Embed Size (px)
Citation preview

Fiscal Year 2020
City of Germantown
Proposed Budget
-
CITY OF GERMANTOWN
FISCAL YEAR 2020
BUDGET
July 1, 2019 – June 30, 2020

The Government Finance Officers Association of the United States and Canada (GFOA) presented a Distinguished Budget Presentation Award to the City of Germantown, Tennessee for its annual budget for the fiscal year beginning July 1, 2018. In order to receive this award, a governmental unit must publish a budget document that meets program criteria as a policy document, as an operations guide, as a financial plan and as a communication device. The award is valid for a period of one year only. We believe our current budget continues to conform to program requirements, and we are submitting it to GFOA to determine its eligibility for another award.

I
READER’S GUIDE The budget document is organized in 11 sections. Introduction. Separate letters from the Mayor and the City Administrator, transmitting the FY20 Budget document. General information about the City. The Board of Mayor and Aldermen’s Policy Agenda, listing major objectives. City Financial Policies, a guide in preparation and management of the Budget. Budget Summaries. An overview of the FY20 Budget. Total expenditure overview and summaries by major category and by cost center in six major operating funds: General, Utility, Germantown Athletic Club, Great Hall, Sanitation and Stormwater. Graphs/charts of revenues and expenditures, CIP projects, Infrastructure Replacement Program (IRP) lists, personnel staffing, special revenue funds, internal service funds and fiduciary funds. General Government. Operating budget for several departments including Administration, Finance, Procurement and General Services, Fleet Services, Economic Development. Specific cost centers and program description including overview, mission and FY20 objectives, performance measurements, budget category summary, personnel projections and category explanations. (Basic department and cost center information also found in other sections). Public Safety. Information about operation budgets for the Police Department, Drug Asset Forfeiture, Federal Asset Forfeiture, E-Citation, Fire Department and Ambulance. Transportation and Environment. Operating Budget for all transportation and environment cost centers, including Public Services, State Street Aid, and Animal Control. Solid Waste. Information for the operating budget for the Solid Waste Fund, an enterprise fund, which incorporates the cost for both the collection and disposal of solid waste. Stormwater Management. Information for the operating budget for the Stormwater Management Fund, an enterprise fund. Community Services. Information about the operating budgets for Parks and Recreation, Library Services, Pickering Center, Cultural Arts, and Germantown Municipal School Districts (GMSD). In addition, budgets are included for Germantown Athletic Club and the Great Hall & Conference Center, both enterprise funds. Utilities. Information about operating budgets for all utility cost centers, including Water Operations, Sewer Operations, Sewage Treatment and Utility Debt Service. Capital Improvements Program Summary. General overview of the CIP, divided in nine categories: General Government, Major Roads, Intersections/Other/Drainage, Parks, Germantown Athletic Club, Utilities, Great Hall & Conference Center, and Recreation. (Complete listing of 2020 projects and five-year CIP projection in Budget Summary section). Revenues and Other Information. Specific information regarding revenue sources for General Fund and five enterprise funds. Significant accounting principles and policies followed by the City in the administration and development of the budget. Glossary of governmental budgeting and accounting terms.

II
TABLE OF CONTENTS
INTRODUCTION PUBLIC SAFETY
Reader’s Guide………………………………...………. I Police……………………………………….......................
Table of Contents…………………..……..........……… II Automated Enforcement…..……………………………...
Mayor’s Letter…………………..……..………..…….... 1 Drug Asset Forfeiture……………………..………………
City Administrator’s Letter.…..…….…………..…….... 2 Federal Asset Forfeiture……………………..…………... General Information and Statistical Data …...…….... 13 Fire…………………………………………....................... Location Map …...……....…………………...……...…. 13 Ambulance………………………………......................
Organization Chart……..….…………………...…….... 17
City Officials Roster……….…………………....…….... 18 TRANSPORTATION & ENVIRONMENT
Philosophy Statement…………………………...……... 19
2019-1 Budget Ordinance .…………………..……….. 20 Public Works………….…………………………………
Strategic Objectives…………………………...…….…. Performance Measurements………….………………
33 38
State Street Aid…………………………………….…… Animal Control…………………………………….………
Financial Policies………………….…………............... Condensed Budget Calendar…………………............
39 51
SOLID WASTE
Solid Waste Fund……………………………................. BUDGET SUMMARIES
STORMWATER MANAGEMENT Total Expenditure Budget………………….….. ……… 54
General Fund Budget……………………….………….. 58 Stormwater Management Fund………………………...
Utility Fund Budget…………………………................. 62
Athletic Club Fund Budget………….…………………. 66 COMMUNITY SERVICES
Great Hall Fund Budget……………………………….. 70
Solid Waste Fund Budget………………….………….. 74 Parks and Recreation…………………………………….
Stormwater Management Fund ………….…………… 76 Recreation…………………………………………………
Capital Projects Summary………………….………….. 78 Cultural Arts Projects……………………………………..
Infrastructure Replacement Pickering Center…………………………………………..
Program Summary……………………..………….. 81 Library Services…………………………………………..
Discussion of General Fund Reserves…….…........... 86 The Farm …………………………………………………
Budget Projection Summaries………………............... 87
Personnel and Staffing…………………………………. 110 GERMANTOWN MUNICIPAL SCHOOL DISTRICT…
GERMANTOWN ATHLETIC CLUB FUND……………
GENERAL GOVERNMENT GREAT HALL FUND…………………………………….
Aldermen…………………………………….................. UTILITIES
Civic Support…………………………..……………….
Court……………………………………..………………. Utility Debt Service…………………………….................
Administration…………………………………………… Water Operations………………………………...............
Human Resources………………………….................. Sewer Operations…………………………………………
Information Technology…………………..................... Sewage Treatment………………………………………..
Germantown Performing Arts Center….....................
Finance……………………….……………..………...… CAPITAL IMPROVEMENTS PROGRAM………………
Procurement…………………………………………….
Allocated Expenses……………………..…………….. REVENUES & OTHER INFORMATION
General Debt Service…………………………………..
Economic and Community Development…………… Revenues……………………………………….................
Budget and Performance………………………………. Significant Accounting Policies…………………………..
Facility Services……………………….……………….. Glossary of Terms……………...…………………………
Fleet Services ……….………………………………… City of Germantown Citizen Boards….………………….

1
1930 South Germantown Road Germantown, Tennessee 38138-2815
Phone (901) 757-7200 Fax (901) 757-7292 www.germantown-tn.gov
May 2019 Board of Mayor and Aldermen Financial Advisory Commission City of Germantown, Tennessee Presented for your consideration is the FY20 annual operating and capital budget for the City of Germantown. It is a fiscally sound and balanced document representing countless hours of development and review by City staff and citizen volunteers. The annual budget and five year financial plan is built around our financial policies and addresses the operational and capital challenges that face our community. As a policy document, the budget serves as the financial plan for our City and will help guide the actions of the Board of Mayor and Aldermen over the next 12 months. Our role as elected officials and that of City staff is to utilize the resources that the taxpayers of Germantown have entrusted to us. It is also our role to improve our City product and service delivery to our citizens while at the same time reducing costs. The FY20 budget accomplishes these two directives and continues to ensure a financially sustainable future for the next generation of Germantown residents. The FY20 budget encompasses funding for a wide range of services including safety, security and infrastructure improvements, accomplished through fiscal soundness while sustaining the character of the community. In every department, division and line item, the FY20 budget reflects the Board’s thoughtful and diligent decisions about services and infrastructure investment, the Financial Advisory Commission’s thoughtful examination of revenue and expense projections and the professional staff’s daily stewardship of citizen tax dollars. Because of the soundness of and adherence to conservative fiscal policies, the City continues to merit the triple-A bond ratings of both Moody’s and Standard and Poor’s. Of considerable note in the FY20 budget is the City’s continued investment and support of public education in Germantown. Evidenced by the Board of Mayor and Aldermen’s commitment to provide capital assets and funding for the Houston Middle School expansion at $5 million. Furthermore, Forest Hill Elementary School and associated road improvements to Forest Hill Irene Road, totaling close to a $33 million, will open in FY20. Your Board, along with City staff, have a strong relationship with our partners at Germantown Municipal School District, allowing us to work together to deliver value and excellence in public education.
Mike Palazzolo, Mayor

2
1930 South Germantown Road Germantown, Tennessee 38138-2815
Phone (901) 757-7200 Fax (901) 757-7292 www.germantown-tn.gov
May 2019
Board of Mayor and Aldermen Financial Advisory Commission City of Germantown, Tennessee This letter transmits the Budget for the fiscal year beginning July 1, 2019. In setting the City’s annual financial and spending plan, the adoption of the Budget is the most significant action taken by the Board of Mayor and Aldermen each year. It authorizes the allocation of resources and establishes the direction for programs and services for our AAA-rated city for the coming year and the five-year planning period.
THE FISCAL YEAR 2020 BUDGET The FY20 budget is structurally balanced and supports the City’s sound fiscal and operational policies. It is a strategic budget that aligns financial, capital and employee resources with Germantown Forward 2030 long range strategic plan. The FY20 budget totals $174.6 million for all funds, with the City’s general fund totaling $58.9 million. It provides for public investments in education, public safety, infrastructure and quality development. Germantown remains in excellent financial health as evident by our AAA bond rating and strong financial reserves and is experiencing significant investment as a result of the improving economy. There is no increase to the property tax rate. PUBLIC POLICY Adoption of the budget remains, by far, one of the most significant actions taken by the BMA each year. It authorizes the allocation of resources and establishes direction for programs and services for the coming year and during the five-year planning period. The annual budget represents the culmination of hours of analysis and hundreds of recommendations on how best to respond to needs of the community in accordance with resources available, established policies and sound administrative practices. The annual budget builds upon prior budgets, staff objectives and departmental business plans and citizen feedback. Administration employs certain funding priorities in developing the annual budget. Administration is strongly committed to the following:
An operationally balanced budget, which supplies the necessary materials and tools to address the objectives identified in Germantown Forward 2030
A fiscally balanced budget with no use of one-time revenues to fund ongoing city operations
A budget based on customer ratings for importance and satisfaction with City services
Full cost accounting and fee collection where possible
A commitment to funding capital projects based upon the City’s established financial policies
When structuring the budget document, Administration’s goal is to produce a document that provides sufficient policy and financial information to give an accurate description of the city’s financial health and stability. The Germantown Board of Mayor and Aldermen, Administration and staff are committed to Germantown’s economic, environmental and social sustainability. The strategic vision and planning process focus on influencing the future rather than simply adapting to it by aligning organizational resources to bridge the gap between present conditions and the envisioned future. The City’s long-range strategic plan, Germantown Forward 2030, heavily influenced FY20 budget priorities. With a focus on the priorities set forth in the bi-annually updated Germantown Forward 2030 Plan, Administration routinely presents a balanced budget for the year under consideration in addition to a five-year financial plan based upon carefully
Board of Mayor and Aldermen Financial Advisory Commission May 2019
3
researched data, planning scenarios and financial assumptions. Current and long-term financial obligations of the community are addressed through the following measures. FISCAL ACCOUNTABILITY Fiscal accountability is achieved through development and adoption of the annual budget and long-range financial plan. This action authorizes the allocation of resources and establishes direction for programs and services for the coming year and for the five-year planning period. The budget process and development begins with the annual Board of Mayor and Aldermen retreat when strategic objectives and policy decisions are identified for budget deliberations. The actual development of the budget relies on the expertise and professionalism of a highly trained staff in cooperation with the 24-member Financial Advisory Commission (FAC), a volunteer commission appointed by the BMA. These appointed resident volunteers, who have extensive experience in the financial sector, generously donate their time to work with City staff on every aspect of the budget and financial policies prior to recommendation to the BMA for adoption and passage. Believing that a budget is more than simply a series of numbers, graphs and statistics, the City works hard to ensure that the document is easy to understand and that residents have a clear picture of how tax dollars are used. Prior to budget adoption, a budget in brief postcard is created and distributed to residents. The document includes an invitation to the public hearing on the budget and highlights key revenues, expenditures and capital projects. Once adopted, the budget is made available on the City website. Throughout the fiscal year, the Budget and Performance staff prepares and disseminates monthly financial reports to the city administrator, the BMA and every city department. The report provides information on key revenue and expenditures and highlights any variance requiring examination. Fiscal accountability is also achieved by rating agencies each time the City enters the bond market to issue debt. Germantown is one of only 100 cities with a Triple A bond rating from both Moody’s and Standard & Poor’s. Both agencies conduct an extensive review of the City’s finances and provide full disclosure to the bond buyer as to the fiscal health and stability of the City. These agencies last renewed the City’s AAA rating prior to a bond sale in September 2017. The City conducts an annual audit at the conclusion of each fiscal year. Records for every fund are audited by an independent audit firm that tests and reviews supporting evidences and financial statements. The City’s audit has resulted in an unmodified opinion for more than 20 years on the overall fiscal health of the City. The audit report is reviewed by the City Audit Commission prior to submission to the Board of Mayor and Aldermen. The Audit Commission is staffed by the City’s mayor, city administrator, alderman liaison, finance director and Financial Advisory Commission chairman. The City has received the GFOA award for excellence in financial reporting each year since 1982. The purpose of the award is to encourage local governments to go beyond the minimum requirements of generally accepted accounting principles and to prepare comprehensive financial reports that provide true transparency and full disclosure. SHORT TERM FACTORS The City’s main objective is to provide a balanced budget that insures financial health and stability of the City while preserving current service levels for its citizens.
Economic Outlook. The City’s overall economic outlook in the near future is positive. Over the past several years, we witnessed positive growth in sales and occupancy tax as well as an increase in the overall assessed value of the commercial tax base. This coupled with low vacancy rate in the retail and office market, supports this positive trend.
Current Reserves. The City plans to spend reserves for capital improvement projects. FY20’s reserve spending is projected to be $4.6 million with most of the cost attributed to drainage and road improvements.
State Revenue Sharing. Pending legislation is looked at during the budget process for its impact on the City’s budget.
Employee benefits. There is a net effect of a 3% increase in the FY20 Budget for all full time employees.
Wage adjustments. The FY20 Budget includes a market adjustment of several positions based on results from a class and compensation study.
STRATEGIC PLANNING/ VISION AND VALUES The complexity of the problems facing local governments and communities across the country requires active and ongoing citizen engagement in long-range planning to guide public policy and service delivery. It was against this backdrop that the
Board of Mayor and Aldermen Financial Advisory Commission May 2019
4
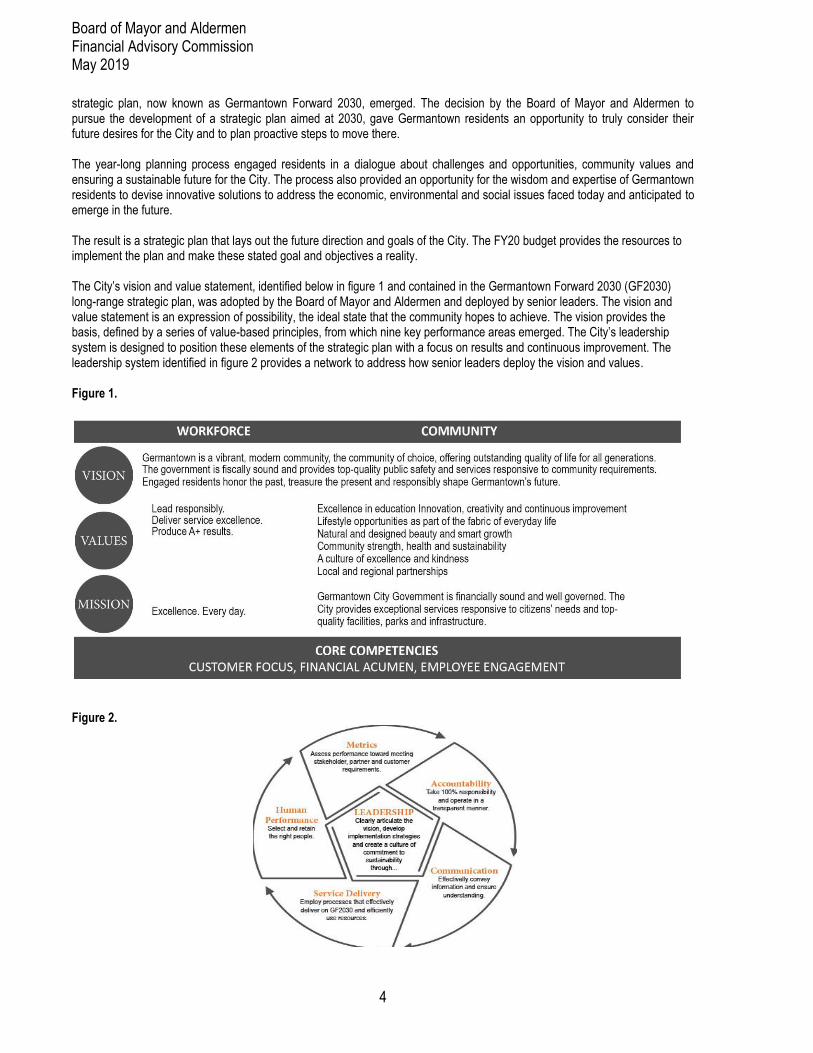
strategic plan, now known as Germantown Forward 2030, emerged. The decision by the Board of Mayor and Aldermen to pursue the development of a strategic plan aimed at 2030, gave Germantown residents an opportunity to truly consider their future desires for the City and to plan proactive steps to move there. The year-long planning process engaged residents in a dialogue about challenges and opportunities, community values and ensuring a sustainable future for the City. The process also provided an opportunity for the wisdom and expertise of Germantown residents to devise innovative solutions to address the economic, environmental and social issues faced today and anticipated to emerge in the future. The result is a strategic plan that lays out the future direction and goals of the City. The FY20 budget provides the resources to implement the plan and make these stated goal and objectives a reality. The City’s vision and value statement, identified below in figure 1 and contained in the Germantown Forward 2030 (GF2030) long-range strategic plan, was adopted by the Board of Mayor and Aldermen and deployed by senior leaders. The vision and value statement is an expression of possibility, the ideal state that the community hopes to achieve. The vision provides the basis, defined by a series of value-based principles, from which nine key performance areas emerged. The City’s leadership system is designed to position these elements of the strategic plan with a focus on results and continuous improvement. The leadership system identified in figure 2 provides a network to address how senior leaders deploy the vision and values. Figure 1.
Figure 2.

Board of Mayor and Aldermen Financial Advisory Commission May 2019
5
REVENUE PROJECTIONS Concurrent with the adoption of the budget, the Board of Mayor and Aldermen adopts a property tax rate. The budget for FY20 has a property tax rate of $1.95. Property taxes generated in Germantown comprise about 57% of overall General Fund operating revenues. Germantown currently has multiple mixed-use projects under construction in FY20 representing over $400 million in private investment. These projects will result in an additional 10,000 square feet compared to FY19 in retail shops, restaurants, hotel rooms, class-A office space and multifamily units. In addition, 180 new single family homes, with a total value of more than $25 million, are being developed with many already under construction. These new Germantown properties will be assessed beginning in FY20. GENERAL FUND REVENUES:
$ MILLIONS
010203040506070
FY16 FY17 FY18 FY19 FY20
Property Tax Local Sales TaxInvestment Income Federal and State RevenuesOther Revenues
5
15
25
35
FY16 FY17 FY18 FY19 FY20
Real Personal In Lieu Of PILOT
The General Fund revenues include property tax, local sales tax, investment income and other revenues. The property tax consistently remains one of the most stable sources of revenue in our community. Other revenue sources are subject to some degree of fluctuation in economic cycles. FY20 general fund revenues increased by .06% over FY19 estimate. The property tax rate is $1.95 per $100 assessed value in FY20.
The property tax rate for the City of Germantown is $1.95 per $100 of assessed valuation. In the FY20 budget, real, personal, in-lieu-of-property taxes and PILOT are projected to generate approximately $33.8 million, 57% of the total revenue budget for the City.
$ MILLIONS
$ MILLIONS
LOCAL SALES TAXES
Local sales tax collections contribute 25% of the total revenue for the operations of the City. This category includes the local sales tax, the wholesale beer tax, the wholesale liquor tax, gross receipts business taxes and hotel/motel occupancy tax. The FY20 Budget anticipates $14.5 million in local sales tax revenue.
0
5
10
15
20
FY16 FY17 FY18 FY19 FY20
Local Sales Tax Other Sources
PROPERTY TAXES

Board of Mayor and Aldermen Financial Advisory Commission May 2019
6
More detailed information about each revenue category is provided under the “Revenues and Other Information” tab in the latter part of the document.
0.00
5.00
10.00
15.00
20.00
25.00
30.00
FY10 FY11 FY12 FY13 FY14 FY15 FY16 FY17 FY18 FY19 FY20
Sales Tax Interest Income
0
2
4
6
8
FY16 FY17 FY18 FY19 FY20
State Revenues Grants
0
1
2
3
4
5
6
FY16 FY17 FY18 FY19 FY20
Fines Auto Registration Fees Licenses Other
SALES TAX REVENUE AND INTEREST INCOME AS % OF GENERAL FUND REVENUES
OTHER LOCAL REVENUE SOURCES $ MILLIONS
PERCENT
Other local revenue sources generate approximately 8% of the overall revenue for the City. This category includes automobile registration fees, local cable franchise fees, city court fees and an assortment of other smaller fees collected by municipalities. Licenses and fees are a fairly stable source of revenue for the City. Revenues are budgeted at $4.7 million for this revenue category.
STATE REVENUES AND GRANTS
State shared revenues and state and federal grants make up 9% of the total fund sources for the City. This area includes state allocations for income tax, sales tax, beer tax, liquor tax, and City street and transportation tax allocation. In Germantown, state shared revenues are projected to be $5.5 million in FY20. With the exception of the income and excise tax, state revenues are allocated on a per capita basis with Germantown’s population at 40,123 with a Special Census in 2012. This source of revenue fluctuates depending on the statewide economy and certified population counts. Starting in FY17, the declining trend is a reflection of the Hall Tax phases out that will be completed by FY22.
$ MILLIONS
INTEREST INCOME Interest on the City’s investments contributes less than 1% of total revenues for the City of Germantown. The FY20 Budget projects income from investments at $219,200. Both the State of Tennessee and the City of Germantown have regulations regarding authorized investments. The level of interest income fluctuates depending on interest rates and amount of funds held in reserve.

Board of Mayor and Aldermen Financial Advisory Commission May 2019
7
EXPENDITURES The City’s fiscal year spending plan emphasizes a long-term goal of maintaining financial stability. All expenditures reflect the spending priorities established by the Board of Mayor and Aldermen and strict adherence to the financial policies that provide a framework for allocating resources. (The Board’s Policy Agenda for fiscal year 2020 and an overview of the Financial Policies as adopted by the Board of Mayor and Aldermen are provided following this section.)
0
5
10
15
20
FY16 FY17 FY18 FY19 FY20
Administration Finance Development General Services
0
2
4
6
FY16 FY17 FY18 FY19 FY20
Public Works Animal Control
Total expenditures for Police and Fire Departments increased by approximately $1 million or 5% over the FY19 estimate. FY20 shows an increase over FY19 estimate due to a full year’s salary for six additional police officers, one dispatcher and six firefighters and infrastructure replacement for vehicles and other equipment.
The category includes the Department of Public Services and Animal Control. Total FY20 expenditures for this category decreased by $39,300 or 1% from the FY19 estimate. FY20 expenditures are less than FY19 estimate due to infrastructure replacements for equipment.
GENERAL GOVERNMENT EXPENDITURES
PUBLIC SAFETY EXPENDITURES
TRANSPORTATION AND ENVIRONMENT EXPENDITURES
$ MILLIONS
$ MILLIONS
General government includes the Departments of Aldermen, Administration, Civic Support, Economic & Community Development, Human Resources, Information Technology, Germantown Performing Arts Center, General Services, Budget and Performance, City Court, Procurement, and Finance. FY20 expenditures for these functions increased by $1,043,900 or 6% over the FY19 estimate. This increase can be attributed to an increase in infrastructure replacement projects.
$ MILLIONS
0
5
10
15
20
25
FY16 FY17 FY18 FY19 FY20
Fire Police

Board of Mayor and Aldermen Financial Advisory Commission May 2019
8
The category includes the Parks and Recreation Department, Library Services and Cultural Arts. The FY20 expenditures increased by $114,500 or 4% over the FY19 estimate. This increase is due to an increase in Library Services consulting and a full year’s salary for three vacant positions in Parks that was filled in the 3rd quarter of FY19 and infrastructure replacement for
other assets.
COMMUNITY SERVICES EXPENDITURES $ MILLIONS
0
1
2
3
4
FY16 FY17 FY18 FY19 FY20
Parks & Rec. Cultural Arts Library

Board of Mayor and Aldermen Financial Advisory Commission May 2019
9
SUMMARY OF FY20 APPROVED EXPENDITURE HIGHLIGHTS
(To be added)
Board of Mayor and Aldermen Financial Advisory Commission May 2019
10
RESERVES: While the entire subsequent year’s balance sheets are not presented in this document, the most critical aspect of the City’s balance sheets – fund balance – is presented in the budget projection summaries in the following section. General Fund fund balance as of June 30, 2018 totaled $40.7 million. The underlying purpose and rationale for these reserves are described in the Financial Policies contained in this section of the document. Following a review of the Financial Policies with the Financial Advisory Commission and the Board of Mayor and Aldermen, the Financial Policies were updated as detailed in this section of the Budget. UTILITY FUND REVENUE AND EXPENSES:
2
3
4
5
6
7
8
9
10
11
FY16 FY17 FY18 FY19 FY20 FY21 FY22 FY23 FY24
Expenses Revenues
-
5.00
10.00
15.00
20.00
25.00
30.00
FY16 FY17 FY18 FY19 FY20 FY21 FY22
Ratio
Warning Trend
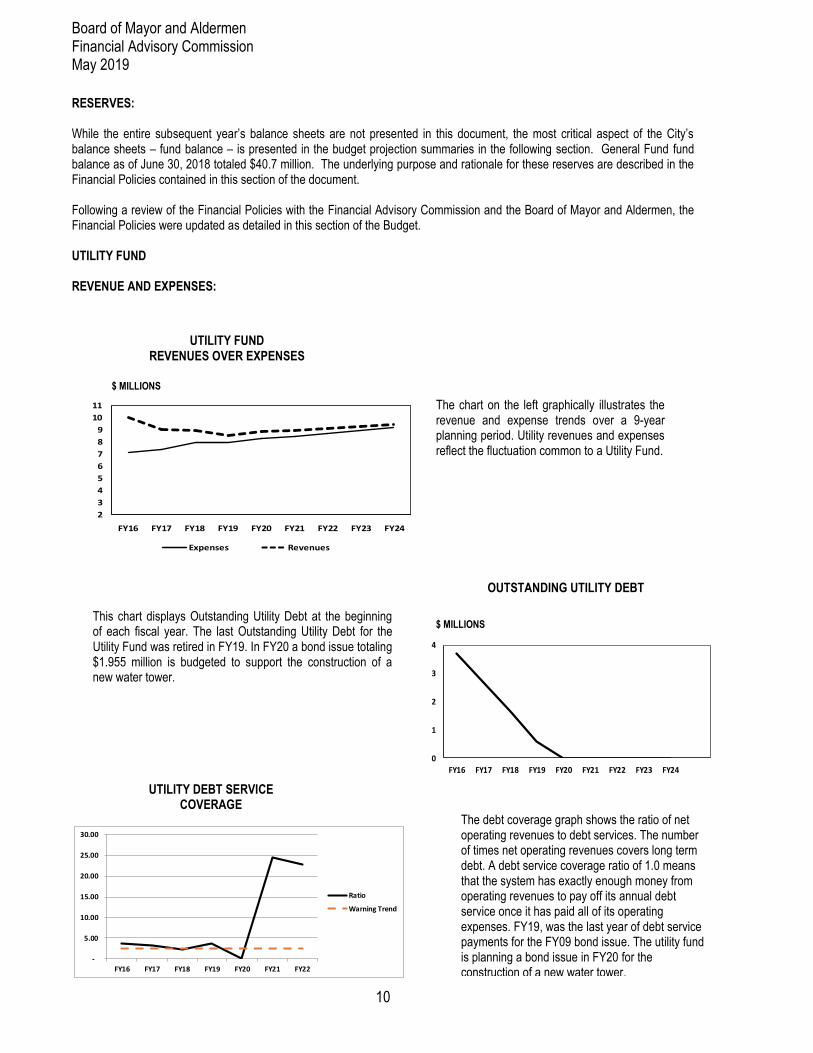
The chart on the left graphically illustrates the revenue and expense trends over a 9-year planning period. Utility revenues and expenses reflect the fluctuation common to a Utility Fund.
This chart displays Outstanding Utility Debt at the beginning of each fiscal year. The last Outstanding Utility Debt for the Utility Fund was retired in FY19. In FY20 a bond issue totaling $1.955 million is budgeted to support the construction of a new water tower.
UTILITY FUND REVENUES OVER EXPENSES
OUTSTANDING UTILITY DEBT
UTILITY DEBT SERVICE COVERAGE
$ MILLIONS
$ MILLIONS
0
1
2
3
4
FY16 FY17 FY18 FY19 FY20 FY21 FY22 FY23 FY24
The debt coverage graph shows the ratio of net operating revenues to debt services. The number of times net operating revenues covers long term debt. A debt service coverage ratio of 1.0 means that the system has exactly enough money from operating revenues to pay off its annual debt service once it has paid all of its operating expenses. FY19, was the last year of debt service payments for the FY09 bond issue. The utility fund is planning a bond issue in FY20 for the construction of a new water tower.

Board of Mayor and Aldermen Financial Advisory Commission May 2019
11
Although the major rating agencies consider 2.4 an appropriate debt coverage ratio for an AAA rated city, Germantown’s strong financial foundations, coupled with its high levels of working capital maintained in the Utility Fund, provide additional protection against unexpected operating costs and declines in revenues between periodic rate adjustments.
FY20 CAPITAL BUDGET The FY20 Capital Budget totals $26,525,775. There is a $4.6 million transfer to capital projects from the General Fund in FY20. Those projects incorporated in the CIP are consistent with the Board of Mayor and Aldermen’s Policy Agenda and funding priorities. The FY20 CIP demonstrates a significant level of spending due mainly to the funding for Wolf River/Germantown Road improvements, Houston Middle School expansion, Riverdale boilers, GMSD security upgrades, parkland acquisition and Greenway Phase Neshoba to East Trail Head. Details on these and other CIP projects and their impact on operations in this Budget and future years are contained under the tab Capital Improvements Program. DEBT ANALYSIS
In the State of Tennessee, there is no legal debt limit.
$-
$500
$1,000
$1,500
$2,000
$2,500
FY17 FY18 FY19 FY20 FY21 FY22 FY23 FY24
Total Debt Warning Trend
The Outstanding General Obligation Debt chart depicts the level of indebtedness over an 8-year period. In FY12 $6.025 million of G.O. debt and $3.5 million of new debt and $5.5 million in refunding in FY14 were issued. In FY16, $10.2 of G.O. debt was issued for Riverdale school construction and $7.9 million in G.O. debt and refunding bonds were issued. In FY18, $29.3 million of G.O. debt was issued for a new school and road improvement. A $7.5 million G.O bond for Parkland Acquisition and Houston Middle School Expansion in FY20 is included and $4 million for new fire station in FY22. Finally, a $3.5 million is planned in FY24 for park improvements and long field project development.
The City’s debt policy considers $2,000 per capita to be the upper limit. Even with the anticipated issuance of debt in the outer years, Germantown
maintains a debt level below the upper limit.
OUTSTANDING G.O. DEBT
G.O. DEBT PER CAPITA
$ MILLIONS
$ PER CAPITA
5 15 25 35 45 55 65 75 85 95
FY17 FY18 FY19 FY20 FY21 FY22 FY23 FY24

Board of Mayor and Aldermen Financial Advisory Commission May 2019
12
GERMANTOWN ATHLETIC CLUB FUND The Germantown Athletic Club begins FY20 with continued reinvestment back into the facility; increased competition and an aging facility have resulted in a strong focus on membership retention as well as a need to update both facility and programming. Since 2016, the Athletic Club has reinvested $6.6 in capital facilities. Streamlining programs and membership fees, enhancing marketing and communications, along with a “back to basics” approach of services have resulted in several continuous years of positive growth and revenue. GREAT HALL FUND The Great Hall & Conference Center focuses on providing 8,600 square feet of rental facility space ideal to accommodate meetings, weddings and receptions. The Great Hall handles both large and intimate events. The 160’ by 54’ main space can be reconfigured into as many as five meeting spaces and the Conference Center seats up to 84 in tiered theatre seating, which features expansive table space for participants. SOLID WASTE FUND The FY20 Budget for the Solid Waste Fund reflects the costs of the fourth year of a five year collection contract with an option to renew an additional five years with Waste Pro and landfill disposal, BFI Waste Systems and Quad County Environmental Solutions. The revenue side includes a rate increase that was implemented in FY17 for solid waste collection and disposal. The contract includes weekly collection of household trash with a choice of backdoor or curbside collection, weekly recyclables collection and weekly yard debris collection. STORMWATER MANAGEMENT FUND In the FY11 Budget a Stormwater Management Fund was created in response to a federal mandate for municipalities to manage stormwater runoff. This fund provides citizens with improved health and safety, protection of property value, maintenance of drainage and cleaner and safer streets. SPECIAL THANKS: The FY20 Budget could not have been prepared without the combined efforts of staff, the Financial Advisory Commission, the Personnel Advisory Commission and the Board of Mayor and Aldermen. I want to express my appreciation to all of those who have worked to produce the FY20 Budget and Capital Improvements Program, and in particular, I want to thank the Office of Budget and Performance.
Sincerely, Patrick J. Lawton City Administrator
GENERAL INFORMATION AND STATISTICAL DATA
13
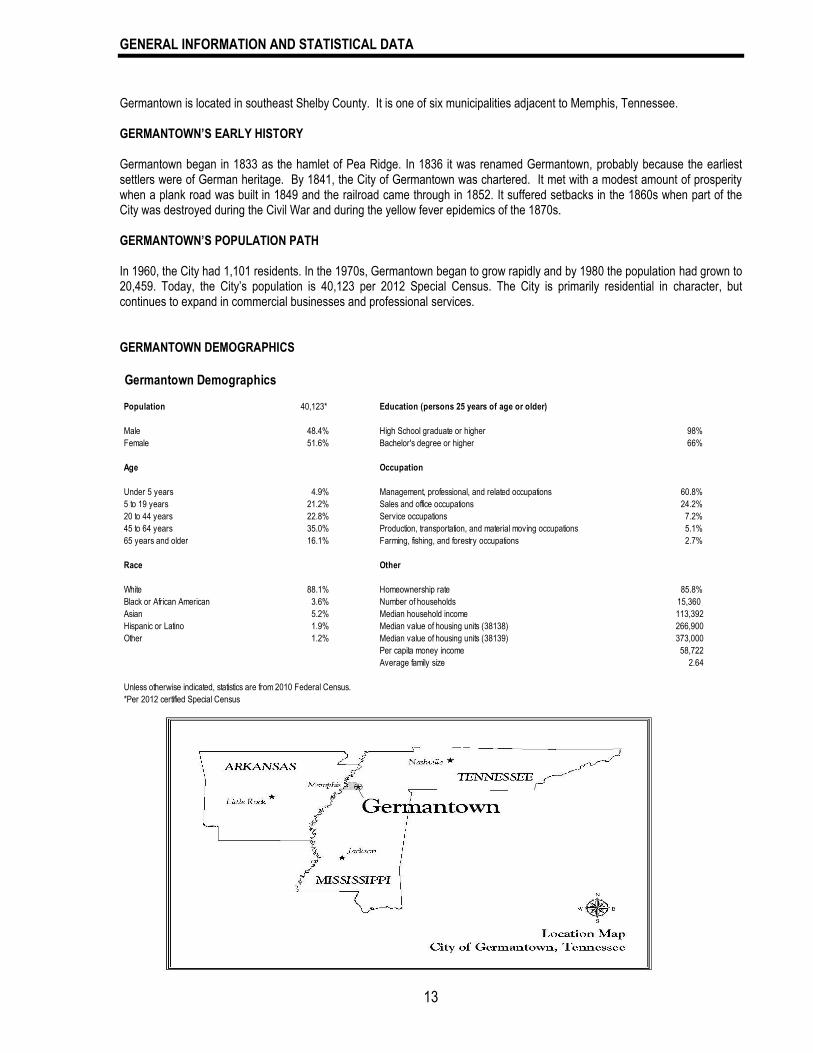
Germantown is located in southeast Shelby County. It is one of six municipalities adjacent to Memphis, Tennessee. GERMANTOWN’S EARLY HISTORY Germantown began in 1833 as the hamlet of Pea Ridge. In 1836 it was renamed Germantown, probably because the earliest settlers were of German heritage. By 1841, the City of Germantown was chartered. It met with a modest amount of prosperity when a plank road was built in 1849 and the railroad came through in 1852. It suffered setbacks in the 1860s when part of the City was destroyed during the Civil War and during the yellow fever epidemics of the 1870s. GERMANTOWN’S POPULATION PATH In 1960, the City had 1,101 residents. In the 1970s, Germantown began to grow rapidly and by 1980 the population had grown to 20,459. Today, the City’s population is 40,123 per 2012 Special Census. The City is primarily residential in character, but continues to expand in commercial businesses and professional services. GERMANTOWN DEMOGRAPHICS
Germantown Demographics
Population 40,123* Education (persons 25 years of age or older)
Male 48.4% High School graduate or higher 98%
Female 51.6% Bachelor's degree or higher 66%
Age Occupation
Under 5 years 4.9% Management, professional, and related occupations 60.8%
5 to 19 years 21.2% Sales and office occupations 24.2%
20 to 44 years 22.8% Service occupations 7.2%
45 to 64 years 35.0% Production, transportation, and material moving occupations 5.1%
65 years and older 16.1% Farming, fishing, and forestry occupations 2.7%
Race Other
White 88.1% Homeownership rate 85.8%
Black or African American 3.6% Number of households 15,360
Asian 5.2% Median household income 113,392
Hispanic or Latino 1.9% Median value of housing units (38138) 266,900
Other 1.2% Median value of housing units (38139) 373,000
Per capita money income 58,722
Average family size 2.64
Unless otherwise indicated, statistics are from 2010 Federal Census.
*Per 2012 certified Special Census

GENERAL INFORMATION AND STATISTICAL DATA
14
2018 PRINCIPLE PROPERTY TAXPAYERS
2018 PRINCIPAL EMPLOYERS
Percentage
of Total City
Taxable
Assessed Assessed
Taxpayer Value Rank Value
The Village at Germantown Inc. 14,846,560$ 1 0.90%
Whitney Bridges LLC 11,304,000 2 0.69%
HCP Germantown LLC 10,817,360 3 0.66%
PEBB Germantown LEB LLC 8,987,520 4 0.55%
Shops at Saddle Creek Inc. 8,937,240 5 0.54%
G&I VIII Brook Chase LLC 8,831,680 6 0.54%
Crestwyn Health Group LLC 8,247,120 7 0.50%
EREP Forest Hill I LLC 7,838,440 8 0.48%
Vineyards Apartments Inc 7,574,840 9 0.46%
Taylor Sentor Crook (TR) etal 7,475,760 10 0.45%
Totals 94,860,520$ 5.77%
Percentage
of Total
County
Employer Employees Rank Employment
Methodist Le Bonheur Hospital - Germantown 1,900 1 0.38%
Germantown Municipal School District 518 2 0.10%
City of Germantown 406 3 0.08%
Campbell Clinic 397 4 0.08%
Stern Cardiovascular 375 5 0.07%
Memphis Orthopedic Group 316 6 0.06%
Kroger 300 7 0.06%
ThyssenKrupp Elevator Manufacturing, Inc. 310 8 0.06%
Gastro One 271 9 0.05%
Villages of Germantown 220 10 0.04%
GENERAL INFORMATION AND STATISTICAL DATA
15
AMENITIES A total of 29 parks allow for a park within walking distance of every residence. The community has more than 700 acres of parkland. More than 13 miles of greenway links parkland and neighborhoods. Under the Germantown Municipal School District, a high school, one middle school and three elementary schools serve Germantown. In addition, a new elementary school, Forest Hill Elementary School, is planned to open in FY20. The City also has three private and four specialty schools, along with three schools operated by Shelby County. The Community Library was constructed in 1996, the Regional History and Genealogy Center opened in FY07. The Germantown Performing Arts Center (GPAC) is an acoustically-perfect 800-seat theater featuring top artists from around the world. The Germantown Athletic Club is an 118,000 square foot indoor athletic complex that opened in 1989 and expanded in 2003 to include two outdoor pools. The Great Hall & Conference Center is an 8,000 square feet rental facility space that is ideal to accommodate meetings, weddings and receptions. GERMANTOWN’S STATUS Germantown is one of a few cities in the nation possessing a triple-A bond rating from both Moody’s and Standard & Poor’s. It has the lowest crime rate for any city its size in the State of Tennessee and the police and fire departments have average emergency response time of five minutes. The parks and recreation department is nationally accredited. The Arbor Day Foundation has designed Germantown a “Tree City USA” for 28 consecutive years. GERMANTOWN’S GOVERNMENT The City of Germantown operates under a Mayor-Aldermanic form of government. The mayor and five aldermen are elected for four year terms and are part-time positions. The Board of Mayor and Aldermen is the legislative and policy-making body of the City. The mayor does not vote except to break a tie. By charter, the mayor is the chief administrative officer; however, oversight of day-to-day management is assigned to a professional city administrator, appointed by the mayor but subject to board approval. Around 200 citizens annually volunteer their time, expertise and energy in service on the City’s 20-plus advisory commissions and boards. Most appointments, made by the mayor and aldermen each December, are for one year terms; most groups meet monthly. Their responsibilities range from recommendations on City government matters and community interests to indentifying opportunities, challenges and solutions to conducting special activities. The commissions are Audit, Beautification, Bicycle and Pedestrian, Design Review, Economic Development, Education, Environmental, Financial, Athletic Club, Great Hall, Historic, Neighborhood Preservation, Parks and Recreation, Personnel, Planning, Public Art, Public Safety Education, Retirement Plan Administration/Other Postemployment Benefits, Technology, and Senior Citizens. The boards are ADA Access Review, Zoning Appeals, Industrial Development, Library, and Tree.

GENERAL INFORMATION AND STATISTICAL DATA
16
CONTACT INFORMATION For further information, please contact: City of Germantown 1930 South Germantown Road Germantown, Tennessee 38138 901-757-7200 www.germantown-tn.gov
CITY OF GERMANTOWN, TENNESSEE
MISCELLANEOUS STATISTICAL DATA
City Stats: Education (1) :
Date Originally Chartered 1841 Number of Schools* 6 (GMSD)
Date of Incorporation 1903 Number of Students 6,016
Form of Government Mayor-Aldermanic
Area 19.8 sq. miles
Miles of Streets 232
Number of Street Lights 5,000 Water System:
Number of Consumers 13,939
Fire Protection: Miles of Water Main 256
Number of Stations 4 Well Capacity 22.43 million gallons per day
Number of Regular Firefighters: Treatment Plant Capacity 24 million gallons per day
Fire and Ambulance 91 Storage Capacity 7.800 million gallons
Number of Volunteer Firefighters 10 Average Daily Consumption 5.744 million gallons
Insurance Service Office Rating Class I Peak Day Pumpage 12.294 million gallons
Residential Rate in Force $8.78 for first 5,000 gallons (minimum)
Police Protection: $2.15 per additional 1,000
Number of Regular Police Officers 108 gallons up to 15,000 gallons
Number of Reserve Police Officers 30 $2.47 per additional 1,000
gallons up to 50,000 gallons
Recreation and Culture: $3.12 per 1,000 gallons thereafter
Number of Parks 29
Acreage 748 Sewer System:
Number of Libraries 2 Number of Consumers 13,772
(Germantown Community Miles of Sewer Main 235
Library and Genealogy Treatment Provided by City of Memphis
Center) Residential Rate in Force $5.07 for first 2,000 gallons (minimum)
Volumes 141,200 $.90 per for third additional 1,000 gallons
$1.99 per additional 1,000 gallons up to
20,000 gallons
$0.78 per 1,000 gallons
($5.07 minimum and $40.58 maximum)
* A seventh school is scheduled to open in FY20.
ORGANIZATION CHART
17
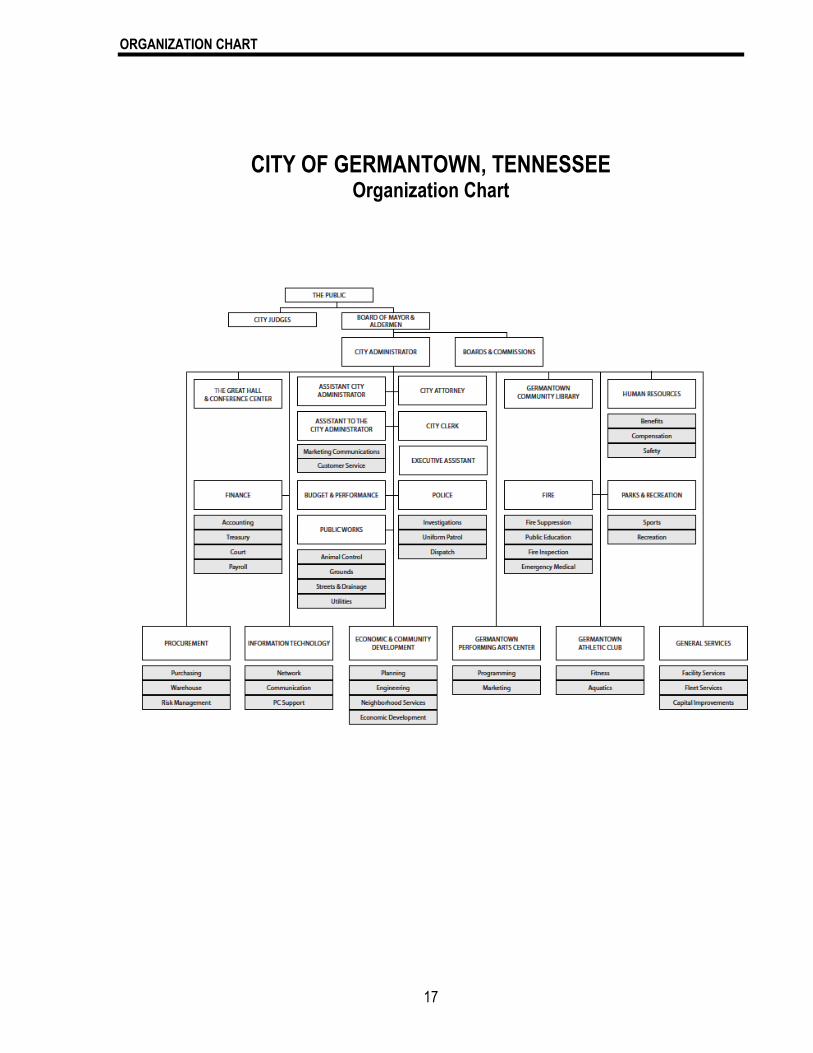
CITY OF GERMANTOWN, TENNESSEE
Organization Chart

LIST OF CITY OFFICIALS
18
CITY OF GERMANTOWN CITY OFFICIALS
MAYOR
Honorable Mike Palazzolo (2022*)
ALDERMEN
Mary Anne Gibson (Vice Mayor – 2022*)
Forrest Owens (2020*)
Dean Massey (2020*)
Rocky Janda (2020*)
Scott A. Sanders (2022*)
CITY ADMINISTRATOR
Patrick J. Lawton CITY ATTORNEY
CITY JUDGES John R. McCarroll III Bob Brannon
Raymond S. Clift EXECUTIVES
Assistant City Administrator…………………………………………………………………………………………………..Jason Huisman Economic and Community Development Director………………………………………….……………......................... Cameron Ross Fire Chief……..………………………….…………………………………...............……....…..……………...…………..John M. Selberg Police Chief…………………………………………………………………………………......….…..…..................................Richard Hall General Services Director…………………………………………………………………………………………..……….Reynold Douglas Germantown Performing Arts Center Director ……………………………………………………………………..…….…. Paul Chandler Human Resources Director………………………………………....………..........….........................................…..…Stephen Wilensky Finance Director…………………………………………...............………………………..…....…………………….……………… Vacant Procurement Director………………………………………………………………………………………………….…………… Lisa Piefer Parks and Recreation Director………………...............………………...……………..………………………….…….…… Pam Beasley Library Services Director…………………………………………...............…………………..……………………….…….. Daniel Page Public Works Director……………………………………………..……………...............………..………..………………..…...… Bo Mills Information Technology Director ……………………………………………..……………...............………..…..………… Tony Fischer Germantown Athletic Club Director …………………………………………..……………...............………..…..………… Phil Rogers
BUDGET PREPARATION STAFF Sr. Budget and Performance Analyst…………………………….……………...............….......................……...…..…... Sherry Rowell Sr. Budget and Performance Analyst …………………………………...............……………………………………..... Adrienne Royals Budget and Performance Analyst………………………………………………………………………………………... De’Kisha Fondon Capital Improvements Projects Coordinator….……………......……………………...............................…..................... Emily Rozar *(Date elected term expires)
PHILOSOPY STATEMENT
19
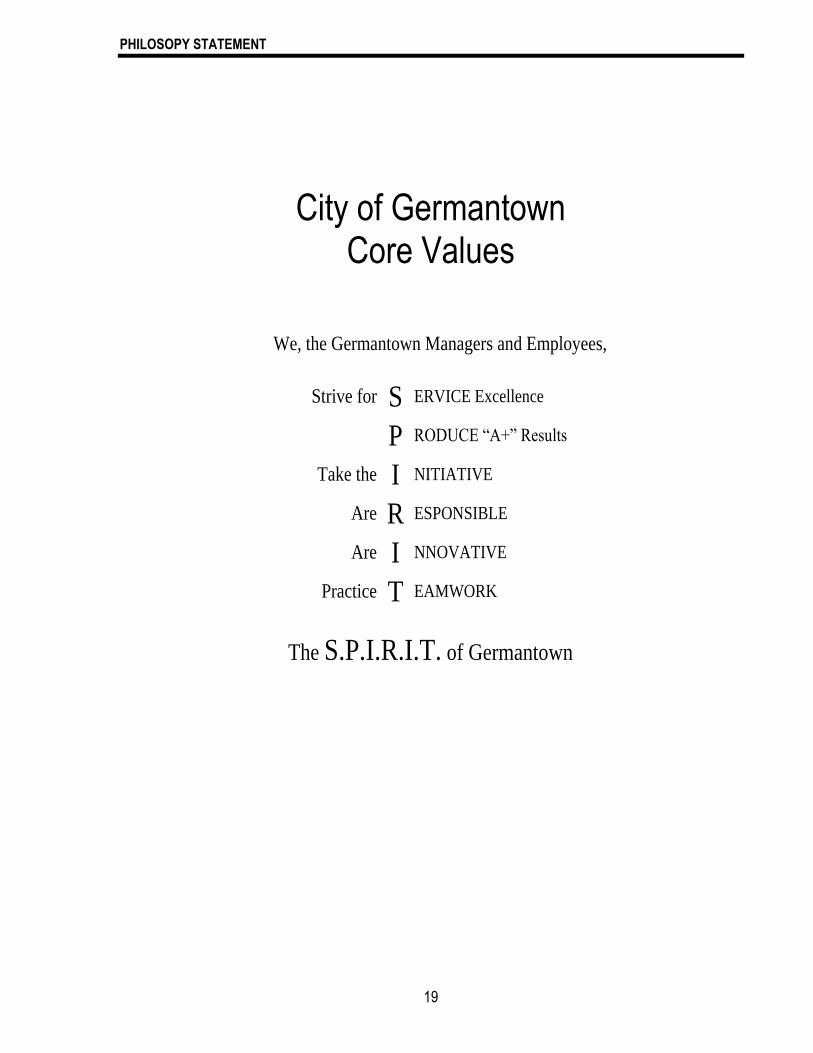
City of Germantown Core Values
We, the Germantown Managers and Employees,
Strive for S ERVICE Excellence
P RODUCE “A+” Results
Take the I NITIATIVE
Are R ESPONSIBLE
Are I NNOVATIVE
Practice T EAMWORK
The S.P.I.R.I.T. of Germantown

BOARD OF MAYOR AND ALDERMEN ORDINANCE – FY20
20
ORDINANCE NO. 2019 - 1
AN ORDINANCE OF THE CITY OF GERMANTOWN, TENNESSEE, ADOPTING THE ANNUAL BUDGET AND TAX RATE
FOR THE FISCAL YEAR BEGINNING JULY 1, 2019 THROUGH JUNE 30, 2020 Whereas, Tennessee Code Annotated Title 9 Chapter 1 Section 116 requires that all funds of the State of Tennessee
and all its political subdivisions shall first be appropriated before being expended and that only funds that are available shall be appropriated; and
Whereas, the Municipal Budget Law of 1982 requires that the governing body of each municipality adopt and operate
under an annual budget ordinance presenting a financial plan with at least the information required by that state statue, that no municipality may expend any moneys regardless of the source except in accordance with a budget ordinance and that the governing body shall not make any appropriation in excess of estimated available funds; and
Whereas, the City Charter provides that at least forty-five (45) days before the beginning of the fiscal year, the City
Administrator shall prepare and submit to the Board a budget for the ensuing fiscal year and an accompanying message. It shall outline the proposed financial policies of the City for the ensuing fiscal year, describe the important features of the budget, indicate any major changes from the current year in financial policies, expenditures, and revenues together with the reasons for such changes, summarize the City’s debt position, and include such other material as the City Administrator deems desirable or the Board may require; and
Whereas, the City Charter provides that after considering the City Administrator’s proposed annual budget on first
reading and the making of any modification thereto, the Board shall schedule a time and place for a public hearing thereon and shall give proper notice of the time and place of the public hearing, a summary of the annual budget tentatively approved by the Board to include the budgetary comparisons of the proposed budget with the prior year (actual) and the current year (estimated), and a notice of when and where the entire annual budget may be inspected. Notice of the public hearing must be given at least ten (10) days in advance of the date thereof; and
Whereas, in accordance with state law and the City Charter, the City Administrator has submitted the proposed budget
for fiscal year 2020 which is hereby tentatively approved on first reading. The BMA hereby schedules June 10, 2019 as the public hearing date to consider the annual budget on second reading and has placed the entire annual budget on the City’s website for public inspection at any time. The City shall publish a copy of this budget ordinance with a summary of the annual budget together with the notice of the public hearing date of June 10, 2019 in an officially designated newspaper and post the same at the Municipal Center at least ten (10) days in advance of the date thereof.
NOW THEREFORE BE IT ORDAINED BY THE BOARD OF MAYOR AND ALDERMEN OF THE CITY OF GERMANTOWN,
TENNESSEE AS FOLLOWS:
BOARD OF MAYOR AND ALDERMEN ORDINANCE – FY20
21
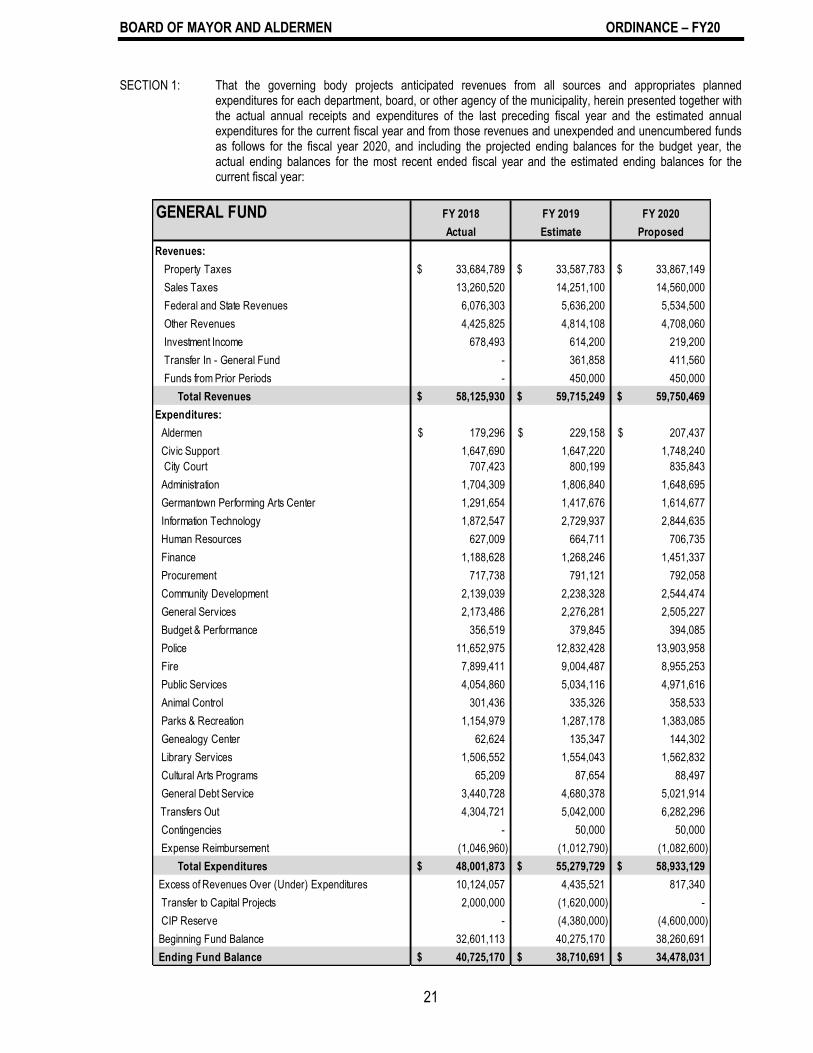
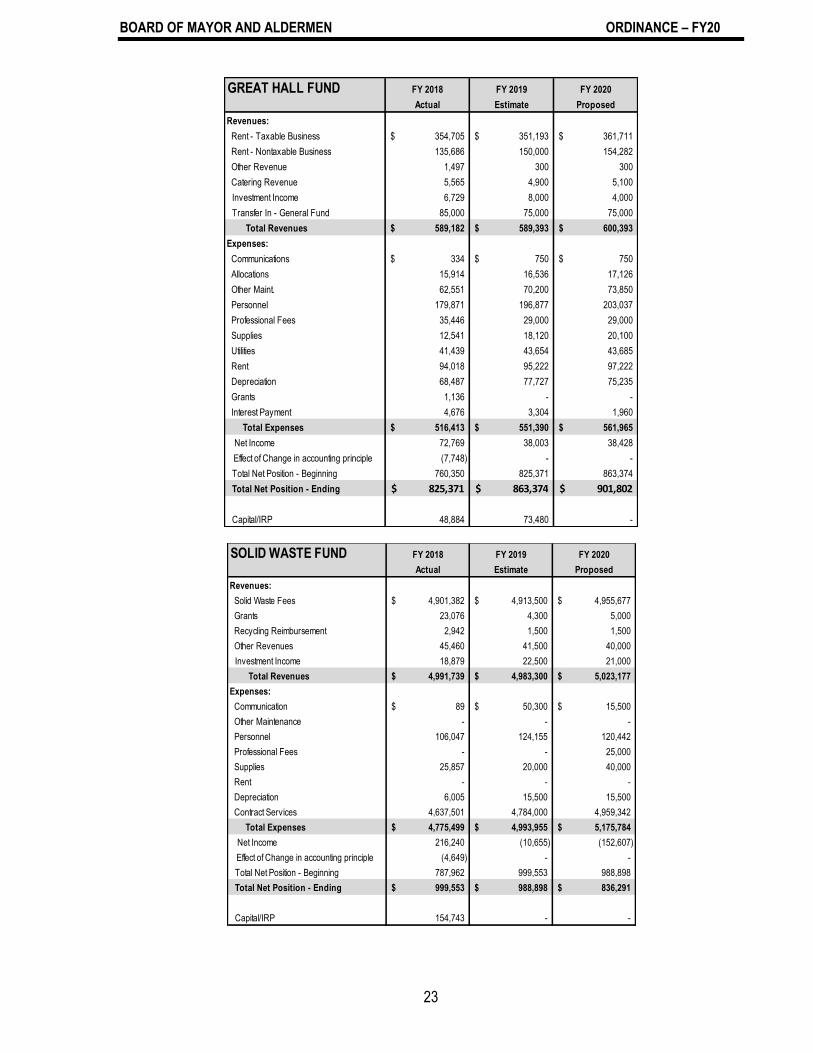
SECTION 1: That the governing body projects anticipated revenues from all sources and appropriates planned expenditures for each department, board, or other agency of the municipality, herein presented together with the actual annual receipts and expenditures of the last preceding fiscal year and the estimated annual expenditures for the current fiscal year and from those revenues and unexpended and unencumbered funds as follows for the fiscal year 2020, and including the projected ending balances for the budget year, the actual ending balances for the most recent ended fiscal year and the estimated ending balances for the current fiscal year:
GENERAL FUND FY 2018 FY 2019 FY 2020
Actual Estimate Proposed
Revenues:
Property Taxes 33,684,789$ 33,587,783$ 33,867,149$
Sales Taxes 13,260,520 14,251,100 14,560,000
Federal and State Revenues 6,076,303 5,636,200 5,534,500
Other Revenues 4,425,825 4,814,108 4,708,060
Investment Income 678,493 614,200 219,200
Transfer In - General Fund - 361,858 411,560
Funds from Prior Periods - 450,000 450,000
Total Revenues 58,125,930$ 59,715,249$ 59,750,469$
Expenditures:
Aldermen 179,296$ 229,158$ 207,437$
Civic Support 1,647,690 1,647,220 1,748,240
City Court 707,423 800,199 835,843
Administration 1,704,309 1,806,840 1,648,695
Germantown Performing Arts Center 1,291,654 1,417,676 1,614,677
Information Technology 1,872,547 2,729,937 2,844,635
Human Resources 627,009 664,711 706,735
Finance 1,188,628 1,268,246 1,451,337
Procurement 717,738 791,121 792,058
Community Development 2,139,039 2,238,328 2,544,474
General Services 2,173,486 2,276,281 2,505,227
Budget & Performance 356,519 379,845 394,085
Police 11,652,975 12,832,428 13,903,958
Fire 7,899,411 9,004,487 8,955,253
Public Services 4,054,860 5,034,116 4,971,616
Animal Control 301,436 335,326 358,533
Parks & Recreation 1,154,979 1,287,178 1,383,085
Genealogy Center 62,624 135,347 144,302
Library Services 1,506,552 1,554,043 1,562,832
Cultural Arts Programs 65,209 87,654 88,497
General Debt Service 3,440,728 4,680,378 5,021,914
Transfers Out 4,304,721 5,042,000 6,282,296
Contingencies - 50,000 50,000
Expense Reimbursement (1,046,960) (1,012,790) (1,082,600)
Total Expenditures 48,001,873$ 55,279,729$ 58,933,129$
Excess of Revenues Over (Under) Expenditures 10,124,057 4,435,521 817,340
Transfer to Capital Projects 2,000,000 (1,620,000) -
CIP Reserve - (4,380,000) (4,600,000)
Beginning Fund Balance 32,601,113 40,275,170 38,260,691
Ending Fund Balance 40,725,170$ 38,710,691$ 34,478,031$

BOARD OF MAYOR AND ALDERMEN ORDINANCE – FY20
22
UTILITY FUND FY 2018 FY 2019 FY 2020
Actual Estimate Proposed
Revenues:
Metered Water Sales 5,079,445$ 5,022,030$ 5,165,000$
Sewer Service Fees 3,160,302 3,034,500 3,200,000
Other Revenue 605,901 286,934 387,000
Gain/Loss on Disposal of Assets 8,369 - -
Investment Income 136,815 200,000 66,500
Total Revenues 8,990,832$ 8,543,464$ 8,818,500$
Expenses:
Water 4,511,011$ 4,615,743$ 4,875,331$
Sewer 1,904,224 1,837,943 1,879,414
Sewage Treatment 1,480,577 1,433,770 1,519,796
Utility Debt Service 26,554 12,050 -
Total Expenses 7,922,366$ 7,899,506$ 8,274,541$
Net Income 1,068,466 643,958 543,959
Effect of Change in accounting principle (72,834) - -
Total Net Position - Beginning 49,933,487 50,929,119 51,573,077
Total Net Position - Ending 50,929,119$ 51,573,077$ 52,117,036$
Capital/IRP 778,639$ 4,270,773$ 4,791,000$
GERMANTOWN ATHLETIC CLUB FY 2018 FY 2019 FY 2020
Actual Estimate Proposed
Revenues:
Membership Fees 3,640,373$ 3,858,902$ 3,902,500$
Aquatics Revenues 169,875 137,686 134,168
Business Revenues 79,222 79,222 79,222
Personal Training Revenues 207,730 258,759 325,000
Other Revenues 186,391 211,777 240,113
Investment Income 38,658 62,247 35,000
Total Revenues 4,322,249$ 4,608,593$ 4,716,003$
Expenses:
Recreation 3,070,300$ 3,259,263$ 3,476,224$
Aquatics 774,517 714,527 697,464
Interest Payment 12,024 8,496 5,040
Transfer to (From) - General Fund 100,000 100,000 100,000
Total Expenses 3,956,841$ 4,082,286$ 4,278,728$
Net Income 365,408 526,307 437,276
Effect of Change in accounting principle (46,490) - -
Total Net Position - Beginning 16,669,920 16,988,838 17,515,145
Total Net Position - Ending 16,988,838$ 17,515,145$ 17,952,421$
Capital/IRP 1,333,389$ 1,614,554$ 290,000$
BOARD OF MAYOR AND ALDERMEN ORDINANCE – FY20
23
GREAT HALL FUND FY 2018 FY 2019 FY 2020
Actual Estimate Proposed
Revenues:
Rent - Taxable Business 354,705$ 351,193$ 361,711$
Rent - Nontaxable Business 135,686 150,000 154,282
Other Revenue 1,497 300 300
Catering Revenue 5,565 4,900 5,100
Investment Income 6,729 8,000 4,000
Transfer In - General Fund 85,000 75,000 75,000
Total Revenues 589,182$ 589,393$ 600,393$
Expenses:
Communications 334$ 750$ 750$
Allocations 15,914 16,536 17,126
Other Maint. 62,551 70,200 73,850
Personnel 179,871 196,877 203,037
Professional Fees 35,446 29,000 29,000
Supplies 12,541 18,120 20,100
Utilities 41,439 43,654 43,685
Rent 94,018 95,222 97,222
Depreciation 68,487 77,727 75,235
Grants 1,136 - -
Interest Payment 4,676 3,304 1,960
Total Expenses 516,413$ 551,390$ 561,965$
Net Income 72,769 38,003 38,428
Effect of Change in accounting principle (7,748) - -
Total Net Position - Beginning 760,350 825,371 863,374
Total Net Position - Ending 825,371$ 863,374$ 901,802$
Capital/IRP 48,884 73,480 -
SOLID WASTE FUND FY 2018 FY 2019 FY 2020
Actual Estimate Proposed
Revenues:
Solid Waste Fees 4,901,382$ 4,913,500$ 4,955,677$
Grants 23,076 4,300 5,000
Recycling Reimbursement 2,942 1,500 1,500
Other Revenues 45,460 41,500 40,000
Investment Income 18,879 22,500 21,000
Total Revenues 4,991,739$ 4,983,300$ 5,023,177$
Expenses:
Communication 89$ 50,300$ 15,500$
Other Maintenance - - -
Personnel 106,047 124,155 120,442
Professional Fees - - 25,000
Supplies 25,857 20,000 40,000
Rent - - -
Depreciation 6,005 15,500 15,500
Contract Services 4,637,501 4,784,000 4,959,342
Total Expenses 4,775,499$ 4,993,955$ 5,175,784$
Net Income 216,240 (10,655) (152,607)
Effect of Change in accounting principle (4,649) - -
Total Net Position - Beginning 787,962 999,553 988,898
Total Net Position - Ending 999,553$ 988,898$ 836,291$
Capital/IRP 154,743 - -

BOARD OF MAYOR AND ALDERMEN ORDINANCE – FY20
24
STORMWATER FUND FY 2018 FY 2019 FY 2020
Actual Estimate Proposed
Revenues:
Stormwater Management Fee 1,013,612$ 1,011,080$ 1,012,300$
Stormwater Permits 6,880 7,000 6,900
Other Revenues 1,480 - -
Investment Income 13,165 7,300 5,000
Total Revenues 1,035,137$ 1,025,380$ 1,024,200$
Expenses:
Communication 1,486$ 1,420$ 3,275$
Other Maintenance 7,640 34,460 30,960
Personnel 645,222 575,406 566,558
Professional Fees 1,500 - 1,000
Supplies 17,340 14,880 19,400
Utilities - 570 600
Roads and Mains 277,871 292,600 265,000
Allocations 36,914 36,559 37,429
Depreciation 37,940 36,500 38,500
Total Expenses 1,025,913$ 992,395$ 962,722$
Net Income 9,224 32,985 61,478
Effect of Change in accounting principle (23,245) - -
Total Net Position - Beginning 573,358 559,337 592,322
Total Net Position - Ending 559,337$ 592,322$ 653,800$
Capital/IRP 96,597 75,000 120,000
STATE STREET AID FUND FY 2018 FY 2019 FY 2020
Actual Estimate Proposed
Revenues:
State Street Aid 1,345,488$ 1,415,000$ 1,420,000$
Interest 5,801 15,000 2,500
Transfer In - General Fund 1,100,000 1,500,000 2,800,000
Total Revenues 2,451,289$ 2,930,000$ 4,222,500$
Expenses:
Other Maintenance 283,426$ 200,000$ 200,000$
Electricity & Gas 900,108 915,000 920,000
Str. Contract Maint. 1,084,800 2,000,000 2,700,000
City Str. Maint. 291,399 354,000 450,000
Total Expenditures 2,559,733$ 3,469,000$ 4,270,000$
Excess (Deficit) (108,444) (539,000) (47,500)
Beginning Fund Balance 1,269,565 1,161,121 622,121
Ending Fund Balance 1,161,121$ 622,121$ 574,621$
DRUG FUND FY 2018 FY 2019 FY 2020
Actual Estimate Proposed
Revenues:
Drug Enforcement 125,396$ 228,000$ 300,000$
Total Revenues 125,396$ 228,000$ 300,000$
Expenses:
Personnel 106,582$ 94,000$ 111,000$
Communications - 500 1,000
Professional Fees 176 - -
Other Maintenance - 1,200 5,000
Supplies 28,719 70,800 138,000
Utilities 2,840 3,500 6,000
Rents - 750 750
Capital Outlay - - 35,000
Total Expenditures 138,317$ 170,750$ 296,750$
Excess (Deficit) (12,921) 57,250 3,250
Beginning Fund Balance 138,841 125,920 183,170
Ending Fund Balance 125,920$ 183,170$ 186,420$
BOARD OF MAYOR AND ALDERMEN ORDINANCE – FY20
25
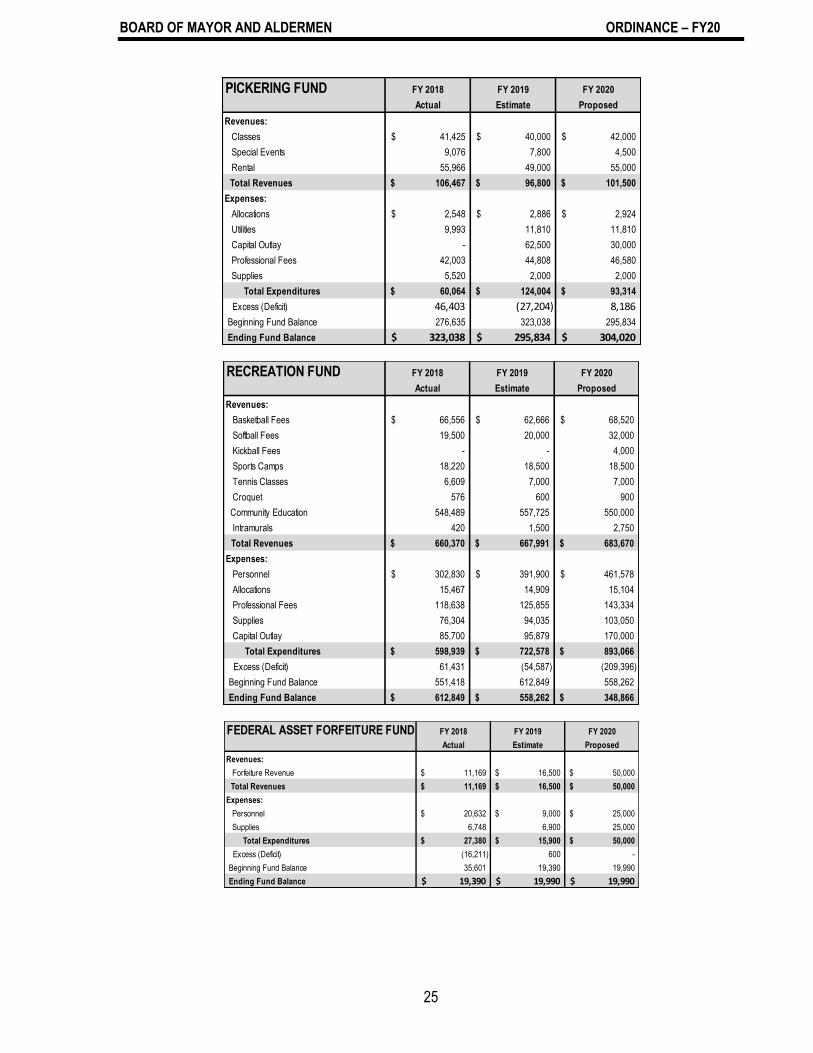
PICKERING FUND FY 2018 FY 2019 FY 2020
Actual Estimate Proposed
Revenues:
Classes 41,425$ 40,000$ 42,000$
Special Events 9,076 7,800 4,500
Rental 55,966 49,000 55,000
Total Revenues 106,467$ 96,800$ 101,500$
Expenses:
Allocations 2,548$ 2,886$ 2,924$
Utilities 9,993 11,810 11,810
Capital Outlay - 62,500 30,000
Professional Fees 42,003 44,808 46,580
Supplies 5,520 2,000 2,000
Total Expenditures 60,064$ 124,004$ 93,314$
Excess (Deficit) 46,403 (27,204) 8,186
Beginning Fund Balance 276,635 323,038 295,834
Ending Fund Balance 323,038$ 295,834$ 304,020$
RECREATION FUND FY 2018 FY 2019 FY 2020
Actual Estimate Proposed
Revenues:
Basketball Fees 66,556$ 62,666$ 68,520$
Softball Fees 19,500 20,000 32,000
Kickball Fees - - 4,000
Sports Camps 18,220 18,500 18,500
Tennis Classes 6,609 7,000 7,000
Croquet 576 600 900
Community Education 548,489 557,725 550,000
Intramurals 420 1,500 2,750
Total Revenues 660,370$ 667,991$ 683,670$
Expenses:
Personnel 302,830$ 391,900$ 461,578$
Allocations 15,467 14,909 15,104
Professional Fees 118,638 125,855 143,334
Supplies 76,304 94,035 103,050
Capital Outlay 85,700 95,879 170,000
Total Expenditures 598,939$ 722,578$ 893,066$
Excess (Deficit) 61,431 (54,587) (209,396)
Beginning Fund Balance 551,418 612,849 558,262
Ending Fund Balance 612,849$ 558,262$ 348,866$
FEDERAL ASSET FORFEITURE FUND FY 2018 FY 2019 FY 2020
Actual Estimate Proposed
Revenues:
Forfeiture Revenue 11,169$ 16,500$ 50,000$
Total Revenues 11,169$ 16,500$ 50,000$
Expenses:
Personnel 20,632$ 9,000$ 25,000$
Supplies 6,748 6,900 25,000
Total Expenditures 27,380$ 15,900$ 50,000$
Excess (Deficit) (16,211) 600 -
Beginning Fund Balance 35,601 19,390 19,990
Ending Fund Balance 19,390$ 19,990$ 19,990$
BOARD OF MAYOR AND ALDERMEN ORDINANCE – FY20
26
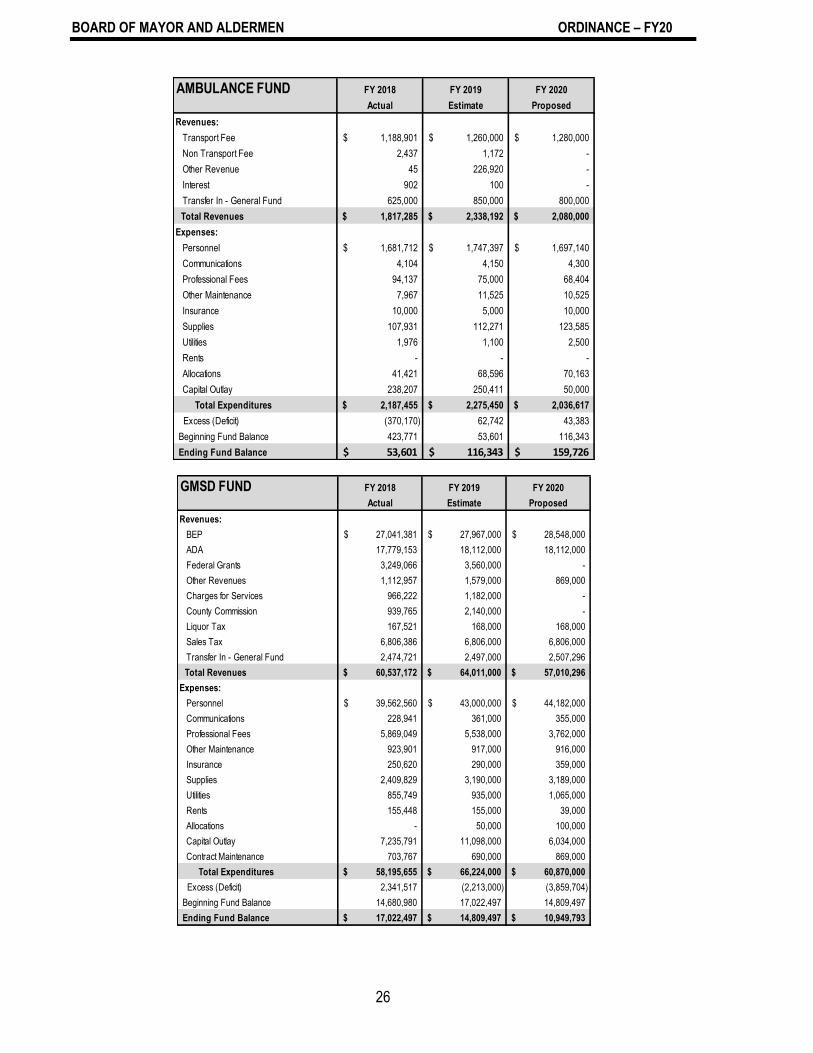
AMBULANCE FUND FY 2018 FY 2019 FY 2020
Actual Estimate Proposed
Revenues:
Transport Fee 1,188,901$ 1,260,000$ 1,280,000$
Non Transport Fee 2,437 1,172 -
Other Revenue 45 226,920 -
Interest 902 100 -
Transfer In - General Fund 625,000 850,000 800,000
Total Revenues 1,817,285$ 2,338,192$ 2,080,000$
Expenses:
Personnel 1,681,712$ 1,747,397$ 1,697,140$
Communications 4,104 4,150 4,300
Professional Fees 94,137 75,000 68,404
Other Maintenance 7,967 11,525 10,525
Insurance 10,000 5,000 10,000
Supplies 107,931 112,271 123,585
Utilities 1,976 1,100 2,500
Rents - - -
Allocations 41,421 68,596 70,163
Capital Outlay 238,207 250,411 50,000
Total Expenditures 2,187,455$ 2,275,450$ 2,036,617$
Excess (Deficit) (370,170) 62,742 43,383
Beginning Fund Balance 423,771 53,601 116,343
Ending Fund Balance 53,601$ 116,343$ 159,726$
GMSD FUND FY 2018 FY 2019 FY 2020
Actual Estimate Proposed
Revenues:
BEP 27,041,381$ 27,967,000$ 28,548,000$
ADA 17,779,153 18,112,000 18,112,000
Federal Grants 3,249,066 3,560,000 -
Other Revenues 1,112,957 1,579,000 869,000
Charges for Services 966,222 1,182,000 -
County Commission 939,765 2,140,000 -
Liquor Tax 167,521 168,000 168,000
Sales Tax 6,806,386 6,806,000 6,806,000
Transfer In - General Fund 2,474,721 2,497,000 2,507,296
Total Revenues 60,537,172$ 64,011,000$ 57,010,296$
Expenses:
Personnel 39,562,560$ 43,000,000$ 44,182,000$
Communications 228,941 361,000 355,000
Professional Fees 5,869,049 5,538,000 3,762,000
Other Maintenance 923,901 917,000 916,000
Insurance 250,620 290,000 359,000
Supplies 2,409,829 3,190,000 3,189,000
Utilities 855,749 935,000 1,065,000
Rents 155,448 155,000 39,000
Allocations - 50,000 100,000
Capital Outlay 7,235,791 11,098,000 6,034,000
Contract Maintenance 703,767 690,000 869,000
Total Expenditures 58,195,655$ 66,224,000$ 60,870,000$
Excess (Deficit) 2,341,517 (2,213,000) (3,859,704)
Beginning Fund Balance 14,680,980 17,022,497 14,809,497
Ending Fund Balance 17,022,497$ 14,809,497$ 10,949,793$

BOARD OF MAYOR AND ALDERMEN ORDINANCE – FY20
27
FARM FUND FY 2018 FY 2019 FY 2020
Actual Estimate Proposed
Revenues:
Membership Fee 4,580$ 4,500$ 4,500$
Donations 19,111 19,686 17,500
Vendor Income 2,653 3,000 3,000
Educational Fees 2,075 1,000 1,400
Grant 2,000 1,000 1,000
Rental Income 6,222 9,800 13,000
Transfer In - General Fund 120,000 120,000 100,000
Total Revenues 156,641$ 158,986$ 140,400$
Expenses:
Personnel 52,384$ 86,340$ 90,105$
Communications 2,649 2,300 2,600
Professional Fees 28,434 21,500 21,800
Other Maintenance 7,901 9,500 12,000
Insurance - 2,500 2,500
Supplies 11,878 12,500 12,700
Utilities 8,563 8,331 10,231
Rents 12,339 8,000 6,000
Allocations 965 1,093 1,107
Capital Outlay 17,231 - -
Total Expenditures 142,344$ 152,064$ 159,043$
Excess (Deficit) 14,297 6,922 (18,643)
Beginning Fund Balance 133,217 147,514 154,436
Ending Fund Balance 147,514$ 154,436$ 135,793$
LIBRARY ENDOWMENT FUND FY 2018 FY 2019 FY 2020
Actual Estimate Proposed
Revenues:
Interest 3,100$ -$ -$
Other Revenue 1,000 - -
Total Revenues 4,100$ -$ -$
Expenses:
Personnel 3,057$ -$ -$
Communications - - -
Professional Fees 8,139 - -
Other Maintenance - - -
Supplies 6,217 - -
Total Expenditures 17,413$ -$ -$
Excess (Deficit) (13,313) - -
Beginning Fund Balance 247,585 234,272 234,272
Ending Fund Balance 234,272$ 234,272$ 234,272$
E-CITATIONS FUND FY 2018 FY 2019 FY 2020
Actual Estimate Proposed
Revenues:
Other Revenues -$ 30,028$ 31,050$
Total Revenues -$ 30,028$ 31,050$
Expenses:
Other Maintenance -$ -$ -$
Supplies - 4,319 3,000
Capital Outlay - - -
Total Expenditures -$ 4,319$ 3,000$
Excess (Deficit) - 25,709 28,050
Beginning Fund Balance - - 25,709
Ending Fund Balance -$ 25,709$ 53,759$
BOARD OF MAYOR AND ALDERMEN ORDINANCE – FY20
28
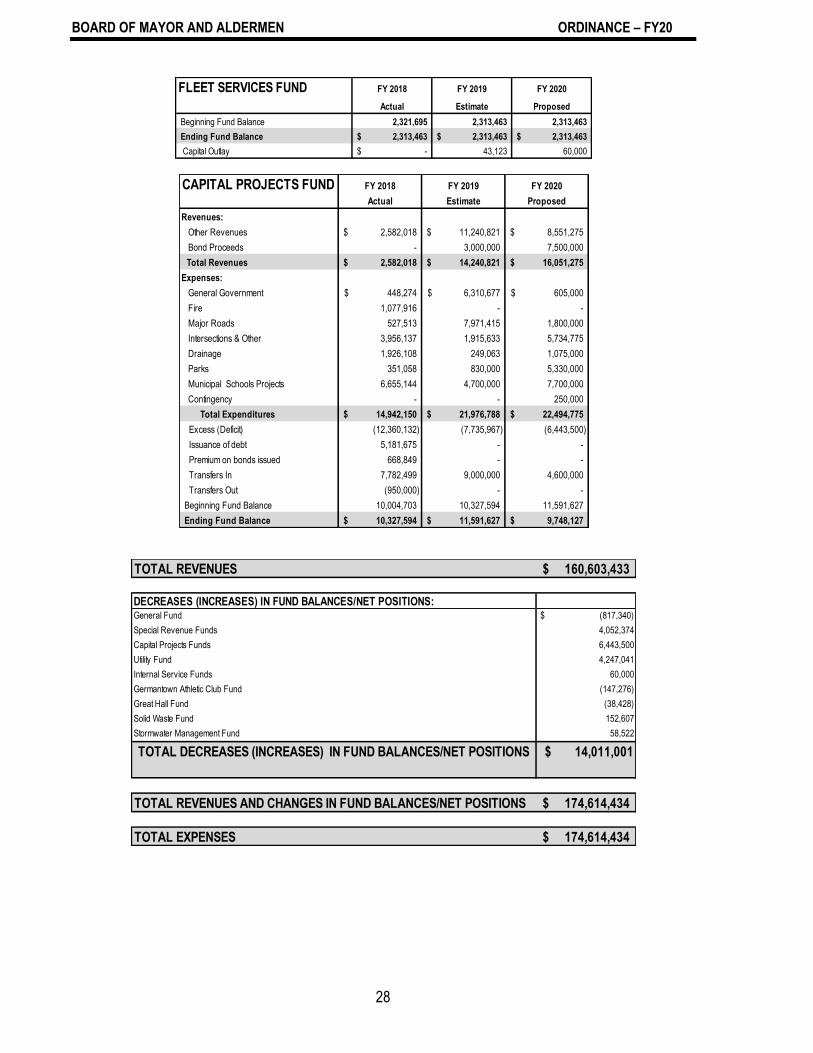
FLEET SERVICES FUND FY 2018 FY 2019 FY 2020
Actual Estimate Proposed
Beginning Fund Balance 2,321,695 2,313,463 2,313,463
Ending Fund Balance 2,313,463$ 2,313,463$ 2,313,463$
Capital Outlay -$ 43,123 60,000
CAPITAL PROJECTS FUND FY 2018 FY 2019 FY 2020
Actual Estimate Proposed
Revenues:
Other Revenues 2,582,018$ 11,240,821$ 8,551,275$
Bond Proceeds - 3,000,000 7,500,000
Total Revenues 2,582,018$ 14,240,821$ 16,051,275$
Expenses:
General Government 448,274$ 6,310,677$ 605,000$
Fire 1,077,916 - -
Major Roads 527,513 7,971,415 1,800,000
Intersections & Other 3,956,137 1,915,633 5,734,775
Drainage 1,926,108 249,063 1,075,000
Parks 351,058 830,000 5,330,000
Municipal Schools Projects 6,655,144 4,700,000 7,700,000
Contingency - - 250,000
Total Expenditures 14,942,150$ 21,976,788$ 22,494,775$
Excess (Deficit) (12,360,132) (7,735,967) (6,443,500)
Issuance of debt 5,181,675 - -
Premium on bonds issued 668,849 - -
Transfers In 7,782,499 9,000,000 4,600,000
Transfers Out (950,000) - -
Beginning Fund Balance 10,004,703 10,327,594 11,591,627
Ending Fund Balance 10,327,594$ 11,591,627$ 9,748,127$
TOTAL REVENUES 160,603,433$
DECREASES (INCREASES) IN FUND BALANCES/NET POSITIONS:General Fund $ (817,340)
Special Revenue Funds 4,052,374
Capital Projects Funds 6,443,500
Utility Fund 4,247,041
Internal Service Funds 60,000
Germantown Athletic Club Fund (147,276)
Great Hall Fund (38,428)
Solid Waste Fund 152,607
Stormwater Management Fund 58,522
TOTAL DECREASES (INCREASES) IN FUND BALANCES/NET POSITIONS $ 14,011,001
TOTAL REVENUES AND CHANGES IN FUND BALANCES/NET POSITIONS 174,614,434$
TOTAL EXPENSES 174,614,434$
BOARD OF MAYOR AND ALDERMEN ORDINANCE – FY20
29
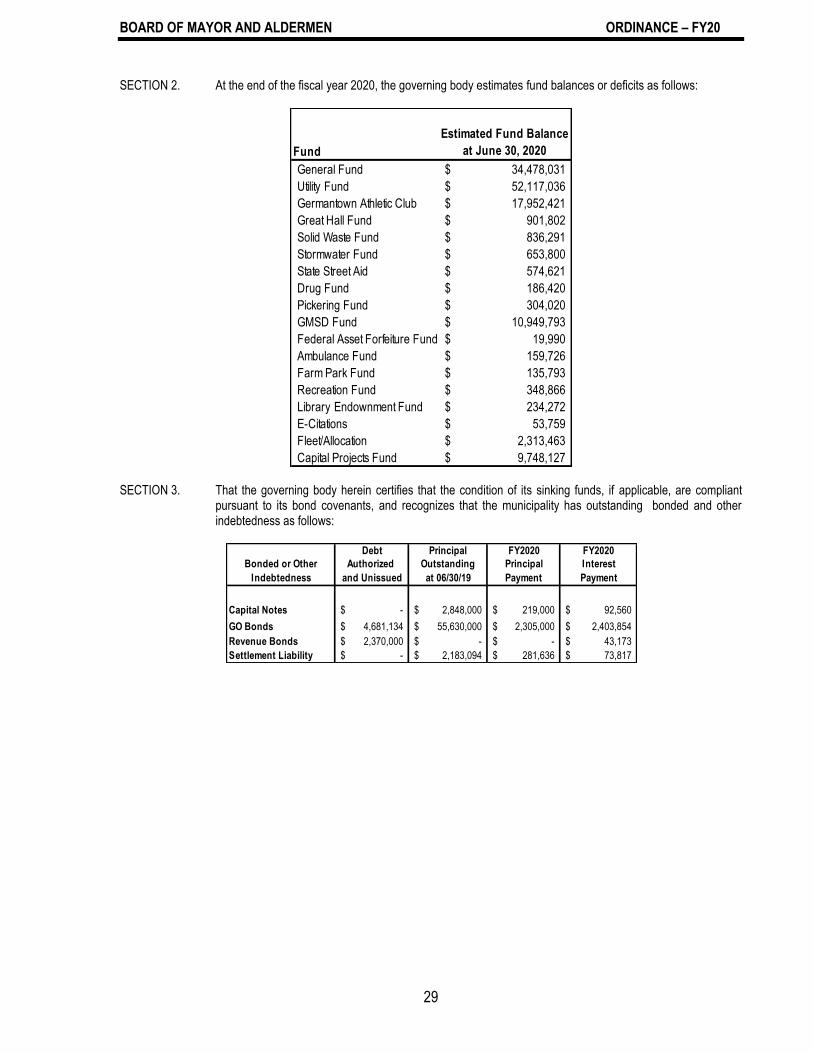
SECTION 2. At the end of the fiscal year 2020, the governing body estimates fund balances or deficits as follows:
SECTION 3. That the governing body herein certifies that the condition of its sinking funds, if applicable, are compliant
pursuant to its bond covenants, and recognizes that the municipality has outstanding bonded and other indebtedness as follows:
Fund
Estimated Fund Balance
at June 30, 2020
General Fund 34,478,031$
Utility Fund 52,117,036$
Germantown Athletic Club 17,952,421$
Great Hall Fund 901,802$
Solid Waste Fund 836,291$
Stormwater Fund 653,800$
State Street Aid 574,621$
Drug Fund 186,420$
Pickering Fund 304,020$
GMSD Fund 10,949,793$
Federal Asset Forfeiture Fund 19,990$
Ambulance Fund 159,726$
Farm Park Fund 135,793$
Recreation Fund 348,866$
Library Endownment Fund 234,272$
E-Citations 53,759$
Fleet/Allocation 2,313,463$
Capital Projects Fund 9,748,127$
Debt Principal FY2020 FY2020
Bonded or Other Authorized Outstanding Principal Interest
Indebtedness and Unissued at 06/30/19 Payment Payment
Capital Notes -$ 2,848,000$ 219,000$ 92,560$
GO Bonds 4,681,134$ 55,630,000$ 2,305,000$ 2,403,854$
Revenue Bonds 2,370,000$ -$ -$ 43,173$
Settlement Liability -$ 2,183,094$ 281,636$ 73,817$

BOARD OF MAYOR AND ALDERMEN ORDINANCE – FY20
30
SECTION 4. During the coming fiscal year (2020) the governing body has pending and planned capital projects and with proposed funding as follows:
FY20 Pending Capital Projects Pending Pending Pending Pending
Pending Capital Capital Capital Capital
Capital Projects Expense Projects Expense Projects Expense Projects Expense
Projects - Financed by Financed by Financed by Financed by
(in thousands) Total Expense Grants Bonds State & Federal Reserves
GENERAL GOVERNMENT:
Court Clerk Office Renovation 60$ - - - 60
GPAC Grove Perimeter Fencing 300 150 - - 150
Ambulance 245 - - - 245
Total General Government: 605$ 150 - - 455
MAJOR ROADS:
Forest Hill Irene Safety Improv Poplar to WRB 375$ - - 300 75
Neshoba Rd Gtown to Exter Overlay 150 - - 120 30
Wolf River Milling and Paving - Riverdale to West City Limits 200 - - 160 40
Major Road Plan 100 - - 80 20
Poplar Avenue Culvert - Phase IV and V* 575 - - 575 -
FHI Widening Poplar Pike/Winc- Const 400 - - - 400
Total Major Roads: 1,800$ - - 1,235 565
* State funding is included in totals.
INTERSECTIONS & OTHER:
Decorative Street Signs 59.8$ 10 - - 50
Signal Upgrades* 300 - - 300 -
Intersection Safety Audit 200 - - 160 40
WRB/Campbell Clinic Signal 75 38 - - 37
Signalization WRB @ HHS 100 - - 100 -
Wolf River/Gtown Rd Impr- Const* 4,600 - - 4,600 -
Signalization FHI @ Crestwyn 75 35 - - 40
GPAC Pedestrian Walkways 50 - - - 50
ADA Transition Plan* 275 - - 220 55
Total Intersections/Other: 5,734.8$ 83 - 5,380 271.8
* State funding is included in totals.
DRAINAGE:
City Wide Master Drainage Plan 150$ - - - 150
Lateral E Bank Stablization 875 - - - 875
Annual Misc Drainage Imprv 50 - - - 50
Total Drainage: 1,075$ - - - 1,075
* State funding is included in totals.
(in thousands)
PARKS:
Germantown Station Park Reinvestment 250$ - - - 250
Riverdale Reinvestment 250 - - - 250
Greenway Phase Nashoba to East Trail Head* 2,130 - - 1,704 426
Cameron Brown Phase 1 200 - - - 200
Parkland Acquistion 2,500 - 2,500 - -
Total Parks: 5,330$ - 2,500 1,704 1,126
* State funding is included in totals.
GERMANTOWN ATHLETIC CLUB FUND:
GAC Renovation Phase 4 Closeout 40$ - - - 40
Exterior Signage 50 - - - 50
Total GAC Fund: 90$ - - - 90
MUNICIPAL SCHOOLS:
HHS Fieldhouse 200$ - - - 200
Security Upgrades 1,000 - - - 1,000
Riverdale Boilers 1,500 - - - 1,500
Houston Middle School Expansion 5,000 - 5,000 - -
Total GMSD Fund: 7,700$ - 5,000 - 2,700
UTILITY FUND:
Water System Acquisition Funding 500$ - - - 500
Elevated Water Tank 2,357 - 2,357 - -
Annexation Area Water Main Phase 2 1,034 - - - 1,034
Automated Meter Reading Phase 1 50 - - - 50
Total Utility Fund: 3,941$ - 2,357 - 1,584
CONTINGENCY: 250$ - - - 250
Total Contingency: 250$ - - - 250

BOARD OF MAYOR AND ALDERMEN ORDINANCE – FY20
31
SECTION 5. No appropriations listed above may be exceeded without an amendment of the budget ordinance as required
by the Municipal Budget Law of 1982 (T.C.A. Section 6-56-208). In addition, no appropriation may be made in excess of available funds except to provide for an actual emergency threatening the health, property or lives of the inhabitants of the municipality and declared by a two-thirds (2/3) vote of at least a quorum of the governing body in accord with Tennessee Code Annotated Section 6-56-205.
Proposed Future Capital Projects Proposed Proposed Proposed ProposedProposed Future Capital Future Capital Future Capital Future Capital
Future Capital Projects Expense Projects Expense Projects Expense Projects Expense
Projects - Financed by Financed by Financed by Financed by
(in thousands) Total Expense Grants Bonds State & Federal Reserves
GENERAL GOVERNMENT:
Fire Station 3 Construction 4,000$ - 4,000 - -
Fire Station #2 Design 350 - - - 350
Fire Engine Replacement 1,300 - - - 1,300
Ambulance (2) 745 - - - 745
Total General Government: 6,395$ - 4,000 - 2,395
MAJOR ROADS:
Neshoba Rd Gtown to Exter Overlay 1,350 - - 1,080 270
FHI Widening Poplar to WRB ROW 500 - - 400 100
FHI Widening Poplar to WRB Const 4,125 - - 3,300 825
Wolf River Milling and Paving - Riverdale to West City Limits 1,800 - - 1,440 360
Poplar Avenue Culvert - Phase IV and V* 500 - - 500 -
Total Major Roads: 8,275$ - - 6,720 1,555
* State funding is included in totals.
INTERSECTIONS & OTHER:
Signal Upgrades* 1,200 - - 1,200 -
WRB/Campbell Clinic Signal 425 213 - - 213
Signalization WRB @ HHS 400 - - 400 -
Signalization FHI @ Crestwyn 425 - - - 425
Total Intersections/Other: 2,450$ 213 - 1,600 637.5
* State funding is included in totals.
DRAINAGE:
City Wide Master Drainage Plan 750$ - - - 750
Duntreath Drainage Ditch Improvements 1,080 - - - 1,080
Annual Misc Drainage Imprv 250 - - - 250
Redbud Trail Imprv 500 - - - 500
Riverdale Rd Outlet Culvert 830 - - - 830
English Meadows 900 - - - 900
Dogwood Grove 4th addition 930 - - - 930
Miller Farms Drainage Study 115 - - - 115
Great Oaks Drainage 850 - - - 850
Total Drainage: 6,205$ - - - 6,205
* State funding is included in totals.
(in thousands)
PARKS:
Greenway Clark Property 400$ - - - 400
Neighborhood Parks 2,400 - 1,000 - 1,400
Greenway Wayfinding Signage 300 - - - 300
Long Field Project Design and Development 4,000 - 2,500 - 1,500
Parkland Acquistion 1,000 - - - 1,000
Total Parks: 8,100$ - 3,500 - 4,600
* State funding is included in totals.
MUNICIPAL SCHOOLS:
HHS Fieldhouse 600$ - - - 600
Total GMSD Fund: 600$ - - - 600
UTILITY FUND:
North Johnson Road Lift Station 235$ - - - 235 Automated Meter Reading Phase 1 3,000 - - 3,000
Sanitary Sewer Upgrade Design- FHH 1,000 - - - 1,000
Total Utility Fund: 4,235$ - - - 4,235
CONTINGENCY: 1,250$ - - - 1,250
Total Contingency: 1,250$ - - - 1,250

BOARD OF MAYOR AND ALDERMEN ORDINANCE – FY20
32
SECTION 6. At any time during the fiscal year, the City Administrator may transfer part or all of any unencumbered line items within a department, office, or agency. The Board, by appropriate action, may authorize the City Administrator to transfer moneys from one (1) department, office or agency to another within the same fund subject to such limitations and procedures as it may prescribe. Any such transfers shall be reported to the Board at its next regular meeting and shall be entered in the minutes.
SECTION 7. In the event funds are donated or contributed to the City or the City receives grants, revenue projections and
expenditure appropriations may be increased by action of the Board of Mayor and Aldermen to the extent of the amount of funds received.
SECTION 8. A detailed financial plan will be attached to this budget and become part of this budget ordinance. In addition,
the published operating budget and budgetary comparisons shown by fund with beginning and ending fund balances and the number of full time equivalent employees required by Section 6-56-206, Tennessee Code Annotated will be attached.
SECTION 9. There is hereby levied a property tax of $1.95 per $100 of assessed value on all real and personal property. SECTION 10. This annual operating and capital budget ordinance and supporting documents shall be submitted to the
Comptroller of the Treasury or Comptroller’s Designee for approval if the City has debt issued pursuant to Title 9, Chapter 21 of the Tennessee Code Annotated within fifteen (15) days of its adoption. This budget shall not become the official budget for the fiscal year until such budget is approved by the Comptroller of the Treasury or Comptroller’s Designee in accordance with Title 9, Chapter 21 of the Tennessee Code Annotated (the “Statutes”.) If the Comptroller of the Treasury or Comptroller’s Designee determines that the budget does not comply with the Statues, the Governing Body shall adjust its estimates or make additional tax levies sufficient to comply with the Statutes or as directed by the Comptroller of the Treasury or Comptroller’s Designee. If the City does not have such debt outstanding, it will file this annual operating and capital budget ordinance and supporting documents with the Comptroller of the Treasury or Comptroller’s Designee.
SECTION 11. All unencumbered balances of appropriations remaining at the end of the fiscal year shall lapse and revert to
the respective fund balances. SECTION 12. All ordinances or parts of ordinances in conflict with any provision of this ordinance are hereby repealed. SECTION 13. This ordinance shall take effect July 1, 2019, the public welfare requiring it. First Reading: May 13, 2019 Second Reading: June 10, 2019 Third Reading: June 24, 2019 Mike Palazzolo, Mayor Michele Betty, City Clerk/Recorder

STRATEGIC OBJECTIVES
33
In January 2015 the Germantown Board of Mayor and Aldermen approved a process for the development of a long-range strategic plan to guide the growth and development of the community for the next 15 years. The year-long planning process focused on understanding and influencing the future, rather than simply preparing for or adapting to it, by aligning resources to bridge the gap between our present condition and the desired future. The strategic planning process began with the appointment of a 30-member steering committee. These citizens led the development of the Germantown Forward 2030 vision statement. A larger group of citizens assigned to specific task forces worked to develop specific goals and action plans to translate the vision into reality. The vision statement developed by the steering committee is an expression of possibility, the ideal state that the community hopes to achieve. The focus of the steering committee in writing the vision statement was to ensure it is embraced by the entire community. The vision provides the basis, defined by a series of value based principles, from which the steering committee established the key performance areas. The key performance areas that emerged from the visioning process formed the foundation for the task forces’ strategy development work that followed. Nine task forces were comprised of steering committee members, appropriate City staff, and residents tapped for their expertise or interest in one of the key performance areas (KPA). Individual task forces used the following steps to develop the strategic objectives, actions plans and key performance indicators that guide the implementation of the strategic plan.
1. Each task force developed a description of success (DoS) for the KPA. The description of success defines KPA success in reference to the vision statement. Task force members asked the question, “What should the performance area look like if the vision is achieved?” and “What community assets exist to help reach this description?”
2. Once the description of success was defined, the task force used this description to identify indicators and targets to monitor progress.
3. Each task force developed a Description of the Current Reality focusing on challenges that may threaten achievement of the description of success. Identification of these challenges provided a starting point for action plan development.
4. Finally, the task force generated ideas and initiatives, in the form of strategic objectives and action plans, designed to move the community from current realty toward success. Action plans were sorted into short-, medium- and long-term priorities and performance indicators were developed for each objective.
The strategic objectives and the action plans that emerged effectively identify what must be accomplished to achieve the vision set forth in Germantown Forward 2030. These objectives will be deployed through the allocation of intellectual and human capital and financial resources. Progress will be measured using a performance management program designed to provide accountability and transparency.
GERMANTOWN FORWARD 2030
VISION:
Germantown is a vibrant modern community, the community of choice, offering outstanding quality of life for all generations. The government is fiscally sound and provides top quality public safety and services responsive to community requirements. Engaged residents honor the past, treasure the present and responsibly shape Germantown's future.
THE COMMUNITY VALUES:
Excellence in education Innovation, creativity and continuous improvement Lifestyle opportunities as part of the fabric of everyday life Natural and designed beauty and smart community growth Community strength, health and sustainability Culture of excellence and kindness Local and regional partnerships

STRATEGIC OBJECTIVES
34
KPA STRATEGIC OBJECTIVE ACTION PLAN TIMELINE KEY PERFORMANCE INDICATOR
City
Ser
vice
s an
d F
inan
ce
All funds are self-sustaining.
Reduce dependency of Special Revenue Funds on the General Fund. Reduce dependency of Enterprise Funds on the General Fund.
1 to 2 years General Fund transfers to Special Revenue Funds General Fund transfers to Enterprise Funds
Asset renewal is fully funded and takes place as scheduled.
Update IRP policy, establish prioritization criteria. Develop process to measure variance between IRP and actual replacement. Increase asset replacement to meet schedule.
1 to 2 years Fully funded asset renewal
Net financial liabilities are fully funded. Reinforce adopted financial policies and monitor market performance.
1 to 10 years Fully funded annual pension liability
The City provides high-quality services.
Provide timely response to customer needs. Understand customer requirements and integrate within the performance management system.
1 to 2 years Satisfaction with City services
The City provides community services that are responsive to customer needs.
Align departmental business plans with strategic plan. Develop and implement a process to update the plan.
1 to 2 years Net Promoter Score
City Services are used effectively in high-priority areas.
Percent of total City resources for low-valued services should not exceed 20%.
1 to 2 years Satisfaction with the focus on priorities Funding of low-valued services
Eco
nom
ic D
evel
opm
ent
Economic development practices support economic sustainability.
Develop Germantown as a regional destination. Grow and retain employment opportunities by executing industry sector and cluster strategies aimed at growing the Life Sciences and Health Care sectors.
1 to 2 years Ratio of elastic tax revenue to total revenue Unemployment rate Business growth rate Cost of living index
Economic development policies encourage investment in key commercial areas.
Complete all identified small area plans and adopt related land use changes. Redevelop municipal center into a mixed-use development and city center.
1 to 2 years 2 to 5 years
Commercial tax base revenue Value of new construction in key commercial areas Job growth Median residential property value and home price
Edu
catio
n
Germantown has a reputation for lifelong learning and continuous education that meets the needs of all residents.
Conduct a survey of local offerings and prepare a plan to fill identified gaps. Improve availability and awareness of adult and children’s education opportunities in Germantown. Establish a forum for education leaders to share, coordinate and cooperate. Support campus safety and the health and welfare of students and teachers.
1 to 2 years Participation in adult lifelong learning and continuing education Degree that adult lifelong learning and continuing education needs are met Books from Birth enrollment
Germantown Municipal School District is the top-performing school district in Shelby County and ranks among the top five statewide.
The City responsibly provides financial support for GMSD’s facilities plan. GMSD benefits from the City’s borrowing and purchasing power. Support campus safety and the health and welfare of students and teachers. City departments collaborate with GMSD to support student achievement.
1 to 2 years Satisfaction with GMSD operations GMSD ACT scores GMSD Graduation rate GMSD College readiness

STRATEGIC OBJECTIVES
35
KPA STRATEGIC OBJECTIVE ACTION PLAN TIMELINE KEY PERFORMANCE INDICATOR La
nd U
se a
nd T
rans
port
atio
n
Significantly improve walkability in Germantown’s CBD
Implement streetscape design standards in the CBD to enhance walkability. Fully implement the City’s Greenway and Pedestrian/Bicycle Master Plans.
1 to 2 years 2 to 5 years
Central Business District Walk Score
Germantown is regionally recognized as a leader for improved access and mobility for all forms of transportation.
Develop a baseline for level of service on Germantown Rd. and Poplar Ave. Develop and adopt a Complete Streets policy. Update the major road plan and establish priorities for transportation efficiency. Improve the Level of Service on Poplar Ave. and Germantown Rd.
1 to 2 years 2 to 5 years
Ratio of proposed to actual bike routes and greenway Satisfaction with traffic flow Level of Service for Germantown Road Level of Service for Poplar Avenue
Assessed property value in smart growth areas increases annually.
Proactively promote smart growth development opportunities in identified. Economic Development strategic nodes.
1 to 2 years Property tax revenue from smart growth areas
The City experiences positive trends in assessed value of residential areas.
Activate the Neighborhood Planning Initiative. Incentivize and support rehabilitation of existing single family homes and lots. Promote alternative models of single family housing types. Establish a support program for the maintenance of older homes.
1 to 2 years 2 to 5 years
Assessed value of residential property Ratio of multi-family to single-family homes
Nat
ural
Res
ourc
es
Policies and practices advance sustainable practices in natural resource management.
Create a Natural Resource Division. Create a comprehensive database of all natural resources. Provide public awareness for understanding of the plan. Improve access to nature and increase public awareness. Develop and implement a long-term funding strategy to progress plan. Practice and promote innovative energy conservation measures. Implement a long-term funding strategy to support sustained tree canopy.
1 to 2 years 2 to 5 years 5 to 10 years
City’s carbon footprint Air quality index
Ecosystem integrity and habitat biodiversity exist on public lands.
Ensure well-stocked fishing lakes and ponds. Develop and implement a streamside buffer ordinance. Increase use of drought-tolerant, low-maintenance native plants. Eradicate invasive plants on all public property. Increase designated arboretums on public lands. Create designated, protected wildlife corridors. Increase tree planting programs. Increase planting of vegetation and habitat restoration to attract desired wildlife, pollinators, birds and butterflies.
1 to 2 years 2 to 5 years
Tree canopy coverage ratio City’s non-invasive plant inventory Designated arboretum
Enhanced protection and conservation of water resources are priorities.
Monitor USGS and Groundwater Institute reports. Invest in water availability redundancy. Protect wetlands and surface water. Maintain a national pollutant discharge eliminations system. Invest in infrastructure through a comprehensive IRP plan. Implement eco-friendly irrigation systems and retrofits. Evaluate long-term non-ground water irrigation options.
1 to 2 years Total coliforms in stormwater Turbidity Total dissolved solids Water hardness Rate of change in aquifer level
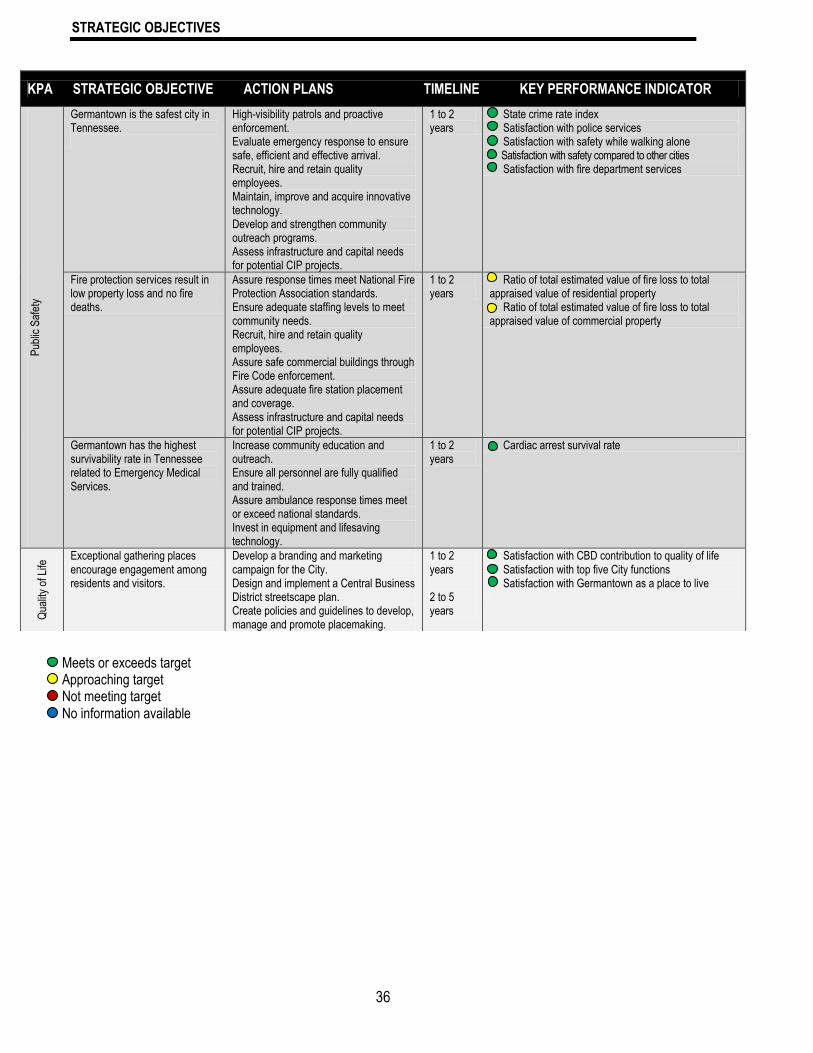
STRATEGIC OBJECTIVES
36
KPA STRATEGIC OBJECTIVE ACTION PLANS TIMELINE KEY PERFORMANCE INDICATOR
Pub
lic S
afet
y
Germantown is the safest city in Tennessee.
High-visibility patrols and proactive enforcement. Evaluate emergency response to ensure safe, efficient and effective arrival. Recruit, hire and retain quality employees. Maintain, improve and acquire innovative technology. Develop and strengthen community outreach programs. Assess infrastructure and capital needs for potential CIP projects.
1 to 2 years
State crime rate index Satisfaction with police services Satisfaction with safety while walking alone Satisfaction with safety compared to other cities Satisfaction with fire department services
Fire protection services result in low property loss and no fire deaths.
Assure response times meet National Fire Protection Association standards. Ensure adequate staffing levels to meet community needs. Recruit, hire and retain quality employees. Assure safe commercial buildings through Fire Code enforcement. Assure adequate fire station placement and coverage. Assess infrastructure and capital needs for potential CIP projects.
1 to 2 years
Ratio of total estimated value of fire loss to total appraised value of residential property Ratio of total estimated value of fire loss to total appraised value of commercial property
Germantown has the highest survivability rate in Tennessee related to Emergency Medical Services.
Increase community education and outreach. Ensure all personnel are fully qualified and trained. Assure ambulance response times meet or exceed national standards. Invest in equipment and lifesaving technology.
1 to 2 years
Cardiac arrest survival rate
Qua
lity
of L
ife Exceptional gathering places
encourage engagement among residents and visitors.
Develop a branding and marketing campaign for the City. Design and implement a Central Business District streetscape plan. Create policies and guidelines to develop, manage and promote placemaking.
1 to 2 years 2 to 5 years
Satisfaction with CBD contribution to quality of life Satisfaction with top five City functions Satisfaction with Germantown as a place to live
Meets or exceeds target Approaching target Not meeting target No information available

PERFORMANCE MEASUREMENTS – FY20
37
It is not enough to simply provide good customer service; the City of Germantown continually strives to improve overall value to its citizens. Business planning is a basic step to understanding how departments operate and provides a framework to examine alternatives to “business as usual”. Performance measures are the core of any results-based business planning and budgeting system. Thus, the City’s business planning process has a specific focus on performance measurement linking to the desired outcomes and performance measures in the City’s Strategic Plan. Departments monitor the need for change in performance measures as their operating environment evolves. Results-based business planning and budgeting is a process that directly connects resource allocations to specific measurable outcomes. Budgets are used to drive the progress and leverage accountability, rather than maintaining the status quo. This system provides policy makers with the tools they need to respond more effectively to what the community wants, as well as provide them with the political support that is needed to make tough choices. The City of Germantown’s performance management and strategic planning approach consists of identifying organizational strategies based on the Board of Mayor and Aldermen’s Germantown Forward 2030 Strategic Plan, then translating the strategy through organizational departments. Performance measures are reviewed during the budget process to ensure that target goals are current with the BMA Policy Agenda. Changes were made to reflect each department’s evaluation of past service results and new program changes. Performance measures are reported quarterly along with a year-end report summarizing the fiscal year’s performance on an annual basis, which is distributed to elected officials and all levels of city management. These reports spotlight the level of service and allow for appropriate changes in staffing, funding allocations and delivery of service levels.
The quality of customer service is almost wholly determined by the organization’s ability to meet their citizen and customer’s expectations. Because customer expectations are an ever-evolving process, it can be very challenging to know precisely what those expectations might be. The best course of action is to take the question directly to the city’s citizen and customers. Each year, departments conduct customer focus groups with both internal and external customers to determine departmental requirements. Questions such as “what do you expect of the department?” “What must be accomplished to meet your expectations?” “What is the most important factor leading to your complete satisfaction?” These answers provide valuable feedback that help identify possible program changes and processes that need to be amended in order to meet community needs. From this, departments validate or modify their performance measures to support citizen expectations.
Performance Measures are included in each department’s section. In addition, the City also conducts an annual citizen survey. The survey asks respondents to rate the importance respondents assign to a set of City Services and then provide the level of satisfaction they have with how they perceive the City is performing those services. A Gap Analysis is conducted comparing how often each City Service is given a high satisfaction rating vs. how often the City Service is given a high importance rating. The difference or “gap” between satisfaction and importance ratings, in other words, customer needs and perceived performance allows the identification of areas of improvement and the construction of an improvement opportunity grid or priority chart. A priority chart graphically displays the City Functions in terms of satisfaction and importance scores and helps set priorities for future initiatives to improve resident satisfaction. The chart shows the value placed on each City Function from the survey respondent perspective and shows the importance value along the horizontal axis and the satisfaction value along the vertical axis. City Functions then fall into one of four quadrants based upon whether the value is above or below the average importance or average satisfaction rating. For example, with regards to importance values, City Functions on the right-hand side of the grid (above the average importance score of 75 percent) reflect values that are above average as far as importance ratings. With regards to satisfaction scores, City Functions on the top half of the grid (above the average satisfaction scores of 79 percent) reflect values that are above average as far as satisfaction ratings. From right to left counter clock wise, the priority chart shows the following results: Primary Strengths: These City Functions are above average in both satisfaction and importance levels. This indicates that the City is doing well in delivering these services and functions, and is placing the right level of effort and priority on them. These City Functions should be targets for continuous improvement. According to survey results in 2018, the following City Functions meet customer needs and satisfaction: Police Services, Fire Services, Ambulance and Emergency Medical Services, Recycling and Garbage Collection, Emergency Preparedness, City Parks. All these City Functions were areas of strengths identified in 2017. The City Parks were considered secondary strength in previous years and now show as a primary strength. Primary Opportunities: These City Functions are those with above average customer ratings in importance, but with below average ratings in satisfaction. The City should prioritize improvements on these functions and services. Efforts placed on these areas should contribute towards raising overall satisfaction levels. According to survey results in 2018, the following City Functions need attention: Support Neighborhoods, Attracting and Keeping Businesses in Germantown, Zoning and Land Use, Maintaining Streets, Managing Traffic Flow, Protecting our Natural Environment. All of these areas continue to be high priorities for improvement since the 2016 survey with the exception of Supporting Neighborhood which was considered a

PERFORMANCE MEASUREMENTS – FY20
38
high priority in 2017. In 2017, Maintaining Streets and Managing Traffic Flow were considered strengths, while Protecting our Natural Environment was considered a secondary opportunity. Secondary Opportunities: These City Functions reflect areas in which no immediate attention is needed. Even though survey respondents rated these functions below average in satisfaction, they also rated them below average in importance. Therefore, the City should not consider the following functions as high improvement priorities: Community Events, Walkable Community, Code Enforcement, Support for the Arts in the Community, Recreational Programs and Classes, Farm Park. All these areas were considered secondary opportunities in 2017. Secondary Strengths: These City Functions correspond to those areas where the City is meeting or exceeding public satisfaction, but are not a high priority for survey respondents. The City may be placing too high of a priority or too many resources on these functions, and could redirect attention to the services and programs that fall under primary opportunities. These functions are: Library Services. This service was also considered secondary strengths in the 2017 survey.

FINANCIAL POLICIES
39
By resolution of the Board of Mayor and Aldermen on June 28, 2004 the following policies were adopted, and on April 27, 2015 were amended to provide guidance to Administration in budgeting, long-range planning and financial management of the City’s operations designation for the General Fund fund balance.
I. Operating Budget
The operating budget will be based on the principle of financing current expenditures with current revenues or accumulated reserves. Operating expenditures will not be directly supported by debt or federal and state transfer proceeds. Expenditures shall include adequate funding for retirement systems and adequate maintenance and replacement of capital and operating assets. Budgeted expenditures shall reflect the City’s perceived needs and desires of the community based on current surveys and long-range planning. The budget will also be based on generally accepted accounting principles as promulgated by the Governmental Accounting Standards Board. The budget basis will conform to the accounting policies contained in the Comprehensive Annual Financial Report, Note 1 – Summary of Significant Accounting Policies. The form of the budget will include five-year projections of revenues and expenditures based on a program orientation, which includes measurement of performance, full cost absorption, adequate provisions for debt service and depreciation where applicable. The budget presentation will include analyses of cash flow, capital position and debt capacity. Semiannually, there will be a comprehensive review of the operations to date in comparison to the existing budget. Projections of remaining revenues and expenditures for the year will be made and reviewed by the City Administrator, Mayor, and the Financial Advisory Commission and appropriate adjustments will be recommended to the Board of Mayor and Aldermen.
II. Revenues
The operating budget will be developed with the objective of funding all well justified program goals, while avoiding major per capita tax increases. The City will strive to diversify the revenue base, reducing its dependency on property taxes and intergovernmental transfers. The City will maximize the availability of revenue proceeds through aggressive collection and investment policies and proper timing of cash disbursements. User fees will be developed and continually reviewed to ensure that they recover the cost of services that are not universal to all taxpayers. In Proprietary Funds, user fees will provide full coverage of direct and indirect costs including depreciation. In the Recreation Fund and the Pickering Center Fund, user fees will be maintained at a level to cover operating costs.
III. Fund Balance
General Fund: The operating budget will provide funding of commitments necessary to the continued financial health of the City. In compliance with generally accepted accounting principles, the following five areas are defined as Commitments of the General Fund fund balance in the City’s financial statements.
Emergencies and Catastrophes – provide funds to meet major, unforeseen, infrequent, catastrophic or emergency requirements, and are to be maintained at a level of $900,000. This amount also provides funding of a risk management program, whereby the City obtains insurance contracts for catastrophic losses, but maintains relatively high deductible or retention limits on operating equipment and maintains no insurance contracts on certain exposures. Contingencies – provides funds annually from which appropriations may be made to meet minor, additional needs not specifically provided for in the current operating budget. An amount of $50,000 is budgeted in the General Fund Contingency Account. The Financial Advisory Commission and the Board of Mayor and Aldermen will review this fixed level of funding annually.

FINANCIAL POLICIES
40
Infrastructure Replacement – commits the following year’s funding for the replacement, reconstruction or refurbishment of City assets consisting of, but not limited to, city buildings, parks, streets, curbs, and sidewalks and operating equipment on a pay-as-you-go basis. Tax Anticipation – supplements operating cash flows to avoid liquidity problems, which might necessitate the issuance of Tax Anticipation Notes. The funding commitment is to be maintained at a level of one-third of property tax revenues for the following year. Debt Service – establishes a funding commitment to meet total debt service requirements for the following year. Utility Fund: The operating budget will provide funding of certain reserves considered necessary to the continued financial health of the Utility Fund. These two reserves are reflected in the City’s annual budget as unrestricted net assets of the Utility Fund.
Operations – the unallocated cash balance in the Utility Fund will be maintained at a 90 day reserve level, not including debt service. This level was established to ensure reserves equal to three months of operating expenditures to meet cash flow requirements. Debt Service – the unallocated cash balance in the Utility Fund will maintain debt service coverage of two years of annual debt service.
IV. Capital Improvements Program
The Capital Improvements Program (CIP) will reflect a consensus of the perceived needs and desires of the community based on current surveys and long-range planning. The CIP will be cognizant of the financial impact on the applicable fiscal year and the City’s past, present and future goals. The CIP will generally address those capital projects used for the acquisition or construction of major capital facilities.
The City will update and adopt annually a six-year CIP, including the annual Capital Improvements Budget (CIB) and a five year projection of capital needs and expenditures which details the estimated cost, description and anticipated funding sources for capital projects. Projections may be made for future projects exceeding the six-year CIP timeframe. The plan will include costs that have been estimated including consideration for inflation. The inflation rate will be determined annually in the budget process and will be disclosed in the capital budget report.
The first year of the six-year CIP will be the basis of formal fiscal year appropriations during the annual budget process. As part of the annual budget process, the CIP will be evaluated and adjusted with changes in priorities. The Mayor and City Administrator will review the CIP quarterly and if new project needs arise during the year, a budget adjustment identifying both the funding sources and project appropriations must be presented to the Board of Mayor and Aldermen (BMA) for approval. The approval must occur before active progress is made on the planning, design, or construction of the project. Projects may be granted exceptions as to promptly resolve any dangers to the community.
Projects involving development contracts brought before the Board of Mayor and Aldermen for approval during the operating year will identify proposed sources of funding and impacts to CIP funding, in particular, the General Fund Operating Reserves.
Each capital project will have a “sunset provision” enforced at the end of the fiscal year, which can only be lifted by resolution adopted by the Board of Mayor and Aldermen. Projects will be monitored to ensure compliance with CIP Policy and Procedures. Projects will be entered into a timeline to produce a CIP schedule. Post-project evaluation reports will be used to determine the successfulness of a project. A contingency amount of $250,000 will be budgeted annually to meet minor, additional needs not specifically provided for in the current capital budget. The contingency amount is budgeted in the CIP Contingency Account. The Financial Advisory Commission and the Board of Mayor and Aldermen will review this fixed level of funding annually.
FINANCIAL POLICIES
41
Evaluation Criteria
In order for a project to be considered in the CIP, an application shall be submitted for evaluation. A CIP Committee will be developed to assist in the review of project applications. The CIP Committee will use the following criteria to evaluate each capital project:
1. Promote safety and/or security
2. Response to federal or state mandates
3. Federal or state funding or assistance availability
4. Impact future operating costs
5. Enhance economic development or add to the tax base
6. Deferring project will have possible significant implications to the community
7. Maintain a current level of service
8. Improve the quality of existing services
9. Support or is a continuation of another CIP project
10. Replacement or maintenance of a capital asset
11. Create a disruption or inconvenience to citizens
12. Benefit a large amount of stakeholders
13. Rate this risk or uncertainty involved with this project.
14. Protect or contribute to the history of the City
15. Project timeline
Financing
The two basic approaches to funding capital projects are pay-as-you-go and pay-as-you-use. Pay-as-you-go means paying for the capital project out of current revenues at the time of expenditure. Pay-as-you-use means borrowing to finance the expenditure with debt service payments generated from revenues raised through the useful life of the project. The CIP will use a combination of these two financing methods. Capital projects are funded through bonds, reserves, grants, developer contributions and other governmental sources. The average maturity of general obligation bonds will be at or below 30 years. Pay-as-you-go financing for capital projects must account for at least 25% of capital plan funding. The City will maintain its physical assets at a level adequate to protect the City’s capital investment and to minimize future maintenance and replacement costs. The budget will provide for the adequate maintenance and the orderly replacement of capital plant and equipment from current revenues where possible. Future maintenance or replacement costs will be factored into future years CIP as a result of the entry of a new project. The Capital Improvements Program (CIP) will reflect a consensus of the perceived needs and desires of the community based on current surveys and long-range planning. The City will develop and maintain a CIP to control capital projects over a six-year planning period coordinated with the operating budget. The CIP will be designed to protect the City’s investments in capital and operating assets through timely and adequate maintenance and replacement of those assets. The Mayor and City Administrator will review the CIP quarterly and recommendations for amendments will be made to the Board of Mayor and Aldermen. Projects involving development contracts brought before the Board of Mayor and Aldermen for approval during the operating year will identify possible sources of funding and impacts to CIP funding, in particular, General Fund Operating Reserves. The CIP will monitor projects in progress to ensure timely completion or the substitution of alternative projects.
V. Debt Management and Investment Polices
Debt will be used to finance long-lived capital and operating assets for the City as well as the School District within the constraints of maintaining or improving bond ratings and debt service quality and payments.
FINANCIAL POLICIES
42
Debt management will provide for the protection of bond ratings, the maintenance of adequate debt service reserves, compliance with debt instrument provisions and appropriate disclosure to investors, underwriters and rating agencies. Investments of the City will be made and collateralized in accordance with Tennessee Code Annotated. Investment management will strive to maximize investment return on the City’s funds through pooling of funds where permitted, frequent market analysis; cash forecasting procedures and competitive bidding. A separate detailed investment policy “Policy Letter No. 27” was revised and approved by the Board of Mayor and Aldermen on October 22, 2007. The policy letter addresses in greater detail the administrative involvement into City investments. The policy defines the guidelines for the selection of financial institutions and investment instruments as authorized under Tennessee Code.
Types and Use of Debt
Uses of Debt
Capital Improvement Plan (CIP). To ensure sustainability, City staff identifies new construction projects, infrastructure replacement or major asset acquisitions through its multi-year Capital Improvements Program (CIP). This process of long-term planning is performed in conjunction with the annual budget process and reflects the Board’s visions and goals for capital improvements to the City. Early identification of future capital needs allows the City more time to assess various financial alternatives and to plan the use of debt financing more effectively.
The City will assess all financial alternatives for funding capital improvements, but initially, pay-as-you-go financing will be considered before issuing any debt. Pay-as-you-go financing may include: current revenues and unreserved fund balances; grants from federal, state and other sources; private sector or developer contributions; public/private partnerships; leasing payments. Once the City has determined the available "pay-as-you-go" funding, the City may consider debt to finance the balance of approved capital projects.
When debt financing is considered, the City’s policy is to issue debt for the acquisition or construction of major capital assets or infrastructure with a useful life of not less than ten (10) years. With the exception of unanticipated capital expenditures, the acquisitions or projects financed with debt will be well identified and analyzed in the CIP. Projects eligible for funding with debt include, but are not limited to, libraries, public streets and bridges, administrative facilities and equipment, public safety facilities and equipment, parks and recreational facilities, storm water drainage and treatment facilities and drinking water treatment and distribution facilities, school facilities and school equipment.
Refunding. Under certain circumstances, the City’s financial interests will best be served by the prepayment or refinancing of existing debt. Because many factors could influence this decision, the City’s staff and advisors will periodically (at least annually) review all outstanding debt to determine refunding or prepayment opportunities. In general, refundings (or debt prepayments) will be considered if and when there is a net economic benefit from the transaction. Subject to a review of the transaction by the Tennessee Comptroller’s office (Division of Local Finance), targeted savings (net of all transaction costs) for advance refundings will be a net present value savings of at least four percent (4%) of the refunded debt. Notwithstanding the targeted savings, other factors will be considered on a case-by-case basis to determine if a refund, prepayment or other modification of existing debt is warranted or will be beneficial to the City.
Municipal School District Short-Term Cash Flow. Revenue Anticipation Notes (RANs) shall be issued only to meet cash flow needs of the Germantown Municipal School District (GMSD) consistent with cash flow projections by the Chief Financial Officer (the “CFO”). The CFO shall determine such cash flow projections based on the budgeted operating revenues and expenditures. The issuance of RANs will be presented to the Board of Mayor and Alderman and will retire no later than June 30 of each year. Types of Debt When the City’s determines that the use of debt is appropriate for funding, the form of the debt will be evaluated according to the criteria for various types of debt. The typical types of debt financing are listed in order as most commonly used by the City and are described herein:
General Obligation Bonds. The City may issue general obligation bonds to finance approved capital projects that otherwise lack a dedicated revenue stream from operations. This long-term debt has the “full faith, credit and taxing power” of the City pledged to the repayment of the bonds and typically has the lowest interest cost for long-
FINANCIAL POLICIES
43
term capital. Generally, this debt will be issued for capital projects with a useful life of at least ten (10) years and a combined cost (for the funded projects) of at least three million dollars ($3,000,000). [Note: It is intended that any issuances of debt refunding bonds be combined with general obligation bonds (or revenue bonds, described below) in order to meet the targeted $3 million minimum issuance and to maximize the value of the issuance costs.]
Revenue Bonds. The City may issue revenue bonds to finance approved capital projects (equipment and facilities) that have a useful life of at least ten (10) years and have a dedicated revenue stream as part of a separate enterprise fund (e.g., Utility Fund). It is fully intended that the debt will be repaid by the revenue generated by the enterprise fund. However, the revenue bonds may be issued with the City’s “full faith” backing as approved by the Board of Mayor and Aldermen based on economic and financial considerations.
Special Assessment and Incremental Tax Revenue Bond. Specific to projects under the City’s Public Private Partnership Policy or other economic development initiative, the City may issue special assessment or incremental tax revenue bonds as part of the financing of the overall development project. Generally, these projects will be of significant size and scope encompassing major capital developments so that issued debt will be at least five million dollars ($5,000,000) with the useful lives of assets not less than twenty (20) years. It is intended and expected that any special assessment or incremental tax revenue bonds will be issued by a separate legal entity such as the Industrial Development Board (IDB) of the City of Germantown, Tennessee (a public benefit corporation chartered under Tennessee law) but will not be issued with the City’s “full faith” backing. Any bonds issued by the IDB will be subject to approval by the Board of Mayor and Aldermen, therefore it is intended that the IDB will be subject to the general guidelines and procedures included in this Debt Policy.
Capital Outlay Notes. Under the provisions of T.C.A. Section 9-21-101 et seq., the City may issue capital outlay notes, a simpler and usually less expensive form of general obligation debt that is often structured as a loan from local banks. Subject to approval by an agency of the Tennessee Comptroller’s Office, this debt funding may be provided for approved capital equipment and projects with a useful life between three (3) and twelve (12) years and a total project cost of not more than three million dollars ($3,000,000).
Revenue Anticipation Notes. RANs will be issued under the provisions of Title IX, Chapter 21, Parts I, IV, and VIII of Tennessee Code Annotated. The amount of such RANs will not exceed the estimated annual expenses times 5% plus highest estimated monthly deficit for the Fiscal Year upon the approval of the State Director of Local Finance. The issuance of RANs will be presented to the Board of Mayor and Alderman and will retire no later than June 30 of each year.
Other Financing Types. If it is determined in the best interest of the City after consulting with financial advisors, appropriate commissions or other stakeholders, and subject to required approvals by the City’s Board, the City may issue other forms of debt (including capital lease or installment financing). This section is not intended to circumvent the issuance process for other types of debt funding but merely recognizes that a simpler type of debt may be more cost effective under certain circumstances. Debt obligations of this type will not exceed two million dollars ($2,000,000) during a fiscal year with a maximum term not to exceed six (6) years.
VII. Debt Limits and Affordability Consistent with the stated objectives of this Debt Policy (SECTION IV), financial and economic indicators have been devised to reasonably measure the City’s debt capacity and establish maximum debt limits or limits of affordability. While recognizing the City’s need to access debt capital under a wide variety of obligations or changing circumstances, it is fully intended that the indicators of affordability provide measures that reflect the constantly changing dynamics of the population, the tax base and the economic environment. Likewise, it is intended that these measures are viewed and projected in conjunction with the City’s Capital Improvement Program in order to identify potential limitations or an unfavorable impact on future operations. The City’s established debt limits and affordability does not apply for debt issued on behalf of the Municipal School District Short-Term Cash Flow needs.
The following benchmarks (financial or economic indicators) are devised to establish not only limits on the total debt but also the City’s ability to repay outstanding debt over future periods. These limits of affordability include:
1. Net Debt Service to Governmental Fund Expenditures – a measure of the debt service as a percent of the City’s total operating expense.

FINANCIAL POLICIES
44
A percent not to exceed: 12%
Net Debt Service will include all debt service costs (principal and interest) related to general obligation or other secured debt (but not including business enterprise debt with proven revenues) paid from the City’s general fund.
2. Direct Debt to Appraised Property Value – a measure of the debt liability to the City’s total appraised values for property taxes.
A percent not to exceed: 1.50% Direct Debt will include all general obligation debt and any business enterprise debt secured by the City’s taxing authority.
3. Direct Debt Per Capita – a measure of debt liability to the City’s population.
An amount not to exceed: $2,000 Direct Debt will include all general obligation debt and any business enterprise debt secured by the City’s taxing authority.
4. Per Capita Debt to Per Capita Income – a measure of the debt liability for the City’s population as a percent to their annual income.
A percent not to exceed: 4% Per capita income from published sources and Direct Debt Per Capita calculated above. Notwithstanding the measures established herein, this policy ultimately seeks to maintain the highest credit quality (triple-A) established by the national rating agencies due to easier access to capital and the lower overall cost for debt. Recognizing that these same measures are utilized by the rating agencies, the City’s policy will be adapted to ensure that its debt limits and measures of affordability do not exceed the levels necessary to maintain the highest quality rating for its debt.
This policy requires that these measures and limits of affordability be fully analyzed when evaluating the issuance of new or refunding debt in order to determine the financial impact of the additional debt on future periods. The analysis described herein will be made part of the information or presentations provided to the Financial Advisory Commission (FAC) and the Board of Mayor and Aldermen as outlined in SECTION V.
Periodic monitoring and reporting of these debt measures will also be performed as part of the City’s annual budget preparation. During the annual budget process, the fiscal year budget information presented for review to the Financial Advisory Commission and the Board of Mayor and Aldermen will include the current and projected analysis of these debt measures.
VIII. Debt Issuance Process Once the City determine that debt will be utilized to fund an approved capital project or acquisition, the Finance Director will assemble the staff resources and service professionals needed to prepare, analyze, document and close the debt transaction. The type, complexity, and size of the debt to be issued will determine the staff requirements and service professionals required. The various considerations that must be addressed at the onset to ensure the proper planning and execution of the debt issuance process are discussed herein. Timing of the Transaction The City will determine the optimal timing for issuing or placing the debt based on the requirements identified in the CIP, the funding forecast developed in the budgeting process, and the actual cash flow projected for the construction or acquisition of the capital asset. Once the targeted debt issue date is determined, the Finance Director will determine the necessary lead times to identify the type of debt to be issued, engage the appropriate professionals, analyze payment structure and estimated rates, and then schedule the various commission, public and Board presentations. Timing of the debt issuance will ultimately be determined by mandated public notice and necessary Board approvals.

FINANCIAL POLICIES
45
Sale Method or Placement Competitive Sale The City believes that the competitive sale process is the best tool for obtaining the lowest interest rates and terms for the issued debt. Therefore the City will always use the competitive sale process to sell its general obligation or revenue bonds (including capital outlay notes), except in situations where (1) existing disruptions in the national capital markets make it unlikely the City will receive at least three (3) reasonable bids for its bonds, or (2) the general obligation debt is in the form of a loan agreement through a federal or state sponsored loan program. Negotiated Sale Notwithstanding the strong preference for issuing debt using the competitive process, the City recognizes that some debt is best sold through negotiation. In such instances, the City shall assess the following circumstances or conditions when considering a negotiated sale: (1) express statutory authority; (2) a structure which may require a strong pre-marketing effort such as a complex transaction or new credit; (3) size of the issue; (4) market volatility; and (5) variable rate pricing. To ensure full transparency of any debt issuance, the use of the negotiated sale process will not reduce the analysis of the transaction by staff and professionals nor limit the public information and participation during the debt approval process. Private Placement For certain capital transactions, the City may elect to privately place the debt issued as part of the transaction (e.g. installment transactions or capital leases). Such placement will be acceptable if the method clearly demonstrates that such transaction will be in the best interest of the City due to cost savings or other favorable transaction terms. Use of Professionals As part of the debt issuance process, the City will engage the services of knowledgeable professionals to analyze and advise City staff about optimizing the outcome of the transaction and clearing all the legal hurdles. Due to the infrequency of issuing new debt, the City will maintain its expertise in the credit markets by retaining professionals who stay well-informed about industry trends and about the City’s visions and finances. SECTION X of this policy will more fully describe the details of the relationship with the professionals named herein. City Attorney The City Attorney will review, advise, and prepare debt-related documents on behalf of the City for simple borrowings that do not involve the public debt market. In the case of debt structures that directly access the public debt market, the City Attorney will provide support to staff and bond counsel about the City’s legal status and authority for issuing the debt. In addition, the City Attorney will provide an opinion that the debt was issued within the applicable debt limitations set by State law or the City’s charter, that the City has taken all steps necessary to authorize the sale and issuance of debt, and that the debt is a valid and binding obligation of the City (if applicable). Bond Counsel For all sales of debt in the public debt market, the City will engage a specialized bond counsel with specific experience in the issuance of municipal debt. The bond counsel will prepare all legal documents related to the issuance of the public debt including the legal documents necessary for the City to authorize the issuance of debt. In addition, the bond counsel must be fully competent to provide an unqualified opinion as to the tax-exempt or tax credit status of applicable debt issued and to prepare, review, or comment on all disclosure documents and regulatory forms or applications associated with the transaction. Financial Advisor For all debt transactions in excess of $1 million or for all sales of debt in the public debt market, the City will select a financial advisory firm to assist in the issuance and administration of the City’s debt. The firm selected to serve as financial advisor will provide objective advice and analysis, maintain the confidentiality (to the extent permitted by law) of the City’s financial plans and be free from any conflict of interest as defined in this Debt Policy and Tennessee statutes. Further, the City’s financial advisor will not underwrite or participate in any syndicates in the sale of the debt.

FINANCIAL POLICIES
46
Underwriters In a competitive sale of debt, the City and its financial/legal advisors will set the business and legal terms for the financing and then take public bids from qualified underwriters in a generally accepted auction setting. The firm (or syndicate) that submits the lowest true-interest-cost bid will be awarded the bonds and serve as underwriter (or senior manager of the syndicate). In the case of a negotiated sale of debt, the City will first select a firm to market its debt from a pool of qualified underwriters. The City’s appointment will be based upon a competitive evaluation of objective criteria, which may include the firm’s performance in the City’s past competitive sales of debt. The City’s selection of the underwriter will be subject to review and recommendation by the FAC and approval by the Board. Registration/Escrow Agent In the case of debt issued in the public debt market, the City will designate a bond registrar and paying agent (known at the “Registration Agent”) to maintain books and records necessary for the registration, record-keeping and transfer of bonds on behalf of the City. In addition, the Registration Agent will act as pay agent for the City and will be authorized to make all payments of principal, interest, and redemption premium, if any, with respect to the issued bonds. In the case of debt that is issued for the purpose of refunding currently outstanding bonds at the time of debt issue or in the near future, the City will designate an agent (known as the “Escrow Agent”) to hold funds in escrow for the express purpose of performing the refunding. The City and Escrow Agent will enter into an agreement (the “Escrow Agreement”) that authorizes the Escrow Agent to perform duties on behalf of the City with respect to the acquisition and payment for the refund bonds. Board Approval All debt financing that constitutes an obligation beyond one fiscal year will be presented for review by the Financial Advisory Commission (FAC) as described in SECTION V. At the completion of the FAC’s review of the proposed debt issuance, and with the FAC recommendation, the debt transaction will be presented to the Board for approval of the resolutions required to authorize the debt issuance. In the absence of a quorum of the FAC, the Finance Director may present the transaction directly to the Board for consideration. Compliance Reporting It is the City’s intent to provide a high level of transparency in all of its financial dealings, including debt management. Consistent with past practice, the City will issue on a timely basis and make widely available all financial reports including the annual budget, the Comprehensive Annual Financial Report (CAFR), the Popular Annual Financial Report (PAFR), and the Capital Improvements Program Report (CIP). In addition, as part of the issuance of debt in the public markets, the City covenants and agrees that it will comply with and carry out all of the provisions of the continuing disclosure certificate, which includes providing annual reports to national repositories and issuing material event notices in accordance with SEC Rule 15c2-12. IX. Terms of the Debt Issue During the course of issuing debt, the City will endeavor to structure the terms and conditions of each debt transaction to achieve a low cost of capital and to preserve the City’s overall financial flexibility. Maintaining financial flexibility enables the City to readily access and restructure its financing at a low cost. (Likewise, the City can avoid financial distress in the face of negative shocks or readily fund capital investments when opportunities arise.) Adherence to the policies in this section is not intended to override the requirement that the City stay within the overall limits of the entire debt portfolio addressed in Section VII (Debt Limits and Affordability). However, the policies herein will address the individual components of all financing that have the most immediate impact on the City’s credit rating and debt service payments. Maximum Maturity All capital improvements financed through the issuance of debt will be financed for a period not to exceed the useful life of the improvements, but in no event will the term of the debt financing exceed thirty (30) years. As part of this process to determine the maximum maturity of a debt issue, the City must consider the need to allocate the capital burden to upcoming generations (i.e. future fiscal periods) as opposed to funding from currently available sources. The City will measure the future financial impact of the financing’s debt service

FINANCIAL POLICIES
47
(principal and interest) by projecting the estimated percentage of the future budgets dedicated to total debt service. Analysis of the future debt capacity will be performed in order to assess the City’s commitment to a pay-as-you-go budget allocation for capital projects. Maturity Schedule Debt issuance will be planned to achieve relatively level debt service for each individual debt issue, while still matching debt service to the useful life of projects financed. The terms and life of each debt issue, including the detail of expected principal and interest payments, will be prominently disclosed when terms of the issued debt are published or otherwise made available to the public (through websites, e-mails, or other electronic means). The City will avoid the use of bullet or balloon maturities except in those rare instances where these maturities serve to make existing overall debt service level or match a specific income stream. Any deferral of principal payment or backloading must be explicitly disclosed and justified, including disclosure of the justification or recommendation made by the Financial Advisor for the principal deferral. Interest Rates To maintain a predictable level of debt service and to avoid future uncertainty, the City will issue debt that carries a fixed interest rate. Under certain limited conditions, the City may consider variable rate debt subject to additional analysis and recommendations by the Financial Advisor that the tradeoff between costs and risks is not unreasonable. Further, the City will employ cost effective measures (rate swaps, credit enhancements, etc.) to minimize risks associated with variable rate debt. If utilized, the total amount of variable rate debt issued will not exceed twenty-five percent (25%) of the City’s total outstanding debt at the time of issue. Bond Coupon Rate For most bond issuances, the City’s will set parameters so that bonds subject to redemption can be priced between 95% and 125% of par. In certain market conditions, bonds issued with a deep discount may provide the City with a lower cost of borrowing. Subject to additional analysis and recommendations by the Financial Advisor, the City will assess the value and effect on any refinancing opportunities as a result of accepting lower-than-market coupons. Call Features In many cases, it is the City’s policy to include a call feature with a date set appropriate to current market conditions. Subject to additional analysis and recommendations by the Financial Advisor, the City will assess the value of including a call option relative to the lower interest rate associated with non-callable bonds. Credit Enhancement Facilities Historically, the City has avoided the use of credit enhancement (insurance or letters of credit) because of its strong financial position and excellent standing with the national rating agencies. However, the City will consider the use of credit enhancements on a case-by-case basis, evaluating the economic benefit versus cost for each case. Only when clearly demonstrable savings can be shown shall an enhancement be considered. Issuance Cost As part of the Capital Improvements Program (CIP), the City regularly evaluates future capital project needs and the methods for financing them, including the use of debt financing. The City’s policy is to reasonably coordinate new bond issues to that multiple projects can be accommodated in a single borrowing to reduce issuance costs per dollar of debt issued. Total issuance costs will be evaluated and disclosed during all phases of the debt issue process.
X. Professional Services The City will engage and utilize professional services as necessary to supplement the skills and expertise in the Finance Department or to meet regulatory requirements related to the issuance of debt. The selection or hiring of professionals will not be based on competitive bids but will be determined on the basis of recognized competence and integrity in their field of expertise. The Finance Director will determine the criteria for selecting professionals to be utilized in the debt issuance process. The selection criteria will include, but not be limited to, recognized professional expertise, depth of

FINANCIAL POLICIES
48
transaction experience, and the opportunity to bring current best industry practices to the City. Using the defined selection criteria, the City Administrator and Finance Director will interview eligible persons or groups and make specific recommendations to the Board of Mayor and Aldermen for qualified professionals. All professionals engaged in the City’s process of issuing debt will affirm, acknowledge or disclose the following statements or information in an engagement letter, professional services agreement, or a separate writing provided as a matter of record to the City:
- The professional will clearly disclose all compensation and consideration received (or to be received) as related to services provided in the debt issuance process by the City and the lender or conduit issuer, if any. This includes “soft” costs or compensation in lieu of direct payments.
- The professional will acknowledge receipt of this Debt Management Policy and will adhere to the standards and
guidelines contained herein.
- The professional will acknowledge receipt of and familiarity with the details of the “Code of Ethical Conduct for Officials of the City of Germantown” and the “Code of Ethical Conduct for City Employees of the City of Germantown.”
- The professional will affirm that they have disclosed any existing client and business relationships as described in SECTION XI of this Policy (Conflicts of Interest).
Any exceptions, either by the professional or the City, to this Policy or other policies and procedures indicated above, must be clearly disclosed in the engagement letter, professional services agreement, or a separate writing. The City Administrator will determine if the exception requires removal of the professional from the debt transaction or if the exception requires any further disclosure. Specific to certain professionals are the following requirements: Legal Counsel. An engagement letter (or professional services agreement) will be required from each lawyer or law firm that represents or provides services to the City in a debt transaction. (This requirement does not apply to the City Attorney or to counsel not directly representing the City, such as underwriters’ counsel.) Financial Advisor. A professional services agreement or other form of written agreement (engagement letter) will be provided by each person or firm serving as financial advisor in a debt management role or in a debt transaction. In the sale of the City’s debt instruments, whether in a competitive or negotiated transaction, the financial advisor will not be permitted to bid on, privately place or underwrite an issue for which they have been providing advisory services. Underwriter. If the City engages an underwriter in a sale transaction, the underwriter will be required to clearly identify itself in writing (in its proposal, in its bid, or in its submitted promotional materials) as an underwriter and not as a financial advisor. This disclosure will occur at the earliest stages of the relationship with the debt issue. The underwriter will clarify that its primary role as a purchaser of securities in an arm’s-length commercial transaction has financial and other interests that differ from those of the City. Additionally, if the debt is offered in a publicly offered, negotiated sale, the underwriter will be required to provide pricing information (both as to interest rates and takedown per maturity) to the Financial Services Director in advance of the pricing of the debt.
XI. Conflicts of Interest The City of Germantown operates as a public trust, which is subject to scrutiny by and is accountable to its residents and members of the public. Consequently, a fiduciary duty exists between the City’s officers/employees and the public which carries with it a broad and unbending duty of loyalty and fidelity. Those officers and employees are responsible for administering the affairs of the City honestly and prudently. They will exercise the
FINANCIAL POLICIES
49
utmost good faith in all transactions involved in their duties, and they will not use their positions with the City or knowledge gained there from for their personal benefit. Separate from this Policy, the City’s officers (who include elected officials and members appointed to commission or boards) and all City employees are subject to strict Codes of Ethical Conduct. These Codes include very detailed standards that prohibit the officer or employee from knowingly engaging in activities that would lead to a conflict of interest with the City. By reference, the City’s existing Codes of Ethical Conduct as applicable to officer or employee conflicts of interest in debt transactions are applicable to the administration of this Policy. Likewise, all professionals (as defined in SECTION X) involved in a debt transaction who have been hired or compensated by the City are required to disclose to the City any existing client and business relationships between and among the professionals to a transaction (including but not limited to financial advisor, swap advisor, bond counsel, swap counsel, trustee, paying agent, underwriter, counterparty, and remarketing agent), as well as conduit issuers, sponsoring organizations and program administrators. This written disclosure will include information reasonably sufficient to allow the City to appreciate the significance of the relationships. [NOTE: Professionals who become involved in the debt transaction as a result of a bid submitted in a widely and publicly advertised competitive sale conducted using an industry standard, electronic bidding platform is not subject to this disclosure. No disclosure is required that would violate any rule or regulation of professional conduct. However, subject to regulatory agency rules or industry guidelines, these same professionals are required to exercise due care and proper conduct in the debt transaction process.] Therefore, all parties to the debt transaction must be free from conflicts of interest that could adversely influence their judgment, objectivity or fiduciary duty on behalf of the City. Likewise, all parties must be aware that even the appearance of a conflict of interest can weaken or damage the public trust. XII. Debt Management Policy Review and Approval This Debt Management Policy will be administered and maintained by the City’s Finance Department and will address or incorporate any requirements specified by the Tennessee State Funding Board or other regulatory board (such as MSRB) having appropriate authority over the issuance of the City’s debt. This policy will be formally approved and adopted by the Board of Mayor and Aldermen. Any changes or amendments to the Policy must be recommended by the City Administrator and are subject to approval by the Board of Mayor and Aldermen. This policy will be subject to periodic reviews by the Finance Director well in advance of any anticipated debt issuance. To ensure reasonable public disclosure and to invite participation by City residents, the policy reviews will be addressed with the City’s Financial Advisory Commission (FAC). Comments and recommendations will be solicited from the FAC for consideration by City staff.
Basis of Budgeting
The City does not distinguish between Basis of Budgeting and Basis of Accounting, as reflected in the City’s Comprehensive Annual Financial Report (CAFR). The principles set forth as the Basis of Accounting are strictly observed in the budgetary process. The City budget is prepared on a modified accrual basis of accounting except for encumbrances. Unencumbered appropriations lapse at the end of each fiscal year, with encumbered appropriations being carried forward to the next year. The budgetary process for the City of Germantown begins in January with the Board of Mayor and Aldermen’s annual retreat where its policy agenda is set for the upcoming fiscal year. Early in January, a budget manual is distributed to all departments and divisions, which outlines the budget calendar, submission dates, performance measurement requirements and parameters for budget requests. Six months of actual data for the current fiscal year is given as a basis for departments to submit their estimates for the current fiscal year end. Departments are required to complete their budgetary requests for the new fiscal year and include justifications for any infrastructure, capital and program change requests. The Office of Budget and Performance staff works with departments in reviewing personnel needs. The city administration reviews all requests on the timeframe as identified in the annual budget calendar. All funds, capital programs, infrastructure replacement programs and staffing are
FINANCIAL POLICIES
50
presented to the City’s Financial Advisory Commission (FAC). The FAC is composed of citizens who volunteer to serve on the Commission on an annual basis and whose background is within the financial services discipline. The final component of the budgetary process is highlighted in a work session with the Board of Mayor and Aldermen. The Proposed Budget is then presented to the Board of Mayor and Aldermen for adoption through three readings, including a public hearing. Prior to the public hearing, a Budget In Brief brochure is mailed to all citizens. The brochure highlights the major capital and operating projects in the proposed Budget along with a letter from the Mayor. Budgetary Control Formal budgetary accounting is used as a management control for all funds of the City. Budgetary controls are exercised both at the departmental level, with the adoption of the budget, and at the line item level through accounting controls. Additionally, budgetary control is maintained at the program level by the individual departments, acting in conjunction with the Department of Finance and the Office of Budget & Performance to execute budgetary controls. Under provisions of the City's charter, the Board of Mayor and Aldermen annually enact by ordinance the operating budgets of the general, special revenue, capital projects, enterprise and internal service funds, which cannot exceed appropriation except by approval of the governing body. An annual budget for the capital projects is adopted by individual funds. The total budgets of these funds constitute legal spending limits, requiring ordinance amendment. Transfers within the funds are accomplished by resolution of the Board of Mayor and Aldermen to authorize expenditures of various grants received and to adjust the individual fund budgets as required within the total dollar limitations of the budget ordinance. The City Administrator may approve transfers between categories within a cost center without the governing body's approval. The Board must approve other transfers or requests for additional funds. Thus, departmental or cost center appropriations comprise a legal spending limit for governmental fund types, except for capital projects funds for which the project length financial plans are adopted. The City disperses its capital projects fund monies to various projects, which may cause a deficit within the project. However, the City adopts a positive Capital Improvements Program where funds can be transferred within the fund with appropriate approval from the governing body. Supplemental appropriations were required during the year and the accompanying budgetary data has been revised for amendments authorized by resolution during the year. The basis of accounting applied to budgetary data presented is consistent with the appropriate basis of accounting for each fund type.
The Capital Projects Funds account for the receipt and disbursement of all resources used in the acquisition and construction of capital facilities where the construction period is expected to exceed one year, other than those financed entirely by Proprietary Fund Types. The primary funding sources are debt proceeds and General Fund transfers. The facilities constructed and assets acquired become a part of the City's fixed assets and are, therefore, recorded in the General Fixed Assets Account Group. The residual equity in Capital Projects Funds, if any, is returned to the General Fund upon completion of the project. The following funds are included in this grouping. The Major Roads Fund includes projects that create, widen or improve roads or intersections. In addition, this fund provides safe and reasonable access to the commercial developments while maintaining a reasonable level of service for traffic using the roadways. The Intersections & Other Fund includes additional intersections and signals for the city or the improvement of the existing ones. The major purpose of this fund is to provide safe and orderly movement of traffic. The Fire Fund contains major objective is to provide adequate fire protection to the city and to maintain the Class 1 insurance rating. The major projects in this fund include the construction of new fire stations, the remodeling or expansion of existing fire stations and major equipment purchases. The Parks Improvements Fund is needed to meet the intensified demand for additional parkland. In addition, growth and development of new parkland is needed to keep pace with the Master Plan for parks and recreation. The Drainage Projects Fund includes projects that will provide adequate water supply for existing and future population requirements. In addition, this fund consists of sewer projects, such as the provision of sanitary sewers, which are needed when properties are annexed into the City. The General Government Projects Fund includes miscellaneous projects needed to meet individual departmental demands. The major projects in this fund include the remodeling or expansion of City owned buildings as well as community use buildings and property.
51
PROPOSED FY20 BUDGET CALENDAR
December 12/05/18 Capital Improvements Program (CIP) applications due to CIP Coordinator 12/21/18 FY20 General Fund (Revenues and Expenditures), Program Change Requests
and Infrastructure Replacement Program requests are due to Budget and Performance are due to Budget and Performance
January 1/04/19 Budget Materials distributed to Enterprise, Special Revenue and Internal Service
Funds 1/14/19 FY20 Budget review with General Fund departments 1/22/19 Financial Advisory Commission – First Meeting: Introduction, recommendation
of budget calendar and review of budget issues 1/28/19 Board Meeting - Budget Calendar review and approval by the Board of Mayor
and Aldermen February
2/01/19 FY20 Budget (Revenues and Expenses), Program Change Requests and Infrastructure Replacement Program requests are due to Budget and Performance (Enterprise Funds, Internal Service Funds, Special Revenue Funds)
2/11-15/19 FY20 Budget review with departments (Enterprise Funds, Internal Service Funds, Special Revenue Funds)
2/26/19 Financial Advisory Commission – Second Meeting: Review of FY20 Budget Enterprise Funds (Utility, Germantown Athletic Club, Great Hall, Sanitation and Stormwater)
March 3/26/19 Financial Advisory Commission – Third Meeting: Review of Capital
Improvements Program 3/27/19 Board of Mayor and Aldermen – work session on CIP
April 4/16/19 Financial Advisory Commission – Fourth Meeting: Review of FY20 Special
Revenue 4/23/19 Financial Advisory Commission – Fifth Meeting: Review of FY20 GMSD Fund 4/30/19 Financial Advisory Commission – Sixth Meeting: Review of FY20 General
Fund Revenues and Expenditures May
5/01/19 Proposed FY20 Budget delivered to Board of Mayor and Aldermen Budget in Brief prepared 5/08/19 Board of Mayor and Aldermen work session on FY20 Budget 5/13/19 Board Meeting - First Reading on FY20 Budget Ordinance 2019-1
Distribute Budget in Brief and Neighborhood News 5/20/19 Document printing due to Procurement
June 6/10/19 Board Meeting - Public Hearing on FY20 Budget; Second Reading on FY20
Budget Ordinance 2019-1 6/24/19 Board Meeting - Third and Final Reading on FY20 Budget Ordinance 2019-1

52

EXPLANATION OF BUDGET SUMMARIES FISCAL YEAR 2020
53
This section consists of summaries of the FY20 Budget by major category and by cost center in the six major operating funds: General, Utility, Germantown Athletic Club, Great Hall, Solid Waste and Stormwater. It also contains pie charts of General Revenues and Expenditures, CIP Project Listings, Personnel Staffing Schedule, Special Revenue Funds, Internal Service Funds and Fiduciary Funds. TOTAL EXPENDITURE BUDGET – The schedule, which appears on the next two pages, summarizes revenues and expenditures for all fund types by category or nature of revenue and expenditure for FY20. It is compared to the estimated total for FY19. The significant totals are carried forward to the City Administrator’s transmittal letter in analyzing major changes in operating and capital expenditures. The impact to fund balance is also provided. GENERAL FUND – The summary of the General Fund Budget is on pages 58 and 59. The details of General and Special Revenues are found in the last section of the document. Expenditures are summarized by cost center and grouped by program. General Fund expenditures that include engineering, public services and information technology services are charged to the Utility Fund, which is reimbursed by the expense reimbursement line of the General Fund Budget Summary. Three years of history, including FY19 and five years of projections including FY20, are presented. The bottom line in this schedule is the ending fund balance for each of the fiscal years. A detail of the General Fund’s fund balance is outlined in this section under the heading Discussion of General Fund Reserves. The General Fund Summary reflects the carry forward resources from prior year revenues, which carries forward prior year expenditure obligations. This change accounts for the variance between ending and beginning fund balance figures. PIE CHARTS – Pie charts are presented for General Fund Revenues and Expenditures in order to demonstrate the proportional relationships of the General Fund Budget. Beneath the pie charts are comparative summaries of major categories of revenues and expenditures by program. Similar pie charts are presented for the Utility Fund, the Germantown Athletic Club and the Great Hall Fund. UTILITY FUND – GERMANTOWN ATHLETIC CLUB FUND – GREAT HALL FUND – SOLID WASTE FUND – STORMWATER MANAGEMENT FUND – These Fund Summaries are presented in the same columnar format as the General Fund Summary. The summaries are designed to accomplish a couple of objectives: 1) to provide a Net Operating Income amount and 2) to project Total Net Position. Revenues are detailed in the last section of this document. Operating Expenditures, including depreciation and interest on indebtedness, are subtracted from Total Revenues to arrive at Net Operating Income. Other adjustments to income, including depreciation and capital outlays, are added to or deducted from Net Operating Income to arrive at an estimation of cash flows. Components of fund equity at each of the fiscal year-ends are also described in these summaries. Contributed Capital in the Utility Fund does not include fees paid to the City by developers for infrastructure constructed by the City, but generally represents subdivision and project water and sewer lines installed by developers.
Governmental Proprietary Fiduciary
General Fund General Utility Fund Enterprise Pension Fund Trust Fund
Recreation Fund Special Germantown Athletic Club Fund Enterprise OPEB Fund Cash Balance Fund
Trust Fund Trust Fund
State Street Aid Fund Special Great Hall Fund Enterprise Automated Enforcement Special Solid Waste Fund Enterprise
Drug Asset Forfeiture Special Stormwater Fund Enterprise
Federal Asset Forfeiture Special Health Fund Internal Service Pickering Fund Special Fleet Services Internal Service
Ambulance Fund Special Allocated Expenses Internal Service
GMSD Fund Special
Farm Park Fund Capital Improvements Fund
Special Capital
List of Funds
Library Endowment Special
E-Citation Fund Special

TOTAL EXPENDITURE BUDGET
54
General Fund
Utility
Fund
Germantown
Athletic Club
Great Hall
Fund
Solid Waste
Fund
Stormwater
Fund
REVENUES:
Property Taxes 33,867,149$ - - - - -
Sales Taxes 14,560,000 - - - - -
Federal and State Revenues 5,534,500 - - - 5,000 -
Metered Water Sales - 5,165,000 - - - -
Sewer Service Fees - 3,200,000 - - - -
Membership Fees - - 3,895,000 - - -
Aquatics Revenues - - 134,168 - - -
Business Revenues - - - 521,393 - -
Personal Training - - 325,000 - - -
Solid Waste Fees - - - - 4,955,677
State Gasoline Tax Allocation - - - - - -
Automated Enforcement Revenues - - - - - -
Drug Enforcement Revenues - - - - - -
Federal Asset Forfeiture Revenues - - - - - -
Pickering Complex Revenues - - - - - -
Transport Fee - - - - - -
Non Transport Fee - - - - - -
Education Revenues - - - - - -
Recreation Revenues - - - - -
Farm Revenues - - - - - -
Stormwater Fee - 1,012,300
Other Revenues 4,708,060 387,000 326,835 - 41,500 6,900
Investment Income 219,200 66,500 35,000 4,000 21,000 5,000
Transfers In 411,560 - - 75,000 - -
Funds from Prior Periods 450,000 - - - -
FY20 Total Revenues: 59,750,469 8,818,500 4,716,003 600,393 5,023,177 1,024,200
Expenditures/Expenses by Category:
Personnel 33,899,751 1,640,724 1,803,889 203,037 120,442 566,558
Communications 403,917 95,600 21,200 750 15,500 3,275
Utilities 1,167,086 653,868 379,002 43,685 - 600
Professional 2,871,026 237,000 539,914 29,000 25,000 1,000
Grants 1,757,240 - - - - -
Other Maintenance 2,739,050 155,000 177,000 73,850 - 30,960
Vehicle Maintenance - - - - - -
Street Maintenance - - - - - 265,000
Mains Maintenance - 155,000 - - - -
Supplies 1,825,222 217,700 264,632 20,100 40,000 19,400
Contract Services - 1,519,796 - - 4,959,342 -
Insurance 120,000 11,000 - - - -
Rent 98,783 - 240,000 97,222 - -
Debt Service 5,021,914 - 5,040 1,960 - -
Capital Outlay 2,310,500 - - - - -
Depreciation - 1,834,736 642,500 75,235 15,500 38,500
Contingency 50,000 - - - - -
Transfers Out 6,282,296 - 100,000 - -
Allocation/PILOT 1,468,944 1,754,116 105,551 17,126 - 37,429
Expense Reimbursement (1,082,600) - - - - -
FY20 Total Expenditures/Expenses 58,933,129 8,274,541 4,278,728 561,965 5,175,784 962,722
Excess (Deficit)/Income (Loss) 817,340 543,959 437,276 38,428 (152,607) 61,478
Fund Balance/Net Assets Position:
Beg. Fund Bal./Net Assets Position 38,260,691 51,573,077 17,515,145 863,374 988,898 592,322
Transfer to CIP/IRP (4,600,000) - - - - -
End Fund Bal./Net Assets Position 34,478,031$ 52,117,036 17,952,421 901,802 836,291 653,800
Capital Outlay/Infrastructure/CIP - 4,791,000 290,000 - - 120,000
COMPARISON TO PRIOR YEAR'S BUDGET
ALL FUNDS: BUDGET FY19 BUDGET FY20 CHANGE % CHANGE
Operating Budget* 129,846,012$ 148,088,659 18,242,647 14.0%
Capital Budget 39,943,911 26,525,775 (13,418,136) -33.6%9,531,000
TOTAL BUDGET 169,789,923$ 174,614,434 4,824,511 2.8%
* Includes Capital Outlay and Infrastructure.
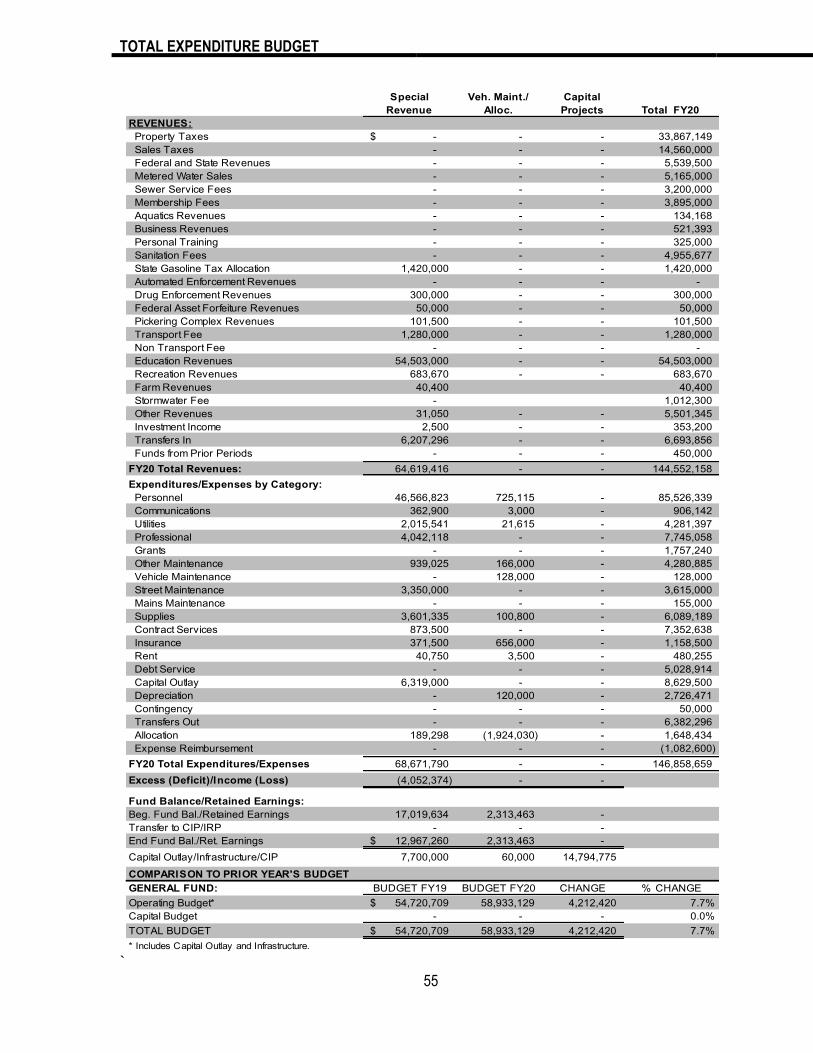
TOTAL EXPENDITURE BUDGET
55
`
Special
Revenue
Veh. Maint./
Alloc.
Capital
Projects Total FY20
REVENUES:
Property Taxes -$ - - 33,867,149
Sales Taxes - - - 14,560,000
Federal and State Revenues - - - 5,539,500
Metered Water Sales - - - 5,165,000
Sewer Service Fees - - - 3,200,000
Membership Fees - - - 3,895,000
Aquatics Revenues - - - 134,168
Business Revenues - - - 521,393
Personal Training - - - 325,000
Sanitation Fees - - - 4,955,677
State Gasoline Tax Allocation 1,420,000 - - 1,420,000
Automated Enforcement Revenues - - - -
Drug Enforcement Revenues 300,000 - - 300,000
Federal Asset Forfeiture Revenues 50,000 - - 50,000
Pickering Complex Revenues 101,500 - - 101,500
Transport Fee 1,280,000 - - 1,280,000
Non Transport Fee - - - -
Education Revenues 54,503,000 - - 54,503,000
Recreation Revenues 683,670 - - 683,670
Farm Revenues 40,400 40,400
Stormwater Fee - 1,012,300
Other Revenues 31,050 - - 5,501,345
Investment Income 2,500 - - 353,200
Transfers In 6,207,296 - - 6,693,856
Funds from Prior Periods - - - 450,000
FY20 Total Revenues: 64,619,416 - - 144,552,158
Expenditures/Expenses by Category:
Personnel 46,566,823 725,115 - 85,526,339
Communications 362,900 3,000 - 906,142
Utilities 2,015,541 21,615 - 4,281,397
Professional 4,042,118 - - 7,745,058
Grants - - - 1,757,240
Other Maintenance 939,025 166,000 - 4,280,885
Vehicle Maintenance - 128,000 - 128,000
Street Maintenance 3,350,000 - - 3,615,000
Mains Maintenance - - - 155,000
Supplies 3,601,335 100,800 - 6,089,189
Contract Services 873,500 - - 7,352,638
Insurance 371,500 656,000 - 1,158,500
Rent 40,750 3,500 - 480,255
Debt Service - - - 5,028,914
Capital Outlay 6,319,000 - - 8,629,500
Depreciation - 120,000 - 2,726,471
Contingency - - - 50,000
Transfers Out - - - 6,382,296
Allocation 189,298 (1,924,030) - 1,648,434
Expense Reimbursement - - - (1,082,600)
FY20 Total Expenditures/Expenses 68,671,790 - - 146,858,659
Excess (Deficit)/Income (Loss) (4,052,374) - -
Fund Balance/Retained Earnings:
Beg. Fund Bal./Retained Earnings 17,019,634 2,313,463 -
Transfer to CIP/IRP - - -
End Fund Bal./Ret. Earnings 12,967,260$ 2,313,463 -
Capital Outlay/Infrastructure/CIP 7,700,000 60,000 14,794,775
COMPARISON TO PRIOR YEAR'S BUDGET
GENERAL FUND: BUDGET FY19 BUDGET FY20 CHANGE % CHANGE
Operating Budget* 54,720,709$ 58,933,129 4,212,420 7.7%
Capital Budget - - - 0.0%
TOTAL BUDGET 54,720,709$ 58,933,129 4,212,420 7.7%
* Includes Capital Outlay and Infrastructure.

TOTAL EXPENDITURE BUDGET
56
ALL FUND OPERATING REVENUES ALL FUND OPERATING EXPENSES
FY20 FY20
General Fund
41%
Utility Fund
6%
Germantown
Athletic ClubFund
3%
Solid
Waste Fund
3%
Special
Revenue Funds 46%
Great
Hall Fund
0%
Stormwater Management
Fund
1%

TOTAL EXPENDITURE BUDGET
57
ALL FUND OPERATING EXPENSES
FY20
General Fund40%
Utility Fund6%
Germantown Athletic Club
Fund3%
Great Hall0%
Solid Waste Fund4%
Special Revenue Funds46%
Stormwater1%

GENERAL FUND BUDGET SUMMARY
58
Actual Actual Original
REVENUES: FY17 FY18 FY19 Budget
Property Taxes 29,415,474$ 33,684,789 32,855,367
Sales Taxes 12,007,202 13,260,520 13,265,000
Federal and State Revenues 6,797,012 6,076,303 5,677,000
Other Revenues 4,289,915 4,425,825 4,474,550
Investment Income 226,922 678,493 219,200
Transfers In - - 100,000
Funds from Prior Periods - - 450,000
TOTAL GENERAL FUND REVENUES 52,736,525 58,125,930 57,041,117
EXPENDITURES:
General Government:
Aldermen 191,973 179,296 226,960
Civic Support 1,637,548 1,647,690 1,695,376
City Court 685,076 707,423 801,304
Administration 1,604,239 1,704,309 1,669,805
Germantown Performing Arts Center 1,261,783 1,291,654 1,450,278
Information Technology 2,028,104 1,872,547 2,621,923
Human Resources 589,016 627,009 658,811
Finance 1,135,977 1,188,628 1,384,590
Procurement 666,333 717,738 756,820
Community Development 2,040,520 2,139,039 2,240,274
General Services 2,031,441 2,173,486 2,388,119
Budget & Performance 325,078 356,519 386,638
Total General Government 14,197,088 14,605,338 16,280,898
Public Safety:
Police 11,359,830 11,652,975 13,021,569
Fire 7,769,219 7,899,411 8,429,506
Total Public Safety 19,129,049 19,552,386 21,451,075
Transportation & Environment:
Public Services 4,302,667 4,054,860 5,051,646
Animal Control 295,787 301,436 365,567
Total Transportation & Environment 4,598,454 4,356,296 5,417,213
Community Services:
Parks & Recreation 1,124,376 1,154,979 1,374,211
Genealogy Center 62,772 62,624 150,710
Library Services 1,456,655 1,506,552 1,537,768
Cultural Arts Programs 46,399 65,209 86,497
Total Community Services 2,690,202 2,789,364 3,149,186
General Debt Service 3,852,402 3,440,728 4,418,520
Other Expenditures:
Transfer to Great Hall Fund 175,000 85,000 75,000
Transfer to Municipal Schools Fund 2,189,386 2,474,721 2,496,607
Transfer to Germantown Athletic Club Fund - (100,000) -
Transfer to Ambulance 600,000 625,000 775,000
Transfer to State Street Aid 1,650,000 1,100,000 1,500,000
Transfer to Farm Park 150,000 120,000 120,000
Contingencies - - 50,000
Expense Reimbursement (978,808) (1,046,960) (1,012,790)
Roll Forward Enc.- Prior Year 450,000 450,000 450,000
Roll Forward Enc.- Next Year (450,000) (450,000) (450,000)
TOTAL GENERAL FUND EXPENDITURES 48,204,034 48,001,873 54,720,709
Excess of Revenues Over/(Under) Expenditures 4,532,491$ 10,124,057 2,320,408
Fund Balance - Beginning 31,857,872 32,601,113 37,456,451
Transfer to Capital Projects (3,789,250) (2,000,000) (1,620,000)
CIP Reserve Increase (Decrease) - - (4,380,000)
Fund Balance - Ending 32,601,113$ 40,725,170 33,776,859

GENERAL FUND BUDGET SUMMARY
59
Estimate Budget Projected
FY19 FY20 FY21 FY22 FY23 FY24
33,587,783$ 33,867,149 34,103,040 34,469,437 35,012,233 35,730,788
14,251,100 14,560,000 15,045,750 15,266,448 15,565,583 15,793,211
5,636,200 5,534,500 5,561,200 5,057,119 4,563,897 4,621,547
4,814,108 4,708,060 4,512,148 4,815,452 4,913,637 5,009,129
614,200 219,200 221,700 218,700 217,840 217,161
361,858 411,560 311,443 312,098 311,493 311,660
450,000 450,000 450,000 450,000 450,000 450,000
59,715,249 59,750,469 60,205,281 60,589,253 61,034,683 62,133,496
229,158 207,437 210,027 212,733 216,452 219,752
1,647,220 1,748,240 1,732,461 1,757,310 1,783,941 1,811,430
800,199 835,843 845,925 864,362 884,501 905,329
1,806,840 1,648,695 1,673,239 1,712,677 1,757,562 1,801,711
1,417,676 1,614,677 1,565,196 1,605,754 1,650,344 1,695,400
2,729,937 2,844,635 3,533,584 2,601,698 3,081,274 2,739,234
664,711 706,735 695,008 714,816 736,154 758,373
1,268,246 1,451,337 1,482,337 1,514,970 1,553,882 1,590,519
791,121 792,058 812,764 834,581 858,466 882,855
2,238,328 2,544,474 2,605,134 2,707,726 2,806,962 2,854,235
2,276,281 2,505,227 2,360,505 2,280,416 2,558,031 2,378,284
379,845 394,085 402,660 412,780 423,743 435,080
16,249,562 17,293,443 17,918,840 17,219,824 18,311,312 18,072,201
12,832,428 13,903,958 14,044,103 14,245,226 14,716,418 15,351,151
9,004,487 8,955,253 9,158,756 9,572,633 9,668,586 9,955,283
21,836,915 22,859,211 23,202,859 23,817,860 24,385,003 25,306,433
5,034,116 4,971,616 4,876,084 5,216,749 4,937,569 5,231,581
335,326 358,533 374,390 383,526 393,598 403,907
5,369,442 5,330,149 5,250,474 5,600,276 5,331,167 5,635,488
1,287,178 1,383,085 1,321,756 1,383,651 1,387,683 1,454,556
135,347 144,302 148,030 151,717 155,869 160,104
1,554,043 1,562,832 1,605,318 1,649,587 1,695,529 1,742,548
87,654 88,497 88,497 88,543 88,745 88,793
3,064,222 3,178,716 3,163,601 3,273,498 3,327,827 3,446,001
4,680,378 5,021,914 5,335,396 5,239,808 5,231,829 5,237,595
75,000 75,000 50,000 - - -
2,497,000 2,507,296 2,557,442 2,608,591 2,660,763 2,713,978
- - - - - -
850,000 800,000 725,000 700,000 750,000 800,000
1,500,000 2,800,000 2,500,000 2,500,000 2,200,000 2,100,000
120,000 100,000 100,000 100,000 120,000 120,000
50,000 50,000 50,000 50,000 50,000 50,000
(1,012,790) (1,082,600) (1,107,489) (1,134,898) (1,163,119) (1,192,180)
450,000 450,000 450,000 450,000 450,000 450,000
(450,000) (450,000) (450,000) (450,000) (450,000) (450,000)
55,279,729 58,933,129 59,746,123 59,974,958 61,204,781 62,289,517
4,435,521$ 817,340 459,158 614,295 (170,097) (156,021)
40,275,170 38,260,691 34,028,031 29,314,189 24,828,484 19,788,387
(1,620,000) - - - - -
(4,380,000) (4,600,000) (4,723,000) (4,650,000) (4,420,000) (2,150,000)
38,710,691$ 34,478,031 29,764,189 25,278,484 20,238,387 17,482,366

GENERAL FUND BUDGET SUMMARY
60
GENERAL FUND REVENUES GENERAL FUND EXPENDITURES
FY20 FY20
GENERAL FUND REVENUES ($000)
2019 ESTIMATED 2020 BUDGET
Amount Percent Amount Percent
Property Taxes 33,588$ 57% 33,867$ 57%
Sales Taxes 14,251 24% 14,560 25%
Federal & State Revenues 5,636 10% 5,535 9%
License, Fees & Other 4,814 7% 4,708 8%
Investment Income 614 1% 219 0%
Transfers In 362 1% 412 1%
TOTAL REVENUES 59,265$ 100% 59,300$ 100%
Property Tax 57%
Sales Tax 19%
Federal & State 13%License & Fees 10%
Interest 1%
Property Tax57%
Sales Tax25%Federal & State
9%
License & Fees 8%
Interest0%
Transfers In1%
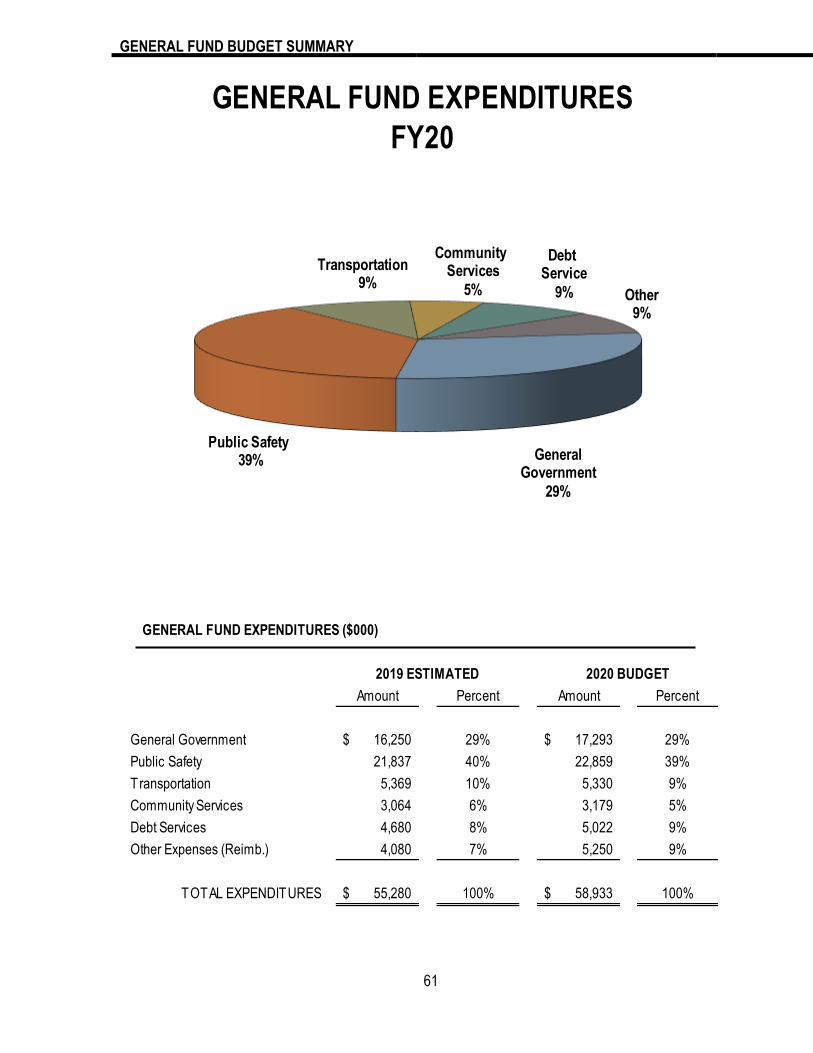
GENERAL FUND BUDGET SUMMARY
61
GENERAL FUND EXPENDITURES
FY20
GENERAL FUND EXPENDITURES ($000)
2019 ESTIMATED 2020 BUDGET
Amount Percent Amount Percent
General Government 16,250$ 29% 17,293$ 29%
Public Safety 21,837 40% 22,859 39%
Transportation 5,369 10% 5,330 9%
Community Services 3,064 6% 3,179 5%
Debt Services 4,680 8% 5,022 9%
Other Expenses (Reimb.) 4,080 7% 5,250 9%
TOTAL EXPENDITURES 55,280$ 100% 58,933$ 100%
Community Services
5%
Debt Service
9% Other9%
Transportation 9%
General Government
29%
Public Safety39%

UTILITY FUND BUDGET SUMMARY
62
Actual Actual Budget
FY17 FY18 FY19
OPERATING REVENUES
Metered Water Sales 5,393,461$ 5,079,445 5,350,000
Sewer Service Fees 3,279,737 3,160,302 3,200,000
Other Revenue 284,461 377,149 284,000
Total Operating Revenues 8,957,659 8,616,896 8,834,000
OPERATING EXPENSES
Water 4,367,388 4,511,011 4,756,904
Sewer 1,570,691 1,904,224 1,818,440
Sewage Treatment 1,379,611 1,480,577 1,572,192
Total Operating Expenses 7,317,690 7,895,812 8,147,536
OPERATING INCOME 1,639,969 721,084 686,464
NONOPERATING REVENUES (EXPENSES)
Contributions from Developers 40,764 228,752 175,000
Investment Income 39,361 136,815 66,500
Gain/loss on disposal of assets 8,660 8,369 -
Utility Debt Service (69,070) (26,554) (12,050)
Net Non-Operating
Revenues (Expenses) 19,715 347,382 229,450
NET INCOME 1,659,684 1,068,466 915,914
Other Receipts
Debt Proceeds - - -
Depreciation 1,751,416 1,779,310 1,785,657
Total Other Receipts 1,751,416 1,779,310 1,785,657
Other Expenses
Bonds Payable 1,035,000 1,075,000 590,000
Major Construction 236,230 512,877 3,558,100
Infrastructure (Water & Sewer) - 265,762 555,000
Total Other Expenses 1,271,230 1,853,639 4,703,100
Effect of Change in Accounting Principle - (72,834) -
Total Net Position - Beginning 48,273,803 49,933,487 50,891,835
Total Net Position - Ending 49,933,487$ 50,929,119 51,807,749
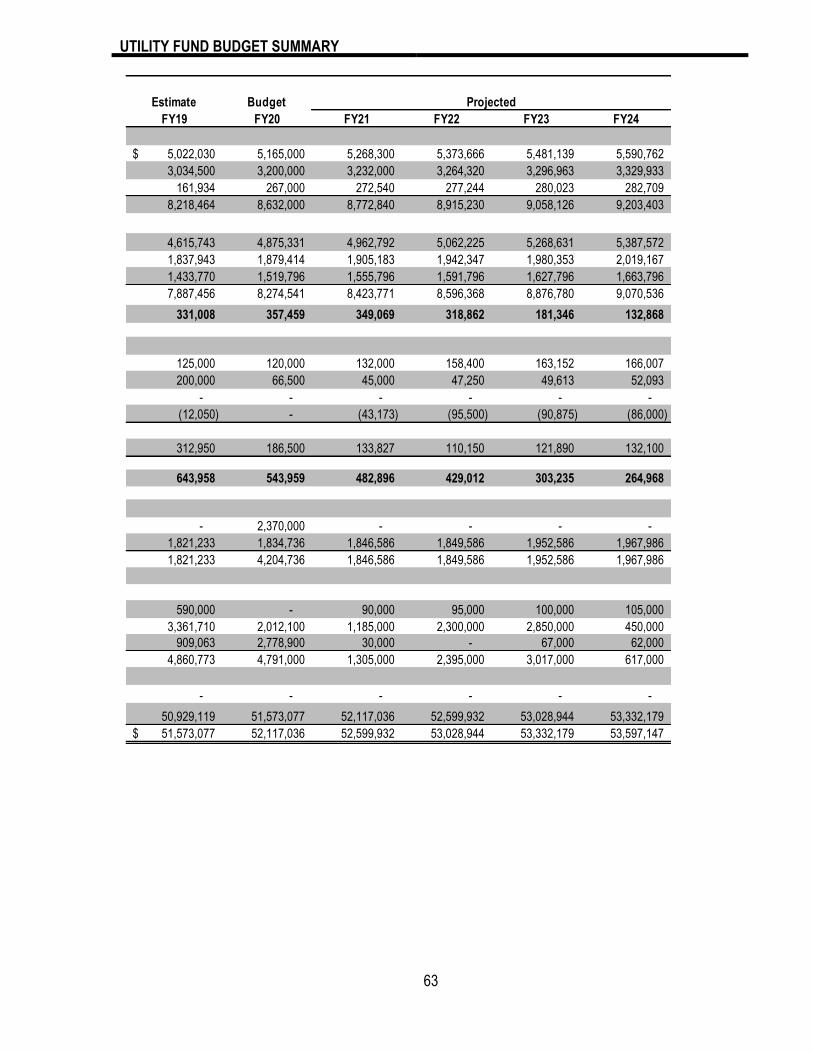
UTILITY FUND BUDGET SUMMARY
63
Estimate Budget Projected
FY19 FY20 FY21 FY22 FY23 FY24
5,022,030$ 5,165,000 5,268,300 5,373,666 5,481,139 5,590,762
3,034,500 3,200,000 3,232,000 3,264,320 3,296,963 3,329,933
161,934 267,000 272,540 277,244 280,023 282,709
8,218,464 8,632,000 8,772,840 8,915,230 9,058,126 9,203,403
4,615,743 4,875,331 4,962,792 5,062,225 5,268,631 5,387,572
1,837,943 1,879,414 1,905,183 1,942,347 1,980,353 2,019,167
1,433,770 1,519,796 1,555,796 1,591,796 1,627,796 1,663,796
7,887,456 8,274,541 8,423,771 8,596,368 8,876,780 9,070,536
331,008 357,459 349,069 318,862 181,346 132,868
125,000 120,000 132,000 158,400 163,152 166,007
200,000 66,500 45,000 47,250 49,613 52,093
- - - - - -
(12,050) - (43,173) (95,500) (90,875) (86,000)
312,950 186,500 133,827 110,150 121,890 132,100
643,958 543,959 482,896 429,012 303,235 264,968
- 2,370,000 - - - -
1,821,233 1,834,736 1,846,586 1,849,586 1,952,586 1,967,986
1,821,233 4,204,736 1,846,586 1,849,586 1,952,586 1,967,986
590,000 - 90,000 95,000 100,000 105,000
3,361,710 2,012,100 1,185,000 2,300,000 2,850,000 450,000
909,063 2,778,900 30,000 - 67,000 62,000
4,860,773 4,791,000 1,305,000 2,395,000 3,017,000 617,000
- - - - - -
50,929,119 51,573,077 52,117,036 52,599,932 53,028,944 53,332,179
51,573,077$ 52,117,036 52,599,932 53,028,944 53,332,179 53,597,147

UTILITY FUND BUDGET SUMMARY
64
UTILITY FUND REVENUES ($000)
2019 ESTIMATED
Amount Percent Amount Percent
Metered Water Sales 5,022$ 59% 5,165$ 59%
Sewer Service Fees 3,035 36% 3,200 36%
Other Revenue 161 2% 267 3%
Contributions from Developers 125 1% 120 1%
Investment Income 200 2% 67 1%
TOTAL REVENUES 8,543$ 100% 8,819$ 100%
2020 BUDGET
UTILITY FUND REVENUES
FY20
Metered Water Sales
59%Sewer Service Fees
36%
Investment
Income1%
Other
Revenues3%
Developer
Contributions1%

UTILITY FUND BUDGET SUMMARY
65
UTILITY FUND EXPENSES ($000)
2019 ESTIMATED
Amount Percent Amount Percent
Water 4,616$ 59% 4,875$ 59%
Sewer 1,838 23% 1,879 23%
Sewage Treatment 1,434 18% 1,520 18%
Utility Debt Service 12 0% - -
TOTAL EXPENSES 7,900$ 100% 8,275$ 100%
2020 BUDGET
UTILITY FUND EXPENSES
FY20
Water 59%
Sewer23%
Sewage Treatment18% Debt Service
0%
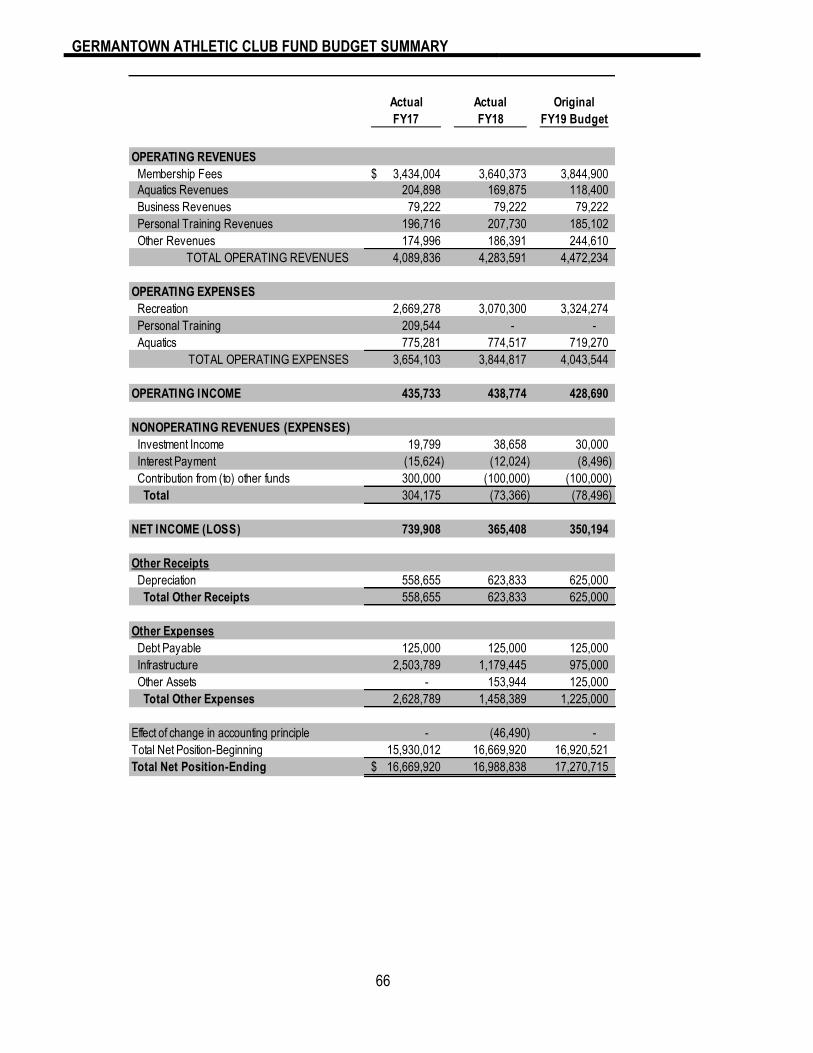
GERMANTOWN ATHLETIC CLUB FUND BUDGET SUMMARY
66
Actual Actual Original
FY17 FY18 FY19 Budget
OPERATING REVENUES
Membership Fees 3,434,004$ 3,640,373 3,844,900
Aquatics Revenues 204,898 169,875 118,400
Business Revenues 79,222 79,222 79,222
Personal Training Revenues 196,716 207,730 185,102
Other Revenues 174,996 186,391 244,610
TOTAL OPERATING REVENUES 4,089,836 4,283,591 4,472,234
OPERATING EXPENSES
Recreation 2,669,278 3,070,300 3,324,274
Personal Training 209,544 - -
Aquatics 775,281 774,517 719,270
TOTAL OPERATING EXPENSES 3,654,103 3,844,817 4,043,544
OPERATING INCOME 435,733 438,774 428,690
NONOPERATING REVENUES (EXPENSES)
Investment Income 19,799 38,658 30,000
Interest Payment (15,624) (12,024) (8,496)
Contribution from (to) other funds 300,000 (100,000) (100,000)
Total 304,175 (73,366) (78,496)
NET INCOME (LOSS) 739,908 365,408 350,194
Other Receipts
Depreciation 558,655 623,833 625,000
Total Other Receipts 558,655 623,833 625,000
Other Expenses
Debt Payable 125,000 125,000 125,000
Infrastructure 2,503,789 1,179,445 975,000
Other Assets - 153,944 125,000
Total Other Expenses 2,628,789 1,458,389 1,225,000
Effect of change in accounting principle - (46,490) -
Total Net Position-Beginning 15,930,012 16,669,920 16,920,521
Total Net Position-Ending 16,669,920$ 16,988,838 17,270,715
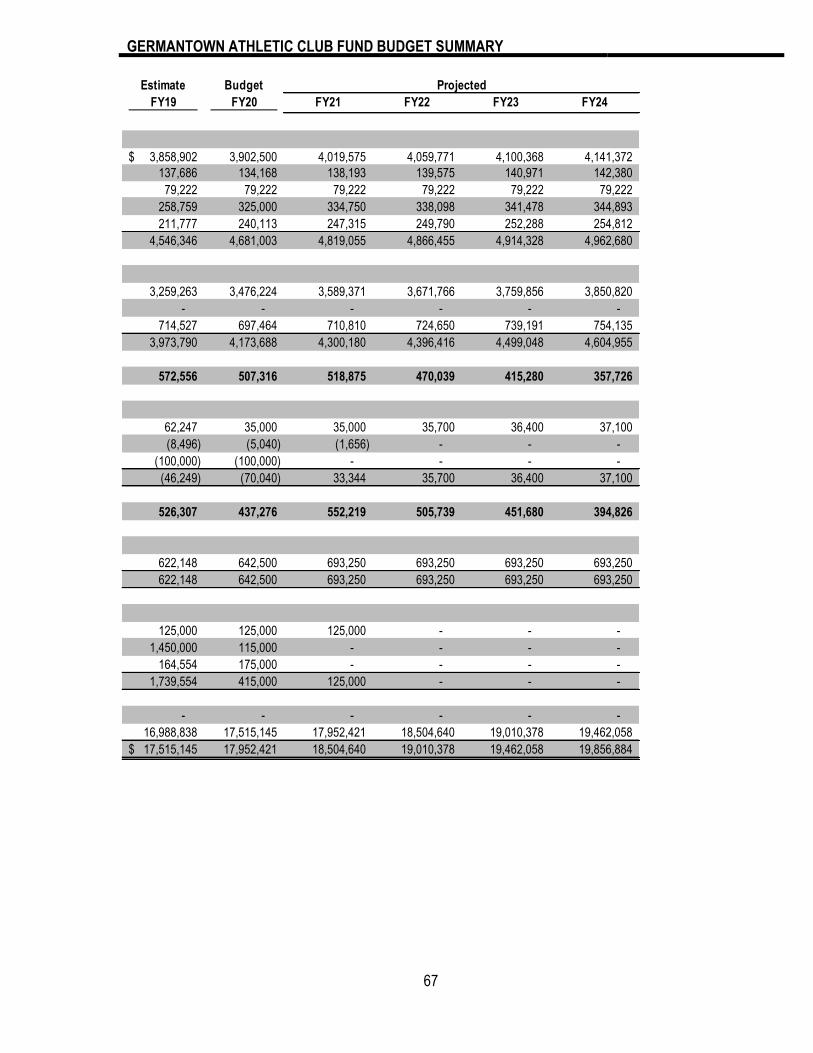
GERMANTOWN ATHLETIC CLUB FUND BUDGET SUMMARY
67
Estimate Budget Projected
FY19 FY20 FY21 FY22 FY23 FY24
3,858,902$ 3,902,500 4,019,575 4,059,771 4,100,368 4,141,372
137,686 134,168 138,193 139,575 140,971 142,380
79,222 79,222 79,222 79,222 79,222 79,222
258,759 325,000 334,750 338,098 341,478 344,893
211,777 240,113 247,315 249,790 252,288 254,812
4,546,346 4,681,003 4,819,055 4,866,455 4,914,328 4,962,680
3,259,263 3,476,224 3,589,371 3,671,766 3,759,856 3,850,820
- - - - - -
714,527 697,464 710,810 724,650 739,191 754,135
3,973,790 4,173,688 4,300,180 4,396,416 4,499,048 4,604,955
572,556 507,316 518,875 470,039 415,280 357,726
62,247 35,000 35,000 35,700 36,400 37,100
(8,496) (5,040) (1,656) - - -
(100,000) (100,000) - - - -
(46,249) (70,040) 33,344 35,700 36,400 37,100
526,307 437,276 552,219 505,739 451,680 394,826
622,148 642,500 693,250 693,250 693,250 693,250
622,148 642,500 693,250 693,250 693,250 693,250
125,000 125,000 125,000 - - -
1,450,000 115,000 - - - -
164,554 175,000 - - - -
1,739,554 415,000 125,000 - - -
- - - - - -
16,988,838 17,515,145 17,952,421 18,504,640 19,010,378 19,462,058
17,515,145$ 17,952,421 18,504,640 19,010,378 19,462,058 19,856,884

GERMANTOWN ATHLETIC CLUB FUND BUDGET SUMMARY
68
GERMANTOWN ATHLETIC CLUB FUND
REVENUES FY20
GAC FUND REVENUES ($000)
2019 ESTIMATED 2020 BUDGET
Amount Percent Amount Percent
Membership Fees 3,859$ 83% 3,903$ 82%
Aquatics Revenues 138 3% 134 3%
Business Revenues 79 2% 79 2%
Personal Training 259 6% 325 7%
Other Revenues 211 5% 240 5%
Investment Income 62 1% 35 1%
TOTAL REVENUES 4,608$ 100% 4,716$ 100%
Business Revenues
2%
Investment Income
1%
Membership Fees
82%
Aquatics Revenues 3%
Other Revenues
5%
Personal Training
7%

GERMANTOWN ATHLETIC CLUB FUND BUDGET SUMMARY
69
GERMANTOWN ATHLETIC CLUB FUND
EXPENSES FY20
GAC FUND EXPENSES ($000)
2019 ESTIMATED 2020 BUDGET
Amount Percent Amount Percent
Recreation 3,259$ 80% 3,476$ 82%
Aquatics 715 18% 697 16%
Interest Payment 8 0% 6 0%
Transfers Out 100 2% 100 2%
TOTAL EXPENSES 4,082$ 100% 4,279$ 100%
Aquatics
16%
Recreation
82%
Interest Payment
0% Transfers Out2%
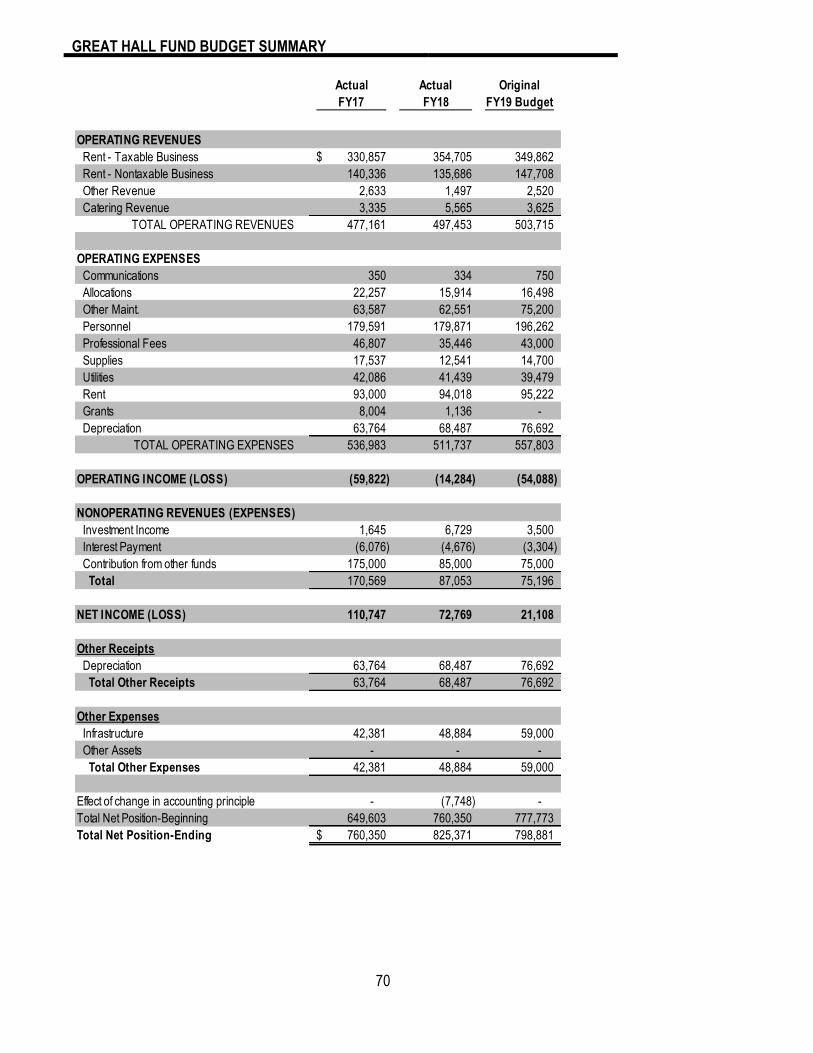
GREAT HALL FUND BUDGET SUMMARY
70
Actual Actual Original
FY17 FY18 FY19 Budget
OPERATING REVENUES
Rent - Taxable Business 330,857$ 354,705 349,862
Rent - Nontaxable Business 140,336 135,686 147,708
Other Revenue 2,633 1,497 2,520
Catering Revenue 3,335 5,565 3,625
TOTAL OPERATING REVENUES 477,161 497,453 503,715
OPERATING EXPENSES
Communications 350 334 750
Allocations 22,257 15,914 16,498
Other Maint. 63,587 62,551 75,200
Personnel 179,591 179,871 196,262
Professional Fees 46,807 35,446 43,000
Supplies 17,537 12,541 14,700
Utilities 42,086 41,439 39,479
Rent 93,000 94,018 95,222
Grants 8,004 1,136 -
Depreciation 63,764 68,487 76,692
TOTAL OPERATING EXPENSES 536,983 511,737 557,803
OPERATING INCOME (LOSS) (59,822) (14,284) (54,088)
NONOPERATING REVENUES (EXPENSES)
Investment Income 1,645 6,729 3,500
Interest Payment (6,076) (4,676) (3,304)
Contribution from other funds 175,000 85,000 75,000
Total 170,569 87,053 75,196
NET INCOME (LOSS) 110,747 72,769 21,108
Other Receipts
Depreciation 63,764 68,487 76,692
Total Other Receipts 63,764 68,487 76,692
Other Expenses
Infrastructure 42,381 48,884 59,000
Other Assets - - -
Total Other Expenses 42,381 48,884 59,000
Effect of change in accounting principle - (7,748) -
Total Net Position-Beginning 649,603 760,350 777,773
Total Net Position-Ending 760,350$ 825,371 798,881
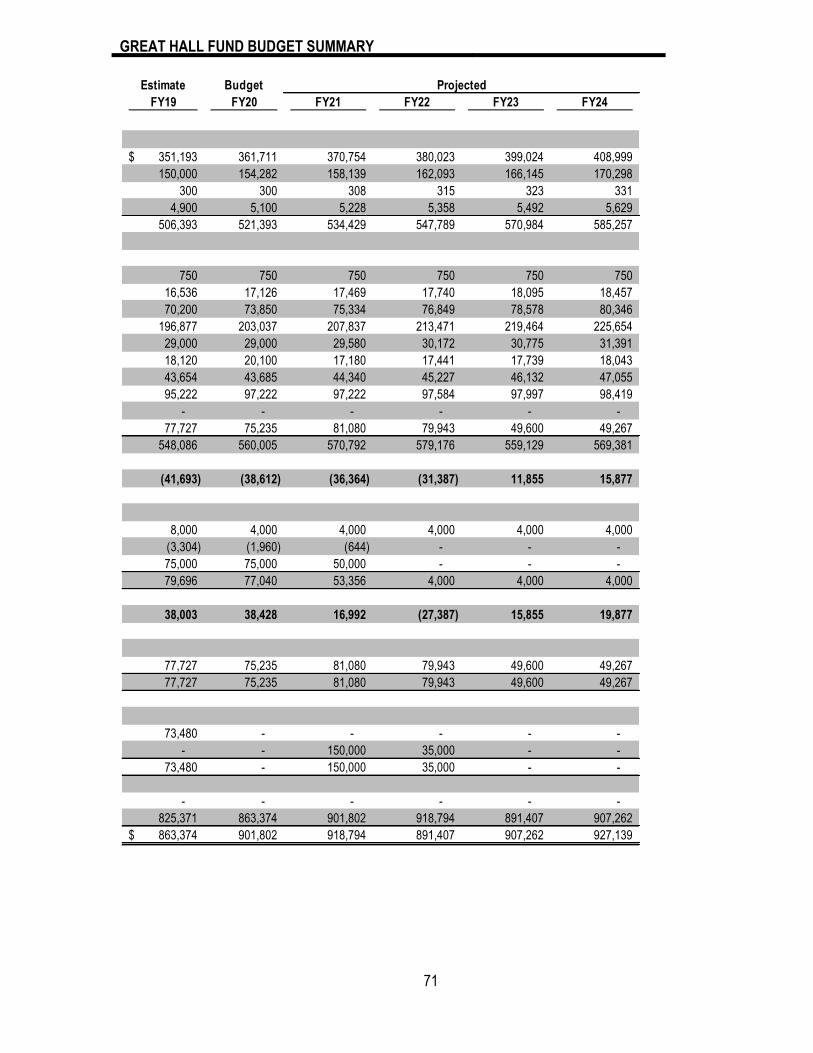
GREAT HALL FUND BUDGET SUMMARY
71
Estimate Budget Projected
FY19 FY20 FY21 FY22 FY23 FY24
351,193$ 361,711 370,754 380,023 399,024 408,999
150,000 154,282 158,139 162,093 166,145 170,298
300 300 308 315 323 331
4,900 5,100 5,228 5,358 5,492 5,629
506,393 521,393 534,429 547,789 570,984 585,257
750 750 750 750 750 750
16,536 17,126 17,469 17,740 18,095 18,457
70,200 73,850 75,334 76,849 78,578 80,346
196,877 203,037 207,837 213,471 219,464 225,654
29,000 29,000 29,580 30,172 30,775 31,391
18,120 20,100 17,180 17,441 17,739 18,043
43,654 43,685 44,340 45,227 46,132 47,055
95,222 97,222 97,222 97,584 97,997 98,419
- - - - - -
77,727 75,235 81,080 79,943 49,600 49,267
548,086 560,005 570,792 579,176 559,129 569,381
(41,693) (38,612) (36,364) (31,387) 11,855 15,877
8,000 4,000 4,000 4,000 4,000 4,000
(3,304) (1,960) (644) - - -
75,000 75,000 50,000 - - -
79,696 77,040 53,356 4,000 4,000 4,000
38,003 38,428 16,992 (27,387) 15,855 19,877
77,727 75,235 81,080 79,943 49,600 49,267
77,727 75,235 81,080 79,943 49,600 49,267
73,480 - - - - -
- - 150,000 35,000 - -
73,480 - 150,000 35,000 - -
- - - - - -
825,371 863,374 901,802 918,794 891,407 907,262
863,374$ 901,802 918,794 891,407 907,262 927,139
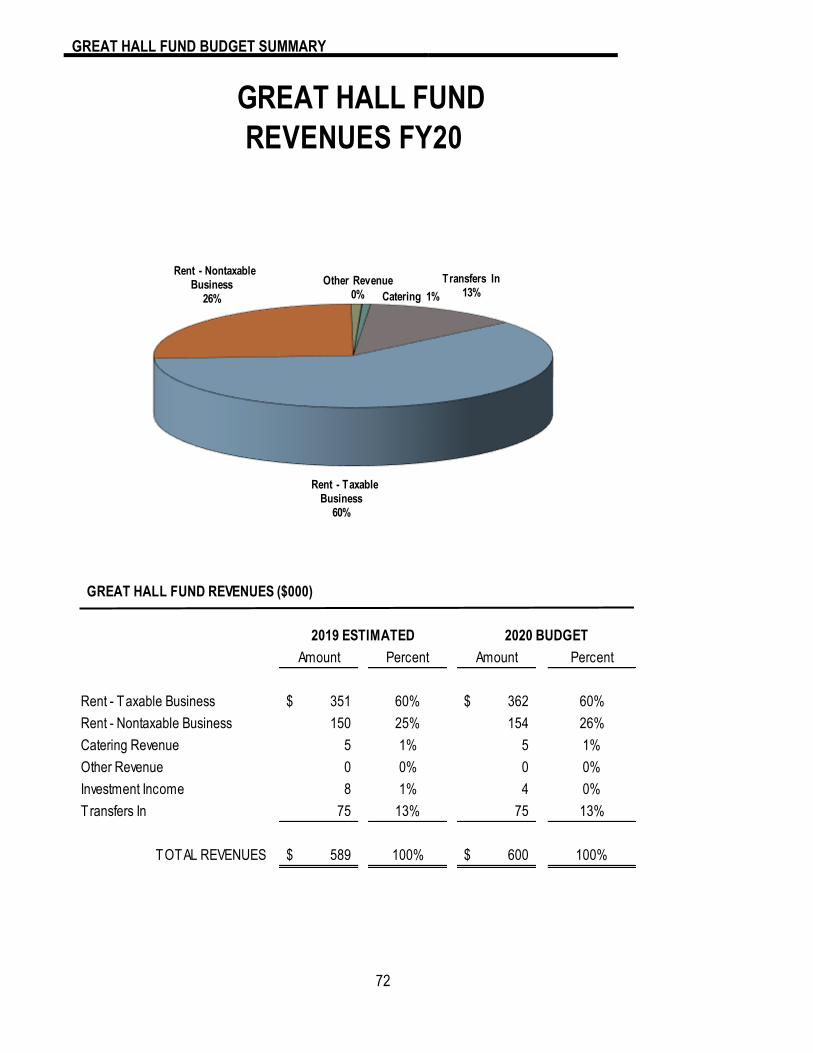
GREAT HALL FUND BUDGET SUMMARY
72
GREAT HALL FUND
REVENUES FY20
GREAT HALL FUND REVENUES ($000)
2019 ESTIMATED 2020 BUDGET
Amount Percent Amount Percent
Rent - Taxable Business 351$ 60% 362$ 60%
Rent - Nontaxable Business 150 25% 154 26%
Catering Revenue 5 1% 5 1%
Other Revenue 0 0% 0 0%
Investment Income 8 1% 4 0%
Transfers In 75 13% 75 13%
TOTAL REVENUES 589$ 100% 600$ 100%
Rent - Taxable Business
60%
Rent - Nontaxable Business
26% Catering 1%
Other Revenue0%
Transfers In13%

GREAT HALL FUND BUDGET SUMMARY
73
GREAT HALL FUND
EXPENSES FY20
GREAT HALL FUND EXPENSES ($000)
2019 ESTIMATED 2020 BUDGET
Amount Percent Amount Percent
Allocations 17$ 3% 17 3%
Other Maintenance 70 13% 74 13%
Personnel 196 36% 203 37%
Professional Fees 29 5% 29 5%
Communication 1 0% 1 0%
Supplies 18 3% 20 4%
Utilities 44 8% 44 8%
Rent 95 17% 97 17%
Depreciation 78 14% 75 13%
Interest Payment 3 1% 2 0%
TOTAL EXPENSES 551$ 100% 562 100%
Allocations
3%
Other
Maintenance13%
Personnel
37%
Professional Fees
5%
Supplies 4%
Utilities 8%
Rent
17%
Depreciation
13%
Interest
Payment0%
Communication 0%

SOLID WASTE FUND BUDGET SUMMARY
74
Actual Actual Budget
FY17 FY18 FY19
OPERATING REVENUES
Solid Waste Fees 4,782,138$ 4,901,382 4,946,821
Grants 4,202 23,076 7,500
Recycling Reimbursement 2,688 2,942 1,500
Other Revenues 48,067 45,460 40,000
TOTAL OPERATING REVENUES 4,837,095 4,972,860 4,995,821
OPERATING EXPENSES
Communication 4,726 89 25,500
Personnel 158,272 106,047 113,478
Professional Fees - - 25,000
Supplies 34,432 25,857 40,000
Rent - - -
Depreciation - 6,005 15,474
Contract Services 4,790,864 4,637,501 4,862,989
TOTAL OPERATING EXPENSES 4,988,294 4,775,499 5,082,441
OPERATING INCOME (151,199) 197,361 (86,620)
NONOPERATING REVENUES (EXPENSES)
Investment Income 7,014 18,879 10,000
Total Nonoperating Revenues 7,014 18,879 10,000
NET INCOME/(LOSS) (144,185) 216,240 (76,620)
Other Receipts
Depreciation - 6,005 15,474
Total Other Receipts - 6,005 15,474
Other Expenses
Other Assets - 154,743 -
Total Other Expenses - 154,743 -
Effect of change in accounting principle - (4,649) -
Total Net Position-Beginning 932,147 787,962 923,838
Total Net Position Ending 787,962$ 999,553 847,218

SOLID WASTE FUND BUDGET SUMMARY
75
Estimate Budget
FY19 FY20 FY21 FY22 FY23 FY24
4,913,500$ 4,955,677 4,970,867 4,982,896 5,017,754 5,029,842
4,300 5,000 5,150 5,304 5,461 5,627
1,500 1,500 1,500 1,500 1,500 1,500
41,500 40,000 40,000 40,000 40,000 40,000
4,960,800 5,002,177 5,017,517 5,029,700 5,064,715 5,076,969
50,300 15,500 15,500 17,500 17,500 17,500
124,155 120,442 124,041 129,047 131,664 135,596
- 25,000 25,000 - - -
20,000 40,000 40,000 40,000 50,000 50,000
- - - - - -
15,500 15,500 15,474 15,474 15,474 15,474
4,784,000 4,959,342 5,026,350 5,054,619 5,117,291 5,161,015
4,993,955 5,175,784 5,246,365 5,256,640 5,331,930 5,379,585
(33,155) (173,607) (228,848) (226,940) (267,215) (302,616)
22,500 21,000 10,000 10,000 10,000 10,000
22,500 21,000 10,000 10,000 10,000 10,000
(10,655) (152,607) (218,848) (216,940) (257,215) (292,616)
15,500 15,500 15,474 15,474 15,474 15,474
15,500 15,500 15,474 15,474 15,474 15,474
- - - - - -
- - - - -
- - - - - -
999,553 988,898 836,291 617,443 400,503 143,288
988,898$ 836,291 617,443 400,503 143,288 (149,328)
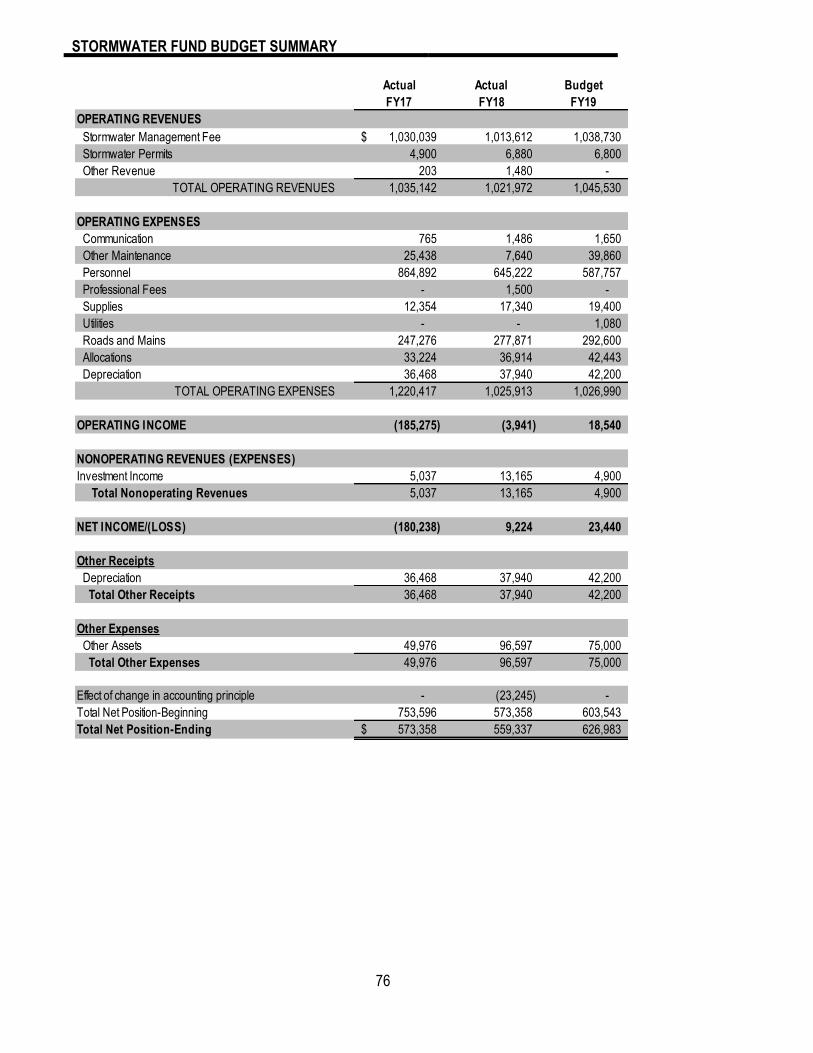
STORMWATER FUND BUDGET SUMMARY
76
Actual Actual Budget
FY17 FY18 FY19
OPERATING REVENUES
Stormwater Management Fee 1,030,039$ 1,013,612 1,038,730
Stormwater Permits 4,900 6,880 6,800
Other Revenue 203 1,480 -
TOTAL OPERATING REVENUES 1,035,142 1,021,972 1,045,530
OPERATING EXPENSES
Communication 765 1,486 1,650
Other Maintenance 25,438 7,640 39,860
Personnel 864,892 645,222 587,757
Professional Fees - 1,500 -
Supplies 12,354 17,340 19,400
Utilities - - 1,080
Roads and Mains 247,276 277,871 292,600
Allocations 33,224 36,914 42,443
Depreciation 36,468 37,940 42,200
TOTAL OPERATING EXPENSES 1,220,417 1,025,913 1,026,990
OPERATING INCOME (185,275) (3,941) 18,540
NONOPERATING REVENUES (EXPENSES)
Investment Income 5,037 13,165 4,900
Total Nonoperating Revenues 5,037 13,165 4,900
NET INCOME/(LOSS) (180,238) 9,224 23,440
Other Receipts
Depreciation 36,468 37,940 42,200
Total Other Receipts 36,468 37,940 42,200
Other Expenses
Other Assets 49,976 96,597 75,000
Total Other Expenses 49,976 96,597 75,000
Effect of change in accounting principle - (23,245) -
Total Net Position-Beginning 753,596 573,358 603,543
Total Net Position-Ending 573,358$ 559,337 626,983

STORMWATER FUND BUDGET SUMMARY
77
Estimate Budget Projected
FY19 FY20 FY21 FY22 FY23 FY24
1,011,080$ 1,012,300 1,017,362 1,027,535 1,032,673 1,043,000
7,000 6,900 9,000 12,000 15,000 17,000
- - - - - -
1,018,080 1,019,200 1,026,362 1,039,535 1,047,673 1,060,000
1,420 3,275 3,287 3,300 3,314 3,327
34,460 30,960 22,984 23,559 24,148 24,751
575,406 566,558 584,564 604,019 624,587 645,880
- 1,000 1,000 1,000 1,010 1,010
14,880 19,400 19,915 20,463 21,026 21,606
570 600 612 624 637 649
292,600 265,000 265,000 277,600 277,600 277,600
36,559 37,429 37,961 39,168 40,540 41,742
36,500 38,500 38,885 39,274 39,667 40,063
992,395 962,722 974,208 1,009,007 1,032,528 1,056,629
25,685 56,478 52,153 30,529 15,145 3,370
7,300 5,000 5,150 5,305 5,464 5,628
7,300 5,000 5,150 5,305 5,464 5,628
32,985 61,478 57,303 35,833 20,609 8,998
36,500 38,500 38,885 39,274 39,667 40,063
36,500 38,500 38,885 39,274 39,667 40,063
75,000 120,000 50,000 180,000 50,000 50,000
75,000 120,000 50,000 180,000 50,000 50,000
- - - - - -
559,337 592,322 653,800 711,103 746,936 767,545
592,322$ 653,800 711,103 746,936 767,545 776,543
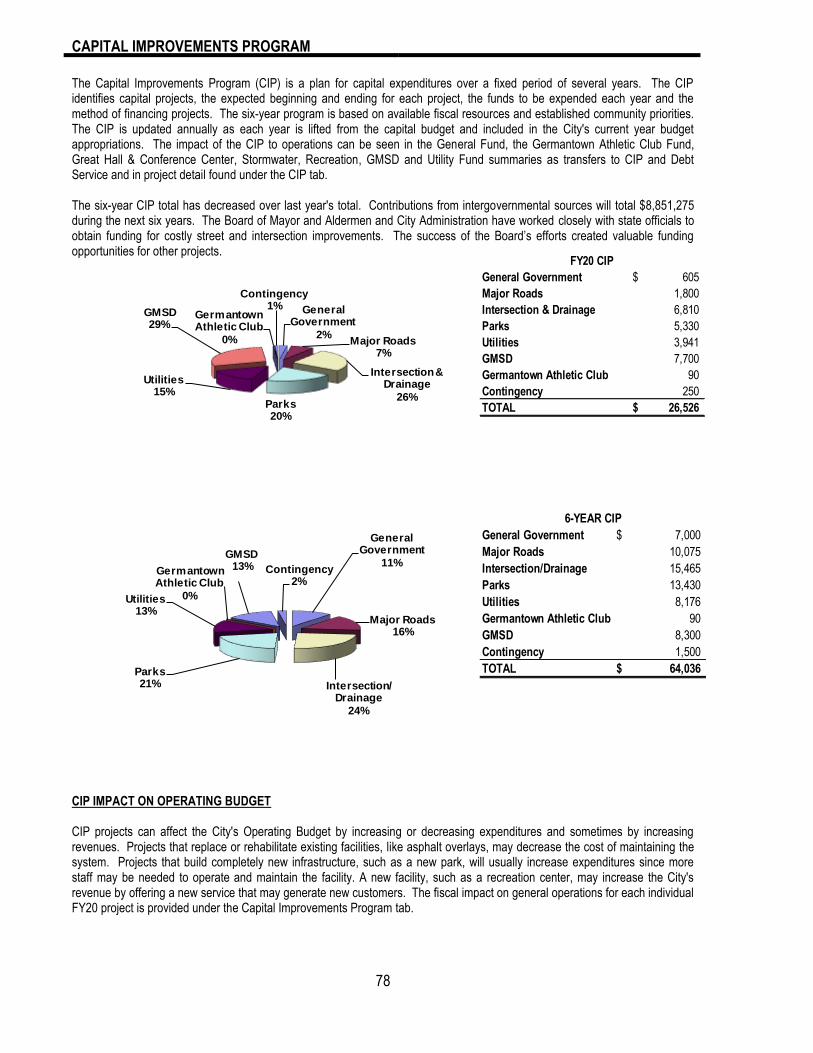
CAPITAL IMPROVEMENTS PROGRAM
78
The Capital Improvements Program (CIP) is a plan for capital expenditures over a fixed period of several years. The CIP identifies capital projects, the expected beginning and ending for each project, the funds to be expended each year and the method of financing projects. The six-year program is based on available fiscal resources and established community priorities. The CIP is updated annually as each year is lifted from the capital budget and included in the City's current year budget appropriations. The impact of the CIP to operations can be seen in the General Fund, the Germantown Athletic Club Fund, Great Hall & Conference Center, Stormwater, Recreation, GMSD and Utility Fund summaries as transfers to CIP and Debt Service and in project detail found under the CIP tab. The six-year CIP total has decreased over last year's total. Contributions from intergovernmental sources will total $8,851,275 during the next six years. The Board of Mayor and Aldermen and City Administration have worked closely with state officials to obtain funding for costly street and intersection improvements. The success of the Board’s efforts created valuable funding opportunities for other projects.
CIP IMPACT ON OPERATING BUDGET
CIP projects can affect the City's Operating Budget by increasing or decreasing expenditures and sometimes by increasing revenues. Projects that replace or rehabilitate existing facilities, like asphalt overlays, may decrease the cost of maintaining the system. Projects that build completely new infrastructure, such as a new park, will usually increase expenditures since more staff may be needed to operate and maintain the facility. A new facility, such as a recreation center, may increase the City's revenue by offering a new service that may generate new customers. The fiscal impact on general operations for each individual FY20 project is provided under the Capital Improvements Program tab.
General Government
2%Major Roads
7%
Intersection & Drainage
26%Parks20%
Utilities15%
GMSD29%
Germantown Athletic Club
0%
Contingency1%
General Government
11%
Major Roads16%
Intersection/Drainage
24%
Parks21%
Utilities13%
Germantown Athletic Club
0%
GMSD13% Contingency
2%
General Government 605$
Major Roads 1,800
Intersection & Drainage 6,810
Parks 5,330
Utilities 3,941
GMSD 7,700
Germantown Athletic Club 90
Contingency 250
TOTAL 26,526$
FY20 CIP
General Government 7,000$
Major Roads 10,075
Intersection/Drainage 15,465
Parks 13,430
Utilities 8,176
Germantown Athletic Club 90
GMSD 8,300
Contingency 1,500
TOTAL 64,036$
6-YEAR CIP

CAPITAL IMPROVEMENTS PROGRAM
79
STATE &
E X P E N D I T U R E S FUNDING SOURCES FEDERAL
(in thousands) FY19 TOTAL FY20 FY21 FY22 FY23 FY24 FY25 Reserves Grants Bonds Hall PROJECTS
GENERAL GOVERNMENT:
GPAC - Grove 5,056 - - - - - - - - - - - -
Court Clerk Office Renovation 60 60 - - - - - 60 - - - -
Fire Station 3 Preliminary Design 100 - - - - - - - - - - - -
Fire Station 3 Construction - 4,000 - - 4,000 - - - - - 4,000 - -
City Hall Elevator Replacement 295 - - - - - - - - - - - -
Court Clerk Office Renovation - - - - - - - - - - - - -
GPAC Grove Perimeter Fencing - 300 300 - - - - - 150 150 - - -
Fire Station #2 Design 350 - - - - - 350 350 - - - -
Ambulance - 990 245 245 250 250 - - 990 - - - -
Fire Engine Replacements 860 1,300 - 1,300 - - - - 1,300 - - - -
Total General Government: 6,311 7,000 605 1,545 4,250 250 - 350 2,850 150 4,000 - -
MAJOR ROADS:
Forest Hill Irene Safety Improv Poplar to WRB - 375 375 - - - - - 75 - - - 300
Neshoba Rd Gtown to Exter Overlay - 1,500 150 1,350 - - - - 300 - - - 1,200
FHI Widening Poplar to WRB ROW - 500 - 500 - - - - 100 - - - 400
FHI Widening Poplar to WRB Const - 4,125 - - - 4,125 - - 825 - - - 3,300
Winchester Milling and Paving* 1,640 - - - - - - - - - - - -
Wolf River Milling and Paving - Riverdale to West City Limits- 2,000 200 1,800 - - - - 400 - - - 1,600
Major Road Plan - 100 100 - - - - - 20 - - - 80
Poplar Avenue Culvert - Phase IV and V* - 1,075 575 500 - - - - - - - - 1,075
FHI Widening Poplar Pike to Winc ROW 536 - - - - - - - - - - - -
FHI Widening Poplar Pike/Winc- Const 5,795 400 400 - - - - - 400 - - - -
Total Major Roads: 7,971 10,075 1,800 4,150 - 4,125 - - 2,120 - - - 7,955
* State funding is included in totals.
INTERSECTIONS & OTHER:
Central Business District Streetscape 62 - - - - - - - - - - - -
Decorative Street Signs 25 60 60 - - - - - 50 10 - - -
Signal Upgrades* 1,050 1,500 300 1,200 - - - - - - - - 1,500
Intersection Safety Audit 200 200 - - - - - 40 - - - 160
Safe Routes to School Ph1* 200 - - - - - - - - - - - -
Safe Routes to School Ph2* 356 - - - - - - - - - - - -
WRB/Campbell Clinic Signal 500 75 425 - - - - 250 250 - - -
Signalization WRB @ HHS 500 100 400 - - - - - - - - 500
Wolf River/Gtown Rd Impr- Const* 47 4,600 4,600 - - - - - - - - - 4,600
Signalization FHI @ Crestwyn - 500 75 425 - - - - 465 35 - - -
GPAC Pedestrian Walkways - 50 50 - - - - - 50 - - - -
ADA Transition Plan* 175 275 275 - - - - - 55 - - - 220
Total Intersections/Other: 1,916 8,185 5,735 2,450 - - - - 910 295 - - 6,980
DRAINAGE:
City Wide Master Drainage Plan 180 900 150 150 150 150 150 150 900 - - - -
Lateral E Bank Stablization - 875 875 - - - - - 875 - - - -
Duntreath Drainage Ditch Improvements - 1,080 - 80 1,000 - - - 1,080 - - - -
Annual Misc Drainage Imprv 69 300 50 50 50 50 50 50 300 - - - -
Redbud Trail Imprv - 500 - 500 - - - - 500 - - - -
Riverdale Rd Outlet Culvert - 830 - 80 750 - - - 830 - - - -
English Meadows - 900 - - - 900 - - 900 - - - -
Dogwood Grove 4th addition - 930 - - - 80 850 - 930 - - - -
Miller Farms Drainage Study 115 - - - 115 - - 115 - - - -
Great Oaks Drainage - 850 - - - - 850 - 850 - - - -
Total Drainage: 249 7,280 1,075 860 1,950 1,295 1,900 200 7,280 - - - -
* State funding is included in totals.
PARKS:
Greenway Clark Property 400 - 400 - - - - 400 - - - -
Neighborhood Parks - 2,400 - - 1,000 - 1,000 400 1,400 - 1,000 - -
Germantown Station Park Reinvestment - 250 250 - - - - - 250 - - - -
Riverdale Reinvestment 250 250 - - - - - 250 - - - -
Greenway Wayfinding Signage 50 300 - 100 - 100 - 100 300 - - - -
Greenway Phase Nashoba to East Trail Head* - 2,130 2,130 - - - - - 426 - - - 1,704
Farmington Playground Renovation 430 - - - - - - - - - - - -
Cameron Brown Phase 1 200 200 - - - - - 200 - - - -
Parkland Acquistion 350 3,500 2,500 - 1,000 - - - 1,000 - 2,500 - -
Long Field Project Design and Development - 4,000 - - - 1,500 2,500 - 1,500 - 2,500 - -
Total Parks: 830 13,430 5,330 500 2,000 1,600 3,500 500 5,726 - 6,000 - 1,704
* State funding is included in totals. -
GERMANTOWN ATHLETIC CLUB FUND:
Interior Security Cameras 148 - - - - - - - - - - - -
GAC Renovation Phase 4 Closeout 1,302 40 40 - - - - - 40 - - - -
Exterior Signage - 50 50 - - - - - 50 - - - -
Total GAC Fund: 1,450 90 90 - - - - - 90 - - - -
* State funding is included in totals.
CITY OF GERMANTOWN
Capital Improvements Program - 2018 to 2025

CAPITAL IMPROVEMENTS PROGRAM
80
STATE &
E X P E N D I T U R E S FUNDING SOURCES FEDERAL
(in thousands) FY19 TOTAL FY20 FY21 FY22 FY23 FY24 FY25 Reserves Grants Bonds Hall PROJECTS
MUNICIPAL SCHOOLS:
GMSD Central Office 3,000 - - - - - - - - - - - -
HHS Fieldhouse 200 800 200 200 200 200 - - 800 - - - -
Security Upgrades 500 1,000 1,000 - - - - - 1,000 - - - -
Riverdale Boilers 1,000 1,500 1,500 - - - - - 1,500 - - - -
Houston Middle School Expansion - 5,000 5,000 - - - - - - - 5,000 - -
Total GMSD Fund: 4,700 8,300 7,700 200 200 200 - - 3,300 - 5,000 - -
UTILITY FUND:
Water System Acquisition Funding - 500 500 - - - - - 500 - - - -
North Johnson Rd Lift Station 235 - 235 - - - - 235 - - - -
Water Main to Elevated Water Tank 243 - - - - - - - - - - - -
Elevated Water Tank - 2,357 2,357 - - - - - - - 2,357 - -
Annexation Area Water Main Phase 1 922 - - - - - - - - - - - -
Annexation Area Water Main Phase 2 - 1,034 1,034 - - - - - 1,034 - - - -
Western Gateway Sewer 2,000 - - - - - - - - - - - -
Automated Meter Reading Phase 1 3,050 50 - 1,500 1,500 - - 3,050 - - - -
Southern Ave Electrical Panels 348 - - - - - - - - - - -
Sanitary Sewer Upgrade Design- FHH - 1,000 - - 100 900 - - 1,000 - - - -
Total Utility Fund: 3,513 8,176 3,941 235 1,600 2,400 - - 5,819 - 2,357 - -
CONTINGENCY: 1,500 250 250 250 250 250 250 1,500 - - -
Total Contingency: - 1,500 250 250 250 250 250 250 1,500 - - - -
CIP SUMMARYGeneral Government 6,311 7,000 605 1,545 4,250 250 - 350
Major Roads 7,971 10,075 1,800 4,150 - 4,125 - -
Intersec/Other/Drainage 2,165 15,465 6,810 3,310 1,950 1,295 1,900 200
Parks 830 13,430 5,330 500 2,000 1,600 3,500 500
Utilities 3,513 8,176 3,941 235 1,600 2,400 - -
Germantown Athletic Club 1,450 90 90 - - - - -
Great Hall - - - - - - - -
GMSD 4,700 8,300 7,700 200 200 200 - -
Contingency - 1,500 250 250 250 250 250 250
Total CIP: 26,940 64,036 26,526 10,190 10,250 10,120 5,650 1,300
FUNDING SUMMARY
Reserves: General 17,277 20,386 3,744 4,523 4,450 4,220 2,150 1,300
Utility 3,513 5,819 1,584 235 1,600 2,400 - -
Germantown Athletic Club 1,450 90 90 - - - - -
Great Hall - - - - - - - -
GMSD 4,700 3,300 2,700 200 200 200 - -
State/Intergovernmental/Grant: 17,084 8,551 5,233 - 3,300 - -
Bonds: General - 15,000 7,500 - 4,000 - 3,500 -
Utility - 2,357 2,357 - - - - -
Hall: General - - - - - - - -
Total Funding: 26,940 64,036 26,526 10,190 10,250 10,120 5,650 1,300

INFRASTRUCTURE REPLACEMENT PROGRAM – 2020 to 2029
81
City of Germantown
INFRASTRUCTURE REPLACEMENT PROGRAM DETAIL
(in thousands)
AREA & TYPE OF Budget Estimate 10 YEAR
INFRASTRUCTURE FY19 FY19 FY20 FY21 FY22 FY23 FY24 FY25 FY26 FY27 FY28 FY29 TOTAL
GENERAL FUND:
BUILDING IMPROVEMENTS:
FACIILITIES SERVICES:
Conference Room 1 Improvements - - 40 - - - - - - - - - 40
ADA Bathroom Upgrade -People Street - - 100 - - - - - - - - - 100
ECD Boilers 20 34 - - - - - - - - - - -
Depot Park Exterior Light replacement - - 55 - - - - - - - - - 55
Police - Office and Corridors Floor Replacement 25 23 - - - - - - - - - - -
Police - Air Handler Replacement in Pistol Range 35 26 - - - - - - - - - - -
City Hall Flooring Replacement (lower level) - - - 55 - - - - - - - - 55
City Hall Interior Lighting Improvements - - - 25 - - - - - - - - 25
Animal Shelter HVAC Replacements - - - 60 - - - - - - - - 60
GPAC and GAC Cooling Tower Replacement 60 77 - - - - - - - - - - -
GPAC Flooring - Green Room - - 11 - - - - - - - - - 11
Library Building Exterior Improvements - - - - - 60 - - - - - - 60
Depot Exterior Painting - - - - - 12 - - - - - - 12
Station 4 - IT Computer Room HVAC Installation - - - - 90 - - - - - - - 90
GPAC - Simulcast Room - - 12 - - - - - - - - - 12
Station 2 Building Interior and Exterior Improvements 50 17 - - - - - - - - - - -
Station 1 Condenser Units #1&2 and Freon gas line replacement 55 42 - - - - - - - - - - -
HVAC - Fire Station 2 - - 88 - - - - - - - - - 88
Watkins Theater Hallway - - 100 - - - - - - - - - 100
ECD Chiller Replacement - - - 140 - - - - - - - - 140
Parks & Recreation Exterior Painting - - - - - 20 - - - - - - 20
Public Services Interior Lighting Improvements - - - - 15 - - - - - - - 15
TOTAL FACILITIES SERVS. 245 218 406 280 105 92 - - - - - - 883
TOTAL BUILDING IMPROVEMENTS 245 218 406 280 105 92 - - - - - - 883
OTHER EQUIPMENT:
GPAC:
Simulcast Room Cabling - - 18 - - - - - - - - - 18
TOTAL GPAC - - 18 - - - - - - - - - 18
FACILITY SERVICES
Portable Emergency Generator - - - - - 270 - - - - - - 270
TOTAL FACILITY SERVICES - - - - - 270 - - - - - - 270
FIRE:
Kitchen Cabinets and Appliances - - 15 - - - - - - - - - 15
Apparatus Exhaust Systems 25 23 40 35 - - 15 35 - - - - 125
Haz-Mat ID 56 54 - - - - - - - - - - -
Power Hawk Electric Extrication Tools - - 20 - - - - - - - - - 20
Swiftwater Trailers 12 11 - - - - - - - - - - -
TOTAL FIRE 93 88 75 35 - - 15 35 - - - - 160
TOTAL OTHER EQUIPMENT 93 88 93 35 - 270 15 35 - - - - 448
MAINTENANCE EQUIPMENT:
PUBLIC SERVICE AND GROUNDS:
Concrete Form Trailer - - 10 - - - - - - - - - 10
Specialty Mower w/various attachments for Greenway - - - 60 - - - - - - - - 60
Ingersoll Rand Air Compressor - - 40 40 - - - - - - - - 80
Solar Arrow Board 20 20 - - - - - - - - - - -
Utility Trailer - - 10 - - - - - - - - - 10
Kohler Compact Roller - - 35 - - - - - - - - - 35
Graco Walk-Behind Street Line Striper - - - 30 - - - - - - - - 30
Gradall Rubber Tire Excavator 425 404 - - - - - - - - - - -
Smitco Bunker Rake - - - 18 20 - - - - - 22 - 60
International 4700 Hook Lift - - - - - - 150 - - - - - 150
Exmark Mower 72" - - - - - - - 30 - - - - 30
DXT Loader - - - - - - - 150 - - - - 150
Toro Workman - - - - 20 - - - - - 22 - 42
Craco SS125 Asphalt Crack Sealer - - - - - - - 65 - - - - 65
TOTAL PUBLIC SVCS. 445 424 95 148 40 - 150 245 - - 44 - 722
TOTAL MAINTENANCE EQUIPMENT 445 424 95 148 40 - 150 245 - - 44 - 722

INFRASTRUCTURE REPLACEMENT PROGRAM – 2020 to 2029
82
City of Germantown
INFRASTRUCTURE REPLACEMENT PROGRAM DETAIL
(in thousands)
AREA & TYPE OF Budget Estimate 10 YEAR
INFRASTRUCTURE FY19 FY19 FY20 FY21 FY22 FY23 FY24 FY25 FY26 FY27 FY28 FY29 TOTAL
AUTOS AND TRUCKS:
ANIMAL CONTROL:
Transit Connect - - - - - - - - 35 - - - 35
TOTAL ANIMAL CONTROL - - - - - - - - 35 - - - 35
FACILITIES MANAGEMENT:
Ford F-350 - - - - - - - 35 - - - - 35
Dodge 1500 30 28 - - - - - - - - - - -
Dodge Ram - - - - - - - - - 40 - - 40
Ford Transit Connect Van - - - - - - - - - - 32 - 32
Ford F-150 - - 40 - - - - - - - - - 40
Ford Taurus - - 25 - - - - - - - - - 25
Ford Ranger - - - - 40 - - - - - - - 40
Ford F-250 - - - - - - 120 - - - - - 120
TOTAL FACILITIES MAINT. 30 28 65 - 40 - 120 35 - 40 32 - 332
DEVELOPMENT:
Ford Ranger - - - - - 30 32 - - - 32 - 94
Ford Escape - - - - - - - - - - - 32 32
Ford F-150 4x4 - - - - - 30 - - - 32 32 - 94
TOTAL DEVELOPMENT - - - - - 60 32 - - 32 64 32 220
PUBLIC SERVICE AND GROUNDS:
KW T370 Dump Truck - - - - - - - - - - 130 130 260
Chevrolet 3500 40 42 - - - - - - - - - - -
Sterling Dump Truck - - - - 130 - - - - - - - 130
Ford F-350 Crew Cab - - - - 45 - - - - - - - 45
Ford F-750 Flat Bed - - - - - - 90 - - - - - 90
Ford F-750 Dump - - - - 90 - - - - - - - 90
Dodge 2500 4x4 Pickup 35 29 35 - - - - - - - - 40 75
Ford F-450 Crew Cab 65 63 40 - - - - - - - - 75 115
Ford F-550 Bucket Truck - - - - - 100 - - - - - - 100
Dodge 4x4 Ram Pick-Up 40 33 - - - - - - - - - - -
Dodge 1500 Pickup - - 30 - - - - - - - - - 30
Ford F-150 - - - - - 30 - - - - - - 30
Ford F-250 40 30 - - 40 - - - - - - - 40
Ford F-350 - - - - - - 45 - - - - - 45
John Deere 4x4 Tractor - - 40 30 - - - - - - - - 70
John Deere 4500 Tractor - - 60 - - - - - - - - - 60
John Deere 710K Backhoe - - - - - - - - - 200 - - 200
Kubota M4900 Tractor - - - - 100 - - - - - - - 100
Kubota M5400 Tractor - - - - 40 - - - - - - - 40
Ford F-450 - - - 70 - - - - - - - - 70
TOTAL PUBLIC SVCS. 220 198 205 100 445 130 135 - - 200 130 245 1,590
FIRE:
Ford Expedition - - - - - 50 45 - - - - - 95
Ford F-350 60 65 - - - - - - - - - - -
Chevy Tahoe - - - - 50 - - - 55 - - - 105
Ford F-350 Crew Cab - - - - - - - - - 70 - - 70
Ford Explorer - - - - 90 - - - - - - - 90
Ford F-350 4x4 Crew Cab Pickup - - - - 60 - - - - - - - 60
TOTAL FIRE 60 65 - - 200 50 45 - 55 70 - - 420
PARKS AND RECREATION:
Ford Transit Connect - - - - - - - - 30 - - - 30
Ford Escape - - - - 30 - - - - 32 - - 62
Ford F-150 - - - - - - 32 - - - - - 32
Ford Ranger 30 26 - - - - - - - - - - -
Dodge Journey 30 27 - - - - - - - - - - -
TOTAL PARKS AND REC. 60 53 - - 30 - 32 - 30 32 - - 124
POLICE:
Police Fleet - Chevy Tahoes - (4) 255 285 179 84 - 84 86 130 90 180 190 90 1,113
Police Fleet - Impala 35 35 - - - 35 - - 35 - - - 70
Police Fleet - Ford Crown Vic - - 35 - 42 42 42 42 - - - - 203
Police Fleet - Ford F-350 4x4 Crewcab - - - - - - 50 - - - - - 50
Police Fleet - Ford Fusion Hybrid - - - 140 35 - - - 35 - 35 - 245
Police Fleet - 4x4 Ford Expedition 42 42 - - - - - - - - 45 - 45
Police Fleet - Ford Fusion - - - - - - 44 - - 45 35 - 124
Police Fleet - Ford Explorer (5) 119 119 226 168 126 126 264 176 135 225 180 135 1,761
Police Fleet - Ford F-250 - - - - - - - - - - 40 - 40
Police Fleet - Chevrolet Malibu - - 35 - - - - - - - - - 35
Police Fleet - Chevrolet Camaro - - 35 - - - - 35 - - - - 70
TOTAL POLICE 451 481 510 392 203 287 486 383 295 450 525 225 3,756
TOTAL AUTOS & TRUCKS 821 826 780 492 918 527 850 418 415 824 751 502 6,477
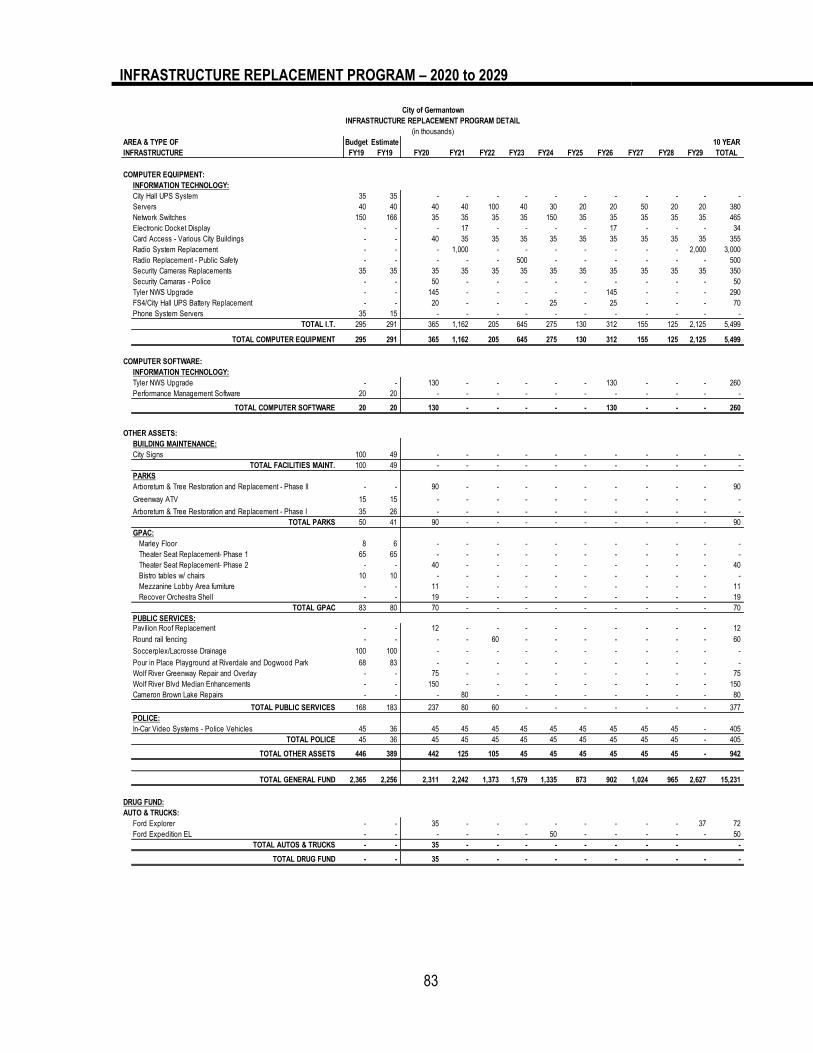
INFRASTRUCTURE REPLACEMENT PROGRAM – 2020 to 2029
83
City of Germantown
INFRASTRUCTURE REPLACEMENT PROGRAM DETAIL
(in thousands)
AREA & TYPE OF Budget Estimate 10 YEAR
INFRASTRUCTURE FY19 FY19 FY20 FY21 FY22 FY23 FY24 FY25 FY26 FY27 FY28 FY29 TOTAL
COMPUTER EQUIPMENT:
INFORMATION TECHNOLOGY:
City Hall UPS System 35 35 - - - - - - - - - - -
Servers 40 40 40 40 100 40 30 20 20 50 20 20 380
Network Switches 150 166 35 35 35 35 150 35 35 35 35 35 465
Electronic Docket Display - - - 17 - - - - 17 - - - 34
Card Access - Various City Buildings - - 40 35 35 35 35 35 35 35 35 35 355
Radio System Replacement - - - 1,000 - - - - - - - 2,000 3,000
Radio Replacement - Public Safety - - - - - 500 - - - - - - 500
Security Cameras Replacements 35 35 35 35 35 35 35 35 35 35 35 35 350
Security Camaras - Police - - 50 - - - - - - - - - 50
Tyler NWS Upgrade - - 145 - - - - - 145 - - - 290
FS4/City Hall UPS Battery Replacement - - 20 - - - 25 - 25 - - - 70
Phone System Servers 35 15 - - - - - - - - - - -
TOTAL I.T. 295 291 365 1,162 205 645 275 130 312 155 125 2,125 5,499
TOTAL COMPUTER EQUIPMENT 295 291 365 1,162 205 645 275 130 312 155 125 2,125 5,499
COMPUTER SOFTWARE:
INFORMATION TECHNOLOGY:
Tyler NWS Upgrade - - 130 - - - - - 130 - - - 260
Performance Management Software 20 20 - - - - - - - - - - -
TOTAL COMPUTER SOFTWARE 20 20 130 - - - - - 130 - - - 260
OTHER ASSETS:
BUILDING MAINTENANCE:
City Signs 100 49 - - - - - - - - - - -
TOTAL FACILITIES MAINT. 100 49 - - - - - - - - - - -
PARKS
Arboretum & Tree Restoration and Replacement - Phase ll - - 90 - - - - - - - - - 90
Greenway ATV 15 15 - - - - - - - - - - -
Arboretum & Tree Restoration and Replacement - Phase l 35 26 - - - - - - - - - - -
TOTAL PARKS 50 41 90 - - - - - - - - - 90
GPAC:
Marley Floor 8 6 - - - - - - - - - - -
Theater Seat Replacement- Phase 1 65 65 - - - - - - - - - - -
Theater Seat Replacement- Phase 2 - - 40 - - - - - - - - - 40
Bistro tables w/ chairs 10 10 - - - - - - - - - - -
Mezzanine Lobby Area furniture - - 11 - - - - - - - - - 11
Recover Orchestra Shell - - 19 - - - - - - - - - 19
TOTAL GPAC 83 80 70 - - - - - - - - - 70
PUBLIC SERVICES:
Pavilion Roof Replacement - - 12 - - - - - - - - - 12
Round rail fencing - - - - 60 - - - - - - - 60
Soccerplex/Lacrosse Drainage 100 100 - - - - - - - - - - -
Pour in Place Playground at Riverdale and Dogwood Park 68 83 - - - - - - - - - - -
Wolf River Greenway Repair and Overlay - - 75 - - - - - - - - - 75
Wolf River Blvd Median Enhancements - - 150 - - - - - - - - - 150
Cameron Brown Lake Repairs - - - 80 - - - - - - - - 80
TOTAL PUBLIC SERVICES 168 183 237 80 60 - - - - - - - 377
POLICE:
In-Car Video Systems - Police Vehicles 45 36 45 45 45 45 45 45 45 45 45 - 405
TOTAL POLICE 45 36 45 45 45 45 45 45 45 45 45 - 405
TOTAL OTHER ASSETS 446 389 442 125 105 45 45 45 45 45 45 - 942
TOTAL GENERAL FUND 2,365 2,256 2,311 2,242 1,373 1,579 1,335 873 902 1,024 965 2,627 15,231
DRUG FUND:
AUTO & TRUCKS:
Ford Explorer - - 35 - - - - - - - - 37 72
Ford Expedition EL - - - - - - 50 - - - - - 50
TOTAL AUTOS & TRUCKS - - 35 - - - - - - - - -
TOTAL DRUG FUND - - 35 - - - - - - - - - -

INFRASTRUCTURE REPLACEMENT PROGRAM – 2020 to 2029
84
City of Germantown
INFRASTRUCTURE REPLACEMENT PROGRAM DETAIL
(in thousands)
AREA & TYPE OF Budget Estimate 10 YEAR
INFRASTRUCTURE FY19 FY19 FY20 FY21 FY22 FY23 FY24 FY25 FY26 FY27 FY28 FY29 TOTAL
RECREATION FUND:
OTHER ASSETS:
Baseball and Soccer/Lacrosse Park Bleachers Replacement (10) 10 10 - - - - - - - - - - -
Bob Hailey Dugout Roof Replacement - - - 50 - - - - - - - - 50
Sports Lighting & Control Upgrades - - - - - - - - - - - - -
TOTAL OTHER ASSETS 10 10 - 50 - - - - - - - - 50
FURNITURE:
Office and Conference Room Furniture 12 12 - - - - - - - - - - -
TOTAL FURNITURE 12 12 - - - - - - - - - - -
OTHER IMPROVEMENTS:
Tennis Court Resurfacing (10) 49 42 90 - - - - - - - - - 90
Tennis Court Fence Renovation - Municipal Park - - 80 - - - - - - - - - 80
TOTAL OTHER IMPROVEMENTS 49 42 170 - - - - - - - - - 170
AUTO & TRUCKS
Ford Transit Connect 35 32 - - - - - - - - - - 0
TOTAL AUTOS & TRUCKS 35 32 - - - - - - - - - - 0
TOTAL RECREATION FUND 106 96 170 50 - - - - - - - - 50
STORMWATER FUND:
MAINTENANCE EQUIPMENT:
ODB Leaf Vac - - - - 65 - - - - - - - 65
Bobcat E35 Excavator - - - - - - - - - - 75 - 75 ODB Debris Vac - - - - - - - - - - - 70 70
TOTAL MAINTENANCE EQUIPMENT - - - - 65 - - - - - 75 70 210
OTHER ASSETS:
CIPP 75 75 50 50 50 50 50 75 75 75 75 75 625
TOTAL OTHER ASSETS 75 75 50 50 50 50 50 75 75 75 75 75 625
AUTO & TRUCKS:
Ford F-450 Truck - - 70 - 65 - - - - - - - 135
TOTAL AUTOS & TRUCKS - - 70 - 65 - - - - - - - 135
TOTAL STORMWATER FUND 75 75 120 50 180 50 50 75 75 75 150 145 970
GREAT HALL FUND:
BUILDING IMPROVEMENTS:
Carpet Replacement 59 73 - - - - - - - - - - -
Portable Walls - - - 150 - - - - - - - - 150
TOTAL BUILDING IMPROVEMENTS 59 73 - 150 - - - - - - - - 150
TOTAL GREAT HALL FUND 59 73 - 150 - - - - - - - - -
LINES, WELLS AND STATION IMPROVEMENTS:
SEWER:
Maintenance of Sewer Collection System 265 265 265 300 300 300 300 300 300 300 300 - 2,665
TOTAL SEWER 265 265 265 300 300 300 300 300 300 300 300 - 2,665
WATER:
Water Tower Maintenance 100 100 - - - - - - - - - - -
Well and Pump Rehab - - 60 - - - - - - - - - 60
Water Mains Maintenance 100 125 100 100 100 100 100 100 100 100 100 - 900 Maintenance of Water WellField System 20 50 20 50 50 50 50 50 50 50 50 - 420
TOTAL WATER 220 275 180 150 150 150 150 150 150 150 150 - 1,320
TOTAL LINES, WELLS & STATION IMPROVEMENTS 485 540 445 450 450 450 450 450 450 450 450 - 3,985
MAINTENANCE EQUIPMENT:
SEWER:
Sanitary Sewer Flo Meters - - - 100 - - - - - - - - 100
TOTAL SEWER - - - 100 - - - - - - - - 100
WATER:
Water Tower Maintenance 100 100 - - - - - - - - - - -
Gradall Excavator 3100 - - - - 250 - - - - - - - 250
Gradall XL4100 - - - - - - - - 450 - - - 450
Cat 308E Trackhoe - - - - - - - - - - 140 - 140
TOTAL WATER 100 100 - - 250 - - - 450 - 140 - 840
TOTAL MAINTENANCE EQUIPMENT 100 100 - 100 250 - - - 450 - 140 - 940

INFRASTRUCTURE REPLACEMENT PROGRAM – 2020 to 2029
85
City of Germantown
INFRASTRUCTURE REPLACEMENT PROGRAM DETAIL
(in thousands)
AREA & TYPE OF Budget Estimate 10 YEAR
INFRASTRUCTURE FY19 FY19 FY20 FY21 FY22 FY23 FY24 FY25 FY26 FY27 FY28 FY29 TOTAL
AUTOS AND TRUCKS:
SEWER:
International Sewer/Vacuum Truck - - - - - - - 300 - - - - 300
Ford F-750 Sewer Flush Truck - - 280 - - - - - - - - - 280
Ford F-350 - - - - - - - - - - - - -
Ford F-450 Service Truck w/crane & Chevy 3500 Truck - - - - - - - - - - - - -
TOTAL SEWER - - 280 - - - - 300 - - - - 580
WATER:
Ford F-350 70 59 - - - - - - - - - 85 85
Dodge Dakota - - 60 - - - - - - - 60 - 120
Ford F-150 Truck - - 35 - - 67 32 - 35 - - - 169
International Dump Truck - - - - - - - 120 - - - - 120
Ford Transit Connect - - 30 - - - - - 30 - - - 60
Ford Ranger - - - 30 - - 30 - - - - - 60
TOTAL WATER 70 59 125 30 - 67 62 120 65 - 60 85 614
TOTAL AUTOS & TRUCKS 70 59 405 30 - 67 62 420 65 - 60 85 1,194
TOTAL UTILITY FUND 655 699 850 580 700 517 512 870 965 450 650 85 6,119
GERMANTOWN ATHLETIC CLUB:
OTHER ASSETS:
GAC Skylight Repairs - - 75 - - - - - - - - 75
Alarm System - - 100 - - - - - - - - 100
Resurface Hot Tub - - 25 - - - - - - - - - -
GAC & GPAC Cooling Tower Replacement 125 165 - - - - - - - - - -
OTHER ASSETS 125 165 200 - - - - - - - - - 175
TOTAL G'TOWN ATHLETIC CLUB 125 165 200 - - - - - - - - - 175
PICKERING
Window Replacement - - 15 - - - - - - - - - 15
Lighting and Ceiling Tiles - - 15 - - - - - - - - - 15
Cabinets 40 40 - - - - - - - - - - -
Controlled Access 23 23 - - - - - - - - - - -
BUILDING IMPROVEMENTS 63 63 30 - - - - - - - - - 30
TOTAL PICKERING 63 23 30 - - - - - - - - - 30
VEHICLE MAINTENANCE FUND:
AUTOS AND TRUCKS:
Ford F250 - - - - - - - - - - 40 - 40
Ford Fusion - - 30 - - - - - - - 35 - 65
Dodge Charger 30 19 - - - - - - 30 - - - 30
Dodge Avenger - - - - - 32 - - - - - - 32
Ford Explorer - - - - 40 - - - - - 42 - 82
Pool Vehicle - - 30 - - - - - - - - 30
TOTAL AUTOS & TRUCKS 30 19 60 - 40 32 - - 30 - 117 - 279
Maintenance Equipment
Fuel Transport Trailer 16 15 - - - - - - - - - - -
Prolink Diagnostic Tool - 9 - - - - - - - - - - -
TOTAL OTHER ASSETS 16 24 - - - - - - - - - - -
TOTAL VEHICLE MAINT. FUND 46 43 60 - 40 32 - - 30 - 117 - 279
The Farm
OTHER ASSETS:
Tractor and Agricultural Implements 20 - - - - - - - - - - - -
Farm Park Entrance Sign (Cross Country) - - - - - - - - - - - - -
Farm Park Storage Shed - - - - - - - - - - - - -
TOTAL OTHER ASSETS 20 - - - - - - - - - - - -
TOTAL FARM 20 - - - - - - - - - - - -
Ambulance
OTHER ASSETS:
EMS Training Mannequin INSERT NEW IRP HERE- - - - - - - - - - - - -
TOTAL OTHER ASSETS - - - - - - - - - - - - -
AUTOS AND TRUCKS:
Ambulance INSERT NEW IRP HERE- - - - - - - - - - - - -
Chevrolet Tahoe - - 50 - - - - - - - - - 50
TOTAL AUTOS AND TRUCKS - - 50 - - - - - - - - - 50
TOTAL AMBULANCE - - 50 - - - - - - - - - 50
GRAND TOTAL - ALL FUNDS 3,514 3,430 3,826 3,072 2,293 2,178 1,897 1,818 1,972 1,549 1,882 2,857 22,904

DISCUSSION OF GENERAL FUND RESERVES
86
During the City's high growth period, excess revenues over expenditures were used for capital projects not funded by bond proceeds. In the past several years, General Fund reserves were used to fund a significant portion of the capital projects. Beginning in FY04, revenues from the Hall Income and Excise Tax were earmarked to fund capital projects due to the uncertainty of this revenue source for operational funding. Beginning in 2017, the State began phasing out the Hall Income and Excise Tax with total elimination by 2022. The drawdown of reserves, including Hall, for the five-year planning period is as follows.
FY19 FY20 FY21 FY22 FY23 FY24 CIP $ 6,000,000 4,600,000 4,723,000 4,650,000 4,420,000 2,150,000
Actual Estimated Budget Projected
FY18 FY19 FY20 FY21 FY22 FY23 FY24
Nonspendable 315,646$ 200,000 65,000 65,000 65,000 65,000 65,000
Restricted:
Committed Emergencies & Catastrophes 900,000 900,000 900,000 900,000 900,000 900,000 900,000
Committed Capital Asset Repl. Infrastructure 2,365,000 q 2,310,500 2,242,000 1,373,000 1,579,000 1,335,000 873,000
Committed Tax Anticipation 10,752,156 11,289,050 11,367,680 11,489,812 11,670,744 11,910,263 12,148,468
Committed General Debt 4,418,520 5,021,914 5,335,396 5,239,808 5,231,829 5,237,595 5,231,796
Committed Contingencies 50,000 50,000 50,000 50,000 50,000 50,000 50,000
Assigned 2,432,724 2,587,307 2,730,467 2,885,079 2,854,250 3,034,590 3,156,319
Unassigned 19,491,124 16,351,920 11,787,488 7,761,490 2,927,661 (2,294,060) (4,942,217)
Total Fund Balance 40,725,170 38,710,691 34,478,031 29,764,189 25,278,484 20,238,387 17,482,366
Operating Expenditures 48,001,873$ 55,279,729 58,933,129 59,746,123 59,974,958 61,204,781 62,289,517
Fund Balance as % of Expenditures 85% 70% 59% 50% 42% 33% 28%
The chart at the right illustrates the impact of the draw downs on the City’s General Fund fund balance:
FUND BALANCE % TOTAL EXPENDITURES ANALYSIS OF FUND BALANCE
68%
85%
70%
59% 50%
42%
33% 28%
0%
10%
20%
30%
40%
50%
60%
70%
80%
FY17 FY18 FY19 FY20 FY21 FY22 FY23 FY24

ALL FUNDS BUDGET PROJECTION SUMMARY
87
The two charts below illustrate revenues and expenses for all major funds. The section following these charts consist of budget projection summaries of revenues and expenditures by major categories, along with fund balances as of June 30, for the fiscal years 2017-2024. The graphs illustrate 8 years of information. This data is provided for the General Fund, Utility Fund, Germantown Athletic Club Fund, Great Hall Fund, Solid Waste Fund, Stormwater Management Fund, Special Revenue Funds, Internal Service Funds, Pension, OPEB, Health Fund and Cash Balance Funds.
Following the budget projection summaries is a description of personnel costs with a comparison of staffing levels between FY19 and FY20.
$- $5,000
$10,000 $15,000 $20,000 $25,000 $30,000 $35,000 $40,000 $45,000 $50,000 $55,000 $60,000 $65,000 $70,000
General Fund Utility Fund Germantown
Athletic Club
Fund
Great Hall
Fund
Solid Waste
Fund
Special
Revenue
Funds
Stormwater
Management
Fund
$ ThousandsALL FUNDSREVENUES
$- $5,000
$10,000 $15,000 $20,000 $25,000 $30,000 $35,000 $40,000 $45,000 $50,000 $55,000 $60,000 $65,000 $70,000 $75,000
General Fund Utility Fund Germantown
Athletic Club
Fund
Great Hall
Fund
Solid Waste
Fund
Special
Revenue
Funds
Stormwater
Management
Fund
$ Thousands ALL FUNDSEXPENSES

GENERAL FUND BUDGET PROJECTION SUMMARY
88
GENERAL FUND REVENUES
GENERAL FUND EXPENDITURES
0
10
20
30
40
50
60
70
FY17 FY18 FY19 FY20 FY21 FY22 FY23 FY24
Property Taxes Sales Taxes Federal and State Revenues Other Revenues Investment Income Transfers In
0
10
20
30
40
50
60
70
FY17 FY18 FY19 FY20 FY21 FY22 FY23 FY24
Operating Expenses Debt Service Operating Transfers
$ Millions
$ Millions

GENERAL FUND BUDGET PROJECTION SUMMARY
89
($000) Actual Actual Budget Estimate Budget Projected
FY17 FY18 FY19 FY19 FY20 FY21 FY22 FY23 FY24
GENERAL REVENUES:
Auto Registration 886$ 1,161 1,150 1,210 1,250 1,275 1,301 1,327 1,353
Court Fines 990 1,103 1,191 1,265 1,100 1,115 1,125 1,151 1,177
Franchise Fees 781 755 850 740 775 775 798 822 847
Grants 271 167 200 150 470 470 470 470 470
Interest 203 653 200 595 200 200 202 206 210
Licenses 269 255 246 293 257 257 259 266 273
Other Income 1,388 1,177 1,057 1,325 1,345 1,070 1,307 1,317 1,323
Property Taxes 29,415 33,685 32,855 33,588 33,867 34,103 34,469 35,012 35,731
Sales Taxes 12,007 13,261 13,265 14,251 14,560 15,046 15,266 15,566 15,793
State Taxes 6,526 5,909 5,477 5,486 5,065 5,133 4,630 4,137 4,195
Transfers In - - 100 362 412 311 312 311 312
Funds From Prior Periods - - 450 450 450 450 450 450 450
REVENUE TOTAL 52,737 58,126 57,041 59,715 59,750 60,205 60,589 61,035 62,133
EXPENDITURE BY CATEGORY:
Personnel 28,107 29,743 32,115 32,385 33,900 34,839 35,838 36,858 37,974
Communication 321 338 384 373 404 393 396 400 404
Prof. Fees 2,726 2,511 2,635 2,809 2,871 2,962 3,045 3,073 3,124
Other Maint. 2,157 2,084 2,618 2,726 2,739 2,772 2,805 2,853 2,891
Supplies 1,371 1,312 1,698 1,640 1,825 1,766 1,798 1,834 1,871
Insurance 71 39 100 88 120 120 120 120 120
Rent 71 72 93 101 99 99 99 99 99
Allocations 1,404 1,376 1,519 1,438 1,469 1,498 1,546 1,599 1,651
Capital Outlay 1,744 1,194 2,365 2,259 2,311 2,242 1,373 1,579 1,335
Contingency - - 50 50 50 50 50 50 50
Grants 1,651 1,653 1,704 1,655 1,757 1,742 1,766 1,793 1,821
Debt Service 3,852 3,441 4,419 4,680 5,022 5,335 5,240 5,232 5,238
Operating Transfers 4,716 4,305 4,967 5,042 6,282 5,932 5,909 5,731 5,734
Expense Reimburs. (979) (1,047) (1,013) (1,013) (1,083) (1,107) (1,135) (1,163) (1,192)
Roll Fwd. Enc. - Prior Yr. - - 450 450 450 450 450 450 450
Roll Fwd. Enc. - Next Yr. - - (450) (450) (450) (450) (450) (450) (450)
Utilities 993 982 1,067 1,045 1,167 1,104 1,125 1,147 1,170
EXPENDITURE TOTAL 48,205 48,002 54,721 55,280 58,933 59,746 59,975 61,205 62,290
Excess (Deficit) 4,532 10,124 2,320 4,436 817 459 614 (170) (156)
FUND BALANCE
Beginning 31,858 32,601 37,456 40,275 38,261 34,028 29,314 24,828 19,788
Transf. to CIP (3,789) (2,000) (1,620) (1,620) - - - - -
CIP Res Inc (Dec) - - (4,380) (4,380) (4,600) (4,723) (4,650) (4,420) (2,150)
Ending 32,601$ 40,725 33,776 38,711 34,478 29,764 25,279 20,238 17,482

UTILITY FUND BUDGET PROJECTION SUMMARY
90
UTILITY REVENUES
UTILITY EXPENSES
0
2
4
6
8
10
FY17 FY18 FY19 FY20 FY21 FY22 FY23 FY24
Water Sales Sewer Fees Other Developer Contributions
0
2
4
6
8
10
FY17 FY18 FY19 FY20 FY21 FY22 FY23 FY24
Water Sewer Sewage Treatment Debt Service
$ Millions
$ Millions

UTILITY FUND BUDGET PROJECTION SUMMARY
91
($000) Actual Actual Budget Estimate Budget Projected
FY17 FY18 FY19 FY19 FY20 FY21 FY22 FY23 FY24
REVENUES:
Allocations -$ (0) - (0) - - - - -
Installation Charges 170 255 167 101 167 170 172 173 174
Interest 39 137 67 200 67 45 47 50 52
Contrib. Developers 41 229 175 125 120 132 158 163 166
Other Income 48 54 40 7 35 36 36 37 38
Sewer Fees 3,280 3,160 3,200 3,035 3,200 3,232 3,264 3,297 3,330
Water Sales 5,469 5,155 5,427 5,077 5,230 5,335 5,443 5,551 5,661
TOTAL REVENUES 9,046 8,991 9,076 8,543 8,819 8,950 9,121 9,271 9,422
EXPENSES BY CATEGORY:
Allocations 1,133 1,225 1,200 1,195 1,272 1,289 1,328 1,369 1,411
Communication 76 68 84 92 96 98 100 103 105
Debt Service 69 27 12 12 - 43 96 91 86
Depreciation 1,751 1,779 1,786 1,821 1,835 1,847 1,850 1,953 1,968
Other Maintenance 69 89 105 95 155 159 163 167 171
Personnel 1,444 1,714 1,728 1,644 1,640 1,680 1,731 1,782 1,836
Professional Fees 90 109 135 145 237 242 242 244 244
Rents - - - - - - - - -
Insurance 2 5 11 8 11 11 12 12 12
Mains Maintenance 142 150 155 147 155 159 163 167 172
Contract Services 1,380 1,481 1,572 1,434 1,520 1,556 1,592 1,628 1,664
Supplies 147 148 218 206 218 224 230 236 242
Utilities 610 633 646 618 654 662 676 689 703
PILOT 474 495 508 482 482 497 512 527 543
TOTAL EXPENSES 7,387 7,922 8,160 7,900 8,275 8,466 8,692 8,968 9,157
NET INCOME (LOSS) 1,659 1,068 916 645 544 483 429 303 265
TOTAL NET POSITION
Effect of change in accounting principle - (73) - - - - - - -
Beginning 48,274 49,861 50,892 50,929 51,573 52,117 52,600 53,029 53,332
Ending 49,933$ 50,929 51,808 51,573 52,117 52,600 53,029 53,332 53,597
Capital Outlay 236$ 779 4,113 4,271 4,791 1,215 2,300 2,917 512

GERMANTOWN ATHLETIC CLUB FUND BUDGET PROJECTION SUMMARY
92
GERMANTOWN ATHLETIC CLUB REVENUES
GERMANTOWN ATHLETIC CLUB EXPENSES
0
1
2
3
4
5
FY17 FY18 FY19 FY20 FY21 FY22 FY23 FY24
Recreation Aquatics Personal Training Concession Transfer In
0
1
2
3
4
FY17 FY18 FY19 FY20 FY21 FY22 FY23 FY24
Recreation Aquatics Personal Training Debt Service
$ Millions
$ Millions

GERMANTOWN ATHLETIC CLUB FUND BUDGET PROJECTION SUMMARY
93
($000) Actual Actual Budget Estimated Budget Projected
FY17 FY18 FY19 FY19 FY20 FY21 FY22 FY23 FY24
REVENUES:
Centre Revenue 3,671$ 3,890 4,129 4,200 4,166 4,288 4,330 4,373 4,416
Aquatics Revenue 205 170 118 138 134 138 140 141 142
Personal Training 175 208 185 259 325 335 338 341 345
Concession Revenue 59 55 70 12 91 93 94 95 96
Transfer In 300 - - - - - - - -
TOTAL REVENUE 4,410 4,322 4,502 4,609 4,716 4,854 4,902 4,951 5,000
EXPENSES BY CATEGORY:
Allocations 89 96 102 103 106 108 110 112 114
Communication - 7 9 15 21 21 21 21 21
Debt Service 16 12 8 8 5 2 - - -
Other Maint. 117 178 184 153 177 181 184 188 193
Personnel 1,758 1,718 1,792 1,724 1,804 1,853 1,915 1,981 2,050
Professional Fees 436 436 483 522 540 550 561 572 583
Rents 162 240 240 239 240 245 250 255 261
Supplies 163 183 238 202 265 265 270 276 282
Depreciation 559 624 625 622 643 693 693 693 693
Utilities 370 364 371 393 379 384 392 400 408
Transfer Out - 100 100 100 100 - - - -
TOTAL EXPENSES 3,670 3,957 4,152 4,082 4,279 4,302 4,396 4,499 4,605
EXCESS (DEFICIT) 740 365 350 526 437 552 506 452 395
TOTAL NET POSITION
Effect of change in accounting principle - (46) - - - - - - -
Beginning 15,930 16,670 16,921 16,989 17,515 17,952 18,504 19,010 19,462
Ending 16,670$ 16,989 17,271 17,515 17,952 18,504 19,010 19,462 19,857
Capital Outlay 2,504$ 1,333 1,100 1,615 290 - - - -

GREAT HALL FUND
BUDGET PROJECTION SUMMARY
94
GREAT HALL REVENUES
GREAT HALL EXPENSES
-
100
200
300
400
500
600
700
FY17 FY18 FY19 FY20 FY21 FY22 FY23 FY24
Rent - Nontaxable Business Rent - Taxable Business Catering
Other Revenue Interest Income Transfer In
-
100
200
300
400
500
600
700
FY17 FY18 FY19 FY20 FY21 FY22 FY23 FY24
Allocations Other Maint. Personnel Professional Fees
Supplies Util ities Rent Grants
Debt Service Depreciation
$ Thousands
$ Thousands

GREAT HALL FUND
BUDGET PROJECTION SUMMARY
95
($000) Actual Actual Budget Estimated Budget Projected
FY17 FY18 FY19 FY19 FY20 FY21 FY22 FY23 FY24
REVENUES:
Business Revenue 479$ 504 507 514 525 538 552 575 589
Transfer In 175 85 75 75 75 50 - - -
TOTAL REVENUES 654 589 582 589 600 588 552 575 589
EXPENSES BY CATEGORY:
Allocations 22 16 16 17 17 17 18 18 18
Communication 0 0 1 1 1 1 1 1 1
Debt Service 6 5 3 3 2 1 - - -
Other Maint. 64 63 75 70 74 75 77 79 80
Personnel 180 180 196 197 203 208 213 219 226
Professional Fees 47 35 43 29 29 30 30 31 31
Rents 93 94 95 95 97 97 98 98 98
Insurance - - - - - - - - -
Supplies 18 13 15 18 20 17 17 18 18
Depreciation 64 68 77 78 75 81 80 50 49
Grants 8 1 - - - - - - -
Utilities 42 41 39 44 44 44 45 46 47
TOTAL EXPENSES 543 516 561 551 562 571 579 559 569
EXCESS (DEFICIT) 111 73 21 38 38 17 (27) 16 20
TOTAL NET POSITION
Effect of change in accounting principle - (8) - - - - - - -
Beginning 650 760 778 825 863 902 919 891 907
Ending 760$ 825 799 863 902 919 891 907 927
Capital Outlay 42$ 49 59 73 - 150 35 - -
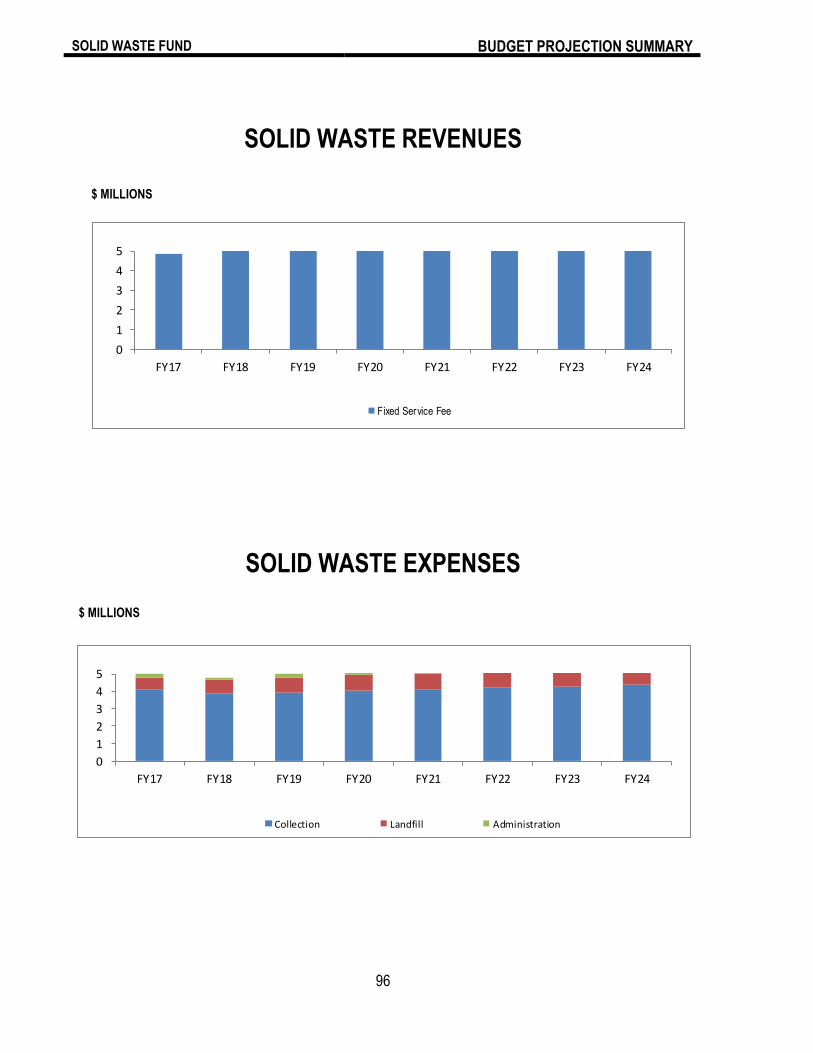
SOLID WASTE FUND F FUND
BUDGET PROJECTION SUMMARY
96
SOLID WASTE REVENUES
SOLID WASTE EXPENSES
0
1
2
3
4
5
FY17 FY18 FY19 FY20 FY21 FY22 FY23 FY24
Fixed Service Fee
0
1
2
3
4
5
FY17 FY18 FY19 FY20 FY21 FY22 FY23 FY24
Collection Landfill Administration
$ MILLIONS
$ MILLIONS
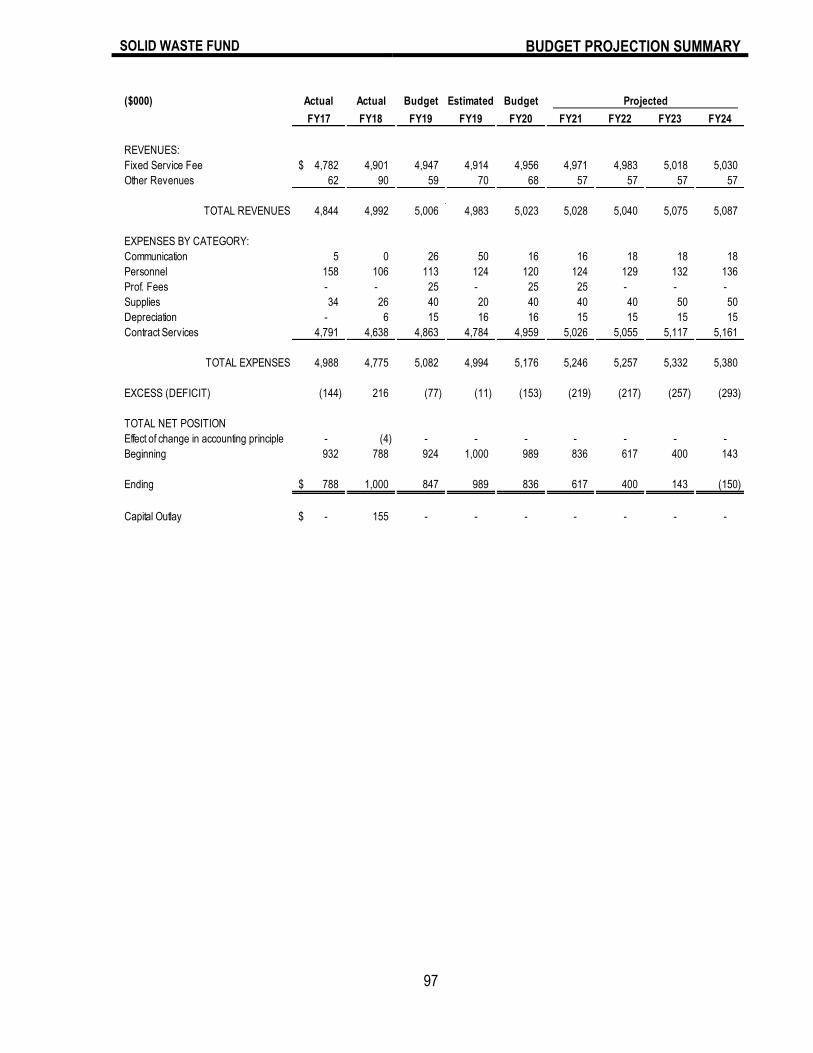
SOLID WASTE FUND F FUND
BUDGET PROJECTION SUMMARY
97
($000) Actual Actual Budget Estimated Budget Projected
FY17 FY18 FY19 FY19 FY20 FY21 FY22 FY23 FY24
REVENUES:
Fixed Service Fee 4,782$ 4,901 4,947 4,914 4,956 4,971 4,983 5,018 5,030
Other Revenues 62 90 59 70 68 57 57 57 57
TOTAL REVENUES 4,844 4,992 5,006 4,983 5,023 5,028 5,040 5,075 5,087
EXPENSES BY CATEGORY:
Communication 5 0 26 50 16 16 18 18 18
Personnel 158 106 113 124 120 124 129 132 136
Prof. Fees - - 25 - 25 25 - - -
Supplies 34 26 40 20 40 40 40 50 50
Depreciation - 6 15 16 16 15 15 15 15
Contract Services 4,791 4,638 4,863 4,784 4,959 5,026 5,055 5,117 5,161
TOTAL EXPENSES 4,988 4,775 5,082 4,994 5,176 5,246 5,257 5,332 5,380
EXCESS (DEFICIT) (144) 216 (77) (11) (153) (219) (217) (257) (293)
TOTAL NET POSITION
Effect of change in accounting principle - (4) - - - - - - -
Beginning 932 788 924 1,000 989 836 617 400 143
Ending 788$ 1,000 847 989 836 617 400 143 (150)
Capital Outlay -$ 155 - - - - - - -

STORMWATER MANAGEMENT FUND F FUND
BUDGET PROJECTION SUMMARY
98
STORMWATER MANAGEMENT REVENUES
STORMWATER MANAGEMENT EXPENSES
0
1
2
FY17 FY18 FY19 FY20 FY21 FY22 FY23 FY24
Stormwater Fee Other Revenues
0
1
2
FY17 FY18 FY19 FY20 FY21 FY22 FY23 FY24
Communication Other Maintenance Personnel Professional Fees
Supplies Roads and Mains Depreciation Allocations
$ MILLIONS
$ MILLIONS
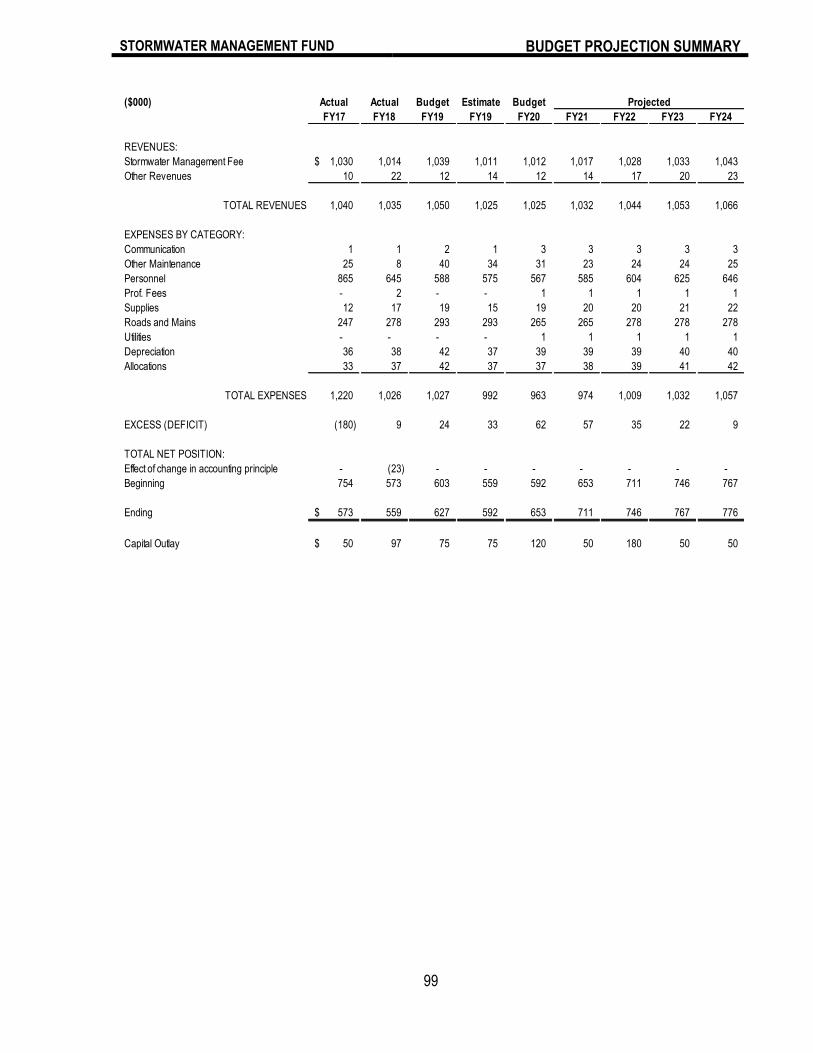
STORMWATER MANAGEMENT FUND F FUND
BUDGET PROJECTION SUMMARY
99
($000) Actual Actual Budget Estimate Budget Projected
FY17 FY18 FY19 FY19 FY20 FY21 FY22 FY23 FY24
REVENUES:
Stormwater Management Fee 1,030$ 1,014 1,039 1,011 1,012 1,017 1,028 1,033 1,043
Other Revenues 10 22 12 14 12 14 17 20 23
TOTAL REVENUES 1,040 1,035 1,050 1,025 1,025 1,032 1,044 1,053 1,066
EXPENSES BY CATEGORY:
Communication 1 1 2 1 3 3 3 3 3
Other Maintenance 25 8 40 34 31 23 24 24 25
Personnel 865 645 588 575 567 585 604 625 646
Prof. Fees - 2 - - 1 1 1 1 1
Supplies 12 17 19 15 19 20 20 21 22
Roads and Mains 247 278 293 293 265 265 278 278 278
Utilities - - - - 1 1 1 1 1
Depreciation 36 38 42 37 39 39 39 40 40
Allocations 33 37 42 37 37 38 39 41 42
TOTAL EXPENSES 1,220 1,026 1,027 992 963 974 1,009 1,032 1,057
EXCESS (DEFICIT) (180) 9 24 33 62 57 35 22 9
TOTAL NET POSITION:
Effect of change in accounting principle - (23) - - - - - - -
Beginning 754 573 603 559 592 653 711 746 767
Ending 573$ 559 627 592 653 711 746 767 776
Capital Outlay 50$ 97 75 75 120 50 180 50 50
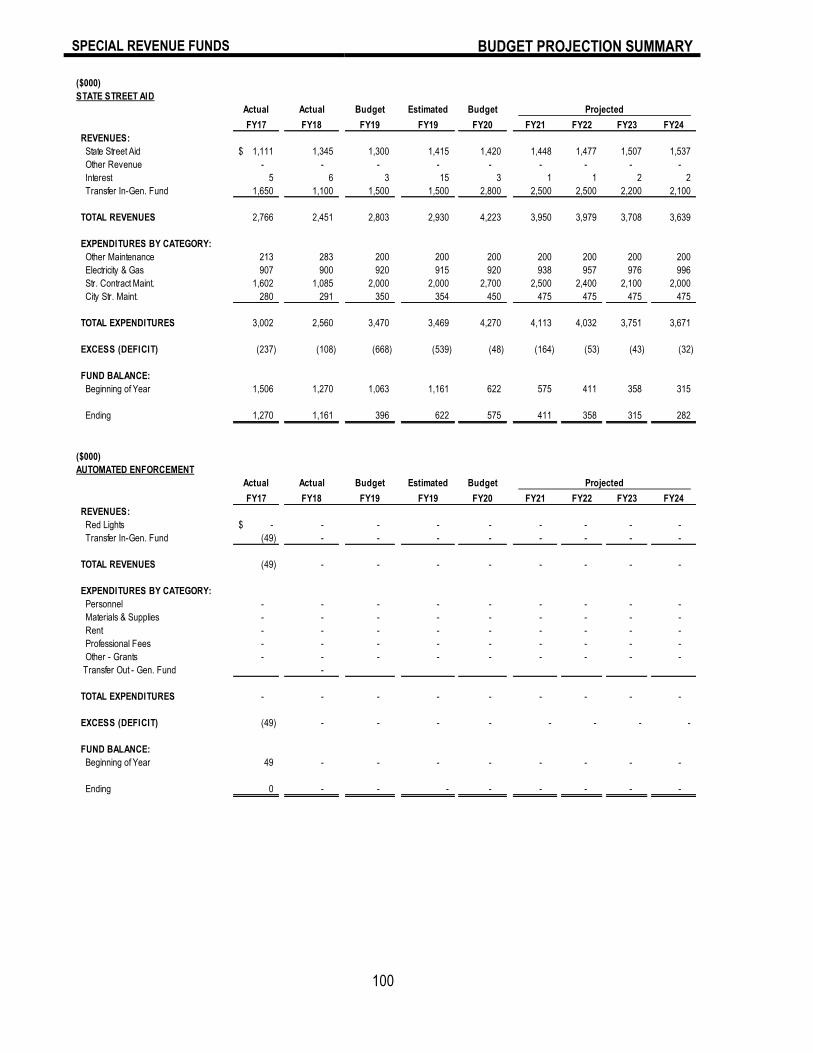
SPECIAL REVENUE FUNDS F FUND
BUDGET PROJECTION SUMMARY
100
($000)
STATE STREET AID
Actual Actual Budget Estimated Budget Projected
FY17 FY18 FY19 FY19 FY20 FY21 FY22 FY23 FY24
REVENUES:
State Street Aid 1,111$ 1,345 1,300 1,415 1,420 1,448 1,477 1,507 1,537
Other Revenue - - - - - - - - -
Interest 5 6 3 15 3 1 1 2 2
Transfer In-Gen. Fund 1,650 1,100 1,500 1,500 2,800 2,500 2,500 2,200 2,100
TOTAL REVENUES 2,766 2,451 2,803 2,930 4,223 3,950 3,979 3,708 3,639
EXPENDITURES BY CATEGORY:
Other Maintenance 213 283 200 200 200 200 200 200 200
Electricity & Gas 907 900 920 915 920 938 957 976 996
Str. Contract Maint. 1,602 1,085 2,000 2,000 2,700 2,500 2,400 2,100 2,000
City Str. Maint. 280 291 350 354 450 475 475 475 475
TOTAL EXPENDITURES 3,002 2,560 3,470 3,469 4,270 4,113 4,032 3,751 3,671
EXCESS (DEFICIT) (237) (108) (668) (539) (48) (164) (53) (43) (32)
FUND BALANCE:
Beginning of Year 1,506 1,270 1,063 1,161 622 575 411 358 315
Ending 1,270 1,161 396 622 575 411 358 315 282
($000)
AUTOMATED ENFORCEMENT
Actual Actual Budget Estimated Budget Projected
FY17 FY18 FY19 FY19 FY20 FY21 FY22 FY23 FY24
REVENUES:
Red Lights -$ - - - - - - - -
Transfer In-Gen. Fund (49) - - - - - - - -
TOTAL REVENUES (49) - - - - - - - -
EXPENDITURES BY CATEGORY:
Personnel - - - - - - - - -
Materials & Supplies - - - - - - - - -
Rent - - - - - - - - -
Professional Fees - - - - - - - - -
Other - Grants - - - - - - - - -
Transfer Out - Gen. Fund -
TOTAL EXPENDITURES - - - - - - - - -
EXCESS (DEFICIT) (49) - - - - - - - -
FUND BALANCE:
Beginning of Year 49 - - - - - - - -
Ending 0 - - - - - - - -
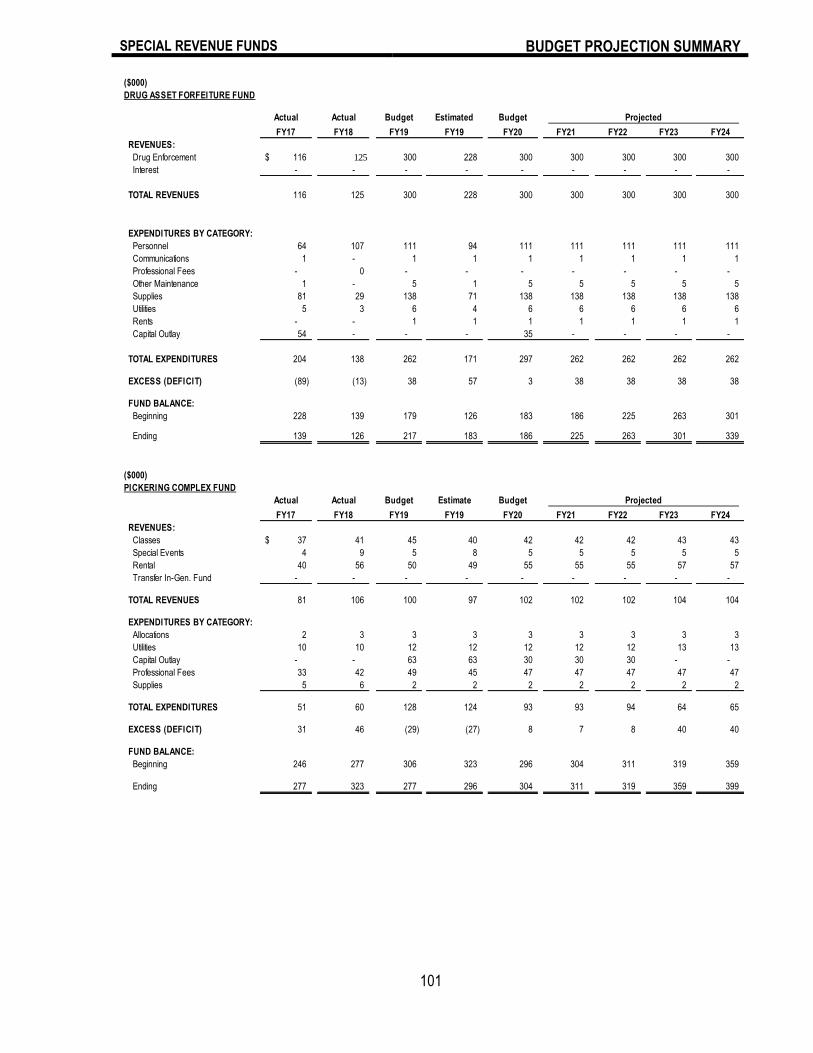
SPECIAL REVENUE FUNDS F FUND
BUDGET PROJECTION SUMMARY
101
($000)
DRUG ASSET FORFEITURE FUND
Actual Actual Budget Estimated Budget Projected
FY17 FY18 FY19 FY19 FY20 FY21 FY22 FY23 FY24
REVENUES:
Drug Enforcement 116$ 125 300 228 300 300 300 300 300
Interest - - - - - - - - -
TOTAL REVENUES 116 125 300 228 300 300 300 300 300
EXPENDITURES BY CATEGORY:
Personnel 64 107 111 94 111 111 111 111 111
Communications 1 - 1 1 1 1 1 1 1
Professional Fees - 0 - - - - - - -
Other Maintenance 1 - 5 1 5 5 5 5 5
Supplies 81 29 138 71 138 138 138 138 138
Utilities 5 3 6 4 6 6 6 6 6
Rents - - 1 1 1 1 1 1 1
Capital Outlay 54 - - - 35 - - - -
TOTAL EXPENDITURES 204 138 262 171 297 262 262 262 262
EXCESS (DEFICIT) (89) (13) 38 57 3 38 38 38 38
FUND BALANCE:
Beginning 228 139 179 126 183 186 225 263 301
Ending 139 126 217 183 186 225 263 301 339
($000)
PICKERING COMPLEX FUND
Actual Actual Budget Estimate Budget Projected
FY17 FY18 FY19 FY19 FY20 FY21 FY22 FY23 FY24
REVENUES:
Classes 37$ 41 45 40 42 42 42 43 43
Special Events 4 9 5 8 5 5 5 5 5
Rental 40 56 50 49 55 55 55 57 57
Transfer In-Gen. Fund - - - - - - - - -
TOTAL REVENUES 81 106 100 97 102 102 102 104 104
EXPENDITURES BY CATEGORY:
Allocations 2 3 3 3 3 3 3 3 3
Utilities 10 10 12 12 12 12 12 13 13
Capital Outlay - - 63 63 30 30 30 - -
Professional Fees 33 42 49 45 47 47 47 47 47
Supplies 5 6 2 2 2 2 2 2 2
TOTAL EXPENDITURES 51 60 128 124 93 93 94 64 65
EXCESS (DEFICIT) 31 46 (29) (27) 8 7 8 40 40
FUND BALANCE:
Beginning 246 277 306 323 296 304 311 319 359
Ending 277 323 277 296 304 311 319 359 399
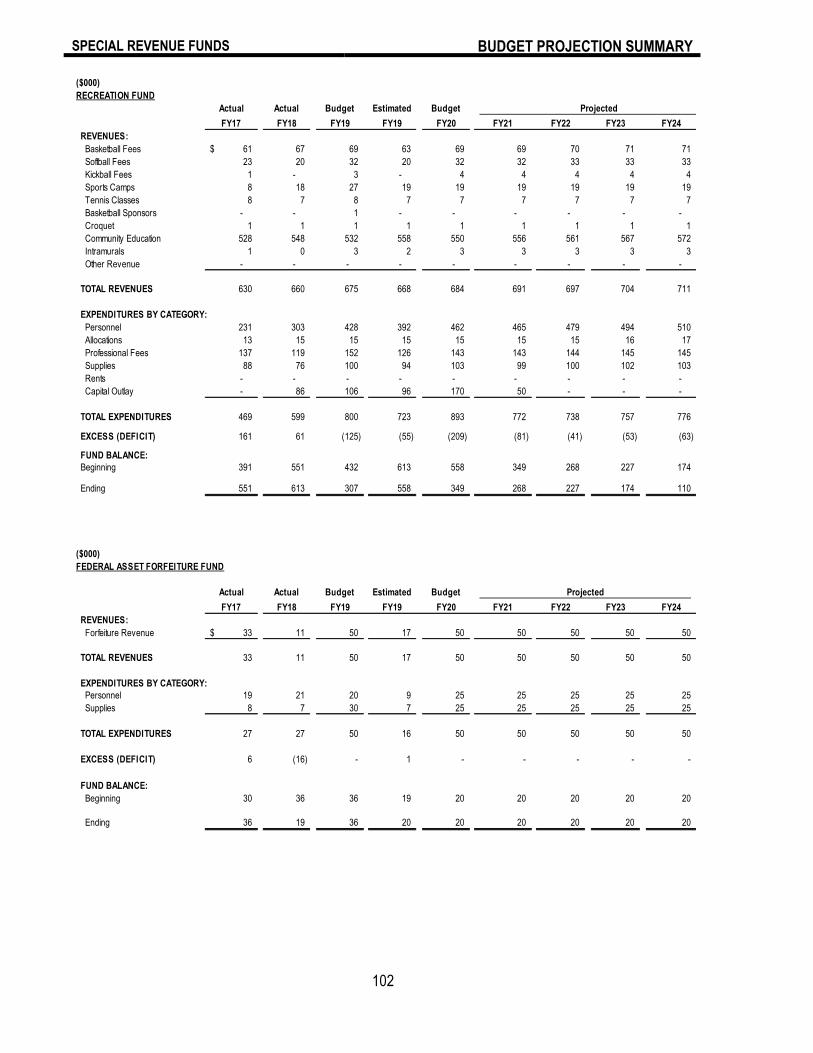
SPECIAL REVENUE FUNDS F FUND
BUDGET PROJECTION SUMMARY
102
($000)
RECREATION FUND
Actual Actual Budget Estimated Budget Projected
FY17 FY18 FY19 FY19 FY20 FY21 FY22 FY23 FY24
REVENUES:
Basketball Fees 61$ 67 69 63 69 69 70 71 71
Softball Fees 23 20 32 20 32 32 33 33 33
Kickball Fees 1 - 3 - 4 4 4 4 4
Sports Camps 8 18 27 19 19 19 19 19 19
Tennis Classes 8 7 8 7 7 7 7 7 7
Basketball Sponsors - - 1 - - - - - -
Croquet 1 1 1 1 1 1 1 1 1
Community Education 528 548 532 558 550 556 561 567 572
Intramurals 1 0 3 2 3 3 3 3 3
Other Revenue - - - - - - - - -
TOTAL REVENUES 630 660 675 668 684 691 697 704 711
EXPENDITURES BY CATEGORY:
Personnel 231 303 428 392 462 465 479 494 510
Allocations 13 15 15 15 15 15 15 16 17
Professional Fees 137 119 152 126 143 143 144 145 145
Supplies 88 76 100 94 103 99 100 102 103
Rents - - - - - - - - -
Capital Outlay - 86 106 96 170 50 - - -
TOTAL EXPENDITURES 469 599 800 723 893 772 738 757 776
EXCESS (DEFICIT) 161 61 (125) (55) (209) (81) (41) (53) (63)
FUND BALANCE:
Beginning 391 551 432 613 558 349 268 227 174
Ending 551 613 307 558 349 268 227 174 110
($000)
FEDERAL ASSET FORFEITURE FUND
Actual Actual Budget Estimated Budget Projected
FY17 FY18 FY19 FY19 FY20 FY21 FY22 FY23 FY24
REVENUES:
Forfeiture Revenue 33$ 11 50 17 50 50 50 50 50
TOTAL REVENUES 33 11 50 17 50 50 50 50 50
EXPENDITURES BY CATEGORY:
Personnel 19 21 20 9 25 25 25 25 25
Supplies 8 7 30 7 25 25 25 25 25
TOTAL EXPENDITURES 27 27 50 16 50 50 50 50 50
EXCESS (DEFICIT) 6 (16) - 1 - - - - -
FUND BALANCE:
Beginning 30 36 36 19 20 20 20 20 20
Ending 36 19 36 20 20 20 20 20 20
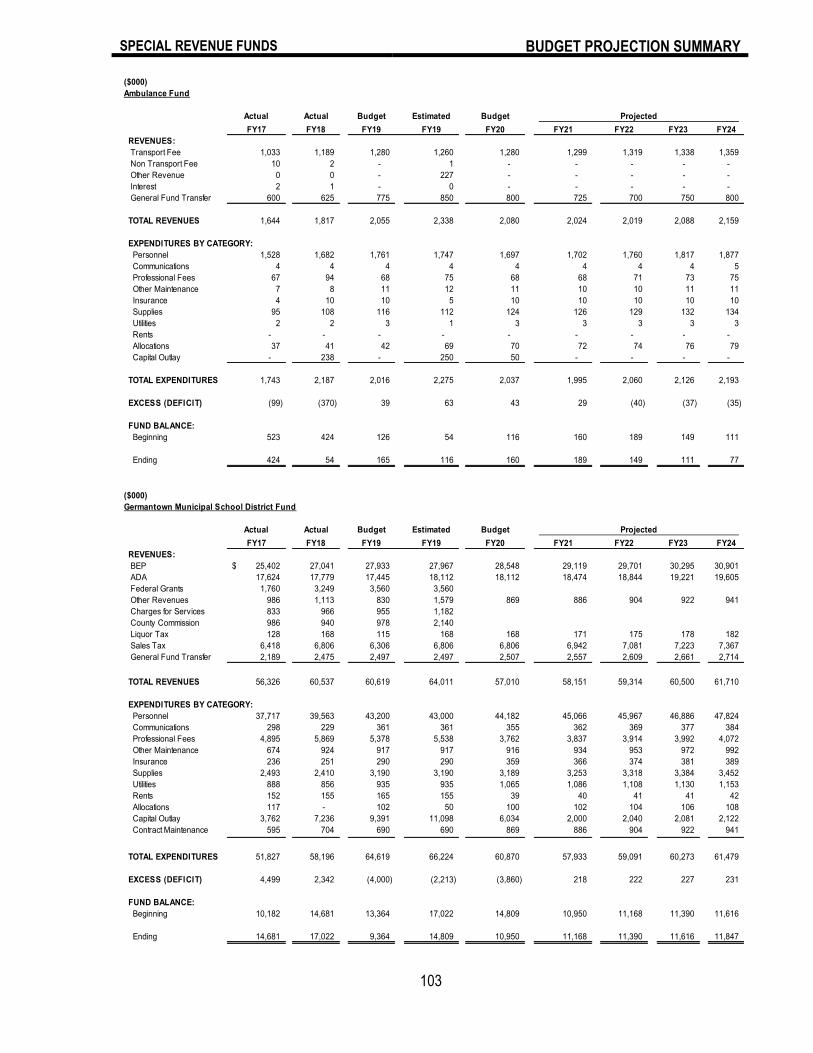
SPECIAL REVENUE FUNDS F FUND
BUDGET PROJECTION SUMMARY
103
($000)
Ambulance Fund
Actual Actual Budget Estimated Budget Projected
FY17 FY18 FY19 FY19 FY20 FY21 FY22 FY23 FY24
REVENUES:
Transport Fee 1,033 1,189 1,280 1,260 1,280 1,299 1,319 1,338 1,359
Non Transport Fee 10 2 - 1 - - - - -
Other Revenue 0 0 - 227 - - - - -
Interest 2 1 - 0 - - - - -
General Fund Transfer 600 625 775 850 800 725 700 750 800
TOTAL REVENUES 1,644 1,817 2,055 2,338 2,080 2,024 2,019 2,088 2,159
EXPENDITURES BY CATEGORY:
Personnel 1,528 1,682 1,761 1,747 1,697 1,702 1,760 1,817 1,877
Communications 4 4 4 4 4 4 4 4 5
Professional Fees 67 94 68 75 68 68 71 73 75
Other Maintenance 7 8 11 12 11 10 10 11 11
Insurance 4 10 10 5 10 10 10 10 10
Supplies 95 108 116 112 124 126 129 132 134
Utilities 2 2 3 1 3 3 3 3 3
Rents - - - - - - - - -
Allocations 37 41 42 69 70 72 74 76 79
Capital Outlay - 238 - 250 50 - - - -
TOTAL EXPENDITURES 1,743 2,187 2,016 2,275 2,037 1,995 2,060 2,126 2,193
EXCESS (DEFICIT) (99) (370) 39 63 43 29 (40) (37) (35)
FUND BALANCE:
Beginning 523 424 126 54 116 160 189 149 111
Ending 424 54 165 116 160 189 149 111 77
($000)
Germantown Municipal School District Fund
Actual Actual Budget Estimated Budget Projected
FY17 FY18 FY19 FY19 FY20 FY21 FY22 FY23 FY24
REVENUES:
BEP 25,402$ 27,041 27,933 27,967 28,548 29,119 29,701 30,295 30,901
ADA 17,624 17,779 17,445 18,112 18,112 18,474 18,844 19,221 19,605
Federal Grants 1,760 3,249 3,560 3,560
Other Revenues 986 1,113 830 1,579 869 886 904 922 941
Charges for Services 833 966 955 1,182
County Commission 986 940 978 2,140
Liquor Tax 128 168 115 168 168 171 175 178 182
Sales Tax 6,418 6,806 6,306 6,806 6,806 6,942 7,081 7,223 7,367
General Fund Transfer 2,189 2,475 2,497 2,497 2,507 2,557 2,609 2,661 2,714
TOTAL REVENUES 56,326 60,537 60,619 64,011 57,010 58,151 59,314 60,500 61,710
EXPENDITURES BY CATEGORY:
Personnel 37,717 39,563 43,200 43,000 44,182 45,066 45,967 46,886 47,824
Communications 298 229 361 361 355 362 369 377 384
Professional Fees 4,895 5,869 5,378 5,538 3,762 3,837 3,914 3,992 4,072
Other Maintenance 674 924 917 917 916 934 953 972 992
Insurance 236 251 290 290 359 366 374 381 389
Supplies 2,493 2,410 3,190 3,190 3,189 3,253 3,318 3,384 3,452
Utilities 888 856 935 935 1,065 1,086 1,108 1,130 1,153
Rents 152 155 165 155 39 40 41 41 42
Allocations 117 - 102 50 100 102 104 106 108
Capital Outlay 3,762 7,236 9,391 11,098 6,034 2,000 2,040 2,081 2,122
Contract Maintenance 595 704 690 690 869 886 904 922 941
TOTAL EXPENDITURES 51,827 58,196 64,619 66,224 60,870 57,933 59,091 60,273 61,479
EXCESS (DEFICIT) 4,499 2,342 (4,000) (2,213) (3,860) 218 222 227 231
FUND BALANCE:
Beginning 10,182 14,681 13,364 17,022 14,809 10,950 11,168 11,390 11,616
Ending 14,681 17,022 9,364 14,809 10,950 11,168 11,390 11,616 11,847

SPECIAL REVENUE FUNDS F FUND
BUDGET PROJECTION SUMMARY
104
($000)
Farm Fund
Actual Actual Budget Estimated Budget Projected
FY17 FY18 FY19 FY19 FY20 FY21 FY22 FY23 FY24
REVENUES:
Membership Fee 3$ 5 4 5 5 5 5 5 5
Donations 17 19 18 20 18 18 18 19 19
Vendor Income 4 3 4 3 3 3 3 3 3
Educational Fees 0 2 1 1 1 1 1 1 2
Grant 1 2 1 1 1 - - - -
Rental Income - 6 13 10 13 14 16 17 19
General Fund Transfer 150 120 120 120 100 100 100 120 120
TOTAL REVENUES 176 157 160 159 140 141 143 165 167
EXPENDITURES BY CATEGORY:
Personnel 55 52 83 86 90 93 96 98 101
Communications 2 3 3 2 3 4 4 4 4
Professional Fees 26 28 22 22 22 22 23 23 23
Other Maintenance 9 8 12 10 12 12 13 14 14
Insurance 5 - 3 3 3 3 3 3 3
Supplies 16 12 13 13 13 13 13 14 14
Utilities 6 9 10 8 10 11 11 11 11
Rents 1 12 8 8 6 6 6 6 6
Allocations 1 1 1 1 1 1 1 1 1
Capital Outlay - 17 20 - - - - - -
TOTAL EXPENDITURES 121 142 175 152 159 164 169 173 177
EXCESS (DEFICIT) 55 14 (15) 7 (19) (24) (26) (7) (9)
FUND BALANCE:
Beginning 79 133 123 148 154 136 112 86 80
Ending 133 148 108 154 136 112 86 80 70
($000)
E-CITATIONS FUND
Actual Actual Budget Estimated Budget Projected
FY17 FY18 FY19 FY19 FY20 FY21 FY22 FY23 FY24
REVENUES:
E-Fee $4 -$ - 25 24 25 25 25 25 -
E-Fee $1 - - 6 6 6 6 6 6 6
Technology Fee Revenue - - 5 0 0 0 0 0 0
TOTAL REVENUES - - 37 30 31 31 31 31 6
EXPENDITURES BY CATEGORY:
Other Maintenance - - - - - - - - -
Supplies - - - 4 3 3 3 3 3
Capital Outlay - - - - - - - - -
TOTAL EXPENDITURES - - - 4 3 3 3 3 3
EXCESS (DEFICIT) - - 37 26 28 28 28 28 3
FUND BALANCE:
Beginning - - - - 26 54 82 110 138
Ending - - 37 26 54 82 110 138 141

SPECIAL REVENUE FUNDS F FUND
BUDGET PROJECTION SUMMARY
105
($000)
LIBRARY ENDOWMENT
Actual Actual Budget Estimated Budget Projected
FY17 FY18 FY19 FY19 FY20 FY21 FY22 FY23 FY24
REVENUES:
Interest 1$ 3 - - - - - - -
Fines 1 1 - - - - - - -
TOTAL REVENUES 2 4 - - - - - - -
EXPENDITURES BY CATEGORY:
Personnel 1 3 - - - - - - -
Communications - - - - - - - - -
Professional Fees 2 8 - - - - - - -
Other Maintenance - - - - - - - - -
Supplies 8 6 - - - - - - -
TOTAL EXPENDITURES 11 17 - - - - - - -
EXCESS (DEFICIT) (8) (13) - - - - - - -
FUND BALANCE:
Beginning 256 248 331 234 234 234 234 234 234
Ending 248 234 331 234 234 234 234 234 234
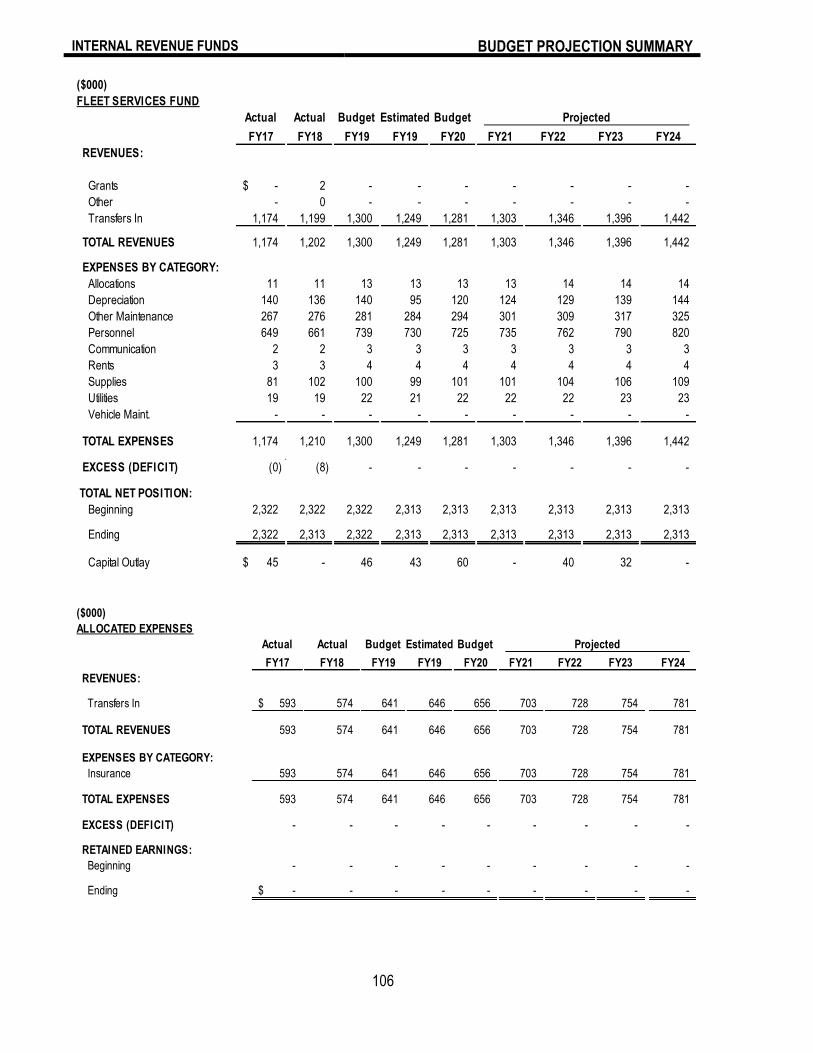
INTERNAL REVENUE FUNDS F FUND
BUDGET PROJECTION SUMMARY
106
($000)
FLEET SERVICES FUND
Actual Actual Budget Estimated Budget Projected
FY17 FY18 FY19 FY19 FY20 FY21 FY22 FY23 FY24
REVENUES:
Grants -$ 2 - - - - - - -
Other - 0 - - - - - - -
Transfers In 1,174 1,199 1,300 1,249 1,281 1,303 1,346 1,396 1,442
TOTAL REVENUES 1,174 1,202 1,300 1,249 1,281 1,303 1,346 1,396 1,442
EXPENSES BY CATEGORY:
Allocations 11 11 13 13 13 13 14 14 14
Depreciation 140 136 140 95 120 124 129 139 144
Other Maintenance 267 276 281 284 294 301 309 317 325
Personnel 649 661 739 730 725 735 762 790 820
Communication 2 2 3 3 3 3 3 3 3
Rents 3 3 4 4 4 4 4 4 4
Supplies 81 102 100 99 101 101 104 106 109
Utilities 19 19 22 21 22 22 22 23 23
Vehicle Maint. - - - - - - - - -
TOTAL EXPENSES 1,174 1,210 1,300 1,249 1,281 1,303 1,346 1,396 1,442
EXCESS (DEFICIT) (0) (8) - - - - - - -
TOTAL NET POSITION:
Beginning 2,322 2,322 2,322 2,313 2,313 2,313 2,313 2,313 2,313
Ending 2,322 2,313 2,322 2,313 2,313 2,313 2,313 2,313 2,313
Capital Outlay 45$ - 46 43 60 - 40 32 -
($000)
ALLOCATED EXPENSES
Actual Actual Budget Estimated Budget Projected
FY17 FY18 FY19 FY19 FY20 FY21 FY22 FY23 FY24
REVENUES:
Transfers In 593$ 574 641 646 656 703 728 754 781
TOTAL REVENUES 593 574 641 646 656 703 728 754 781
EXPENSES BY CATEGORY:
Insurance 593 574 641 646 656 703 728 754 781
TOTAL EXPENSES 593 574 641 646 656 703 728 754 781
EXCESS (DEFICIT) - - - - - - - - -
RETAINED EARNINGS:
Beginning - - - - - - - - -
Ending -$ - - - - - - - -
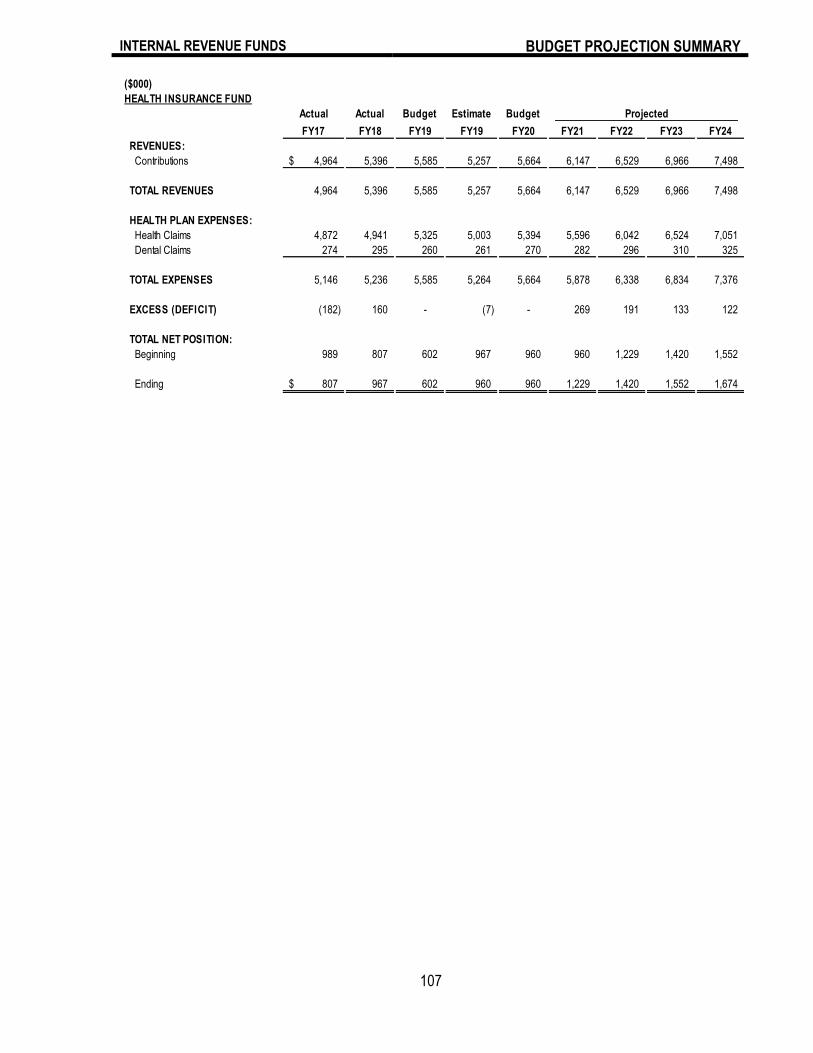
INTERNAL REVENUE FUNDS F FUND
BUDGET PROJECTION SUMMARY
107
($000)
HEALTH INSURANCE FUND
Actual Actual Budget Estimate Budget Projected
FY17 FY18 FY19 FY19 FY20 FY21 FY22 FY23 FY24
REVENUES:
Contributions 4,964$ 5,396 5,585 5,257 5,664 6,147 6,529 6,966 7,498
TOTAL REVENUES 4,964 5,396 5,585 5,257 5,664 6,147 6,529 6,966 7,498
HEALTH PLAN EXPENSES:
Health Claims 4,872 4,941 5,325 5,003 5,394 5,596 6,042 6,524 7,051
Dental Claims 274 295 260 261 270 282 296 310 325
TOTAL EXPENSES 5,146 5,236 5,585 5,264 5,664 5,878 6,338 6,834 7,376
EXCESS (DEFICIT) (182) 160 - (7) - 269 191 133 122
TOTAL NET POSITION:
Beginning 989 807 602 967 960 960 1,229 1,420 1,552
Ending 807$ 967 602 960 960 1,229 1,420 1,552 1,674

INTERNAL REVENUE FUNDS F FUND
BUDGET PROJECTION SUMMARY
108
($000)
OPEB FUND
Actual Actual Budget Estimate Budget Projected
FY17 FY18 FY19 FY19 FY20 FY21 FY22 FY23 FY24
OPEB REVENUES:
Contributions 707$ 992 896 941 1,334 1,342 1,396 1,451 1,510
Fair Value Appreciation 275 27 130 (150) (150) (156) (162) (169) (175)
Gain (Loss) 238 262 240 250 255 265 276 287 298
Interest 66 68 67 70 75 78 81 84 88
TOTAL REVENUES 1,285 1,349 1,333 1,111 1,514 1,529 1,590 1,654 1,720
OPEB EXPENSES:
Trustee Fees 24 15 18 16 18 19 19 20 21
Benefits 1,414 1,364 1,423 1,439 1,591 1,655 1,721 1,790 1,861
Stop Loss (27) (211) - (163) - - - - -
TOTAL EXPENSES 1,410 1,168 1,441 1,292 1,609 1,673 1,740 1,810 1,882
EXCESS (DEFICIT) (125) 181 (108) (181) (95) (144) (150) (156) (162)
FUND BALANCE:
Beginning 5,987 5,862 5,976 6,043 5,862 5,767 5,621 5,472 5,317
Ending 5,862$ 6,043 5,868 5,862 5,767 5,621 5,472 5,317 5,154
($000)
CASH BALANCE
Actual Actual Budget Estimate Budget Projected
FY17 FY18 FY19 FY19 FY20 FY21 FY22 FY23 FY24
CASH BALANCE REVENUES:
Contributions 392$ 508 599 703 834 867 902 938 975
Fair Value Appreciation 33 (1) 3 49 25 26 27 28 29
Interest 7 17 9 28 20 21 22 22 23
Realized Gain Loss 9 33 10 44 20 21 22 22 23
TOTAL REVENUES 441 557 621 823 899 935 972 1,011 1,051
CASH BALANCE EXPENSES:
Trustee Fees 15 8 8 11 12 12 12 13 13
Benefits 15 32 15 43 45 47 49 51 53
TOTAL EXPENSES 29 40 23 55 57 59 61 64 66
EXCESS (DEFICIT) 412 517 597 768 842 876 911 947 985
FUND BALANCE:
Beginning 370 782 1,304 1,299 2,069 2,910 3,786 4,696 5,644
Ending 782$ 1,299 1,901 2,069 2,910 3,786 4,696 5,644 6,629

TRUST FUNDS F FUND
BUDGET PROJECTION SUMMARY
109
($000)
PENSION FUND
Actual Actual Budget Estimate Budget Projected
FY17 FY18 FY19 FY19 FY20 FY21 FY22 FY23 FY24
PENSION REVENUES:
Contributions 2,934$ 3,651 3,756 3,706 3,886 3,886 3,978 3,978 3,978
Fair Value Appreciation
(Depreciation) 5,615 (762) 1,500 (1,500) (1,500) (1,575) (1,622) (1,671) (1,721)
Realized Gain (Loss) 1,187 4,619 3,500 3,500 3,500 3,500 3,535 3,535 3,535
Interest 754 719 900 785 750 750 758 758 773
TOTAL REVENUES 10,490 8,227 9,656 6,491 6,636 6,561 6,649 6,600 6,565
PENSION EXPENSES:
Trustee Fees 274 239 262 250 266 266 266 266 266
Benefits 3,687 4,129 3,714 4,250 4,294 4,723 1,738 1,738 1,825
TOTAL EXPENSES 3,961 4,368 3,976 4,500 4,560 4,989 2,004 2,004 2,091
EXCESS (DEFICIT) 6,529 3,860 5,680 1,991 2,076 1,572 4,644 4,595 4,474
TOTAL NET POSITION:
Beginning 61,837 68,366 74,027 72,226 74,216 76,293 77,866 82,510 87,105
Ending 68,366$ 72,226 79,708 74,216 76,293 77,866 82,510 87,105 91,579

PERSONNEL AND STAFFING BUDGET PROJECTION SUMMARY
110
The following staffing schedule summarizes the employee component of the City. In each cost center section of the Budget, a Personnel Projection schedule lists five areas of personnel expense – exempt salaries, non-exempt wages, other compensation, fringe benefits and other personnel. Since the nature of these categories is generally common to all departments, these items will be described in this section. Exempt Salaries and Non-Exempt Wages: Exempt salaries and non-exempt wages include the payroll cost for full-time and part-time positions classified under each category. There is a net effect of a 3% merit increase in the FY20 Budget. The budget for total personnel salaries and wages increased over FY19 budget by $1,336,908. Other Compensation: Other compensation includes overtime wages, extra duty wages, housing allowance and per diem expenses. Overtime is self-explanatory. Extraordinary amounts and changes are described in certain cost center Budget Category Explanations. Extra duty wages account for the amounts paid to police and fire employees in lieu of holiday time off and for court appearances. Housing allowance has been discontinued, but is still paid to those who were grandfathered in before 1986. Per Diem covers City judges, prosecutors, Aldermen and the Mayor. Fringe Benefits: Fringe Benefits include the City’s cost for FICA, medical, dental, life, long-term disability, retirement, OPEB, and Workers’ Compensation insurance. FICA, set by the federal law, is 7.65% of salary. The new per employee City annual contribution is $10,700 both health and dental. To maintain a competitive compensation package, the City added retiree’s medical benefits several years ago and continues to improve the retirement plan. The City has implemented an IRS Section 125 Plan to pay employee costs of retirement and medical benefits with pre-tax dollars. The City also provides life insurance of three times salary at a cost of 13¢ per month per $1,000 of coverage. The City pays 80¢ per month per $100 of salary for long-term disability benefits. Workers’ Compensation is through the TML Risk Management Pool and varies by department based on the Pool’s assessment of potential risks. Other Personnel: Other Personnel costs include education, staff functions, and unemployment. Employee education amounts and charges are described in the Budget Category Explanations in the various cost centers. Staff functions fund events such as employee holiday parties and awards programs. Unemployment funds payments to individuals receiving unemployment benefits.
-
100.0
200.0
300.0
400.0
500.0
Full-time Part-time
422
48
431
48 Num
ber
of P
ositio
ns
FY19 FY20
`
The number of full-time and part-time positions in the FY20 Budget shows change over the current fiscal year. The chart on the following page identifies the position changes; all associated with productivity
improvement initiatives.
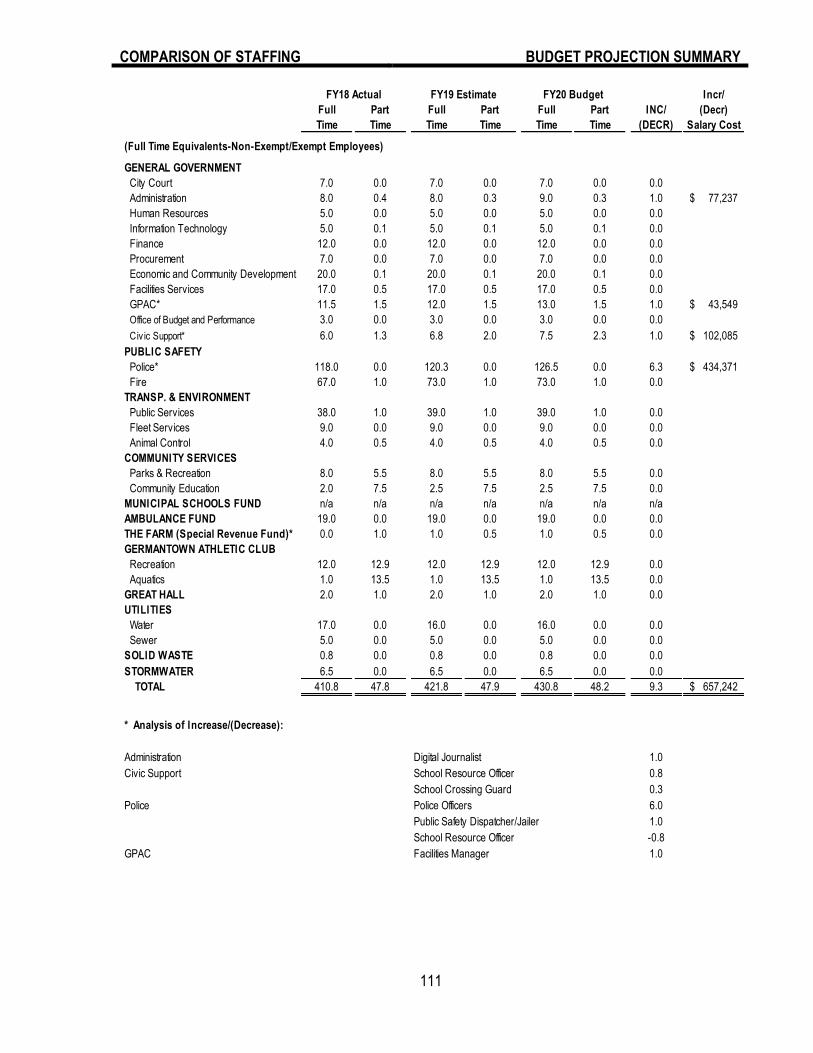
111
COMPARISON OF STAFFING BUDGET PROJECTION SUMMARY
FY18 Actual FY19 Estimate FY20 Budget Incr/
Full Part Full Part Full Part INC/ (Decr)
Time Time Time Time Time Time (DECR) Salary Cost
(Full Time Equivalents-Non-Exempt/Exempt Employees)
GENERAL GOVERNMENT
City Court 7.0 0.0 7.0 0.0 7.0 0.0 0.0
Administration 8.0 0.4 8.0 0.3 9.0 0.3 1.0 77,237$
Human Resources 5.0 0.0 5.0 0.0 5.0 0.0 0.0
Information Technology 5.0 0.1 5.0 0.1 5.0 0.1 0.0
Finance 12.0 0.0 12.0 0.0 12.0 0.0 0.0
Procurement 7.0 0.0 7.0 0.0 7.0 0.0 0.0
Economic and Community Development 20.0 0.1 20.0 0.1 20.0 0.1 0.0
Facilities Services 17.0 0.5 17.0 0.5 17.0 0.5 0.0
GPAC* 11.5 1.5 12.0 1.5 13.0 1.5 1.0 43,549$
Office of Budget and Performance 3.0 0.0 3.0 0.0 3.0 0.0 0.0
Civ ic Support* 6.0 1.3 6.8 2.0 7.5 2.3 1.0 102,085$
PUBLIC SAFETY
Police* 118.0 0.0 120.3 0.0 126.5 0.0 6.3 434,371$
Fire 67.0 1.0 73.0 1.0 73.0 1.0 0.0
TRANSP. & ENVIRONMENT
Public Services 38.0 1.0 39.0 1.0 39.0 1.0 0.0
Fleet Services 9.0 0.0 9.0 0.0 9.0 0.0 0.0
Animal Control 4.0 0.5 4.0 0.5 4.0 0.5 0.0
COMMUNITY SERVICES
Parks & Recreation 8.0 5.5 8.0 5.5 8.0 5.5 0.0
Community Education 2.0 7.5 2.5 7.5 2.5 7.5 0.0
MUNICIPAL SCHOOLS FUND n/a n/a n/a n/a n/a n/a n/a
AMBULANCE FUND 19.0 0.0 19.0 0.0 19.0 0.0 0.0
THE FARM (Special Revenue Fund)* 0.0 1.0 1.0 0.5 1.0 0.5 0.0
GERMANTOWN ATHLETIC CLUB
Recreation 12.0 12.9 12.0 12.9 12.0 12.9 0.0
Aquatics 1.0 13.5 1.0 13.5 1.0 13.5 0.0
GREAT HALL 2.0 1.0 2.0 1.0 2.0 1.0 0.0
UTILITIES
Water 17.0 0.0 16.0 0.0 16.0 0.0 0.0
Sewer 5.0 0.0 5.0 0.0 5.0 0.0 0.0
SOLID WASTE 0.8 0.0 0.8 0.0 0.8 0.0 0.0
STORMWATER 6.5 0.0 6.5 0.0 6.5 0.0 0.0
TOTAL 410.8 47.8 421.8 47.9 430.8 48.2 9.3 657,242$
* Analysis of Increase/(Decrease):
Administration Digital Journalist 1.0
Civic Support School Resource Officer 0.8
School Crossing Guard 0.3
Police Police Officers 6.0
Public Safety Dispatcher/Jailer 1.0
School Resource Officer -0.8
GPAC Facilities Manager 1.0

112