Embed Size (px)
Citation preview

Fiscal Sustainability and Generational BurdenSharing in Denmark *
Svend Erik Hougaard JensenCenter for Economic and Business Research and EPRU
Ulrik NødgaardDanish Ministry of Economic Affairs
Lars Haagen PedersenDREAM Group, Statistics Denmark
May, 2001
Abstract
Based on generational accounts and a simple welfare calculus, this paper studiestwo alternative scenarios of sustainable fiscal policy. A strategy of tax smoothing isfound to successfully distribute the financial burden associated with populationageing across generations, but this happens at the cost of a sharp increase in publicdebt along the transition path. This can be avoided if a strategy of debt smoothing isfollowed, but this shifts the financial burden onto current generations. A comparisonbased on a social welfare function indicates a marginal superiority of tax smoothing.
* Paper prepared for the workshop “Generational Accounting in the Nordic Countries”,Reykjavik, February 24, 2001. Martin Junge, Anders Due Madsen and Rasmus WesterlinNielsen have provided excellent research assistance. The activities of CEBR are financed bythe Ministry of Trade and Industry in Denmark. Opinions are those of the authors, andshould not be assumed to be those of our employers.
E-mail adresses: [email protected], [email protected], [email protected]

Contents
1. Introduction . . . . . . . . . . . . . . . . . . . . 52. Recent macroeconomic trends. . . . . . . . . . . . . . . 63. Generational accounting and GE modelling – an integrated approach . . 93.1. Age dependent public expenditures and revenues . . . . . . . 103.2 Demographic projections . . . . . . . . . . . . . . . 123.3 The pension system in Denmark . . . . . . . . . . . . 133.4 Fiscal policy and the foreign sector . . . . . . . . . . 154. Tax Smoothing . . . . . . . . . . . . . . . . . . . 174.1. Macroeconomic performance . . . . . . . . . . . . . 174.2. The public budget . . . . . . . . . . . . . . . . . 184.3. Generational accounts . . . . . . . . . . . . . . . . 205. Debt Smoothing . . . . . . . . . . . . . . . . . . 225.1. The macroeconomy and public finances . . . . . . . . . 225.2. Generational accounts and equivalent variations . . . . . . . . 236. Concluding remarks . . . . . . . . . . . . . . . . . 26References . . . . . . . . . . . . . . . . . . . . . 27

1. Introduction
The macroeconomic development in Denmark has been favourable since 1993,where unemployment peaked at 12 per cent of the labour force and the publicde…cit reached 3 per cent of GDP. By 2000, unemployment had fallen to 5 percent, and the surplus on public …nances amounted to almost 3 per cent of GDP.The recovery began in 1994 and was kick started by a minor …scal stimulus of 1per cent of GDP, a temporary reduction of income taxes combined with measuresto stimulate activity in the construction sector.
Despite strong growth since 1994, in‡ation has remained modest, at levels con-sistent with a policy of keeping a …xed exchange rate vis–à-vis the German markand, since 1999, the euro. Furthermore, the long period of economic expansionhas not resulted in massive current account de…cits, unlike past experience inDenmark. This suggests that the structural reforms undertaken during the 1990shave been quite successful, although it is di¢cult to disentangle the e¤ects ofsubstantial structural reforms from the e¤ects of cyclical factors.
Denmark has decided not to participate in the …nal stage of EMU. However,macroeconomic policy has been conducted according to a commitment to theprinciples of nominal convergence and …scal discipline. The position of the Danishgovernment is to adhere strictly to public debt reduction. The gross public debt-GDP ratio has already been brought down from almost 80 per cent in 1993 to 48per cent in 2000. And the o¢cial target set by the current government involvesa further reduction in the debt-GDP ratio to 24 per cent by year 2010.
While the current state of the Danish economy thus appears strong, the purposeof this paper is to examine whether similarly optimistic conclusions can be drawnabout the medium-to-long term. Our major concern is the future stance of public…nances. Among the questions we try to answer are the following: Is current…scal policy sustainable? If not, what is the magnitude of the …scal imbalance?To what extent are we passing …scal burdens onto future generations? How wouldalternative …scal strategies impact on the macroeconomy and the distribution ofwelfare across di¤erent current and future generations?
There are several reasons why we think these questions deserve addressing: First,the process of changing demographics is likely to lead to a substantial increase inthe number of elderly, a phenomenon which will undoubtedly put upward pressureon public expenditures. Second, the long-term trend for people of working-age
5

to wish more leisure could continue. Third, a further tendency towards a shorterworking life could be observed. This would reinforce the budgetary pressurecaused by population ageing.
Other challenges, mainly some associated with ”globalization” and/or ”Euro-peanization”, could be added. For example, one could envisage that it will beincreasingly di¢cult to raise the revenues needed to sustain the …nancial viabilityof the welfare state. Increased mobility within Europe may induce some mem-bers of the labour force to ‡ee to lower-tax jurisdictions, thereby eroding thetax base. A similar problem concerning corporate taxation may arise. Public…nances could also come up against the …scal prudence criteria of the Growthand Stability Pact (GSP), according to which EMU members should produce amedium-term budgetary position of close to balance or in surplus.
We conclude that the sustainable tax rate is around 1 percentage point abovethe relevant benchmark tax rate, corresponding to a need for a permanent in-crease in income taxation of approximately 0.75 per cent of GDP. Therefore, instrict sense current …scal policy is not sustainable, but there is no indication of adramatic …scal imbalance. The results thus underline the importance of bringingpublic debt down now when there is demographic breathing-space, rather thanpostponing the adjustment until the ageing of the population starts.
If preferences for generational fairness are heavily weighted, a policy of taxsmoothing would be wise. However, during the transition period a policy ofthat kind would produce public debt-GDP ratios that might be in con‡ict withthe GSP. Hence we consider an alternative scenario where the public debt-GDPratio is held constant throughout (”debt smoothing”). Using the tool of genera-tional accounts, we …nd that all currently living generations would su¤er if …scalpolicy is conducted in terms of debt rather than tax smoothing.
While neither of these …scal scenaria produce particularly alarming outcomes,there is a trade-o¤ between temporary (excessive?) debt accumulation and (un-fair?) generational redistribution. We address this dilemma by formulating asocial welfare function and …nd that there is a one-o¤ social welfare gain of 0.6per cent of GDP in factor prices by implementing pure tax smoothing instead ofpure debt smoothing. The relatively modest gain from tax smoothing suggeststhat the costs of complying with the GSP requirements are small. And, sincethis result does not imply that tax smoothing is optimal, it might well be more
6

sensible to adopt a mixed regime. For example, this could take the form of an in-crease in the …nancial burden on current generations implemented through lowertransfer payments. This would also reduce the size of government and therebypave the way for a lower tax burden in the future.
From here we proceed as follows. The next section o¤ers a brief overview ofsome recent macroeconomic trends. Section 3 presents a uni…ed framework forgenerational accounting and intertemporal simulation modelling. Sections 4 and 5then show some macroeconomic, budgetary and generational e¤ects of alternative…scal policies. Section 6 concludes.
2. Recent macroeconomic trends
Two major tax reforms have been implemented during the 1990s, both aimingat bringing down marginal tax rates on personal income by broadening the taxbase and switching towards green taxes. The tax reforms have been motivatedby a need for improving not only the incentives to work but also to strengthenhouseholds’ savings in order to improve the current account, traditionally theAchilles heel of the Danish economy. The tax value of the deductable interestexpenses will be brought down from 52 per cent in the early 1990s to 33 per centin 2002. Hence the incentive to save has increased signi…cantly. Although thehighest marginal tax rate on income has been brought down from 69 to 63 percent, and the average marginal tax rate of full-time employed people is expectedto fall from 59.3 per cent in 1993 to 54.4 per cent in 2002, the economic incentivesto become employed for unskilled workers are still low. The tax system has alsobeen modi…ed in view of the increased international mobility of capital. Thenominal corporate tax rate has been brought down from 50 per cent in 1990 to30 per cent in 2001, thereby making the tax system more robust with respect topro…t shifting of international …rms. As the reductions have been …nanced bytightening depreciation allowances, the marginal e¤ective tax rate has, however,remained fairly constant.
The 1990s have also witnessed several labour market reforms. Some aggregateevidence reported by the OECD points towards a substantial fall in structuralunemployment, from 8.4 in 1993 to 6.3 in 1999. A major characteristic has beenan increased use of active labour market policies, including compulsory activationof the unemployed after one year of unemployment. Microeconometric evidenceshows that the probability of …nding a job goes up as the point for compulsory
7

activation is approaching, suggesting (but not implying) that the ALMPs havelowered unemployment (Ministry of Labour, 2000). Moreover, availability re-quirements have been tightened, eligibility criteria have been strenghtened andthe generosity of certain bene…ts have been reduced. For example, the maximumduration of unemployment bene…ts has been reduced from 9 to 4 years, and theso-called ”youth package” reduced unemployment bene…ts for people aged below25 by 50 per cent after 6 months of unemployment. The e¤ect of the latter reformhas been a signi…cant reduction in the youth unemployment.
With the aim of increasing labour supply, two reforms concerning the retirementdecision have been implemented. First, the so-called transitory retirement schemefor long term unemployed persons in the age-groups from 50 to 60 years has beenabandoned. Second, the early retirement bene…t scheme allowing people to retireat the age of 60 was reformed in 1998. This reform makes retirement beforethe age of 62 less attractive and o¤ers a premium to people who abstains fromusing the scheme. Furthermore, entitlement to these bene…ts requires that acontribution rate has been paid at least 25 years prior to retirement. Despitethese initiatives, the number of working-age people who are outside the labourforce and receives public transfers remains high. Undoubtedly, further reformsare needed if a signi…cant reduction in the labour force is to be avoided.
Another major structural change in the Danish economy is that there has beena dramatic increase in private, fully-funded pension schemes, see below. Thecontribution rate of blue-collar workers is now being increased to typically 9 percent of the wage income, for white-collar workers and public employees ratesare 12-15 per cent. The contributions amount to almost 5 per cent of GDP. Atpresent, the total wealth of private pension funds is 75 per cent of GDP but isexpected to reach a level of almost 200 per cent of GDP in 2050.
Since the public sector is relative large in Denmark, it is not surprising that thegovernment budget is very sensitive to the business cycle. However, a signi…cantpart of the recent improvement might be of a more structural nature. Indeed,based on the standard technique of applying relevant revenue and expenditureelasticities to the output gap, the structural balance has been estimated to 2.6per cent of GDP in 2000, an improvement of almost 6 per cent of GDP since1993 (European Commission, 2001). Hence, a part of the improvement of public…nances re‡ects structural factors, among which the fall in the structural rate ofunemployment is dominant.
8

By international comparison, it is remarkable that Danish politicians, even withsurpluses of almost 3 per cent of GDP, have resisted the temptation to implementun…nanced tax cuts similarly to what has recently been seen in Germany, theNetherlands, France and Sweden. The strategy of debt-reduction has led to a fallin the gross debt-GDP ratio from 80 per cent in 1993 to 53 per cent by the endof 1999 and is expected to be only 44 per cent by the end of 2001. Taking intoconsideration the assets of the funded supplementary public pension fund ATP,net debt is at present only 16 per cent of GDP.
Public expenditures on transfers have decreased (mainly due to the decreasednumber of unemployed) in recent years. However, public consumption has con-tinued to increase beyond the targets set out by the government. The o¢cialtarget is to reduce the real growth of public consumption to 1 per cent a year.However, based on budgets for 2001, real public consumption will on averagegrow by 2 per cent from 1997 to 2001. The increase cannot be explained by shiftsin demography a¤ecting age-related spending; rather, it re‡ects an increase inthe standards of public service. Indeed, the repeated overruns have been madepossible by the fact that two thirds of public consumption take place at the levelof local governments, thus beyond the direct control of the central government.When measured as a percentage of GDP, public consumption has remained rel-atively constant throughout the period. However, by international comparisonthe level of public consumption is high. In the euro-area, for instance, publicconsumption is only 20 per cent of GDP, compared to 25 per cent in Denmark.
3. Generational accounting and GE modelling - an integrated ap-proach
This section seeks to evaluate the sustainability of …scal policy in Denmark withina uni…ed framework of generational accounting and dynamic general equilibriummodelling. For that purpose we employ the DREAM model, which is an OLG-CGE model of the Danish economy formulated in the spirit of Auerbach andKotliko¤ (1987).1 Here we focus on how the age-speci…c pro…les of public ex-penditures and revenues, the underlying demographic projection and the pensionsystem in Denmark have been incorporated into the model.
1DREAM is an acronym for Danish Rational Economic Agents Model. Details of themodel are available in Knudsen, Pedersen, Petersen, Stephensen and Trier (1998, 1999) andPedersen, Stephensen and Trier (1999). General information on DREAM is available athttp://www.dst.dk/dream.
9

3.1. Age dependent public expenditures and revenues
3.1.1. Public consumption
Following the methodology of generational accounting, public consumption is splitinto two parts: individual and collective. The former is de…ned as those partsof public consumption that are attributed directly to individuals. This includesstrictly rival goods, such as medicare and residential homes for elderly people,as well as goods that are partly non-rival goods such as education and libraries.For each of these types of goods the total expenditures have been distributedacross individuals of a given generation according to each generation’s use of theparticular good, based on behaviour in 1998. It is assumed that this distributionremains unchanged throughout the projection period. In 1998 two thirds of thetotal public consumption were de…ned as individual public consumption. Its realvalue (per individual of a given age) is assumed to grow in line with real GDP.In a steady state with a stationary population this assumption implies that theindividual public consumption constitutes a …xed proportion of GDP. However,along the transition path to the steady state, the individual public consumptionmay grow faster than real GDP due to changes in the demographic compositionof the population.2
The real value of the collective part of public consumption, consisting of pure non-rival goods such as defence and police, is assumed to grow in line with real GDP.In the generational accounts presented below these expenditures are distributedacross generations according to the number of adults in each generation. Thedemographic changes along the transition path of the economy a¤ects the levelof collective public consumption per adult.
3.1.2. Public transfers
Gross public transfers to individuals constituted 21 per cent of GDP at factorprices in 1998. Almost all transfers to individuals are subject to income taxationand net transfers are therefore signi…cantly lower. Here transfers are divided intoone part that is determined endogenously and another part based on exogenousprojections. We assume that the labour force (measured in number of persons)is determined by the demographic projection. The fraction of the population
2This is indeed the case in the present projection, where the individual (age-dependent) publicconsumption increases from 21 per cent of GDP at factor prices in 1998 to a peak of 24 percentof GDP in 2038.
10

of a given age, gender and origin (native or immigrants) that is in the labourforce in 1998 is assumed to remain constant throughout. Changes in the com-position of the population (with respect to age, gender and origin) would thuslead to changes in the labour force.3 Since employment and unemployment aredetermined endogenously, publicly …nanced unemployment bene…ts are also de-termined endogenously. Unemployment in the model is for simplicity distributedacross age, gender and origin groups in the labour force such that the unemploy-ment rate for each group is identical to the overall rate of unemployment.
The public transfers to persons outside the labour force are determined by thefollowing procedure: The distribution of persons receiving public transfers in1998 is taken from a register of all persons in Denmark where individuals areclassi…ed according to the type of income they receive. From this register thefraction of a given age, gender and origin group that receives a speci…c transferpayment is obtained for a given year. In the projection it is assumed that thesefractions remain constant through time. Given the demographic projection thisgenerates the development in the number of persons receiving the public transfers.The public transfers are indexed to the wage rate and, as wage determination isendogenous, indexation of transfers is also endogenous.4
The remaining part of public expenditures, most notably public investments andinterest payments on public debt, are determined endogenously and have not beenallocated to generations in the reported generational accounts.
3.1.3. Public revenues
Public revenues are generally endogenous in DREAM. The tax revenue from per-sonal income taxation is collected from the tax payments of the households in themodel. In the generational accounting system these taxes are distributed acrossgenerations simply by using the endogenous tax revenue from the generation inquestion. Various types of personal income are taxed di¤erently in the Danish
3Origin is included since immigrants have a signi…cantly di¤erent labour market behaviourthan the rest of the population. This fact, combined with the fact that the present numberof immigrants is very low and therefore increasing over time for any reasonable projection ofannual immigration, imply that the development in both the labour force and public transfersto individuals are a¤ected by the development in relative size of the number of immigrants.
4 In addition to these main public transfers there exists a group of transfers, which goesto both persons in the labour force and persons outside the labour force. These transfers aredistributed to the di¤erent generations using a procedure similar to the one applied to individualpublic consumption.
11

tax system. Since the model re‡ects this fact, a given level of personal incomemay lead to di¤erent levels of taxation depending on the composition of income.Similarly, revenue from indirect taxation is collected from the indirect tax pay-ments associated with the private consumption of the individual generations ofhouseholds. These revenues are also used directly in the generational account-ing system. Revenues from direct and indirect taxation of …rms, most notablycorporate taxes, are distributed to generations according to the number of adult-equivalents in each generation. The same procedure is used for the revenue fromtaxation of capital income in the fully funded pension system.
3.1.4. A comparison to previous studies
The procedure outlined above di¤ers somewhat from the standard generationalaccounting methodology (Auerbach, Gokhale and Kotliko¤, 1991) that was usedin two previous studies of the generational stance of …scal policy in Denmark, seeJensen and Ra¤elhüschen (1997, 1999). First, in the present study we distributeboth individual and collective public consumption across generations, whereas inthe previous studies only individual public consumption was distributed. Second,while in this study both direct and indirect taxes paid by …rms and insurancecompanies are distributed across those generations that are active in the periodwhere the taxes are paid, this was the case only for the personal direct and indirecttaxes in the previous generational accounts for Denmark. Finally, in this studychildhood is excluded in the sense that public consumption allocated to childrenbelow the age of 17 years is distributed to their mothers’ generations. In theprevious studies, however, also children were assumed to have an economic life.This simpli…cation is made in order to obtain consistency with the constructionof households in the DREAM model.
3.2. Demographic projections
The underlying demographic projection is based on Statistics Denmark (1999)and Petersen (1999). Two age groups are of special interest, namely those ofworking age and the elderly. The former (aged 15-64) is projected to increaseslightly until 2010, whereupon it starts shrinking and remains below the currentlevel throughout this century. Labour market participation rates are assumedconstant, but changes in the demographic composition of the labour force magnifythe reduction that follows from the reduction in the total number of persons inthat age group. The number of working hours per individual is reduced by 2percent untill 2002 to account for the reduction in working hours in the recent
12

bargaining agreement in the private sector. After 2002 the number of workinghours per individual is assumed to remain constant. These assumptions takentogether imply a fall in the number of working hours of around 7.5 per cent from1998 to 2038. Thereafter, the labour force is growing slightly; yet it remains 5per cent below the 1998 level throughout the century.
The number of persons aged 60 and above is increasing throughout the …rst half ofthe century, implying that by 2040 this age group has grown by almost 50 per centcompared to 1998.5 Also the number of persons aged 80 and above is expectedto increase by 45 per cent in the same period (”double-ageing”). From 2040 thenumber of persons aged 60 and above stabilises at the new level. However, thenumber of persons aged 80 and above continues to increase, meaning an expectedrise by around 60 per cent over the next …ve decades.
Against the prospect of a falling work-force and a rising group of retirees, agrowing demographic burden is inevitable. The so-called corrected dependencyratio, de…ned as the number of persons who are not in the labour force dividedby the labour force measured in the number of working hours, is projected toincrease by 30 per cent from 1998 to 2038. In the remaining period the correcteddependency ratio stabilises at a level of 25 per cent higher than in 1998. Thisindicates that the expected increase in expenditures related to the demographicdevelopment is not just a temporary phenomenon related to the large postwargenerations, but a permanent shift.
Finally, from a modelling perspective, a novelty here is that the demographicprojection is incorporated directly into the household structure of the model.6
3.3. The pension system in Denmark
The Danish pension system consists of four pillars: First, a pure pay-as-you-go pension system that distributes pensions to all persons aged 67 and above.7
5The o¢cial retirement age in Denmark is currently 67, but falling to 65 by year 2005.However, the existence of the early retirement bene…t scheme, reserved for persons aged 60-66,implies that the e¤ective retirement age is relatively close to 60 years.
6See Knudsen, Pedersen, Petersen, Stephensen and Trier (1998) for a detailed description ofthe construction and the behaviour of the households in DREAM.
7While basically a ‡at-rate system, there are some exceptions. First, there are reductions inthe pension for persons who have been living in Denmark for less than 30 years after becoming18 years old. Second, in addition to the ‡at rate pension bene…t there is an income-dependent
13

Second, a fully funded general labour market pension scheme (ATP) coveringall persons in the labour force.8 Third, fully funded contribution-de…ned labourmarket pension schemes that are negotiated between trade unions and employers’federations as part of the wage bargain. Fourth, fully funded individual pensions.In addition to these schemes a number of public employees are entitled to civilservants pension.9
While the PAYG scheme is likely to remain a crucial part of the Danish welfaresystem, future pensions in Denmark will increasingly be based on funded sys-tems. This structural shift has two major e¤ects. First, total pension paymentsper pensioner is expected to increase at a much higher speed than the growthof income for an employed person. Second, and most importantly, this shiftwill tend to reduce the intergenerational redistribution e¤ects associated withchanging demographics. Indeed, it is well-known that the economic impact ofchanging demographics depends crucially on the pension system being in opera-tion (Sandmo, 1992). In a small, open economy with free capital mobility, a purefully funded pension system implies that each generation pays for its own pen-sion and no intergenerational e¤ects are present in the absence of tax distortions.Contrariwise, a pure pay-as-you-go system implies that each working generationpays the pension bene…ts to the overlapping generations of retirees. Therefore,this system involves intergenerational transfers and the size of these transfers area¤ected by the relative sizes of the generations.
The funded pension systems in Denmark are relatively young, as re‡ected in lowlevels of present average pension payments relative to the level of contributions.For the blue collar part of the labour market the funded labour market pensionsystem was initiated in the beginning of the 1990s. The level of contributions asa percentage of the annual wage is expected to reach the long run level of 9 per
part which constitutes around 40 per cent of the average social pension in 1998. Given the rulesthis indicates that only a minor fraction of the pensioners in 1998 had pension payments fromthe funded pension system.
8The Danish system of national accounts de…nes ATP as a public pension system. Therefore,contributions to the system are modelled as income to the public sector, and pension paymentsfrom ATP are treated as public expenditures.
9 In DREAM pension funds of type three and type four are modelled as endogenous non-matured actuarial fair non-pro…t insurance companies with a behaviour determined by set ofrules approved by the Danish authorities, see Pedersen, Stephensen and Trier (1999) for detailsof the modelling of pension funds. The contribution rates are assumed to be …xed at the currentlevels, except for a slight increase due to the agreed increases in the contribution rate for bluecollar workers until 2004 and a shift in the composition of the public employment from personswith civil servants pension to employees with a funded pension arrangement.
14

cent in 2004. Therefore, this pension system needs a full life time of a generationto reach a situation where all pensioners receive pensions based on the long runlevel of contributions in their entire working-life. This implies that the fundedsystem is not expected to be fully matured before around year 2070.10
The non-mature status of the funded pension systems in Denmark also has majore¤ects on the tax base of the personal income tax in the transition period. Thisis due to the fact that contributions to pension systems are deductible in thepersonal income tax whereas pension payments from the pension funds are taxableat the personal income tax rate. This feature implies that the personal incometax base is low in an economy with a non-matured pension fund (due to the highcontributions and the low pension payment from the fund), and the tax-base isincreasing through time as the pension fund matures.11 This automatic increasein the tax base as the pension funds mature is a feature that is unique in the EUfor Denmark and the Netherlands (European Commission, 2000). The increasein the tax base of course implies that for a given initial position of the public debtthe …nancing of the expected increase in the age-burden may require a smalleraccommodation in these countries than in others faced with the same type ofproblems.
In sum, the shift towards larger dependence on funded pension systems will re-duce the impact on future shifts in the demographic composition on the inter-generational distribution of income. However, the conversion came too late tosigni…cantly redress the budgetary e¤ects of the expected increase in the old-ageburden from 2020 to 2040.
3.4. Fiscal policy and the foreign sector
The existence of an equilibrium with perfect foresight requires that all agents inthe economy ful…l their intertemporal budget constraints. Therefore, we need aspeci…c policy reaction function to ensure that the government’s intertemporalbudget constraint is met. Public expenditures are given by the demographic
10Labour market pension schemes for white-collar workers and public employees are oldersystems. These systems were started in the 1950s and 1960s, and they are therefore expectedto mature earlier.
11The positive e¤ect on the public budget as the pension system matures does not apply tothe ATP pension system in DREAM. Since this system is treated as a part of the public sectorcontributions are similar to taxes whereas pensions payments from the fund are similar to publicpensions. Therefore the non-mature ATP-pension system has a positive e¤ect of the publicbudget which is reduced as the system matures.
15
development, the age-dependent public consumption and public transfers andthe indexation rules, and we assume that the tax structure remains stable andthat all indirect tax rates (measured in VAT-equivalents) remain …xed.12 To ful…lthe intertemporal budget constraint we adjust the base tax rate of the personalincome tax system. More precisely, we de…ne the sustainable tax rate as the lowestpossible constant (or permanent) level of the base tax rate of the personal incometax system which is su¢cient to ful…l the intertemporal budget constraint. Thesustainable constant tax rate is set such that the growth and in‡ation correctedvalue of the primary surplus on the public budget is equal to the growth andin‡ation corrected interest payments on the public debt in the steady state.
The (announced and actual) economic policy, including the announced reductionin the tax rates, is assumed to follow what has already been legislated. Thismeans that tax rates are exogenous until 2003, from which year the policy of thesustainable tax rate is introduced. Two things should be noticed here. First, thedi¤erence between the sustainable tax rate and the basic tax rate in 2003 serves asan intelligible indicator of sustainability: if the former is higher than the latter, a…scal tightening of that magnitude is required, and vice versa. Second, the intro-duction of the sustainable tax rate implies that the government follows a policyof perfect tax smoothing, which identi…es our baseline …scal policy framework.
The foreign sector is modelled as ”neutral” as possible. This implies that therate of foreign in‡ation is constant at a 1.5 per cent level, the rate of growth offoreign demand for domestic export grows - for given relative prices - at the rateof Harrod-neutral technological progress in the domestic country, which also isassumed to be 1.5 per cent. The nominal foreign interest rate is kept constantthrough time at a level of 5.56 per cent, amounting to a real interest rate of4.0 per cent. These assumptions are made to dampen the e¤ects on the domesticeconomy in order to isolate the e¤ects of the domestic demographic ageing. Theseassumptions imply that any e¤ects of demographic ageing on the world economyare ignored.
12This implies that the potential pressure from international tax competition on, e.g., corpo-rate taxation and capital income taxation is ignored. The same is true for the cross-border tradee¤ects on indirect tax rates.
16
4. Tax Smoothing
4.1. Macroeconomic performance
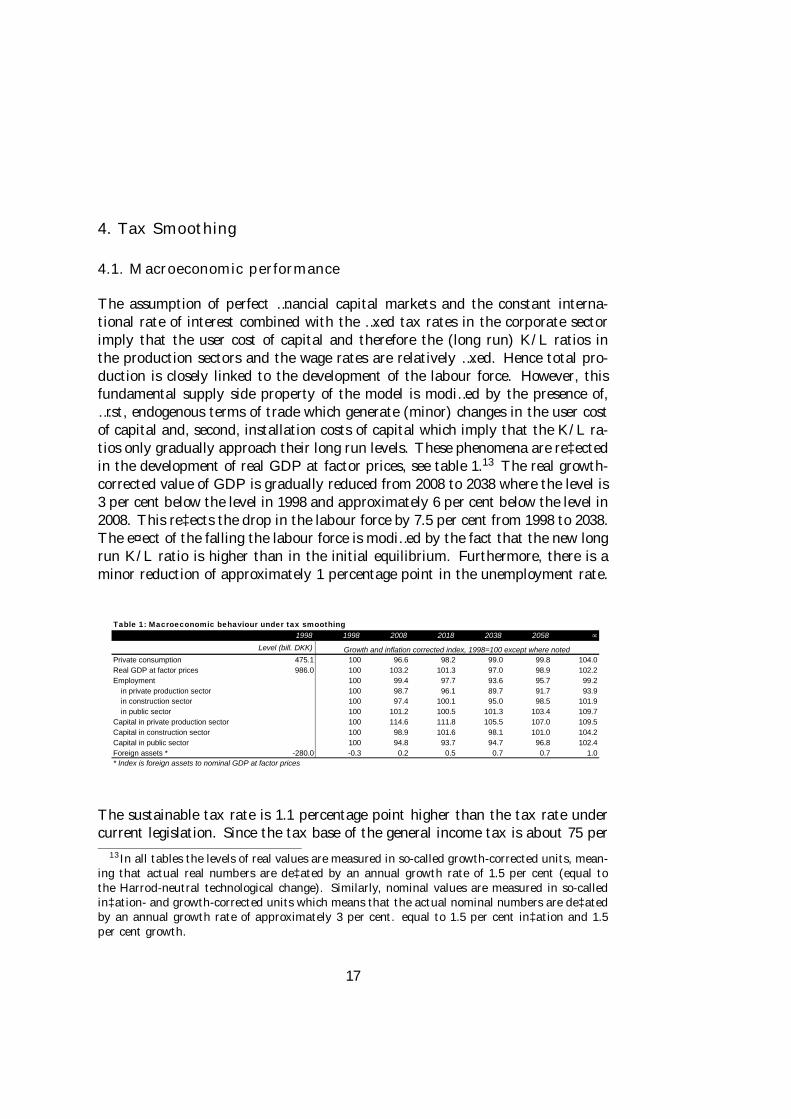
The assumption of perfect …nancial capital markets and the constant interna-tional rate of interest combined with the …xed tax rates in the corporate sectorimply that the user cost of capital and therefore the (long run) K/L ratios inthe production sectors and the wage rates are relatively …xed. Hence total pro-duction is closely linked to the development of the labour force. However, thisfundamental supply side property of the model is modi…ed by the presence of,…rst, endogenous terms of trade which generate (minor) changes in the user costof capital and, second, installation costs of capital which imply that the K/L ra-tios only gradually approach their long run levels. These phenomena are re‡ectedin the development of real GDP at factor prices, see table 1.13 The real growth-corrected value of GDP is gradually reduced from 2008 to 2038 where the level is3 per cent below the level in 1998 and approximately 6 per cent below the level in2008. This re‡ects the drop in the labour force by 7.5 per cent from 1998 to 2038.The e¤ect of the falling the labour force is modi…ed by the fact that the new longrun K/L ratio is higher than in the initial equilibrium. Furthermore, there is aminor reduction of approximately 1 percentage point in the unemployment rate.
Table 1: Macroeconomic behaviour under tax smoothing 1998 1998 2008 2018 2038 2058 ∞
Level (bill. DKK)
Private consumption 475.1 100 96.6 98.2 99.0 99.8 104.0Real GDP at factor prices 986.0 100 103.2 101.3 97.0 98.9 102.2Employment 100 99.4 97.7 93.6 95.7 99.2
in private production sector 100 98.7 96.1 89.7 91.7 93.9in construction sector 100 97.4 100.1 95.0 98.5 101.9in public sector 100 101.2 100.5 101.3 103.4 109.7
Capital in private production sector 100 114.6 111.8 105.5 107.0 109.5Capital in construction sector 100 98.9 101.6 98.1 101.0 104.2Capital in public sector 100 94.8 93.7 94.7 96.8 102.4Foreign assets * -280.0 -0.3 0.2 0.5 0.7 0.7 1.0* Index is foreign assets to nominal GDP at factor prices
Growth and inflation corrected index, 1998=100 except where noted
The sustainable tax rate is 1.1 percentage point higher than the tax rate undercurrent legislation. Since the tax base of the general income tax is about 75 per
13 In all tables the levels of real values are measured in so-called growth-corrected units, mean-ing that actual real numbers are de‡ated by an annual growth rate of 1.5 per cent (equal tothe Harrod-neutral technological change). Similarly, nominal values are measured in so-calledin‡ation- and growth-corrected units which means that the actual nominal numbers are de‡atedby an annual growth rate of approximately 3 per cent. equal to 1.5 per cent in‡ation and 1.5per cent growth.
17

cent of GDP, this amounts to raising taxes by 0.75 per cent of GDP. Therefore,current …scal policy in not sustainable, but the necessary adjustment is relativelysmall.
The substantial improvement of the net foreign asset position is another remark-able feature of the dynamic adjustment. This re‡ects the fact that the K/L ratiosare fairly …xed. Clearly, as the labour force is falling quite dramatically, real in-vestments must also fall, and savings have to be directed towards accumulationof foreign assets. This e¤ect is enhanced by an assumed net saving e¤ect from thelabour market pension schemes, see also Ministry of Economic A¤airs (2000).14
This e¤ect also explains why private consumption in the new steady state hasincreased by 4 per cent compared to 1998.
4.2. The public budget
Changing demographics are re‡ected in the public expenditures. First of all, theincreased old-age dependency ratio that peaks in 2038 leads to an increase in theexpenditures to social pensions relative to GDP at factor prices by 2.4 percentagepoints. The total e¤ects on expenditures relative to GDP from public transfersamount to an increase by 3.9 percentage points. Hence other transfers haveincreased, mostly increased pension payments from the (public) labour marketpension fund (ATP).
From 1998 to 2038 the value of the age-dependent public consumption relativeto GDP at factor prices increases by 2.7 percentage points, and total publicexpenditures relative to GDP increase by 8.6 percentage points. The increasein the non-age-dependent public expenditures is due to an increase in the publicinvestments to keep a constant capital output ratio in the public production andan increase in the interest payments on public debt.
14This e¤ect is included in the model to account for the possibility that mainly young house-holds may be rationed in the capital markets. As DREAM assumes perfect capital markets, thise¤ect appears technically in the sense that the planning horizon of the household is shorter thanthe expected lifetime used by the actuarial fair pensions funds.
18

Table 2: Public expenditures and revenues under tax smoothing1998 1998 2008 2018 2038 2058 ∞
Level (bill. DKK)Expenditures 559.6 56.8 58.4 60.6 65.3 64.7 64.6
Social pensions * 102.6 10.4 10.8 11.7 12.8 11.8 11.9Civil servants' pension, ATP and LD 17.3 1.8 2.6 3.4 3.2 3.1 3.0Age dependent public transfers 87.8 8.9 8.4 8.4 8.9 8.8 8.8Age dependent public consumption 206.6 21.0 21.6 21.8 23.6 23.6 24.5Total of age dependent exp. 414.3 42.0 43.3 45.3 48.6 47.2 48.1Other expenditures 145.3 14.7 15.1 15.3 16.8 17.5 16.5
Tax revenues 573.1 58.1 57.9 59.5 62.4 62.7 63.5Social pensions * 26.6 2.7 2.7 2.9 3.2 2.9 2.9Civil servants' pension, ATP and LD 7.2 0.7 1.0 1.4 1.3 1.3 1.2Labour market pensions 8.1 0.8 0.9 1.3 2.6 3.5 3.7Private pensions 6.8 0.7 0.7 0.8 1.4 1.1 1.2Pension funds 3.9 0.4 0.9 1.3 2.0 2.1 2.2Other taxes 520.6 52.8 51.8 51.8 52.0 51.9 52.2
Net debt 253.3 25.7 19.4 24.6 56.7 66.1 41.7* Early retirement benefits, early retirement pensions, transitional benefits and public old-age pensions
Percentage of nominal GDP at factor costs
Total revenues relative to GDP at factor prices increase by 4.3 percentage pointfrom 1998 to 2038. The automatic increase in the tax base of the personal incometaxation from pension payments from the funded pension system accounts for 2.5percentage points of this increase in revenues. The taxation of capital incomein the pension funds accounts for 1.6 percentage points.15 The combined e¤ectof the reduced labour force and the increased tax rate keeps the remaining taxrevenues fairly constant.
Two features are particularly noteworthy. First, we …nd that the increase intaxation from the pension funds …nances almost half of the increase in the ex-penditures due to the change in the demographic composition of individuals.Therefore, the …nancial burden is signi…cantly reduced by the tax base e¤ect.Second, the increase in the public revenue constitutes only half of the increase inthe expenditures (both measured relative to GDP). In other words, generationsliving until 2038 only …nances half of the demographic burden, and the rest is leftfor future generations through a huge increase in public debt. Indeed, the netpublic debt-GDP ratio increases from 25 per cent in 1998 to 57 per cent in 2038.It peaks at approximately 67 per cent around 2060 and is hereafter graduallyreduced to a steady state level of 42 per cent.
Moreover, table 2 shows that the increase in the tax revenue from the automaticincrease in the tax base continues until 2058 and therefore contributes to generatepublic surpluses that gradually reduce the public debt to the steady state level.Again, this indicates that the introduction of funded pension schemes in the Dan-
15This is a gross e¤ect. Private savings are reduced to partially o¤set the increase in pensionssavings, which tends to reduce the revenue from the personal capital income tax.
19

ish economy came too late to fully match the increase in the public expendituredriven by the ageing of the large postwar generations.
So, although the public sector ful…ls its intertemporal budget constraint, severalyears during the transition period will be characterized by budget de…cits andassociated debt accumulation. Is this a matter of concern? It is hard to say,but as a participant in the EMU (though not the …nal stage), economic policy inDenmark is somehow restricted by the Maastricht …scal criteria.16 If these criteriaare repeatedly violated over the next …ve decades, a strategy of tax smoothingcould not only upset Denmark’s partners in the EU but also run into problemssuch as higher costs of …nancing public debt (Alesina, De Broeck and Tabellini,1993).
4.3. Generational accounts
We now turn to an examination of the (inter)generational properties of a strategyof tax smoothing. For that purpose we construct individual generational accounts,here reported as the discounted value of the sum of public transfers and publicconsumption net of the discounted value of the sum of direct and indirect taxespaid during the remaining lifetime of a representative member of each (currentand future) generation.
Figure 1: Generational accounts under tax smoothingThousand DDK per adult
-150-100-50
050
100150200
1940 1960 1980 2000 2020 2040
Generation
Net
rec
eive
men
t fro
m p
ublic
se
ctor
16These well-known criteria are that the gross public debt-GDP ratio must not exceed 60 percent and that the annual public de…cit-GDP ratio must not exceed 3 per cent.
20
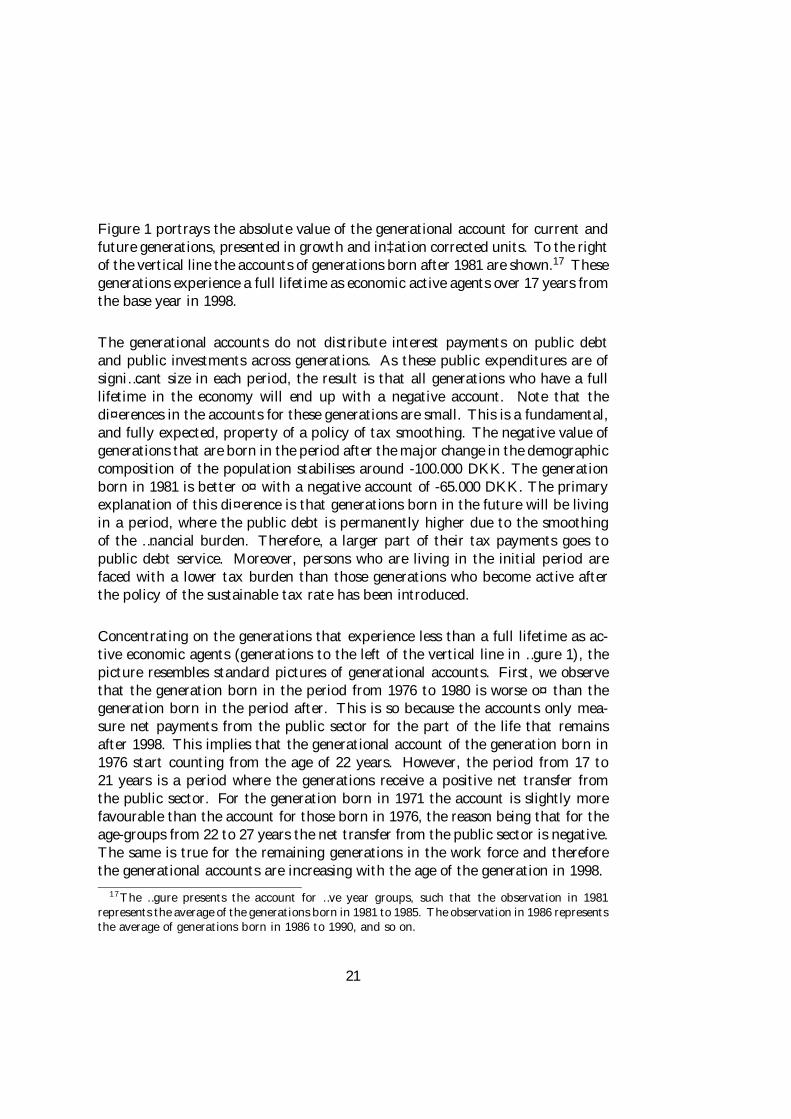
Figure 1 portrays the absolute value of the generational account for current andfuture generations, presented in growth and in‡ation corrected units. To the rightof the vertical line the accounts of generations born after 1981 are shown.17 Thesegenerations experience a full lifetime as economic active agents over 17 years fromthe base year in 1998.
The generational accounts do not distribute interest payments on public debtand public investments across generations. As these public expenditures are ofsigni…cant size in each period, the result is that all generations who have a fulllifetime in the economy will end up with a negative account. Note that thedi¤erences in the accounts for these generations are small. This is a fundamental,and fully expected, property of a policy of tax smoothing. The negative value ofgenerations that are born in the period after the major change in the demographiccomposition of the population stabilises around -100.000 DKK. The generationborn in 1981 is better o¤ with a negative account of -65.000 DKK. The primaryexplanation of this di¤erence is that generations born in the future will be livingin a period, where the public debt is permanently higher due to the smoothingof the …nancial burden. Therefore, a larger part of their tax payments goes topublic debt service. Moreover, persons who are living in the initial period arefaced with a lower tax burden than those generations who become active afterthe policy of the sustainable tax rate has been introduced.
Concentrating on the generations that experience less than a full lifetime as ac-tive economic agents (generations to the left of the vertical line in …gure 1), thepicture resembles standard pictures of generational accounts. First, we observethat the generation born in the period from 1976 to 1980 is worse o¤ than thegeneration born in the period after. This is so because the accounts only mea-sure net payments from the public sector for the part of the life that remainsafter 1998. This implies that the generational account of the generation born in1976 start counting from the age of 22 years. However, the period from 17 to21 years is a period where the generations receive a positive net transfer fromthe public sector. For the generation born in 1971 the account is slightly morefavourable than the account for those born in 1976, the reason being that for theage-groups from 22 to 27 years the net transfer from the public sector is negative.The same is true for the remaining generations in the work force and thereforethe generational accounts are increasing with the age of the generation in 1998.
17The …gure presents the account for …ve year groups, such that the observation in 1981represents the average of the generations born in 1981 to 1985. The observation in 1986 representsthe average of generations born in 1986 to 1990, and so on.
21

5. Debt Smoothing
5.1. The macroeconomy and public …nances
The aim of this section is to consider the trade-o¤ between intergenerationalburden sharing and the accumulation of public debt. The policy rule discussedin the previous section is therefore contrasted with a policy rule that keeps thegrowth-corrected value of the public debt constant (”debt smoothing”). Thispolicy goal is obtained by adjusting the base tax rate of personal income .
As noted already, the change in the demographic dependency ratio after 2040,combined with the fact that tax revenues from pension payments from the fundedpension system is growing faster than the rest of the economy until 2070, implythat the long run …nancial burden of the demographic change is lower than thetemporary burden around 2040. Therefore, the tax rate of the personal income taxsystem is higher under debt smoothing compared to tax smoothing throughoutthe …rst half of this century. Thereafter the picture is reversed, which of course isdue to the lower interest payment on public debt in the debt smoothing scenario.The base tax rate peaks in 2038 at a level 3.5 per cent higher than the announcedbase tax rate in 2003, which is 2.4 percentage points higher than in the taxsmoothing case. In 2058 the tax rate falls slightly below the smooth tax rate, andin the long run the base tax rate falls to a level similar to the announced tax ratefor 2003.
The macroeconomic consequences of this change in the tax policy are very smallon the supply side of the economy, whereas the level of aggregate consumption isreduced relative to the tax smoothing scenario in the period where the tax rateis higher than the smooth tax rate. In 2058 aggregate consumption is identicalin the two scenaria and from this point on the private consumption is higher inthe debt smoothing scenario. This pattern of consumption simply re‡ects thepattern of the tax rate in the two scenarios.
In the debt smoothing scenario the total expenditures relative to GDP at factorprices increase by 7.3 percentage points from 1998 to the peak in 2038. This is1.3 percentage points lower than in the tax smoothing scenario. The di¤erence isentirely due to a reduction in the interest payments on public debt. Total publicrevenues increase by 5.4 percentage points. The reason why this is su¢cientto keep the public debt ratio constant, even if the expenditures increase by 1.9
22

percentage point more, is that there is a public surplus in 1998. This is turnedinto a de…cit to keep the debt growing at the same rate of GDP.
5.2. Generational accounts and equivalent variation
As reported in the previous subsection the only major macroeconomic conse-quence of the policy change is the reduction in the public debt and the increasein the tax rate. Therefore, the change in policy may be considered as a purechange in the trade-o¤ between intergenerational burden sharing and the devel-opment in the public debt.
Figure 2: Absolute difference in generational accounts(debt smoothing vs. tax smoothing)
Thousand DDK per adult
-10
-5
0
5
10
15
20
1900 1950 2000 2050 2100
Generation
Cha
nge
in G
As
Figure 2 reports the changes in the generational accounts of the di¤erent gener-ations, when comparing the debt smoothing polity to the tax smoothing policy.Not surprisingly, the …gure reveals that generations currently alive and genera-tions born before 2006 will end up having a lower (a more negative) net valueof their generational account. Of course, this re‡ects that these generations areactive in the economy in the period, where the tax rate is higher in the debtsmoothing scenario. The generation that has the largest loss in net value is thegeneration that becomes active in 1998. The loss for this generation is 6.000DKK per adult. Generations born after 2006 have a higher net value of theirgenerational account in the debt smoothing scenario. These generations becomeactive in the economy in 2023, which is at the time, where the public debt is
23

rapidly increasing in the tax smoothing scenario. In the debt smoothing scenariothe …nancing of the interest payments on public debt is lower and hence the taxrate needed to …nance public expenditures is lower. This generates the increasein the net value of the generational accounts. For generations born after 2050the increase stabilises around 15.000 DKK per adult measured in growth andin‡ation corrected units.
A di¤erent approach to measuring the intergenerational distribution is to computethe equivalent variation (EV) for each generation. This measures the amount ofmoney per adult that a generation is willing to pay (measured in the prices ofthe tax smoothing scenario) for a shift of policy to the debt smoothing scenario.A negative amount therefore means that the generation is worse of in the debtsmoothing scenario.
EV may be reduced to a measure of the relative change in utility times the initialstock of …nancial and human capital of the household in question.18 The utilityfunction of the households in DREAM is traditional in the sense that it is de…nedover the set of private consumption goods and leisure. The individual publicconsumption does therefore not a¤ect the EV measure. However, the presentpolicy change does not involve public consumption, and therefore EV may beconsidered a measure of ”total” utility including individual public consumptioni¤ the utility function is speci…ed as additive separable in the individual publicconsumption.
Figure 3: Equivalent variationThousand DDK per adult
-20
-10
0
10
20
30
40
1900 1950 2000 2050 2100
Generation
Pay
men
t fro
m g
ener
atio
n
18For a derivation of the EV measure in DREAM, see Madsen (2000).
24

As shown in …gure 3, the similarity between the EV measure and the genera-tional accounts reported in Figure 2 is striking. The generations that are worseo¤ according to the EV measure is approximately the same as the generationsthat experience a reduction in their generational account. This means that thegenerations that are currently active in the labour market and the generationsborn in the near future are worse o¤ in the debt smoothing scenario, whereasgenerations born later in the future are better o¤ in this scenario. Only thegenerations born between 2006 and 2016 experience a di¤erent evolution in thegenerational account and the EV measure. These generations have higher valuesin the generational accounts but are worse o¤ according to the EV measure.
The reason for the similarity between the two measures is that in both cases thechange is driven by the shift in the tax burden of the generation in question. Anincrease in the tax burden directly reduces the generational account, since thepublic consumption is (almost) una¤ected by the policy change. In case of theEV measure, the increased tax burden faced by the generation implies that theafter-tax value of income is reduced, and therefore, the total consumption bundlethat the generation can a¤ord over the life time is reduced. This in turn reducesutility and hence the EV becomes negative. The reason why the generations bornin 2006 to 2016 experience an increase in the value of the generational account,and at the same time a decrease in the EV is that the bequest from the parentgenerations is lower because the parent generations are poorer, since they face anincreased tax burden.19
Finally, a social welfare function is constructed to measure the total e¤ect onsociety from the policy change. The change in the social welfare function is givenas the discounted sum of the population weighted EV measures of each generation.The discount rate is assumed to be the international rate of interest.20 Using thiswelfare function the tax smoothing policy is found to be preferable to society whencompared to the debt smoothing policy. The one-o¤ gain from implementing thetax smoothing policy amounts to 0.6 per cent of GDP in factor prices.
This result is in line with the standard argument in favour of tax smoothing, whichis that convex distortionary e¤ects of taxes make a smooth rate of taxation over
19Minor reduction in the overall activity due to general equilibrium e¤ects also pull the resultin this direction.
20The social welfare function may be criticized on the grounds that the discounting of eachgenerations EV measure is ad hoc. The standard argument for using the international interestrate is that this represents the alternativ costs for the public sector when transfering wealthbetween generations.
25

time preferable to a ‡uctuating one (Barro, 1979). In DREAM the distortion ofthe base tax rate of the personal income taxation is low, due to the presence of animperfectly competitive labour market, and the fact that all transfers includingunemployment bene…ts are taxed according to the personal income tax system.The latter implies that a reduction in the base tax rate, which leads to higherafter tax wage income also leads to a higher income for the unemployed (since thetax rate on bene…ts is also reduced). Therefore the improvement in the incentiveto become employed is very modest. Hence, the absolute value of the gain fromthe tax smoothing is also modest.21
6. Concluding remarks
The current macroeconomic position of the Danish economy is favourable, with alow rate of unemployment and signi…cant surpluses on both the public budget andthe current account of the balance of payments. Therefore, the initial position ofthe economy tends to be relatively good, when it becomes faced with the problemof the increased age burden in the near future. The structural shift towards higherdependency on fully funded pension schemes also has a signi…cant positive e¤ecton the Danish economy’s ability to face the demographic challenges.
Structural reforms of the tax system have improved the incentives to save. Thismay be very important in the case of Denmark, as a low propensity to savehistorically has been a major problem. However, faced with the prospect of areduced labour force, the structural improvements from lower marginal tax ratesand from increased incentives for the unskilled to become employed are needed.Also, welfare reforms to increase the incentives to enter the labour force couldfurther improve the position of the economy.
The …rst main conclusion of our analysis is that the …scal policy in Denmarkis almost sustainable, in the sense that a smooth tax rate, which ful…ls the in-tertemporal budget constraint of the public sector is only 1.1 percentage pointhigher than the announced base tax rate for 2003. The second main conclusionis that perfect tax smoothing succeeds in smoothing the …nancial burden of thedemographic changes between the generations. Unfortunately, this is obtained atthe cost of a large and fast increase in the public debt from 2020 to 2040. There-fore, a policy of debt smoothing was considered. The result was that this leads
21Even without these e¤ects from the taxation of the alternative to employment, the gainfrom tax smoothing in CGE models tends to be small.
26

to a minor shifting of the …nancial burden onto the currently living generations.It also leads to a minor loss in social e¢ciency compared to the tax smoothingpolicy. However, the magnitude of these costs was found to be relative small.
Overall, we conclude that a precautionary …scal policy that abstains from perfecttax smoothing and increases the …nancial burden of currently living generationsrelative to future generations may be advisable.
References
[1] Alesina, A, M. De Broeck and G. Tabellini, 1993, Default risk on governmentdebt in OECD countries, Economic Policy 14, 428-463
[2] Auerbach, A. and L. Kotliko¤, 1987, Dynamic …scal policy (Cambridge Uni-versity Press: Cambridge)
[3] Danish Economic Council, 1998, Dansk økonomi: December 1998 (Copen-hagen: Economic Council)
[4] European Commission, 2000, Progress report to the Eco…n Council on theimpact of ageing populations on public pension systems (Brussels: EuropeanCommission).
[5] Fehr, H., 2000, Pension reform during the demographic transition, Scandi-navian Journal of Economics 102, 419-443.
[6] Fehr, H. and L. Kotliko¤, 1997, Generational accounting in general equilib-rium, Finanzarchiv 53, 1-27.
[7] Fougère, M. and M. Mèrette, 2000, Population ageing, intergenerationalequity, and growth: analysis with an endogenous growth overlapping-generations model, in: G. W. Harrison, S.H. Jensen, L.H Pedersen and T.F.Rutherford, eds., Using dynamic general equilibrium models for policy anal-ysis (North-Holland, Amsterdam).
[8] Hansen, N. P., S.H. Jensen and M. Junge, 1999, Government solvency, socialsecurity and debt reduction in Denmark, in: T.M. Andersen, S.H. Jensenand O. Risager, eds., Macroeconomic perspectives on the Danish economy(Macmillan: London)
[9] Jensen, S.H. and S.B. Nielsen, 1995, Population ageing, public debt andsustainable …scal policy, Fiscal Studies 16, 1-20.
27

[10] Jensen, S.H. and B. Ra¤elhüschen, 1997, Generational and gender-speci…caspects of the tax and transfer system in Denmark, Empirical Economics 22,615-635.
[11] Jensen, S.H. and B. Ra¤elhüschen, 1999, Public debt, welfare reforms, andintergenerational distribution of tax burdens in Denmark’, in: A. Auerbach,L. Kotliko¤ and W. Leibfritz, eds., Generational accounting around the world(Chicago: University of Chicago Press).
[12] Knudsen, M. B., L. H. Pedersen, T. W. Petersen, P. Stephensen and P.Trier, 1998, Danish Rational Economic Agents Model - DREAM Version 1.2,working paper, Statistics Denmark, available at http://www.dst.dk/dream
[13] Knudsen, M. B., L. H. Pedersen, T. W. Petersen, P. Stephensen and P. Trier,1999, Dynamic calibration of a CGE model with a demographic application,working paper, Statistics Denmark, available at http://www.dst.dk/dream
[14] Madsen, A. D., 2000, Velfærdse¤ekter ved skattesænkninger i DREAM, Eco-nomic Modelling Working Paper Series 2000:5, Statistics Denmark, availableat http://www.dst.dk/dream
[15] Miles, D., 1999, Modelling the impact of demographic change upon the econ-omy, The Economic Journal 109, 1-36
[16] Ministry of Economic A¤airs, 2000, A sustainable pension system (Copen-hagen: Schultz Information).
[17] Pedersen, L. H., P. Stephensen and P. Trier, 1999, A CGE analysis of theDanish ageing problem, working paper, Statistics Denmark, available athttp://www.dst.dk/dream
[18] Pedersen, L. H. and P. Trier, 2000, Har vi råd til velfærdsstaten?, EconomicModelling Working Paper Series 2000:4, Statistics Denmark, available athttp://www.dst.dk/dream
[19] Petersen, T. W., 1999, Befolkningsprognose til år 2100, mimeo, available athttp://www.dst.dk/dream’
[20] Ra¤elhüschen, B. and A. Risa, 1997, Generational accounting and intergen-erational welfare, Public Choice 93, 149-163.
28

The Working Paper SeriesThe Working Paper Series of the Economic Modelling Unit of Statistics Denmarkdocuments the development of the two models, DREAM and ADAM. DREAM(Danish Rational Economic Agents Model) is a relatively new computable generalequilibrium model, whereas ADAM (Aggregate Danish Annual Model) is a Danishmacroeconometric model used by e.g. government agencies.
The views presented in the issues of the working paper series are those of theauthors and do not constitute an official position of Statistics Denmark.
The Working Paper Series contains documentation of parts of the models, topicbooklets, and examples of using the models for specific policy analyses. Further-more, the series contains analyses of relevant macroeconomic problems – analysesof both theoretical and empirical nature. Some of the papers discuss topics ofcommon interest for both modelling traditions.
The papers are written in either English or Danish, but papers in Danish will containan abstract in English. If you are interested in back numbers or in receiving theWorking Paper Series, phone the Economic Modelling Unit at (+45) 39 17 32 02,fax us at (+45) 39 17 39 99, or e-mail us at [email protected] or [email protected], you can also visit our Internet home pages at http://www.dst.dk/adamor http://www.dst.dk/dream and download the Working Paper Series from there.
The following titles have been published previously in the Working Paper Series,beginning in January 1998.
******************
1998:1 Thomas Thomsen: Faktorblokkens udviklingshistorie, 1991-1995. (Thedevelopment history of the factor demand system, 1991-1995). [ADAM]
1998:2 Thomas Thomsen: Links between short- and long-run factor demand.[ADAM]
1998:3 Toke Ward Petersen: Introduktion til CGE-modeller. (An introduction toCGE-modelling). [DREAM]

1998:4 Toke Ward Petersen: An introduction to CGE-modelling and an illustrativeapplication to Eastern European Integration with the EU. [DREAM]
1998:5 Lars Haagen Pedersen, Nina Smith and Peter Stephensen: WageFormation and Minimum Wage Contracts: Theory and Evidence fromDanish Panel Data. [DREAM]
1998:6 Martin B. Knudsen, Lars Haagen Pedersen, Toke Ward Petersen, PeterStephensen and Peter Trier: A CGE Analysis of the Danish 1993 TaxReform. [DREAM]
* * * * *
1999:1 Thomas Thomsen: Efterspørgslen efter produktionsfaktorer i Danmark.(The demand for production factors in Denmark). [ADAM]
1999:2 Asger Olsen: Aggregation in Macroeconomic Models: An EmpiricalInput-Output Approach. [ADAM]
1999:3 Lars Haagen Pedersen and Peter Stephensen: Earned Income Tax Creditin a Disaggregated Labor Market with Minimum Wage Contracts. [DREAM]
1999:4 Carl-Johan Dalgaard and Martin Rasmussen: Løn-prisspiraler ogcrowding out i makroøkonometriske modeller. (Wage-price spirals andcrowding out in macroeconometric models). [ADAM]
* * * * *
2000:1 Lars Haagen Pedersen and Martin Rasmussen: Langsigtsmultiplikatorer iADAM og DREAM – en sammenlignende analyse (Long run multipliersin ADAM and DREAM – a comparative analysis).
2000:2 Asger Olsen: General Perfect Aggregation of Industries in Input-OutputModels [ADAM]
2000:3 Asger Olsen and Peter Rørmose Jensen: Current Price Identities inMacroeconomic Models [ADAM]
2000:4 Lars Haagen Pedersen & Peter Trier: Har vi råd til velfærdsstaten? (Is the

fiscal policy sustainable?). [DREAM]
2000:5 Anders Due Madsen: Velfærdseffekter ved skattesænkninger i DREAM.(Welfare Effects of Tax Reductions in DREAM). [DREAM]
* * * * *
2001:1 Svend Erik Hougaard Jensen, Ulrik Nødgaard & Lars Haagen Pedersen:Fiscal Sustainability and Generational Burden Sharing in Denmark.[DREAM]