Embed Size (px)
Citation preview

COMPTROLLEROffice of the NEW YORK STATE
Fiscal Stress Monitoring System Manual
NOVEMBER 2017
New York State Comptrol ler
THOMAS P. DiNAPOLI

2 Fiscal Stress Monitoring System Manual
IntroductionLocal governments and school districts are on the frontline of service delivery in New York State, and their financial stability is of interest to the public at large and many specific stakeholders. The State Comptroller has a Constitutional and statutory function to examine and report on the financial affairs and condition of local governments and school districts. In conjunction with this role, the Office of the State Comptroller (OSC) developed and launched the Fiscal Stress Monitoring System (System) in 2013. In 2017, OSC implemented System enhancements, reflecting four years of operational experience as well as feedback collected during a 75-day public comment period.
Each year, the System assesses each of the State’s counties, cities, towns, villages and school districts, identifying those entities experiencing notable levels of fiscal stress, as well as those showing susceptibility to fiscal stress. New York City is excluded from this analysis, due to its unique financial structure.
Through this program, OSC provides the public with objective information highlighting communities in need of timely and corrective attention. Ideally, local officials use the System analysis to pursue local actions in an orderly, transparent and inclusive manner—to minimize disruption to vital services and maximize citizen engagement. Similarly, the System allows State leaders to be better informed as to the overall fiscal climate in which these entities operate.
This manual provides a basic discussion about the System while accompanying technical appendices provide details about the methodology OSC staff utilize in performing the assessments.
3Industrial Development AgenciesFiscal Stress Monitoring System Manual
System Basics
Focus: What We Measure
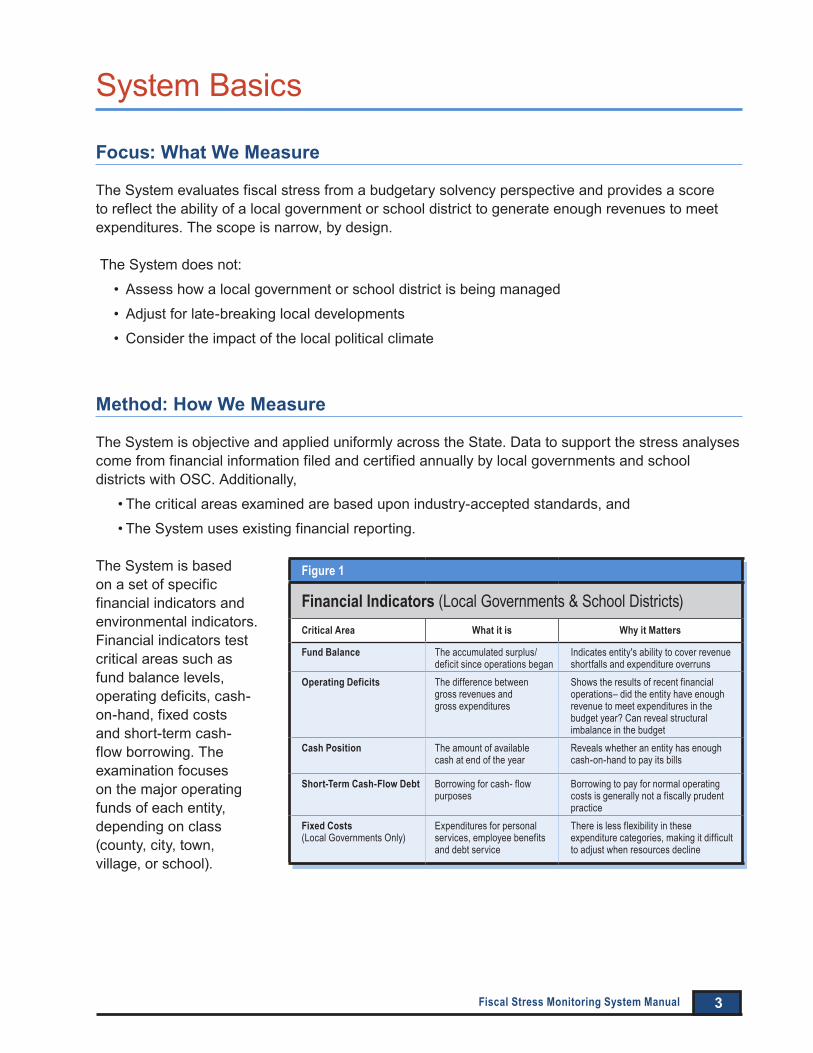
The System evaluates fiscal stress from a budgetary solvency perspective and provides a score to reflect the ability of a local government or school district to generate enough revenues to meet expenditures. The scope is narrow, by design.
The System does not:
• Assess how a local government or school district is being managed
• Adjust for late-breaking local developments
• Consider the impact of the local political climate
Method: How We Measure
The System is objective and applied uniformly across the State. Data to support the stress analyses come from financial information filed and certified annually by local governments and school districts with OSC. Additionally,
• The critical areas examined are based upon industry-accepted standards, and
• The System uses existing financial reporting.
The System is based on a set of specific financial indicators and environmental indicators. Financial indicators test critical areas such as fund balance levels, operating deficits, cash-on-hand, fixed costs and short-term cash-flow borrowing. The examination focuses on the major operating funds of each entity, depending on class (county, city, town, village, or school).
Figure 1
Financial Indicators (Local Governments & School Districts)Critical Area What it is Why it Matters
Fund Balance The accumulated surplus/deficit since operations began
Indicates entity's ability to cover revenue shortfalls and expenditure overruns
Operating Deficits The difference between gross revenues and gross expenditures
Shows the results of recent financial operations– did the entity have enough revenue to meet expenditures in the budget year? Can reveal structural imbalance in the budget
Cash Position The amount of available cash at end of the year
Reveals whether an entity has enough cash-on-hand to pay its bills
Short-Term Cash-Flow Debt Borrowing for cash- flow purposes
Borrowing to pay for normal operating costs is generally not a fiscally prudent practice
Fixed Costs (Local Governments Only)
Expenditures for personal services, employee benefits and debt service
There is less flexibility in these expenditure categories, making it difficult to adjust when resources decline

4 Fiscal Stress Monitoring System Manual
Separately, environmental indicators assess a different set of critical areas that, unlike the financial indicators, are generally outside the direct control of local leaders (e.g. tax base and population growth, reliance on state and federal revenues, poverty levels etc.). In addition to information filed with OSC, data for environmental indicators come from other Federal and State sources including the American Community Survey, U.S. Bureau of Labor Statistics, U.S. Department of Health and Human Services, the New York State Education Department and the New York State Office of Real Property Tax Services.
For school districts, System calculations are also based on a set of specific financial and environmental indicators. School financial indicators test critical areas such as fund balance levels, operating deficits, cash-on-hand and short-term cash-flow borrowing while school environmental indicators examine key areas such as poverty levels, class size, school budget support etc.
For general discussion purposes, Figures 1-3 provide abbreviated summaries of the financial and environmental indicators. Detailed, technical descriptions are available in Appendices A-D.
Figure 2
Environmental Indicators (Local Governments)Critical Area What it is Why it Matters
Population 5-yr change in population Provides insight into health of local economy. Affects local property values and tax base
Poverty Households on public assistance Provides insight about mix of services
needed by the community–some of which are higher cost (e.g. healthcare, public transportation)
Age Percent of population < 18 and > 65 (those not likely to be working full time)
Tax Base Percent change in home values Reflects health of local economy and ability to raise revenue through property taxes
Income Median Household Income Reflects ability of a household to pay property taxes and support local economy (e.g. generate sales tax receipts)Unemployment Unemployment rate
State and Federal Revenue
Reliance on state and federal aid These revenues are not controlled locally. Significant dependence presents a revenue risk
Figure 3
Environmental Indicators (School Districts)Critical Area What it is Why it Matters
Poverty Percentage of economically disadvantaged students
Provides insights about service needs within a district
Class Size Number of students in class Reflects possible future costs for a school district (e.g. need for new buildings, additional teachers etc)Teacher Turnover Teacher turnover rate
Tax Base Percent change in property value Reflects health of local economy and ability to raise revenues through property taxes
Budget Support Budget vote approval percentage Community support affects ability of district to incur anticipated expenditures
English Language Learners
Percent of students with English as a second language
Provides insights about future cost growth

5Industrial Development AgenciesFiscal Stress Monitoring System Manual
ScoringThe System weighs individual indicators according to relative importance. The results of an entity’s indicator calculations are evaluated on a 100-point scale, with the sum of the points yielding separate fiscal stress and environmental stress scores.
In basic terms, the more points an entity accumulates, the higher its score. Those entities with the highest scores on the financial indicators are subsequently listed on the Comptroller’s official fiscal stress list. As mentioned above, environmental scores provide useful information for local officials to reference as they field questions from citizens, local media and other interested parties.
ClassificationsThe System uses three categories of stress. They are the same for both the financial indicator and the environmental indicator results: Significant Stress, Moderate Stress and Susceptible to Stress.
In addition to those noted above, there are three additional classifications reflecting other possible scenarios:
• No Designation – for entities whose score results are below the established thresholds for one of the three stress categories. Importantly, this classification does not imply that the entity is free of all fiscal stress conditions.
• Inconclusive – for entities that did file financial data but still have significant unresolved issues associated with that data, as of the snapshot date.
• Not Filed – for entities that either did not submit their annual financial reports (each of the past three years) or did so very late (after the snapshot date)—well after the opportunity to be properly evaluated and scored has passed. This is perhaps the most troubling classification as not filing deprives citizens in these communities the full transparency they deserve from their local leaders. Entities in this category are not retroactively scored even after they submit their information.
Additional information about scoring methodology can be found in Appendix F.
What’s a Snapshot Date?
A snapshot date is the date scores are calculated and finalized. The annual financial report (AFR) must be filed and free of material outstanding issues on this date in order for an entity to receive a Fiscal Stress Monitoring System score.
Significant Stress
Susceptible to Stress
Moderate Stress

6 Fiscal Stress Monitoring System Manual
Timing: When We Measure
The System represents an ongoing commitment by OSC to maintain an objective and broad understanding about the fiscal challenges facing local communities in New York State.
Local governments and school districts are required to file their financial reports 60-120 days after the end of their fiscal year. OSC staff begin reviewing reports as soon as they are filed. System scores are typically available 7-9 months after the end of the local government or school district fiscal year.
Score releases occur three times each year. Entities are assigned to a release, based on their class type and fiscal year-end date. See Figure 4.
Since entities continue to be scored on an annual basis, the System allows users to track stress condition trends over time and get a realistic sense about where an individual community might be headed.
Verification ProcessAs OSC receives annual financial reports, Division staff perform a standardized review and follow-up with the local government or school officials, as necessary. A subset of specific data elements are then used in the fiscal stress calculations to preliminarily determine whether or not a unit might be in one of the stress categories. Once these entities are identified, additional contact and follow-up is made to review this information and resolve any data issues (e.g. data errors or inconsistencies). The entire process may involve multiple phone and email communications and often results in adjustments being submitted by individual entities. The process concludes with an official notification by OSC to the local government and school district officials, just prior to the public release of scores. This lengthy and rigorous review ensures that there are no surprises at the local level when the scores are announced. Figure 5 depicts the general process.
Figure 4
Release Type Fiscal Year(s) Ending
Timing of Release
Schools June 30 1st Quarter
Non-Calendar Year Local Governments: Some cities (including Big 4) and most villages
February 28 March 31
May 31 June 30 July 31
2nd Quarter
Calendar Year Local Governments: All counties and towns, most cities and a few villages
December 31 3rd Quarter

7Industrial Development AgenciesFiscal Stress Monitoring System Manual
Figure 5
EntityEntity files its Annual Financial
Report/ST-3 with OSCOSC staff screen financial
reports for fiscal stress and conduct additional reviews,
as appropriate
Entity + OSCOSC staff contact entity to resolve any issues or data
discrepancies found in review
OSC releases public scores with all supporting data and planning resources
OSC staff notify entity CEOs and CFOs (in writing) of final
stress score in the days prior to the public release
Entity + OSCOSC staff make a preliminary
determination of units in stress. These entities are contacted
again to confirm the accuracy of information submitted
OSC
Fiscal Stress Monitoring System: Verification Process
-A
� [if •••• B=
OSC
Entity + OSC
OSC also supports a range of helpful resources that go hand-in-hand with our fiscal stress monitoring function. Resources include a self-assessment tool, multiyear and capital planning guidance and the latest research reports. These tools are easy to use and publicly available on the OSC website.
www.osc.state.ny.us/localgov/fiscalmonitoring/index.htm

8 Fiscal Stress Monitoring System Manual
Coun
ty, C
ity, T
own,
or V
illage
Fin
ancia
l Indi
cato
rsCa
tego
ryIn
dica
tor
Scor
ing
Fisc
al
Year
End
Data
Req
uire
d an
d Ca
lcul
atio
nsPo
ssib
le Po
ints
Year
End
Fu
nd B
alan
ce
1As
signe
d and
Unas
signe
dFu
nd B
alanc
e
Gene
ral F
und
Curre
nt
Year
Data
Req
uire
d
25.0
025
18.75
12.5
06.
25 0
Point
s for
value
s ≤ 0
%
Point
s for
value
s > 0
% B
ut ≤
3.33
%Po
ints f
or va
lues >
3.3
3% B
ut ≤
6.67
%
Point
s for
value
s > 6
.67%
But
≤ 10
%
Point
s for
value
s > 10
%
Assig
ned a
nd U
nass
igned
Fun
d Bala
nce (
code
s 915
& 91
7)Gr
oss E
xpen
ditur
es
Calc
ulat
ion
Assig
ned a
nd U
nass
igned
Fun
d Bala
nce ÷
Gro
ss E
xpen
ditur
es
2 Tota
l Fu
nd B
alanc
e
Gene
ral F
und
Curre
nt
Year
Data
Req
uire
d
25.0
025
18.75
12.5
06.
25 0
Point
s for
value
s ≤ 0
%
Point
s for
value
s > 0
% B
ut ≤
10%
Po
ints f
or va
lues >
10%
But
≤ 15
%
Point
s for
value
s > 15
% B
ut ≤
20%
Point
s for
value
s > 2
0%
Tota
l Fun
d Bala
nce (
code
802
9)Gr
oss E
xpen
ditur
es
Calc
ulat
ion
Tota
l Fun
d Bala
nce ÷
Gro
ss E
xpen
ditur
es
Oper
atin
g De
ficits
3Op
erat
ing
Defic
it
Com
bine
d Fu
nds
2 Yea
rs
Prior
Data
Req
uire
d
10.0
0
106.
673.
33 0
Point
s for
value
s = D
efici
t < 0
% in
3/3
Las
t Fisc
al Ye
ars
Point
s for
value
s = D
efici
t < 0
% in
2/3
Las
t Fisc
al Ye
ars
Po
ints f
or va
lues =
Def
icit <
0%
in 1/
3 Las
t Fisc
al Ye
ars
Point
s for
value
s = D
efici
t < 0
% in
0/3
Las
t Fisc
al Ye
ars
Gros
s Rev
enue
sGr
oss E
xpen
ditur
esCa
lcul
atio
n(G
ross
Rev
enue
s - G
ross
Exp
endit
ures
) ÷ G
ross
Exp
endit
ures
Prior
Ye
ar
Data
Req
uire
dGr
oss R
even
ues
Gros
s Exp
endit
ures
Calc
ulat
ion
(Gro
ss R
even
ues -
Gro
ss E
xpen
ditur
es) ÷
Gro
ss E
xpen
ditur
es
Curre
nt
Year
Data
Req
uire
dGr
oss R
even
ues
Gros
s Exp
endit
ures
Calc
ulat
ion
(Gro
ss R
even
ues -
Gro
ss E
xpen
ditur
es) ÷
Gro
ss E
xpen
ditur
es
Cash
Po
sitio
n
4Ca
sh
Ratio
Com
bine
d Fu
nds
Curre
nt
Year
Data
Req
uire
d
10.0
010
6.67
3.33 0
Point
s for
value
s ≤ 5
0%
Point
s for
value
s > 5
0% B
ut ≤
75%
Point
s for
value
s > 75
% B
ut ≤
100%
Point
s for
value
s > 10
0%
Cash
and
Inve
stmen
ts (co
des 2
00-2
23,4
50,4
51)
Net C
urre
nt Lia
bility
(cod
es 6
00-6
26, 6
31-6
37 &
639
-668
less
code
s 280
,290
,295
)Ca
lcul
atio
nCa
sh a
nd In
vestm
ents
÷ Ne
t Cur
rent
Liabil
ity
5Ca
sh %
of
Mon
thly
Expe
nditu
res
Com
bine
d Fu
nds (
Citie
s & C
ount
ies)
Curre
nt
Year
Data
Req
uire
d
10.0
0
106.
673.
33 0
Point
s for
value
s ≤ 5
0%
Point
s for
value
s > 5
0% B
ut ≤
100%
Point
s for
value
s > 10
0% B
ut ≤
150%
Po
ints f
or va
lues >
150%
Cash
and
Inve
stmen
ts (co
des 2
00, 2
01, 4
50, 4
51)
Aver
age M
onth
ly Gr
oss E
xpen
ditur
es (G
ross
Exp
endit
ures
÷ 12
)Ca
lcul
atio
nCa
sh a
nd In
vestm
ents
÷ Av
erag
e Mon
thly
Gros
s Exp
endit
ures
Com
bine
d Fu
nds (
Villa
ges &
Town
s)10
6.67
3.33 0
Point
s for
value
s ≤ 3
3.33
%
Point
s for
value
s > 3
3.33
% B
ut ≤
66.6
7%Po
ints f
or va
lues >
66.
67%
But
≤ 10
0%
Point
s for
value
s > 10
0%
Use o
f Sh
ort-T
erm
Ca
sh-F
low
De
bt
6Sh
ort-T
erm
Cash
-Flow
Deb
t Iss
uanc
e
All F
unds
Curre
nt
Year
Data
Req
uire
d
5.00
53.
33 1.67 0
Point
s for
value
s > 15
%
Point
s for
value
s > 5%
But
≤ 15
%
Point
s for
value
s > 0
% B
ut ≤
5%
Point
s for
value
s = 0
%
Shor
t-Ter
m Ca
sh-F
low D
ebt I
ssue
d (Re
venu
e Ant
icipa
tion N
otes
, Tax
Ant
icipa
tion N
otes
, Bu
dget
Note
s, an
d Def
icien
cy N
otes
)To
tal R
even
ues (
Gene
ral F
und O
nly)
Calc
ulat
ion
Shor
t-Ter
m De
bt Iss
ued ÷
Tota
l Rev
enue
s (Ge
nera
l Fun
d Only
)
Appendix A
9Industrial Development AgenciesFiscal Stress Monitoring System Manual
Coun
ty, C
ity, T
own,
or V
illage
Fin
ancia
l Indi
cato
rsCa
tego
ryIn
dica
tor
Scor
ing
Fisc
al
Year
End
Data
Req
uire
d an
d Ca
lcul
atio
nsPo
ssib
le Po
ints
Use o
f Sh
ort-T
erm
Ca
sh-F
low
De
bt
7Sh
ort-T
erm
Cash
-Flow
Deb
t Iss
uanc
e Tre
nd
All F
unds
2 Y
ears
Pr
ior
Data
Req
uire
d
5.00
53.
33 1.67 0
Point
s for
value
s = Is
suan
ce In
Eac
h of L
ast T
hree
Yea
rsPo
ints f
or va
lues =
Issu
ance
In E
ach o
f Las
t Two
Yea
rsPo
ints f
or va
lues =
Issu
ance
In C
urre
nt Y
ear
Point
s for
value
s = N
o Iss
uanc
e In C
urre
nt Ye
ar
Shor
t-Ter
m Ca
sh-F
low D
ebt I
ssue
d (Re
venu
e Ant
icipa
tion N
otes
, Tax
Ant
icipa
tion N
otes
, Bu
dget
Note
s, an
d Def
icien
cy N
otes
)Pr
ior
Year
Shor
t-Ter
m Ca
sh-F
low D
ebt I
ssue
d (Re
venu
e Ant
icipa
tion N
otes
, Tax
Ant
icipa
tion N
otes
, Bu
dget
Note
s, an
d Def
icien
cy N
otes
)Cu
rrent
Ye
arSh
ort-T
erm
Cash
-Flow
Deb
t Iss
ued (
Reve
nue A
ntici
patio
n Not
es, T
ax A
ntici
patio
n Not
es,
Budg
et No
tes,
and D
efici
ency
Not
es)
Fixe
d Co
sts
8Pe
rson
al Se
rvice
s and
Emplo
yee
Bene
fits
All F
unds
(Exc
ept C
apita
l Pro
ject
s)2 Y
ears
Pr
ior
Data
Req
uire
d
5.00
53.
33 1.67 0
Point
s for
value
s = L
ast T
hree
Fisc
al Ye
ar A
vera
ge ≥
75%
Point
s for
value
s = L
ast T
hree
Fisc
al Ye
ar A
vera
ge ≥
70%
But
< 75
%
Point
s for
value
s = L
ast T
hree
Fisc
al Ye
ar A
vera
ge ≥
65%
But
< 70
%Po
ints f
or va
lues =
Las
t Thr
ee F
iscal
Year
Ave
rage
< 6
5%
Pers
onal
Serv
ices a
nd E
mplo
yee B
enef
itsTo
tal R
even
ues
Calc
ulat
ion
Pers
onal
Serv
ices a
nd E
mplo
yee B
enef
its ÷
Tota
l Rev
enue
s
Prior
Ye
ar
Data
Req
uire
dPe
rson
al Se
rvice
s and
Em
ploye
e Ben
efits
Tota
l Rev
enue
s Ca
lcul
atio
nPe
rson
al Se
rvice
s and
Em
ploye
e Ben
efits
÷ To
tal R
even
ues
Curre
nt
Year
Data
Req
uire
dPe
rson
al Se
rvice
s and
Em
ploye
e Ben
efits
Tota
l Rev
enue
sCa
lcul
atio
nPe
rson
al Se
rvice
s and
Em
ploye
e Ben
efits
÷ To
tal R
even
ues
Calc
ulat
ion
(Ave
rage
)3 Y
ear A
vera
ge (P
erso
nal S
ervic
es a
nd E
mplo
yee B
enef
its ÷
Tota
l Rev
enue
s)
9De
bt Se
rvice
% R
even
ue
All F
unds
(Exc
ept C
apita
l Pro
ject
s)2 Y
ears
Pr
ior
Data
Req
uire
d
5.00
53.
33 1.67 0
Point
s for
value
s = L
ast T
hree
Fisc
al Ye
ar A
vera
ge ≥
20%
Point
s for
value
s = L
ast T
hree
Fisc
al Ye
ar A
vera
ge ≥
15%
But
< 20
%Po
ints f
or va
lues =
Las
t Thr
ee F
iscal
Year
Ave
rage
≥ 10
% B
ut <
15%
Point
s for
value
s = L
ast T
hree
Fisc
al Ye
ar A
vera
ge <
10%
Debt
Serv
ice E
xpen
ditur
es -
Curre
nt Re
fund
ing B
ond P
roce
eds (
code
5792
)To
tal R
even
ues
Calc
ulat
ion
Debt
Serv
ice ÷
Tota
l Rev
enue
s
Prior
Ye
ar
Data
Req
uire
dDe
bt Se
rvice
Exp
endit
ures
- Cu
rrent
Refu
nding
Bon
d Pro
ceed
s (co
de 57
92)
Tota
l Rev
enue
sCa
lcul
atio
nDe
bt Se
rvice
÷ To
tal R
even
ues
Curre
nt
Year
Data
Req
uire
dDe
bt Se
rvice
Exp
endit
ures
- Cu
rrent
Refu
nding
Bon
d Pro
ceed
s (co
de 57
92)
Tota
l Rev
enue
sCa
lcul
atio
nDe
bt Se
rvice
÷ To
tal R
even
ues
Calc
ulat
ion
(Ave
rage
)3 Y
ear A
vera
ge (D
ebt S
ervic
e ÷ To
tal R
even
ues)
Tota
l1 :10
0.0
Gene
ral F
und
Com
bine
d Fu
nds2
Gros
s Rev
enue
s = R
even
ues a
nd O
ther S
ource
sPo
int R
ange
(Out
of 1
00 to
tal p
ts)
Citie
s:A
A, F
X, G
, ES,
EW
(Big
4 Citie
s Inc
lude D
epen
dent
Scho
ol's A
)To
tal R
even
ues =
Rev
enue
sSi
gnific
ant F
iscal
Stre
ss 65
- 10
0Co
untie
s:A
A, D
, DM,
FX,
G, A
ll Ente
rpris
e Fun
dsGr
oss E
xpen
ditu
res =
Exp
endit
ures
and O
ther U
ses
Mode
rate
Fisca
l Stre
ss 55
- 64
.9Vi
llage
s:A
A, F
X, G
, ES,
EW
Susc
eptib
le Fis
cal S
tress
45 -
54.9
Town
s:A,
DA
A, B
, DA,
DB,
FX,
G, S
S, S
W, E
S, E
WNo
Des
ignati
on 0
- 44.9
1 Indica
tor po
ints a
re ro
unde
d to t
wo de
cimal
place
s. To
tal po
ints a
re ro
unde
d to o
ne de
cimal
place
. 2 Se
e the
Acc
ount
ing
and
Repo
rting
Man
ual fo
r mor
e info
rmati
on ab
out th
e use
of fu
nds i
n loc
al go
vern
ments
.
Appendix A
10 Fiscal Stress Monitoring System Manual
Scho
ol D
istric
t Fin
ancia
l Indi
cato
rsCa
tego
ryIn
dica
tor
Scor
ing
Fisc
al
Year
End
Data
Req
uire
d an
d Ca
lcul
atio
nsPo
ssib
le Po
ints
Year
End
Fu
nd B
alan
ce
1Un
assig
ned
Fund
Bala
nce
Gene
ral F
und
Curre
nt
Year
Data
Req
uire
d25
.00
2516
.67
8.33 0
Point
s for
value
s ≤ 1%
Po
ints f
or va
lues >
1% B
ut ≤
2%
Point
s for
value
s > 2
% B
ut ≤
3%
Point
s for
value
s > 3%
Unas
signe
d Fun
d Bala
nce (
code
s 916
& 91
7)Gr
oss E
xpen
ditur
esCa
lcul
atio
nUn
assig
ned F
und B
alanc
e ÷ G
ross
Exp
endit
ures
2 Tota
l Fu
nd B
alanc
e
Gene
ral F
und
Curre
nt
Year
Data
Req
uire
d25
.00
2516
.67
8.33 0
Point
s for
value
s ≤ 0
%Po
ints f
or va
lues >
0%
But
≤ 5%
Po
ints f
or va
lues >
5% B
ut ≤
10%
Po
ints f
or va
lues >
10%
Tota
l Fun
d Bala
nce (
code
802
9)Gr
oss E
xpen
ditur
esCa
lcul
atio
nTo
tal F
und B
alanc
e (co
de 8
029)
÷ G
ross
Exp
endit
ures
Oper
atin
g De
ficits
3Op
erat
ing
Defic
it
Gene
ral F
und
2 Yea
rs
Prior
Data
Req
uire
d
20.0
0
2013
.33
6.67 0
Point
s for
value
s = D
efici
ts ≤
-1% in
3/3
of th
e Las
t Fisc
al Ye
ars
Point
s for
value
s = D
efici
ts ≤
-1% in
2/3
of th
e Las
t Fisc
al Ye
ars
Point
s for
value
s = D
efici
t ≤ -1
% in
1/3 L
ast F
iscal
Year
s Po
ints f
or va
lues =
Def
icit ≤
-1%
in 0
/3 L
ast F
iscal
Year
s
Gros
s Rev
enue
sGr
oss E
xpen
ditur
esCa
lcul
atio
n(G
ross
Rev
enue
s - G
ross
Exp
endit
ures
) ÷ G
ross
Exp
endit
ures
Prior
Ye
ar
Data
Req
uire
dGr
oss R
even
ues
Gros
s Exp
endit
ures
Calc
ulat
ion
(Gro
ss R
even
ues -
Gro
ss E
xpen
ditur
es) ÷
Gro
ss E
xpen
ditur
es
Curre
nt
Year
Data
Req
uire
dGr
oss R
even
ues
Gros
s Exp
endit
ures
Calc
ulat
ion
(Gro
ss R
even
ues -
Gro
ss E
xpen
ditur
es) ÷
Gro
ss E
xpen
ditur
es
Cash
Po
sitio
n
4Ca
sh
Ratio
Gene
ral F
und
Curre
nt
Year
Data
Req
uire
d10
.00
106.
673.
33 0
Point
s for
value
s ≤ 5
0%
Point
s for
value
s > 5
0% B
ut ≤
75%
Po
ints f
or va
lues >
75%
But
≤ 10
0%Po
ints f
or va
lues >
100%
Cash
and
Inve
stmen
ts (co
des 2
00-2
23, 4
50, 4
51)
Net C
urre
nt Lia
bility
(cod
es 6
00-6
26 &
631
-668
)Ca
lcul
atio
nCa
sh a
nd In
vestm
ents
÷ Ne
t Cur
rent
Liabil
ity5
Cash
%
of M
onth
ly Ex
pend
iture
s
Gene
ral F
und
Curre
nt
Year
Data
Req
uire
d10
.00
106.
673.
33 0
Point
s for
value
s ≤ 3
3.33
%
Point
s for
value
s > 3
3.33
% B
ut ≤
66.6
7%Po
ints f
or va
lues >
66.
67%
But
≤ 10
0%
Point
s for
value
s > 10
0%
Cash
and
Inve
stmen
ts (co
des 2
00, 2
01, 4
50, 4
51)
Aver
age M
onth
ly Gr
oss E
xpen
ditur
es (G
ross
Exp
endit
ures
÷ 12
)Ca
lcul
atio
nCa
sh a
nd In
vestm
ents
÷ Av
erag
e Mon
thly
Gros
s Exp
endit
ures
Relia
nce o
n Sh
ort-T
erm
Ca
sh-F
low
De
bt
6Sh
ort-T
erm
Ca
sh-F
low
Debt
Relia
nce
All F
unds
Prior
Ye
ar
Data
Req
uire
d
10.0
0
10 6.67
3.33 0
Point
s = C
hang
e in C
ash-
Flow
Debt
Issue
d is ≥
10%
or Cu
rrent
Year
Cash
-Flow
De
bt Iss
ued a
nd N
o Prio
r Yea
r Issu
ance
Point
s = C
hang
e in C
ash-
Flow
Debt
Issue
d is ≥
6.67
% B
ut < 1
0%Po
ints =
Cha
nge i
n Cas
h-Flo
w De
bt Iss
ued i
s ≥ 3.
33%
But
< 6.67
%Po
ints =
Cha
nge i
n Cas
h-Flo
w De
bt Iss
ued i
s < 3.
33%
or N
o Cur
rent
Year
Issua
nce
Shor
t-Ter
m Ca
sh-F
low D
ebt I
ssue
d (R
even
ue A
ntici
patio
n Not
es, T
ax A
ntici
patio
n Not
es, B
udge
t Not
es, a
nd D
efici
ency
Not
es)
Curre
nt
Year
Data
Req
uire
dSh
ort-T
erm
Cash
-Flow
Deb
t Iss
ued
(Rev
enue
Ant
icipa
tion N
otes
, Tax
Ant
icipa
tion N
otes
, Bud
get N
otes
, and
Def
icien
cy N
otes
)Ca
lcul
atio
n(C
urre
nt Ye
ar S
hort-
Term
Cas
h-Fl
ow D
ebt I
ssue
d - P
rior Y
ear S
hort-
Term
Ca
sh-F
low D
ebt I
ssue
d) ÷
Prio
r Yea
r Sho
rt-Te
rm C
ash-
Flow
Deb
t Iss
ued
Tota
l1 :10
0.0
Gros
s Rev
enue
s = G
ener
al Fu
nd's
Reve
nues
and
Oth
er S
ourc
es (T
rans
fer A
ctivit
y) Gr
oss E
xpen
ditu
res =
Gen
eral
Fund
's Ex
pend
iture
s and
Oth
er U
ses (
Tran
sfer A
ctivit
y) - 9
950.
9 (Tr
ansfe
rs to
Cap
ital P
rojec
t's F
und)
¹Indic
ator
poin
ts ar
e rou
nded
to tw
o dec
imal
place
s. To
tal p
oints
are r
ound
ed to
one
dec
imal
place
.
Poin
t Ran
ge (O
ut o
f 100
tota
l pts
)Si
gnific
ant F
iscal
Stre
ss 6
5 - 10
0M
oder
ate F
iscal
Stre
ss 4
5 - 6
4.9
Susc
eptib
le Fi
scal
Stre
ss 2
5 - 4
4.9
No D
esign
ation
0 - 2
4.9
Appendix B

11Industrial Development AgenciesFiscal Stress Monitoring System Manual
Coun
ty, C
ity, T
own,
or V
illage
Env
ironm
enta
l Indi
cato
rsCa
tego
ryIn
dica
tor
Scor
ing
Year
Da
ta R
equi
red
and
Calc
ulat
ions
Poss
ible
Poin
ts
Popu
latio
n1
Chan
ge in
Po
pulat
ion
106.
673.
33 0
Point
s for
value
s < -5
%Po
ints f
or va
lues <
-2.5
% B
ut ≥
-5%
Point
s for
value
s < 0
% B
ut ≥
-2.5
%Po
ints f
or va
lues ≥
0%
6 Yea
rs
Prior
Data
Req
uire
d
10.0
0Po
pulat
ionPr
ior
Year
Data
Req
uire
d
Popu
lation
Calc
ulat
ion
(Prio
r Yea
r Pop
ulatio
n Esti
mat
e - 6
Year
s Prio
r Pop
ulatio
n Esti
mat
e) ÷
6 Ye
ars P
rior P
opula
tion
Pove
rty2
Perc
ent o
f Ho
useh
olds w
ith
Publi
c Ass
istan
ce
2013
.33
6.67 0
Point
s for
value
s > 3
0%Po
int fo
r valu
es >
25%
But
≤ 30
%Po
ints f
or va
lues >
20%
But
≤ 25
%Po
ints f
or va
lues ≤
20%
Prior
Ye
arDa
ta R
equi
red
20.0
0Ho
useh
olds w
ith P
ublic
Ass
istan
ceTo
tal N
umbe
r of H
ouse
holds
Calc
ulat
ion
Hous
ehold
s with
Pub
lic A
ssist
ance
÷ To
tal N
umbe
r of H
ouse
holds
Age
3Pe
rcen
t of
Popu
lation
Und
er
18 &
Ove
r 65
106.
673.
33 0
Point
s for
value
s > 5
0%Po
ints f
or va
lues >
47.5
% B
ut ≤
50%
Point
s for
value
s > 4
5% B
ut ≤
47.5
%Po
ints f
or va
lues ≤
45%
Prior
Ye
ar
Data
Req
uire
d
10.0
0Pe
rcen
t of P
opula
tion U
nder
18Pe
rcen
t of P
opula
tion 6
5 and
Ove
rCa
lcul
atio
nPe
rcen
t of P
opula
tion U
nder
18 +
Per
cent
of Po
pulat
ion 6
5 and
Ove
r
Tax B
ase
4Pe
rcen
t Cha
nge i
n Ho
me V
alue
2013
.33
6.67 0
Point
s for
value
s < 0
%Po
ints f
or va
lues <
50%
of C
onsu
mer
Pric
e Ind
ex C
alcula
tion
Point
s for
value
s < C
onsu
mer
Pric
e Ind
ex C
alcula
tion
Point
s for
value
s ≥ C
onsu
mer
Pric
e Ind
ex C
alcula
tion
6 Yea
rs
Prior
Data
Req
uire
d
20.0
0
Med
ian V
alue o
f Own
er O
ccup
ied H
ousin
gHo
using
Con
sum
er P
rice I
ndex
(NY-
NJ-C
T-PA
Reg
ion)
Prior
Ye
arDa
ta R
equi
red
M
edian
Valu
e of O
wner
Occ
upied
Hou
sing
Hous
ing C
onsu
mer
Pric
e Ind
ex (N
Y-NJ
-CT-
PA R
egion
)Ca
lcul
atio
n (P
rope
rty V
alue
)(P
rior Y
ear M
edian
Hom
e Valu
e - 6
Year
s Prio
r Med
ian H
ome V
alue)
÷ 6
Year
s Prio
r Med
ian H
ome V
alue
Calc
ulat
ion
(Con
sum
er P
rice I
ndex
)(P
rior Y
ear C
onsu
mer P
rice I
ndex
- 6 Y
ears
Prior
Con
sume
r Pric
e Ind
ex) ÷
6 Ye
ars P
rior C
onsu
mer P
rice I
ndex
Inco
me
5M
edian
Ho
useh
old In
com
e
106.
673.
33 0
Point
s for
value
s < 15
0% x
Fede
ral P
over
ty Lin
e (FP
L)Po
ints f
or va
lues <
175%
x FP
L But
≥ 15
0% x
FPL
Point
s for
value
s < 2
00%
x FP
L But
≥ 17
5% x
FPL
Point
s for
value
s ≥ 2
00%
x FP
L
Prior
Ye
ar
Data
Req
uire
d
10.0
0M
edian
Hou
seho
ld In
com
eFe
dera
l Pov
erty
Line (
Fam
ily of
3)
Unem
ploy
men
t6
Unem
ploym
ent
Rate
106.
673.
33 0
Point
s for
value
s > 12
%Po
ints f
or va
lues >
10%
But
≤ 12
%Po
ints f
or va
lues >
8% B
ut ≤
10%
Point
s for
value
s ≤ 8%
Prior
Ye
ar
Data
Req
uire
d
10.0
0Un
emplo
ymen
t Rat
e
Stat
e and
Fe
dera
l Aid
7Re
lianc
e on
Stat
e and
Fe
dera
l Aid
2013
.33
6.67 0
Point
s for
value
s > 3
0%Po
ints f
or va
lues >
20%
But
≤ 30
%Po
ints f
or va
lues >
15%
But
≤ 20
%Po
ints f
or va
lues ≤
15%
2 Yea
rs
Prior
Data
Req
uire
d
20.0
0
Stat
e and
Fed
eral
Reve
nues
(cod
es 3
000-
4999
) - (c
odes
396
0 & 4
960)
)To
tal R
even
ues (
All F
unds
Exc
ept C
apita
l Pro
jects)
Calc
ulat
ion
Stat
e and
Fed
eral
Reve
nues
÷ To
tal R
even
ues
Prior
Ye
ar
Stat
e and
Fed
eral
Reve
nues
(cod
es 3
000-
4999
) - (c
odes
396
0 & 4
960)
)To
tal R
even
ues (
All F
unds
Exc
ept C
apita
l Pro
jects)
Calc
ulat
ion
Stat
e and
Fed
eral
Reve
nues
÷ To
tal R
even
ues
Curre
nt
Year
Stat
e and
Fed
eral
Reve
nues
(cod
es 3
000-
4999
) - (c
odes
396
0 & 4
960)
)To
tal R
even
ues (
All F
unds
Exc
ept C
apita
l Pro
jects)
Calc
ulat
ion
Stat
e and
Fed
eral
Reve
nues
÷ To
tal R
even
ues
Calc
ulat
ion
(Ave
rage
)3 Y
ear A
vera
ge (S
tate
and F
eder
al Re
venu
es ÷
Tota
l Rev
enue
s)To
tal1 :
100.
0
¹Indic
ator
poin
ts ar
e rou
nded
to tw
o dec
imal
place
s. To
tal p
oints
are r
ound
ed to
one
dec
imal
place
.Po
int R
ange
(Out
of 1
00 to
tal p
ts)
Sign
ifican
t Env
ironm
enta
l Stre
ss 5
0 - 10
0M
oder
ate E
nviro
nmen
tal S
tress
40 -
49.
9Su
scep
tible
Envir
onm
enta
l Stre
ss 3
0 - 3
9.9
No D
esign
ation
0 - 2
9.9
Appendix C

12 Fiscal Stress Monitoring System Manual
Scho
ol D
istric
t Env
ironm
enta
l Indi
cato
rsCa
tego
ryIn
dica
tor
Scor
ing
Year
Da
ta R
equi
red
and
Calc
ulat
ions
Poss
ible
Poin
ts
Pove
rty
1Pe
rcen
tage
of
Econ
omica
lly
Disa
dvan
tage
d stu
dent
s
2516
.67
8.33 0
Point
s for
value
s ≥ 75
%Po
ints f
or va
lues ≥
65%
But
< 75
%Po
ints f
or va
lues ≥
55%
But
< 65
%Po
ints f
or va
lues <
55%
Prior
Ye
ar
Data
Req
uire
d
25.0
0Pe
rcen
tage
of E
cono
mica
lly D
isadv
anta
ged S
tude
nts
Clas
s Size
2Co
mm
on B
ranc
h Cl
ass S
ize
15 10 5 0
Point
s for
value
s ≥ 2
6Po
ints f
or va
lues ≥
24 B
ut <
26Po
ints f
or va
lues ≥
22 B
ut <
24Po
ints f
or va
lues <
22
Prior
Ye
ar
Data
Req
uire
d
15.0
0Co
mm
on B
ranc
h Clas
s Size
Teac
her T
urno
ver
3Tu
rnov
er R
ate o
f Al
l Tea
cher
s
15 10 5 0
Point
s for
value
s ≥ 18
%Po
ints f
or va
lues ≥
14%
But
< 18
%Po
ints f
or va
lues ≥
10%
But
< 14
%Po
ints f
or va
lues <
10%
Prior
Ye
ar
Data
Req
uire
d
15.0
0Tu
rnov
er R
ate o
f All T
each
ers
Tax B
ase
4Pe
rcen
t Cha
nge
in P
rope
rty V
alue
15 10 5 0
Point
s for
value
s ≤ -4
%Po
ints f
or va
lues ≤
-2%
But
> -4
%Po
ints f
or va
lues ≤
-1%
But
> -2
%Po
ints f
or va
lues >
-1%
5 Yea
rs
Prior
Data
Req
uire
d
15.0
0
Prop
erty
Full V
alue
4 Yea
rs
Prior
Data
Req
uire
d
Prop
erty
Full V
alue
Calc
ulat
ion
(Pro
perty
Full
Valu
e - P
rior Y
ear P
rope
rty F
ull V
alue)
÷ P
rior Y
ear P
rope
rty F
ull V
alue
3 Yea
rs
Prior
Data
Req
uire
d
Prop
erty
Full V
alue
Calc
ulat
ion
(Pro
perty
Full
Valu
e - P
rior Y
ear P
rope
rty F
ull V
alue)
÷ P
rior Y
ear P
rope
rty F
ull V
alue
2 Yea
rs
Prior
Data
Req
uire
d
Prop
erty
Full V
alue
Calc
ulat
ion
(Pro
perty
Full
Valu
e - P
rior Y
ear P
rope
rty F
ull V
alue)
÷ P
rior Y
ear P
rope
rty F
ull V
alue
Prior
Ye
ar
Data
Req
uire
d
Prop
erty
Full V
alue
Calc
ulat
ion
(Pro
perty
Full
Valu
e - P
rior Y
ear P
rope
rty F
ull V
alue)
÷ P
rior Y
ear P
rope
rty F
ull V
alue
Calc
ulat
ion
(Ave
rage
)4 Y
ear A
vera
ge (P
rope
rty F
ull V
alue -
Prio
r Yea
r Pro
perty
Full
Valu
e) ÷
Prio
r Yea
r Pro
perty
Full
Valu
e))
Budg
et S
uppo
rt5
Budg
et Vo
te Ap
prov
al Pe
rcen
t
15 10 5 0
Point
s for
value
s ≤ 6
0%Po
ints f
or va
lues ≤
65%
But
> 60
%Po
ints f
or va
lues ≤
70%
But
> 65
%Po
ints f
or va
lues >
70%
Curre
nt Ye
arDa
ta R
equi
red
15
.00
Budg
et Vo
te Ap
prov
al Pe
rcen
t
Engl
ish
Lang
uage
Le
arne
rs
6Pe
rcen
t of E
nglis
h La
ngua
ge Le
arne
rs
15 10 5 0
Point
s for
value
s ≥ 9
%Po
ints f
or va
lues ≥
5% B
ut <
9%Po
ints f
or va
lues ≥
3% B
ut <
5%Po
ints f
or va
lues <
3%
Prior
Ye
ar
Data
Req
uire
d
15.0
0Pe
rcen
t of E
nglis
h Lan
guag
e Lea
rner
s
Tota
l1 :10
0.0
¹Indic
ator
poin
ts ar
e rou
nded
to tw
o dec
imal
place
s. To
tal p
oints
are r
ound
ed to
one
dec
imal
place
.Po
int R
ange
(Out
of 1
00 to
tal p
ts)
Sign
ifican
t Env
ironm
enta
l Stre
ss 6
0 - 10
0M
oder
ate E
nviro
nmen
tal S
tress
45 -
59.
9Su
scep
tible
Envir
onm
enta
l Stre
ss 3
0 - 4
4.9
No D
esign
ation
0 - 2
9.9
Appendix D

13Industrial Development AgenciesFiscal Stress Monitoring System Manual
Scho
ol D
istric
t Env
ironm
enta
l Indi
cato
rsCa
tego
ryIn
dica
tor
Scor
ing
Year
Da
ta R
equi
red
and
Calc
ulat
ions
Poss
ible
Poin
ts
Pove
rty
1Pe
rcen
tage
of
Econ
omica
lly
Disa
dvan
tage
d stu
dent
s
2516
.67
8.33 0
Point
s for
value
s ≥ 75
%Po
ints f
or va
lues ≥
65%
But
< 75
%Po
ints f
or va
lues ≥
55%
But
< 65
%Po
ints f
or va
lues <
55%
Prior
Ye
ar
Data
Req
uire
d
25.0
0Pe
rcen
tage
of E
cono
mica
lly D
isadv
anta
ged S
tude
nts
Clas
s Size
2Co
mm
on B
ranc
h Cl
ass S
ize
15 10 5 0
Point
s for
value
s ≥ 2
6Po
ints f
or va
lues ≥
24 B
ut <
26Po
ints f
or va
lues ≥
22 B
ut <
24Po
ints f
or va
lues <
22
Prior
Ye
ar
Data
Req
uire
d
15.0
0Co
mm
on B
ranc
h Clas
s Size
Teac
her T
urno
ver
3Tu
rnov
er R
ate o
f Al
l Tea
cher
s
15 10 5 0
Point
s for
value
s ≥ 18
%Po
ints f
or va
lues ≥
14%
But
< 18
%Po
ints f
or va
lues ≥
10%
But
< 14
%Po
ints f
or va
lues <
10%
Prior
Ye
ar
Data
Req
uire
d
15.0
0Tu
rnov
er R
ate o
f All T
each
ers
Tax B
ase
4Pe
rcen
t Cha
nge
in P
rope
rty V
alue
15 10 5 0
Point
s for
value
s ≤ -4
%Po
ints f
or va
lues ≤
-2%
But
> -4
%Po
ints f
or va
lues ≤
-1%
But
> -2
%Po
ints f
or va
lues >
-1%
5 Yea
rs
Prior
Data
Req
uire
d
15.0
0
Prop
erty
Full V
alue
4 Yea
rs
Prior
Data
Req
uire
d
Prop
erty
Full V
alue
Calc
ulat
ion
(Pro
perty
Full
Valu
e - P
rior Y
ear P
rope
rty F
ull V
alue)
÷ P
rior Y
ear P
rope
rty F
ull V
alue
3 Yea
rs
Prior
Data
Req
uire
d
Prop
erty
Full V
alue
Calc
ulat
ion
(Pro
perty
Full
Valu
e - P
rior Y
ear P
rope
rty F
ull V
alue)
÷ P
rior Y
ear P
rope
rty F
ull V
alue
2 Yea
rs
Prior
Data
Req
uire
d
Prop
erty
Full V
alue
Calc
ulat
ion
(Pro
perty
Full
Valu
e - P
rior Y
ear P
rope
rty F
ull V
alue)
÷ P
rior Y
ear P
rope
rty F
ull V
alue
Prior
Ye
ar
Data
Req
uire
d
Prop
erty
Full V
alue
Calc
ulat
ion
(Pro
perty
Full
Valu
e - P
rior Y
ear P
rope
rty F
ull V
alue)
÷ P
rior Y
ear P
rope
rty F
ull V
alue
Calc
ulat
ion
(Ave
rage
)4 Y
ear A
vera
ge (P
rope
rty F
ull V
alue -
Prio
r Yea
r Pro
perty
Full
Valu
e) ÷
Prio
r Yea
r Pro
perty
Full
Valu
e))
Budg
et S
uppo
rt5
Budg
et Vo
te Ap
prov
al Pe
rcen
t
15 10 5 0
Point
s for
value
s ≤ 6
0%Po
ints f
or va
lues ≤
65%
But
> 60
%Po
ints f
or va
lues ≤
70%
But
> 65
%Po
ints f
or va
lues >
70%
Curre
nt Ye
arDa
ta R
equi
red
15
.00
Budg
et Vo
te Ap
prov
al Pe
rcen
t
Engl
ish
Lang
uage
Le
arne
rs
6Pe
rcen
t of E
nglis
h La
ngua
ge Le
arne
rs
15 10 5 0
Point
s for
value
s ≥ 9
%Po
ints f
or va
lues ≥
5% B
ut <
9%Po
ints f
or va
lues ≥
3% B
ut <
5%Po
ints f
or va
lues <
3%
Prior
Ye
ar
Data
Req
uire
d
15.0
0Pe
rcen
t of E
nglis
h Lan
guag
e Lea
rner
s
Tota
l1 :10
0.0
¹Indic
ator
poin
ts ar
e rou
nded
to tw
o dec
imal
place
s. To
tal p
oints
are r
ound
ed to
one
dec
imal
place
.Po
int R
ange
(Out
of 1
00 to
tal p
ts)
Sign
ifican
t Env
ironm
enta
l Stre
ss 6
0 - 10
0M
oder
ate E
nviro
nmen
tal S
tress
45 -
59.
9Su
scep
tible
Envir
onm
enta
l Stre
ss 3
0 - 4
4.9
No D
esign
ation
0 - 2
9.9
Appendix E
System Indicators
Why They Are ImportantThe following discussion provides information on the Fiscal Stress Monitoring System indicators. System analyses are focused on the funds that typically account for the majority of financial activity in an entity, considering that there are inherent differences in the types of services for which an entity is responsible. For more details on this and the specific indicator calculations, see Appendices A-D.
Local Government Financial Indicators (Source: Annual Financial Reports)Year-End Fund Balance (Indicators 1 & 2: Assigned and Unassigned Fund Balance, Total Fund Balance)Since fund balance is the accumulated result of financial operations over time, it is an important measure of financial condition. The level of year-end fund balance affects the ability to deal with revenue shortfalls and expenditure overruns. A negative or low level of fund balance can adversely impact expected services.
Operating Deficits (Indicator 3)Annual operating results are a measure of recent financial operations and the direction that finances are headed. Local governments that have multiple years of operating deficits can face financial hardship. This suggests that a budget is not structurally balanced − recurring revenues are insufficient to support recurring expenditures.
Cash Position (Indicators 4 & 5: Cash Ratio, Cash as Percent of Monthly Expenditures)Another method of evaluating fiscal stress is to determine whether an entity has enough cash on hand to pay its bills. These indicators evaluate the ability to liquidate current liabilities as well as fund the ensuing fiscal year’s operations. Low levels of cash and short-term investments may lead to difficulty in paying normal operating costs.
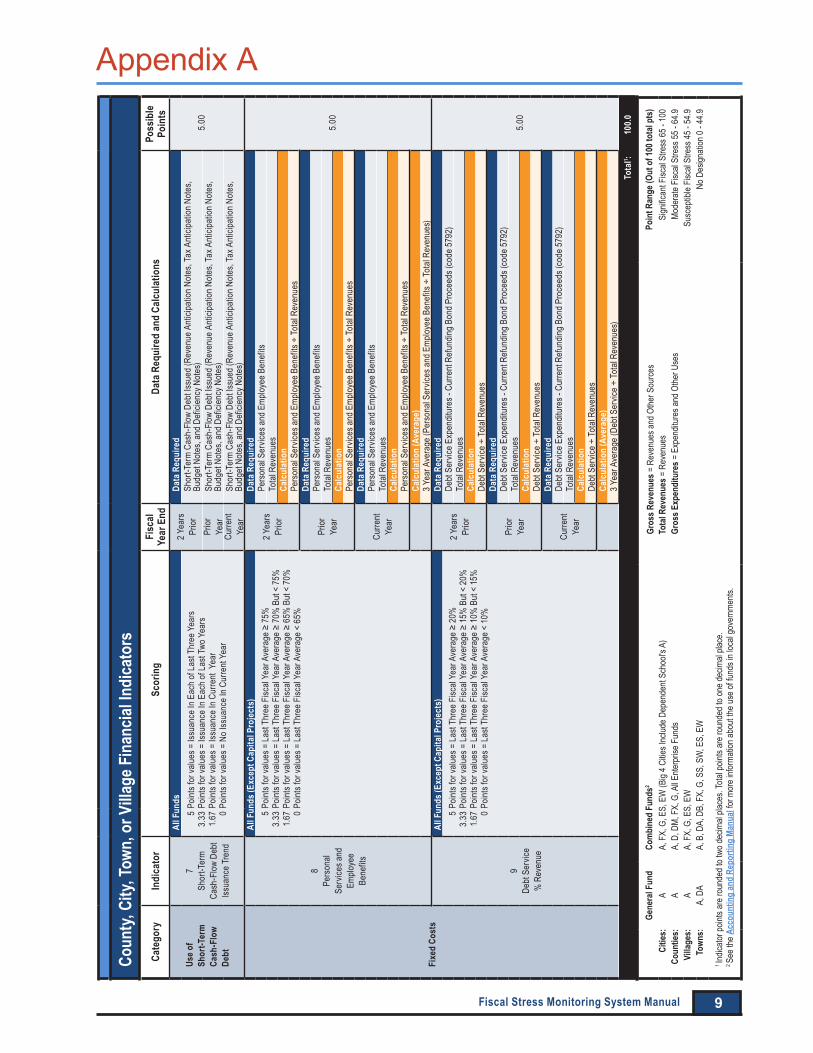
Use of Short-Term Cash-Flow Debt (Indicators 6 & 7: Short-Term Cash-Flow Debt Issuance, Short-Term Cash-Flow Debt Trend)These indicators reflect borrowing for cash flow purposes, to pay for normal operating costs. They evaluate the amount of short-term cash-flow debt that was issued in the last fiscal year as well as the trend, considering the prior three-year period. The recurring issuance of short-term cash-flow debt indicates cash-flow issues that are worsening and may not be a fiscally prudent practice.
Fixed Costs (Indicators 8 & 9: Personal Services and Employee Benefits, Debt Services as a Percent of Revenue)These indicators evaluate the amount of revenues used for personal services and employee benefits, and debt service. The level of fixed costs affects flexibility in responding to economic changes. High fixed costs reduce the ability of a local government to make necessary expenditure adjustments if resources decline.

14 Fiscal Stress Monitoring System Manual
Appendix E
Local Government Environmental IndicatorsPopulation (Indicator 1: Change in Population)Changes in population can provide insight into the health of the local economy. A declining population in a community may adversely affect property values, the associated tax base, and ultimately, a local government’s revenues. Additionally, local officials are often unable to make corresponding cuts (in the short-term) to fixed costs such as debt service, personal services, employee benefits, etc. (Source: U.S. Census)
Poverty (Indicator 2: Percent of Households with Public Assistance)The level of poverty within a local government provides important insight into the service needs within the community. A high number of households receiving public assistance could require the local government to provide a different mix/level of services. (Source: American Community Survey (ACS))
Age (Indicator 3: Percent of Population Under 18 and Over 65)The age of the population provides important insight into the service needs within the community. A local government with a high percentage of non-working age residents may require additional services (e.g., public transportation and healthcare). (Source: ACS)
Tax Base (Indicator 4: Percent Change in Home Value)Property value is a useful gauge of the health of a local economy. A decline in this area may adversely affect real property taxes, a major revenue source for local governments. (Source: ACS, United States Bureau of Labor Statistics)
Income (Indicator 5: Median Household Income)Income levels indicate the ability of households to pay property taxes and support the local economy (e.g., generate sales tax receipts). Communities with lower incomes may require additional support services which can lead to additional expenditures. (Source: ACS and United States Department of Health and Human Services)
Unemployment (Indicator 6: Unemployment Rate)The level of unemployment provides information on the economic strength of an area and may affect a local government’s revenues. A high unemployment rate indicates that a local government’s residents may have less income. Therefore, residents’ ability to support the local economy is diminished, which may also reduce the level of local revenues that are sensitive to changes in economic activity (e.g., sales tax receipts). (Source: ACS)
State and Federal Aid (Indicator 7: Reliance on State and Federal Aid)State and federal aid can be an important part of the local government revenue mix. Because funding levels are largely outside the direct control of local officials, those local governments with a high dependence on State and federal aid are more vulnerable to reductions in these revenues. (Source: Annual Financial Report)

15Industrial Development AgenciesFiscal Stress Monitoring System Manual
Appendix E
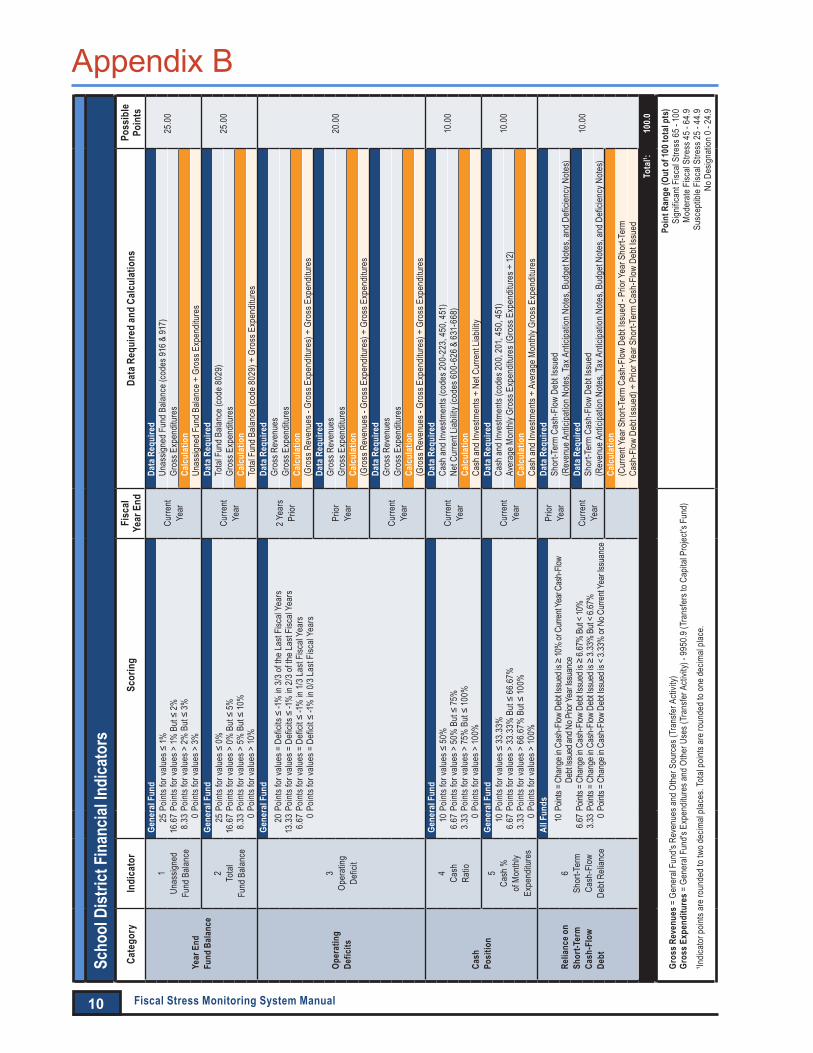
School District Financial Indicators (Source: ST-3)
Year-End Fund Balance (Indicators 1 & 2: Unassigned Fund Balance, Total Fund Balance) Since fund balance is the accumulated result of financial operations over time, it is an important measure of financial condition. The level of year-end fund balance affects the ability to deal with revenue shortfalls and expenditure overruns. A negative or low level of fund balance can adversely impact expected services.
Operating Deficits (Indicator 3)Annual operating results are a measure of recent financial operations and the direction that finances are headed. School districts that have multiple years of operating deficits can face financial hardship. This suggests that a budget is not structurally balanced − recurring revenues are insufficient to support recurring expenditures.
Cash Position (Indicators 4 & 5: Cash Ratio, Cash as a Percent of Monthly Expenditures)Another method of evaluating fiscal stress is to determine whether an entity has enough cash on hand to pay its bills. These indicators evaluate the ability to liquidate current liabilities and as well as fund the ensuing fiscal year’s operations. A low level of cash and short-term investments may lead to difficulty paying normal operating costs.
Reliance on Short-Term Cash-Flow Debt (Indicator 6)This indicator reflects borrowing for cash-flow purposes, to pay for normal operating costs. An increasing reliance on this type of borrowing suggests cash-flow problems that are worsening and may not be a fiscally prudent practice.
School District Environmental IndicatorsPoverty (Indicator 1: Percentage of Economically Disadvantaged Students)The level of poverty within a school district provides important insight into the service needs within a district. Districts with a high number of economically disadvantaged students may need to provide a different mix/level of support services. (Source: New York State Education Department’s School Report Card (SRC))
Class Size (Indicator 2: Common Branch Class Size)A district’s class size is a measure of demand for services and provides insight into future costs for a school district. A large class size can require districts to hire more teachers, build new buildings, etc. (Source: SRC)
Teacher Turnover (Indicator 3: Turnover Rate of All Teachers)Teacher turnover is a measure of workforce stability in a school district and provides insight into future costs of a district, in the near term. A high teacher turnover rate can lead to increases in personnel expenditures. (Source: SRC)
Tax Base (Indicator 4: Percent Change in Property Value)Property value is a useful gauge of local economy health. A decline in this area may adversely affect real property taxes, a major revenue source for school districts. (Source: New York State Office of Real Property and Property Tax Services (ORPTS))
Budget Support (Indicator 5: Budget Vote Approval Percent)The level of community support for a school district’s budget directly affects the school district’s ability to pay normal operating costs. Additionally, because of the tax cap, the level of community support for a school district’s budget directly affect the district’s ability to raise real property taxes. (Source: New York State Education Department)
English-Language Learners (Indicator 6: Percent of English Language Learners)The number of students with English as a secondary language provides insight into the school district’s resource requirements. A high number of English-language learners can lead to increases in personnel expenditures. (Source: SRC)

Local Governments
Notes: Scores for the Big 4 cities of Buffalo, Rochester, Syracuse and Yonkers incorporate the finances of the dependent school districts. Total points are rounded to the first decimal place.
16 Fiscal Stress Monitoring System Manual
Appendix F
Points and Scoring MethodologyThe System weighs individual indicators according to their relative importance. An entity’s performance on each of these indicators is evaluated on a 100-point scale, with the sum of the points yielding the overall fiscal stress and environmental stress score.
The tables below relate to local governments. They summarize: (1) maximum points assigned to each category and (2) how total points correspond to the System designations:
Local Government Financial Categories
Number of Indicators
Maximum Points (100)
Year-End Fund Balance 2 50 (25 per indicator)
Operating Deficits 1 10
Cash Position 2 20 (10 per indicator)
Use of Short-Term Cash-Flow Debt 2 10 (5 per indicator)
Fixed Costs 2 10 (5 per indicator)
Local Government Fiscal Stress Designations
Total Accumulated Points
Significant Fiscal Stress 65-100
Moderate Fiscal Stress 55-64.9
Susceptible to Fiscal Stress 45-54.9
No Designation 0-44.9
Local Government Environmental Categories (1 indicator each)
Maximum Points (100)
Population 10
Poverty 20
Age 10
Tax Base 20
Income 10
Unemployment 10
State and Federal Aid 20
Local Government Environmental Stress Designations
Total Accumulated Points
Significant Environmental Stress 50-100
Moderate Environmental Stress 40-49.9
Susceptible to Environmental Stress 30-39.9
No Designation 0-29.9

School Districts
Total points are rounded to the first decimal place.
School District Fiscal Stress Designations Total Accumulated Points
Significant Fiscal Stress 65-100
Moderate Fiscal Stress 45-64.9
Susceptible to Fiscal Stress 25-44.9
No Designation 0-24.9
School District Environmental Stress Designations
Total Accumulated Points
Significant Environmental Stress 60-100
Moderate Environmental Stress 45-59.9
Susceptible to Environmental Stress 30-44.9
No Designation 0-29.9
School District Environmental Categories (1 indicator each)
Maximum Points (100)
Poverty 25
Class Size 15
Teacher Turnover 15
Tax Base 15
Budget Support 15
English-Language Learners 15
17Industrial Development AgenciesFiscal Stress Monitoring System Manual
Appendix F
The tables below relate to school districts. They summarize: (1) maximum points assigned to each category and (2) how total points correspond to the System designations:
School District Financial Categories
Number of Indicators
Maximum Points (100)
Year-End Fund Balance 2 50 (25 per indicator)
Operating Deficits 1 20
Cash Position 2 20 (10 per indicator)
Reliance on Short-Term Cash-Flow Debt 1 10

18 Fiscal Stress Monitoring System Manual
Mailing Address for all of the above:
Office of the New York State Comptroller, 110 State Street, Albany, New York 12236
email: [email protected]
DirectoryCentral OfficeDivision of Local Government and School Accountability
Andrew A. SanFilippo, Executive Deputy Comptroller
Executive ..................................................................................................................................................................474-4037 Gabriel F. Deyo, Deputy Comptroller Tracey Hitchen Boyd, Assistant Comptroller
Audits, Local Government Services and Professional Standards ................................................ 474-5404 (Audits, Technical Assistance, Accounting and Audit Standards)
Local Government and School Accountability Help Line .............................(866) 321-8503 or 408-4934 (Electronic Filing, Financial Reporting, Justice Courts, Training)
New York State & Local Retirement SystemRetirement Information Services
Inquiries on Employee Benefits and Programs .................................................................474-7736
Bureau of Member and Employer Services ............................................ (866) 805-0990 or 474-1101Monthly Reporting Inquiries ...................................................................................................474-1080 Audits and Plan Changes ..........................................................................................................474-0167 All Other Employer Inquiries....................................................................................................474-6535
Division of Legal ServicesMunicipal Law Section ........................................................................................................................474-5586
Other OSC OfficesBureau of State Expenditures .........................................................................................................486-3017
Bureau of State Contracts .................................................................................................................. 474-4622
(Area code for the following is 518 unless otherwise specified)

19Industrial Development AgenciesFiscal Stress Monitoring System Manual
DirectoryRegional OfficeDivision of Local Government and School Accountability
Andrew A. SanFilippo, Executive Deputy Comptroller
Gabriel F. Deyo, Deputy Comptroller (518) 474-4037Tracey Hitchen Boyd, Assistant Comptroller
Cole H. Hickland, Director • Jack Dougherty, Director Direct Services (518) 474-5480
BINGHAMTON REGIONAL OFFICE - H. Todd Eames, Chief Examiner State Office Building, Suite 1702 • 44 Hawley Street • Binghamton, New York 13901-4417 Tel (607) 721-8306 • Fax (607) 721-8313 • Email: [email protected] Serving: Broome, Chenango, Cortland, Delaware, Otsego, Schoharie, Sullivan, Tioga, Tompkins counties
BUFFALO REGIONAL OFFICE – Jeffrey D. Mazula, Chief Examiner 295 Main Street, Suite 1032 • Buffalo, New York 14203-2510 Tel (716) 847-3647 • Fax (716) 847-3643 • Email: [email protected] Serving: Allegany, Cattaraugus, Chautauqua, Erie, Genesee, Niagara, Orleans, Wyoming counties
GLENS FALLS REGIONAL OFFICE - Jeffrey P. Leonard, Chief Examiner One Broad Street Plaza • Glens Falls, New York 12801-4396 Tel (518) 793-0057 • Fax (518) 793-5797 • Email: [email protected] Serving: Albany, Clinton, Essex, Franklin, Fulton, Hamilton, Montgomery, Rensselaer, Saratoga, Schenectady, Warren, Washington counties
HAUPPAUGE REGIONAL OFFICE – Ira McCracken, Chief Examiner NYS Office Building, Room 3A10 • 250 Veterans Memorial Highway • Hauppauge, New York 11788-5533 Tel (631) 952-6534 • Fax (631) 952-6530 • Email: [email protected] Serving: Nassau, Suffolk counties
NEWBURGH REGIONAL OFFICE – Tenneh Blamah, Chief Examiner 33 Airport Center Drive, Suite 103 • New Windsor, New York 12553-4725 Tel (845) 567-0858 • Fax (845) 567-0080 • Email: [email protected] Serving: Columbia, Dutchess, Greene, Orange, Putnam, Rockland, Ulster, Westchester counties
ROCHESTER REGIONAL OFFICE – Edward V. Grant Jr., Chief Examiner The Powers Building • 16 West Main Street – Suite 522 • Rochester, New York 14614-1608 Tel (585) 454-2460 • Fax (585) 454-3545 • Email: [email protected] Serving: Cayuga, Chemung, Livingston, Monroe, Ontario, Schuyler, Seneca, Steuben, Wayne, Yates counties
SYRACUSE REGIONAL OFFICE – Rebecca Wilcox, Chief Examiner State Office Building, Room 409 • 333 E. Washington Street • Syracuse, New York 13202-1428 Tel (315) 428-4192 • Fax (315) 426-2119 • Email: [email protected] Serving: Herkimer, Jefferson, Lewis, Madison, Oneida, Onondaga, Oswego, St. Lawrence counties
STATEWIDE AUDIT - Ann C. Singer, Chief Examiner State Office Building, Suite 1702 • 44 Hawley Street • Binghamton, New York 13901-4417 Tel (607) 721-8306 • Fax (607) 721-8313

Like us on Facebook at facebook.com/nyscomptrollerFollow us on Twitter @nyscomptroller
ContactOffice of the New York State Comptroller Division of Local Government and School Accountability
110 State Street, 12th floor Albany, NY 12236 Tel: (518) 474-4037 Fax: (518) 486-6479 or email us: [email protected]
www.osc.state.ny.us/localgov/index.htm