Embed Size (px)
Citation preview

FISCAL 2017 FIRST-QUARTER
RESULTS
November 10, 2016

DISCLAIMERThis presentation contains forward-looking statements within the meaning of the federalsecurities laws, which statements involve substantial risks and uncertainties. Forward-lookingstatements generally relate to future events and include, without limitation, projections, forecastsand estimates about possible or assumed future results of the Company’s business, financialcondition, liquidity, results of operations, plans and objectives. In some cases, you can identifyforward-looking statements because they contain words such as “may,” “might,” “will,” “would,”“should,” “expect,” “plan,” “anticipate,” “could,” “intend,” “target,” “project,” “contemplate,”“believe,” “estimate,” “predict,” “likely,” “potential” or “continue” or the negative of these words orother similar terms or expressions that concern our expectations, strategy, plans or intentions.
These forward-looking statements are necessarily based upon estimates and assumptions that,while considered reasonable by the Company and its management, are inherently uncertain.Factors that may cause actual results to differ materially from current expectations include, butare not limited to, those factors identified in the Company’s prospectus in the sections titled “Riskfactors,” “Special note regarding forward-looking statements” and “Management’s discussion andanalysis of financial condition and results of operations.” New risks and uncertainties arise overtime, and it is not possible for us to predict all such factors or how they may affect us.
Nothing in this presentation should be regarded as a representation by any person that theforward-looking statements set forth herein will be achieved or that any of the contemplatedresults of such forward-looking statements will be achieved. You should not place undue relianceon forward-looking statements, which speak only as of the date they are made. The Companyundertakes no duty to update these forward-looking statements. Certain of the economic andmarket information contained herein has been obtained from published sources and/or preparedby other parties. None of the Company or any of its directors, stockholders, officers, affiliates,employees, agents or advisers, nor any other person, assumes any responsibility for theaccuracy, reliability or completeness of any information in this presentation, and we expresslydisclaim any obligation or undertaking to release publicly any updates or revisions to anyforward-looking statements to reflect any change in expectation or events, conditions orcircumstances on which such statements are based.
This presentation includes certain non-GAAP financial measures, including Adjusted EBITDA.These non-GAAP financial measures should be considered only as supplemental to, and not assuperior to, financial measures prepared in accordance with GAAP. Please refer to the Appendixof this presentation for a reconciliation of Adjusted EBITDA to net income, the most directlycomparable financial measure prepared in accordance with U.S. GAAP.
This presentation is confidential and may not be reproduced or otherwise distributed ordisseminated, in whole or part, without the prior written consent of the Company, which consentmay be withheld in its sole and absolute discretion.
Any investment in the Company will be subject to certain risks related to the nature of theCompany’s business and the structure and operations of the Company. Any investment in theCompany should be made only with an appreciation of the applicable risks, which are describedin the Company’s filings with the SEC.

STRATEGIC OVERVIEW

QUARTERLY HIGHLIGHTS
Net sales increased 8.4% to $60.7 million
Gross margin up 100 basis points to 29.3%
Adjusted EBITDA up 24.8% to $13.3 million
Adjusted EBITDA margin up 280 basis points to 21.9%
Net income totaled $7.0 million, up from net loss of $1.3 million in the prior-
year period
Diluted earnings per share under GAAP grew to $0.38 from the first quarter,
up from a loss per share of $0.08 a year earlier
Adjusted net income per share is up 36.7% to $0.41 on a diluted share count
of 18.7 million up from $0.30 in the prior-year period

MARKET UPDATE
• Boat market continues to expand
• Performance Sport Boat segment of the market is the fastest growing segment
• Innovation is significantly driving growth, in particular, the wake surfing technology
• MasterCraft continues to focus on profitable market share in the PSB segment
• Gross margin is up 100 bps in fiscal 2017 Q1 from prior-year period
• All MasterCraft models have been retooled completely in the last four years
• MC won one-third of the innovation awards for three years running at NMMA

We’ve consistently held a leading market share position in the U.S. over the past decade
Our emphasis has been and will continue to be about profitable, sustainable market share
LEADING MARKET SHARE POSITIONJust starting to realize benefits of many recent initiatives that new management has executed
_____________________
Source: SSI and company SEC filings.
(1) Axis is an independent brand within Malibu Boats.
ROLLING QUARTERLY LTM MARKET SHARE THROUGH JUNE 2016 (1)
20.5% 20.8% 21.3%
22.1% 21.7%
20.9% 20.9%
22.6% 22.4% 21.9%
20.6% 21.0%
21.2%21.9%
17.1% 17.3%16.2% 16.3% 16.3% 15.9% 16.1%
9.4% 9.3%10.0% 10.3%
11.0%11.6% 11.4%
LTM 12/2014 LTM 3/2015 LTM 6/2015 LTM 9/2015 LTM 12/2015 LTM 3/2016 LTM 6/2016
(1)
MARKET SHARE KEY

OVERVIEW OF GROWTH OPPORTUNITIES
Continue to Develop New and Innovative Products in Core
Markets
Penetrate the Entry-Level and Mid-Line Segment of the
Performance Sport Boat Category
Capture Additional Share from Adjacent Boating Categories
Continuous Operational Improvement to Drive Margin Expansion
Further Strengthen Dealer Network
1
2
3
4
5

FINANCIAL HIGHLIGHTS
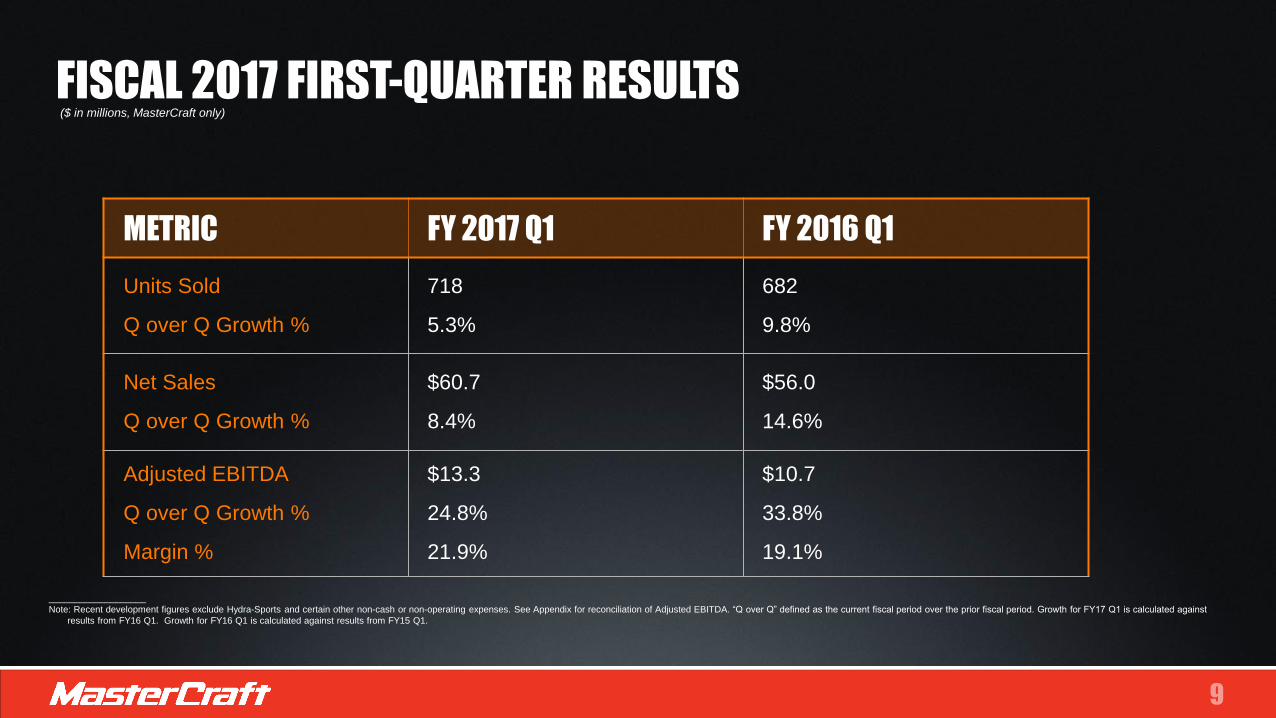
METRIC FY 2017 Q1 FY 2016 Q1
Units Sold
Q over Q Growth %
718
5.3%
682
9.8%
Net Sales
Q over Q Growth %
$60.7
8.4%
$56.0
14.6%
Adjusted EBITDA
Q over Q Growth %
Margin %
$13.3
24.8%
21.9%
$10.7
33.8%
19.1%
___________________
Note: Recent development figures exclude Hydra-Sports and certain other non-cash or non-operating expenses. See Appendix for reconciliation of Adjusted EBITDA. “Q over Q” defined as the current fiscal period over the prior fiscal period. Growth for FY17 Q1 is calculated against
results from FY16 Q1. Growth for FY16 Q1 is calculated against results from FY15 Q1.
($ in millions, MasterCraft only)
FISCAL 2017 FIRST-QUARTER RESULTS

CASH CONVERSION CYCLE($ in thousands) FY 2014 FY 2015 FY 2016 FY 2017 Q1
Net sales $177,587 $214,386 $221,600 $60,689
Cost of sales $139,975 $163,220 $160,521 $42,880
Beginning Inventory $11,316 $11,685 $11,541 $13,268
Ending Inventory $11,685 $11,541 $13,268 $12,596
Beginning Accounts Receivable $5,145 $4,406 $2,653 $2,966
Ending Accounts Receivable $4,406 $2,653 $2,966 $4,943
Beginning Accounts Payable $9,425 $13,020 $14,808 $13,112
Ending Accounts Payable $13,020 $14,808 $13,112 $12,993
Days Inventory Outstanding (DIO) (1) 30.0 26.0 28.2 28.3
Days Sales Outstanding (DSO) (2) 9.8 6.0 4.6 6.1
Days Payable Outstanding (DPO) (3) 29.3 31.1 31.7 28.6
Cash Conversion Cycle (CCC) (Days) (4) 10.5 0.9 1.1 5.9_____________________
Note:
(1) The DIO is calculated as the average inventory divided by the cost of sales per day - 365 days for each FY and 94 days for FY 2017 Q1
(2) The DSO is calculated as the average receivable divided by net sales per day - 365 days for each FY and 94 days for FY 2017 Q1
(3) The DPO is calculated as the average accounts payable divided by cost of sales per day - 365 days for each FY and 94 days for FY 2017 Q1
(4) The CCC, is calculated as the sum of DIO plus the DSO, minus the DPO - 365 days for each FY and 94 days for FY 2017 Q1

FISCAL 2017GUIDANCE
METRIC FYE 2017 TARGET
Revenue Growth Low to mid-single digit
Adjusted EBITDA MarginGrowth from FY 2016, 18.6% to low 19’s
EPS Growth Mid to high-single digit
_____________________
Note: These goals are forward-looking, are subject to significant business, economic, regulatory and competitive uncertainties and contingencies, many of which are beyond the control of the Company and its management, and are based upon assumptions with respect to future
decisions, which are subject to change. Actual results will vary and those variations may be material. For discussion of some of the important factors that could cause these variations, please consult the “Risk Factors” section of the prospectus. Nothing in this presentation
should be regarded as a representation by any person that these goals will be achieved and the Company undertakes no duty to update its goals.
(1) Estimated legal defense costs regarding the Malibu patent infringement have been considered in providing this guidance.
(2) Adjusted net income per proforma share growth
(1)
(2)

APPENDIX

ADJUSTED EBITDA RECONCILIATION
The following table sets forth a reconciliation of adjusted EBITDA to net income as determined in
accordance with GAAP for the periods indicated:FY 2017 Q1 FY 2016 Q1
Net Income (Loss) $6,983 $(1,323)
Income Tax Expense 4,041 1,033
Interest Expense 611 964
Depreciation and Amortization 797 825
EBITDA $12,432 $1,499
Change in Common Stock Warrant Fair Value(1) — 3,346
Transaction Expenses(2) 54 124
Litigation charge(3) 709 274
Stock-based compensation 119 5,425
Adjusted EBITDA $13,314 $10,668
Adjusted EBITDA margin(4) 21.9% 19.1%
(Dollars in thousands, unaudited)
(1) Represents non-cash expense related to changes in the fair market value of our common stock warrant.
(2) Represents fees and expenses associated with our follow-on offering and initial public offering.
(3) Represents legal and advisory fees related to our litigation with Malibu Boats, LLC.
(4) We define Adjusted EBITDA margin as Adjusted EBITDA expressed as a percentage of sales.

ADJUSTED NET INCOME RECONCILIATIONThe following table sets forth a reconciliation of Adjusted net income to net income as determined in
accordance with GAAP for the periods indicated:FY 2017 Q1 FY 2016 Q1
Net Income (Loss) $6,983 $(1,323)
Income Tax Expense 4,041 1,033
Change in Common Stock Warrant Fair Value(1) — 3,346
Transaction Expenses(2) 54 124
Litigation charge(3) 709 274
Stock-based compensation 119 5,425
Adjusted net income before income taxes 11,906 8,879
Adjusted income tax expense(4) 4,286 3,196
Adjusted net income $7,620 $5,683
Pro-Forma Adjusted net income per common share
Basic $0.41 $0.32
Diluted $0.41 $0.30
Pro-forma weighted average shares used for the computation of:
Basic Adjusted net income per share(5) 18,591,808 17,997,622
Diluted Adjusted net income per share(5) 18,679,292 18,946,145
(Dollars in thousands, unaudited)
(1) Represents non-cash expense related to changes in the fair market value of our common stock warrant.
(2) Represents fees and expenses associated with our follow-on offering and initial public offering.
(3) Represents legal and advisory fees related to our litigation with Malibu Boats, LLC.
(4) Reflects income tax expense at an estimated normalized annual effective income tax rate of 36.0 percent for the periods presented.
(5) The weighted average shares used for computation of pro-forma diluted earnings per common share gives effect to the 39,161 shares of restricted
stock awards, the 42,587 performance stock units granted under the 2015 Incentive Award Plan during the three months ended October 2, 2106
and 5,736 shares for the dilutive effect of stock options.