Embed Size (px)
Citation preview

1December 2014
FIRST RELEASE OF RESULTS

2 First release of results
Acknowledgements
TERCE is the product of efforts and commitments made by numerous teams, organizations, and regional and national authorities. We wish to express our most sincere thanks to Education officials and national coordinators in the 15 participating countries and in the Mexican state of Nuevo León. They are represented by the Department of Quality Assessment in Education (DINIECE) of Argentina’s Ministry of Education; the Anísio Teixeira National Institute of Education Studies and Research of Brazil; Chile’s Education Quality Agency; the Colombian Institute for the Promotion of Higher Education (ICFES); the Quality Management and Assessment Division of the Ministry of Public Education of Costa Rica; the National Institute of Educational Assessment of Ecuador (INEVAL); the General Division of Education Assessment and Research of the Ministry of Education of Guatemala; the General Division of Quality Assessment in Education (DIGECE) of the Ministry of Education of Honduras; the National Institute for the Evaluation of Education of Mexico (INEE); the General Division of
Educational Assessment (DGEENL) of the Ministry of Education of Nuevo León; the Special Projects Division of the Ministry of Education of Nicaragua; the National Division of Educational Assessment of the Ministry of Education of Panama; the General Division of Educational Planning of the Ministry of Education and Culture of Paraguay; the Education Quality Measuring Unit of the Ministry of Education of Peru; the Division of Education Quality Assessment of the Ministry of Education of the Dominican Republic; and the Division of Research, Evaluation, and Statistics of the National Public Education Administration (ANEP) of Uruguay. Additionally, we wish to thank the students, families, teachers, and principals of participating schools. This study would not have been possible without the cooperation and commitment of national stakeholders.
We are also grateful to our implementing partners, who made the analysis of the results possible: Mide UC of Chile’s Pontificia Universidad Católica, and
the Center for Comparative Education Policies of the Universidad Diego Portales. Also, the technical contributions of members of the High Level Consultative Technical Council (CTAN): Felipe Martínez (Universidad Autónoma de Aguascalien- tes); Eugenio González (Educational Testing Service); Wolfram Schulz (Australian Council for Educational Research) and Martin Carnoy (Stanford University).
Furthermore, we express our appreciation to the TERCE’s funding partners: UNICEF, the Inter–American Development Bank (IADB), the Spanish Agency for International Development Cooperation (AECID), the Santillana Foundation, and the Educational Testing Service (ETS).
Finally, we manifest our earnest acknowledgement of the contributions made by the professional staff of the OREALC / UNESCO Santiago Office and the UNESCO field offices and institutes in the region, who provided their support for the development of this report.

3December 2014
SERCE AND TERCE2006-2013
COMPARISON OF RESULTS BETWEEN THE SECOND AND THE THIRD REGIONAL COMPARATIVE AND EXPLANATORY STUDIES
4 First release of results
Considerable progress has been made in Latin America and the Caribbean in coverage and access to education, receiving international recognition; however it is not sufficient to ensure that the right to education is fulfilled. This right consists of three elements: access to a school, the right to learn, and inclusive schools able to attend to the great diversity of students and to provide everything necessary for an adequate education. For UNESCO, educational quality assessment is an imperious need towards guaranteeing this right, since it provides fundamental information for directing efforts towards this goal.
OREALC/UNESCO Santiago defines the concept of “educational quality assessment” as a systematic process of obtaining valid, reliable data about the context, resources, processes and results of learning, with the aim to understand actual educational practices, so as to compare them with set standards and objectives and to identify discrepancies and their possible causes.
In this context, OREALC/UNESCO Santiago is working in coordination with the region’s countries with the aim of guaranteeing the right to a high quality education for all. One of the regional
initiatives of this United Nations Agency is the Latin American Laboratory for Assessment of the Quality of Education (LLECE), a network of national units for educational assessment in Latin America and the Caribbean.
LLECE has been carrying out comparative and explanatory regional educational assessment studies since 1997. The results of these assessments have guided the educational debate towards quality and inclusion, generating data which demonstrates the magnitude of the challenges facing education in our countries. They also provide indispensable information on the gap in the achievement levels between students in different contexts, highlighting the critical situation of educational inequity in the region.
Since its beginnings, LLECE has been characterised by the fact that it is based on the educational context of the region, and that its studies follow a participative model. LLECE has involved the participant countries in all the decisions and implementation phases of its studies and other activities. Developing the theoretical reference framework, curriculum analysis and the elaboration of items are just a few of the processes in which countries have contributed from
their respective situations. Given the logic of this work, the countries have also benefited from the discussion of technical and strategic issues, which are essential domains for the implementation of international studies of this kind.
Another differentiating aspect is that the contents assessed in the LLECE tests are defined on the basis of the current curricula in the countries; in other words, they include the countries’ visions as to what a primary school student should learn and know.
In this document, OREALC/UNESCO Santiago is pleased to present the first delivery of the results of the Third Regional Comparative and Explanatory Study (TERCE), carried out by LLECE in 2013.
The purpose of this first delivery is to focus on the results of the TERCE tests compared with the results of the Second Regional Comparative and Explanatory Study (SERCE) in two main aspects:
i. The learning achievements of students in third and sixth grade Primary Education, in the areas of Reading, Mathematics and Natural Sciences. The data is also broken down by gender.
Introduction

5December 2014
The contribution of studies of this kind consists in showing the progress made by countries and the factors that explain their
success or laggardness. The central issue is not “who is winning the race”, but to understand the reasons for success and so
generate mutual learning between education systems.
ii. Distribution of students according to their achievement levels in the grades and areas assessed.
The size and technical characteristics of the TERCE study mean that the information that it provides can be analysed in different ways. For this reason, work is now being done on modelling the associated factors, in order to identify those variables or dimensions that are significantly related with students’ learning results.
The final release of the results of TERCE will therefore be made in April 2015, and will include the complete results both of the tests to assess learning achievements and analyses of the associated factors.
It should be noted that the success of a study such as this is measured by its impact on education policy. UNESCO hopes that the information provided by TERCE will enable societies to learn more about the quality of their education and to direct their efforts towards policies that will have an impact on their education systems.
The role of UNESCO and the studies carried out through LLECE is to help countries to build quality education systems in all their dimensions: based on
established objectives (effectiveness), making optimum use of resources and time (efficiency), providing every child with what he/she needs in order to learn (equity), which are comprehensive and able to attend to the great diversity of students (pertinence), and meeting each child’s needs to enable him/her to develop and contribute to his/her country (relevance). The national average of learning achievements represents only one dimension of educational quality, effectiveness.
For UNESCO, rankings are not intrinsically negative; however they tend to have a great normative effect that needs to be managed. If education systems focus solely on measurable areas (mathematics, science, language) and not on others (social sciences, art, physical education, etc.) or on non-cognitive aspects (tolerance, creativity, dispute settlement), quality will be jeopardised.
The contribution of studies of this kind consists in showing the progress made by countries and the factors that explain their success or laggardness. The central issue is not “who is winning the race”, but to understand the reasons for success and so generate mutual learning between education systems. For example, what policies have been implemented by the
best-positioned, and, even more importantly, “how can I improve the policies in my country” to achieve significant progress in learning.
This first release of the results of TERCE focuses on comparing the performance of each country with its own results in SERCE, in order to understand the progress made in learning achievements in the education system between 2006 and 2013. The second step will be the publication in April 2015 of the results on the factors associated with these achievements; this will enable the study to fulfill one of LLECE’s goals, namely to contribute, with empirical information, to the development of policies that will improve the offer of education in the region in pursuit of the right of education for all.
The Technical Coordination Team Latin American Laboratory for Assessment of
the Quality of Education (LLECE) December 2014
6 First release of results
Chapter OneThe studies coordinated by the Latin American Laboratory for
Assessment of the Quality of Education (LLECE)

7December 2014
Background
A brief history of LLECE and its studies
The Latin American Laboratory for Assessment of the Quality of Education (LLECE) was created on November 10, 1994, in Mexico City, as a network of national education quality assessment units across Latin America and the Caribbean. Since then, LLECE has been a reference point and a framework for regional cooperation in educational assessment, with three main objectives: to promote evidence-based education policy through the generation of (empirical) data on quality education and associated factors; to develop capacities; and to serve as a space to generate ideas and discussion.
The Laboratory emerged in the context of the 1990s, a period in which many countries in the region were adopting educational reforms without sufficient and relevant information for their design and lacking a critical mass of resources to measure educational
quality. In this period, only a few countries in Latin America and the Caribbean were conducting national educational assessments, the results of which were generally not released to the public. Considering the need to support countries in their learning assessment missions, in 1997 the Laboratory applied the First Regional Comparative and Explanatory Study (PERCE) among students in third and fourth grades of primary education, in Reading and Mathematics.
This joint effort was one of the greatest political achievements in education accomplished on the continent, with the successful participation of thirteen countries: Argentina, Bolivia, Brazil, Chile, Colombia, Costa Rica, Cuba, Dominican Republic, Honduras, Mexico, Paraguay, Peru, and Venezuela. The results of PERCE were published in November 1998.
1

8 First release of results
The Second Regional Comparative and Explanatory Study (SERCE)
In late 2002, LLECE’s member countries decided to develop the second regional study, SERCE, to capitalise on what had been learned in PERCE and take major steps to extend the analysis to more countries, school grades and areas. SERCE took four years to prepare and was applied in 2006.
Sixteen countries took part in this study, and, for the first time, one sub-national region. The participants were: Argentina, Brazil, Chile, Colombia, Costa Rica, Cuba, Dominican Republic, Ecuador, El Salvador, Guatemala, Mexico, Nicaragua, Panama, Paraguay, Peru, and Uruguay, plus the Mexican state of Nuevo León.
The study involved 3,065 schools, with 4,627 third grade classes and 4,227 sixth grade. The total number
of Primary School students assessed was 100,752 in third grade and 95,288 in sixth grade.
Like the first study, SERCE assessed Reading and Mathematics in third grade and sixth grade students. However, in the light of the lessons learned from PERCE, and the countries’ assessment needs, the second study added a Writing assessment as part of the Language test, and introduced a third subject, Natural Sciences, which was applied in sixth grade. Because the Science test was being applied for the first time, participation was voluntary and eight countries took the test: Argentina, Colombia, Dominican Republic, Panama, Paraguay, Peru, Uruguay and the Mexican state of Nuevo León.
The results of SERCE were published in June 2008, with the average scores achieved by each country, the
achievement level distributions and the analyses of associated factors. The latter were of great importance for identifying which variables influence students’ learning achievements.
It was found that there are school level variables that can help significantly to reduce learning inequalities. The results showed that the school climate exercises the greatest influence on student performance; this highlights the need to improve the climate in the classroom, for example by fomenting school coexistence.
These findings were used extensively by the countries and in some cases served as a tool for guiding education policy decisions, confirming the relevance of the study and validating its continuance. For this reason the participating countries agreed in 2010 to carry out a third study.
2

9December 2014

10 First release of results
Implementation and objectives of TERCE
The Third Regional Comparative and Explanatory Study (TERCE) has been a collective effort across the region involving thousands of people over the last four years.
TERCE has two essential aims: firstly, to report on comparative learning achievements in the region’s countries with reference to local curricula, in the conviction that learning achievement is an indispensable ingredient in educational quality.
The second aim is to report on the variables associated with learning achievement levels, in order to contribute to knowledge of the circumstances in which learning takes place in the region.
TERCE lies at the heart of the debate on educational quality that is so important for the region and has received so wide public attention. Its goal is to contribute to informed public debate on inclusive quality education in favour of guaranteeing the right to education for all, to which all UNESCO’s efforts are directed. To this end it measures learning
achievements in Mathematics, Language (Reading and Writing) and Natural Sciences in Primary School students, and identifies the associated factors which influence these results.
The study has followed a work plan since 2010, broken down into the following stages:
The Third Regional Comparative and Explanatory Study (TERCE)
1
DEVELOPMENT STAGES OF TERCE
» Curriculum analysis» Elaboration of Items
» General design» Work Plan
» Developing the framework for associated factors» Questionnaires development» Sampling design» Development of software » Pilot application
» Final application
» Analysis and draft of reports» First release of results
» Final release
2011
2010
2012
2013
2014
2015

11December 2014
IN THESE COUNTRIES, TERCE ASSESSED LEARNING ACHIEVEMENTS IN LANGUAGE (READING AND WRITING) AND MATHEMATICS IN THIRD AND SIXTH GRADES AND NATURAL SCIENCES IN SIXTH GRADE PRIMARY EDUCATION.
* MEXICAN STATE
ARGENTINA - BRAZIL - CHILE - COLOMBIA - COSTA RICA - DOMINICAN REPUBLIC - ECUADOR - GUATEMALA - HONDURAS - MEXICO - NICARAGUA - PANAMA - PARAGUAY - PERU - URUGUAY - NUEVO LEÓN*
Participating countries and areas assessedFifteen countries in the region and one sub-national region participated in TERCE:
2

12 First release of results
Who coordinates it and how does it work
Regional curriculum analysis
OREALC/UNESCO Santiago is responsible for the coordination, management and implementation of the study, through the LLECE Technical Coordination Team (CT). This team works together with the National Coordinators (CN) that represent the countries participating in TERCE.
To carry out the technical actions demanded by the study, OREALC/UNESCO has two implementation partners: MIDE UC (Measurement Center of the Pontificia Universidad Católica de Chile) and CPCE (Center for Comparative Education Policies, Universidad Diego Portales). The former was responsible for test development and analysis; the latter for development and analysis of the associated factor questionnaires.
The first step in test development was a review of the curricular frameworks of the participating countries, carried out by the Colombian Institute for Education Assessment (ICFES).
At the same time, LLECE receives advice from a High-level Technical Advisory Board (CTAN) composed of academics in the area of education, especially in educational assessment research.
The work of the CTAN consists in offering expert opinion, strategic guidance and recommendations to inform technical decisions related with the different stages of TERCE, including sampling design, test design, analysis of items, secondary analysis of associated factors, reports, etc.
As in its predecessors, PERCE and SERCE, tests are applied in TERCE to examine elements common to the school curricula of the region in Mathematics, Language and Natural Sciences.
The tests applied in TERCE are based on analysis of the school curricula of each participating country. This included review, systematisation and analysis of the content prescribed by the various curricula in the different areas assessed in the region, in order to establish conceptual domains common to Primary School students in all the participating countries.
TERCE identifies common contents, the focuses through which the countries assess their students’ performance and the way in which these focuses are organised. By studying these and using them as criteria, TERCE helps to enrich knowledge on Educational Assessment in the region.
The Council consists of world-renowned experts in educational assessment: Eugenio Gonzalez (Educational Testing Service), Felipe Martinez Rizo (Autonomous University of Aguas Calientes), Wolfram Schulz (Australian Council for Educational Research) and Martin Carnoy (Stanford University).
3
4
LLECE emerged in the context of the 1990s, a period in which many countries in the region were adopting educational reforms without sufficient and relevant information for their design and lacking a critical mass of resources to measure educational quality.

13December 2014
Instruments for data collection Innovations in the TERCE tests
To achieve its goal, TERCE uses two types of data collection instruments: the first is a group of learning assessment tests and the second is a set of context questionnaires.
LEARNING ASSESSMENT TESTSTest development was done through Item Development
Workshops attended by the countries participating in the study. These workshops had the double aim of developing the instruments necessary for the study and giving technical training to the national teams. As mentioned above, the first step in instrument construction was a review of the curricular frameworks. This allowed common curriculum elements to be identified in order to define a suitable test structure for measuring educational quality at the regional level.
CONTEXT QUESTIONNAIRESThe context questionnaires were developed taking into
consideration of the study’s theoretical framework. TERCE has questionnaires for students, families, teachers and directors. The information obtained through these instruments will provide the foundation for analysis of the associated factors, which will be published in the second release in April 2015.
The experience gained by LLECE over the years has taught the Laboratory the needs of Educational Assessment in the region, enabling it to work with innovative techniques to ensure that its studies provide relevant information which will have an impact on public policies.
One of the innovations implemented by the Laboratory since the application of SERCE has been assessment of Writing skills. The ability to organise ideas and express them coherently in a written text is a basic tool for human and professional development in the 21st century, and is therefore also a reflection of the quality of the education received by the region’s children. For this reason, TERCE has again assessed Writing and will report to countries on their students’ performance in this area.
5 6
14 First release of results
Chapter Two Primary education students’
performance between 2006 and 2013
15December 2014
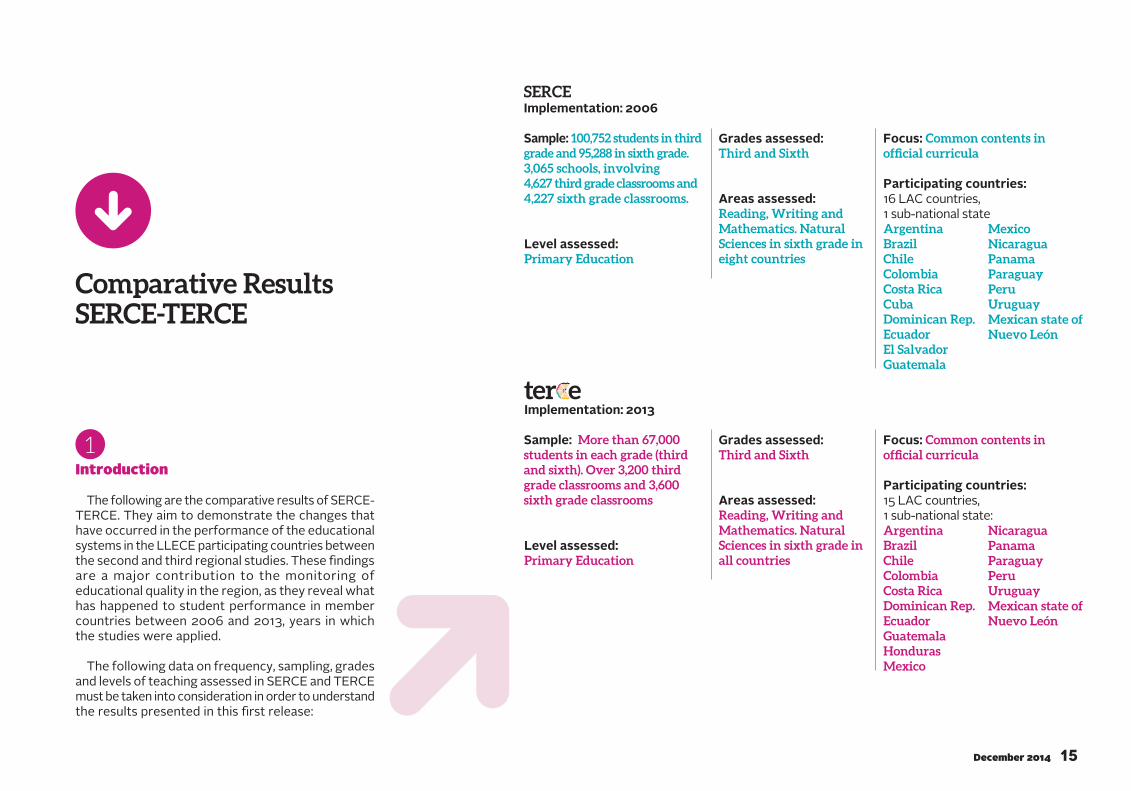
Comparative Results SERCE-TERCE
Introduction
The following are the comparative results of SERCE-TERCE. They aim to demonstrate the changes that have occurred in the performance of the educational systems in the LLECE participating countries between the second and third regional studies. These findings are a major contribution to the monitoring of educational quality in the region, as they reveal what has happened to student performance in member countries between 2006 and 2013, years in which the studies were applied.
The following data on frequency, sampling, grades and levels of teaching assessed in SERCE and TERCE must be taken into consideration in order to understand the results presented in this first release:
1
Implementation: 2013
SERCEImplementation: 2006
Sample: 100,752 students in third grade and 95,288 in sixth grade. 3,065 schools, involving4,627 third grade classrooms and 4,227 sixth grade classrooms.
Sample: More than 67,000 students in each grade (third and sixth). Over 3,200 third grade classrooms and 3,600 sixth grade classrooms
Areas assessed: Reading, Writing and Mathematics. Natural Sciences in sixth grade in eight countries
Areas assessed: Reading, Writing and Mathematics. Natural Sciences in sixth grade in all countries
Focus: Common contents in official curricula
Focus: Common contents in official curricula
Participating countries: 16 LAC countries, 1 sub-national state
Participating countries: 15 LAC countries, 1 sub-national state:
Level assessed: Primary Education
Level assessed: Primary Education
Grades assessed: Third and Sixth
Grades assessed: Third and Sixth
ArgentinaBrazilChileColombiaCosta RicaCubaDominican Rep.EcuadorEl SalvadorGuatemala
ArgentinaBrazilChileColombiaCosta RicaDominican Rep.Ecuador GuatemalaHondurasMexico
Mexico NicaraguaPanamaParaguayPeruUruguayMexican state of Nuevo León
Nicaragua Panama ParaguayPeruUruguayMexican state of Nuevo León

16 First release of results
The findings released in this first set of results compare learning achievements of students in third and sixth grades, in the Mathematics and Reading tests for all the countries that participated in both studies. It will also be possible to compare the results in the Natural Sciences test in the eight countries for which data is available in both studies. It should be noted that participation in the Natural Sciences
test in SERCE was voluntary, therefore only a few countries applied it.
Differences by gender will be shown in all of these comparisons of SERCE-TERCE scores. This section also presents information on student distribution among the different achievement levels in SERCE and TERCE.
The achievement levels consist of descriptions of the skills and knowledge of students in each level. This release of comparative results will show the
variations between students in the same level, in both SERCE and TERCE. Specific descriptions of each of the achievement levels are provided below.
Note: data for Honduras is presented, but no comparison with its performance in SERCE is possible as the country did not take part in the second study. Its scores and performance levels in TERCE will be reported using the SERCE scale.
SUMMARY OF AREAS AND GRADES FOR WHICH COMPARATIVE INFORMATION WILL BE AVAILABLE
ArgentinaBrazilChileColombiaCosta RicaDominican Rep. EcuadorGuatemalaHondurasMexicoNicaraguaPanamaParaguayPeruUruguayNuevo León
Countries with comparative information
Mathematics
3rd grade 3rd grade 6th grade 6th grade 6th grade
Reading Science

17December 2014

18 First release of results
THIRD GRADE
THIRD GRADE
Skills for each achievement level in the Mathematics test:
Skills for each achievement level in the Reading test:
• Recognise the rule governing the formation of a numerical sequence and identify its formulation.• Solve multiplication problems involving one unknown or that require making use of equivalency between the usual measures of length.• Ident ify an e lement on a twodimensional plane and the properties of the sides of a square or rectangle to solve a problem.
• Integrate and generalise information given in a paragraph or in verbal and graphic codes.• Replace non-explicit information.• Follow the text, Including locating new information. • Understand translations from one code to another (from numeric to verbal, and verbal to graphic).
• Solve multiplication problems or addition problems that involve an equation or require two operations. • Solve addition problems using units of measure and their equivalents or problems that include common fractions.• Recognise the rule governing a graphic sequence or additive numerical sequence and continue it.• Identify elements of unusual geometric figures and interpret the different types of figures for extracting information and solving problems using the data.
• Locate information, distinguishing it from adjacent information.• Interpret reformulations that summarise several data.• Infer information based on knowledge about the world.• Distinguish, based on the text, the meaning of words that have more than one meaning.
• Recognise the decimal and positional organisation of the numbering system and the elements of geometric figures.• Identify a path on a plane and the most appropriate unit of measure for measuring an attribute of a known object.• Interpret tables and charts in order to extract and compare data.• Solve addition or multiplication problems involving proportions in the field of natural numbers.
• Locate information in a brief text that is not distinguished from other, conceptually similar information.• Distinguish words with a single meaning.• Recognise simple sentence reformulations.• Recognise redundancies between graphic and verbal codes.
• Recognise the relationship of order between natural numbers and common two-dimensional geometric figures in simple drawings.• Locate relative positions of an object in a spatial representation.• Interpret tables and graphs in order to extract direct information.
• Locate information with a single meaning, in a prominent part of the text, repeated literally or synonymously, and isolated from other information.
• Students who do not achieve the skills required for level I.
• Students who do not achieve the skills required for level I.
Level IV
Level IV
Level III
Level III
Level II
Level II
Level I
Level I
Below I
Below I
SERCE Achievement Levels

19December 2014
SIXTH GRADE Skills for each performance level in the Mathematics test:
• Find averages and solve calculations, combining the four basic operations in natural numbers.• I d e n t i f y p a r a l l e l i s m a n d perpendicularity in a real situation, and represent a percentage in graphic form.• Solve problems involving properties of angles in triangles and quadrilaterals incorporating areas of different shapes, or two operations with decimal numbers.• Solve problems involving fractions.• Make generalisations in order to continue a graphic sequence following a complex pattern.
• Compare fractions, use the concept of percentages when analysing information and solving problems that require this type of calculation.• Identify perpendicularity and parallelism on a plane, as well as bodies and their elements, without graphic support.• Solve problems that require interpreting the constituent elements of a division or measurement equivalence.• Recognise central angles and commonly used geometrical shapes, including the circle; make use of their properties to solve problems.• Solve problems involving areas and perimeters of triangles and quadrilaterals.• Make generalisations in order to continue a graphic sequence or find the numerical sequence rule that applies to a relatively complex pattern.
• Analyse and identify the structure of the positional decimal number system, and estimate weight (mass) expressing it in units consistent with the attribute being measured.• Recognise commonly used geometrical figures and their properties in order to solve problems.• Interpret, compare and work with information presented through various graphic representations.• Identify the regularity of a sequence following a simple pattern.• Solve addition problems in different numerical fields (natural numbers and decimals), including commonly used fractions or measurement equivalence.• Solve multiplication or division problems, or two operations with natural numbers, or operations that include direct proportionality relations.
• Arrange natural numbers (up to five digits) and decimals (up to thousandths) in sequence.• Recognise common geometrical figures and the measurement unit consistent with the attribute being measured.• Interpret information in graphic representations in order to compare it and change it to a different form of representation.• Solve problems involving a single addition using natural numbers.
• Students who do not achieve the skills required for level I.
Nivel IV Nivel III Nivel II Nivel I
Below I

20 First release of results
SIXTH GRADE Skills for each achievement level in the Reading test:
• Integrate, rank and generalise information distributed across the text.• Establish equivalences between more than two codes (verbal, numeric and graphic).• Restate implicit information associated with the entire text.• Recognise the possible meanings of technical terms or figurative language.• Distinguish various tenses and nuances (certainty, doubt) used in a text.
• Use and transfer scientific knowledge involving a high degree of formalisation and abstraction to diverse types of situation.• Identify the scientific knowledge involved in a problem at hand which is more formally stated and may relate to aspects, dimensions or analyses that are detached from the pupil’s immediate setting.
• Locate information, distinguishing it from adjacent information. • Interpret reformulations and syntheses. • Integrate data distributed across a paragraph.• Restate information implicit in the paragraph.• Re-read in search of specific data.• Distinguish the meaning of words that have more than one meaning.• Recognise the meaning of parts of words (affixes) using the text as a reference.
• Explain everyday situations on the basis of scientific evidence, use simple descriptive models to interpret natural phenomena and draw conclusions from a description of experimental activities.
• Locate information in the middle of a text to be distinguished from a different piece of information in a different segment.• Integrate stated information and exemplified information.• Distinguish words with a single meaning.
• Apply school-acquired scientific knowledge: compare, organise and interpret information presented in various formats (tables, figures, diagrams, images), recognise causal relationships and classify living beings in accordance with a criterion.• Access information presented in various formats, interpretation and treatment of which require more complex skills.
• Locate information with a single meaning, in a central or prominent part of the text (the end or the beginning), repeated literally or synonymously, and isolated from other information.
• Relate scientific knowledge with everyday situations which are common in their surroundings.• Explain the immediate world based on their own observations and experiences; establish a relation between these and their previously acquired scientific knowledge, and put them to simple, linear use.• Describe simple, concrete events involving cognitive processes such as remembering and identifying.
• Students who do not achieve the skills required for level I.
• Students who do not achieve the skills required for level I.
Level IV
Nivel IV
Level III
Nivel III
Level II
Nivel II
Level I
Nivel I
Below I
Below I
SIXTH GRADE Skills for each achievement level in the Natural Sciences test:
21December 2014
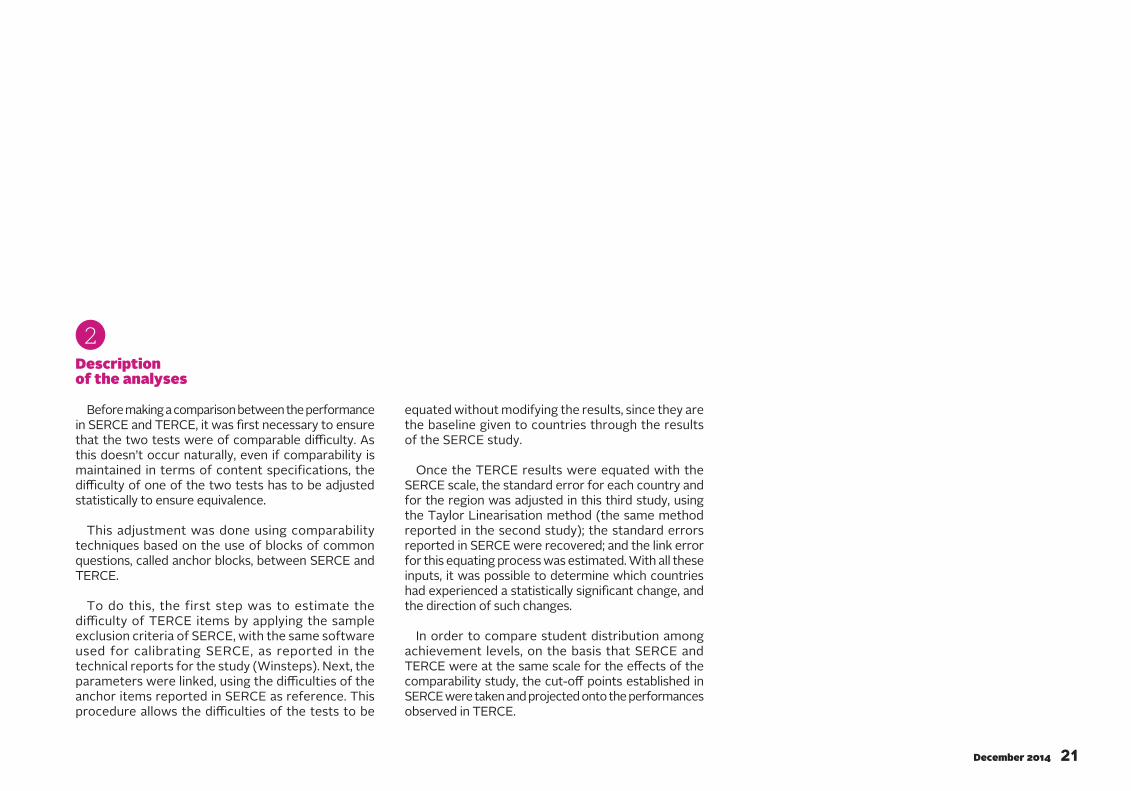
Description of the analyses
Before making a comparison between the performance in SERCE and TERCE, it was first necessary to ensure that the two tests were of comparable difficulty. As this doesn’t occur naturally, even if comparability is maintained in terms of content specifications, the difficulty of one of the two tests has to be adjusted statistically to ensure equivalence.
This adjustment was done using comparability techniques based on the use of blocks of common questions, called anchor blocks, between SERCE and TERCE.
To do this, the first step was to estimate the difficulty of TERCE items by applying the sample exclusion criteria of SERCE, with the same software used for calibrating SERCE, as reported in the technical reports for the study (Winsteps). Next, the parameters were linked, using the difficulties of the anchor items reported in SERCE as reference. This procedure allows the difficulties of the tests to be
equated without modifying the results, since they are the baseline given to countries through the results of the SERCE study.
Once the TERCE results were equated with the SERCE scale, the standard error for each country and for the region was adjusted in this third study, using the Taylor Linearisation method (the same method reported in the second study); the standard errors reported in SERCE were recovered; and the link error for this equating process was estimated. With all these inputs, it was possible to determine which countries had experienced a statistically significant change, and the direction of such changes.
In order to compare student distribution among achievement levels, on the basis that SERCE and TERCE were at the same scale for the effects of the comparability study, the cut-off points established in SERCE were taken and projected onto the performances observed in TERCE.
2

22 First release of results

23December 2014
Dom
inic
an R
ep.
Reading learning in third grade Primary Education
The comparative results for SERCE-TERCE in the third grade Reading test show a statistically significant improvement at a regional level between 2006 and 2013. Consistent with this observation, 8 of the 14 countries that participated in both studies showed a significantly higher performance in TERCE than in SERCE (Brazil, Dominican Republic, Ecuador, Guatemala, Nicaragua, Panama, Paraguay and Peru). Argentina, Chile, Colombia and Uruguay present no differences in reading performance between SERCE and TERCE, while Costa Rica, Mexico and the Mexican state of Nuevo León present a statistically lower performance in the third study than in the second.
I
Comparative Results SERCE-TERCE
Argentina 510.04 512.48 2.44
Brazil 503.57 519.33 15.76*
Chile 562.03 571.28 9.25
Colombia 510.58 519.10 8.52
Costa Rica 562.69 542.83 -19.86*
Dominican Rep. 395.44 454.03 58.59*
Ecuador 452.41 508.43 56.02*
Guatemala 446.95 494.86 47.91*
Honduras 496.81
Mexico 530.44 519.39 -11.05*
Nicaragua 469.80 478.01 8.21*
Panama 467.21 489.93 22.72*
Paraguay 469.09 480.94 11.85*
Peru 473.98 521.39 47.41*
Uruguay 522.65 524.17 1.52
AVERAGE COUNTRIES 491.21 509.73 18.52*
Nuevo León 557.80 528.42 -29.38*
SERCE TERCE DifferenceSERCE-TERCE
0
100
200
300
400
500
600
DIFFERENCE BETWEEN AVERAGE READING TEST SCORES 3RD GRADE PRIMARY EDUCATION IN SERCE AND TERCE
Arg
enti
na
Bra
zil
Ch
ile
Col
omb
ia
Cos
ta R
ica
Ecu
ador
Gu
atem
ala
Mex
ico
Nic
arag
ua
Pan
ama
Par
agu
ay
Per
u
Uru
guay
AV
ER
AG
E C
OU
NT
RIE
S
Nu
evo
Leó
n
Note: *Statistically significant difference at a confidence level of 95%. The average of the countries was calculated considering that they have the same weighting (using the senate weight). Honduras is excluded from the calculation, since it did not take part in the second study and is therefore not part of the SERCE-TERCE comparative analysis.
TERCE average significantly higher than SERCE
TERCE average similar to SERCE
TERCE average significantly lower than SERCE
SERCE TERCE
24 First release of results
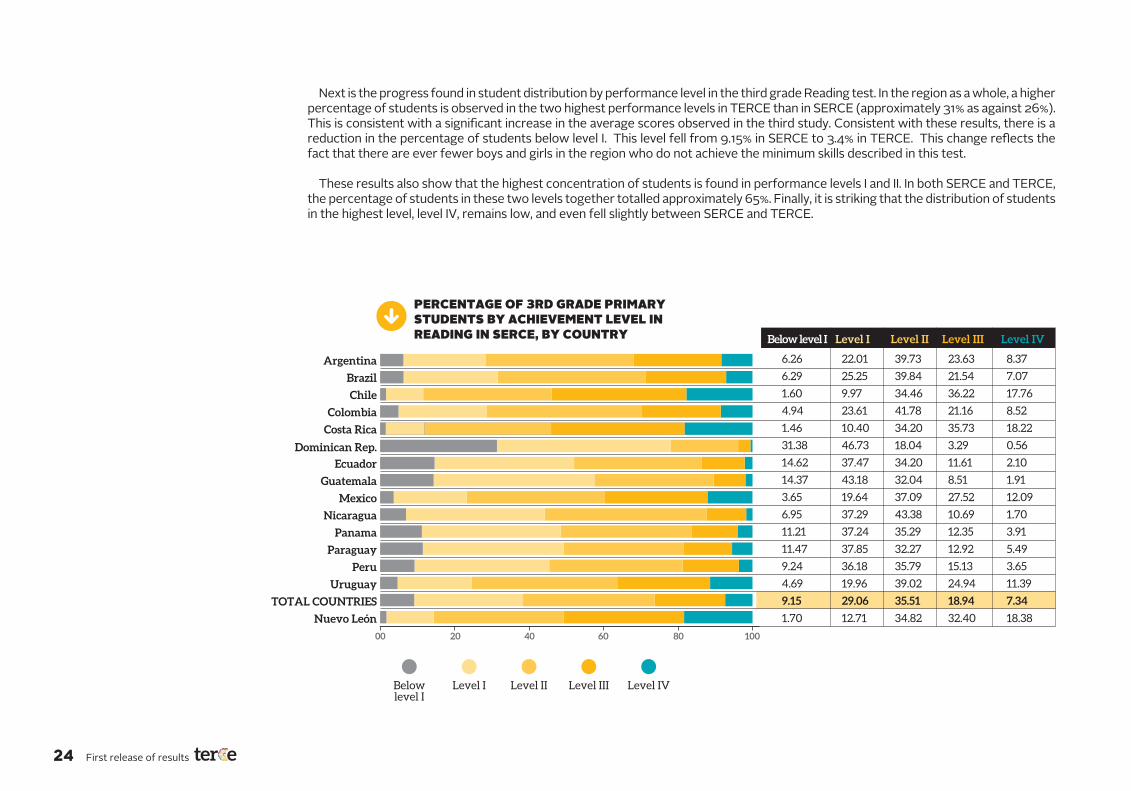
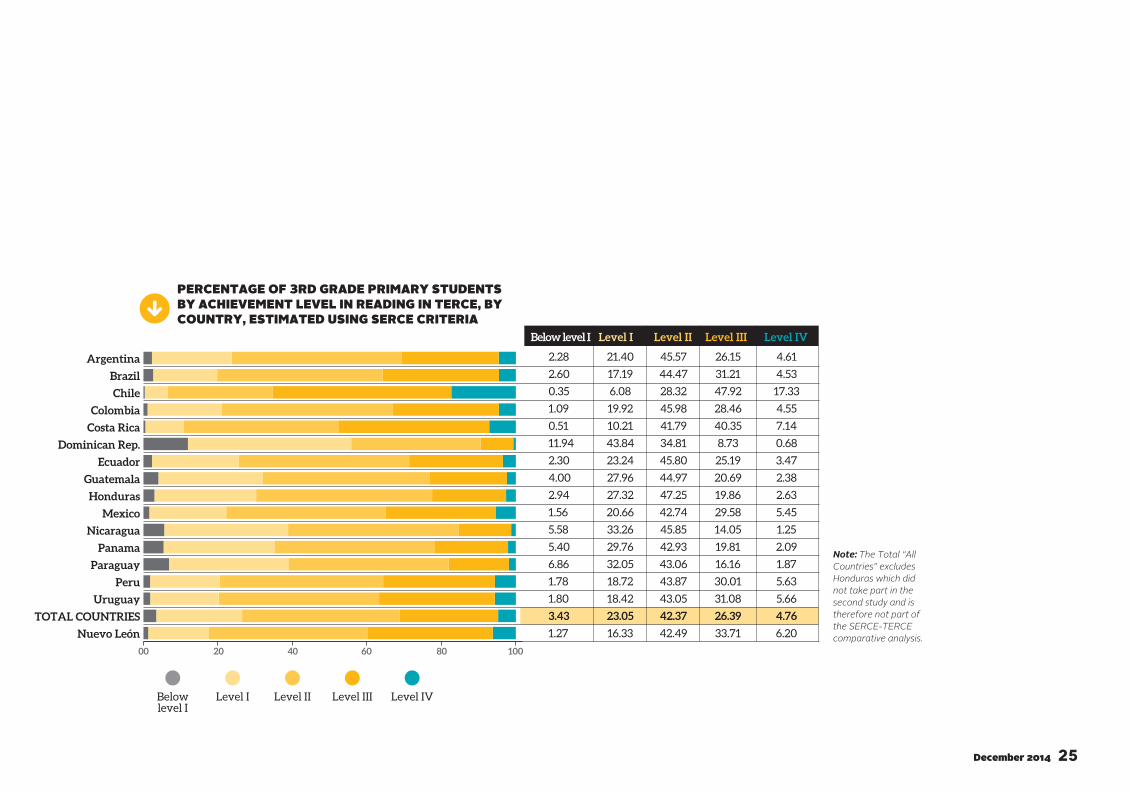
Next is the progress found in student distribution by performance level in the third grade Reading test. In the region as a whole, a higher percentage of students is observed in the two highest performance levels in TERCE than in SERCE (approximately 31% as against 26%). This is consistent with a significant increase in the average scores observed in the third study. Consistent with these results, there is a reduction in the percentage of students below level I. This level fell from 9.15% in SERCE to 3.4% in TERCE. This change reflects the fact that there are ever fewer boys and girls in the region who do not achieve the minimum skills described in this test.
These results also show that the highest concentration of students is found in performance levels I and II. In both SERCE and TERCE, the percentage of students in these two levels together totalled approximately 65%. Finally, it is striking that the distribution of students in the highest level, level IV, remains low, and even fell slightly between SERCE and TERCE.
20 40 60 80 10000
PERCENTAGE OF 3RD GRADE PRIMARY STUDENTS BY ACHIEVEMENT LEVEL IN READING IN SERCE, BY COUNTRY
Below level I
Level I Level II Level III Level IV
6.26 22.01 39.73 23.63 8.37
6.29 25.25 39.84 21.54 7.07
1.60 9.97 34.46 36.22 17.76
4.94 23.61 41.78 21.16 8.52
1.46 10.40 34.20 35.73 18.22
31.38 46.73 18.04 3.29 0.56
14.62 37.47 34.20 11.61 2.10
14.37 43.18 32.04 8.51 1.91
3.65 19.64 37.09 27.52 12.09
6.95 37.29 43.38 10.69 1.70
11.21 37.24 35.29 12.35 3.91
11.47 37.85 32.27 12.92 5.49
9.24 36.18 35.79 15.13 3.65
4.69 19.96 39.02 24.94 11.39
9.15 29.06 35.51 18.94 7.34
1.70 12.71 34.82 32.40 18.38
Below level I Level I Level II Level III Level IV
Argentina
Brazil
Chile
Colombia
Costa Rica
Ecuador
Guatemala
Mexico
Nicaragua
Panama
Paraguay
Peru
Uruguay
TOTAL COUNTRIES
Nuevo León
Dominican Rep.
25December 2014
Note: The Total “All Countries” excludes Honduras which did not take part in the second study and is therefore not part of the SERCE-TERCE comparative analysis.
20 40 60 80 10000
PERCENTAGE OF 3RD GRADE PRIMARY STUDENTS BY ACHIEVEMENT LEVEL IN READING IN TERCE, BY COUNTRY, ESTIMATED USING SERCE CRITERIA
Argentina
Brazil
Chile
Colombia
Costa Rica
Uruguay
TOTAL COUNTRIES
Nuevo León
2.28 21.40 45.57 26.15 4.61
2.60 17.19 44.47 31.21 4.53
0.35 6.08 28.32 47.92 17.33
1.09 19.92 45.98 28.46 4.55
0.51 10.21 41.79 40.35 7.14
11.94 43.84 34.81 8.73 0.68
2.30 23.24 45.80 25.19 3.47
4.00 27.96 44.97 20.69 2.38
2.94 27.32 47.25 19.86 2.63
1.56 20.66 42.74 29.58 5.45
5.58 33.26 45.85 14.05 1.25
5.40 29.76 42.93 19.81 2.09
6.86 32.05 43.06 16.16 1.87
1.78 18.72 43.87 30.01 5.63
1.80 18.42 43.05 31.08 5.66
3.43 23.05 42.37 26.39 4.76
1.27 16.33 42.49 33.71 6.20
Below level I Level I Level II Level III Level IV
Ecuador
Guatemala
Honduras
Mexico
Nicaragua
Panama
Paraguay
Peru
Below level I
Level I Level II Level III Level IV
Dominican Rep.

26 First release of results
If the results of the TERCE tests are broken down for analysis by student gender, it is apparent that countries in which girls obtain a significantly higher score than boys in the third grade reading test predominate; this difference is observed in both SERCE and TERCE, but in more countries in TERCE. The countries where girls obtained significantly higher scores than boys in TERCE are: Argentina, Brazil, Chile, Colombia, Costa Rica, Dominican Republic, Mexico and Paraguay, plus the Mexican state of Nuevo León. By contrast, no statistically significant differences in favour of boys are observed in either study.
DIFFERENCE IN AVERAGE READING SCORES BETWEEN GIRLS AND BOYS IN 3RD GRADE PRIMARY
Argentina
Brazil
Chile
Colombia
Costa Rica
Ecuador
Guatemala
Mexico
Nicaragua
Panama
Paraguay
Peru
Uruguay
AVERAGE COUNTRIES
Nuevo León0 5 10 15 20
Not significant Significant
2.46
17.75
18.57
13.20
14.94
15.69
12.73
9.05
4.64
4.68
9.02
1.67
1.77
0.76
12.73
Not significant Significant
0-5 5 10 15 20
-1.54
3.16
0.89
8.14
0.49
14.20
-0.66
10.92
13.08
9.61
13.52
8.15
11.04
11.25
7.93
10.57
Argentina
Brazil
Chile
Colombia
Costa Rica
Ecuador
Guatemala
Honduras
Mexico
Nicaragua
Panama
Paraguay
Peru
Uruguay
AVERAGE COUNTRIES
Nuevo León
SERCEBoys Girls
TERCEBoys Girls
Dominican Rep. 13.05 Dominican Rep. 16.71

27December 2014
Argentina 503.50 521.25 17.75* 506.90 517.82 10.92*
Brazil 495.44 514.01 18.57* 512.81 525.89 13.08*
Chile 561.81 564.27 2.46 566.68 576.29 9.61*
Colombia 509.02 513.66 4.64 512.24 525.76 13.52*
Costa Rica 560.44 565.12 4.68 538.90 547.05 8.15*
Dominican Rep. 394.32 407.37 13.05* 445.24 461.95 16.71*
Ecuador 448.19 457.21 9.02 508.76 508.10 -0.66
Guatemala 447.21 448.88 1.67 495.61 494.07 -1.54
Honduras 495.22 498.38 3.16
Mexico 526.31 539.51 13.2* 513.88 524.92 11.04*
Nicaragua 469.81 471.58 1.77 477.55 478.44 0.89
Panama 460.69 475.63 14.94* 485.75 493.89 8.14
Paraguay 463.18 478.87 15.69* 475.48 486.73 11.25*
Peru 474.06 474.83 0.76 521.16 521.65 0.49
Uruguay 519.27 532.00 12.73* 517.37 531.57 14.20
AVERAGE COUNTRIES 500.31 513.04 12.73 504.90 512.83 7.93*
Nuevo León 554.55 563.60 9.05* 523.21 533.78 10.57*
SERCE TERCE
(girl - boy)(girl - boy)DifferenceDifference BoysBoys GirlsGirls
Note: * Statistically significant difference at 95% confidence level.
DIFFERENCE IN AVERAGE READING SCORES BETWEEN GIRLS AND BOYS IN 3RD GRADE PRIMARY

28 First release of results
29December 2014
Ecu
ador
Gu
atem
ala
Mex
ico
Nic
arag
ua
Pan
ama
Par
agu
ay
Per
u
Dom
inic
an R
ep.
Reading learning insixth grade Primary education
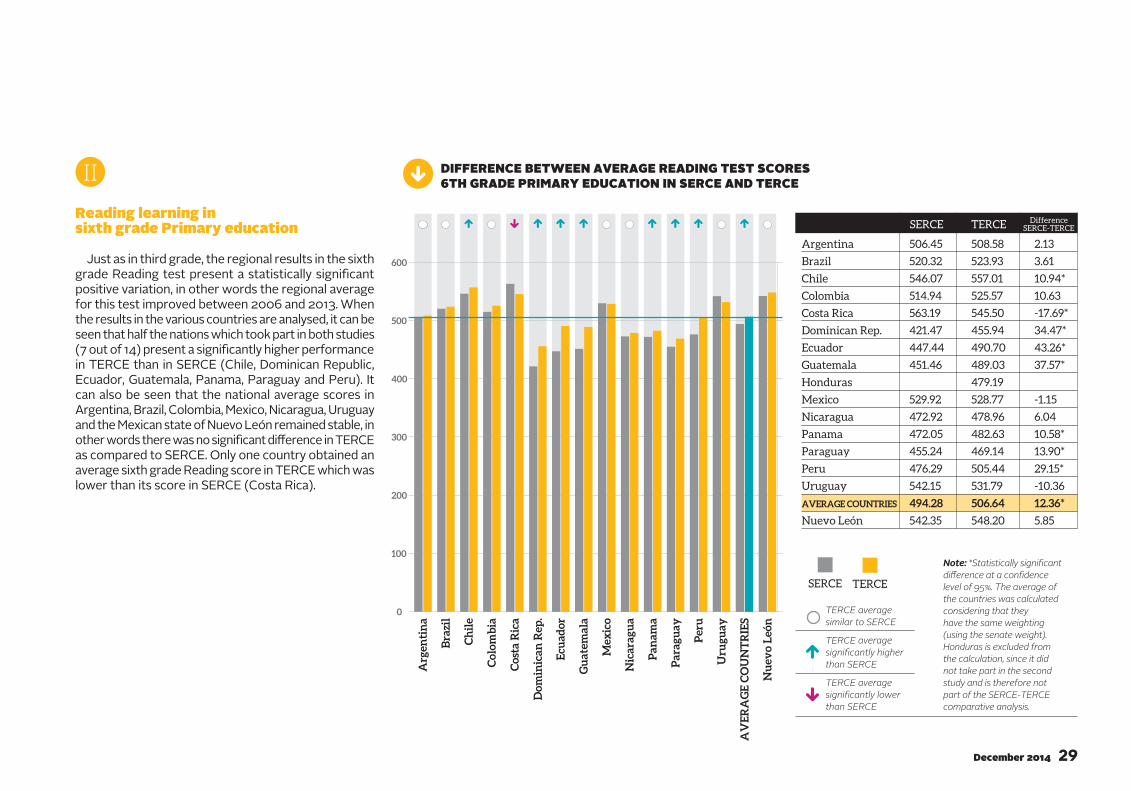
Just as in third grade, the regional results in the sixth grade Reading test present a statistically significant positive variation, in other words the regional average for this test improved between 2006 and 2013. When the results in the various countries are analysed, it can be seen that half the nations which took part in both studies (7 out of 14) present a significantly higher performance in TERCE than in SERCE (Chile, Dominican Republic, Ecuador, Guatemala, Panama, Paraguay and Peru). It can also be seen that the national average scores in Argentina, Brazil, Colombia, Mexico, Nicaragua, Uruguay and the Mexican state of Nuevo León remained stable, in other words there was no significant difference in TERCE as compared to SERCE. Only one country obtained an average sixth grade Reading score in TERCE which was lower than its score in SERCE (Costa Rica).
II
0
100
200
300
400
500
600
DIFFERENCE BETWEEN AVERAGE READING TEST SCORES 6TH GRADE PRIMARY EDUCATION IN SERCE AND TERCE
Arg
enti
na
Bra
zil
Ch
ile
Col
omb
ia
Cos
ta R
ica
Uru
guay
AV
ER
AG
E C
OU
NT
RIE
S
Nu
evo
Leó
n
Argentina 506.45 508.58 2.13
Brazil 520.32 523.93 3.61
Chile 546.07 557.01 10.94*
Colombia 514.94 525.57 10.63
Costa Rica 563.19 545.50 -17.69*
Dominican Rep. 421.47 455.94 34.47*
Ecuador 447.44 490.70 43.26*
Guatemala 451.46 489.03 37.57*
Honduras 479.19
Mexico 529.92 528.77 -1.15
Nicaragua 472.92 478.96 6.04
Panama 472.05 482.63 10.58*
Paraguay 455.24 469.14 13.90*
Peru 476.29 505.44 29.15*
Uruguay 542.15 531.79 -10.36
AVERAGE COUNTRIES 494.28 506.64 12.36*
Nuevo León 542.35 548.20 5.85
SERCE TERCE DifferenceSERCE-TERCE
Note: *Statistically significant difference at a confidence level of 95%. The average of the countries was calculated considering that they have the same weighting (using the senate weight). Honduras is excluded from the calculation, since it did not take part in the second study and is therefore not part of the SERCE-TERCE comparative analysis.
TERCE average significantly higher than SERCE
TERCE average similar to SERCE
TERCE average significantly lower than SERCE
SERCE TERCE

30 First release of results
The overall regional results for achievement levels in the sixth grade Reading test show a higher percentage in TERCE than in SERCE of students in the two highest levels. For example, the percentage of students placed in level III increased from 24% in SERCE to approximately 30% in TERCE. However, although the percentage of students placed in the two lowest performance levels (below I and level I) has fallen from 24% to 18%, this figure still suggests that efforts to improve learning must be maintained.
20 40 60 80 10000
PERCENTAGE OF 6TH GRADE PRIMARY STUDENTS BY ACHIEVEMENT LEVEL IN READING IN SERCE, BY COUNTRY
1.78 17.93 35.59 25.48 19.22
0.57 14.85 34.65 27.47 22.46
0.30 8.02 30.06 32.37 29.26
0.39 13.17 38.25 30.40 17.80
0.22 5.00 23.45 36.73 34.59
4.08 47.84 37.50 9.19 1.39
4.47 33.69 39.48 16.63 5.73
2.86 33.06 43.36 15.73 4.99
0.23 12.23 33.40 29.75 24.39
1.02 22.08 50.58 21.10 5.22
1.95 28.97 38.76 20.77 9.55
3.90 33.46 36.81 18.60 7.23
2.24 24.08 41.65 22.57 9.46
0.47 9.60 30.80 29.68 29.45
1.75 21.71 36.74 24.03 15.77
0.21 9.12 29.99 32.37 28.31
Below level I Level I Level II Level III Level IV
Argentina
Brazil
Chile
Colombia
Costa Rica
Ecuador
Guatemala
Mexico
Nicaragua
Panama
Paraguay
Peru
Dominican Rep.
Uruguay
TOTAL COUNTRIES
Nuevo León
Below level I
Level I Level II Level III Level IV

31December 2014
20 40 60 80 10000
PERCENTAGE OF 6TH GRADE PRIMARY STUDENTS BY ACHIEVEMENT LEVEL IN READING IN TERCE, BY COUNTRY, ESTIMATED USING SERCE CRITERIA
0.48 16.27 36.83 29.66 16.76
0.27 11.26 35.42 31.67 21.38
0.17 5.72 24.37 34.47 35.27
0.23 10.82 33.68 34.65 20.63
0.00 5.45 26.25 42.21 26.08
1.37 34.41 43.60 16.74 3.88
0.75 22.61 38.70 26.08 11.85
0.72 19.61 43.29 27.66 8.72
0.70 24.08 44.66 23.51 7.05
0.21 10.95 31.33 34.85 22.66
0.57 23.45 45.29 24.89 5.80
1.35 23.56 39.17 26.78 9.13
2.82 28.23 40.22 21.31 7.41
0.62 18.77 34.31 30.87 15.43
0.31 9.90 31.23 35.61 22.96
0.70 17.22 35.98 29.82 16.28
0.11 7.20 26.11 35.66 30.93
Below level I Level I Level II Level III Level IV
Note: The Total “All Countries” excludes Honduras which did not take part in the second study and is therefore not part of the SERCE-TERCE comparative analysis.
Argentina
Brazil
Chile
Colombia
Costa Rica
Ecuador
Guatemala
Honduras
Mexico
Nicaragua
Panama
Paraguay
Peru
Dominican Rep.
Uruguay
TOTAL COUNTRIES
Nuevo León
Below level I
Level I Level II Level III Level IV

32 First release of results
The table and graph below show that there are several countries, in both SERCE and TERCE, in which girls achieved a significantly higher performance than boys in the sixth grade Reading test. These results are very similar to those found in the third grade Reading test. Furthermore, neither of the two studies presents significant differences in favour of boys; in other words, both boys and girls present a similar performance, or the girls’ performance is higher. It may also be noted that almost all the participants which presented significant gender differences in TERCE (Argentina, Chile, Panama, Paraguay and the Mexican state of Nuevo León) also presented differences in SERCE, the only exception being Nicaragua. In four countries (Brazil, Dominican Republic, Mexico, and Uruguay) which presented statistically significant differences in performance in favour of girls in SERCE, the difference is no longer statistically significant in TERCE.
Argentina
Brazil
Chile
Colombia
Costa Rica
Uruguay
AVERAGE COUNTRIES
Nuevo León
11.05
15.69
6.89
-0.75
7.97
19.64
10.44
0-5 5 10 15 20
Dominican Rep. 15.09
-4.43
Ecuador
Guatemala
Mexico
Nicaragua
Panama
Paraguay
Peru
-2.44
-0.61
-1.87
6.39
15.89
11.14
13.32
DIFFERENCE IN AVERAGE READING SCORES BETWEEN GIRLS AND BOYS IN 6TH GRADE PRIMARY
Argentina
Brazil
Chile
Colombia
Costa Rica
Uruguay
AVERAGE COUNTRIES
Nuevo León0-5 5 10 15 20
11.67
17.63
13.06
8.81
9.28
6.56
4.05
Ecuador
Guatemala
Honduras
Meico
Nicaragua
Panama
Paraguay
Peru
12.54
14.06
12.31
3.45
-2.15
7.97
5.79
0.31
Dominican Rep. 10.79
14.18
SERCEBoys Girls
TERCEBoys Girls
Not significant Significant Not significant Significant

33December 2014
Argentina 501.26 512.30 11.05* 499.70 517.33 17.63*
Brazil 512.67 528.36 15.69* 517.79 529.46 11.67
Chile 543.42 550.31 6.89* 550.78 563.84 13.06*
Colombia 517.31 512.88 -4.43 522.55 529.11 6.56
Costa Rica 564.00 563.25 -0.75 543.57 547.62 4.05
Dominican Rep. 414.66 429.75 15.09* 450.44 461.23 10.79
Ecuador 444.06 450.45 6.39 489.10 492.55 3.45
Guatemala 453.23 450.79 -2.44 490.10 487.95 -2.15
Honduras 475.22 483.19 7.97
Mexico 523.80 537.11 13.32* 525.95 531.74 5.79
Nicaragua 473.11 472.49 -0.61 472.49 485.03 12.54*
Panama 464.92 480.82 15.89* 475.40 489.46 14.06*
Paraguay 450.07 461.22 11.14* 463.14 475.45 12.31*
Peru 477.19 475.33 -1.87 505.29 505.60 0.31
Uruguay 532.38 552.03 19.64* 524.69 538.87 14.18
AVERAGE COUNTRIES 508.11 518.54 10.44* 500.42 509.23 8.81*
Nuevo León 538.54 546.51 7.97 543.64 552.92 9.28*
SERCE TERCE
Note: * Statistically significant difference at 95% confidence level.
DIFFERENCE IN AVERAGE READING SCORES BETWEEN GIRLS AND BOYS IN 6TH GRADE PRIMARY
(girl - boy)(girl - boy)DifferenceDifference BoysBoys GirlsGirls

34 First release of results
35December 2014
100
200
300
400
500
600
Ecu
ador
Gu
atem
ala
Mex
ico
Nic
arag
ua
Pan
ama
Par
agu
ay
Per
u
Dom
inic
an R
ep.
Mathematics learning in third grade Primary education
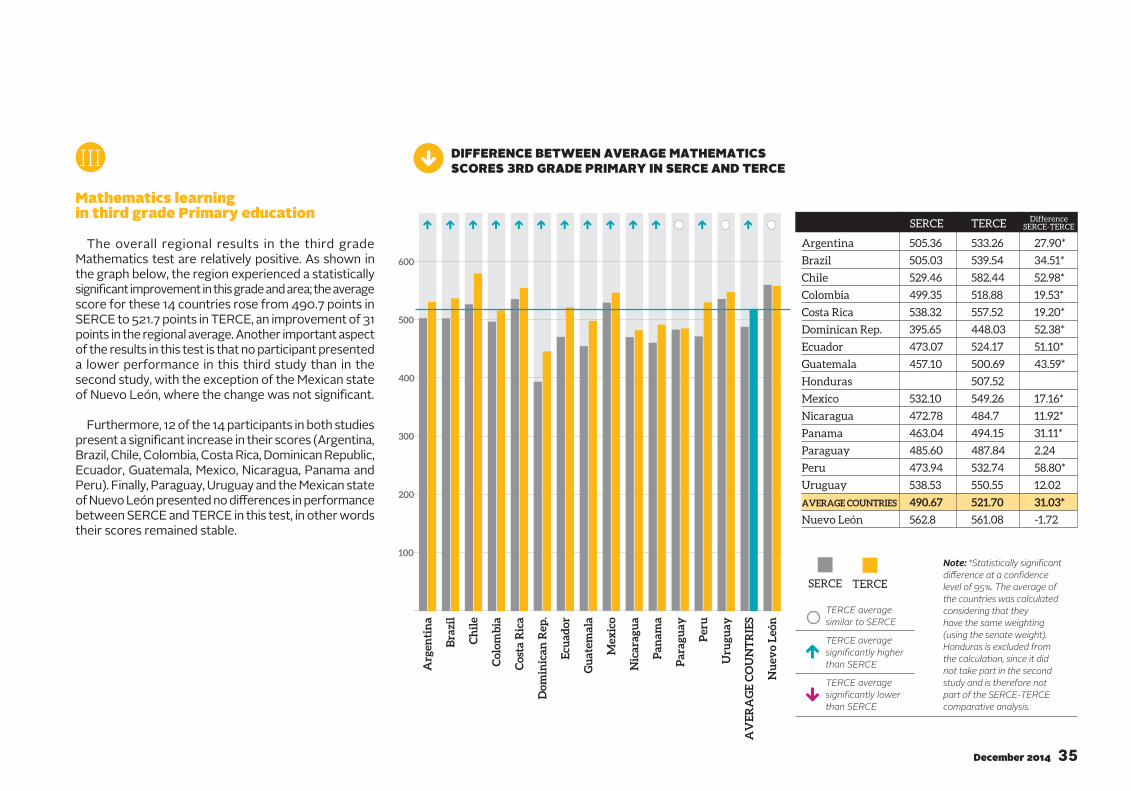
The overall regional results in the third grade Mathematics test are relatively positive. As shown in the graph below, the region experienced a statistically significant improvement in this grade and area; the average score for these 14 countries rose from 490.7 points in SERCE to 521.7 points in TERCE, an improvement of 31 points in the regional average. Another important aspect of the results in this test is that no participant presented a lower performance in this third study than in the second study, with the exception of the Mexican state of Nuevo León, where the change was not significant.
Furthermore, 12 of the 14 participants in both studies present a significant increase in their scores (Argentina, Brazil, Chile, Colombia, Costa Rica, Dominican Republic, Ecuador, Guatemala, Mexico, Nicaragua, Panama and Peru). Finally, Paraguay, Uruguay and the Mexican state of Nuevo León presented no differences in performance between SERCE and TERCE in this test, in other words their scores remained stable.
III DIFFERENCE BETWEEN AVERAGE MATHEMATICS SCORES 3RD GRADE PRIMARY IN SERCE AND TERCE
Argentina 505.36 533.26 27.90*
Brazil 505.03 539.54 34.51*
Chile 529.46 582.44 52.98*
Colombia 499.35 518.88 19.53*
Costa Rica 538.32 557.52 19.20*
Dominican Rep. 395.65 448.03 52.38*
Ecuador 473.07 524.17 51.10*
Guatemala 457.10 500.69 43.59*
Honduras 507.52
Mexico 532.10 549.26 17.16*
Nicaragua 472.78 484.7 11.92*
Panama 463.04 494.15 31.11*
Paraguay 485.60 487.84 2.24
Peru 473.94 532.74 58.80*
Uruguay 538.53 550.55 12.02
AVERAGE COUNTRIES 490.67 521.70 31.03*
Nuevo León 562.8 561.08 -1.72
SERCE TERCE DifferenceSERCE-TERCE
Arg
enti
na
Bra
zil
Ch
ile
Col
omb
ia
Cos
ta R
ica
Uru
guay
AV
ER
AG
E C
OU
NT
RIE
S
Nu
evo
Leó
n
Note: *Statistically significant difference at a confidence level of 95%. The average of the countries was calculated considering that they have the same weighting (using the senate weight). Honduras is excluded from the calculation, since it did not take part in the second study and is therefore not part of the SERCE-TERCE comparative analysis.
TERCE average significantly higher than SERCE
TERCE average similar to SERCE
TERCE average significantly lower than SERCE
SERCE TERCE
36 First release of results
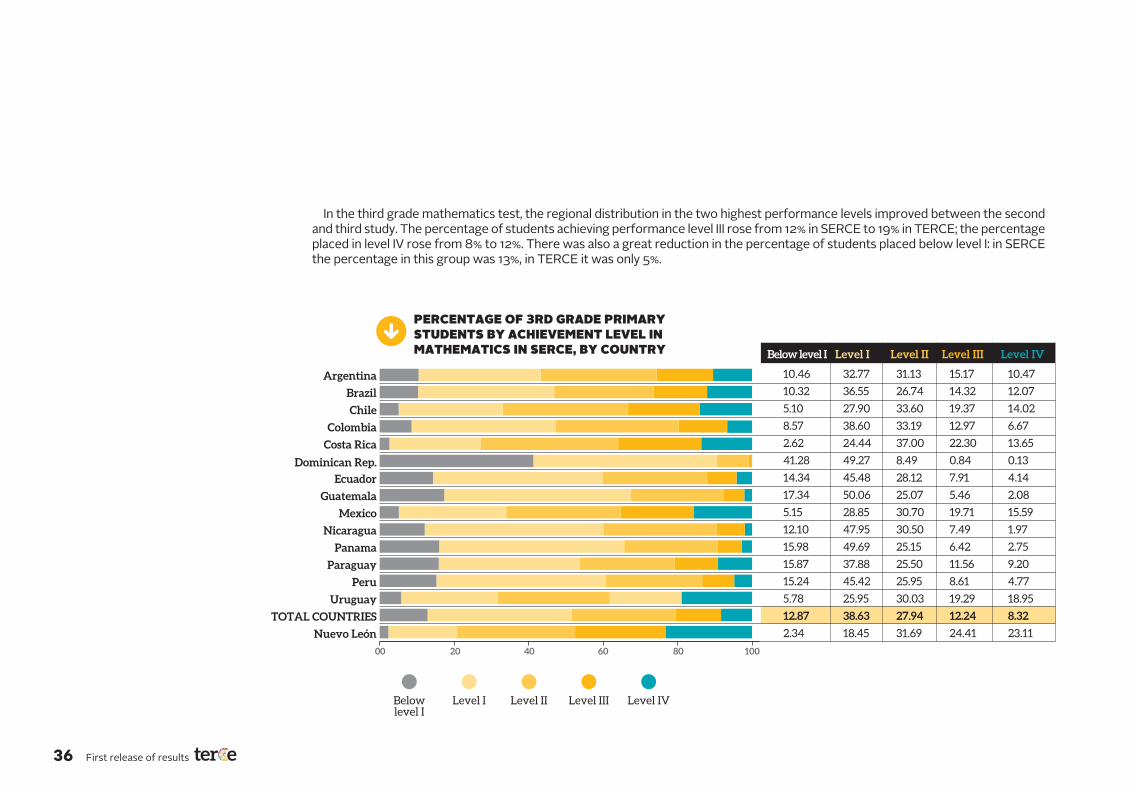
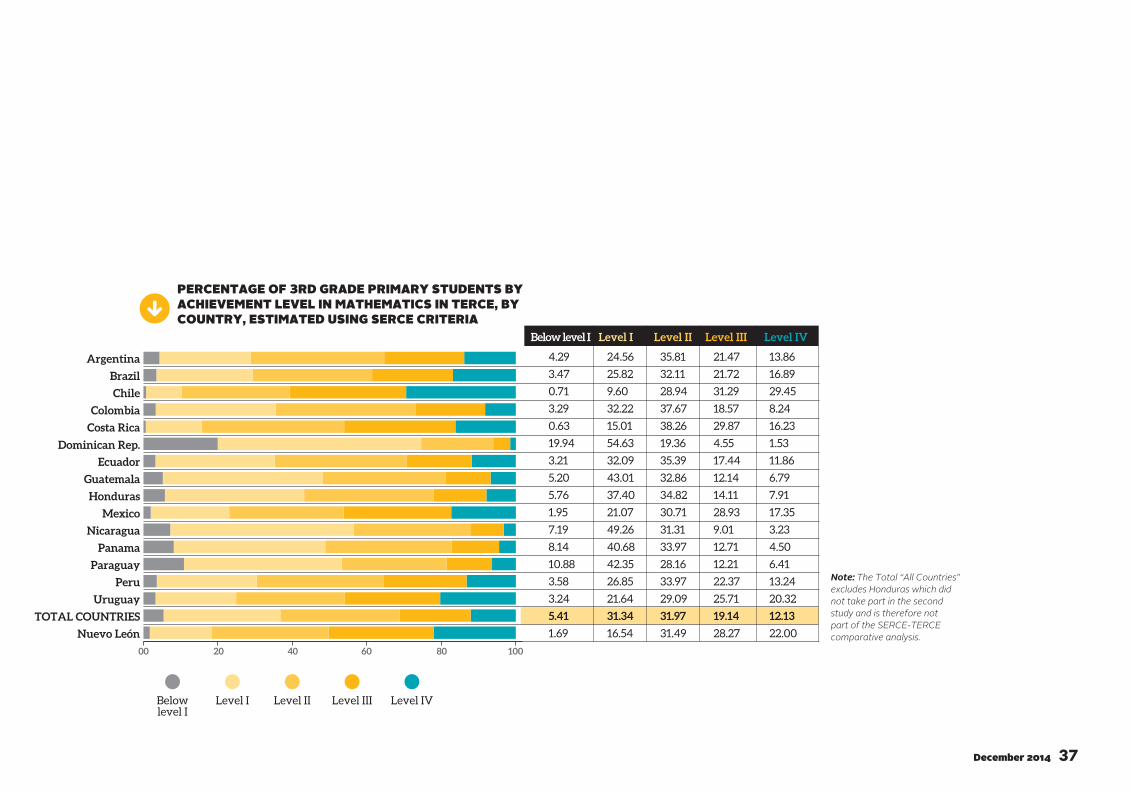
In the third grade mathematics test, the regional distribution in the two highest performance levels improved between the second and third study. The percentage of students achieving performance level III rose from 12% in SERCE to 19% in TERCE; the percentage placed in level IV rose from 8% to 12%. There was also a great reduction in the percentage of students placed below level I: in SERCE the percentage in this group was 13%, in TERCE it was only 5%.
20 40 60 80 10000
PERCENTAGE OF 3RD GRADE PRIMARY STUDENTS BY ACHIEVEMENT LEVEL IN MATHEMATICS IN SERCE, BY COUNTRY
10.46 32.77 31.13 15.17 10.47
10.32 36.55 26.74 14.32 12.07
5.10 27.90 33.60 19.37 14.02
8.57 38.60 33.19 12.97 6.67
2.62 24.44 37.00 22.30 13.65
41.28 49.27 8.49 0.84 0.13
14.34 45.48 28.12 7.91 4.14
17.34 50.06 25.07 5.46 2.08
5.15 28.85 30.70 19.71 15.59
12.10 47.95 30.50 7.49 1.97
15.98 49.69 25.15 6.42 2.75
15.87 37.88 25.50 11.56 9.20
15.24 45.42 25.95 8.61 4.77
5.78 25.95 30.03 19.29 18.95
12.87 38.63 27.94 12.24 8.32
2.34 18.45 31.69 24.41 23.11
Below level I Level I Level II Level III Level IV
Argentina
Brazil
Chile
Colombia
Costa Rica
Ecuador
Guatemala
Mexico
Nicaragua
Panama
Paraguay
Peru
Dominican Rep.
Uruguay
TOTAL COUNTRIES
Nuevo León
Below level I
Level I Level II Level III Level IV
37December 2014
20 40 60 80 10000
PERCENTAGE OF 3RD GRADE PRIMARY STUDENTS BY ACHIEVEMENT LEVEL IN MATHEMATICS IN TERCE, BY COUNTRY, ESTIMATED USING SERCE CRITERIA
4.29 24.56 35.81 21.47 13.86
3.47 25.82 32.11 21.72 16.89
0.71 9.60 28.94 31.29 29.45
3.29 32.22 37.67 18.57 8.24
0.63 15.01 38.26 29.87 16.23
19.94 54.63 19.36 4.55 1.53
3.21 32.09 35.39 17.44 11.86
5.20 43.01 32.86 12.14 6.79
5.76 37.40 34.82 14.11 7.91
1.95 21.07 30.71 28.93 17.35
7.19 49.26 31.31 9.01 3.23
8.14 40.68 33.97 12.71 4.50
10.88 42.35 28.16 12.21 6.41
3.58 26.85 33.97 22.37 13.24
3.24 21.64 29.09 25.71 20.32
5.41 31.34 31.97 19.14 12.13
1.69 16.54 31.49 28.27 22.00
Below level I Level I Level II Level III Level IV
Note: The Total “All Countries” excludes Honduras which did not take part in the second study and is therefore not part of the SERCE-TERCE comparative analysis.
Argentina
Brazil
Chile
Colombia
Costa Rica
Ecuador
Guatemala
Honduras
Mexico
Nicaragua
Panama
Paraguay
Peru
Dominican Rep.
Uruguay
TOTAL COUNTRIES
Nuevo León
Below level I
Level I Level II Level III Level IV
38 First release of results
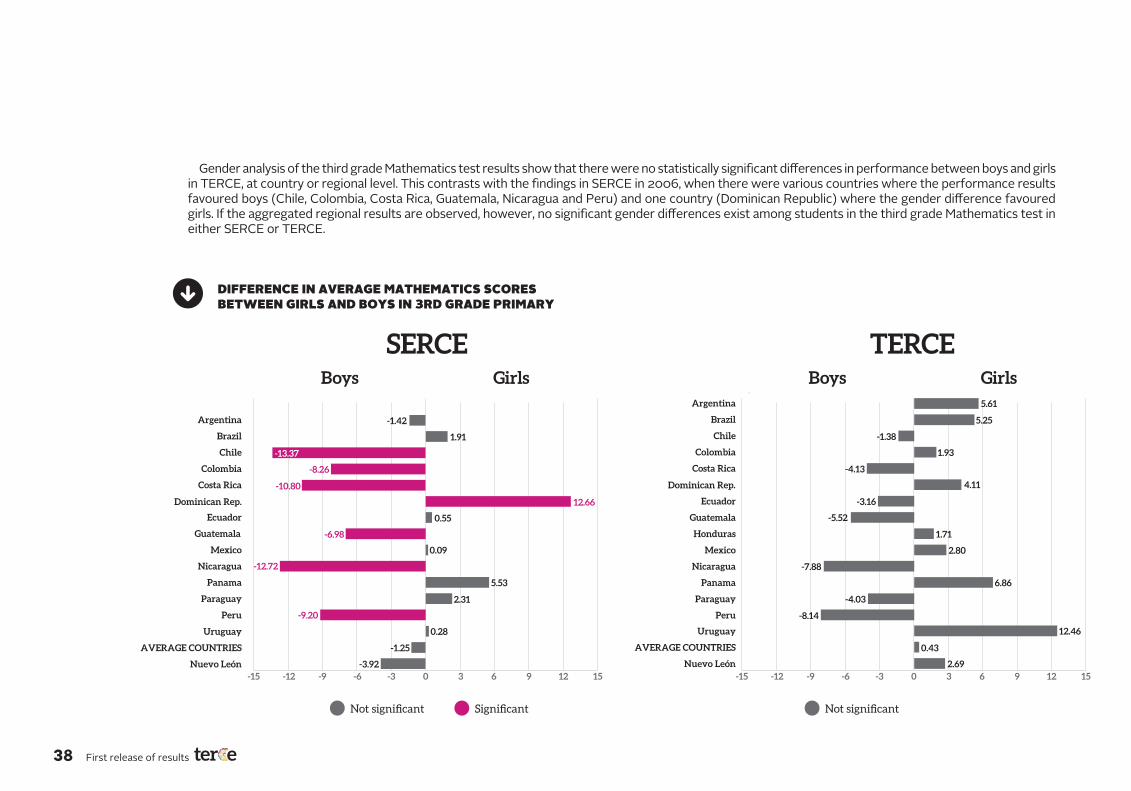
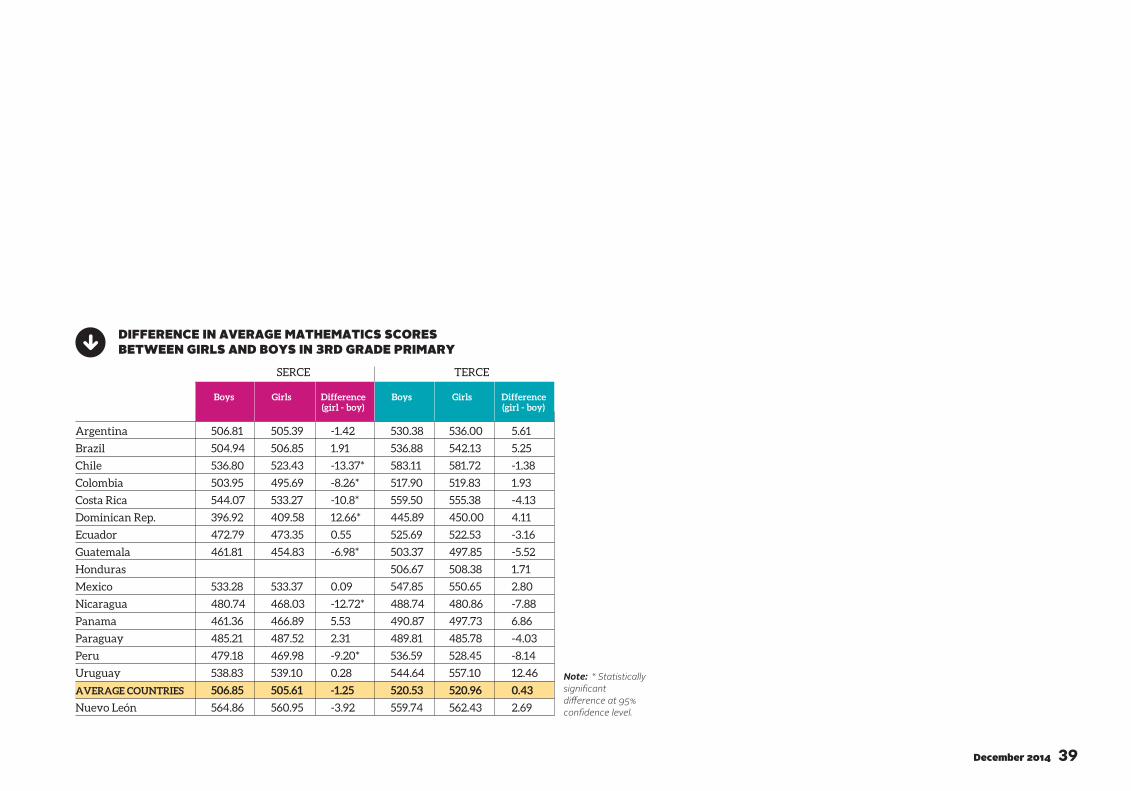
Gender analysis of the third grade Mathematics test results show that there were no statistically significant differences in performance between boys and girls in TERCE, at country or regional level. This contrasts with the findings in SERCE in 2006, when there were various countries where the performance results favoured boys (Chile, Colombia, Costa Rica, Guatemala, Nicaragua and Peru) and one country (Dominican Republic) where the gender difference favoured girls. If the aggregated regional results are observed, however, no significant gender differences exist among students in the third grade Mathematics test in either SERCE or TERCE.
Argentina
Brazil
Chile
Colombia
Costa Rica
Uruguay
AVERAGE COUNTRIES
Nuevo León
Argentina
Brazil
Chile
Colombia
Costa Rica
Uruguay
AVERAGE COUNTRIES
Nuevo León
DIFFERENCE IN AVERAGE MATHEMATICS SCORES BETWEEN GIRLS AND BOYS IN 3RD GRADE PRIMARY
SERCE TERCEBoys BoysGirls Girls
0 3-3 6-6 9-9 12-12 15-15 0 3-3 6-6 9-9 12-12 15-15
-1.42
-1.38
-4.13
12.46
0.43
2.69
1.93
5.25
5.61
1.91
0.28
-1.25
-3.92
-13.37
-8.26
-10.80
Ecuador
Guatemala
Mexico
Nicaragua
Panama
Paraguay
Peru
0.55
0.09
5.53
2.31
-6.98
-12.72
-9.20
Dominican Rep. 12.66 Ecuador
Guatemala
Honduras
Mexico
Nicaragua
Panama
Paraguay
Peru
-3.16
-5.52
-7.88
-4.03
-8.14
6.86
2.80
1.71
Dominican Rep. 4.11
Not significant Significant Not significant
39December 2014
Argentina 506.81 505.39 -1.42 530.38 536.00 5.61
Brazil 504.94 506.85 1.91 536.88 542.13 5.25
Chile 536.80 523.43 -13.37* 583.11 581.72 -1.38
Colombia 503.95 495.69 -8.26* 517.90 519.83 1.93
Costa Rica 544.07 533.27 -10.8* 559.50 555.38 -4.13
Dominican Rep. 396.92 409.58 12.66* 445.89 450.00 4.11
Ecuador 472.79 473.35 0.55 525.69 522.53 -3.16
Guatemala 461.81 454.83 -6.98* 503.37 497.85 -5.52
Honduras 506.67 508.38 1.71
Mexico 533.28 533.37 0.09 547.85 550.65 2.80
Nicaragua 480.74 468.03 -12.72* 488.74 480.86 -7.88
Panama 461.36 466.89 5.53 490.87 497.73 6.86
Paraguay 485.21 487.52 2.31 489.81 485.78 -4.03
Peru 479.18 469.98 -9.20* 536.59 528.45 -8.14
Uruguay 538.83 539.10 0.28 544.64 557.10 12.46
AVERAGE COUNTRIES 506.85 505.61 -1.25 520.53 520.96 0.43
Nuevo León 564.86 560.95 -3.92 559.74 562.43 2.69
SERCE TERCE
Note: * Statistically significant difference at 95% confidence level.
DIFFERENCE IN AVERAGE MATHEMATICS SCORES BETWEEN GIRLS AND BOYS IN 3RD GRADE PRIMARY
(girl - boy)(girl - boy)DifferenceDifference BoysBoys GirlsGirls

40 First release of results
41December 2014
00
100
200
300
400
500
600
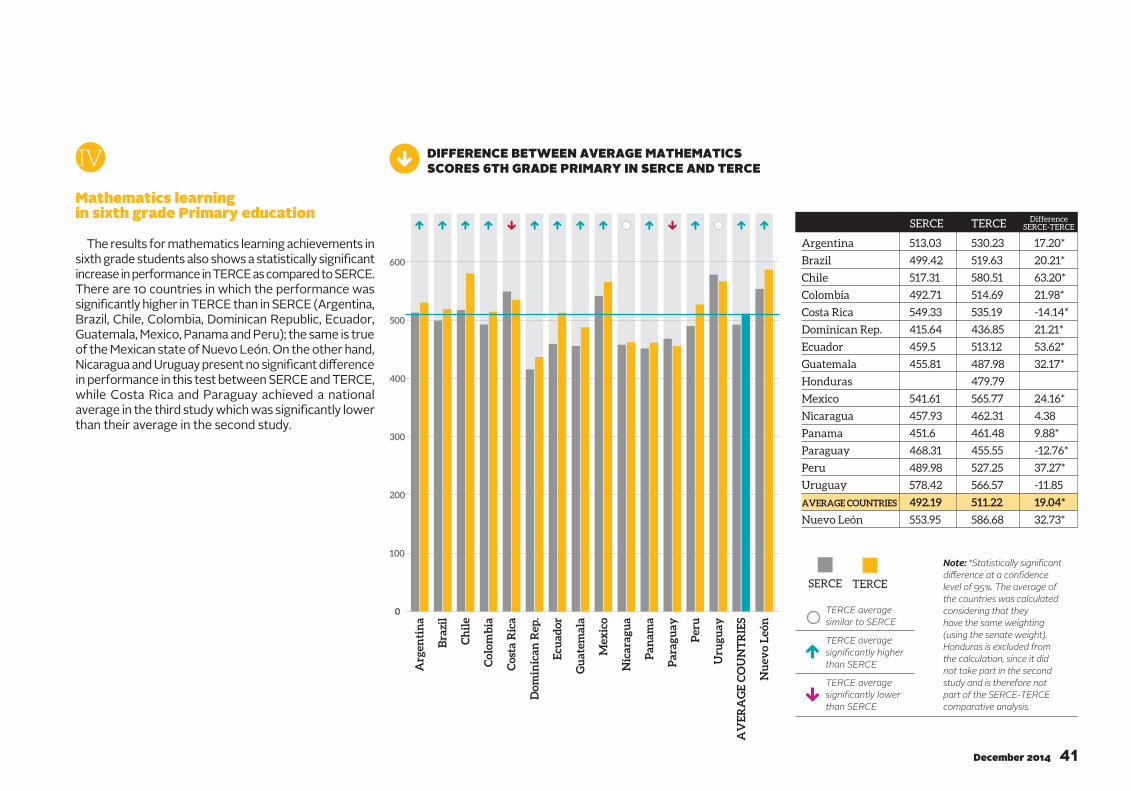
Mathematics learning in sixth grade Primary education
The results for mathematics learning achievements in sixth grade students also shows a statistically significant increase in performance in TERCE as compared to SERCE. There are 10 countries in which the performance was significantly higher in TERCE than in SERCE (Argentina, Brazil, Chile, Colombia, Dominican Republic, Ecuador, Guatemala, Mexico, Panama and Peru); the same is true of the Mexican state of Nuevo León. On the other hand, Nicaragua and Uruguay present no significant difference in performance in this test between SERCE and TERCE, while Costa Rica and Paraguay achieved a national average in the third study which was significantly lower than their average in the second study.
IV
DIFFERENCE BETWEEN AVERAGE MATHEMATICS SCORES 6TH GRADE PRIMARY IN SERCE AND TERCE
Arg
enti
na
Bra
zil
Ch
ile
Col
omb
ia
Cos
ta R
ica
Uru
guay
AV
ER
AG
E C
OU
NT
RIE
S
Nu
evo
Leó
n
Dom
inic
an R
ep.
Ecu
ador
Gu
atem
ala
Mex
ico
Nic
arag
ua
Pan
ama
Par
agu
ay
Per
u
Argentina 513.03 530.23 17.20*
Brazil 499.42 519.63 20.21*
Chile 517.31 580.51 63.20*
Colombia 492.71 514.69 21.98*
Costa Rica 549.33 535.19 -14.14*
Dominican Rep. 415.64 436.85 21.21*
Ecuador 459.5 513.12 53.62*
Guatemala 455.81 487.98 32.17*
Honduras 479.79
Mexico 541.61 565.77 24.16*
Nicaragua 457.93 462.31 4.38
Panama 451.6 461.48 9.88*
Paraguay 468.31 455.55 -12.76*
Peru 489.98 527.25 37.27*
Uruguay 578.42 566.57 -11.85
AVERAGE COUNTRIES 492.19 511.22 19.04*
Nuevo León 553.95 586.68 32.73*
SERCE TERCE DifferenceSERCE-TERCE
Note: *Statistically significant difference at a confidence level of 95%. The average of the countries was calculated considering that they have the same weighting (using the senate weight). Honduras is excluded from the calculation, since it did not take part in the second study and is therefore not part of the SERCE-TERCE comparative analysis.
TERCE average significantly higher than SERCE
TERCE average similar to SERCE
TERCE average significantly lower than SERCE
SERCE TERCE
42 First release of results
20 40 60 80 10000
PERCENTAGE OF 6TH GRADE PRIMARY STUDENTS BY ACHIEVEMENT LEVEL IN MATHEMATICS IN SERCE, BY COUNTRY
1.53 11.89 37.99 36.26 12.34
1.46 14.00 44.09 31.65 8.80
1.40 9.84 37.85 37.39 13.52
1.02 13.29 47.64 32.60 5.46
0.09 4.55 32.71 43.70 18.95
5.69 41.79 45.43 6.85 0.24
4.24 24.86 45.15 21.41 4.34
2.78 24.94 50.80 19.52 1.96
0.51 8.38 32.41 39.10 19.60
2.25 23.88 52.69 19.41 1.76
3.32 27.16 49.55 17.64 2.33
3.85 21.00 46.50 23.91 4.74
2.41 19.58 39.82 28.90 9.29
0.67 4.26 22.36 40.41 32.31
2.23 17.82 41.78 28.48 9.69
0.34 6.29 29.35 40.66 23.36
Below level I Level I Level II Level III Level IV
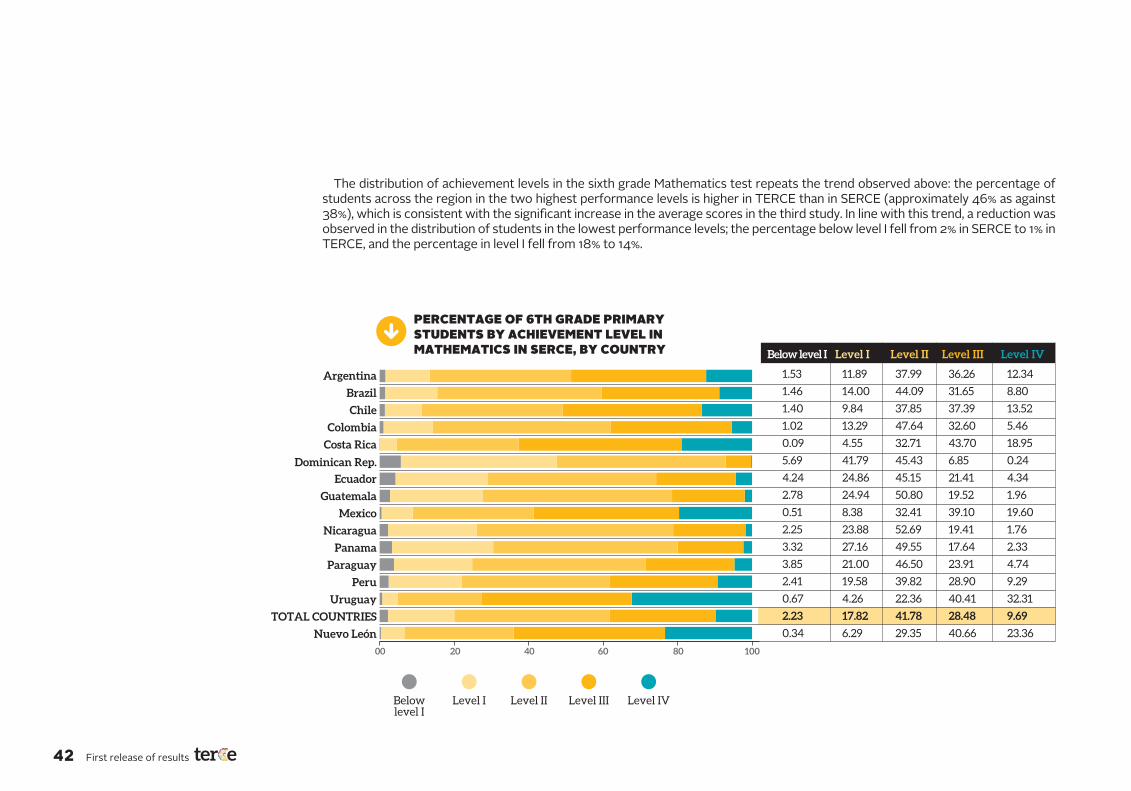
The distribution of achievement levels in the sixth grade Mathematics test repeats the trend observed above: the percentage of students across the region in the two highest performance levels is higher in TERCE than in SERCE (approximately 46% as against 38%), which is consistent with the significant increase in the average scores in the third study. In line with this trend, a reduction was observed in the distribution of students in the lowest performance levels; the percentage below level I fell from 2% in SERCE to 1% in TERCE, and the percentage in level I fell from 18% to 14%.
Argentina
Brazil
Chile
Colombia
Costa Rica
Ecuador
Guatemala
Mexico
Nicaragua
Panama
Paraguay
Peru
Dominican Rep.
Uruguay
TOTAL COUNTRIES
Nuevo León
Below level I
Level I Level II Level III Level IV

43December 2014
20 40 60 80 10000
PERCENTAGE OF 6TH GRADE PRIMARY STUDENTS BY ACHIEVEMENT LEVEL IN MATHEMATICS IN TERCE, BY COUNTRY, ESTIMATED USING SERCE CRITERIA
0.68 7.23 36.48 41.60 14.00
0.30 9.32 38.68 41.63 10.07
0.13 1.83 22.62 45.72 29.69
0.15 8.77 43.41 37.91 9.76
0.13 5.15 34.63 47.60 12.49
4.36 33.69 49.61 11.62 0.73
0.85 10.76 40.02 38.36 10.01
1.06 16.05 48.43 29.58 4.89
1.77 16.40 50.09 27.92 3.82
0.25 3.56 26.73 43.26 26.21
1.61 22.40 55.64 18.56 1.80
2.50 24.66 50.18 19.93 2.73
4.88 27.41 44.41 19.65 3.65
1.56 11.90 33.95 35.95 16.64
0.10 5.97 25.70 40.73 27.50
1.33 13.48 39.32 33.72 12.15
0.15 2.30 19.87 44.08 33.61
Below level I Level I Level II Level III Level IV
Note: The Total “All Countries” excludes Honduras which did not take part in the second study and is therefore not part of the SERCE-TERCE comparative analysis.
Argentina
Brazil
Chile
Colombia
Costa Rica
Ecuador
Guatemala
Honduras
Mexico
Nicaragua
Panama
Paraguay
Peru
Dominican Rep.
Uruguay
TOTAL COUNTRIES
Nuevo León
Below level I
Level I Level II Level III Level IV

44 First release of results
In terms of gender differences, in both SERCE and TERCE boys achieved a significantly higher performance than girls in the sixth grade Mathematics test across the region. It may be added that no statistically significant differences in favour of girls are observed in either study. Furthermore, with the exception of the Mexican state of Nuevo León, all the countries which present statistically significant differences in favour of boys in TERCE (Colombia, Costa Rica, Guatemala, Nicaragua and Peru) presented the same trend in SERCE. Brazil and Chile on the other hand, which presented performance differences in favour of boys in SERCE, present no such differences in TERCE.
DIFFERENCE IN AVERAGE MATHEMATICS SCORES BETWEEN GIRLS AND BOYS IN 6TH GRADE PRIMARY
Argentina
Brazil
Chile
Colombia
Costa Rica
Uruguay
AVERAGE COUNTRIES
Nuevo León
SERCEBoys Girls
0 5-5 10-10 15-15 20-20 25-25
-5.79
-10.02
-6.84
-14.53
-20.67
-6.17
Ecuador
Guatemala
Mexico
Nicaragua
Panama
Paraguay
Peru
-6.91
-10.16
-18.94
0.29
6.35
2.81
-0.59
Dominican Rep. 0.96
0.18
0.27
TERCE
Argentina
Brazil
Chile
Colombia
Costa Rica
Uruguay
AVERAGE COUNTRIES
Nuevo León0 5-5 10-10 15-15 20-20 25-25
-7.79
-17.02
-10.43
-9.71
-11.83
-10.20
-5.72
Ecuador
Guatemala
Honduras
Mexico
Nicaragua
Panama
Paraguay
Peru
-20.15
-7.85
-24.90
-10.51
-10.04
-7.48
-2.97
2.32
Dominican Rep. -4.74
-8.20
Boys Girls
Not significant Significant Not significant Significant

45December 2014
Argentina 517.90 512.11 -5.79 534.09 526.30 -7.79
Brazil 504.79 494.77 -10.02* 524.81 514.61 -10.20
Chile 522.28 515.44 -6.84* 583.38 577.66 -5.72
Colombia 500.49 485.96 -14.53* 522.60 505.58 -17.02*
Costa Rica 559.88 539.21 -20.67* 540.28 529.85 -10.43*
Dominican Rep. 416.59 417.55 0.96 439.14 434.40 -4.74
Ecuador 460.65 460.94 0.29 517.98 507.47 -10.51
Guatemala 459.95 453.04 -6.91* 497.94 477.79 -20.15*
Honduras 484.82 474.78 -10.04
Mexico 538.61 544.96 6.35 569.48 562.00 -7.48
Nicaragua 463.54 453.38 -10.16* 466.29 458.44 -7.85*
Panama 450.82 453.63 2.81 460.31 462.63 2.32
Paraguay 470.16 469.57 -0.59 456.97 454.00 -2.97
Peru 500.70 481.76 -18.94* 539.52 514.62 -24.9*
Uruguay 580.94 581.12 0.18 570.81 562.61 -8.20
AVERAGE COUNTRIES 510.58 504.41 -6.17* 513.90 504.18 -9.71*
Nuevo León 554.04 554.30 0.27 592.67 580.84 -11.83*
SERCE TERCE
Note: * Statistically significant difference at 95% confidence level.
DIFFERENCE IN AVERAGE MATHEMATICS SCORES BETWEEN GIRLS AND BOYS IN 6TH GRADE PRIMARY
(girl - boy)(girl - boy)DifferenceDifference BoysBoys GirlsGirls

46 First release of results

47December 2014
Natural Sciences learning in sixth grade Primary education
As has already been mentioned in this report, the Natural Sciences test was only applied in sixth grade Primary, and was voluntary in SERCE. As a result, information on both studies for purposes of comparison is only available for 7 countries and the Mexican state of Nuevo León.
The trend of the results in this test is similar to that observed in the other areas assessed. Region-wide, there is a statistically significant increase in performance, and the majority of countries present some degree of improvement. Four of the seven countries which took part in both studies present a significantly higher performance in TERCE than in SERCE (Argentina, Colombia, Dominican Republic and Peru), as does the Mexican state of Nuevo León. Panama presents no difference in performance between SERCE and TERCE, while Paraguay and Uruguay present a significantly lower performance in the third study than in the second.
V
DIFFERENCE BETWEEN AVERAGE NATURAL SCIENCES SCORES 6TH GRADE PRIMARY IN SERCE AND TERCE
Arg
enti
na
Col
omb
ia
Uru
guay
PR
OM
ED
IO P
AÍS
ES
Nu
evo
Leó
n
Dom
inic
an R
ep. 0
100
200
300
400
500
600
Pan
ama
Per
u
Par
agu
ay
Argentina 488.72 501.31 12.59*
Colombia 504.32 526.5 22.18*
Dominican Rep. 426.31 443.74 17.43*
Panama 472.52 475.11 2.59
Paraguay 469.26 454.76 -14.5*
Peru 464.9 500.68 35.78*
Uruguay 533.13 516.86 -16.27*
AVERAGE COUNTRIES 479.88 488.42 8.54*
Nuevo León 510.68 538.88 28.20*
SERCE TERCE DifferenceSERCE-TERCE
Note: * Statistically significant difference at 95% confidence level.
TERCE average significantly higher than SERCE
TERCE average similar to SERCE
TERCE average significantly lower than SERCE
SERCE TERCE
48 First release of results
20 40 60 80 10000
PERCENTAGE OF 6TH GRADE PRIMARY STUDENTS BY ACHIEVEMENT LEVEL IN NATURAL SCIENCES IN SERCE, BY COUNTRY
5.32 37.73 43.04 12.73 1.17
2.62 31.68 51.09 13.59 1.02
14.29 62.82 21.5 1.37 0.03
6.34 44.6 39.89 8.40 0.77
7.20 46.18 38.11 7.52 0.99
6.97 46.93 39.36 6.37 0.36
1.69 22.76 48.47 24.01 3.06
6.35 41.82 40.21 10.57 1.06
2.59 30.98 47.78 16.38 2.28
Below level I Level I Level II Level III Level IV
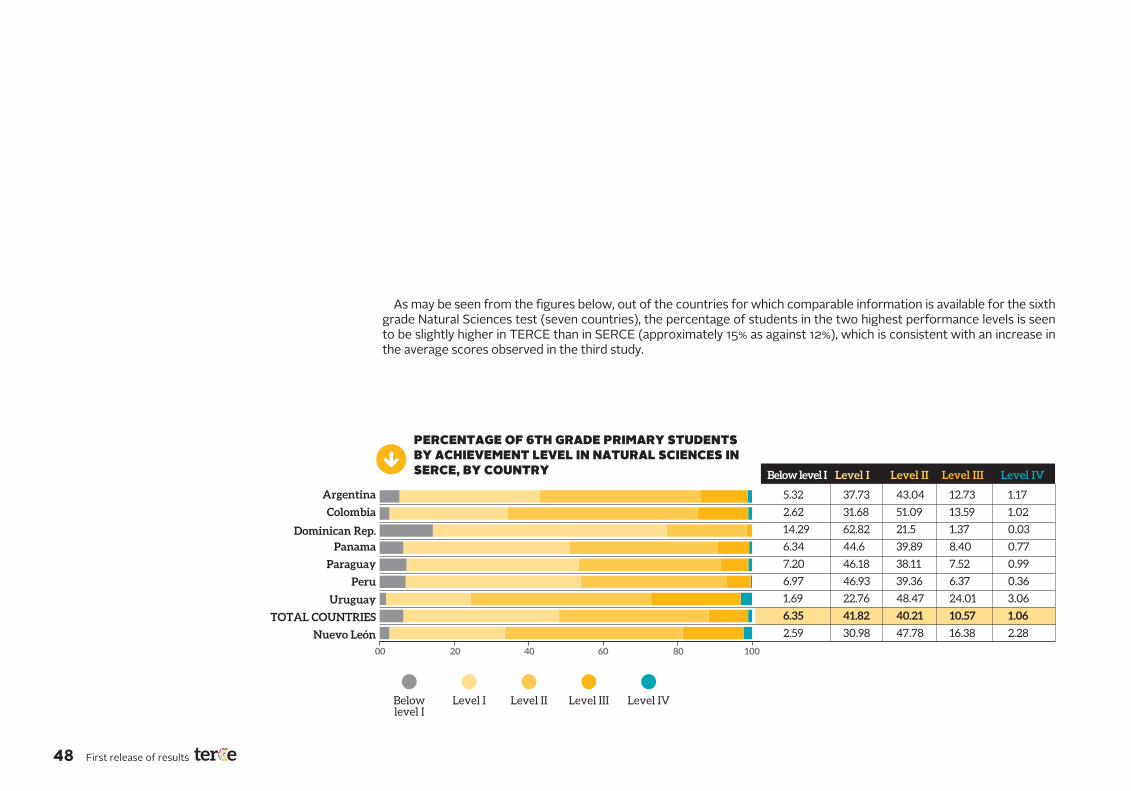
As may be seen from the figures below, out of the countries for which comparable information is available for the sixth grade Natural Sciences test (seven countries), the percentage of students in the two highest performance levels is seen to be slightly higher in TERCE than in SERCE (approximately 15% as against 12%), which is consistent with an increase in the average scores observed in the third study.
Argentina
Colombia
Panama
Paraguay
Peru
Dominican Rep.
Uruguay
TOTAL COUNTRIES
Nuevo León
Below level I
Level I Level II Level III Level IV

49December 2014
20 40 60 80 10000
PERCENTAGE OF 6TH GRADE PRIMARY STUDENTS BY ACHIEVEMENT LEVEL IN NATURAL SCIENCES IN TERCE, BY COUNTRY, ESTIMATED USING SERCE CRITERIA
4.97 35.59 41.35 16.29 1.80
5.20 34.45 44.69 14.20 1.46
2.62 21.98 39.26 29.42 6.72
2.90 26.25 46.34 22.12 2.39
1.73 19.71 48.11 26.17 4.28
12.02 53.54 30.88 3.32 0.23
4.22 32.61 42.83 17.71 2.64
5.89 39.44 43.13 10.41 1.14
8.62 43.14 38.05 9.40 0.79
2.48 25.50 45.56 23.92 2.54
7.85 43.52 40.48 7.53 0.63
8.25 43.43 36.77 10.57 0.98
12.30 47.50 32.12 7.25 0.83
5.09 33.69 44.04 15.77 1.41
3.92 32.44 40.23 20.70 2.71
7.07 38.92 38.82 13.72 1.48
1.86 21.96 48.15 24.36 3.66
Below level I Level I Level II Level III Level IV
Argentina
Brazil
Chile
Colombia
Costa Rica
Ecuador
Guatemala
Honduras
Mexico
Nicaragua
Panama
Paraguay
Peru
Dominican Rep.
Uruguay
TOTAL COUNTRIES
Nuevo León
Note: the country total does not include countries that did not participate in this test in SERCE, as they were not included in the SERCE-TERCE comparative analysis for Natural Sciences.
Below level I
Level I Level II Level III Level IV

50 First release of results
DIFFERENCE IN AVERAGE NATURAL SCIENCES SCORES BETWEEN GIRLS AND BOYS IN 6TH GRADE PRIMARY
SERCEBoys Girls
0 5-5 10-10 15-15 20-20
Argentina
Colombia
Uruguay
AVERAGE COUNTRIES
Nuevo León
-5.06
-4.44
Dominican Rep. -0.65
-18.93
Panama
Paraguay
Peru
1.26
1.88
-16.12
-11.52
-12.77
TERCEBoys Girls
0 5-5 10-10 15-15 20-20
Argentina
Colombia
Uruguay
AVERAGE COUNTRIES
Nuevo León
Panama
Paraguay
Peru
Dominican Rep.
7.98
-4.27
2.62
2.95
3.57
10.35
12.87
-3.24
7.96
Finally, gender analysis of the Science test results show that of the participants (including the Mexican state of Nuevo León) that applied the test in SERCE, three (Colombia, Peru and the Mexican state of Nuevo León) show performance differences in favour of boys. In TERCE, the pattern of results differs from that observed in 2006, since there are no countries with statistically significant differences in favour of boys, while in Panama significantly higher performance by girls is observed.
Not significant Significant Not significant Significant

51December 2014
Argentina 493.42 488.37 -5.06 497.25 505.23 7.98
Brazil 497.32 501.41 4.09
Chile 544.42 557.71 13.29*
Colombia 514.24 495.30 -18.93* 528.54 524.27 -4.27
Costa Rica 550.08 542.58 -7.50
Dominican Rep. 427.10 426.44 -0.65 439.77 447.73 7.96
Ecuador 512.17 508.43 -3.74
Guatemala 490.67 483.59 -7.08
Honduras 469.91 474.45 4.54
Mexico 528.50 530.46 1.96
Nicaragua 472.87 472.11 -0.76
Panama 472.75 474.01 1.26 468.56 481.43 12.87*
Paraguay 468.80 470.68 1.88 449.58 459.93 10.35
Peru 473.75 457.63 -16.12* 502.29 499.05 -3.24
Uruguay 536.96 532.52 -4.44 515.35 518.30 2.95
AVERAGE COUNTRIES 498.83 487.31 -11.52* 497.82 500.44 2.62*
Nuevo León 517.25 504.47 -12.77* 537.01 540.58 3.57
SERCE TERCE
DIFFERENCE IN AVERAGE NATURAL SCIENCES SCORES BETWEEN GIRLS AND BOYS IN 6TH GRADE PRIMARY
(girl - boy)(girl - boy)DifferenceDifference BoysBoys GirlsGirls
Note: * Statistically significant difference at 95% confidence level.

52 First release of results
Chapter threeConclusions

53December 2014
1. To allow the Region to develop in every sense, guaranteeing the right to quality education must be a top priority in all Latin American and Caribbean countries. The region has made great progress over the last two decades, reflected in a series of economic, social and educational indicators. Nevertheless, serious socio-economic gaps persist, which in turn are reflected in the fulfillment of the right to education.
2. The right to education is the right to life-long learning. At Primary School level in particular, universal access to free, compulsory and high-quality teaching is vital for the full exercise of this right. Quality education promotes the maximum development of the many potentials of every person, through socially relevant learning and educational experiences that are pertinent to the needs and characteristics of the individuals, and the contexts in which they live and work.
3. Assessing student learning is just one part of educational quality. The national average of learning achievements represents only one dimension of educational quality, effectiveness; in other words,
the educational system is fulfilling the goals set for it. Large-scale educational assessment also supports monitoring of the equality of the system.
4. Regional and international assessments can play an important role in improving educational quality. Improved worldwide and regional monitoring of learning can encourage governments to try to ensure that not only do all children attend school, but that they also acquire basic notions.
5. The Latin America and the Caribbean region, with the support of UNESCO, has made progress on this issue through the Latin American Laboratory for Assessment of the Quality of Education (LLECE); the laboratory has so far applied three regional assessments, the latest being TERCE in 2013.
6. The Latin American Laboratory for the Assessment of Quality in Education (LLECE) is an advantage for the region and it should be fully exploited. It is a laboratory focused on assessing Educational Quality, which carries out research, imparts training, which has generated a critical mass and has
helped to generate a culture of assessment focused on training and improvements in educational quality.
7. For LLECE to work, it is important to have regular studies over time that are constantly updated, to generate comparable data at different moments. The three assessments done to date (PERCE; SERCE; TERCE) provide valuable information with which to observe trends in learning improvements in the region. Although we cannot compare the information from PERCE, which assessed different grades, we can compare SERCE with TERCE.
8. TERCE is a collective effort to apply a measurement instrument adapted to the social, cultural and economic context of Latin America. Its tests, questionnaires and implementation process were designed in coordination with the participating countries, allowing the sharing of knowledge on educational assessment, enriched by the existence of diverse educational systems in the region. In its TERCE study, LLECE possesses a highly participative and democratic governability model in which the countries have had a large say in every step of the process.

54 First release of results
9. TERCE is the most representative assessment of student performance in Latin America, constituting a unique database. It covers 15 countries in the region, plus the Mexican state of Nuevo León, involving more than 3,000 schools and almost 200,000 students in third and sixth grades of Primary Education.
10. TERCE does NOT assess National Curricula. TERCE applies tests to assess learning of common elements of regional school curricula, selected through curriculum analysis, in the subjects of Mathematics, Language and Natural Sciences. This analysis included review, systematisation and analysis of the content prescribed by the various curricula in the different areas assessed in the region, in order to establish conceptual domains common to Primary School students in all the participating countries. Consequently, the measurement instruments are suited to the region’s social, cultural and economic context.
11. TERCE’s goal is NOT to rank countries; it does not seek to detect winners or losers in the region.
TERCE’s contribution consists in showing the progress made by countries and the factors that explain their success or laggardness. The central issue is not “who is winning the race”, but to understand the reasons for success and so generate mutual learning between education systems. Thus, rather than comparing countries, the analysis is designed for use within countries, since although there are common elements, the region presents very diverse situations.
12. TERCE is an innovative study, using high quality technical and methodological resources. It was coordinated by a technical team from UNESCO Santiago, with the support of the implementation partners MIDE UC, responsible for the elaboration and analysis of the tests, and CPCE/UDP, responsible for the questionnaires on factors associated with learning achievement. Other important technical partners include CITO, ICFES, IEA and INEP. A key role was played by the High-level Technical Consultative Council for TERCE, consisting of four world-renowned experts in Educational Assessment.
13. One of the aims of TERCE was to ensure comparability with SERCE, in order to be able to analyse progress in the region since 2006. The scoring of all the areas except Writing was comparable with SERCE, making it possible to assess whether the participating countries had made progress in improving educational quality, especially learning achievement, between 2006 (the year SERCE was applied) and 2013 (when TERCE was applied).
14. In general the results of TERCE bring positive news, but it is also clear that much work remains to be done to improve educational quality in Latin America and the Caribbean, for which learning achievement is a key element.
15. The average score at regional level has improved significantly since SERCE in all the grades and areas assessed (Reading, Mathematics and Natural Sciences). This means that performance in Primary Schools progressed between 2006 and 2013. The difference in average scores between SERCE and TERCE is greatest in third grade Mathematics.

55December 2014
16. The results of the majority of the countries that participated in TERCE improved significantly between the second and third studies. Only four of the 15 participating countries recorded a significant fall in average scores – in some tests and areas assessed – between 2006 and 2013.
17. In general there was a reduction in the proportion of students in the lowest performance levels (below I and level I), and a slight increase in the proportion of students in the highest levels (III and IV), especially level III.
18. Nevertheless, more than 50% of primary school students in the region still tend to be concentrated in levels I and II, in both SERCE and TERCE. In particular, Mathematics in third grade shows the largest increase in the percentage of students in level IV, from 8% to 12%.
19. In terms of gender differences, there is no general pattern of behaviour across all tests and grades. In the Reading tests, countries where girls obtain a significantly
higher score than boys predominate in both third and sixth grades. In Mathematics on the other hand, boys and girls present a similar performance in third grade, with no statistically significant differences between their results. This stands in contrast to Mathematics in sixth grade, where there were significant differences in favour of boys in both SERCE and TERCE. This difference was accentuated in TERCE at the regional level, and in the majority of countries.
20. In Natural Sciences, considering only the seven participating countries for which comparable information between SERCE and TERCE was available, some differences may be observed in the sixth grade test. In some countries the performance by gender was reversed: where there were significant differences in favour of boys in SERCE, differences in favour of girls were observed in TERCE.
21. This first delivery of TERCE results, comparable with SERCE, shows that although there has been important progress in the region since 2006,
further efforts are required for countries to meet their commitments to ensure a quality education for their children.
22. UNESCO hopes that the information provided by TERCE will enable societies to learn more about their students’ learning achievements, and to direct their efforts towards policies, which will have an impact on the quality of their education systems in all the dimensions identified by UNESCO, particularly equity. UNESCO will continue to work with national authorities in pursuit of this goal in the coming years.
56 First release of results
FIRST RELEASE OF RESULTS