Embed Size (px)
Citation preview

April 27, 2017
First Quarter 2017First Quarter 2017 Earnings Release
1
Lance FritzChairman, President & CEO
First Quarter 2017 Results
Earnings Per ShareFirst Quarter
Operating RatioFirst Quarter
$1.16 $1.32
+14% 65.1 65.1 Flat
First QuarterRecord
2
2016 2017 2016 2017
First Quarter 2017
April 27, 2017
First Quarter 2017 Marketing & Sales Review
3
Beth WhitedExecutive VP & Chief Marketing Officer
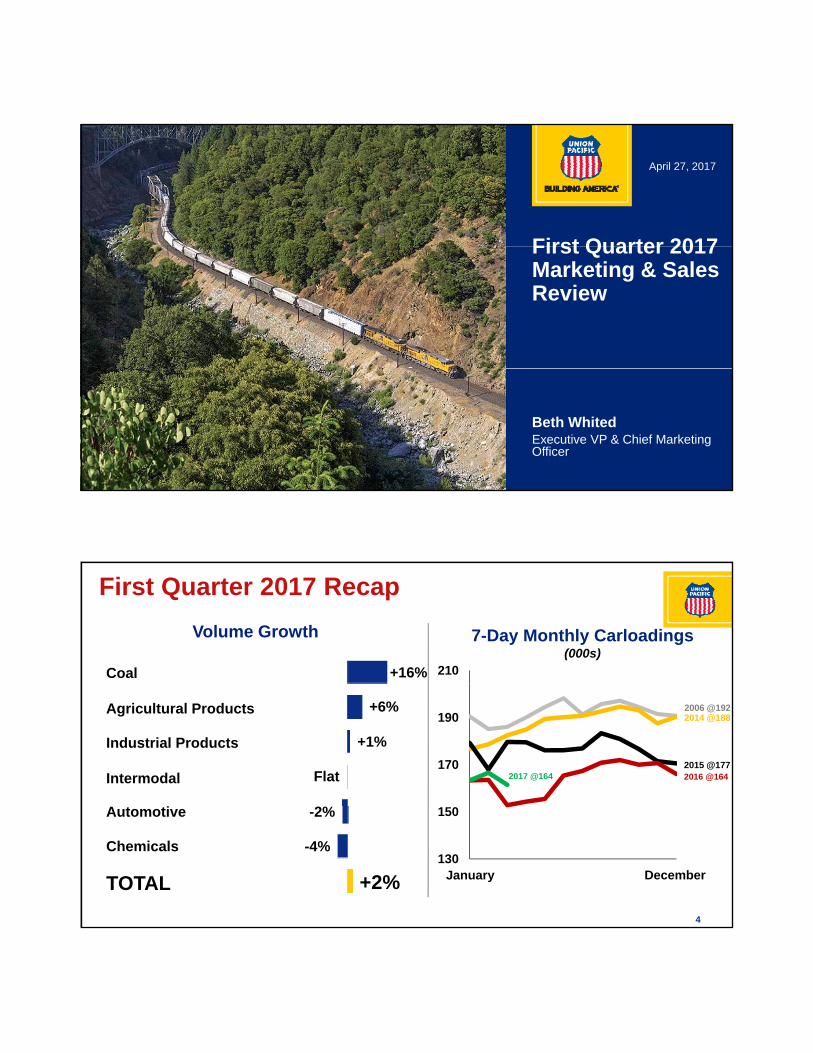
210
7-Day Monthly Carloadings(000s)
Volume Growth
+16%Coal
First Quarter 2017 Recap
170
1902006 @1922014 @188
2015 @177
Intermodal
Agricultural Products
Industrial Products
Flat
+1%
+6%
2016 @1642017 @164
4
130
150
January December
Automotive
TOTAL
-4%
+2%
Chemicals
-2%
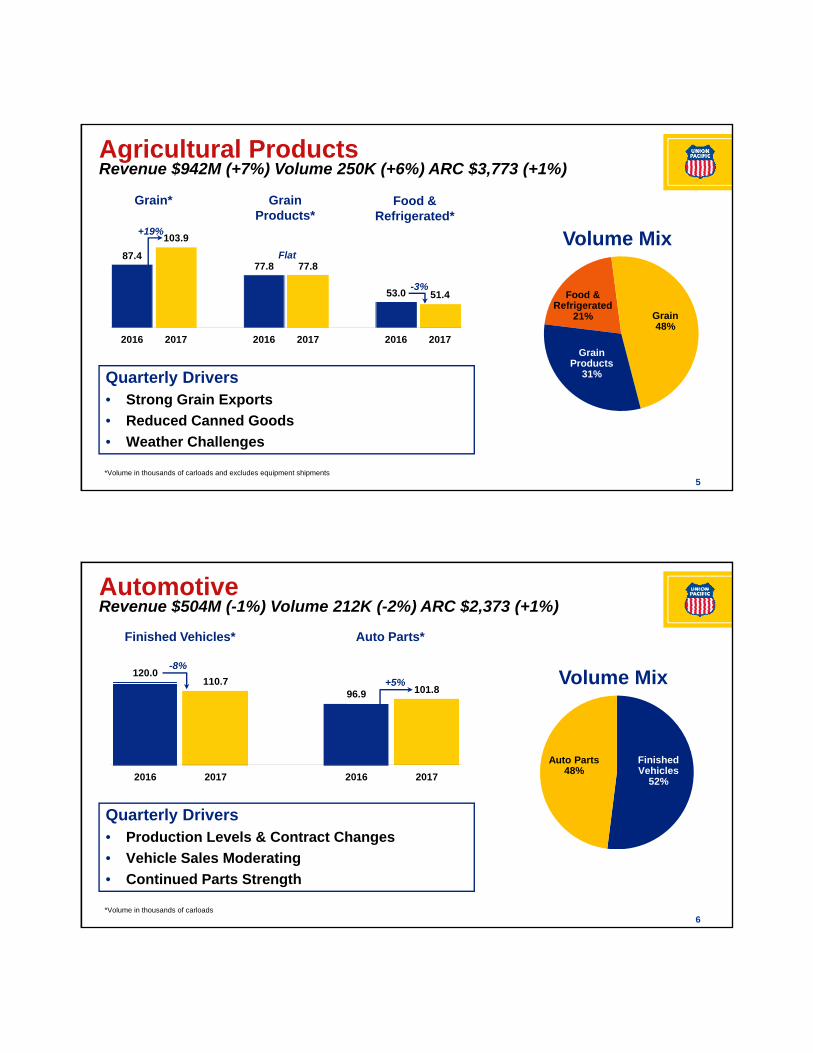
Volume Mix
Agricultural ProductsRevenue $942M (+7%) Volume 250K (+6%) ARC $3,773 (+1%)
Grain* Grain Products*
Food & Refrigerated*
103.9+19%
Grain Products
Grain48%
Food & Refrigerated
21%
87.477.8 77.8
53.0 51.4
2016 2017 2016 2017 2016 2017
Flat
-3%
5
31%
*Volume in thousands of carloads and excludes equipment shipments
Quarterly Drivers• Strong Grain Exports
• Reduced Canned Goods
• Weather Challenges
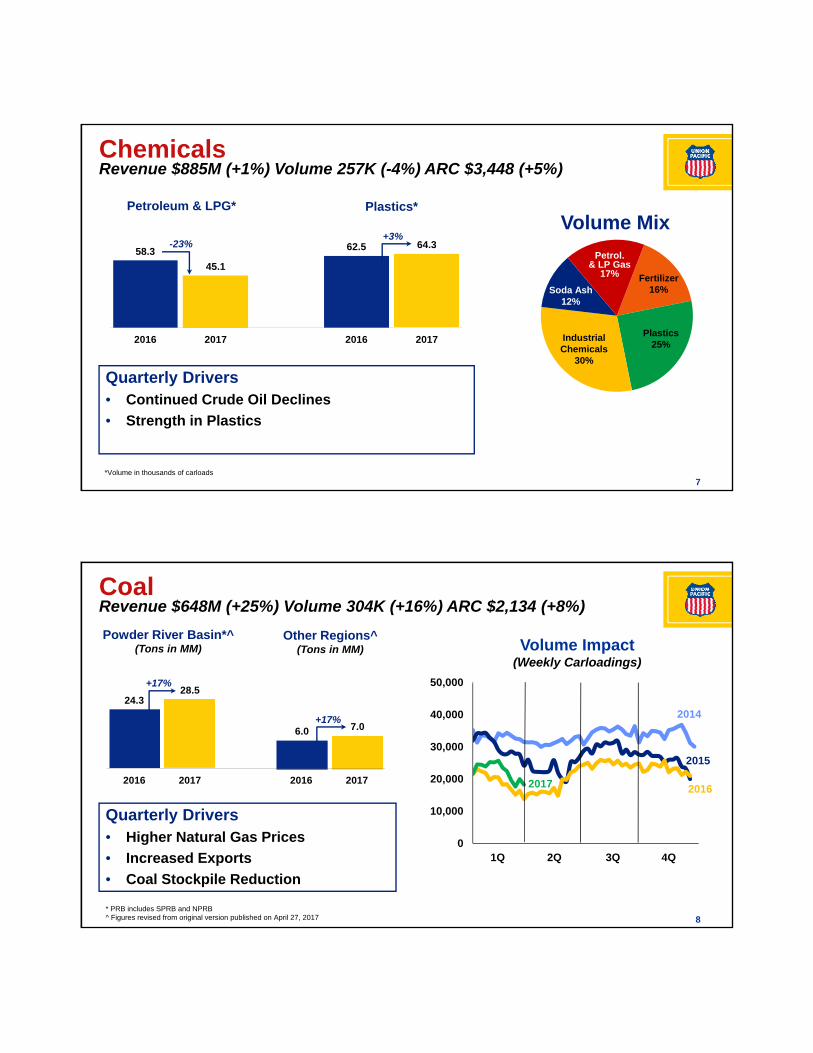
120.0110.7
Finished Vehicles* Auto Parts*
Volume Mix
AutomotiveRevenue $504M (-1%) Volume 212K (-2%) ARC $2,373 (+1%)
+5%
-8%
110.796.9 101.8
2016 2017 2016 2017
Volume Mix
Finished Vehicles
52%
Auto Parts 48%
+5%
6*Volume in thousands of carloads
Quarterly Drivers• Production Levels & Contract Changes
• Vehicle Sales Moderating
• Continued Parts Strength
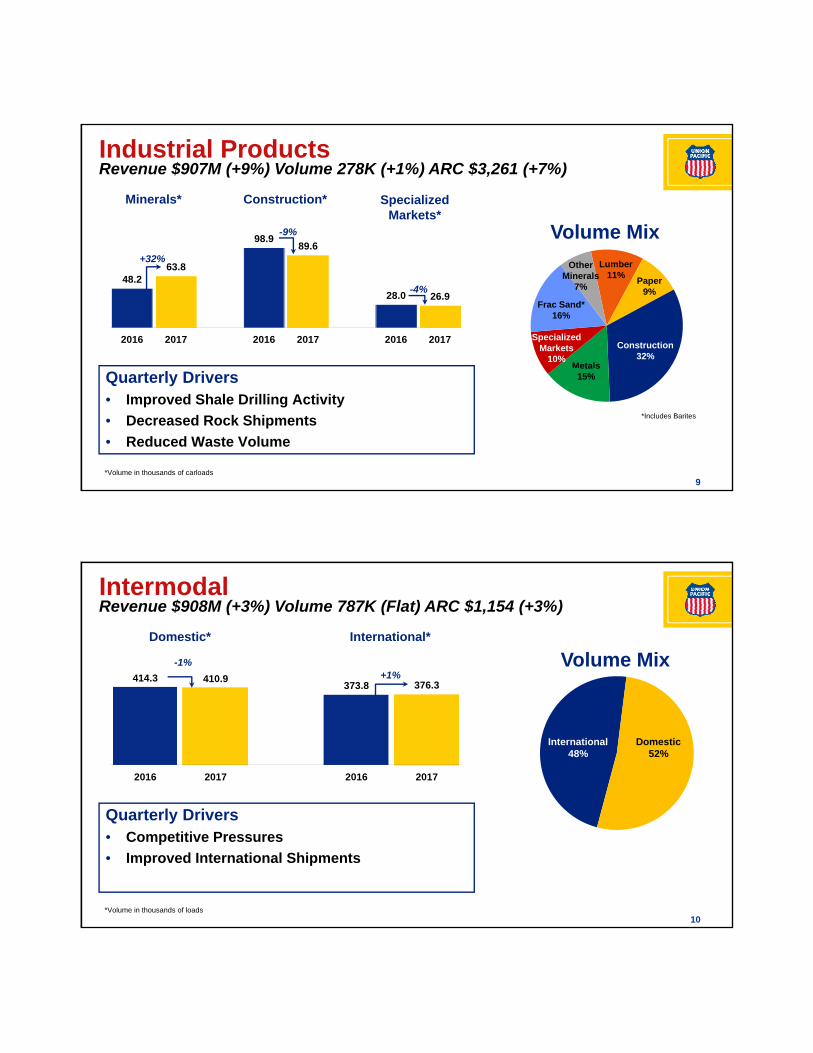
Volume Mix
ChemicalsRevenue $885M (+1%) Volume 257K (-4%) ARC $3,448 (+5%)
Petroleum & LPG* Plastics*
62 5 64 3-23%+3%
Soda Ash12%
58.3
45.1
62.5 64.3
2016 2017 2016 2017
23%
Plastics25%
Industrial Chemicals
30%
Petrol.& LP Gas
17% Fertilizer 16%Soda Ash
12%
7*Volume in thousands of carloads
Quarterly Drivers• Continued Crude Oil Declines
• Strength in Plastics
Volume Impact(Weekly Carloadings)
CoalRevenue $648M (+25%) Volume 304K (+16%) ARC $2,134 (+8%)
Powder River Basin*^(Tons in MM)
Other Regions^(Tons in MM)
+17% 50 000
6.0 7.0
24.328.5
2016 2017 2016 2017
+17%
+17%
20,000
30,000
40,000
50,000
2015
2016
2014
2017
8* PRB includes SPRB and NPRB^ Figures revised from original version published on April 27, 2017
0
10,000
1Q 4Q2Q 3Q
Quarterly Drivers• Higher Natural Gas Prices
• Increased Exports
• Coal Stockpile Reduction
Industrial ProductsRevenue $907M (+9%) Volume 278K (+1%) ARC $3,261 (+7%)
Volume Mix98.989 6
Minerals* Construction* Specialized Markets*
-9%
Paper9%
Specialized Markets
10%Metals
Frac Sand*16%
Construction32%
Lumber11%48.2
63.8
89.6
28.0 26.9
2016 2017 2016 2017 2016 2017
+32%
-4%
Other Minerals
7%
9
eta s15%
*Volume in thousands of carloads
Quarterly Drivers• Improved Shale Drilling Activity
• Decreased Rock Shipments
• Reduced Waste Volume
*Includes Barites
414.3 410.9373 8 376 3
Domestic* International*
Volume Mix+1%
-1%
IntermodalRevenue $908M (+3%) Volume 787K (Flat) ARC $1,154 (+3%)
373.8 376.3
2016 2017 2016 2017
Domestic52%
International48%
10*Volume in thousands of loads
Quarterly Drivers• Competitive Pressures
• Improved International Shipments
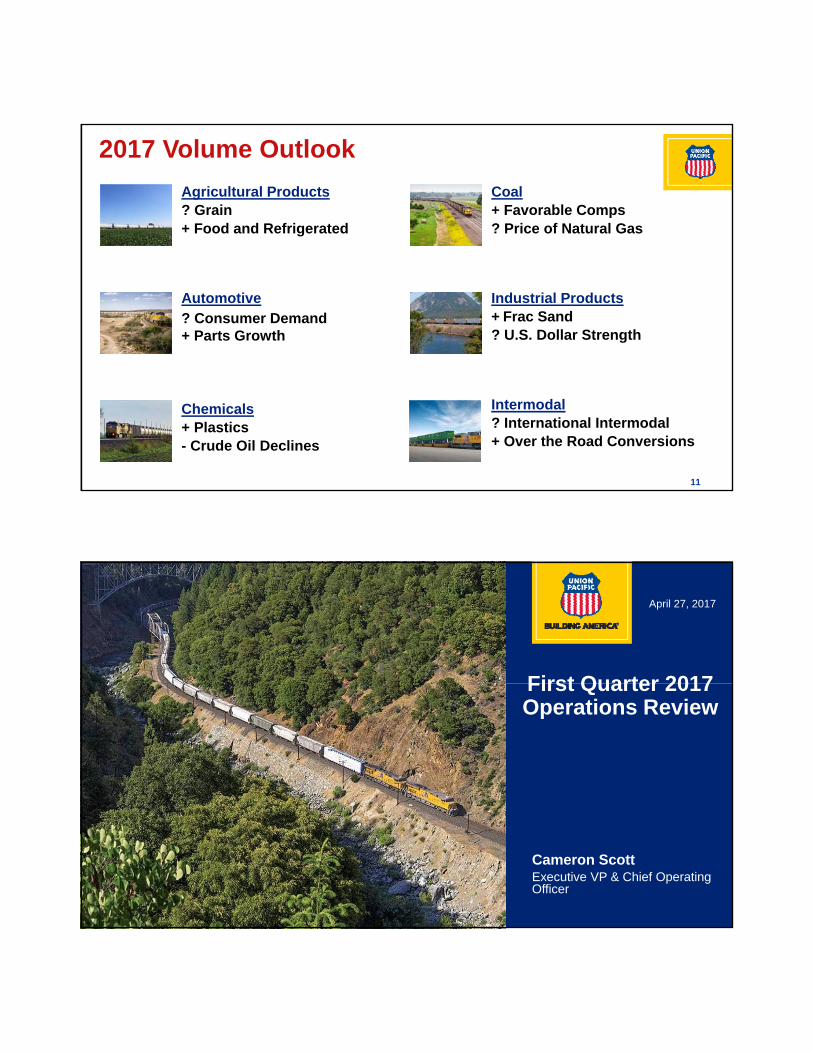
2017 Volume Outlook
Agricultural Products? Grain+ Food and Refrigerated
Coal+ Favorable Comps? Price of Natural Gas
Automotive? Consumer Demand+ Parts Growth
Industrial Products+ Frac Sand? U.S. Dollar Strength
11
Chemicals+ Plastics- Crude Oil Declines
Intermodal? International Intermodal+ Over the Road Conversions
First Quarter 2017
April 27, 2017
First Quarter 2017 Operations Review
12
Cameron ScottExecutive VP & Chief Operating Officer

1.12 1.102 95 3.18
Rail Equipment(Reportable Derailment Incidents
Per Million Train Miles*)
Employee(Reportable Personal Injury Incidents Per
200,000 Employee-Hours)Good
Good
+19%+11%
Safety
0.85 0.750.89
1Q13 1Q14 1Q15 1Q16 1Q17
2.322.65
2.95 2.863.18
1Q13 1Q14 1Q15 1Q16 1Q17
Public(Crossing Accidents Per Million Train Miles)
• Goal of Zero Incidents
+19%
First Qtr Record
13
2.59 2.58
1.882.37
2.21
1Q13 1Q14 1Q15 1Q16 1Q17
( g )
• Enhanced Training & Infrastructure Investment
• Crossing Assessment Process
-7%
Good
*Starting in August 2016, crossing collisions were excluded from rail equipment incidents per FRA methodology. Prior periods have been adjusted to reflect the change.
27.325 7
Terminal Dwell(As Reported to the AAR, in hours)
Velocity(As Reported to the AAR, in mph)
-6%
Network Performance
Good Good
28.6
30.6+7%
25.7
1Q16 1Q17
Terminal Productivity(vs 1Q16) • Western Region Weather
1Q16 1Q17*
First Quarter Record
14
( ) gChallenges
• Improved Terminal Productivity
Nbr of Cars Switched
Cars Switched per Employee Day
Y&L Employee Days
+2%
-1%
+4%

Active LocomotiveTotal TE&Y(Full-Time Equivalent)
Volume & Performance Drive Resources
-1%14,141 14,015 6,590
6,774+3%
Fleet
1Q16 1Q17
Train Size Performance(vs 1Q16)
• Balanced Resource BaseTE&Y F l h 1 650G d
1Q16 1Q17
15
( )• TE&Y Furloughs^: ~1,650
• Stored Locomotives^: ~1,400
• Adjust with Volume and Network Performance
Good
Auto*
Intermodal**
Manifest*
Coal
Grain** +1%
Flat
+2%
+3%
+4%
* Best-Ever Quarter **First-Quarter Record ^As of March 31, 2017
• Continue to Generate Positi e Safet Res lts
Operating Outlook
Positive Safety Results
• Resource Agility
• Maintain Focus on
16
Productivity & Efficiency
First Quarter 2017
April 27, 2017
First Quarter 2017 Financial Review
17
Rob KnightExecutive VP & Chief Financial Officer
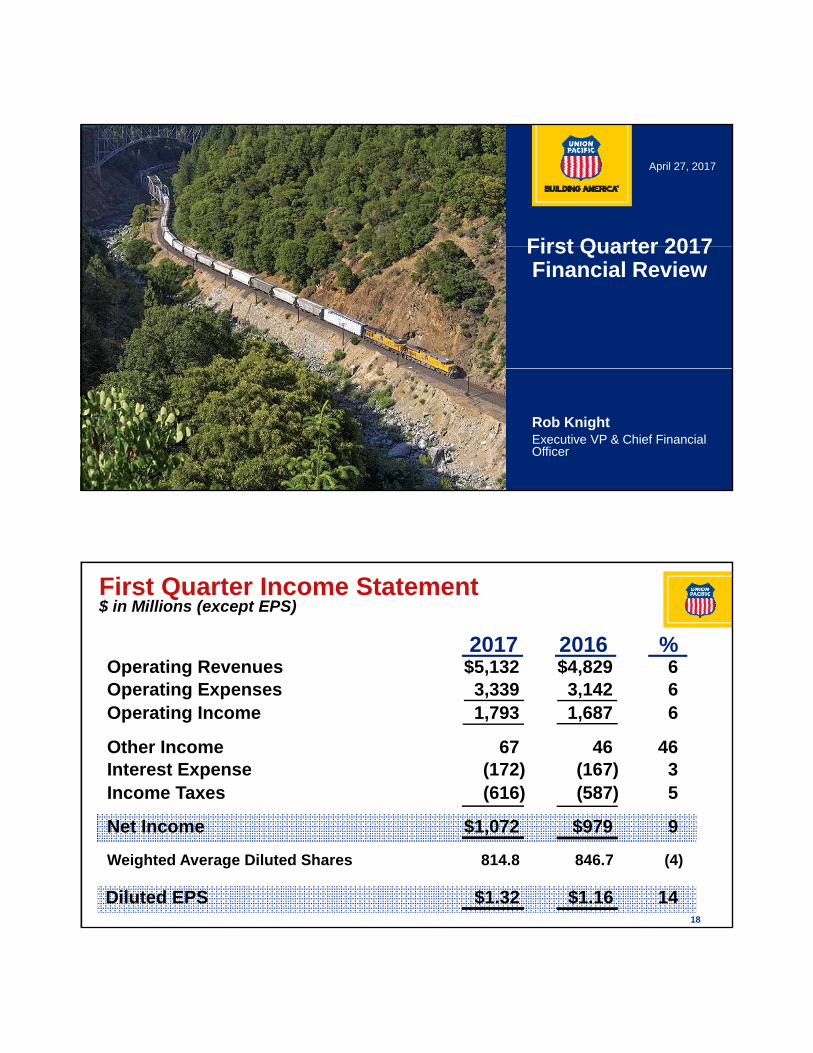
Operating Revenues $5,132 $4,829 6O ti E 3 339 3 142 6
First Quarter Income Statement$ in Millions (except EPS)
2017 2016 %
Operating Expenses 3,339 3,142 6Operating Income 1,793 1,687 6
Other Income 67 46 46Interest Expense (172) (167) 3Income Taxes (616) (587) 5
18
Net Income $1,072 $979 9
Weighted Average Diluted Shares 814.8 846.7 (4)
Diluted EPS $1.32 $1.16 14

$4,794
$4,502
+6.5%
Freight RevenueFirst Quarter ($ In Millions)
+2.5%
Fuel Mix
+2.0% +1.0%+1.0%
Volume Core
19
2016
Fuel Surcharge
Mix
2017
Volume CorePrice
FuelCompensation & Benefits
+4%
$320
$460+44%
First Quarter Operating Expenses$ In Millions
$1,257$1,213
2016 2017
Purchased Services & Materials
• Inflation and Volume Increases
$320
2016 2017
20
$569 $566
2016 2017
Materials• Higher Diesel Fuel Prices
• Weather and Incident Related Expenses
-1%
Equipment & Other Rents
Depreciation
4%
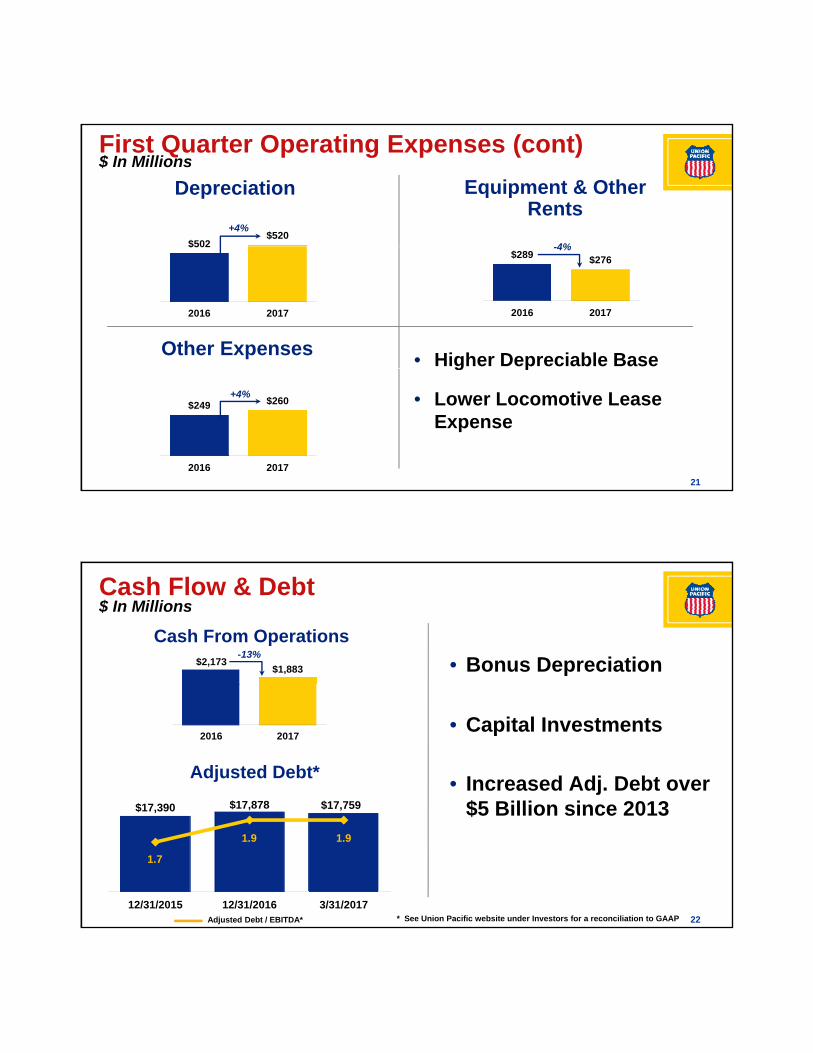
First Quarter Operating Expenses (cont)$ In Millions
$502$520
+4%
Other Expenses
$289 $276
2016 2017
-4%$502
2016 2017
• Higher Depreciable Base
21
$249 $260
2016 2017
+4%
g p
• Lower Locomotive Lease Expense
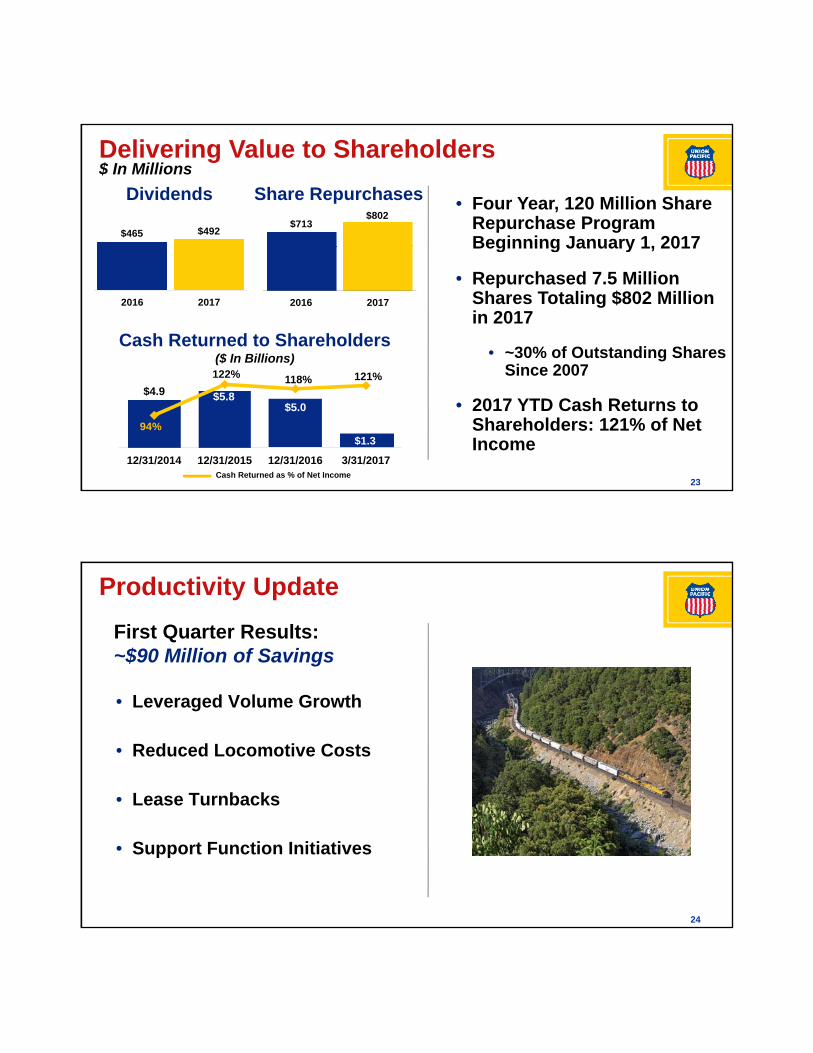
Cash Flow & Debt$ In Millions
• Bonus Depreciation
Cash From Operations$2,173
$1,883
-13%
2016 2017• Capital Investments
• Increased Adj. Debt over $5 Billion since 2013$17 390 $17 878 $17 759
Adjusted Debt*
22
$5 Billion since 2013$17,390 $17,878 $17,759
12/31/2015 12/31/2016 3/31/2017
1.9 1.9
1.7
Adjusted Debt / EBITDA* * See Union Pacific website under Investors for a reconciliation to GAAP
Delivering Value to Shareholders $ In Millions
• Four Year, 120 Million Share Repurchase Program Beginning January 1, 2017
Dividends
$492$465$713
$802
Share Repurchases
2016 2017
Beginning January 1, 2017
• Repurchased 7.5 Million Shares Totaling $802 Million in 2017
• ~30% of Outstanding Shares Since 2007
2016 2017
Cash Returned to Shareholders($ In Billions)
23
Since 2007
• 2017 YTD Cash Returns to Shareholders: 121% of Net Income
$4.9 $5.8 $5.0
94%
12/31/2014 12/31/2015 12/31/2016 3/31/2017Cash Returned as % of Net Income
118% 121%122%
$1.3
Productivity Update
4Q14: $438
First Quarter Results:~$90 Million of Savings
• Leveraged Volume Growth
• Reduced Locomotive Costs
• Lease Turnbacks
24
• Support Function Initiatives

2017 Outlook
4Q14: $438
Operating Ratio(%)
Full Year
• Low Single Digit Volume Growth
63.5
60 +/-• Price Above Inflation
• Productivity $350 to $400 Million
• Improved Operating Ratio
25
2016 2019 Target
Continued Focus on G55+0
• Improved Operating Ratio
April 27, 2017
First Quarter 2017First Quarter 2017 Earnings Release
26
Lance FritzChairman, President & CEO
• Solid First Quarter Results
Looking Ahead
• Continued Focus on Pricing & Productivity
• Gradual Improvement in the Economy
27
the Economy
• Value Tracks Have us Well Positioned
This presentation and related materials contain statements about the Company’s future that are not statements ofhistorical fact, including specifically the statements regarding the Company’s expectations with respect to economicconditions and demand levels; its ability to generate financial returns, improve network performance and customerservice; implementation of corporate strategies; and providing excellent service to its customers and returns to itsshareholders. These statements are, or will be, forward-looking statements as defined by the Securities Act of 1933and the Sec rities E change Act of 1934 For ard looking statements also generall incl de itho t limitation
Cautionary Information
and the Securities Exchange Act of 1934. Forward-looking statements also generally include, without limitation,information or statements regarding: projections, predictions, expectations, estimates or forecasts as to theCompany’s and its subsidiaries’ business, financial, and operational results, and future economic performance; andmanagement’s beliefs, expectations, goals, and objectives and other similar expressions concerning matters that arenot historical facts.
Forward-looking statements should not be read as a guarantee of future performance or results, and will notnecessarily be accurate indications of the times that, or by which, such performance or results will be achieved.Forward-looking information, including expectations regarding operational and financial improvements and theCompany’s future performance or results are subject to risks and uncertainties that could cause actual performanceor results to differ materially from those expressed in the statement. Important factors, including risk factors, couldaffect the Company’s and its subsidiaries’ future results and could cause those results or other outcomes to differmaterially from those expressed or implied in the forward-looking statements. Information regarding risk factors andother cautionary information are available in the Company’s Annual Report on Form 10-K for 2016, which was filed
28
other cautionary information are available in the Company s Annual Report on Form 10 K for 2016, which was filedwith the SEC on February 3, 2017. The Company updates information regarding risk factors if circumstances requiresuch updates in its periodic reports on Form 10-Q and its subsequent Annual Reports on Form 10-K (or such otherreports that may be filed with the SEC).
Forward-looking statements speak only as of, and are based only upon information available on, the date thestatements were made. The Company assumes no obligation to update forward-looking information to reflect actualresults, changes in assumptions or changes in other factors affecting forward-looking information. If the Companydoes update one or more forward-looking statements, no inference should be drawn that the Company will makeadditional updates with respect thereto or with respect to other forward-looking statements. References to ourwebsite are provided for convenience and, therefore, information on or available through the website is not, andshould not be deemed to be, incorporated by reference herein.
April 27, 2017
First Quarter 2017First Quarter 2017 Earnings Release
29
Question & Answer Session