Embed Size (px)
Citation preview
1

This presentation contains forward-looking statements. In some cases, these statements can be identified by the use of forward-looking words such as “may,”“should,” “could,” “anticipate,” “estimate,” “expect,” “plan,” “believe,” “predict,” “potential” and “intend” or other similar words. These forward-looking statementsreflect current expectations and projections about future events of CEMEX Holdings Philippines, Inc. ("CHP") based on CHP’s knowledge of present facts andcircumstances and assumptions about future events. These statements necessarily involve risks and uncertainties that could cause actual results to differmaterially from CHP’s expectations. Some of the risks, uncertainties and other important factors that could cause results to differ, or that otherwise could havean impact on CHP or its subsidiaries, include, but are not limited to, the cyclical activity of the construction sector; CHP’s exposure to other sectors that impactCHP’s business, such as the energy sector; competition; general political, economic and business conditions in the markets in which CHP operates; theregulatory environment, including environmental, tax, antitrust and acquisition-related rules and regulations; CHP’s ability to satisfy its debt obligations and theability of CEMEX, S.A.B. de C.V. (“CEMEX”), the ultimate parent company of the major shareholder of CHP, to satisfy CEMEX’s obligations under its materialdebt agreements, the indentures that govern CEMEX’s senior secured notes and CEMEX’s other debt instruments; expected refinancing of CEMEX’s existingindebtedness; the impact of CEMEX’s below investment grade debt rating on CHP’s and CEMEX’s cost of capital; CEMEX’s ability to consummate asset salesand fully integrate newly acquired businesses; achieve cost-savings from CHP’s cost-reduction initiatives and implement CHP’s pricing initiatives for CHP’sproducts; the increasing reliance on information technology infrastructure for CHP’s invoicing, procurement, financial statements and other processes that canadversely affect operations in the event that the infrastructure does not work as intended, experiences technical difficulties or is subjected to cyber-attacks;weather conditions; natural disasters and other unforeseen events; and the other risks and uncertainties described in CHP’s public filings. Readers are urgedto read these presentations and carefully consider the risks, uncertainties and other factors that affect CHP’s business. The information contained in thesepresentations is subject to change without notice, and CHP is not obligated to publicly update or revise forward-looking statements. Unless the contextindicates otherwise, all references to pricing initiatives, price increases or decreases, refer to CHP’s prices for products sold or distributed by CHP or itssubsidiaries.
Copyright CEMEX Holdings Philippines, Inc. and its subsidiaries
2

3
First Quarter 2017 Highlights
Cost of sales relatively flat, as a percentage to sales, despite higher spot energy prices. Signed contract for new waste-heat-to-electricity facility for our APO cement plant; new facility
expected to provide greater electricity sourcing flexibility. Fully paid the long-term US$ debt with New Sunward Holding B.V., by way of refinancing a
majority of the outstanding US$ loan balance into a Philippine Peso loan at lower interest rate. March cement volumes highest achieved in the last 17 months.
4
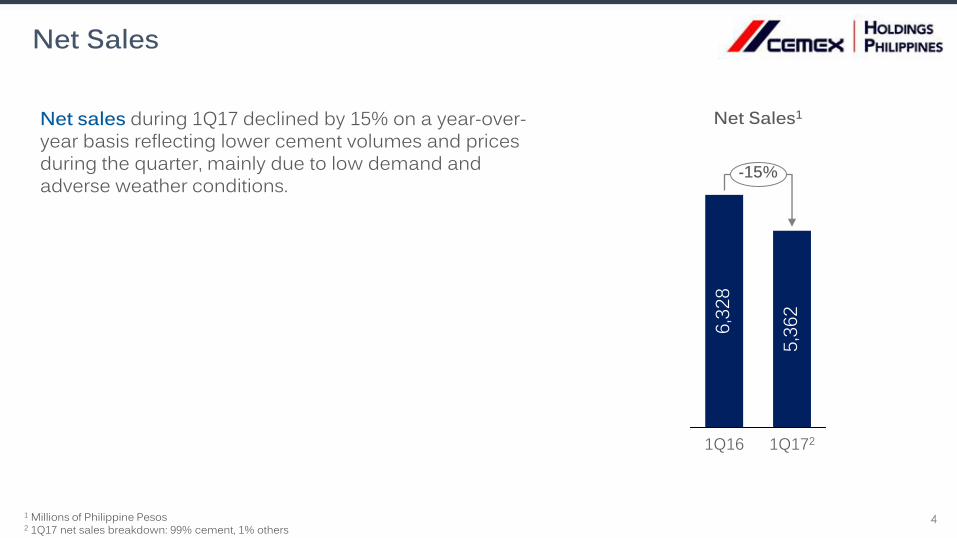
Net Sales
Net sales during 1Q17 declined by 15% on a year-over-year basis reflecting lower cement volumes and prices during the quarter, mainly due to low demand and adverse weather conditions.
1 Millions of Philippine Pesos2 1Q17 net sales breakdown: 99% cement, 1% others
Net Sales1
-15%
1Q172
5,36
2
1Q16
6,32
8

5
Domestic Cement VolumesDomestic gray cement volumes declined by 9% during 1Q17 versus same period last year mainly due to:
• Adverse weather conditions, especially during January and February, resulted in 24 additional downtime days compared with 1Q16 due to rough sea conditions and mandatory sheltering of our vessels
• High base of comparison in 1Q16, with strong construction activity prior to elections
Cement sales increased throughout the quarter as weather improved.
March cement volumes were the highest monthly volumes in the last 17 months.
Sequentially, cement volumes increased by 4% versus 4Q16.
We estimate our market position remained unchanged compared with 4Q16.
Monthly Distribution ofFirst Quarter Volume
34%33%33%39%
32%29%
MarFebJan
20172016
1Q17 vs. 1Q16 1Q17 vs. 4Q16
Domestic Gray Cement
Volume (9%) 4%

6
Domestic Cement Price
Domestic gray cement prices during 1Q17 declined by 7% year-over-year and by 2% sequentially.
Heightened competition due to growth in import volumes relative to the same quarter last year and weaker demand resulted in the price decline.
The sequential decline in prices reflects a product and geography mix effect.
Monthly cement prices improved within the quarter.
CHP Domestic Cement Price Index(Oct ’16 = 100)
92949698
100102
Mar’17
Feb’17
Jan’17
Dec’16
Nov’16
Oct’16
1Q17 vs. 1Q16 1Q17 vs. 4Q16
Domestic Gray Cement
Price (PHP) (7%) (2%)

In the first three quarters…
• Less expensive energy input costs to production and freights to import
• Low prices at origin, principally Vietnam
• Grants of Philippine Standard (PS) licenses to import: 37 licenses in 12 months
Since the second half, situation shifted…
• Rising costs of energy globally affecting production and transportation costs
• Impositions of taxes at source; for example, Vietnam has re-imposed a 10% VAT and imposed a 5% export tariff
• China pollution clampdown
• Additional import regulations by the Philippine Department of Trade to ensure public safety
7
Situation affecting imports by traders in 2016 shifted as the year progressed
1 CHP internal estimates based on publicly available information
0%1%2%3%4%5%6%7%8%
-50%
0%
50%
100%
150%
200%
1Q174Q163Q162Q161Q16
Right Axis: Quarter-on-Quarter GrowthLeft Axis: Percentage of Total Domestic Cement Demand
Estimated Imported Cement Sales by Traders1
Cement sales from traders, as a percentage of total domestic cement demand, leveled in the last three quarters

8
Low cement consumption during 1Q17, due to a high base of comparison in the pre-election period
+6+7+7+7+7+6
-4
+5
+10
+15+15
Q1 20171
-5Q4 2016Q3 2016Q2 2016Q1 2016Q4 2015
Cement Demand GrowthGDP Growth
Source: Philippine Statistics Authority, Cement Manufacturers Association of the Philippines1 CHP internal estimates based on publicly available information
Philippines Quarterly GDP and Cement Demand Growth(%)

9
Residential Sector
Growth in residential sector permits decelerated sharply in 4Q16, and presumed to have affected construction activity during 1Q17.Dollar remittances still growing in the high single digits.Low interest rate environment prevailing.Large developers expected to launch new residential projects following a reduction in inventories during 2015 and 2016.Persistent strong demand in affordable and socialized housing segments.Opportunity for growth with tax reform program.
-10%
-5%
0%
5%
10%
15%
20%
4Q163Q162Q161Q164Q15
Approved ResidentialBuilding Permits
based on floor area1
Year-on-Year Growth
1 Source: Philippine Statistics Authority

10
Industrial-and-Commercial Sector
Growth in industrial and commercial sector permits decelerated sharply starting 3Q16, with an expected decline in activity reflected in succeeding quarters.Business Process Outsourcing (“BPO”) activity is estimated to account for 46% of office space demand in Metro Manila in 20161.Expected resumption of BPO expansion as PH remains fundamentally attractive.
-10%
0%
10%
20%
30%
40%
4Q163Q162Q161Q164Q15
Approved Non-ResidentialBuilding Permits
based on floor area2
Year-on-Year Growth
1 Source: Jones Lang LaSalle2 Source: Philippine Statistics Authority

Department of Budget Management:Infrastructure and other capital outlays missed target in 2016 “owing to procurement difficulties such as failure of biddings, non-compliance of bidders with bid requirements or difficulty in complying with product or service specifications”.“The growth of disbursements for the first few months this 2017 will be moderate partly due to base effect considering the high disbursements recorded for the same period in 2016 and since most line agencies are still in the process of obligating their allotments at the earlier part of the year.” “Spending is expected to rack up in the succeeding months towards the summer season.”
11
Infrastructure Sector
860829
506465
297252242
493
345276262251
159
2011 2012 2013 2014 201720162015
ActualBudget
66% 59%
% of Budget Disbursed
68%59%88%99%
Public Infrastructure vs. Disbursement(PHP billion)
Source: Department of Budget and Management

12
Cost of Sales
NOTE: Refer to slides 29 and 30 for information on pro forma adjustments
Cost of sales remained relatively flat. As a percentage of cost of sales, power and fuel accounted for 20% and 19% respectively.Operating efficiency for the quarter was above 93% for both plants.
52.0
%
+0.9pp
1Q171Q16Pro Forma
51.1
%
2,79
0-14%
1Q171Q16Pro Forma
3,23
1
Percentageof Net Sales
Millions ofPhilippine Pesos

13
Operating Expenses
As a percentage of net sales, Distribution expenses increased 4.0 pp, driven by lower transport efficiencies and higher diesel prices.As a percentage of net sales, S&A Expenses increased 1.9 pp due to intensified promotions, and other overhead expenses.
756
-2%
1Q171Q16Pro Forma
7711,
049
+6%
1Q171Q16Pro Forma
990
Selling andAdministrative1
Distribution1
1 Millions of Philippine PesosNOTE: Refer to slides 29 and 30 for information on pro forma adjustments
15.6%% of Net Sales 19.6% 12.2% 14.1%

14
Operating EBITDA
The decline in operating EBITDAresulted from lower volumes and prices, and an unfavorable operating leverage.Operating EBITDA margin declined by 5.9pp during the quarter.15246
1,640
-35%
EBITDA 1Q17
1,071
Distribution
-59
Sellingand
Administrative
COSOther Sales2
-13
Domestic Cement
Price
-453
Domestic Cement Volume
-305
EBITDA 1Q16Pro
Forma
Operating EBITDA Variation1
25.9%% of Net Sales 20.0%
1 Millions of Philippine Pesos2 Other sales includes sales from export cement, readymix, and other businessesNOTE: Refer to slides 29 and 30 for information on pro forma adjustments

15
Net Income
1 Millions of Philippine PesosNOTE: Refer to slides 29 and 30 for information on pro forma adjustments
350259
460
85
111
Income Tax Net Income 1Q17
Other Financial Income
(Expenses), net
Financial Expenses
Other income (expenses),
net
Depreciation
102
Net Income 1Q16
Pro Forma
EBITDA
-569
Net Income Variation1

16

Free cash flow during the first quarter of 2017 was negative PHP 313 million, mainly due to working capital variation. The change in working capital was driven by:
Higher clinker inventories of PHP 213.3 millionTiming effect of coal payments of PHP 288.4 millionTiming effect of advanced payments, specifically real property taxes and customs duties, of PHP 261.7 millionHigher trade accounts receivables of PHP 155.1 million
17
Free Cash Flow
NOTE: Refer to slides 29 and 30 for information on pro forma adjustments
2017 2016Pro Forma
% var 2017 2016Pro Forma
% var
Operating EBITDA 1,071 1,640 (35%) 1,071 1,640 (35%)
- Net Financial Expenses 258 258
- Maintenance Capex 49 49
- Change in Working Capital 920 920
- Taxes Paid 102 102
- Other Cash Items (net) (19) (19)
Free Cash Flow after Maintenance Capex
(239) (239)
- Strategic Capex 74 74
Free Cash Flow (313) (313)Millions of Philippine Pesos
January - March First Quarter

18
Debt-related information
As of March 31, 2017, CHP refinanced and fully paid its related party loan with New Sunward Holding B.V. with proceeds from a Senior Unsecured Peso Term Loan Facility with BDO Unibank, Inc. (“BDO Debt”)BDO Debt stood at PHP 14,012 million (USD 279 million2), down from USD 291 million at the end of 2016 with a blended rate of 4.7% (fixed rate tranche priced at 5.6%)
Debt Evolution1
353279
33
New SunwardHolding B.V.
37421
BDO Debt2
End 1Q17End 2Q16
312RevolvingFacility3
1 Millions of U.S. Dollars2 Converted using end March 2017 exchange rate of PHP 50.163 Revolving facility with CEMEX Asia B.V.

New line estimated to start operationsfourth quarter of 2019.Engineering contract finalized CBMI Construction Co., Ltd. (SINOMA).Expected total investment: US$ 225 million
19
Solid Plant Capacity Expansion

20
2017 Guidance
Cement volumes 3%
Capital expendituresPHP 918 millionPHP 889 millionPHP 277 millionPHP 2,084 million
Maintenance CAPEXSolid Plant Expansion CAPEXOther Strategic CAPEXTotal CAPEX

21
Upcoming Initiatives for 2017
Ramp up domestic production capability to lessen imported cement requirements.
• Additional 0.3 M tons capacity Forthcoming New Terminal in operation in Bacolod to extend our distribution network.

22

23

24
Income Statement Information(Thousands of Philippine Pesos in nominal terms, except per share amounts)
1 Refer to slides 29 and 30 for information on pro forma adjustments
INCOME STATEMENT 2017 2016 % var 2016 2017 2016 % var 2016
Pro Forma1 Actual Pro Forma1 Actual
Net sales 5,362,377 6,328,209 (15%) 6,328,209 5,362,377 6,328,209 (15%) 6,328,209
Cost of sales (2,789,516) (3,231,475) (14%) (3,231,475) (2,789,516) (3,231,475) (14%) (3,231,475)
Gross profit 2,572,861 3,096,734 (17%) 3,096,734 2,572,861 3,096,734 (17%) 3,096,734
Operating expenses (1,804,749) (1,760,869) 2% (2,563,659) (1,804,749) (1,760,869) 2% (2,563,659)
Operating earnings before other
expenses, net768,112 1,335,865 (43%) 533,075 768,112 1,335,865 (43%) 533,075
Other expenses, net 19,166 8,116 136% 8,116 19,166 8,116 136% 8,116
Operating earnings 787,278 1,343,981 (41%) 541,191 787,278 1,343,981 (41%) 541,191
Financial expenses (249,183) (334,474) (26%) (17,942) (249,183) (334,474) (26%) (17,942)
Other financial income
(expenses), net(97,341) (199,304) (51%) (199,304) (97,341) (199,304) (51%) (199,304)
Net income before income taxes 440,754 810,203 (46%) 323,945 440,754 810,203 (46%) 323,945
Income tax (91,217) (350,480) (74%) (109,643) (91,217) (350,480) (74%) (109,643)
Consolidated net income 349,537 459,723 (24%) 214,302 349,537 459,723 (24%) 214,302
Non-controlling Interest Net Income 9 6 52% 6 9 6 52% 6
Controlling Interest Net Income 349,546 459,729 (24%) 214,308 349,546 459,729 (24%) 214,308
Operating EBITDA 1,070,695 1,639,701 (35%) 836,910 1,070,695 1,639,701 (35%) 836,910
Earnings per share 0.07 0.07
January - March First Quarter
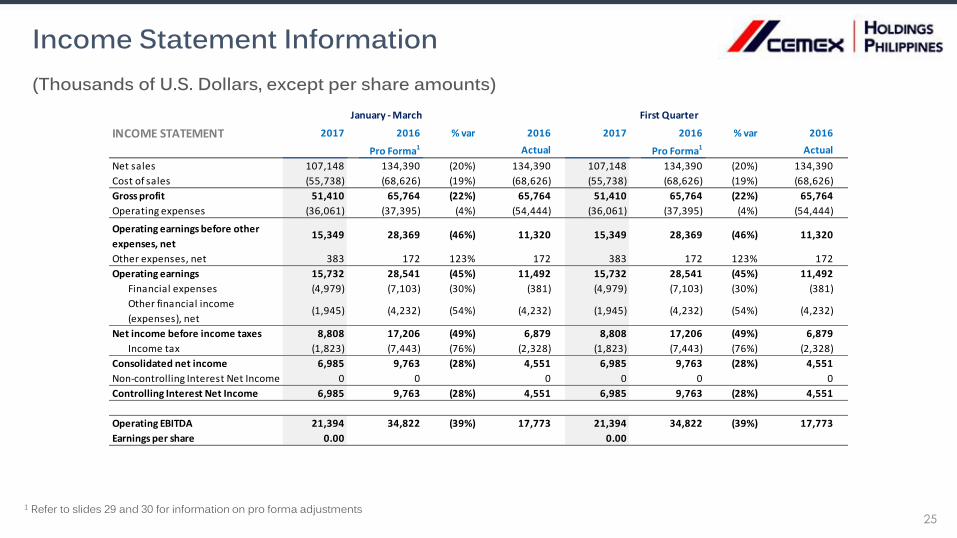
25
Income Statement Information(Thousands of U.S. Dollars, except per share amounts)
1 Refer to slides 29 and 30 for information on pro forma adjustments
INCOME STATEMENT 2017 2016 % var 2016 2017 2016 % var 2016
Pro Forma1 Actual Pro Forma1 Actual
Net sales 107,148 134,390 (20%) 134,390 107,148 134,390 (20%) 134,390
Cost of sales (55,738) (68,626) (19%) (68,626) (55,738) (68,626) (19%) (68,626)
Gross profit 51,410 65,764 (22%) 65,764 51,410 65,764 (22%) 65,764
Operating expenses (36,061) (37,395) (4%) (54,444) (36,061) (37,395) (4%) (54,444)
Operating earnings before other
expenses, net15,349 28,369 (46%) 11,320 15,349 28,369 (46%) 11,320
Other expenses, net 383 172 123% 172 383 172 123% 172
Operating earnings 15,732 28,541 (45%) 11,492 15,732 28,541 (45%) 11,492
Financial expenses (4,979) (7,103) (30%) (381) (4,979) (7,103) (30%) (381)
Other financial income
(expenses), net(1,945) (4,232) (54%) (4,232) (1,945) (4,232) (54%) (4,232)
Net income before income taxes 8,808 17,206 (49%) 6,879 8,808 17,206 (49%) 6,879
Income tax (1,823) (7,443) (76%) (2,328) (1,823) (7,443) (76%) (2,328)
Consolidated net income 6,985 9,763 (28%) 4,551 6,985 9,763 (28%) 4,551
Non-controlling Interest Net Income 0 0 0 0 0 0
Controlling Interest Net Income 6,985 9,763 (28%) 4,551 6,985 9,763 (28%) 4,551
Operating EBITDA 21,394 34,822 (39%) 17,773 21,394 34,822 (39%) 17,773
Earnings per share 0.00 0.00
January - March First Quarter

26
Debt Information
Maturity Profile1
1,193
140
2019
140
2020
105
20174 2018
722
2023
6,656
1,664
2024
5,027
20222021
1 Millions of Philippine Pesos; U.S. dollar debt converted using end March 2017 exchange rate of PHP 50.162 Pertains to U.S. dollar-denominated revolving facility with CEMEX Asia B.V.3 Last 12 months pro forma EBITDA4 Maturity amount pertains only to BDO Debt
BDO DebtRevolving Facility2
Avg. life of debt: 6.2 yearsNet Debt to EBITDA3: 2.4x

27
Historical Pro Forma Financial and Operating Highlights
Refer to slides 29 and 30 for information on pro forma adjustments
Net sales 6,390 6,290 5,278 24,287
Gross Profit 2,981 3,453 2,870 12,401
Operating earnings before other expenses, net
1,378 1,659 1,133 5,506
Operating EBITDA 1,701 1,970 1,417 6,727
as % net sales 26.6% 31.3% 26.8% 27.7%Millions of Philippine Pesos
2Q16Pro Forma
3Q16Pro Forma
4Q16Pro Forma
2016 Full YearPro Forma

28
Definitions
PHP Philippine Pesos
Free Cash Flow Operating EBITDA minus net interest expense, maintenance and strategic capital expenditures, change in working capital, taxes paid, and other cash items (net other expenses less proceeds from the disposal of obsolete and/or substantially depleted operating fixed assets that are no longer in operation),
Maintenance Capital Expenditures
Investments incurred for the purpose of ensuring the company’s operational continuity. These include capital expenditures on projects required to replace obsolete assets or maintain current operational levels, and mandatory capital expenditures, which are projects required to comply with governmental regulations or company policies,
Net Debt Total debt minus cash and cash equivalents.
Operating EBITDA Operating earnings before other expenses, net, plus depreciation and operating amortization.
pp Percentage points
Prices All references to pricing initiatives, price increases or decreases, refer to our prices for our products.
Strategic capital expenditures
investments incurred with the purpose of increasing the company’s profitability. These include capital expenditures on projects designed to increase profitability by expanding capacity, and margin improvement capital expenditures, which are projects designed to increase profitability by reducing costs.
Change in Working capital in the Free cash flow
statements
Only include trade receivables, trade payables, receivables and payables from and to related parties, other current receivables, inventories, other current assets, and other accounts payable and accrued expense.
29
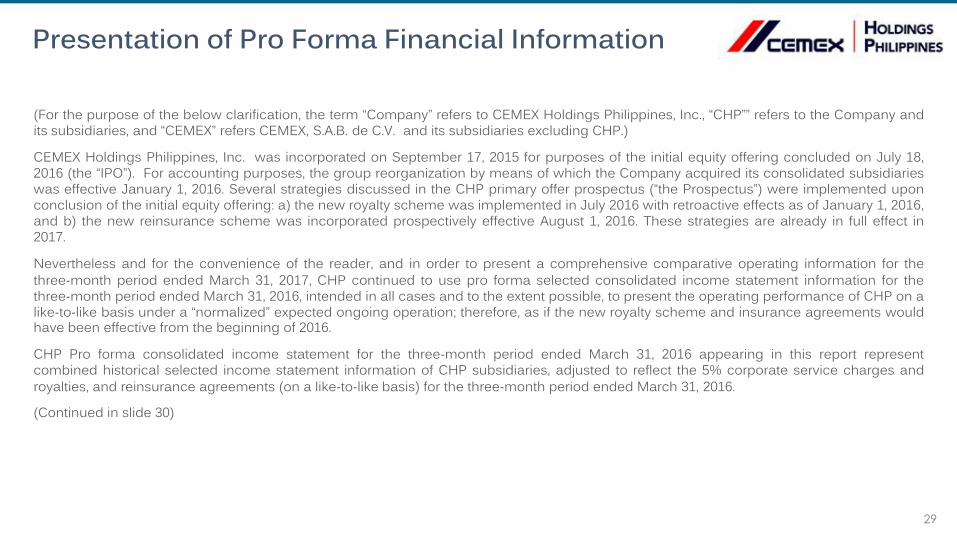
Presentation of Pro Forma Financial Information
(For the purpose of the below clarification, the term “Company” refers to CEMEX Holdings Philippines, Inc., “CHP”” refers to the Company andits subsidiaries, and “CEMEX” refers CEMEX, S.A.B. de C.V. and its subsidiaries excluding CHP.)
CEMEX Holdings Philippines, Inc. was incorporated on September 17, 2015 for purposes of the initial equity offering concluded on July 18,2016 (the “IPO”). For accounting purposes, the group reorganization by means of which the Company acquired its consolidated subsidiarieswas effective January 1, 2016. Several strategies discussed in the CHP primary offer prospectus (“the Prospectus”) were implemented uponconclusion of the initial equity offering: a) the new royalty scheme was implemented in July 2016 with retroactive effects as of January 1, 2016,and b) the new reinsurance scheme was incorporated prospectively effective August 1, 2016. These strategies are already in full effect in2017.
Nevertheless and for the convenience of the reader, and in order to present a comprehensive comparative operating information for thethree‐month period ended March 31, 2017, CHP continued to use pro forma selected consolidated income statement information for thethree‐month period ended March 31, 2016, intended in all cases and to the extent possible, to present the operating performance of CHP on alike‐to‐like basis under a “normalized” expected ongoing operation; therefore, as if the new royalty scheme and insurance agreements wouldhave been effective from the beginning of 2016.
CHP Pro forma consolidated income statement for the three-month period ended March 31, 2016 appearing in this report representcombined historical selected income statement information of CHP subsidiaries, adjusted to reflect the 5% corporate service charges androyalties, and reinsurance agreements (on a like‐to‐like basis) for the three‐month period ended March 31, 2016.
(Continued in slide 30)

30
Presentation of Pro Forma Financial Information
(Continued from slide 29)
In addition:
(1) beginning fiscal year of 2017, a change in accounting treatment of the effects from the new reinsurance agreements will be adoptedrecognizing the same as a reduction in operating expenses instead of an increase of revenue (which was the accounting treatment utilized in2016).
This change in accounting treatment is presented in this report’s Pro Forma consolidated income statement information for the three-monthperiod ended March 31, 2016 This difference in presentation does not have an effect on the reported Pro Forma operating income, reportedPro Forma Operating EBITDA or reported Pro Forma net income for the three months ended March 31, 2016.
(2) the Pro Forma selected consolidated income statement information for the three-month period ended March 31, 2016 appearing in thisreport was prepared by (a) removing IPO-related operating expenses, (b) removing interest payments on short-term debt, and (c) annualizinglong-term debt.

31
Contact Information
Stock InformationPSE: CHP
Investor RelationsIn the Philippines
+632 849 3600