Embed Size (px)
Citation preview

First Quarter 2016 GLOBAL ECONOMIC & CAPITAL MARKETS UPDATE
For investment professionals only. Not for further distribution.
2 2
page 86
page 112
page 108
page 87
Table of Contents
Economics page 4
Capital Markets page 46
Equities page 48
Fixed Income
Real Assets
Global Risk Summary
Currency
3 3
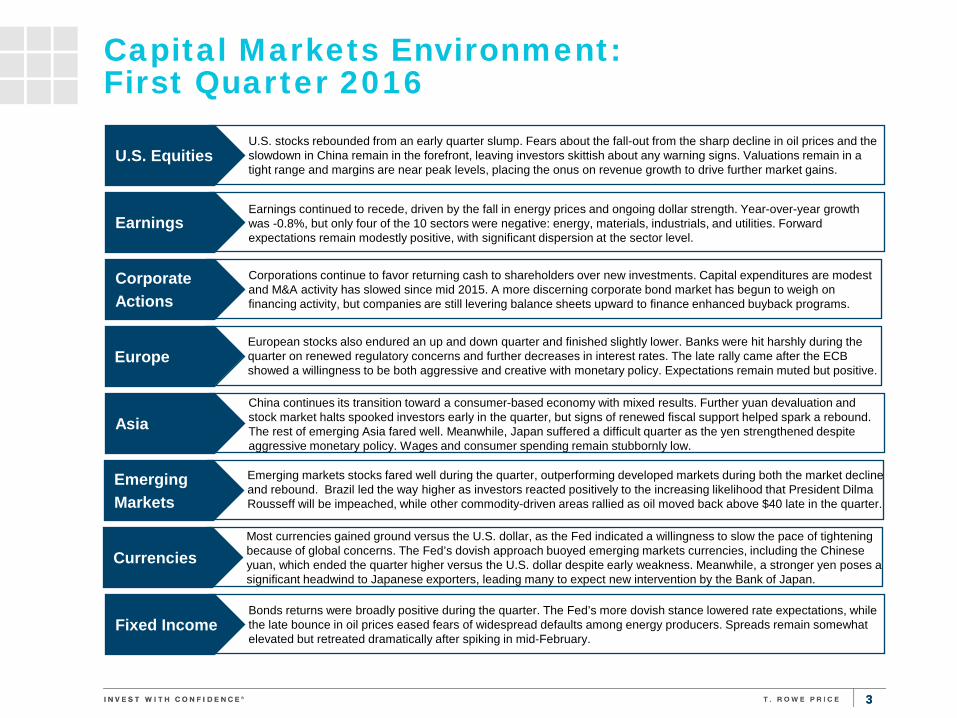
Capital Markets Environment: First Quarter 2016
U.S. Equities U.S. stocks rebounded from an early quarter slump. Fears about the fall-out from the sharp decline in oil prices and the slowdown in China remain in the forefront, leaving investors skittish about any warning signs. Valuations remain in a tight range and margins are near peak levels, placing the onus on revenue growth to drive further market gains.
Earnings Earnings continued to recede, driven by the fall in energy prices and ongoing dollar strength. Year-over-year growth was -0.8%, but only four of the 10 sectors were negative: energy, materials, industrials, and utilities. Forward expectations remain modestly positive, with significant dispersion at the sector level.
Corporate Actions
Corporations continue to favor returning cash to shareholders over new investments. Capital expenditures are modest and M&A activity has slowed since mid 2015. A more discerning corporate bond market has begun to weigh on financing activity, but companies are still levering balance sheets upward to finance enhanced buyback programs.
Asia China continues its transition toward a consumer-based economy with mixed results. Further yuan devaluation and stock market halts spooked investors early in the quarter, but signs of renewed fiscal support helped spark a rebound. The rest of emerging Asia fared well. Meanwhile, Japan suffered a difficult quarter as the yen strengthened despite aggressive monetary policy. Wages and consumer spending remain stubbornly low.
Emerging Markets
Emerging markets stocks fared well during the quarter, outperforming developed markets during both the market decline and rebound. Brazil led the way higher as investors reacted positively to the increasing likelihood that President Dilma Rousseff will be impeached, while other commodity-driven areas rallied as oil moved back above $40 late in the quarter.
Fixed Income Bonds returns were broadly positive during the quarter. The Fed’s more dovish stance lowered rate expectations, while the late bounce in oil prices eased fears of widespread defaults among energy producers. Spreads remain somewhat elevated but retreated dramatically after spiking in mid-February.
Currencies Most currencies gained ground versus the U.S. dollar, as the Fed indicated a willingness to slow the pace of tightening because of global concerns. The Fed’s dovish approach buoyed emerging markets currencies, including the Chinese yuan, which ended the quarter higher versus the U.S. dollar despite early weakness. Meanwhile, a stronger yen poses a significant headwind to Japanese exporters, leading many to expect new intervention by the Bank of Japan.
Europe European stocks also endured an up and down quarter and finished slightly lower. Banks were hit harshly during the quarter on renewed regulatory concerns and further decreases in interest rates. The late rally came after the ECB showed a willingness to be both aggressive and creative with monetary policy. Expectations remain muted but positive.

4 4
U.S. Economy: Measured growth continues
Sources: Factset, Bureau of Economic Analysis, Bureau of Labor Statistics, T. Rowe Price
Solid payroll gains and a falling unemployment rate suggest labor market health.
U.S. economic growth is likely to stay moderate and trend around 2%. We may see quarterly volatility but the year-on-year rate should be between 2.0% and 2.5%.
Economics Economics
-10
-8
-6
-4
-2
0
2
4
6
8
Perc
enta
ge C
hang
e, A
nnua
l Rat
e
REAL GDP GROWTH January 2006 – December 2015
-1,000
-800
-600
-400
-200
0
200
400
600
0
2
4
6
8
10
12
Mon
thly
Cha
nge
(thou
sand
s)
Une
mpl
oym
ent (
%)
UNEMPLOYMENT AND NON-FARM PAYROLLS January 2006– March 2016
Non-Farm Payrolls (R)
Unemployment (L)
5 5
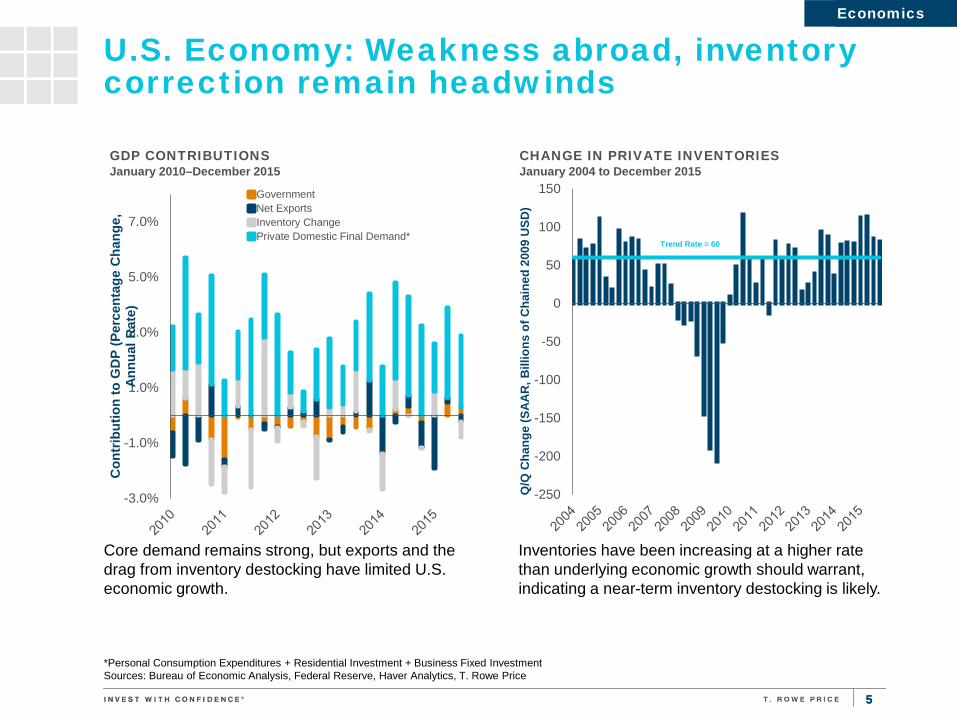
U.S. Economy: Weakness abroad, inventory correction remain headwinds
*Personal Consumption Expenditures + Residential Investment + Business Fixed Investment Sources: Bureau of Economic Analysis, Federal Reserve, Haver Analytics, T. Rowe Price
Inventories have been increasing at a higher rate than underlying economic growth should warrant, indicating a near-term inventory destocking is likely.
Core demand remains strong, but exports and the drag from inventory destocking have limited U.S. economic growth.
Economics Economics
-3.0%
-1.0%
1.0%
3.0%
5.0%
7.0%
Con
trib
utio
n to
GD
P (P
erce
ntag
e C
hang
e,
Annu
al R
ate)
GDP CONTRIBUTIONS January 2010–December 2015
GovernmentNet ExportsInventory ChangePrivate Domestic Final Demand*
Trend Rate = 60
-250
-200
-150
-100
-50
0
50
100
150
Q/Q
Cha
nge
(SA
AR
, Bill
ions
of C
hain
ed 2
009
USD
)
CHANGE IN PRIVATE INVENTORIES January 2004 to December 2015
6 6
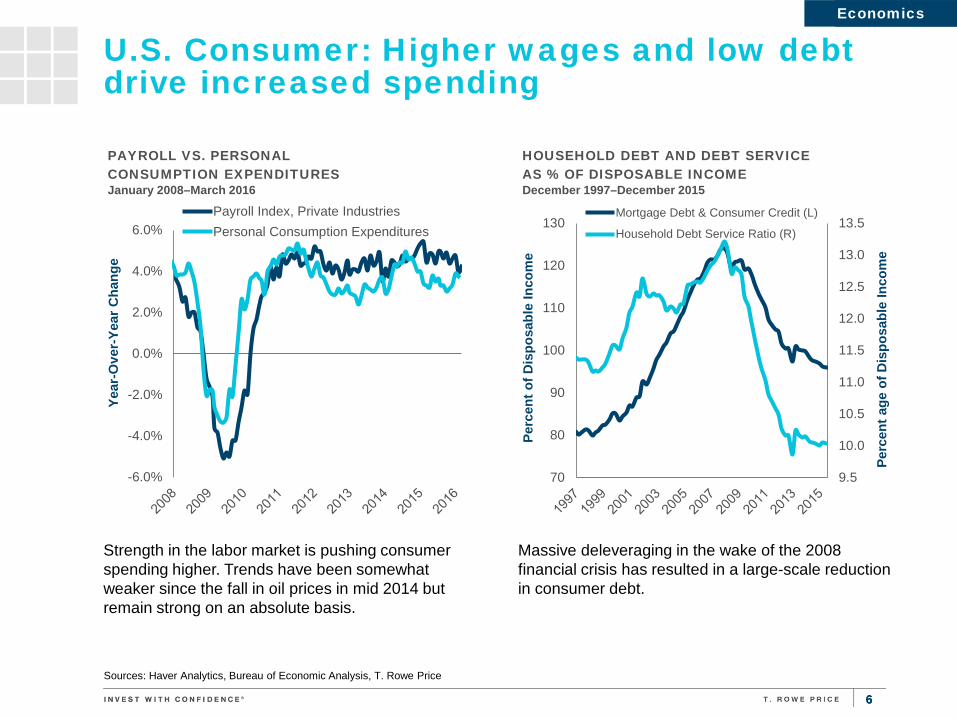
Sources: Haver Analytics, Bureau of Economic Analysis, T. Rowe Price
Strength in the labor market is pushing consumer spending higher. Trends have been somewhat weaker since the fall in oil prices in mid 2014 but remain strong on an absolute basis.
Massive deleveraging in the wake of the 2008 financial crisis has resulted in a large-scale reduction in consumer debt.
Economics Economics
U.S. Consumer: Higher wages and low debt drive increased spending
9.5
10.0
10.5
11.0
11.5
12.0
12.5
13.0
13.5
70
80
90
100
110
120
130
Perc
ent a
ge o
f Dis
posa
ble
Inco
me
Perc
ent o
f Dis
posa
ble
Inco
me
HOUSEHOLD DEBT AND DEBT SERVICE AS % OF DISPOSABLE INCOME December 1997–December 2015
Mortgage Debt & Consumer Credit (L)
Household Debt Service Ratio (R)
-6.0%
-4.0%
-2.0%
0.0%
2.0%
4.0%
6.0%
Year
-Ove
r-Ye
ar C
hang
e
PAYROLL VS. PERSONAL CONSUMPTION EXPENDITURES January 2008–March 2016
Payroll Index, Private IndustriesPersonal Consumption Expenditures

7 7
U.S. Economy: Business spending and housing rebound should support growth
Sources: Bureau of Economic Analysis, Bureau of Labor Statistics, Census Bureau, Haver Analytics, T. Rowe Price
Thus far in this cycle, we have not seen housing starts outpace household formation, meaning there is significant room for housing to accelerate.
A cutback in capital expenditures in the oil industry accounts for the decline in investment in structures over the past 4 quarters. This decline has created a significant drag in growth since mid-2014, a drag which may begin to subside in the near term.
Economics Economics
-1.0%
-0.5%
0.0%
0.5%
1.0%
1.5%
2.0%
2.5%
Con
trib
utio
n to
GD
P
BUSINESS FIXED INVESTMENT January 2010–December 2015
Structures Equipment Intellectual Property
0
500
1000
1500
2000
0
400
800
1200
1600
2000
2400
12 Q
uart
er C
hang
e, A
nnua
lized
Thou
sand
s of
Uni
ts, S
AA
R
HOUSEHOLD FORMATION VS. HOUSING STARTS January 2000–December 2015 Housing Starts (L) Households (R)

8 8
U.S. Fiscal Environment: Government spending is a modest tailwind to growth
Sources: Haver Analytics, Bureau of Economic Analysis, Department of the Treasury, T. Rowe Price
Government finances and employment trends continue to improve. Government spending remains a slight contributor to, rather than a drag on, economic growth.
State and local sectors are making a modest contribution to growth.
Economics Economics
-200
-150
-100
-50
0
50
100
150
-1.0
-0.5
0.0
0.5
1.0
Qua
rter
ly C
hang
e in
Tho
usan
ds
Perc
enta
ge C
hang
e., A
R, 4
Qtr
. Avg
.
GOVERNMENT EXPENDITURES VS. GOVERNMENT EMPLOYMENT January 2007–December 2015
Gov't. Expenditures—Contribution to Real GDP (L)
Gov't. Employment (R)
-8
-6
-4
-2
0
2
4
6
8
10
Perc
enta
ge C
hang
e, Y
ear A
go
REAL GOVERNMENT EXPENDITURES January 2007–December 2015
State and Local Federal

9 9
U.S. Labor Market: Strong but moderating
Employment trends remain broadly positive, however the pace of job creation has moderated since the beginning of 2015.
The unemployment rate is approaching the lows from the prior economic cycle. Meanwhile, the reduction in “under employed” workers has been accelerating since the beginning of 2013, after showing little improvement in the early stages of the recovery.
Economics Economics
0
50
100
150
200
250
300
350
400
450
Cha
nge
in T
hous
ands
PAYROLL EMPLOYMENT January 2011–March 2016
Payroll Employment 12-month average
3
4
5
6
7
8
9
10
11
Perc
ent a
ge o
f Lab
or F
orce
UNEMPLOYMENT RATE VS. PART TIME January 2004–March 2016 Official (U3) Unemployment Rate
Marginally Attached and Involuntary Part TimeWorkers
Sources: Haver Analytics, Bureau of Labor Statistics, T. Rowe Price

10 10
U.S. Inflation: Rising labor costs should begin to affect inflation
PCE = Personal Consumption Expenditures Source: Bureau of Economic Analysis, Bureau of Labor Statistics, Haver Analytics, T. Rowe Price
Economics Economics
-2
-1
0
1
2
3
4
5
Year
-Ove
r-Ye
ar p
erce
ntag
e C
hang
e
PERSONAL CONSUMPTION EXPENDITURES (PCE) PRICE INDEX January 2006–February 2016
PCE Price IndexPCE Price Index Excl. Food & Energy
The increase in labor costs is beginning to have an effect on inflation as low unemployment and a tight labor market put upward pressure on wages.
The collapse in energy prices is keeping core inflation below the Fed’s 2% longer-term target. This effect is likely to fade as energy prices stabilize.
-3
-2
-1
0
1
2
3
4
-3
-2
-1
0
1
2
3
4
Year
-Ove
r-Ye
ar %
Cha
nge
8-Q
uart
er A
nnua
l Per
cent
age
Cha
nge
LABOR COSTS VS. PERSONAL CONSUMPTION EXPENDITURES (PCE) January 2006–December 2015
PCE Price Index Excl. Food & Energy* (R)Unit Labor Costs (L)
11 11
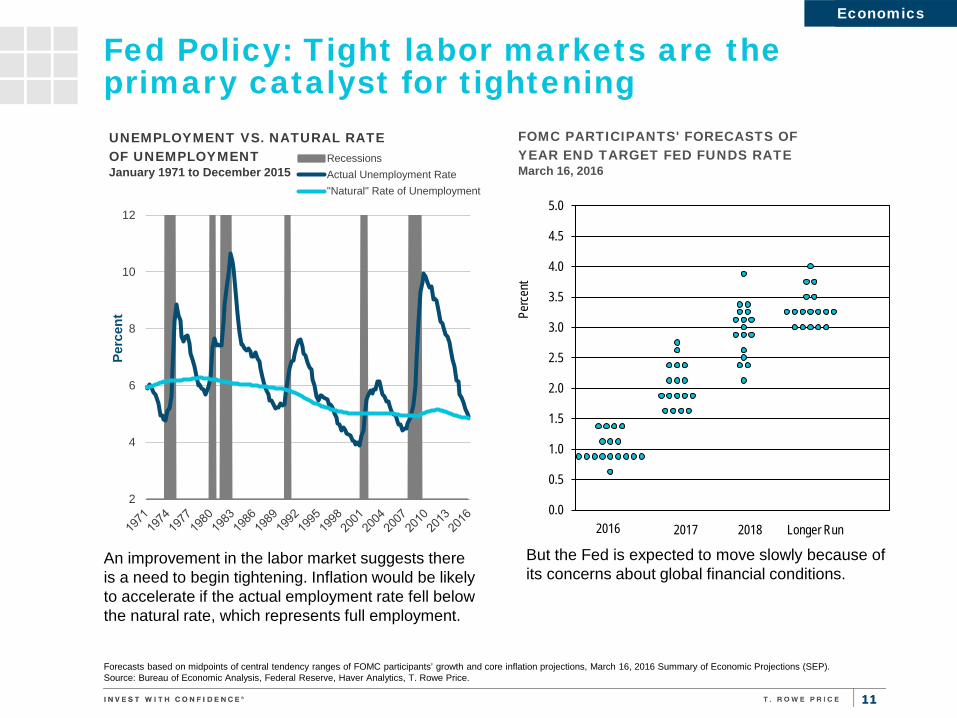
Fed Policy: Tight labor markets are the primary catalyst for tightening
An improvement in the labor market suggests there is a need to begin tightening. Inflation would be likely to accelerate if the actual employment rate fell below the natural rate, which represents full employment.
But the Fed is expected to move slowly because of its concerns about global financial conditions.
Economics Economics
Forecasts based on midpoints of central tendency ranges of FOMC participants’ growth and core inflation projections, March 16, 2016 Summary of Economic Projections (SEP). Source: Bureau of Economic Analysis, Federal Reserve, Haver Analytics, T. Rowe Price.
2
4
6
8
10
12
Perc
ent
UNEMPLOYMENT VS. NATURAL RATE OF UNEMPLOYMENT January 1971 to December 2015
RecessionsActual Unemployment Rate"Natural" Rate of Unemployment
0.0
0.5
1.0
1.5
2.0
2.5
3.0
3.5
4.0
4.5
5.0
Perce
nt
FOMC PARTICIPANTS' FORECASTS OF YEAR END TARGET FED FUNDS RATE March 16, 2016
2016 2017 2018 Longer Run

12 12
-25%
-20%
-15%
-10%
-5%
0%
5%
10%
15%
20%
25%
Year
-Ove
r-Ye
ar %
Cha
nge
BANK CREDIT GROWTH BY TYPE January 2007–December 2015
Consumer Commercial Real EstateResidential Real Estate Commercial and Industrial
U.S. Credit: Credit growth in industrial sector wavering
* All U.S. domestically chartered commercial banks, break adjusted and seasonally adjusted data Sources: Federal Reserve Board, Haver Analytics, T. Rowe Price
Credit growth in most areas continues to accelerate, with the notable exception of commercial and industrial loans. The uptick in consumer credit growth is a positive sign.
Credit growth has been healthy but volatile. Total credit growth moderated slightly in the second half of 2015, primarily due to a slowdown in corporate bond issuance.
Economics Economics
-15%
-10%
-5%
0%
5%
10%
15%
Year
-Ove
r-Ye
ar %
Cha
nge
CREDIT GROWTH BANK AND NON-BANK FINANCING January 2007–December 2015
Commercial bank loans and leases*
Total credit extended to private nonfinancial sectors
13 13
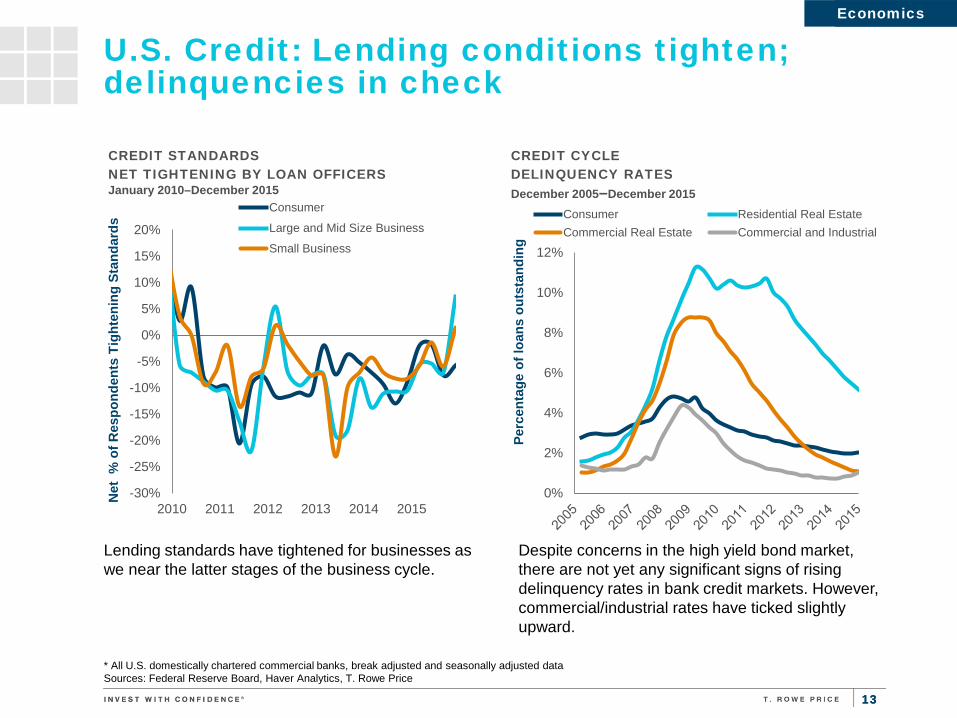
U.S. Credit: Lending conditions tighten; delinquencies in check
* All U.S. domestically chartered commercial banks, break adjusted and seasonally adjusted data Sources: Federal Reserve Board, Haver Analytics, T. Rowe Price
Despite concerns in the high yield bond market, there are not yet any significant signs of rising delinquency rates in bank credit markets. However, commercial/industrial rates have ticked slightly upward.
Lending standards have tightened for businesses as we near the latter stages of the business cycle.
Economics Economics
-30%
-25%
-20%
-15%
-10%
-5%
0%
5%
10%
15%
20%
2010 2011 2012 2013 2014 2015
Net
% o
f Res
pond
ents
Tig
hten
ing
Stan
dard
s
CREDIT STANDARDS NET TIGHTENING BY LOAN OFFICERS January 2010–December 2015
Consumer
Large and Mid Size Business
Small Business
0%
2%
4%
6%
8%
10%
12%
Perc
enta
ge o
f loa
ns o
utst
andi
ng
CREDIT CYCLE DELINQUENCY RATES December 2005–December 2015
Consumer Residential Real EstateCommercial Real Estate Commercial and Industrial
14 14
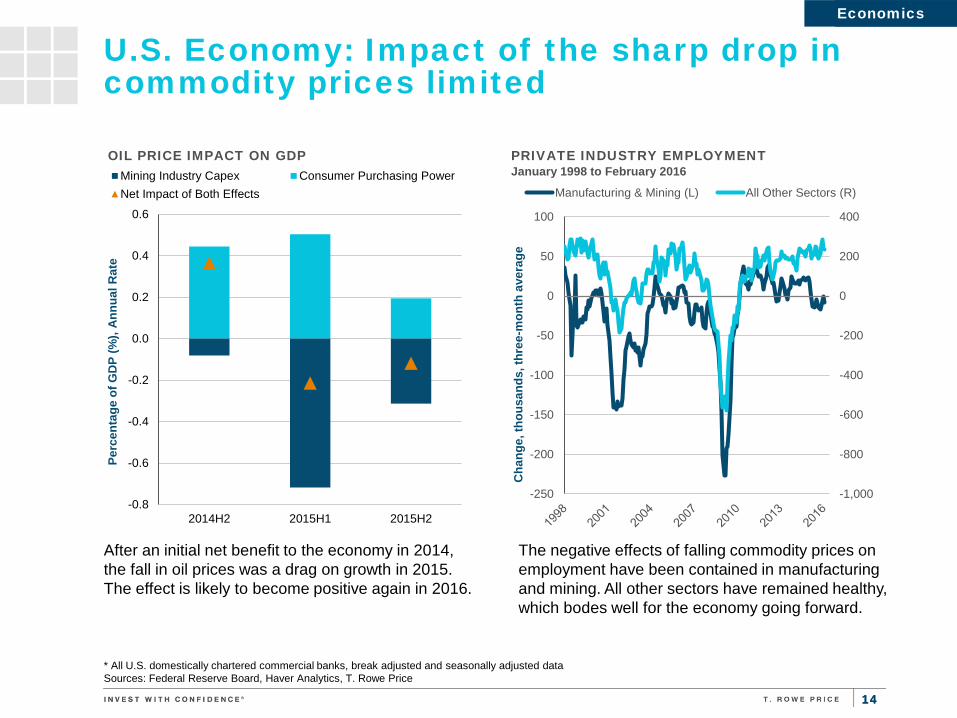
U.S. Economy: Impact of the sharp drop in commodity prices limited
* All U.S. domestically chartered commercial banks, break adjusted and seasonally adjusted data Sources: Federal Reserve Board, Haver Analytics, T. Rowe Price
The negative effects of falling commodity prices on employment have been contained in manufacturing and mining. All other sectors have remained healthy, which bodes well for the economy going forward.
After an initial net benefit to the economy in 2014, the fall in oil prices was a drag on growth in 2015. The effect is likely to become positive again in 2016.
Economics Economics
-0.8
-0.6
-0.4
-0.2
0.0
0.2
0.4
0.6
2014H2 2015H1 2015H2
Perc
enta
ge o
f GD
P (%
), A
nnua
l Rat
e
OIL PRICE IMPACT ON GDP Mining Industry Capex Consumer Purchasing PowerNet Impact of Both Effects
-1,000
-800
-600
-400
-200
0
200
400
-250
-200
-150
-100
-50
0
50
100
Cha
nge,
thou
sand
s, th
ree-
mon
th a
vera
ge
PRIVATE INDUSTRY EMPLOYMENT January 1998 to February 2016
Manufacturing & Mining (L) All Other Sectors (R)
15 15
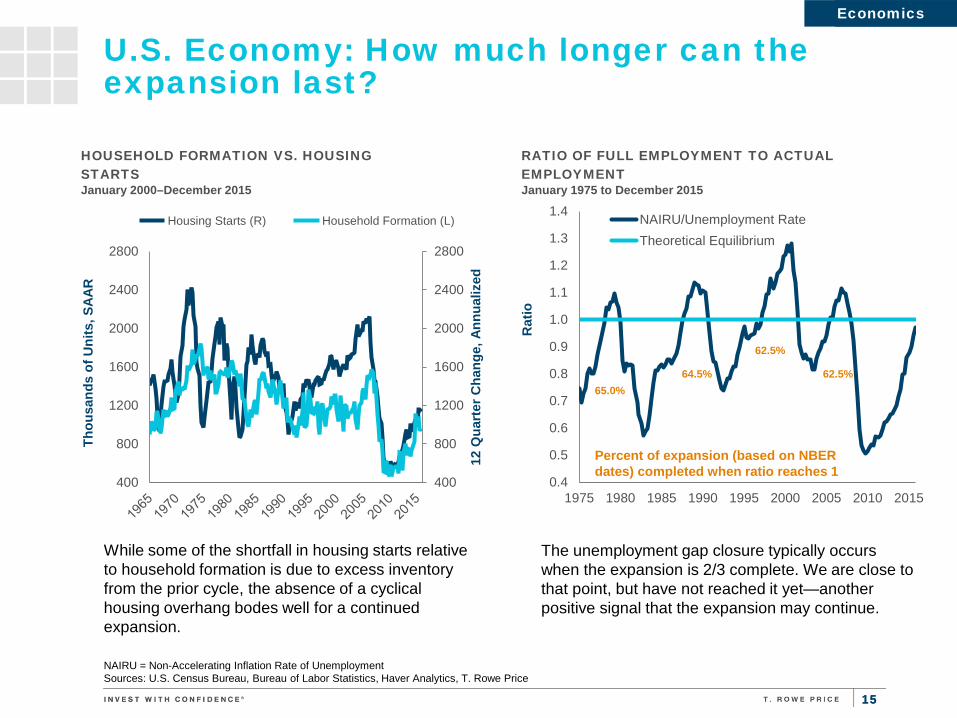
U.S. Economy: How much longer can the expansion last?
NAIRU = Non-Accelerating Inflation Rate of Unemployment Sources: U.S. Census Bureau, Bureau of Labor Statistics, Haver Analytics, T. Rowe Price
The unemployment gap closure typically occurs when the expansion is 2/3 complete. We are close to that point, but have not reached it yet—another positive signal that the expansion may continue.
While some of the shortfall in housing starts relative to household formation is due to excess inventory from the prior cycle, the absence of a cyclical housing overhang bodes well for a continued expansion.
Economics Economics
400
800
1200
1600
2000
2400
2800
400
800
1200
1600
2000
2400
2800
12 Q
uart
er C
hang
e, A
nnua
lized
Thou
sand
s of
Uni
ts, S
AA
R
HOUSEHOLD FORMATION VS. HOUSING STARTS January 2000–December 2015 Housing Starts (R) Household Formation (L)
0.4
0.5
0.6
0.7
0.8
0.9
1.0
1.1
1.2
1.3
1.4
1975 1980 1985 1990 1995 2000 2005 2010 2015
Rat
io
RATIO OF FULL EMPLOYMENT TO ACTUAL EMPLOYMENT January 1975 to December 2015
NAIRU/Unemployment RateTheoretical Equilibrium
Percent of expansion (based on NBER dates) completed when ratio reaches 1
65.0% 64.5%
62.5%
62.5%
16 16
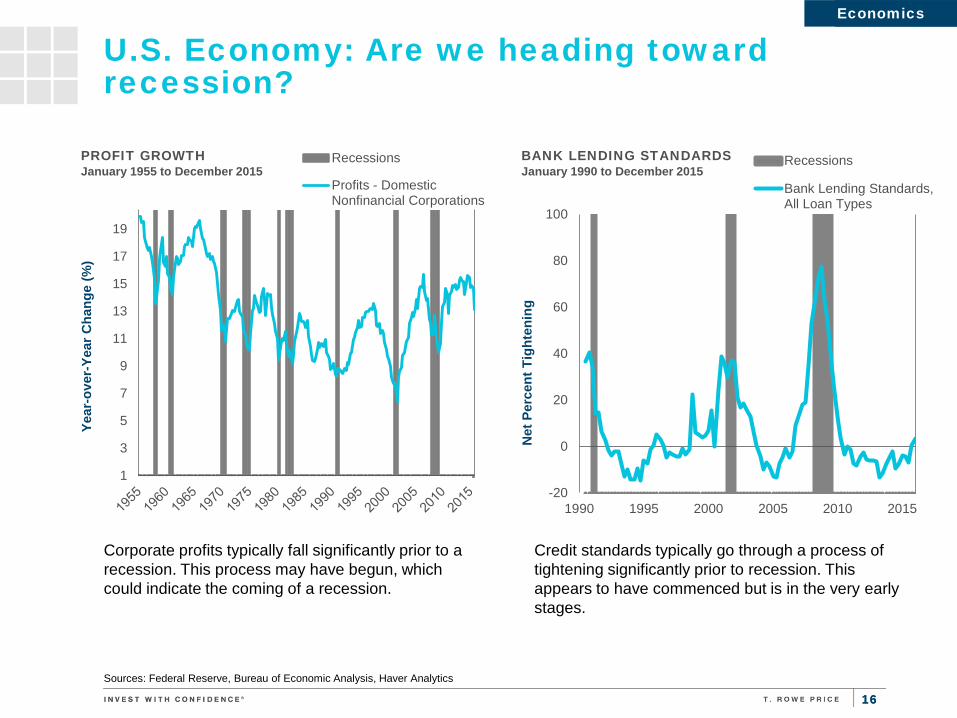
U.S. Economy: Are we heading toward recession?
Sources: Federal Reserve, Bureau of Economic Analysis, Haver Analytics
Credit standards typically go through a process of tightening significantly prior to recession. This appears to have commenced but is in the very early stages.
Corporate profits typically fall significantly prior to a recession. This process may have begun, which could indicate the coming of a recession.
Economics Economics
-20
0
20
40
60
80
100
1990 1995 2000 2005 2010 2015N
et P
erce
nt T
ight
enin
g
BANK LENDING STANDARDS January 1990 to December 2015
Recessions
Bank Lending Standards,All Loan Types
1
3
5
7
9
11
13
15
17
19
Year
-ove
r-Ye
ar C
hang
e (%
)
PROFIT GROWTH January 1955 to December 2015
Recessions
Profits - DomesticNonfinancial Corporations
17 17
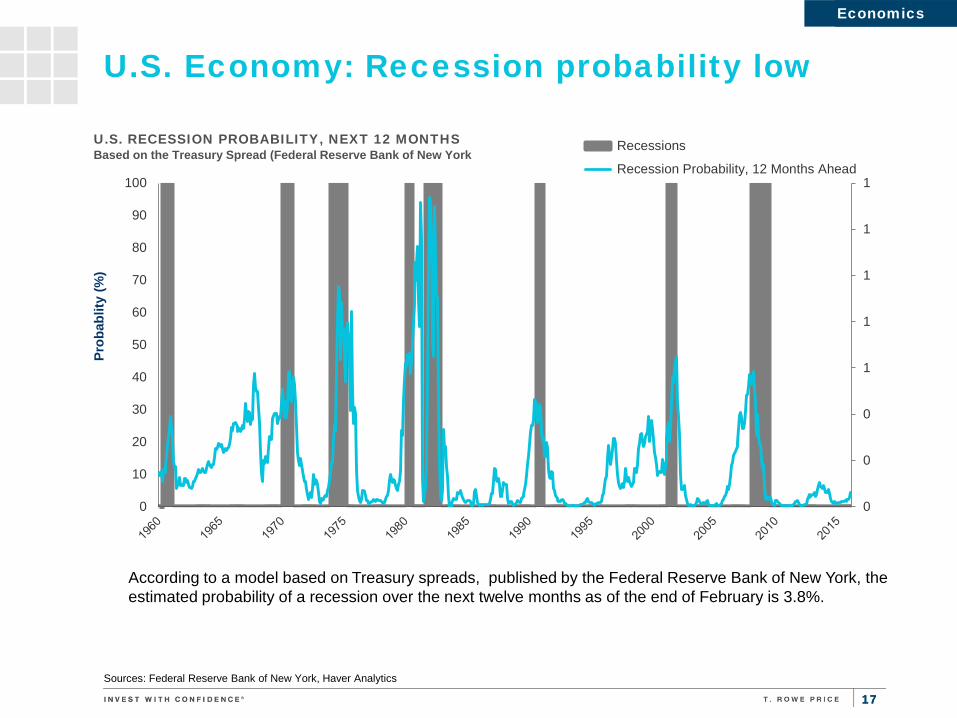
U.S. Economy: Recession probability low
Sources: Federal Reserve Bank of New York, Haver Analytics
According to a model based on Treasury spreads, published by the Federal Reserve Bank of New York, the estimated probability of a recession over the next twelve months as of the end of February is 3.8%.
Economics Economics
0
0
0
1
1
1
1
1
0
10
20
30
40
50
60
70
80
90
100
Prob
ablit
y (%
)
U.S. RECESSION PROBABILITY, NEXT 12 MONTHS Based on the Treasury Spread (Federal Reserve Bank of New York
Recessions
Recession Probability, 12 Months Ahead
18
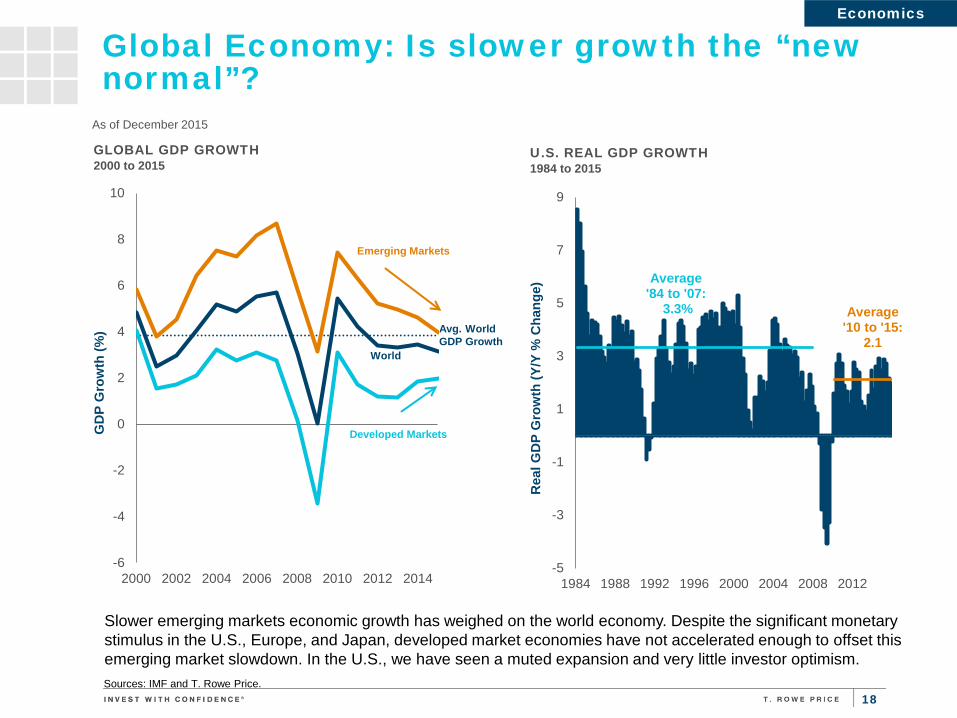
Slower emerging markets economic growth has weighed on the world economy. Despite the significant monetary stimulus in the U.S., Europe, and Japan, developed market economies have not accelerated enough to offset this emerging market slowdown. In the U.S., we have seen a muted expansion and very little investor optimism.
-6
-4
-2
0
2
4
6
8
10
2000 2002 2004 2006 2008 2010 2012 2014
GD
P G
row
th (%
)
GLOBAL GDP GROWTH 2000 to 2015
As of December 2015
Sources: IMF and T. Rowe Price.
Global Economy: Is slower growth the “new normal”?
World
Avg. World GDP Growth
Emerging Markets
Developed Markets
Economics
Average '84 to '07:
3.3% Average '10 to '15:
2.1
-5
-3
-1
1
3
5
7
9
1984 1988 1992 1996 2000 2004 2008 2012
Rea
l GD
P G
row
th (Y
/Y %
Cha
nge)
U.S. REAL GDP GROWTH 1984 to 2015

19 19
Global Economy: Weakness evident among commodity-producing nations
Sources: Haver Analytics, IMF, Markit, T.Rowe Price
GLOBAL MANUFACTURING PMIs As of March 2016
PMI < 50 & Declining m/m PMI < 50 & Increasing m/m PMI > 50 & Declining m/m PMI > 50 & Increasing m/m Scale:
Economics Economics
Mar-16 Feb-16 Jan-16 Dec-15 Nov-15 Oct-15 Sep-15 Aug-15 Jul-15 Jun-15 May-15 Apr-15 Mar-15
Global 50.5 50.0 50.9 50.9 51.2 51.3 50.6 50.7 51.1 51.0 51.3 51.0 51.8
Americas
U.S. 51.5 51.3 52.4 51.2 52.8 54.1 53.1 53.0 53.8 53.6 54.0 54.1 55.7
Canada 51.5 49.4 49.3 47.5 48.6 48.0 48.6 49.4 50.8 51.3 49.8 49.0 48.9
Mexico 53.2 53.1 52.2 52.4 53.0 53.0 52.1 52.4 52.9 52.0 53.3 53.8 53.8
Brazil 46.1 44.5 47.4 45.6 43.8 44.1 47.0 45.8 47.2 46.5 46.0 46.0 46.2
Asia / Pacific
Japan 49.1 50.1 52.3 52.6 52.6 52.4 51.0 51.7 51.2 50.1 50.9 49.9 50.3
Australia 58.1 53.5 51.5 51.9 52.5 50.2 52.1 51.7 50.4 44.2 52.3 48.0 46.3
China 49.7 48.0 48.4 48.3 48.6 48.3 47.2 47.3 47.8 49.4 49.2 48.9 49.6
South Korea 49.5 48.7 49.5 50.7 49.1 49.1 49.2 47.9 47.6 46.1 47.8 48.8 49.2
India 52.4 51.1 51.1 49.1 50.3 50.7 51.2 52.4 52.7 51.3 52.6 51.3 52.1
Indonesia 50.6 48.7 48.9 47.8 46.9 47.8 47.4 48.4 47.3 47.8 47.1 46.7 46.4
Europe / Africa
U.K. 51.0 50.8 52.9 51.9 52.5 55.5 51.5 51.6 51.9 51.4 51.9 51.8 54.3
Euro Area 51.6 51.2 52.3 53.2 52.8 52.3 52.1 52.3 52.4 52.5 52.3 52.0 52.2
Russia 48.3 49.3 49.8 48.7 50.1 50.2 49.1 47.9 48.3 48.7 47.6 48.9 48.1
South Africa 50.5 47.1 43.5 45.5 43.3 48.1 49.0 48.9 51.4 50.0 49.5 47.9 47.9
Turkey 49.2 50.3 50.9 52.2 50.9 49.5 48.8 49.3 50.1 49.0 50.2 48.5 48.0
20 20
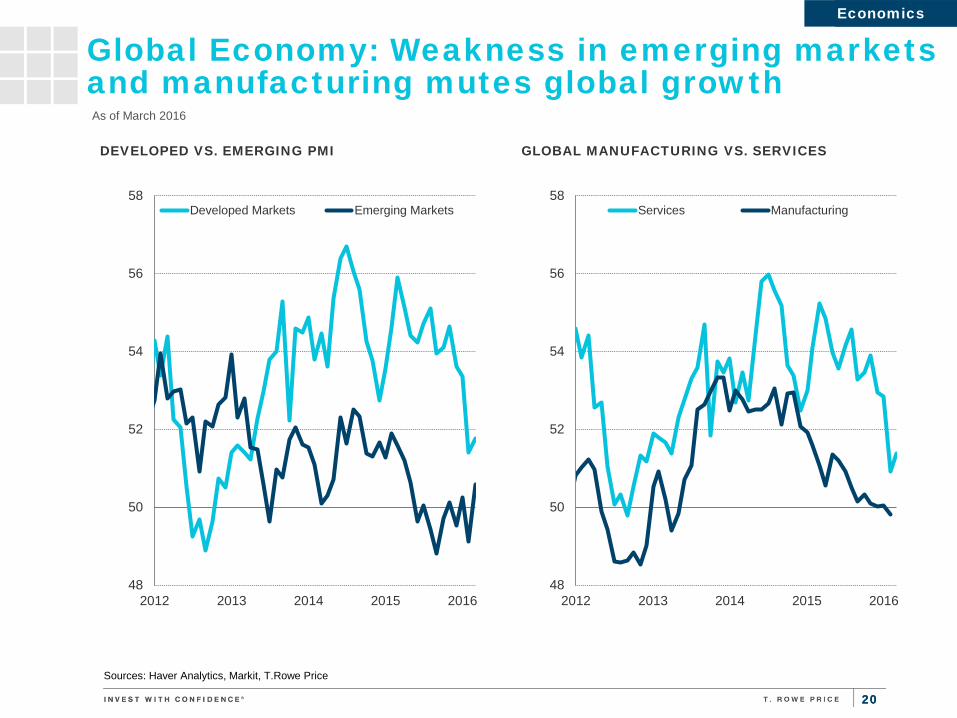
Global Economy: Weakness in emerging markets and manufacturing mutes global growth
Sources: Haver Analytics, Markit, T.Rowe Price
Economics Economics
As of March 2016
48
50
52
54
56
58
2012 2013 2014 2015 2016
DEVELOPED VS. EMERGING PMI
Developed Markets Emerging Markets
48
50
52
54
56
58
2012 2013 2014 2015 2016
GLOBAL MANUFACTURING VS. SERVICES
Services Manufacturing

21 21
Global Economy: Manufacturing weakness is most pronounced in China and the U.S.
Sources: Haver Analytics, Markit, T.Rowe Price
Economics Economics
As of March 2016
44
46
48
50
52
54
56
58
60
2012 2013 2014 2015 2016
GLOBAL PMI
Services Manufacturing
44
46
48
50
52
54
56
58
60
2012 2013 2014 2015 2016
USA PMI
Services Manufacturing
44
46
48
50
52
54
56
58
60
2012 2013 2014 2015 2016
EURO AREA PMI
Services Manufacturing
44
46
48
50
52
54
56
58
60
2012 2013 2014 2015 2016
JAPAN PMI
Services Manufacturing
44
46
48
50
52
54
56
58
60
2012 2013 2014 2015 2016
EMERGING MARKETS PMI
Services Manufacturing
44
46
48
50
52
54
56
58
60
2012 2013 2014 2015 2016
CHINA PMI
Services Manufacturing
22 22
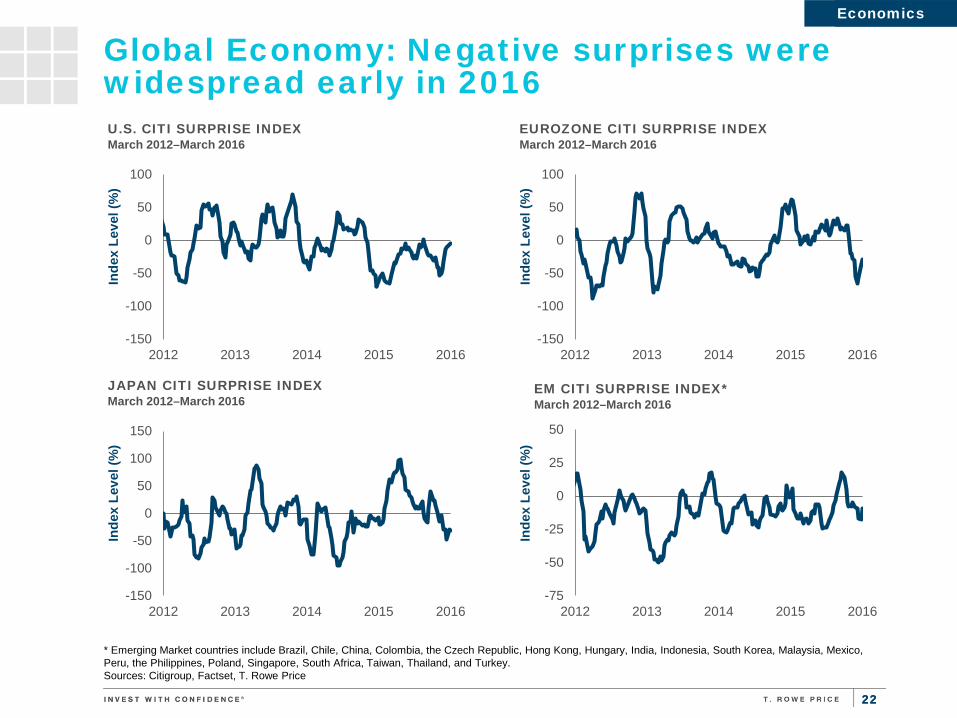
Global Economy: Negative surprises were widespread early in 2016
* Emerging Market countries include Brazil, Chile, China, Colombia, the Czech Republic, Hong Kong, Hungary, India, Indonesia, South Korea, Malaysia, Mexico, Peru, the Philippines, Poland, Singapore, South Africa, Taiwan, Thailand, and Turkey. Sources: Citigroup, Factset, T. Rowe Price
Economics Economics
-150
-100
-50
0
50
100
2012 2013 2014 2015 2016
Inde
x Le
vel (
%)
U.S. CITI SURPRISE INDEX March 2012–March 2016
-150
-100
-50
0
50
100
2012 2013 2014 2015 2016
Inde
x Le
vel (
%)
EUROZONE CITI SURPRISE INDEX March 2012–March 2016
-150
-100
-50
0
50
100
150
2012 2013 2014 2015 2016
Inde
x Le
vel (
%)
JAPAN CITI SURPRISE INDEX March 2012–March 2016
-75
-50
-25
0
25
50
2012 2013 2014 2015 2016
Inde
x Le
vel (
%)
EM CITI SURPRISE INDEX* March 2012–March 2016
23 23
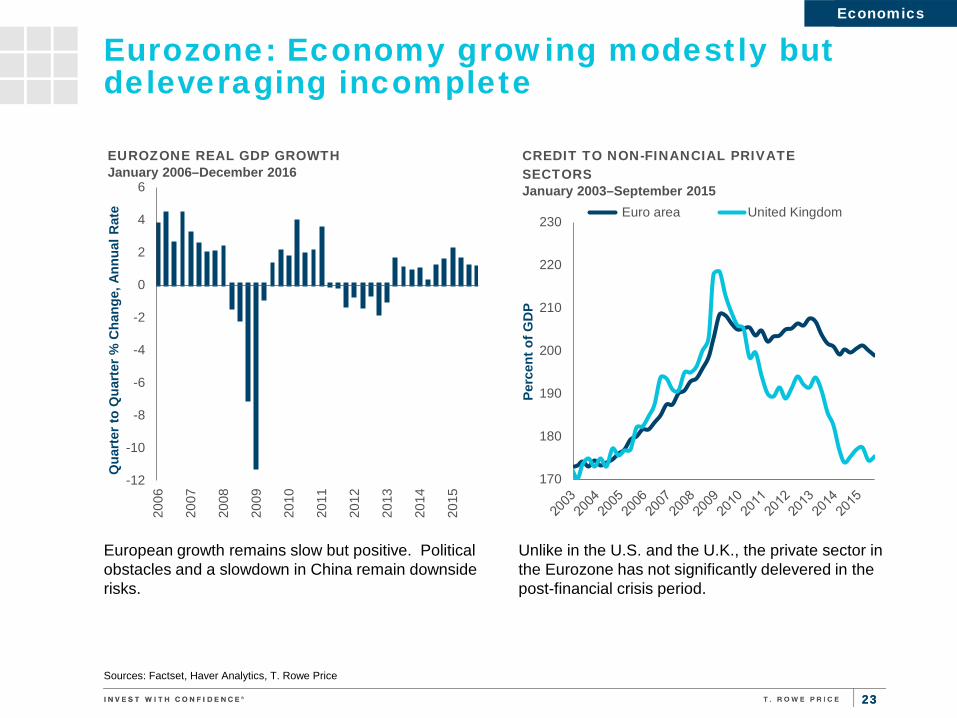
Eurozone: Economy growing modestly but deleveraging incomplete
Sources: Factset, Haver Analytics, T. Rowe Price
Unlike in the U.S. and the U.K., the private sector in the Eurozone has not significantly delevered in the post-financial crisis period.
European growth remains slow but positive. Political obstacles and a slowdown in China remain downside risks.
Economics Economics
-12
-10
-8
-6
-4
-2
0
2
4
6
2006
2007
2008
2009
2010
2011
2012
2013
2014
2015
Qua
rter
to Q
uart
er %
Cha
nge,
Ann
ual R
ate
EUROZONE REAL GDP GROWTH January 2006–December 2016
170
180
190
200
210
220
230
Perc
ent o
f GD
P
CREDIT TO NON-FINANCIAL PRIVATE SECTORS January 2003–September 2015
Euro area United Kingdom

24 24
Eurozone: Quantitative easing a success thus far
Sources: Haver Analytics, Markit, European Central Bank, T. Rowe Price
Better financing conditions allow banks to loosen lending standards, while expectations for renewed economic growth boost demand for consumer and business loans. Demand remains strong but supply is wavering as European banks are struggling with low (or negative) rates and increased regulations.
Money supply is growing, spurred by the ECB’s quantitative easing program. Lower financing costs should encourage companies to increase capital expenditures, thereby boosting economic growth.
Economics Economics
0
2
4
6
8
10
12
14
42
44
46
48
50
52
54
56
58
60
2010 2011 2012 2013 2014 2015 2016
M1
Annu
al G
row
th R
ate
(%)
Euro
zone
PM
I
MONEY SUPPLY VS. PMI January 2010– February 2016
Eurozone Flash PMI (12 month lag)
ECB Money Supply: M1: AnnualGrowth Rate
-80
-60
-40
-20
0
20
40
60
80-80
-60
-40
-20
0
20
40
60
80
2006 2008 2010 2012 2014
Cha
nge
in L
endi
ng S
tand
ards
(%) (
Inve
rted
)
Cha
nge
in D
eman
d (%
)
ECB BANK LENDING SURVEY January 2006– March 2016
Business Loan Demand (L)
Household Loan Demand (L)
Lending Standards for Business (R)
Lending Standards for Households (R)

25 25
Eurozone: Periphery conditions improving
Sources: Haver Analytics, European Central Bank, Banca d’Italia, Banco de Espana, Central Statistics Office Ireland, Greece Ministry of Finance, T. Rowe Price
Many of the periphery countries have also made significant progress in balancing their fiscal budgets, although Italy’s progress has been mixed. These improvements should open the way for the pullback in austerity programs going forward.
The current account balances of periphery countries have benefited from a weaker euro.
Economics Economics
-16
-14
-12
-10
-8
-6
-4
-2
0
2
4
6
2009 2010 2011 2012 2013 2014 2015 2016
Perc
ent o
f GD
P
CURRENT ACCOUNT BALANCES 2009 to 2015
Euro Area Portugal ItalyGreece Spain
-30
-25
-20
-15
-10
-5
0
5
2009 2010 2011 2012 2013 2014 2015
Perc
ent o
f GD
P
FISCAL BALANCES 2009 to 2015
Spain Greece Ireland Italy
26 26
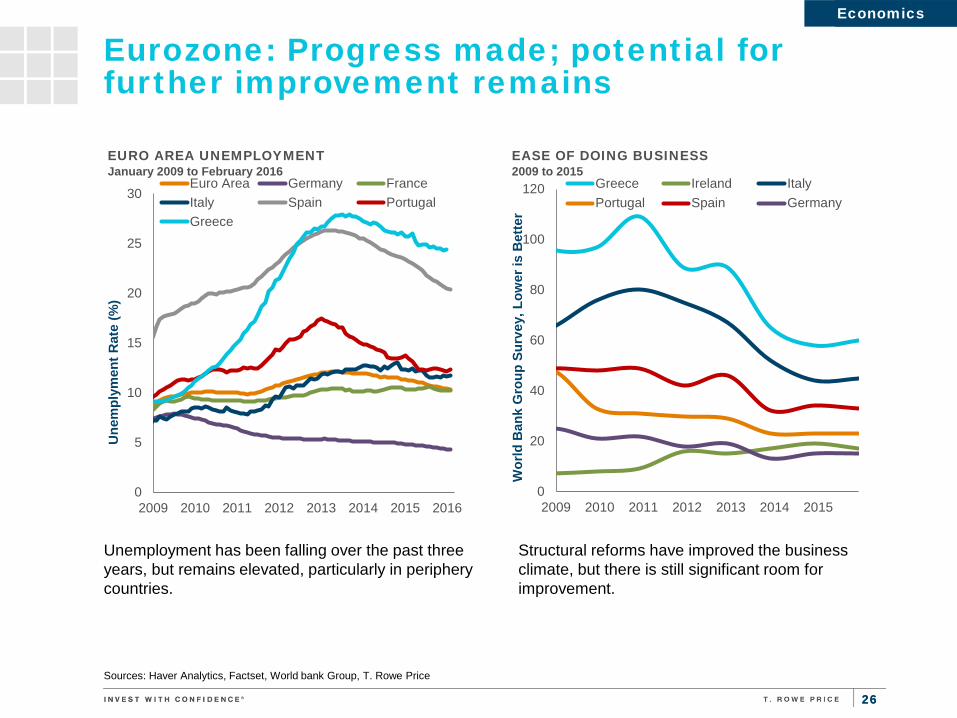
Eurozone: Progress made; potential for further improvement remains
Sources: Haver Analytics, Factset, World bank Group, T. Rowe Price
Structural reforms have improved the business climate, but there is still significant room for improvement.
Unemployment has been falling over the past three years, but remains elevated, particularly in periphery countries.
Economics Economics
0
5
10
15
20
25
30
2009 2010 2011 2012 2013 2014 2015 2016
Une
mpl
ymen
t Rat
e (%
)
EURO AREA UNEMPLOYMENT January 2009 to February 2016
Euro Area Germany FranceItaly Spain PortugalGreece
0
20
40
60
80
100
120
2009 2010 2011 2012 2013 2014 2015W
orld
Ban
k G
roup
Sur
vey,
Low
er is
Bet
ter
EASE OF DOING BUSINESS 2009 to 2015
Greece Ireland ItalyPortugal Spain Germany
27 27
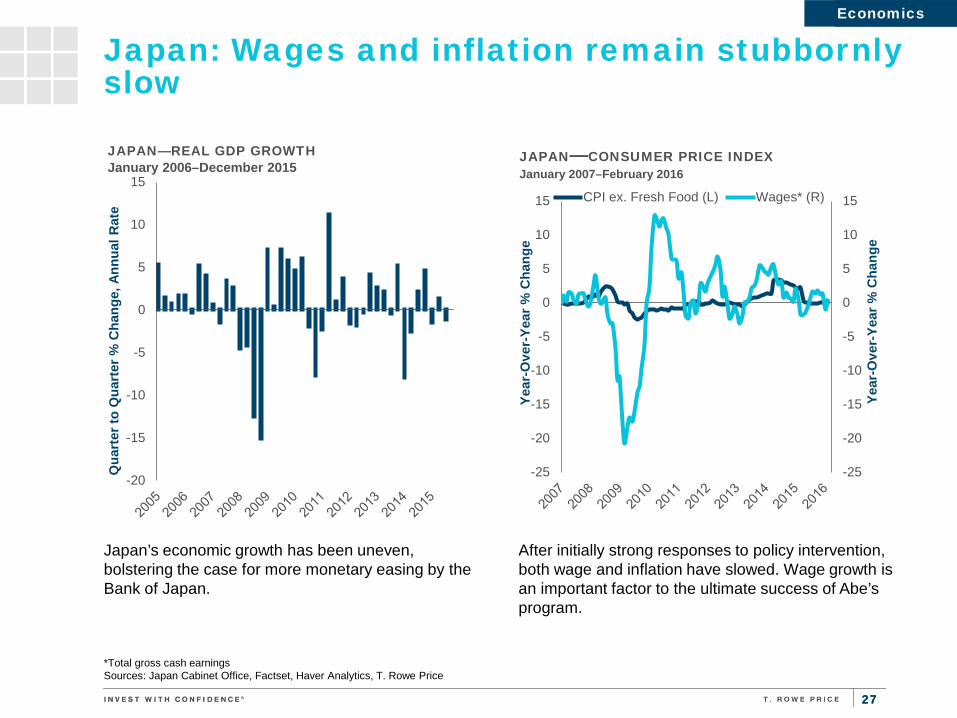
Japan: Wages and inflation remain stubbornly slow
*Total gross cash earnings Sources: Japan Cabinet Office, Factset, Haver Analytics, T. Rowe Price
After initially strong responses to policy intervention, both wage and inflation have slowed. Wage growth is an important factor to the ultimate success of Abe’s program.
Japan’s economic growth has been uneven, bolstering the case for more monetary easing by the Bank of Japan.
Economics Economics
-20
-15
-10
-5
0
5
10
15
Qua
rter
to Q
uart
er %
Cha
nge,
Ann
ual R
ate
JAPAN—REAL GDP GROWTH January 2006–December 2015
-25
-20
-15
-10
-5
0
5
10
15
-25
-20
-15
-10
-5
0
5
10
15
Year
-Ove
r-Ye
ar %
Cha
nge
Year
-Ove
r-Ye
ar %
Cha
nge
JAPAN—CONSUMER PRICE INDEX January 2007–February 2016
CPI ex. Fresh Food (L) Wages* (R)

28 28
Japan: Domestic consumption hampered by tax, demographics
Sources: Cabinet Office of Japan, Japan Ministry of Health, Labour & Welfare, Haver Analytics, T. Rowe Price
Labor force participation has improved in recent years, but the aging of the population remains a significant challenge.
Domestic consumption has stagnated since the consumption tax was increased from 5% to 8% in 2014.
Economics Economics
6,500
6,550
6,600
6,650
6,700
6,750
6,800
6,850
1996 1999 2002 2005 2008 2011 2014Te
n Th
ousa
nd P
erso
ns, S
AA
R
JAPAN - TOTAL LABOR FORCE January 1996 to March 2016
0%
2%
4%
6%
8%
10%
12%
14%
2009 2010 2011 2012 2013 2014 2015 2016
Cum
ulat
ive
Gro
wth
Sin
ce M
arch
200
9
JAPAN - SOURCES OF CONSUMPTION GROWTH 1Q09 to 4Q15 Private Consumption
Government Consumption
29 29
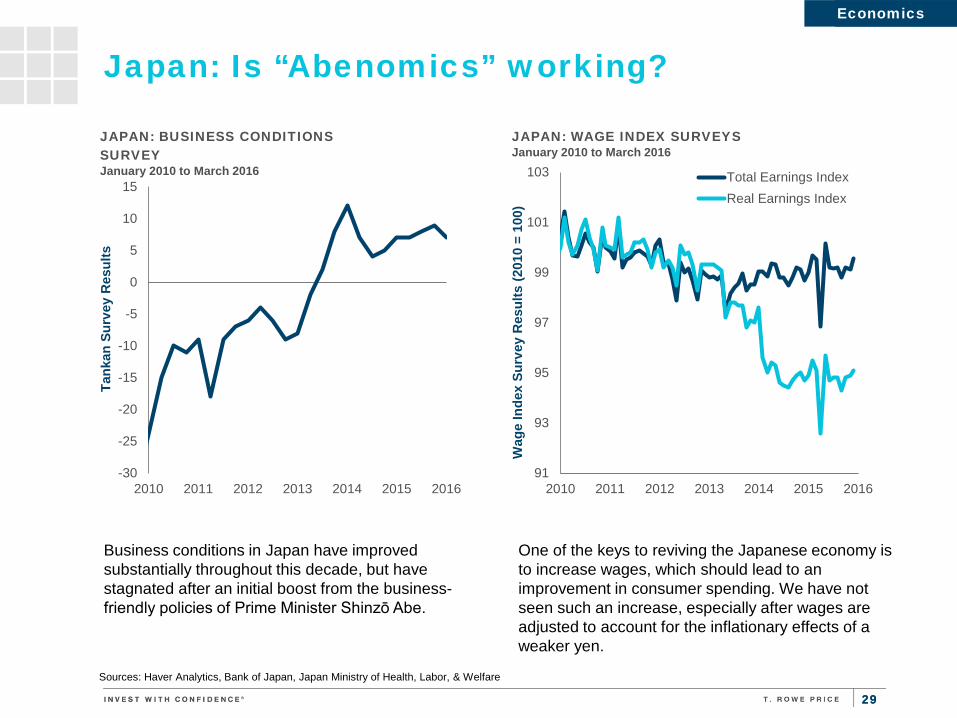
Japan: Is “Abenomics” working?
Sources: Haver Analytics, Bank of Japan, Japan Ministry of Health, Labor, & Welfare
One of the keys to reviving the Japanese economy is to increase wages, which should lead to an improvement in consumer spending. We have not seen such an increase, especially after wages are adjusted to account for the inflationary effects of a weaker yen.
Business conditions in Japan have improved substantially throughout this decade, but have stagnated after an initial boost from the business-friendly policies of Prime Minister Shinzō Abe.
Economics Economics
-30
-25
-20
-15
-10
-5
0
5
10
15
2010 2011 2012 2013 2014 2015 2016
Tank
an S
urve
y R
esul
ts
JAPAN: BUSINESS CONDITIONS SURVEY January 2010 to March 2016
91
93
95
97
99
101
103
2010 2011 2012 2013 2014 2015 2016
Wag
e In
dex
Surv
ey R
esul
ts (2
010
= 10
0)
JAPAN: WAGE INDEX SURVEYS January 2010 to March 2016
Total Earnings IndexReal Earnings Index

30 30
0%
2%
4%
6%
8%
10%
12%
14%
16%
18%
20%
2010 2011 2012 2013 2014 2015 2016
Year
-Ove
r-Ye
ar P
erce
ntag
e C
hang
e
EMERGING MARKETS INFLATION January 2010–March 2016
India Brazil China Russia
0
2
4
6
8
10
12
14
16
18
20
2010 2011 2012 2013 2014 2015 Pe
rcen
t (%
)
EMERGING MARKETS CENTRAL BANK RATES January 2010–March 2016
India Brazil China Russia
Emerging Markets: Divergent monetary paths
Sources: Various National Statistical Agencies, Haver Analytics, T. Rowe Price
As growth slows and inflation moderates, many central banks in emerging markets are shifting from tightening to easing monetary policies.
Inflation levels vary significantly across emerging markets. Inflation is accelerating in countries that are most vulnerable to currency devaluation, although this effect has moderated thus far in 2016.
Central Bank policy rate: All Items CPI:
Economics Economics

31 31
Emerging Markets: Commodity producers face elevated risks
Private credit (non-government) has grown significantly in emerging markets since 2007, but rates vary widely among countries. Most emerging markets have relatively small debt loads relative to developed markets. Markets that have issued new debt to build capacity for commodity production are most at risk, especially if commodity prices remain low.
Economics Economics
Sources: Bank for International Settlements, Haver Analytics, T. Rowe Price
-50
0
50
100
150
200
Priv
ate
Non
-Fin
anci
al C
redi
t as
% o
f GD
P PRIVATE NON-FINANCIAL CREDIT
1997 2007 Current Change since 2007
32 32
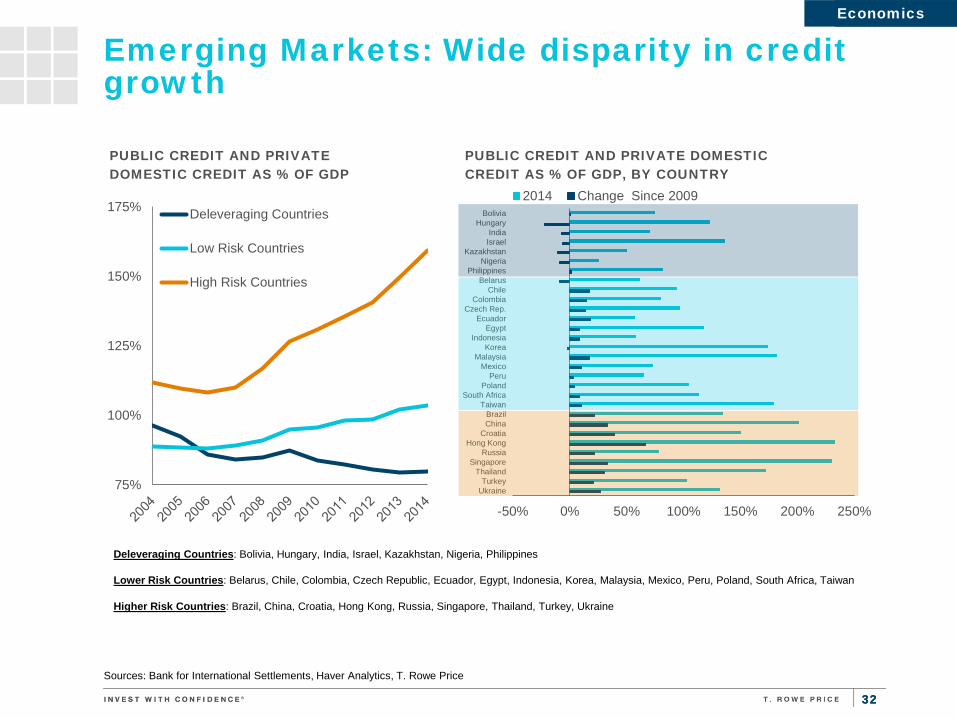
Emerging Markets: Wide disparity in credit growth
Deleveraging Countries: Bolivia, Hungary, India, Israel, Kazakhstan, Nigeria, Philippines
Lower Risk Countries: Belarus, Chile, Colombia, Czech Republic, Ecuador, Egypt, Indonesia, Korea, Malaysia, Mexico, Peru, Poland, South Africa, Taiwan
Higher Risk Countries: Brazil, China, Croatia, Hong Kong, Russia, Singapore, Thailand, Turkey, Ukraine
Economics Economics
Sources: Bank for International Settlements, Haver Analytics, T. Rowe Price
75%
100%
125%
150%
175%
PUBLIC CREDIT AND PRIVATE DOMESTIC CREDIT AS % OF GDP
Deleveraging Countries
Low Risk Countries
High Risk Countries
-50% 0% 50% 100% 150% 200% 250%
BoliviaHungary
IndiaIsrael
KazakhstanNigeria
PhilippinesBelarus
ChileColombia
Czech Rep.Ecuador
EgyptIndonesia
KoreaMalaysia
MexicoPeru
PolandSouth Africa
TaiwanBrazilChina
CroatiaHong Kong
RussiaSingapore
ThailandTurkey
Ukraine
PUBLIC CREDIT AND PRIVATE DOMESTIC CREDIT AS % OF GDP, BY COUNTRY
2014 Change Since 2009
33 33
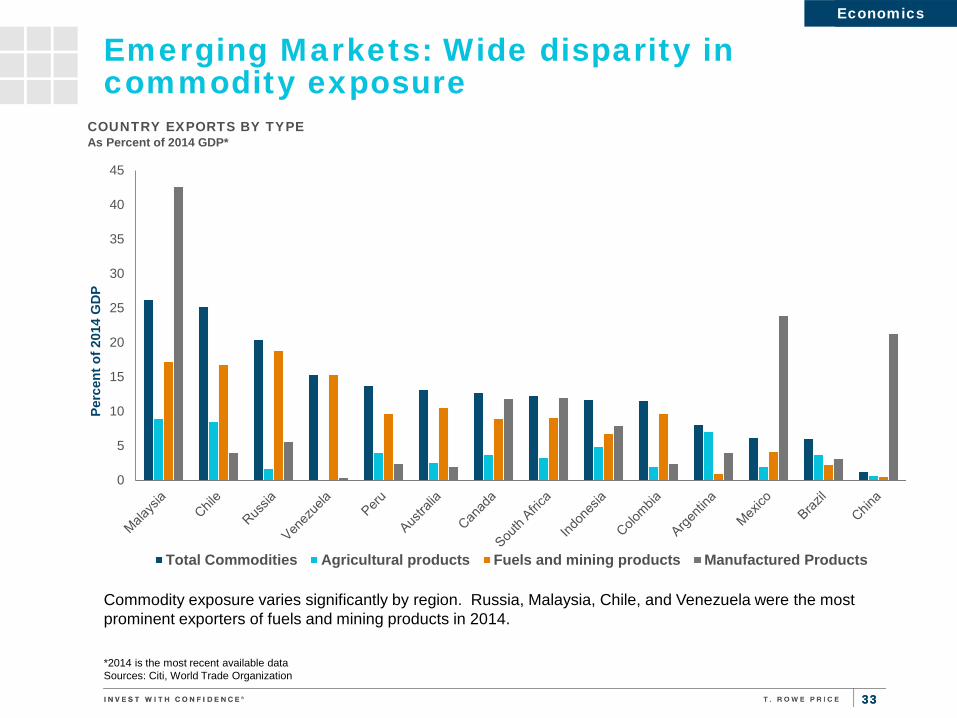
Emerging Markets: Wide disparity in commodity exposure
Economics Economics
*2014 is the most recent available data Sources: Citi, World Trade Organization
0
5
10
15
20
25
30
35
40
45
Perc
ent o
f 201
4 G
DP
COUNTRY EXPORTS BY TYPE As Percent of 2014 GDP*
Total Commodities Agricultural products Fuels and mining products Manufactured Products
Commodity exposure varies significantly by region. Russia, Malaysia, Chile, and Venezuela were the most prominent exporters of fuels and mining products in 2014.
34 34
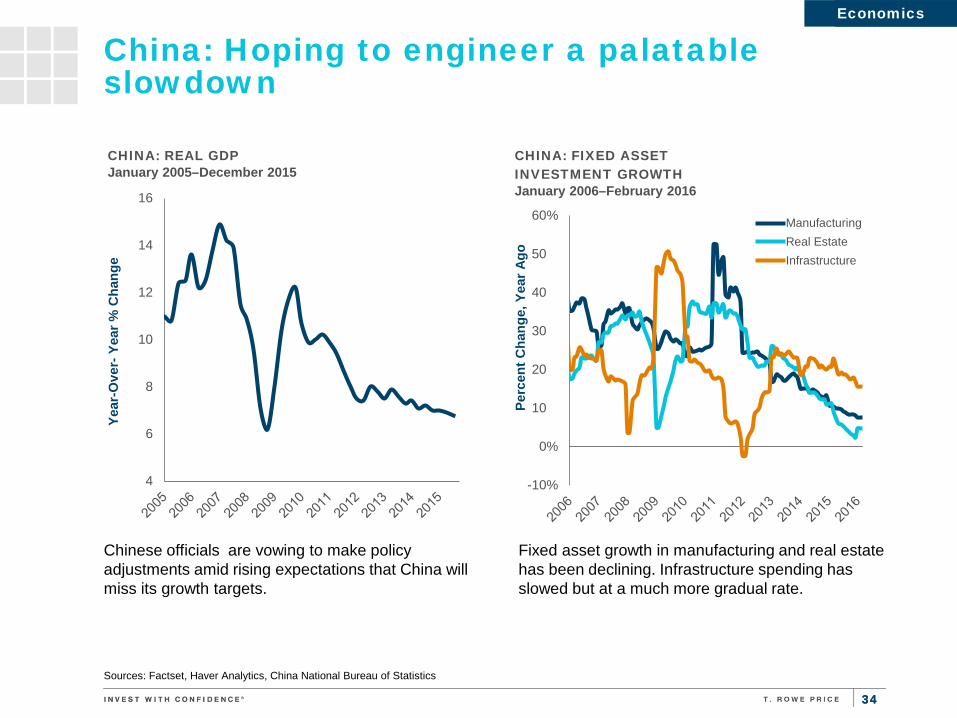
China: Hoping to engineer a palatable slowdown
Sources: Factset, Haver Analytics, China National Bureau of Statistics
Chinese officials are vowing to make policy adjustments amid rising expectations that China will miss its growth targets.
Economics Economics
4
6
8
10
12
14
16
Year
-Ove
r- Y
ear %
Cha
nge
CHINA: REAL GDP January 2005–December 2015
-10%
0%
10%
20%
30%
40%
50%
60%
Perc
ent C
hang
e, Y
ear A
go
CHINA: FIXED ASSET INVESTMENT GROWTH January 2006–February 2016
ManufacturingReal EstateInfrastructure
Fixed asset growth in manufacturing and real estate has been declining. Infrastructure spending has slowed but at a much more gradual rate.
35 35
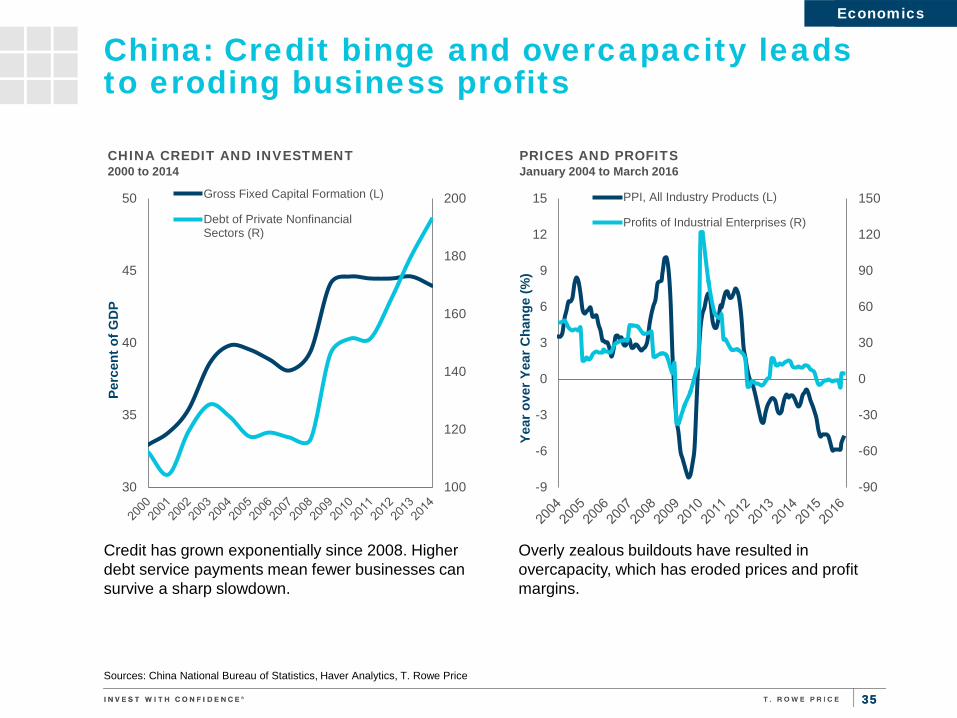
China: Credit binge and overcapacity leads to eroding business profits
Credit has grown exponentially since 2008. Higher debt service payments mean fewer businesses can survive a sharp slowdown.
Economics Economics
Overly zealous buildouts have resulted in overcapacity, which has eroded prices and profit margins.
100
120
140
160
180
200
30
35
40
45
50
Perc
ent o
f GD
P
CHINA CREDIT AND INVESTMENT 2000 to 2014
Gross Fixed Capital Formation (L)
Debt of Private NonfinancialSectors (R)
Sources: China National Bureau of Statistics, Haver Analytics, T. Rowe Price
-90
-60
-30
0
30
60
90
120
150
-9
-6
-3
0
3
6
9
12
15
Year
ove
r Yea
r Cha
nge
(%)
PRICES AND PROFITS January 2004 to March 2016
PPI, All Industry Products (L)
Profits of Industrial Enterprises (R)
36 36
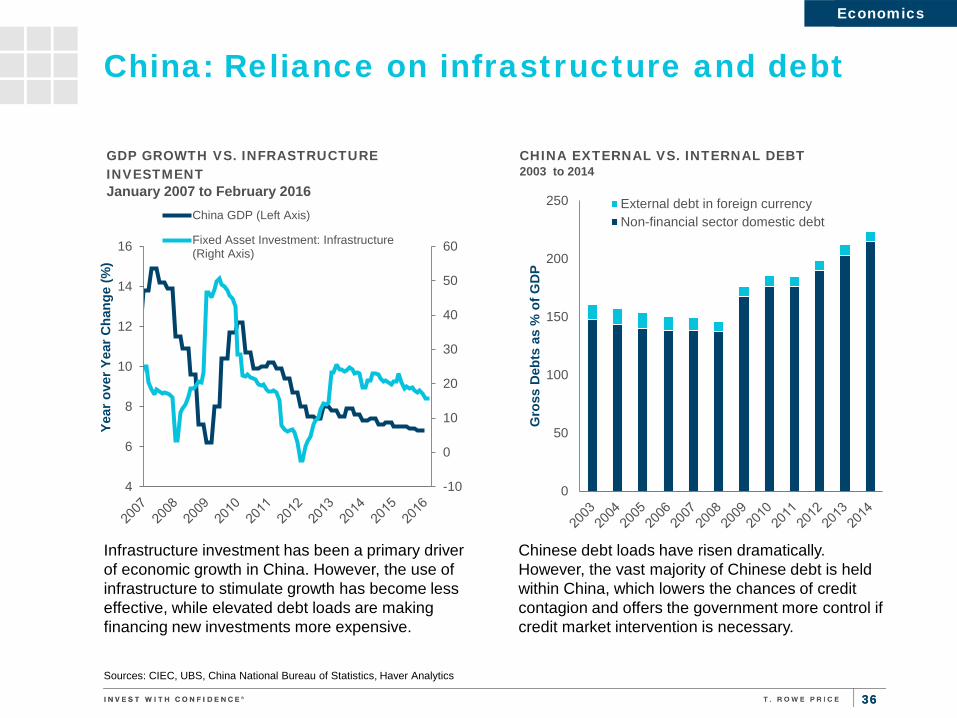
China: Reliance on infrastructure and debt
Sources: CIEC, UBS, China National Bureau of Statistics, Haver Analytics
Infrastructure investment has been a primary driver of economic growth in China. However, the use of infrastructure to stimulate growth has become less effective, while elevated debt loads are making financing new investments more expensive.
Economics Economics
Chinese debt loads have risen dramatically. However, the vast majority of Chinese debt is held within China, which lowers the chances of credit contagion and offers the government more control if credit market intervention is necessary.
0
50
100
150
200
250
Gro
ss D
ebts
as
% o
f GD
P
CHINA EXTERNAL VS. INTERNAL DEBT 2003 to 2014
External debt in foreign currencyNon-financial sector domestic debt
-10
0
10
20
30
40
50
60
4
6
8
10
12
14
16
Year
ove
r Yea
r Cha
nge
(%)
GDP GROWTH VS. INFRASTRUCTURE INVESTMENT January 2007 to February 2016
China GDP (Left Axis)
Fixed Asset Investment: Infrastructure(Right Axis)
37 37
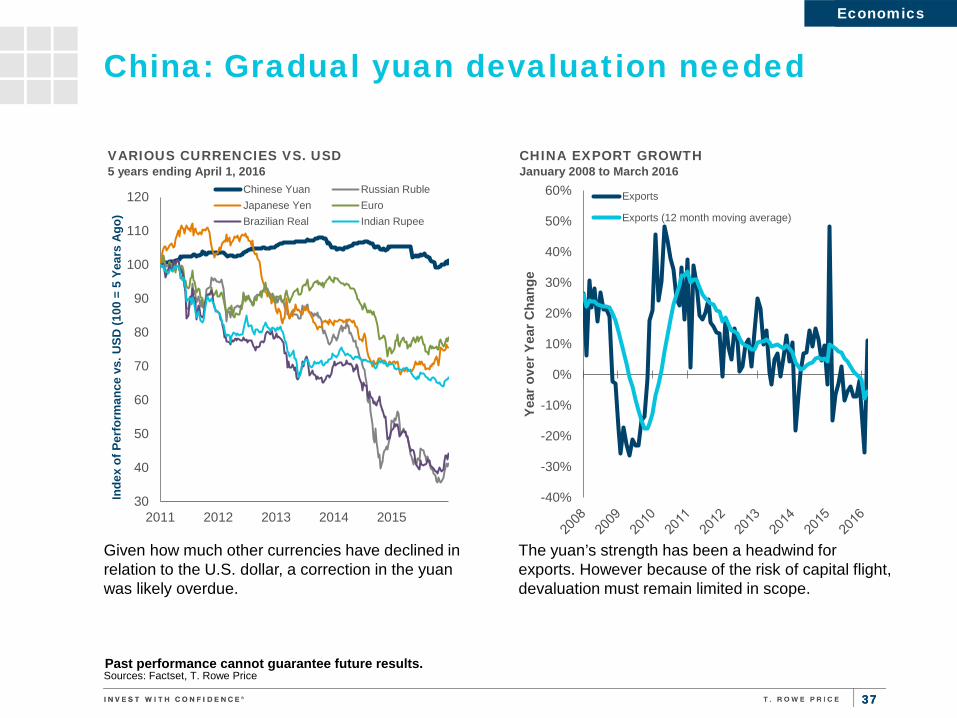
China: Gradual yuan devaluation needed
Given how much other currencies have declined in relation to the U.S. dollar, a correction in the yuan was likely overdue.
Economics Economics
The yuan’s strength has been a headwind for exports. However because of the risk of capital flight, devaluation must remain limited in scope.
Sources: Factset, T. Rowe Price Past performance cannot guarantee future results.
30
40
50
60
70
80
90
100
110
120
2011 2012 2013 2014 2015
Inde
x of
Per
form
ance
vs.
USD
(100
= 5
Yea
rs A
go)
VARIOUS CURRENCIES VS. USD 5 years ending April 1, 2016
Chinese Yuan Russian RubleJapanese Yen EuroBrazilian Real Indian Rupee
-40%
-30%
-20%
-10%
0%
10%
20%
30%
40%
50%
60%
Year
ove
r Yea
r Cha
nge
CHINA EXPORT GROWTH January 2008 to March 2016
Exports
Exports (12 month moving average)

38 38
China: Capital outflow concerns
Initial moves to devalue the yuan/renminbi versus the dollar have caused significant capital outflow, as investors fear further devaluation. This has forced China to spend significant currency reserves stabilizing the currency, but more than $3 trillion in reserves remains.
Economics Economics
However, it is notable that capital flows into China have slowed significantly. This is a stark change in the environment in China, where significant capital inflows have been the norm for many years.
Sources: Haver Analytics, People’s Bank of China, State Administration of Foreign Exchange
-250
-200
-150
-100
-50
0
50
100
150
200
250
0
500
1,000
1,500
2,000
2,500
3,000
3,500
4,000
4,500
Mill
ions
of U
.S. D
olla
rs
CHINA: FOREIGN CURRENCY RESERVES January 2000 to March 2016
Foreign Currency Reserves (L)Quarterly Change (R)
-1,000
-500
0
500
1,000
1,500
2,000
Mill
ions
of U
.S. D
olla
rs
CHINA: CAPITAL ACCOUNT January 2007 to December 2015

39 39
China: Shifting to a consumption economy?
China’s economy is transitioning toward domestic-led growth model reliant on service-oriented industries and away from an export-driven mode that emphasized external demand.
Economics Economics
Electricity consumption sheds further light on the nature of the shift. Household electricity use grew in 2015, while industry use fell by 5%.
Sources: Haver Analytics, China National Bureau of Statistics, T. Rowe Price
51.3%
30%
35%
40%
45%
50%
55%
Serv
ices
as
% o
f GD
P
CHINA: SERVICES SHARE OF THE ECONOMY 1992 to 4Q15
-5%
0%
5%
10%
15%
20%
25%
All Households IndustryYe
ar o
ver Y
ear C
hang
e (%
)
CHINA: ELECTRICITY CONSUMPTION 2011 2012 2013 2014 2015
40 40
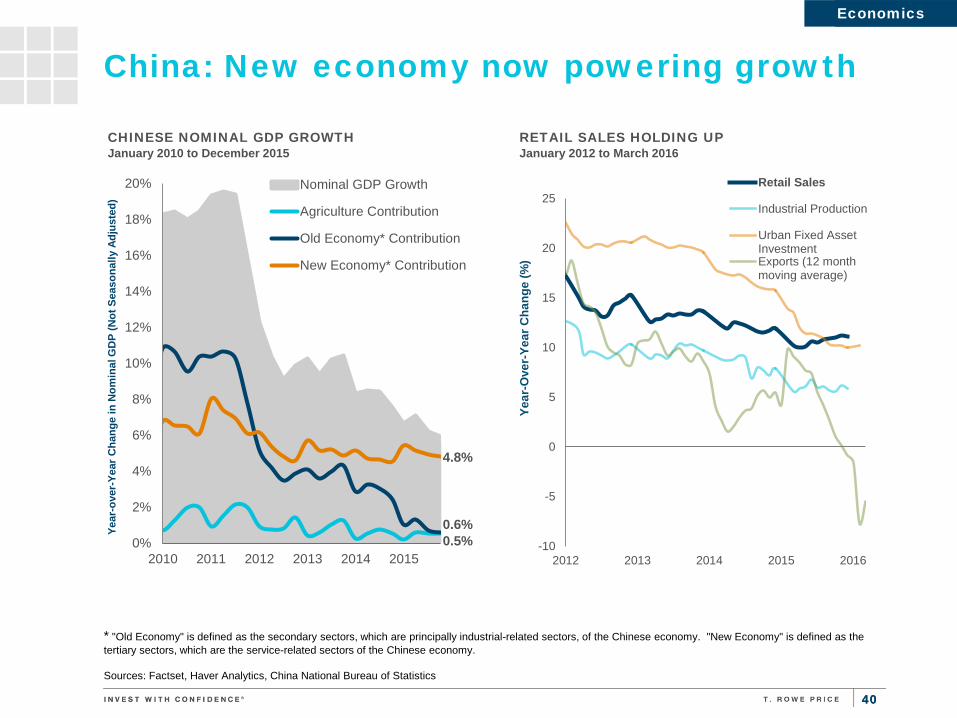
China: New economy now powering growth
* "Old Economy" is defined as the secondary sectors, which are principally industrial-related sectors, of the Chinese economy. "New Economy" is defined as the tertiary sectors, which are the service-related sectors of the Chinese economy. Sources: Factset, Haver Analytics, China National Bureau of Statistics
Economics Economics
-10
-5
0
5
10
15
20
25
2012 2013 2014 2015 2016
Year
-Ove
r-Ye
ar C
hang
e (%
)
RETAIL SALES HOLDING UP January 2012 to March 2016
Retail Sales
Industrial Production
Urban Fixed AssetInvestmentExports (12 monthmoving average)
0.5% 0.6%
4.8%
0%
2%
4%
6%
8%
10%
12%
14%
16%
18%
20%
2010 2011 2012 2013 2014 2015
Year
-ove
r-Ye
ar C
hang
e in
Nom
inal
GD
P (N
ot S
easo
nally
Adj
uste
d)
CHINESE NOMINAL GDP GROWTH January 2010 to December 2015
Nominal GDP Growth
Agriculture Contribution
Old Economy* Contribution
New Economy* Contribution
41 41
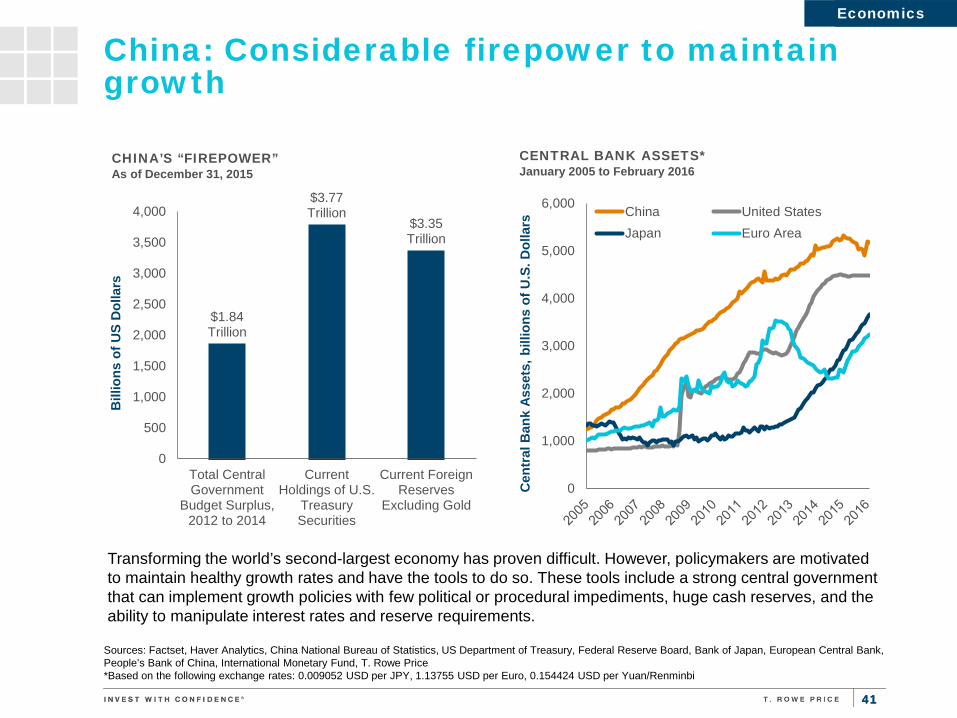
China: Considerable firepower to maintain growth
Economics Economics
Sources: Factset, Haver Analytics, China National Bureau of Statistics, US Department of Treasury, Federal Reserve Board, Bank of Japan, European Central Bank, People’s Bank of China, International Monetary Fund, T. Rowe Price *Based on the following exchange rates: 0.009052 USD per JPY, 1.13755 USD per Euro, 0.154424 USD per Yuan/Renminbi
Transforming the world’s second-largest economy has proven difficult. However, policymakers are motivated to maintain healthy growth rates and have the tools to do so. These tools include a strong central government that can implement growth policies with few political or procedural impediments, huge cash reserves, and the ability to manipulate interest rates and reserve requirements.
$1.84 Trillion
$3.77 Trillion
$3.35 Trillion
0
500
1,000
1,500
2,000
2,500
3,000
3,500
4,000
Total CentralGovernment
Budget Surplus,2012 to 2014
CurrentHoldings of U.S.
TreasurySecurities
Current ForeignReserves
Excluding Gold
Bill
ions
of U
S D
olla
rs
CHINA’S “FIREPOWER” As of December 31, 2015
0
1,000
2,000
3,000
4,000
5,000
6,000
Cen
tral
Ban
k As
sets
, bill
ions
of U
.S. D
olla
rs
CENTRAL BANK ASSETS* January 2005 to February 2016
China United StatesJapan Euro Area

42 42
China: Chinese demand has peaked and is dragging commodity prices lower
Global commodity prices have fallen as a result of a decline in Chinese demand. We have seen a clear correlation between Chinese industrial production and global prices of industrial metals.
Economics Economics
Over-investment leads to over-capacity. In South Korea, investment as a percentage of GDP peaked at 42%. In China, this ratio is currently at 46%--a level that appears unsustainable.
Sources: Factset, Haver Analytics, China National Bureau of Statistics, Bank of Korea, T. Rowe Price
20%
25%
30%
35%
40%
45%
50%
Gro
ss F
ixed
Cap
ital I
nves
tmen
t as
Perc
ent o
f GD
P
INVESTMENT AS PERCENT OF GDP 1970 to 2015
Korea China
250
300
350
400
450
500
5%
7%
9%
11%
13%
15%
17%
2011 2012 2013 2014 2015 2016
Inde
x Le
vel
Year
ove
r Yea
r Cha
nge
(%)
CHINA INDUSTRIAL PRODUCTION VS INDUSTRIAL METALS PRICES January 2011 to March 2016
China - Industrial Production (Left)S&P GSCI Industrial Metals Index Price (Right)
43 43
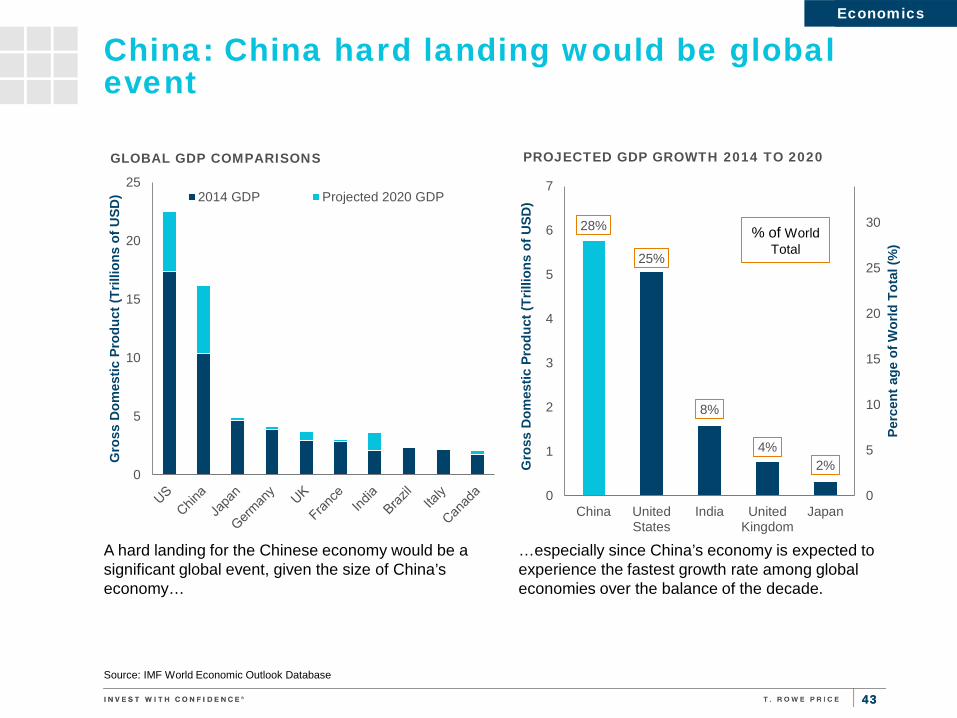
China: China hard landing would be global event
Source: IMF World Economic Outlook Database
A hard landing for the Chinese economy would be a significant global event, given the size of China’s economy…
Economics Economics
…especially since China’s economy is expected to experience the fastest growth rate among global economies over the balance of the decade.
28%
25%
8%
4% 2%
0
5
10
15
20
25
30
0
1
2
3
4
5
6
7
China UnitedStates
India UnitedKingdom
Japan
Perc
ent a
ge o
f Wor
ld T
otal
(%)
Gro
ss D
omes
tic P
rodu
ct (T
rillio
ns o
f USD
)
PROJECTED GDP GROWTH 2014 TO 2020
% of World Total
0
5
10
15
20
25
Gro
ss D
omes
tic P
rodu
ct (T
rillio
ns o
f USD
)
GLOBAL GDP COMPARISONS
2014 GDP Projected 2020 GDP
44 44
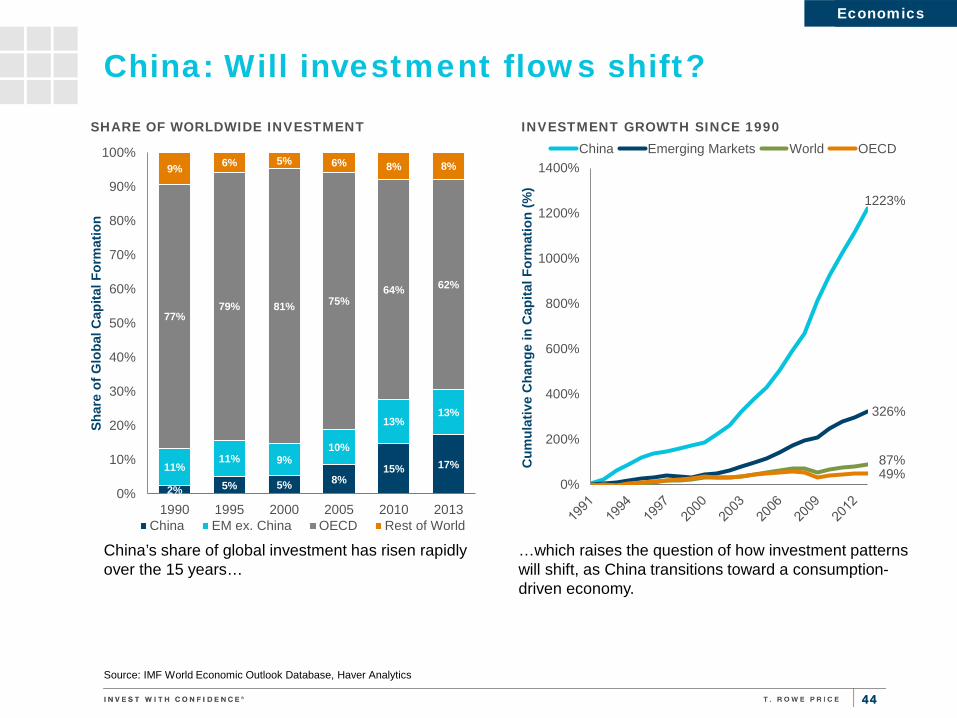
China: Will investment flows shift?
Source: IMF World Economic Outlook Database, Haver Analytics
China’s share of global investment has risen rapidly over the 15 years…
Economics Economics
…which raises the question of how investment patterns will shift, as China transitions toward a consumption-driven economy.
2% 5% 5% 8% 15% 17% 11%
11% 9% 10%
13% 13%
77% 79% 81% 75%
64% 62%
9% 6% 5% 6% 8% 8%
0%
10%
20%
30%
40%
50%
60%
70%
80%
90%
100%
1990 1995 2000 2005 2010 2013
Shar
e of
Glo
bal C
apita
l For
mat
ion
SHARE OF WORLDWIDE INVESTMENT
China EM ex. China OECD Rest of World
1223%
326%
87% 49%
0%
200%
400%
600%
800%
1000%
1200%
1400%
Cum
ulat
ive
Cha
nge
in C
apita
l For
mat
ion
(%)
INVESTMENT GROWTH SINCE 1990 China Emerging Markets World OECD

45 45
Global economy: Country comparison As of March 31, 2016
1 As of 6 April 2016 per The Economist 2 As of 14 October 2015 release of IMF World Economic Outlook via Factset 3 As of 6 April 2016 per the CIA World Factbook (2015 est.) Sources: IMF, The Economist, CIA World Factbook, World Bank
Developed Markets Emerging Markets
United States Europe
United Kingdom Japan Australia Canada Brazil Russia India China Mexico
Inflation Rate (CPI)1 1.0% -0.1% 0.3% 0.3% 1.7% 1.4% 10.4% 7.3% 5.2% 2.3% 2.9%
Savings Rate (as a % of GDP)2 17.7% 23.0% 13.4% 24.3% 22.3% 20.8% 12.9% 23.5% 29.% 45.9% 20.5%
Investment Rate (as a % of GDP)2 20.6% 19.3% 17.7% 21.3% 26.4% 22.7% 16.7% 18.1% 30.6% 43.1% 22.5%
Current Account Balance (as a % of 2015 GDP)1 -2.6% 2.8% -4.2% 3.5% -4.0% -2.9% -2.4% 3.9% -1.1% 3.0% -2.7%
Budget Balance (as a % of 2015 GDP)1 -2.5% -1.9% -3.6% -6.2% -2.0% -1.4% -5.4% -2.2% -3.7% -3.0% -3.0%
Gov’t Debt to GDP2 80.7% 69.7% 79.5% 128.1% 18.3% 38.% 42.1% 13.5%3 51.7%3 16.7%3 52.1%
Short-term Rates1 0.63% -0.25% 0.57% 0.00% 2.34% 0.86% 14.11% 12.16% 6.76% 2.85% 4.07%
2014 Real GDP Growth2 2.5% 1.89% 2.20% 0.60% 2.37% 1.2% -3.80% -3.70% 7.30% 6.90% 2.50%
Projected 2015 Real GDP Growth4 2.60% 1.95% 2.20% 1.00% 2.85% 1.70% -3.50% -1.00% 7.50% 6.90% 2.60%
Economics Economics
46 46
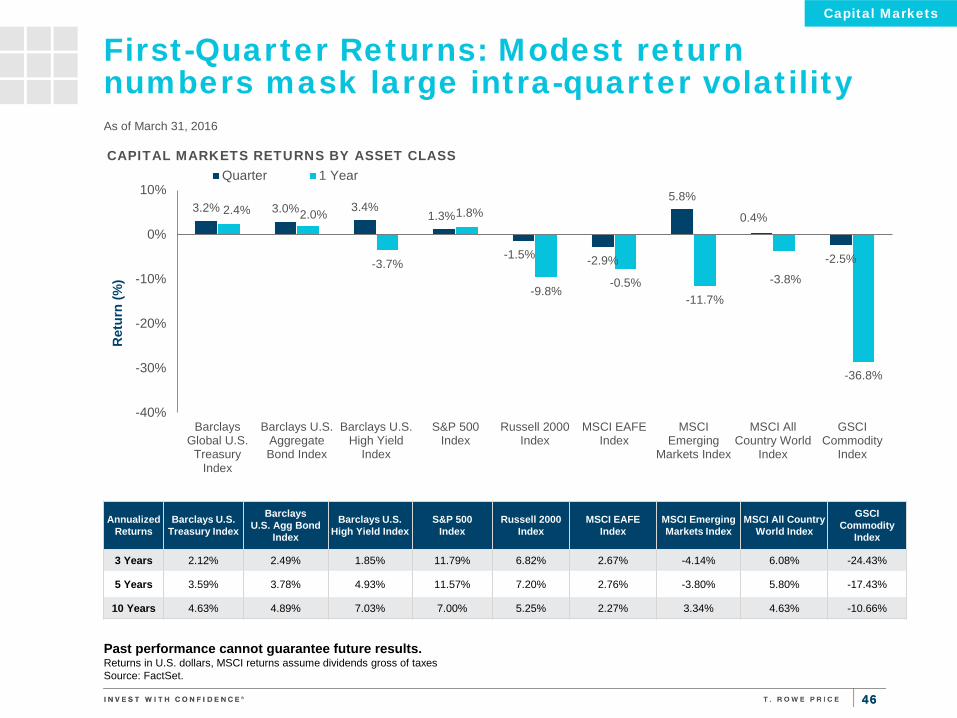
First-Quarter Returns: Modest return numbers mask large intra-quarter volatility As of March 31, 2016
Annualized Returns
Barclays U.S. Treasury Index
Barclays U.S. Agg Bond
Index
Barclays U.S. High Yield Index
S&P 500 Index
Russell 2000 Index
MSCI EAFE Index
MSCI Emerging Markets Index
MSCI All Country World Index
GSCI Commodity
Index
3 Years 2.12% 2.49% 1.85% 11.79% 6.82% 2.67% -4.14% 6.08% -24.43%
5 Years 3.59% 3.78% 4.93% 11.57% 7.20% 2.76% -3.80% 5.80% -17.43%
10 Years 4.63% 4.89% 7.03% 7.00% 5.25% 2.27% 3.34% 4.63% -10.66%
Capital Markets
Past performance cannot guarantee future results. Returns in U.S. dollars, MSCI returns assume dividends gross of taxes Source: FactSet.
3.2% 3.0% 3.4% 1.3%
-1.5% -2.9%
5.8%
0.4%
-2.5%
2.4% 2.0%
-3.7%
1.8%
-9.8% -0.5%
-11.7%
-3.8%
-36.8%
-40%
-30%
-20%
-10%
0%
10%
BarclaysGlobal U.S.
TreasuryIndex
Barclays U.S.AggregateBond Index
Barclays U.S.High Yield
Index
S&P 500Index
Russell 2000Index
MSCI EAFEIndex
MSCIEmerging
Markets Index
MSCI AllCountry World
Index
GSCICommodity
Index
Ret
urn
(%)
CAPITAL MARKETS RETURNS BY ASSET CLASS Quarter 1 Year
47 47
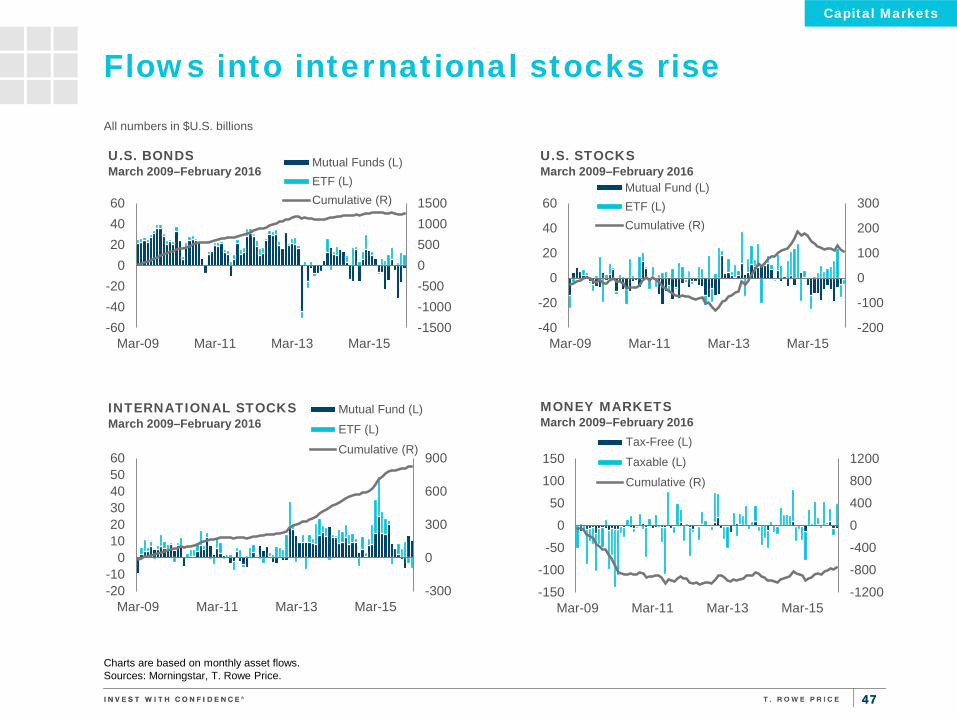
Flows into international stocks rise
-200
-100
0
100
200
300
-40
-20
0
20
40
60
Mar-09 Mar-11 Mar-13 Mar-15
U.S. STOCKS March 2009–February 2016
Mutual Fund (L)ETF (L)Cumulative (R)
All numbers in $U.S. billions
Charts are based on monthly asset flows. Sources: Morningstar, T. Rowe Price.
-1200
-800
-400
0
400
800
1200
-150
-100
-50
0
50
100
150
Mar-09 Mar-11 Mar-13 Mar-15
MONEY MARKETS March 2009–February 2016
Tax-Free (L)
Taxable (L)
Cumulative (R)
-1500-1000-500050010001500
-60-40-20
0204060
Mar-09 Mar-11 Mar-13 Mar-15
U.S. BONDS March 2009–February 2016
Mutual Funds (L)ETF (L)Cumulative (R)
-300
0
300
600
900
-20-10
0102030405060
Mar-09 Mar-11 Mar-13 Mar-15
INTERNATIONAL STOCKS March 2009–February 2016
Mutual Fund (L)
ETF (L)
Cumulative (R)
Capital Markets
48 48
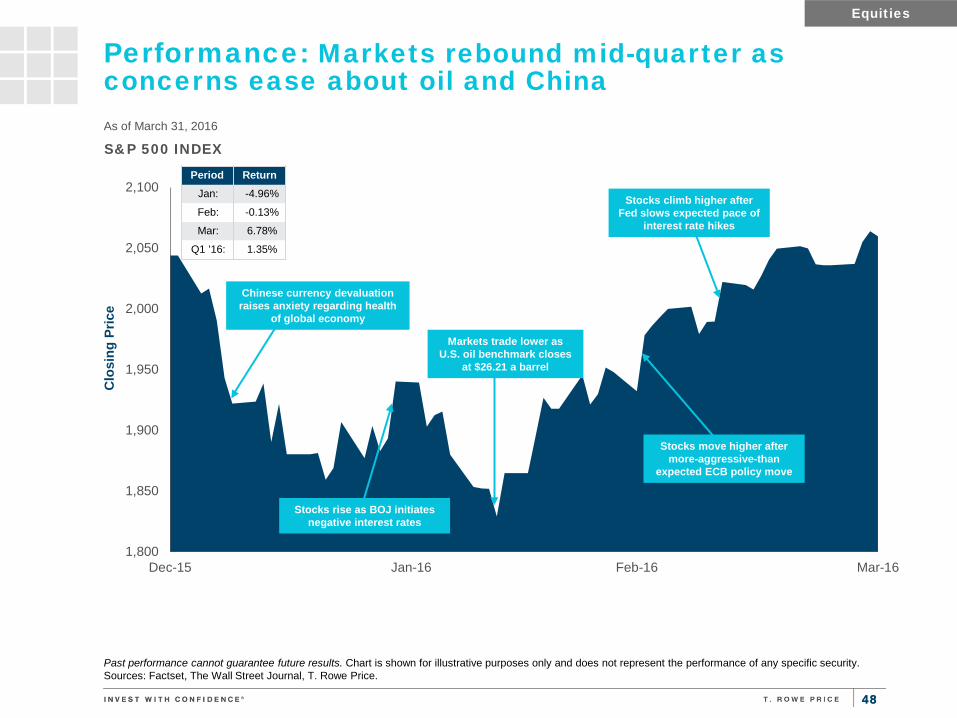
Performance: Markets rebound mid-quarter as concerns ease about oil and China As of March 31, 2016
Past performance cannot guarantee future results. Chart is shown for illustrative purposes only and does not represent the performance of any specific security. Sources: Factset, The Wall Street Journal, T. Rowe Price.
1,800
1,850
1,900
1,950
2,000
2,050
2,100
Dec-15 Jan-16 Feb-16 Mar-16
Clo
sing
Pric
e
S&P 500 INDEX
Stocks climb higher after Fed slows expected pace of
interest rate hikes
Period Return Jan: -4.96%
Feb: -0.13%
Mar: 6.78%
Q1 ’16: 1.35%
Markets trade lower as U.S. oil benchmark closes
at $26.21 a barrel
Chinese currency devaluation raises anxiety regarding health
of global economy
Equities
Stocks rise as BOJ initiates negative interest rates
Stocks move higher after more-aggressive-than
expected ECB policy move
49 49
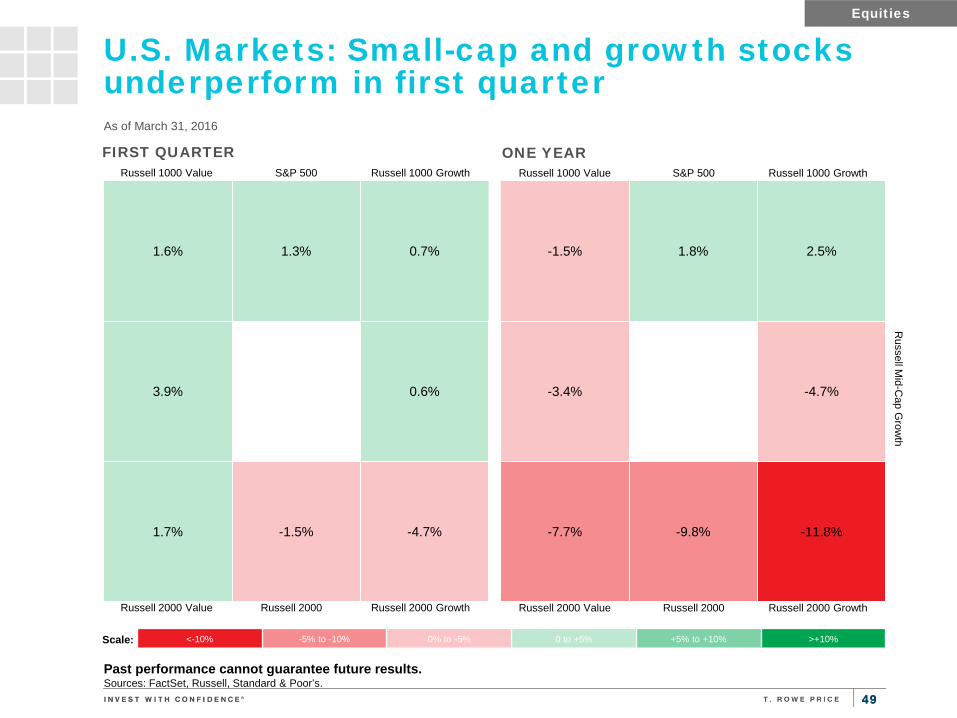
U.S. Markets: Small-cap and growth stocks underperform in first quarter
1.6% 1.3% 0.7%
-1.5% 1.8% 2.5%
3.9%
0.6% -3.4%
-4.7%
1.7% -1.5% -4.7% -7.7% -9.8% -11.8%
As of March 31, 2016
FIRST QUARTER ONE YEAR Russell 1000 Value S&P 500 Russell 1000 Growth Russell 1000 Value S&P 500 Russell 1000 Growth
Russell M
id-Cap G
rowth
Russell 2000 Value Russell 2000 Russell 2000 Growth Russell 2000 Value Russell 2000 Russell 2000 Growth
Equities
<-10% -5% to -10% 0% to -5% 0 to +5% +5% to +10% >+10% Scale:
Past performance cannot guarantee future results. Sources: FactSet, Russell, Standard & Poor’s.
50 50
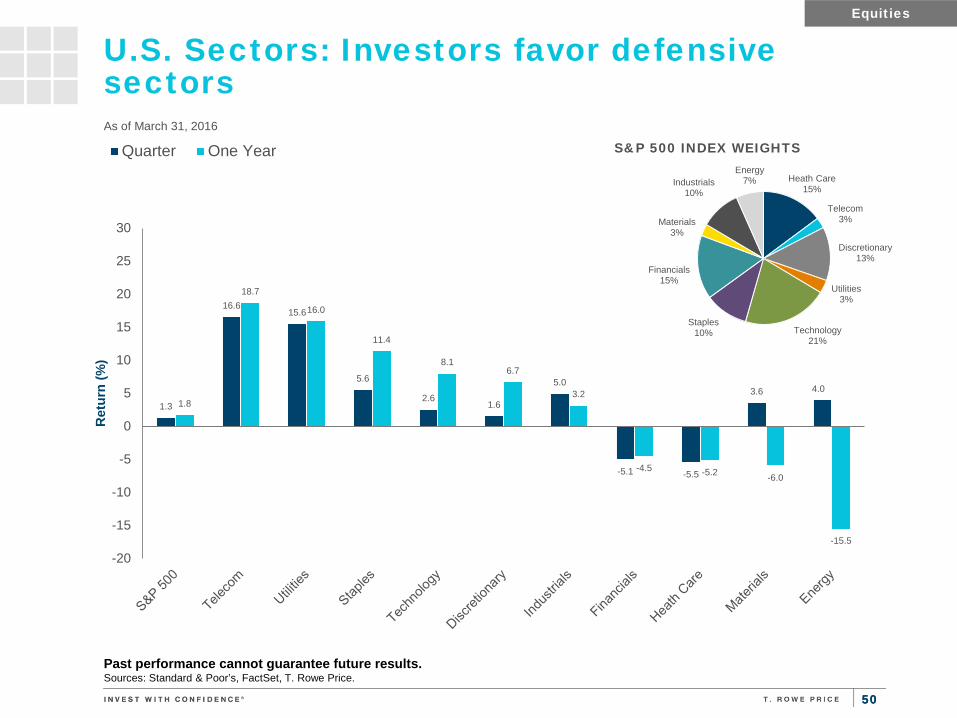
U.S. Sectors: Investors favor defensive sectors As of March 31, 2016
Equities
1.3
16.6 15.6
5.6
2.6 1.6
5.0
-5.1 -5.5
3.6 4.0 1.8
18.7
16.0
11.4
8.1 6.7
3.2
-4.5 -5.2 -6.0
-15.5
-20
-15
-10
-5
0
5
10
15
20
25
30
Ret
urn
(%)
Quarter One YearHeath Care
15%
Telecom 3%
Discretionary 13%
Utilities 3%
Technology 21%
Staples 10%
Financials 15%
Materials 3%
Industrials 10%
Energy 7%
S&P 500 INDEX WEIGHTS
Past performance cannot guarantee future results. Sources: Standard & Poor’s, FactSet, T. Rowe Price.
51 51
-7%
-6%
-5%
-4%
-3%
-2%
-1%
0%
1%
2%
S&P
500
Div
. Yie
ld M
inus
Ten
Yea
r Tre
asur
y Yi
eld
S&P 500 DIVIDEND YIELD VS. 10 YEAR TREASURY YIELD January 1997–March 2016
10
12
14
16
18
20
22
24
26
28
Pric
e-Ea
rnin
gs M
ultip
le
S&P 500 PRICE TO 12 MONTHS FORWARD EARNINGS January 1997–March 2016
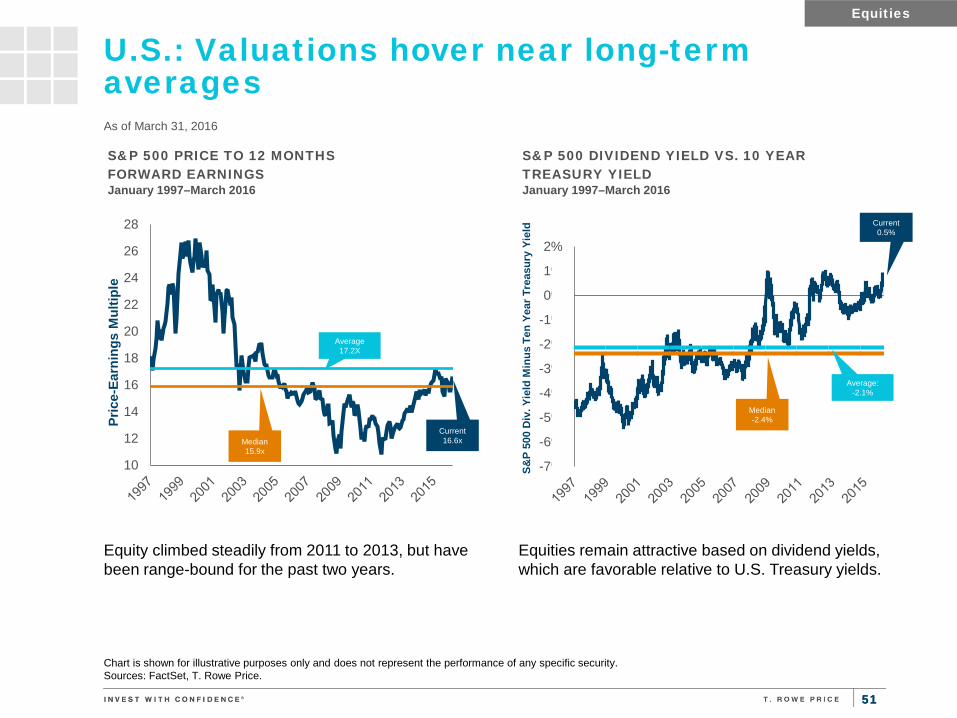
U.S.: Valuations hover near long-term averages As of March 31, 2016
Chart is shown for illustrative purposes only and does not represent the performance of any specific security. Sources: FactSet, T. Rowe Price.
Equities remain attractive based on dividend yields, which are favorable relative to U.S. Treasury yields.
Equity climbed steadily from 2011 to 2013, but have been range-bound for the past two years.
Current 16.6x
Average 17.2X
Average: -2.1%
Current 0.5%
Equities
Median 15.9x
Median -2.4%

52 52
U.S.: Valuations favor growth stocks across market capitalizations
Sources: FactSet, T. Rowe Price.
P/E Ratios (1 Year Forward) by Russell Style Indices
Current (3/31/16) Average High Low
Current Valuation to 20 Year Average
Russell 1000 Value 15.21 14.28 19.90 9.67 6%
Russell 1000 Growth 18.25 21.12 54.50 11.09 -14%
Russell Mid Cap Value 16.28 14.55 17.84 9.24 12%
Russell Mid Cap Growth 19.26 22.10 61.60 10.34 -13%
Russell 2000 Value 15.99 14.69 20.40 10.36 9%
Russell 200 Growth 19.09 21.62 50.80 12.14 -12%
Past 20 Years
Equities
5
10
15
20
25
30
Russell 1000Value
Russell 1000Growth
Russell Mid CapValue
Russell Mid CapGrowth
Russell 2000Value
Russell 2000Growth
Pric
e to
Ear
ning
s M
ultip
le
FORWARD P/E RATIOS March 1996–March 2016

53 53
0.0
0.5
1.0
1.5
2.0
Energy Materials ConsumerDiscretionary
Industrials InformationTechnology
Financials ConsumerStaples
Health Care Telecom. UtilitiesPric
e to
Ear
ning
s M
ultip
le R
elat
ive
to S
&P
500
RELATIVE FORWARD P/E RATIOS March 1996–March 2016
U.S.: Defensive sectors are commanding a premium, energy distorted by impaired earnings
Sources: FactSet, T. Rowe Price.
Past 20 Years
Equities
P/E Ratios (1 Year Forward) by Sector
Current (3/31/16)
Relative to S&P 500 Average High Low
Current Valuation to 20 Year Average
Energy 62.87 3.78 0.94 3.78 0.64 404%
Materials 17.16 1.03 0.98 1.72 0.43 105%
Consumer Discretionary 18.09 1.09 1.13 1.31 0.85 96%
Industrials 16.02 0.96 1.03 1.19 0.80 94%
Information Technology 16.33 0.98 1.27 2.10 0.95 77%
Financials 12.40 0.75 0.78 1.16 0.53 96%
Consumer Staples 20.98 1.26 1.17 1.46 0.74 108%
Health Care 14.90 0.90 1.09 1.47 0.75 83%
Telecom. 13.93 0.84 1.05 1.54 0.74 80%
Utilities 17.71 1.07 0.87 1.25 0.49 123%
54 54
-6
-4
-2
0
2
4
6
1997 1998 1999 2000 2001 2002 2003 2004 2005 2006 2007 2008 2009 2010 2011 2012 2013 2014 2015
Perc
ent (
%)
S&P 500 12-MONTH FWD. EARNINGS YIELD MINUS BBB U.S. CORPORATE BOND YIELD January 1997–March 2016
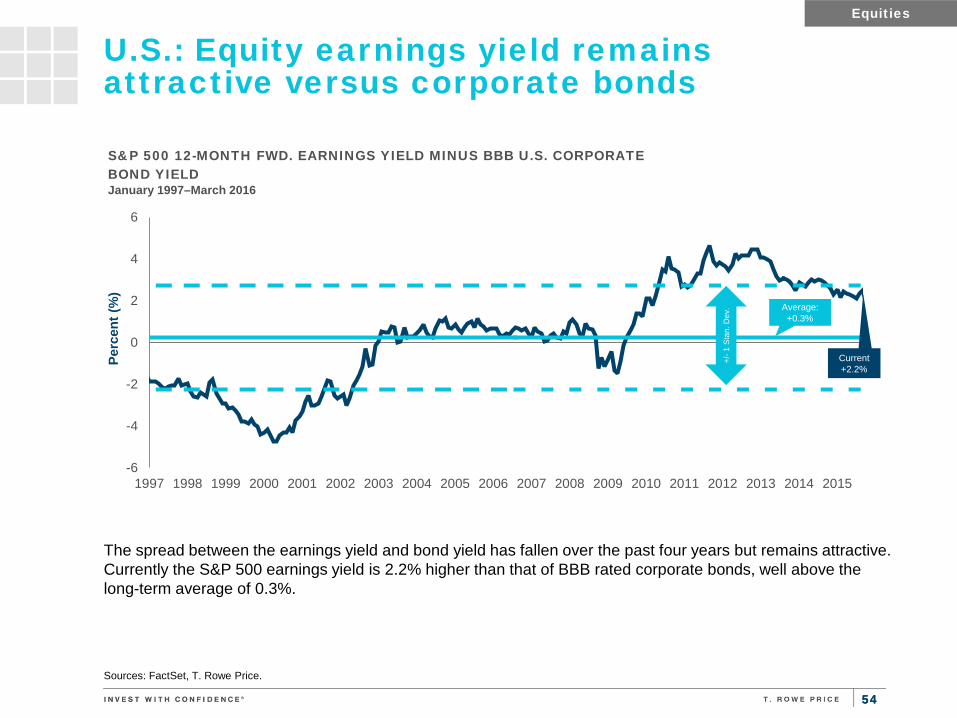
U.S.: Equity earnings yield remains attractive versus corporate bonds
Sources: FactSet, T. Rowe Price.
The spread between the earnings yield and bond yield has fallen over the past four years but remains attractive. Currently the S&P 500 earnings yield is 2.2% higher than that of BBB rated corporate bonds, well above the long-term average of 0.3%.
+/- 1
Sta
n. D
ev.
Equities
Current +2.2%
Average: +0.3%

55 55
0
10
20
30
40
50
60
70
Inde
x Le
vel
CBOE MARKET VOLATILITY INDEX January 1990– March 2016
VIX Average
U.S.: Volatility and correlations fall as macro concerns ease
1 Intra-stock correlations represent the average pair-wise correlation of returns over monthly rolling 90-day periods. Sources: FactSet, T. Rowe Price.
Equities
Volatility has fallen as concerns about China’s slowdown have eased and stock markets have recovered.
0.00
0.05
0.10
0.15
0.20
0.25
0.30
0.35
0.40
0.45
0.50
Cor
rela
tion
INTRA-STOCK CORRELATIONS1 IN THE S&P 500 INDEX December 1990–March 2016
90 Day Correlation Average
Current 14.0
Current 0.18

56 56
U.S.: Weaker energy prices continue to weigh on earnings
Equities
30
40
50
60
70
80
90
100
110
120
130
700
900
1,100
1,300
1,500
1,700
1,900
2,100
2,300
2000 2001 2002 2003 2004 2005 2006 2007 2008 2009 2010 2011 2012 2013 2014 2015 2016
Earn
ings
Per
Sha
re ($
)
Inde
x Le
vel
S&P 500 INDEX VS EARNINGS PER SHARE January 2000– March 2016
Price (L) Earnings Per Share (R)
Past performance cannot guarantee future results. Source: FactSet.
57 57
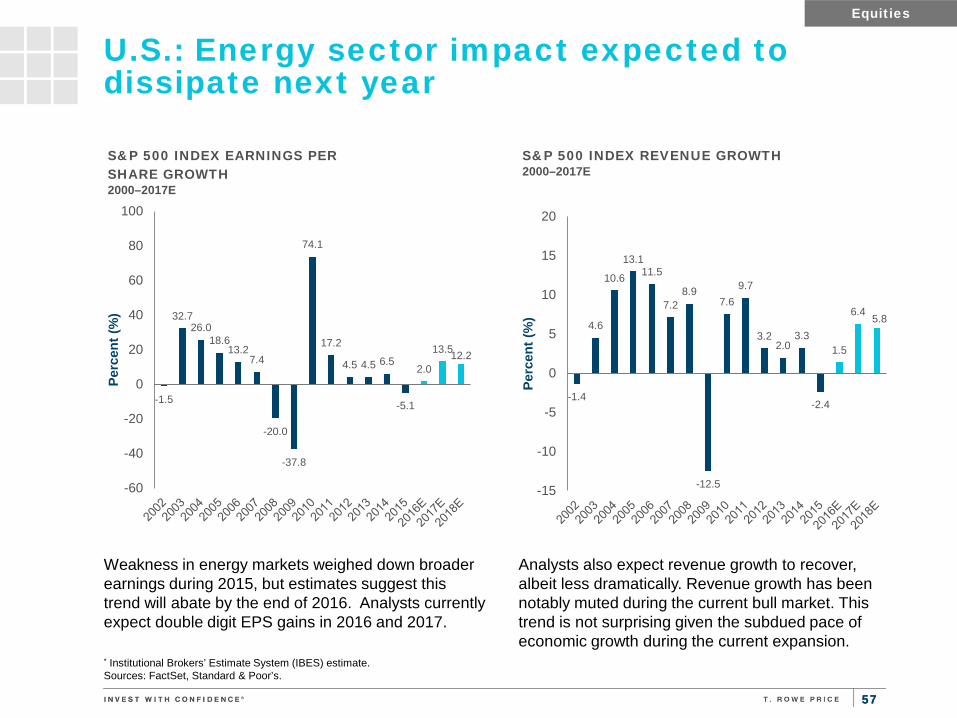
U.S.: Energy sector impact expected to dissipate next year
* Institutional Brokers’ Estimate System (IBES) estimate. Sources: FactSet, Standard & Poor’s.
Analysts also expect revenue growth to recover, albeit less dramatically. Revenue growth has been notably muted during the current bull market. This trend is not surprising given the subdued pace of economic growth during the current expansion.
Weakness in energy markets weighed down broader earnings during 2015, but estimates suggest this trend will abate by the end of 2016. Analysts currently expect double digit EPS gains in 2016 and 2017.
Equities
-1.5
32.7 26.0
18.6 13.2
7.4
-20.0
-37.8
74.1
17.2
4.5 4.5 6.5
-5.1
2.0
13.5 12.2
-60
-40
-20
0
20
40
60
80
100
Perc
ent (
%)
S&P 500 INDEX EARNINGS PER SHARE GROWTH 2000–2017E
-1.4
4.6
10.6
13.1 11.5
7.2 8.9
-12.5
7.6 9.7
3.2 2.0
3.3
-2.4
1.5
6.4 5.8
-15
-10
-5
0
5
10
15
20
Perc
ent (
%)
S&P 500 INDEX REVENUE GROWTH 2000–2017E
58 58
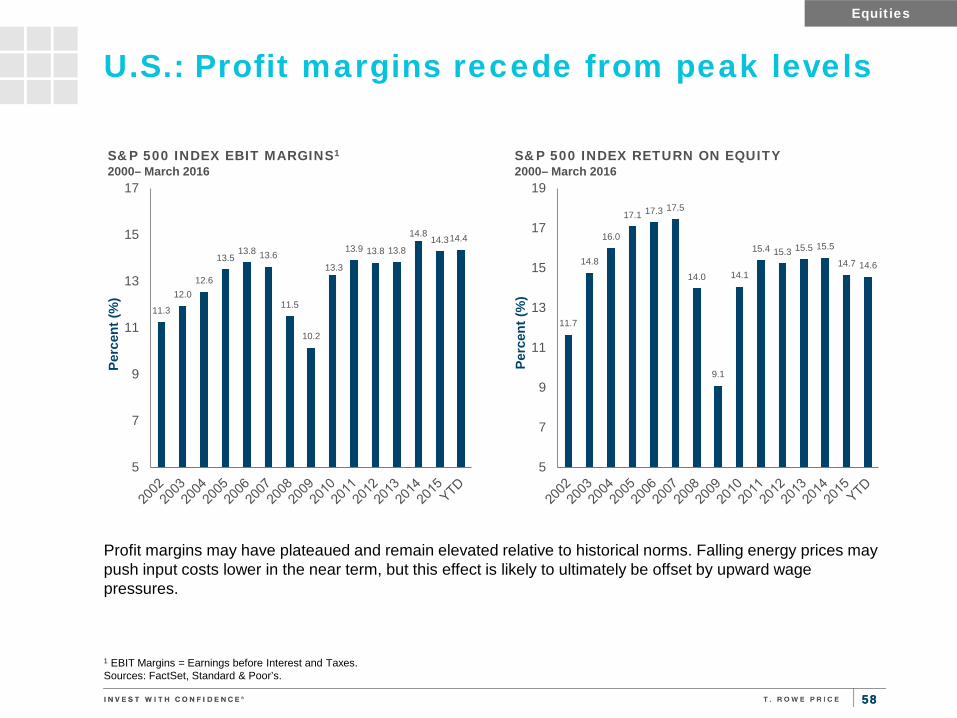
U.S.: Profit margins recede from peak levels
1 EBIT Margins = Earnings before Interest and Taxes. Sources: FactSet, Standard & Poor’s.
Profit margins may have plateaued and remain elevated relative to historical norms. Falling energy prices may push input costs lower in the near term, but this effect is likely to ultimately be offset by upward wage pressures.
Equities
11.3
12.0 12.6
13.5 13.8 13.6
11.5
10.2
13.3
13.9 13.8 13.8
14.8 14.3 14.4
5
7
9
11
13
15
17
Perc
ent (
%)
S&P 500 INDEX EBIT MARGINS1
2000– March 2016
11.7
14.8
16.0
17.1 17.3 17.5
14.0
9.1
14.1
15.4 15.3 15.5 15.5
14.7 14.6
5
7
9
11
13
15
17
19
Perc
ent (
%)
S&P 500 INDEX RETURN ON EQUITY
2000– March 2016
59 59
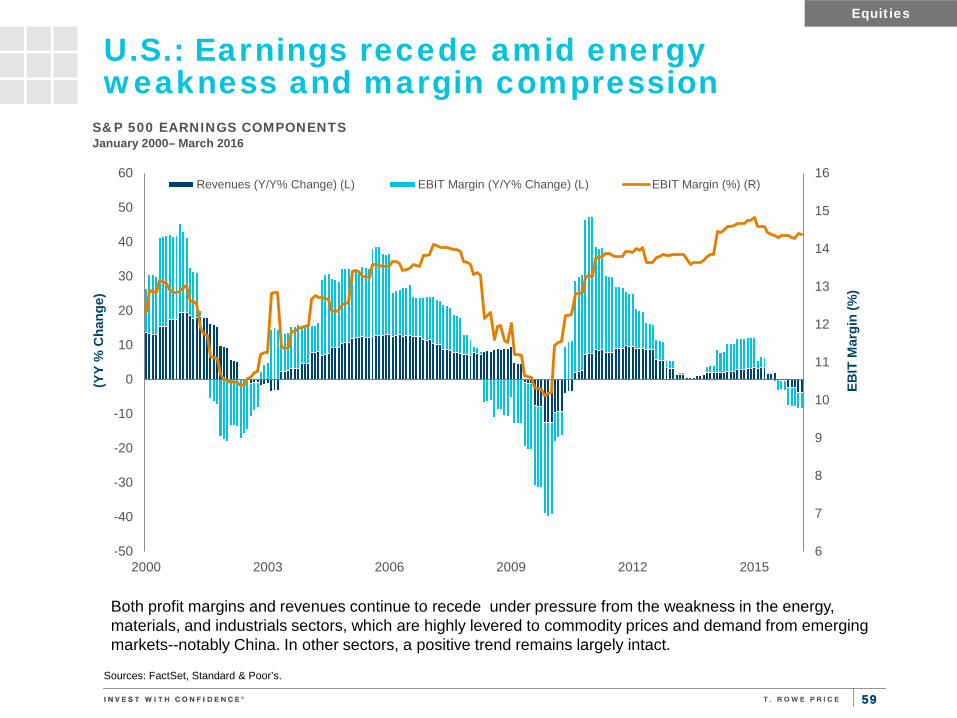
U.S.: Earnings recede amid energy weakness and margin compression
Sources: FactSet, Standard & Poor’s.
Equities
6
7
8
9
10
11
12
13
14
15
16
-50
-40
-30
-20
-10
0
10
20
30
40
50
60
2000 2003 2006 2009 2012 2015
EBIT
Mar
gin
(%)
(YY
% C
hang
e)
S&P 500 EARNINGS COMPONENTS January 2000– March 2016
Revenues (Y/Y% Change) (L) EBIT Margin (Y/Y% Change) (L) EBIT Margin (%) (R)
Both profit margins and revenues continue to recede under pressure from the weakness in the energy, materials, and industrials sectors, which are highly levered to commodity prices and demand from emerging markets--notably China. In other sectors, a positive trend remains largely intact.

60 60
U.S.: Fourth-quarter 2015 earnings and revenues As reported through April 8, 2016
This report is based on trailing 12 month non-GAAP earnings per share and revenues. Sources: FactSet, Standard & Poor’s.
Earnings Growth (YoY) Earnings Surprise
Name YoY Growth Reported (%)
# Pos Growth
# Neg Growth
Surprise (%)
% Pos Surprise
% Neg Surprise
S&P 500 -0.8 289 178 1.2 69.6 19.6 Consumer Discretionary 9.3 58 26 4.8 73.6 17.2 Consumer Staples 0.9 23 14 2.5 65.8 18.4 Energy -61.6 4 33 9.5 67.5 30.0 Financials 5.7 41 24 -0.5 64.0 25.6 Health Care 13.6 48 8 4.5 65.5 18.2 Industrials -4.1 35 27 2.9 72.3 18.5 Information Technology 6.3 42 23 5.5 83.8 7.4 Materials -8.0 14 13 13.8 66.7 18.5 Telecommunication Services 20.4 4 1 1.1 60.0 40.0 Utilities -11.6 20 9 -1.1 55.2 27.6
Revenue Growth (YoY) Revenue Surprise
Name YoY Growth Reported (%)
# Pos Growth
# Neg Growth
Surprise (%)
% Pos Surprise
% Neg Surprise
S&P 500 -2.8 262 238 -0.4 48.4 51.2 Consumer Discretionary 3.5 55 32 0.6 43.7 55.2 Consumer Staples 1.3 19 18 -1.1 42.1 55.3 Energy -35.0 0 37 0.6 61.2 38.8 Financials -0.7 56 34 0.4 44.0 56.0 Health Care 11.2 48 9 0.7 69.1 30.9 Industrials -3.0 26 39 -1.6 40.0 60.0 Information Technology 4.3 40 26 0.4 66.2 33.8 Materials -12.7 7 20 -1.6 25.9 74.1 Telecommunication Services 7.3 4 1 -0.4 40.0 60.0 Utilities -8.6 7 22 -14.3 10.7 89.3
Equities
61 61
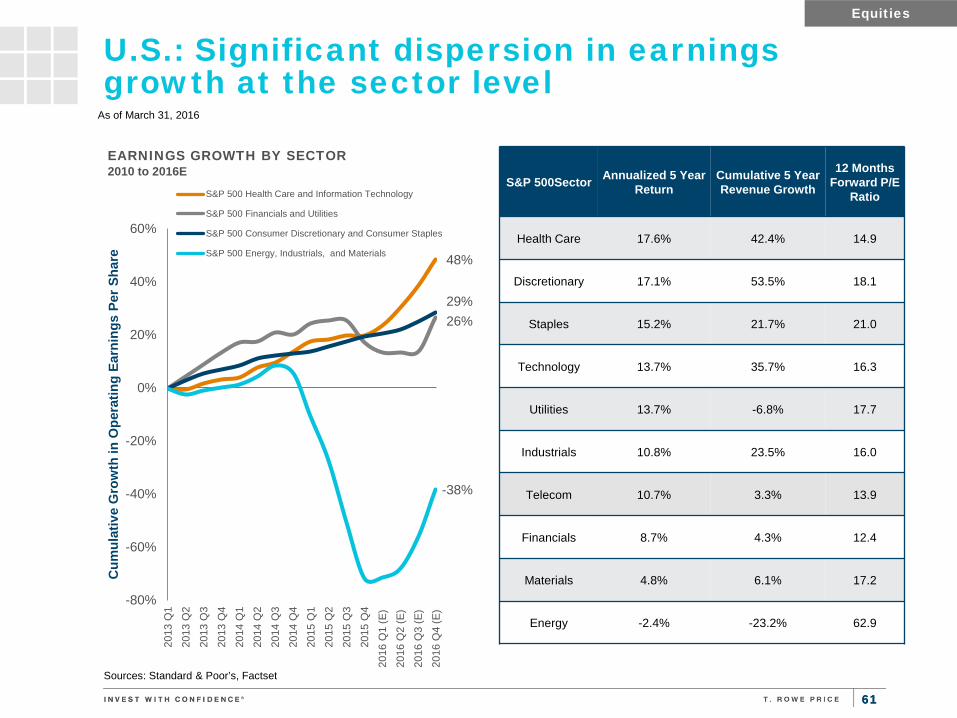
Sources: Standard & Poor’s, Factset
U.S.: Significant dispersion in earnings growth at the sector level
Equities
As of March 31, 2016
48%
26% 29%
-38%
-80%
-60%
-40%
-20%
0%
20%
40%
60%
2013
Q1
2013
Q2
2013
Q3
2013
Q4
2014
Q1
2014
Q2
2014
Q3
2014
Q4
2015
Q1
2015
Q2
2015
Q3
2015
Q4
2016
Q1
(E)
2016
Q2
(E)
2016
Q3
(E)
2016
Q4
(E)
Cum
ulat
ive
Gro
wth
in O
pera
ting
Earn
ings
Per
Sha
re
EARNINGS GROWTH BY SECTOR 2010 to 2016E
S&P 500 Health Care and Information Technology
S&P 500 Financials and Utilities
S&P 500 Consumer Discretionary and Consumer Staples
S&P 500 Energy, Industrials, and Materials
S&P 500Sector Annualized 5 Year Return
Cumulative 5 Year Revenue Growth
12 Months Forward P/E
Ratio
Health Care 17.6% 42.4% 14.9
Discretionary 17.1% 53.5% 18.1
Staples 15.2% 21.7% 21.0
Technology 13.7% 35.7% 16.3
Utilities 13.7% -6.8% 17.7
Industrials 10.8% 23.5% 16.0
Telecom 10.7% 3.3% 13.9
Financials 8.7% 4.3% 12.4
Materials 4.8% 6.1% 17.2
Energy -2.4% -23.2% 62.9

62 62
U.S.: Small-cap relative valuations are close to long-term median
Source: The Leuthold Group, LLC.
50%
60%
70%
80%
90%
100%
110%
120%
130%
1983 1987 1991 1995 1999 2003 2007 2011 2015
SMALL-CAP TO LARGE-CAP HISTORICAL P/E RATIO Based on Normalized Earnings, January 1983–March 2016
Small-cap valuations relative to those of large-cap stocks have declined since 2013 and are now just below their long-term median. Currently the P/E ratio of small-caps relative to large-caps is 102%, compared with a long-term median of 103%.
Median: 103%
Equities
Current 102%

63 63
U.S.: Growth vs value disparity has been narrowing
Source: Factset, Russell.
The spread between value and growth reverted significantly towards value during the quarter, as many of the best performers of 2015 (which were concentrated in growth sectors) retrenched.
Equities
Growth Outperforming
Value Outperforming
-80%
-60%
-40%
-20%
0%
20%
40%
60%
80%
RUSSELL 1000 GROWTH VS. VALUE Rolling 3 year Return Difference
Growth Outperforming
Value Outperforming
-120%
-100%
-80%
-60%
-40%
-20%
0%
20%
40%
60%
80%
100%
RUSSELL 2000 GROWTH VS. VALUE Rolling 3 Year Return Difference
As of March 31, 2016
Past performance cannot guarantee future results.
64 64
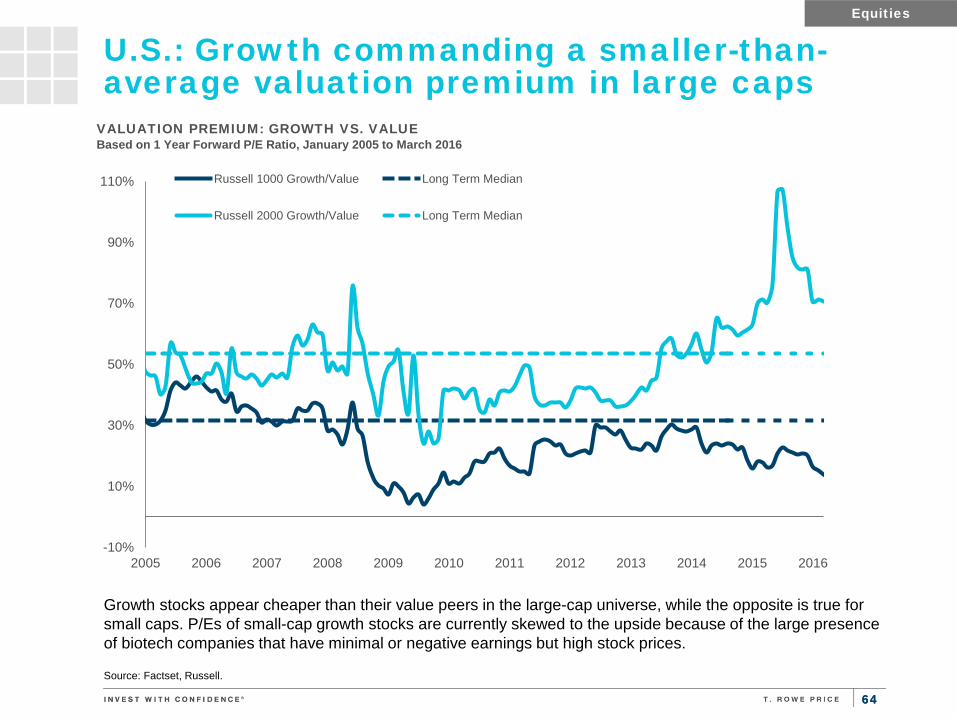
U.S.: Growth commanding a smaller-than-average valuation premium in large caps
Source: Factset, Russell.
Growth stocks appear cheaper than their value peers in the large-cap universe, while the opposite is true for small caps. P/Es of small-cap growth stocks are currently skewed to the upside because of the large presence of biotech companies that have minimal or negative earnings but high stock prices.
Equities
-10%
10%
30%
50%
70%
90%
110%
2005 2006 2007 2008 2009 2010 2011 2012 2013 2014 2015 2016
VALUATION PREMIUM: GROWTH VS. VALUE Based on 1 Year Forward P/E Ratio, January 2005 to March 2016
Russell 1000 Growth/Value Long Term Median
Russell 2000 Growth/Value Long Term Median
65 65
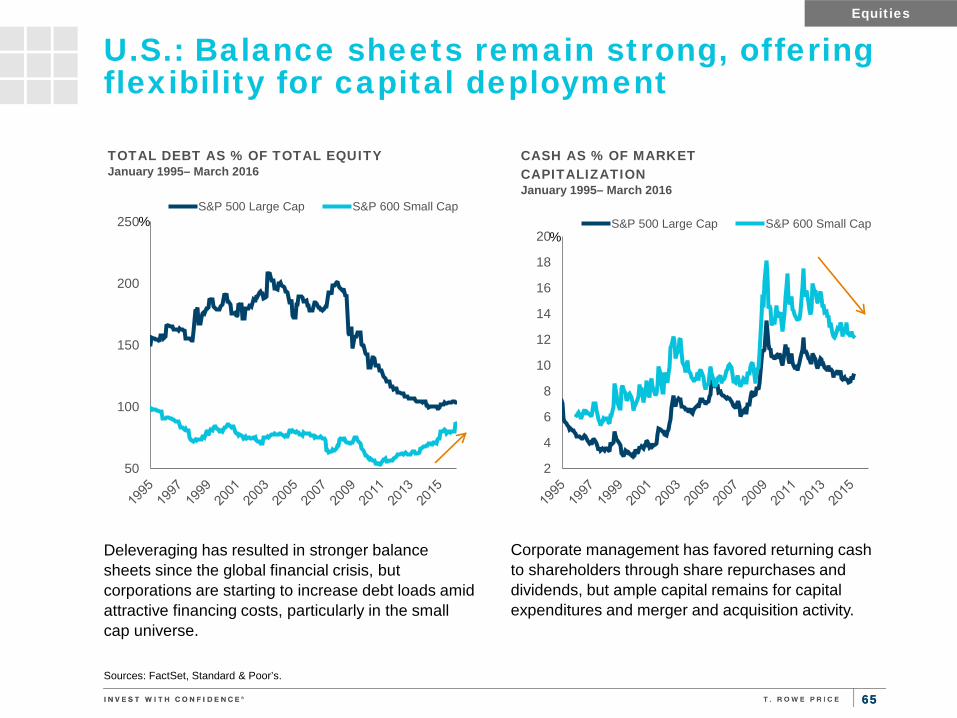
Deleveraging has resulted in stronger balance sheets since the global financial crisis, but corporations are starting to increase debt loads amid attractive financing costs, particularly in the small cap universe.
Sources: FactSet, Standard & Poor’s.
U.S.: Balance sheets remain strong, offering flexibility for capital deployment
Corporate management has favored returning cash to shareholders through share repurchases and dividends, but ample capital remains for capital expenditures and merger and acquisition activity.
%
Equities
%
50
100
150
200
250
TOTAL DEBT AS % OF TOTAL EQUITY January 1995– March 2016
S&P 500 Large Cap S&P 600 Small Cap
2
4
6
8
10
12
14
16
18
20
CASH AS % OF MARKET CAPITALIZATION January 1995– March 2016
S&P 500 Large Cap S&P 600 Small Cap

66 66
* Data based on financial statements released as of 3/31/16. Sources: Citi Research, Factset, Deutsche Bank U.S. Equity Strategy.
U.S.: Shareholder-friendly actions continue; capex spending growth is muted
-100
100
300
500
700
2000 2001 2002 2003 2004 2005 2006 2007 2008 2009 2010 2011 2012 2013 2014 2015
U.S
. $, b
illio
ns
S&P 500 CASH DEPLOYMENT 2000–2015* Dividends Buybacks Capex
0
200
400
600
800
1,000
0
50
100
150
200
250
Num
ber of Deals
$ B
illio
ns
Value of Deals (L)Number of Deals (R)
NUMBER AND VALUE OF U.S. M&A DEALS January 2001–March 2016
0
100
200
300
400
500
600
700
96 97 98 99 00 01 02 03 04 05 06 07 08 09 10 11 12 13 14 15 16
U.S
. $, b
illio
ns
S&P 500 BUYBACK ANNOUNCEMENTS Rolling 12-month total, January 1996–March 2016
Equities
67 67
Sources: Standard & Poor’s, FactSet.
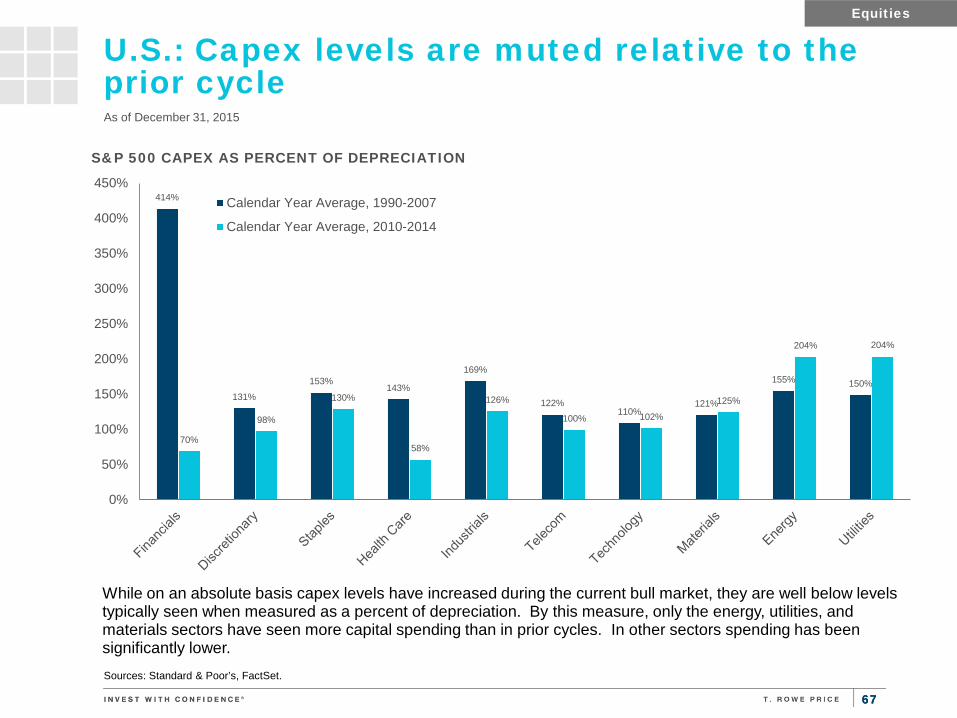
U.S.: Capex levels are muted relative to the prior cycle
Equities
414%
131%
153% 143%
169%
122% 110%
121%
155% 150%
70%
98%
130%
58%
126%
100% 102%
125%
204% 204%
0%
50%
100%
150%
200%
250%
300%
350%
400%
450%
S&P 500 CAPEX AS PERCENT OF DEPRECIATION
Calendar Year Average, 1990-2007
Calendar Year Average, 2010-2014
As of December 31, 2015
While on an absolute basis capex levels have increased during the current bull market, they are well below levels typically seen when measured as a percent of depreciation. By this measure, only the energy, utilities, and materials sectors have seen more capital spending than in prior cycles. In other sectors spending has been significantly lower.
68 68
0%
1%
2%
3%
4%
5%
6%
7%
8%
Div
iden
d an
d B
uyba
ck Y
ield
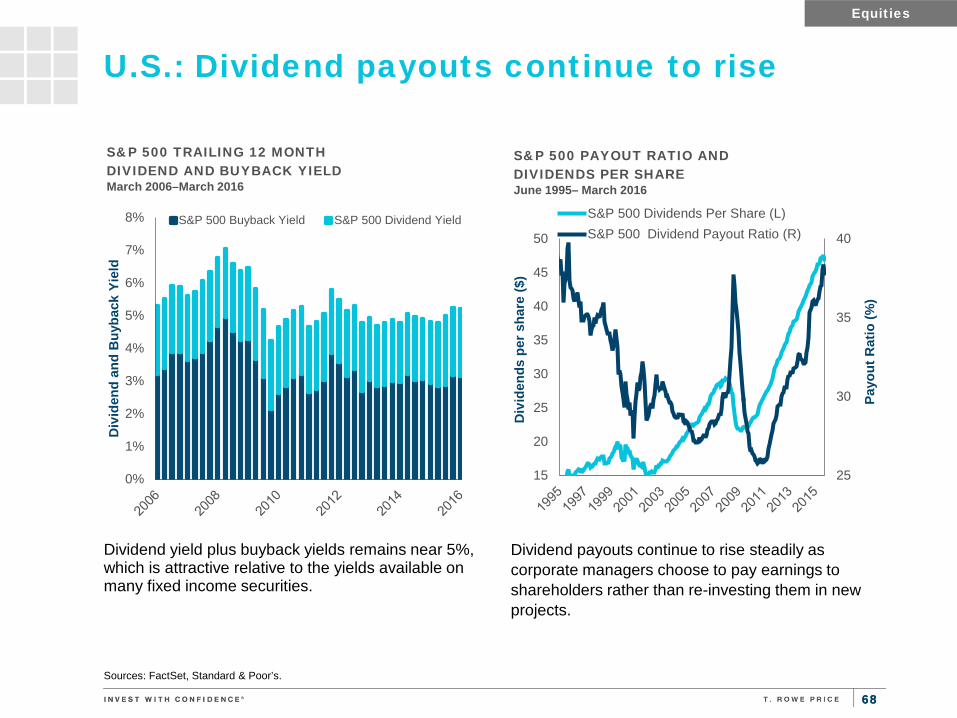
S&P 500 TRAILING 12 MONTH DIVIDEND AND BUYBACK YIELD March 2006–March 2016
S&P 500 Buyback Yield S&P 500 Dividend Yield
Dividend yield plus buyback yields remains near 5%, which is attractive relative to the yields available on many fixed income securities.
Sources: FactSet, Standard & Poor’s.
U.S.: Dividend payouts continue to rise
Dividend payouts continue to rise steadily as corporate managers choose to pay earnings to shareholders rather than re-investing them in new projects.
Equities
25
30
35
40
15
20
25
30
35
40
45
50
Payo
ut R
atio
(%)
Div
iden
ds p
er s
hare
($)
S&P 500 PAYOUT RATIO AND DIVIDENDS PER SHARE June 1995– March 2016
S&P 500 Dividends Per Share (L)S&P 500 Dividend Payout Ratio (R)

69 69
Equity markets typically do not remain range-bound for an extended period of time. However, this has been the case for the S&P 500 since mid-2014.
U.S.: Flat markets are relatively rare
Equities
8%
11% 13%
7%
17%
9% 7%
11%
17%
12%
8% 6%
33%
25%
18%
11%
25%
42%
55%
64%
0%
10%
20%
30%
40%
50%
60%
70%
1 Year Periods 2 Year Periods 3 Year Periods 5 Year Periods
Cum
ulat
ive
Ret
urns
S&P 500 PRICE RETURN Rolling Monthly Periods, January 1927 to March 2016
-20% or worse -5% to -20% -5% to +%5
+5% to +20% +20% or better
1,000
1,200
1,400
1,600
1,800
2,000
2,200
2012 2013 2014 2015 2016
Inde
x Le
vel
S&P 500 INDEX January 2012 to March 2016
Past performance cannot guarantee future results. Sources: FactSet, Standard & Poor’s
70 70
$100
$120
$140
$160
$180
2013 2014 2015 2016Ea
rnin
gs /
Shar
e
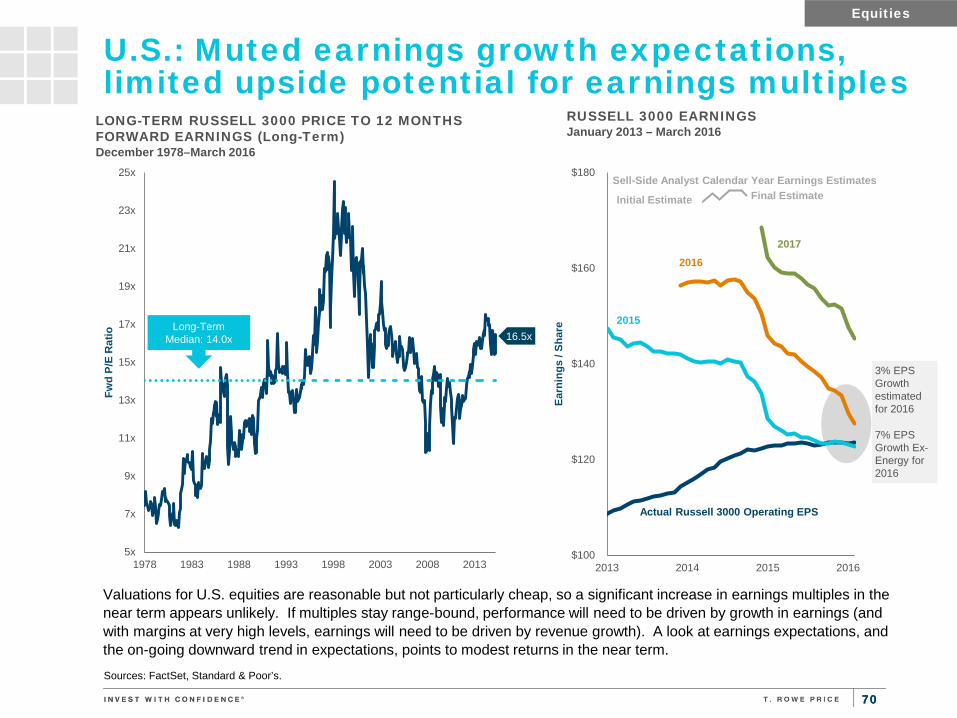
Valuations for U.S. equities are reasonable but not particularly cheap, so a significant increase in earnings multiples in the near term appears unlikely. If multiples stay range-bound, performance will need to be driven by growth in earnings (and with margins at very high levels, earnings will need to be driven by revenue growth). A look at earnings expectations, and the on-going downward trend in expectations, points to modest returns in the near term.
Sources: FactSet, Standard & Poor’s.
U.S.: Muted earnings growth expectations, limited upside potential for earnings multiples
Equities
5x
7x
9x
11x
13x
15x
17x
19x
21x
23x
25x
1978 1983 1988 1993 1998 2003 2008 2013
Fwd
P/E
Rat
io
LONG-TERM RUSSELL 3000 PRICE TO 12 MONTHS FORWARD EARNINGS (Long-Term) December 1978–March 2016
Long-Term Median: 14.0x 16.5x
Initial Estimate Final Estimate
RUSSELL 3000 EARNINGS January 2013 – March 2016
2017 2016
2015
3% EPS Growth estimated for 2016
7% EPS Growth Ex-Energy for 2016
Actual Russell 3000 Operating EPS
Sell-Side Analyst Calendar Year Earnings Estimates
71 71
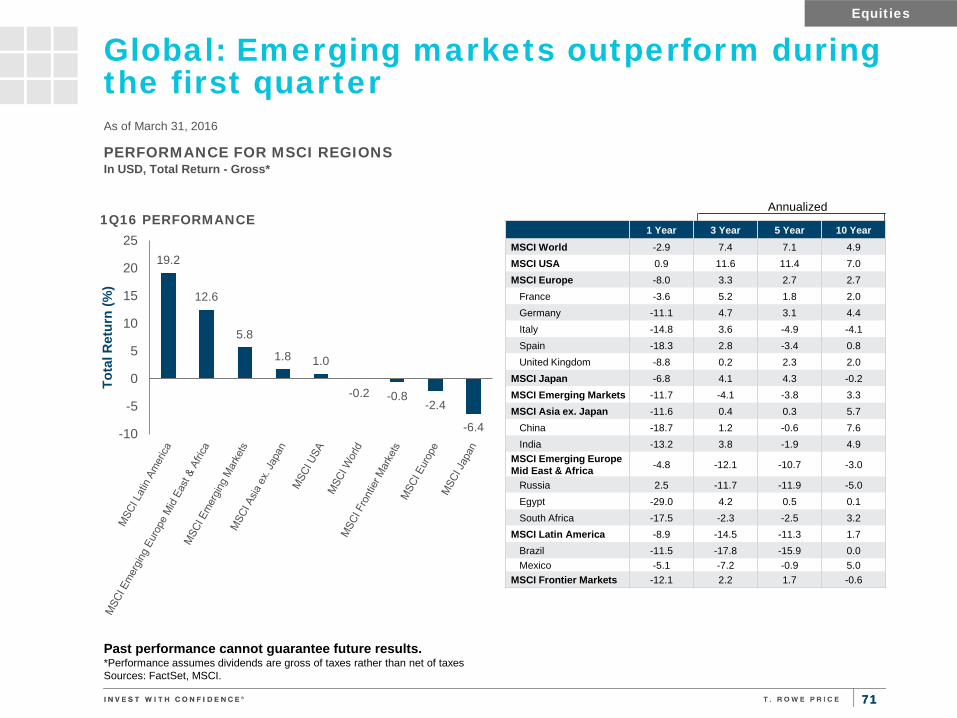
Global: Emerging markets outperform during the first quarter As of March 31, 2016
PERFORMANCE FOR MSCI REGIONS In USD, Total Return - Gross*
1 Year 3 Year 5 Year 10 Year
MSCI World -2.9 7.4 7.1 4.9 MSCI USA 0.9 11.6 11.4 7.0 MSCI Europe -8.0 3.3 2.7 2.7 France -3.6 5.2 1.8 2.0 Germany -11.1 4.7 3.1 4.4 Italy -14.8 3.6 -4.9 -4.1 Spain -18.3 2.8 -3.4 0.8 United Kingdom -8.8 0.2 2.3 2.0 MSCI Japan -6.8 4.1 4.3 -0.2 MSCI Emerging Markets -11.7 -4.1 -3.8 3.3 MSCI Asia ex. Japan -11.6 0.4 0.3 5.7 China -18.7 1.2 -0.6 7.6 India -13.2 3.8 -1.9 4.9 MSCI Emerging Europe Mid East & Africa -4.8 -12.1 -10.7 -3.0
Russia 2.5 -11.7 -11.9 -5.0 Egypt -29.0 4.2 0.5 0.1 South Africa -17.5 -2.3 -2.5 3.2 MSCI Latin America -8.9 -14.5 -11.3 1.7 Brazil -11.5 -17.8 -15.9 0.0 Mexico -5.1 -7.2 -0.9 5.0 MSCI Frontier Markets -12.1 2.2 1.7 -0.6
Annualized
Equities
19.2
12.6
5.8
1.8 1.0
-0.2 -0.8 -2.4
-6.4 -10
-5
0
5
10
15
20
25
Tota
l Ret
urn
(%)
1Q16 PERFORMANCE
Past performance cannot guarantee future results. *Performance assumes dividends are gross of taxes rather than net of taxes Sources: FactSet, MSCI.
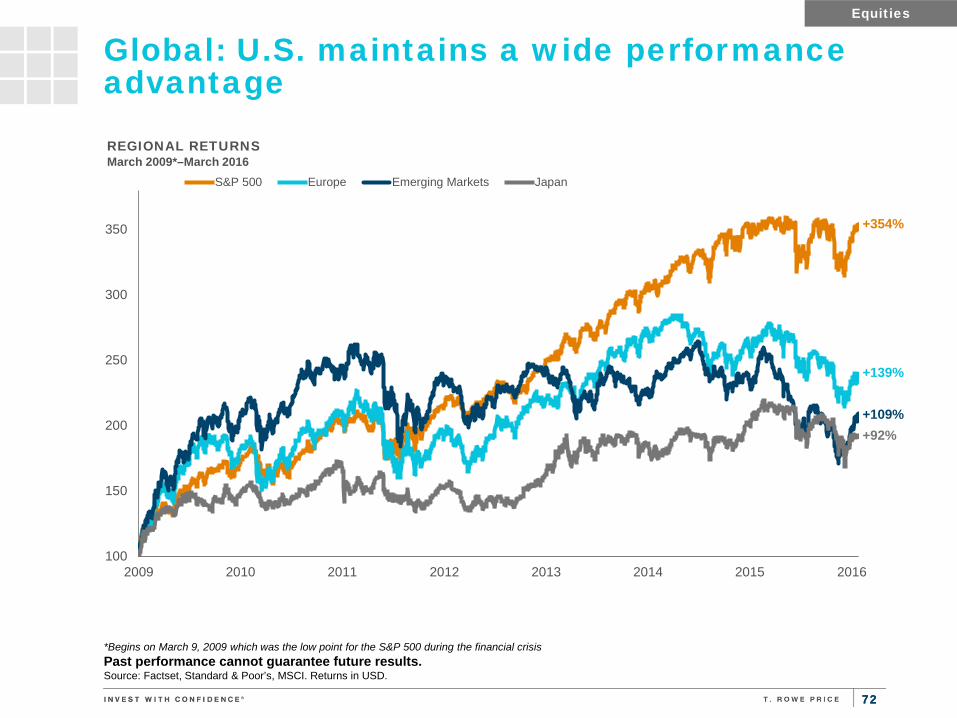
72 72
Global: U.S. maintains a wide performance advantage
Equities
+354%
+139%
+109% +92%
100
150
200
250
300
350
2009 2010 2011 2012 2013 2014 2015 2016
REGIONAL RETURNS March 2009*–March 2016
S&P 500 Europe Emerging Markets Japan
*Begins on March 9, 2009 which was the low point for the S&P 500 during the financial crisis Past performance cannot guarantee future results. Source: Factset, Standard & Poor’s, MSCI. Returns in USD.
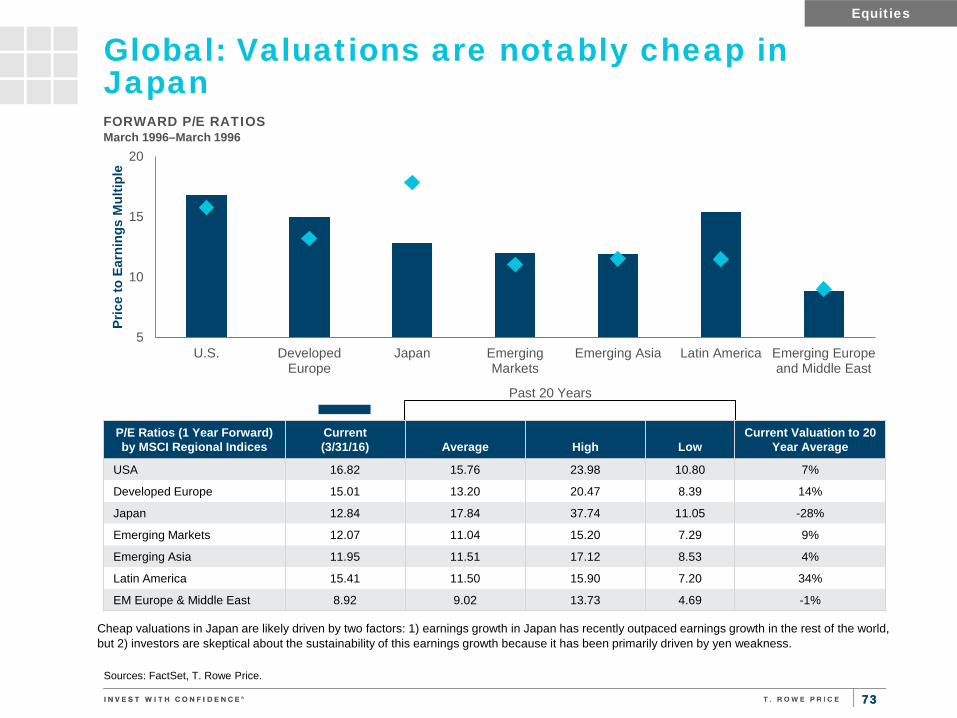
73 73
Global: Valuations are notably cheap in Japan
Sources: FactSet, T. Rowe Price.
P/E Ratios (1 Year Forward) by MSCI Regional Indices
Current (3/31/16) Average High Low
Current Valuation to 20 Year Average
USA 16.82 15.76 23.98 10.80 7%
Developed Europe 15.01 13.20 20.47 8.39 14%
Japan 12.84 17.84 37.74 11.05 -28%
Emerging Markets 12.07 11.04 15.20 7.29 9%
Emerging Asia 11.95 11.51 17.12 8.53 4%
Latin America 15.41 11.50 15.90 7.20 34%
EM Europe & Middle East 8.92 9.02 13.73 4.69 -1%
Past 20 Years
Equities
5
10
15
20
U.S. DevelopedEurope
Japan EmergingMarkets
Emerging Asia Latin America Emerging Europeand Middle East
Pric
e to
Ear
ning
s M
ultip
le
FORWARD P/E RATIOS March 1996–March 1996
Cheap valuations in Japan are likely driven by two factors: 1) earnings growth in Japan has recently outpaced earnings growth in the rest of the world, but 2) investors are skeptical about the sustainability of this earnings growth because it has been primarily driven by yen weakness.

74 74
Multiple expansion drove recent gains in the U.S. and Europe as investors focused on the potential for sustainable growth and profitability. Meanwhile, investors are skeptical that Japanese earnings can continue to accelerate without a weak yen.
Global: Multiple expansion drives a large share of recent gains in U.S. and Europe
Defensive market sectors have generally been rewarded with significant P/E multiple increases, despite limited improvements in earnings.
%
%
Equities
-40
-30
-20
-10
0
10
20
30
40
50
60
S&P 500 MSCI Japan MSCIEurope
MSCIEmergingMarkets
Perc
ent (
%)
REGIONAL RETURNS BY MULTIPLE EXPANSION AND EARNINGS GROWTH March 2013–March 2016
Trailing PE ChangeEPS ChangePrice Return
-50-40-30-20-10
01020304050
Perc
ent (
%)
GLOBAL SECTOR RETURNS BY MULTIPLE EXPANSION AND EARNINGS GROWTH MSCI All Country World Index, March 2013–March 2016
Trailing PE ChangeEPS ChangePrice Return
Past performance cannot guarantee future results. Sources: FactSet, MSCI. Returns in USD.
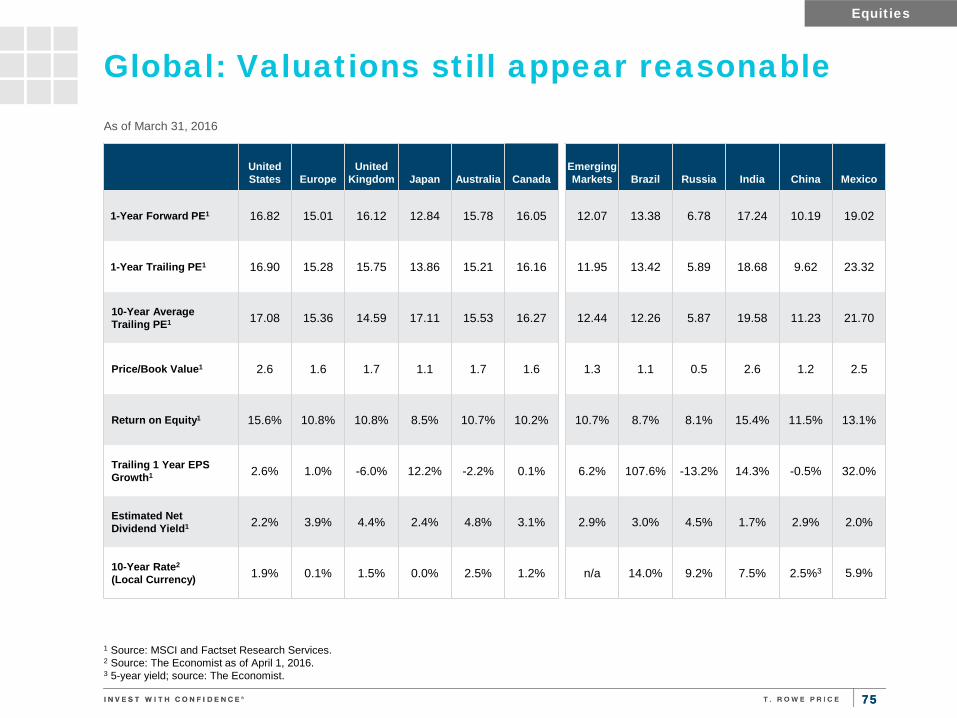
75 75
Global: Valuations still appear reasonable As of March 31, 2016
1 Source: MSCI and Factset Research Services. 2 Source: The Economist as of April 1, 2016. 3 5-year yield; source: The Economist.
United States Europe
United Kingdom Japan Australia Canada
Emerging Markets Brazil Russia India China Mexico
1-Year Forward PE1 16.82 15.01 16.12 12.84 15.78 16.05 12.07 13.38 6.78 17.24 10.19 19.02
1-Year Trailing PE1 16.90 15.28 15.75 13.86 15.21 16.16 11.95 13.42 5.89 18.68 9.62 23.32
10-Year Average Trailing PE1 17.08 15.36 14.59 17.11 15.53 16.27 12.44 12.26 5.87 19.58 11.23 21.70
Price/Book Value1 2.6 1.6 1.7 1.1 1.7 1.6 1.3 1.1 0.5 2.6 1.2 2.5
Return on Equity1 15.6% 10.8% 10.8% 8.5% 10.7% 10.2% 10.7% 8.7% 8.1% 15.4% 11.5% 13.1%
Trailing 1 Year EPS Growth1 2.6% 1.0% -6.0% 12.2% -2.2% 0.1% 6.2% 107.6% -13.2% 14.3% -0.5% 32.0%
Estimated Net Dividend Yield1 2.2% 3.9% 4.4% 2.4% 4.8% 3.1% 2.9% 3.0% 4.5% 1.7% 2.9% 2.0%
10-Year Rate2 (Local Currency) 1.9% 0.1% 1.5% 0.0% 2.5% 1.2% n/a 14.0% 9.2% 7.5% 2.5%3 5.9%
Equities
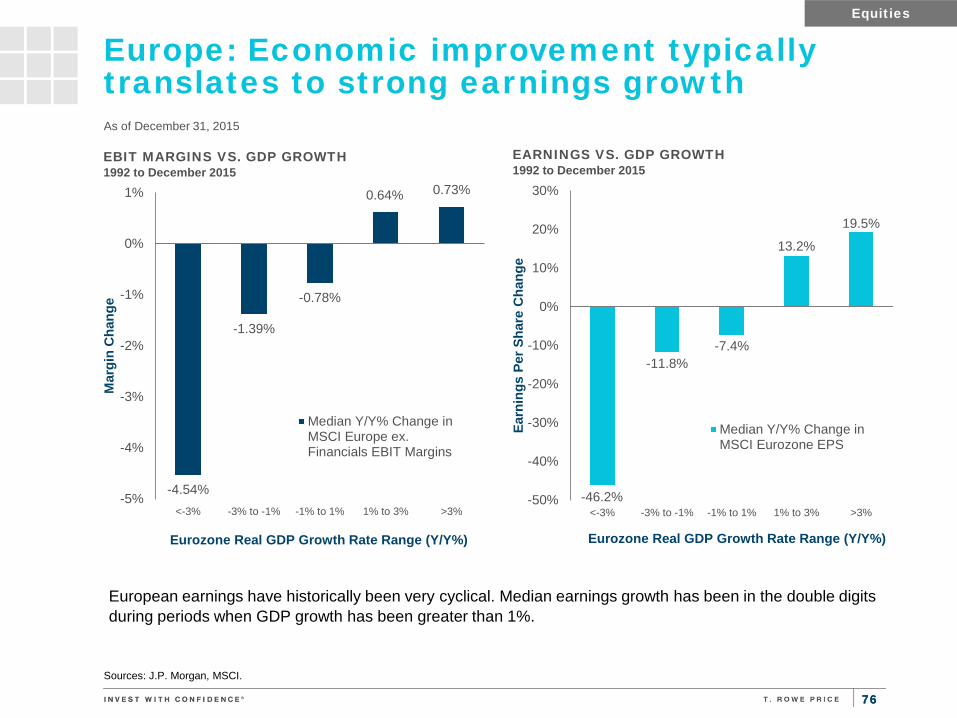
76 76
European earnings have historically been very cyclical. Median earnings growth has been in the double digits during periods when GDP growth has been greater than 1%.
As of December 31, 2015
Sources: J.P. Morgan, MSCI.
Europe: Economic improvement typically translates to strong earnings growth
Equities
-4.54%
-1.39%
-0.78%
0.64% 0.73%
-5%
-4%
-3%
-2%
-1%
0%
1%
<-3% -3% to -1% -1% to 1% 1% to 3% >3%
Mar
gin
Cha
nge
Eurozone Real GDP Growth Rate Range (Y/Y%)
EBIT MARGINS VS. GDP GROWTH 1992 to December 2015
Median Y/Y% Change inMSCI Europe ex.Financials EBIT Margins
-46.2%
-11.8% -7.4%
13.2%
19.5%
-50%
-40%
-30%
-20%
-10%
0%
10%
20%
30%
<-3% -3% to -1% -1% to 1% 1% to 3% >3%Ea
rnin
gs P
er S
hare
Cha
nge
Eurozone Real GDP Growth Rate Range (Y/Y%)
EARNINGS VS. GDP GROWTH 1992 to December 2015
Median Y/Y% Change inMSCI Eurozone EPS

77 77
As of March 31, 2016
Sources: Factset, MSCI, Standard & Poor’s.
Europe: P/Es attractive on “normalized” earnings basis
Equities
13.3x
21.5x
10
12
14
16
18
20
22
24
2011 2012 2013 2014 2015
P/E
Bas
ed o
n 10
Yea
r Ave
rage
Ear
ning
s
P/E BASED ON "NORMALIZED" PRICE TO EARNINGS Past 5 Years
MSCI Europe ex. UK S&P 500
European equities do not appear particularly cheap on traditional P/E measures, primarily due to the fact earnings remain well below pre-crisis levels. However, on a normalized earnings basis European equities appear very cheap – indicating that a rebound in earnings would likely produce strong returns.

78 78
As of March 31, 2016
Europe: Safer areas outperform on the downside and upside
Equities
Past performance cannot guarantee future results. Source: FactSet, MSCI
-35
-30
-25
-20
-15
-10
-5
0
5
10
Mar-15 Jun-15 Sep-15 Dec-15 Mar-16
Cum
mul
ativ
e R
etur
n (%
)
MSCI EUROPE: REGIONAL RETURNS 1 Year Ending March 31, 2016
Periphery Core
-30
-25
-20
-15
-10
-5
0
5
10
Mar-15 Jun-15 Sep-15 Dec-15 Mar-16C
umm
ulat
ive
Ret
urn
(%)
MSCI EUROPE: STYLE RETURNS 1 Year Ending March 31, 2016
Cyclical Defensive
With the core outperforming the periphery and defensives outperforming cyclicals, both during downturns and upturns, it is clear that investors in Europe remain cautious.
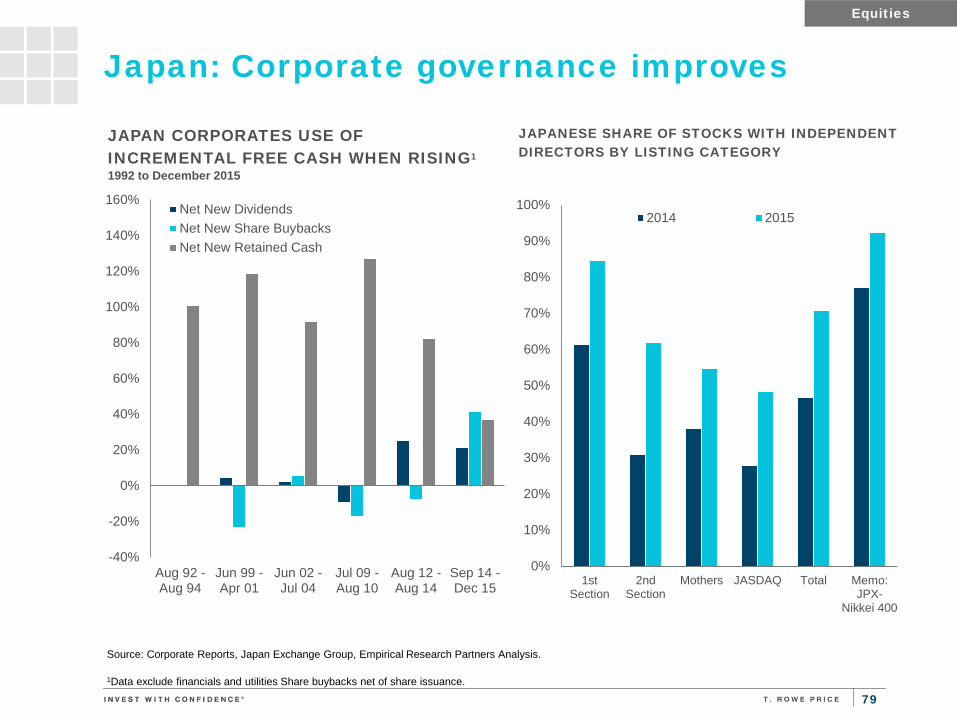
79
Japan: Corporate governance improves
0%
10%
20%
30%
40%
50%
60%
70%
80%
90%
100%
1stSection
2ndSection
Mothers JASDAQ Total Memo:JPX-
Nikkei 400
JAPANESE SHARE OF STOCKS WITH INDEPENDENT DIRECTORS BY LISTING CATEGORY
2014 2015
Equities
-40%
-20%
0%
20%
40%
60%
80%
100%
120%
140%
160%
Aug 92 -Aug 94
Jun 99 -Apr 01
Jun 02 -Jul 04
Jul 09 -Aug 10
Aug 12 -Aug 14
Sep 14 -Dec 15
JAPAN CORPORATES USE OF INCREMENTAL FREE CASH WHEN RISING1
1992 to December 2015
Net New DividendsNet New Share BuybacksNet New Retained Cash
Source: Corporate Reports, Japan Exchange Group, Empirical Research Partners Analysis.
1Data exclude financials and utilities Share buybacks net of share issuance.
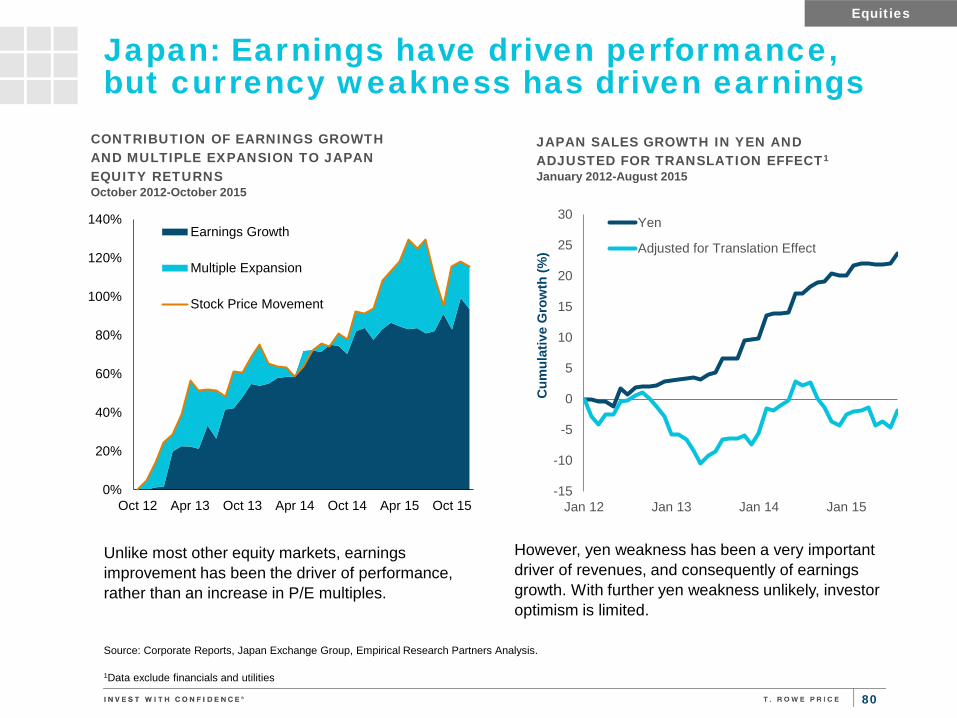
80
Japan: Earnings have driven performance, but currency weakness has driven earnings
Equities
0%
20%
40%
60%
80%
100%
120%
140%
Oct 12 Apr 13 Oct 13 Apr 14 Oct 14 Apr 15 Oct 15
CONTRIBUTION OF EARNINGS GROWTH AND MULTIPLE EXPANSION TO JAPAN EQUITY RETURNS October 2012-October 2015
Earnings Growth
Multiple Expansion
Stock Price Movement
-15
-10
-5
0
5
10
15
20
25
30
Jan 12 Jan 13 Jan 14 Jan 15
Cum
ulat
ive
Gro
wth
(%)
JAPAN SALES GROWTH IN YEN AND ADJUSTED FOR TRANSLATION EFFECT1
January 2012-August 2015
Yen
Adjusted for Translation Effect
Unlike most other equity markets, earnings improvement has been the driver of performance, rather than an increase in P/E multiples.
However, yen weakness has been a very important driver of revenues, and consequently of earnings growth. With further yen weakness unlikely, investor optimism is limited.
Source: Corporate Reports, Japan Exchange Group, Empirical Research Partners Analysis.
1Data exclude financials and utilities

81 81
579
11131517192123252729
Pric
e/Ea
rnin
gs R
atio
DEVELOPED VS. EMERGING MARKETS 12 Months Forward P/E Ratio January 1996–March 2016
MSCI World LT AVERAGE
MSCI EM LT AVERAGE
MSCI World Long Term
Average 16.2x
MSCI EM Long Term Average
11.8x 8
10
12
14
16
18
20
22
24
26
28
30
Pric
e/Ea
rnin
gs R
atio
U.S. VS. DEVELOPED MARKETS 12 Months Forward P/E Ratio January 1996–March 2016
S&P 500 (Operating Basis) LT AVERAGEMSCI EAFE LT AVERAGE
Forward P/E ratios in the U.S. and other developed markets have risen since mid-2011, and appear to be hovering in a “trading range”. The U.S. is commanding a premium, which is not abnormal.
Sources: FactSet, Standard & Poor’s, MSCI.
Emerging Markets: Valuation gap versus developed markets remains significant
Emerging markets equities are currently trading 4.0x lower than developed markets, which is close to the long term average of 4.4x.
S&P 500 Long Term
Average 17.0x
MSCI EAFE Long Term
Average 15.8x
Equities
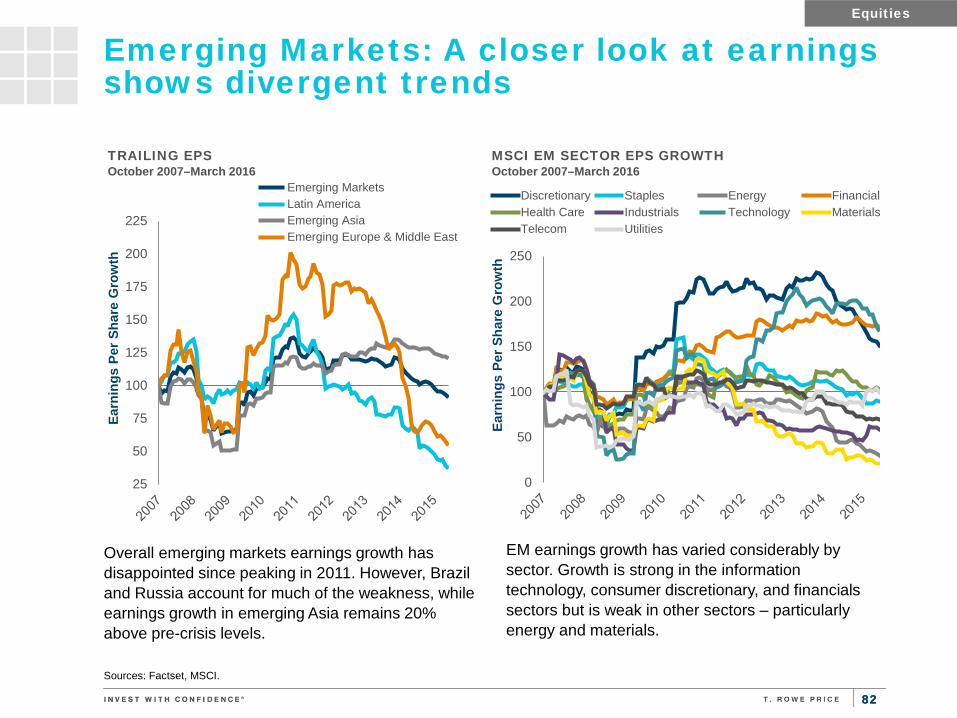
82 82
Overall emerging markets earnings growth has disappointed since peaking in 2011. However, Brazil and Russia account for much of the weakness, while earnings growth in emerging Asia remains 20% above pre-crisis levels.
Sources: Factset, MSCI.
Emerging Markets: A closer look at earnings shows divergent trends
EM earnings growth has varied considerably by sector. Growth is strong in the information technology, consumer discretionary, and financials sectors but is weak in other sectors – particularly energy and materials.
Equities
25
50
75
100
125
150
175
200
225
Earn
ings
Per
Sha
re G
row
th
TRAILING EPS October 2007–March 2016
Emerging MarketsLatin AmericaEmerging AsiaEmerging Europe & Middle East
0
50
100
150
200
250
Earn
ings
Per
Sha
re G
row
th
MSCI EM SECTOR EPS GROWTH October 2007–March 2016 Discretionary Staples Energy Financial
Health Care Industrials Technology MaterialsTelecom Utilities
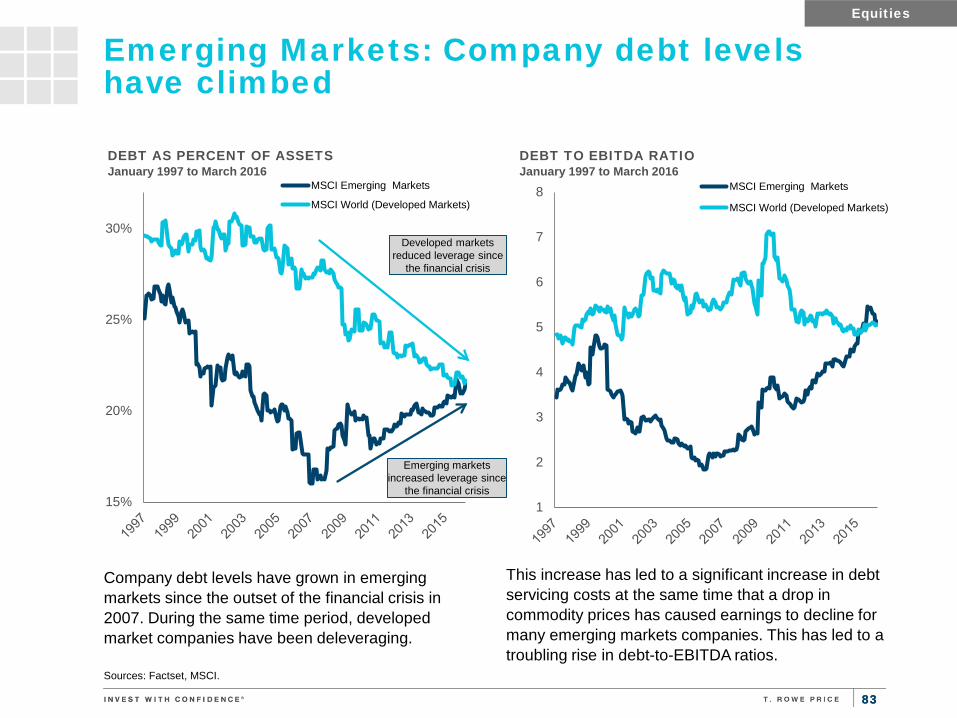
83 83
Company debt levels have grown in emerging markets since the outset of the financial crisis in 2007. During the same time period, developed market companies have been deleveraging.
Sources: Factset, MSCI.
Emerging Markets: Company debt levels have climbed
This increase has led to a significant increase in debt servicing costs at the same time that a drop in commodity prices has caused earnings to decline for many emerging markets companies. This has led to a troubling rise in debt-to-EBITDA ratios.
Equities
15%
20%
25%
30%
DEBT AS PERCENT OF ASSETS January 1997 to March 2016
MSCI Emerging Markets
MSCI World (Developed Markets)
1
2
3
4
5
6
7
8
DEBT TO EBITDA RATIO January 1997 to March 2016
MSCI Emerging Markets
MSCI World (Developed Markets)
Developed markets reduced leverage since
the financial crisis
Emerging markets increased leverage since
the financial crisis
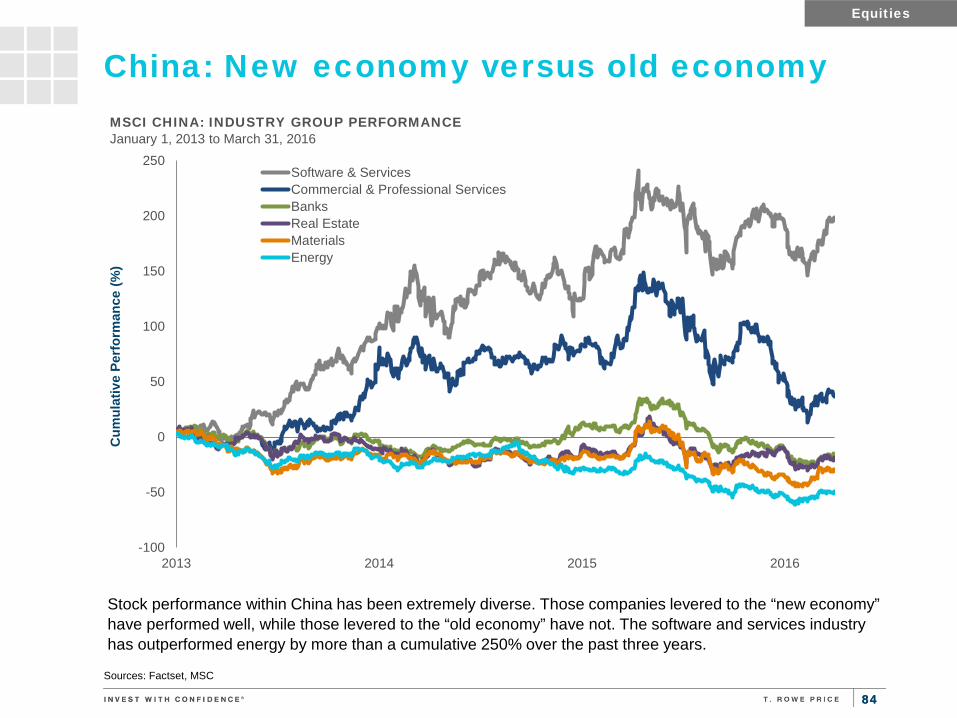
84 84
Stock performance within China has been extremely diverse. Those companies levered to the “new economy” have performed well, while those levered to the “old economy” have not. The software and services industry has outperformed energy by more than a cumulative 250% over the past three years.
Sources: Factset, MSC
China: New economy versus old economy
Equities
-100
-50
0
50
100
150
200
250
2013 2014 2015 2016
Cum
ulat
ive
Perf
orm
ance
(%)
MSCI CHINA: INDUSTRY GROUP PERFORMANCE January 1, 2013 to March 31, 2016
Software & ServicesCommercial & Professional ServicesBanksReal EstateMaterialsEnergy
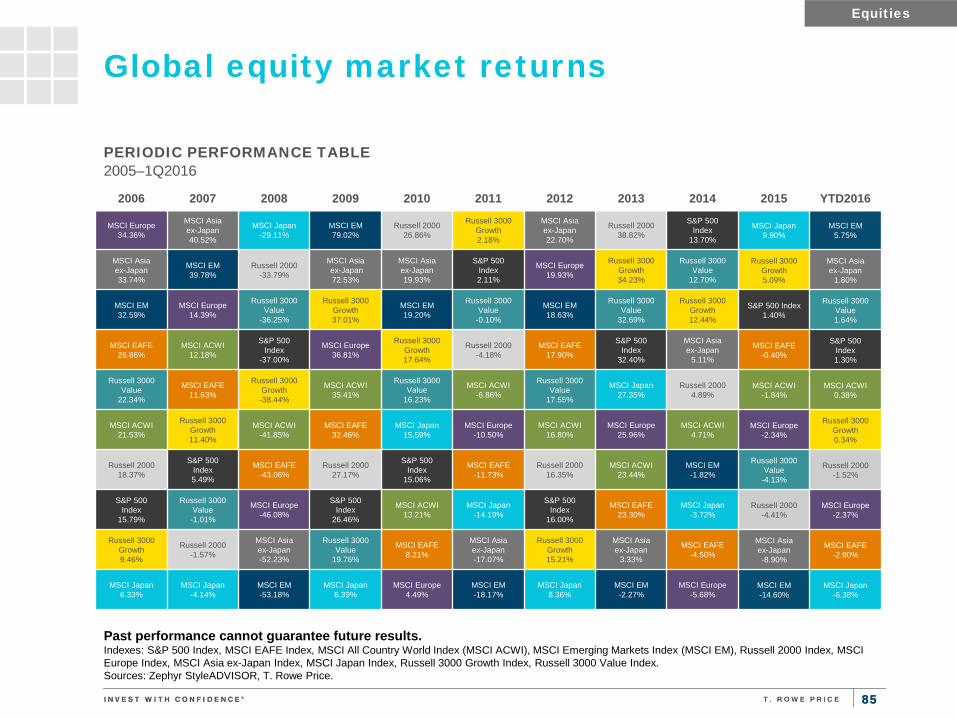
85 85
Global equity market returns
2006 2007 2008 2009 2010 2011 2012 2013 2014 2015 YTD2016
MSCI Europe 34.36%
MSCI Asia ex-Japan 40.52%
MSCI Japan -29.11%
MSCI EM 79.02%
Russell 2000 26.86%
Russell 3000 Growth 2.18%
MSCI Asia ex-Japan 22.70%
Russell 2000 38.82%
S&P 500 Index
13.70%
MSCI Japan 9.90%
MSCI EM 5.75%
MSCI Asia ex-Japan 33.74%
MSCI EM 39.78%
Russell 2000 -33.79%
MSCI Asia ex-Japan 72.53%
MSCI Asia ex-Japan 19.93%
S&P 500 Index 2.11%
MSCI Europe 19.93%
Russell 3000 Growth 34.23%
Russell 3000 Value
12.70%
Russell 3000 Growth 5.09%
MSCI Asia ex-Japan
1.80%
MSCI EM 32.59%
MSCI Europe 14.39%
Russell 3000 Value
-36.25%
Russell 3000 Growth 37.01%
MSCI EM 19.20%
Russell 3000 Value
-0.10%
MSCI EM 18.63%
Russell 3000 Value
32.69%
Russell 3000 Growth 12.44%
S&P 500 Index 1.40%
Russell 3000 Value 1.64%
MSCI EAFE 26.86%
MSCI ACWI 12.18%
S&P 500 Index
-37.00%
MSCI Europe 36.81%
Russell 3000 Growth 17.64%
Russell 2000 -4.18%
MSCI EAFE 17.90%
S&P 500 Index
32.40%
MSCI Asia ex-Japan
5.11%
MSCI EAFE -0.40%
S&P 500 Index 1.30%
Russell 3000 Value
22.34%
MSCI EAFE 11.63%
Russell 3000 Growth -38.44%
MSCI ACWI 35.41%
Russell 3000 Value
16.23%
MSCI ACWI -6.86%
Russell 3000 Value
17.55%
MSCI Japan 27.35%
Russell 2000 4.89%
MSCI ACWI -1.84%
MSCI ACWI 0.38%
MSCI ACWI 21.53%
Russell 3000 Growth 11.40%
MSCI ACWI -41.85%
MSCI EAFE 32.46%
MSCI Japan 15,59%
MSCI Europe -10.50%
MSCI ACWI 16.80%
MSCI Europe 25.96%
MSCI ACWI 4.71%
MSCI Europe -2.34%
Russell 3000 Growth 0.34%
Russell 2000 18.37%
S&P 500 Index 5.49%
MSCI EAFE -43.06%
Russell 2000 27.17%
S&P 500 Index
15.06%
MSCI EAFE -11.73%
Russell 2000 16.35%
MSCI ACWI 23.44%
MSCI EM -1.82%
Russell 3000 Value
-4.13%
Russell 2000 -1.52%
S&P 500 Index
15.79%
Russell 3000 Value
-1.01%
MSCI Europe -46.08%
S&P 500 Index
26.46%
MSCI ACWI 13.21%
MSCI Japan -14.19%
S&P 500 Index
16.00%
MSCI EAFE 23.30%
MSCI Japan -3.72%
Russell 2000 -4.41%
MSCI Europe -2.37%
Russell 3000 Growth 9.46%
Russell 2000 -1.57%
MSCI Asia ex-Japan -52.23%
Russell 3000 Value
19.76%
MSCI EAFE 8.21%
MSCI Asia ex-Japan -17.07%
Russell 3000 Growth 15.21%
MSCI Asia ex-Japan
3.33%
MSCI EAFE -4.50%
MSCI Asia ex-Japan -8.90%
MSCI EAFE -2.90%
MSCI Japan 6.33%
MSCI Japan -4.14%
MSCI EM -53.18%
MSCI Japan 6.39%
MSCI Europe 4.49%
MSCI EM -18.17%
MSCI Japan 8.36%
MSCI EM -2.27%
MSCI Europe -5.68%
MSCI EM -14.60%
MSCI Japan -6.38%
PERIODIC PERFORMANCE TABLE 2005–1Q2016
Equities
Past performance cannot guarantee future results. Indexes: S&P 500 Index, MSCI EAFE Index, MSCI All Country World Index (MSCI ACWI), MSCI Emerging Markets Index (MSCI EM), Russell 2000 Index, MSCI Europe Index, MSCI Asia ex-Japan Index, MSCI Japan Index, Russell 3000 Growth Index, Russell 3000 Value Index. Sources: Zephyr StyleADVISOR, T. Rowe Price.
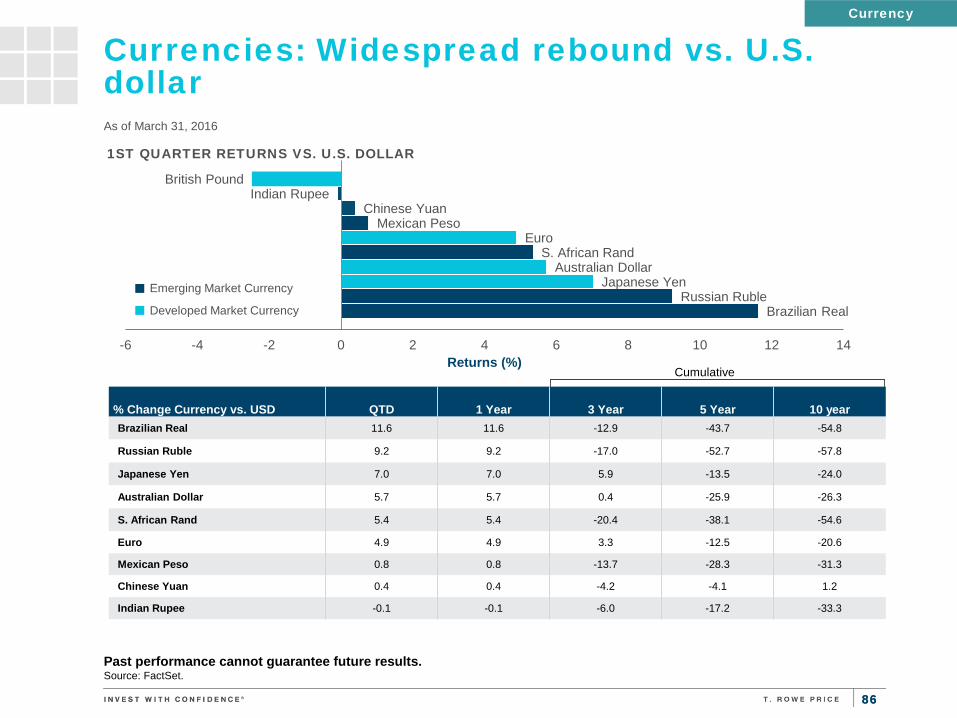
86 86
Currencies: Widespread rebound vs. U.S. dollar
% Change Currency vs. USD QTD 1 Year 3 Year 5 Year 10 year Brazilian Real 11.6 11.6 -12.9 -43.7 -54.8
Russian Ruble 9.2 9.2 -17.0 -52.7 -57.8
Japanese Yen 7.0 7.0 5.9 -13.5 -24.0
Australian Dollar 5.7 5.7 0.4 -25.9 -26.3
S. African Rand 5.4 5.4 -20.4 -38.1 -54.6
Euro 4.9 4.9 3.3 -12.5 -20.6
Mexican Peso 0.8 0.8 -13.7 -28.3 -31.3
Chinese Yuan 0.4 0.4 -4.2 -4.1 1.2
Indian Rupee -0.1 -0.1 -6.0 -17.2 -33.3
As of March 31, 2016
Cumulative
Currency
Emerging Market Currency
Developed Market Currency
Past performance cannot guarantee future results. Source: FactSet.
Brazilian Real Russian Ruble
Japanese Yen Australian Dollar
S. African Rand Euro
Mexican Peso Chinese Yuan
Indian Rupee British Pound
-6 -4 -2 0 2 4 6 8 10 12 14Returns (%)
1ST QUARTER RETURNS VS. U.S. DOLLAR
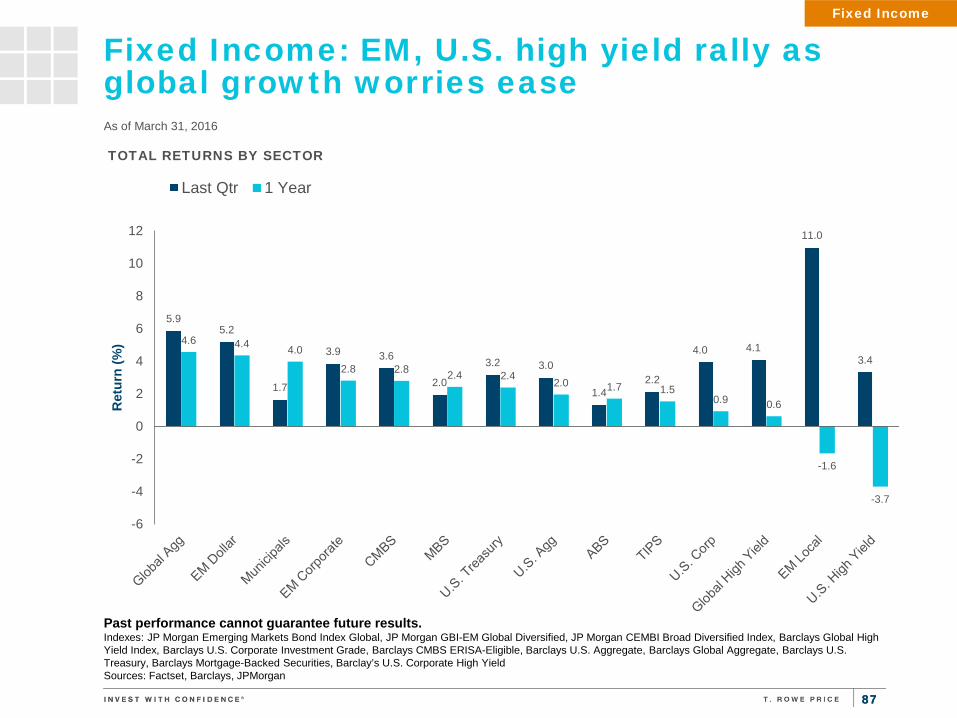
87 87
5.9 5.2
1.7
3.9 3.6
2.0
3.2 3.0
1.4 2.2
4.0 4.1
11.0
3.4
4.6 4.4 4.0
2.8 2.8 2.4 2.4 2.0 1.7 1.5 0.9 0.6
-1.6
-3.7
-6
-4
-2
0
2
4
6
8
10
12
Ret
urn
(%)
TOTAL RETURNS BY SECTOR
Last Qtr 1 Year
Fixed Income: EM, U.S. high yield rally as global growth worries ease As of March 31, 2016
Fixed Income
Past performance cannot guarantee future results. Indexes: JP Morgan Emerging Markets Bond Index Global, JP Morgan GBI-EM Global Diversified, JP Morgan CEMBI Broad Diversified Index, Barclays Global High Yield Index, Barclays U.S. Corporate Investment Grade, Barclays CMBS ERISA-Eligible, Barclays U.S. Aggregate, Barclays Global Aggregate, Barclays U.S. Treasury, Barclays Mortgage-Backed Securities, Barclay’s U.S. Corporate High Yield Sources: Factset, Barclays, JPMorgan

88 88
Credit Quality: Low-quality credits stage first-quarter turnaround As of March 31, 2016
Fixed Income
Both high yield and investment-grade credit performed well during the quarter, as fears of a credit downturn eased.
4.7
3.6 3.9 4.1 3.9
2.5
3.8 2.9
2.5 2.2
-0.7
0.1
-4.9
-10.6 -12
-10
-8
-6
-4
-2
0
2
4
6
AAA AA A BBB BB B CCC
Ret
urn
(%)
TOTAL RETURNS BY CREDIT QUALITY* Last Qtr 1 Year
Past performance cannot guarantee future results. * Ratings categories represented by Barclays U.S. Aggregate Index. Sources: Barclays, Factset

89 89
Source: Factset
U.S. Treasuries: Mid to long-term rate expectations shift even lower
Fixed Income
Yields fell across the curve amid low inflation expectations and dovish U.S. Fed. The spread between 2-year and 10-year Treasuries fell below 100 basis points for the first time in eight years as slower global growth expectations solidified.
0.0
0.5
1.0
1.5
2.0
2.5
3.0
3.5
4.0
2011 2012 2013 2014 2015 2016
Yiel
d (%
)
U.S. TREASURY NOMINAL YIELDS March 2011–March 2016
10 Year 5 Year
0.0
0.5
1.0
1.5
2.0
2.5
3.0
2011 2012 2013 2014 2015 2016Yi
eld
Spre
ad (%
)
U.S. TREASURY YIELD CURVE March 2011–March 2016
2 Year vs. 10 Year 10 Year vs. 30 Year
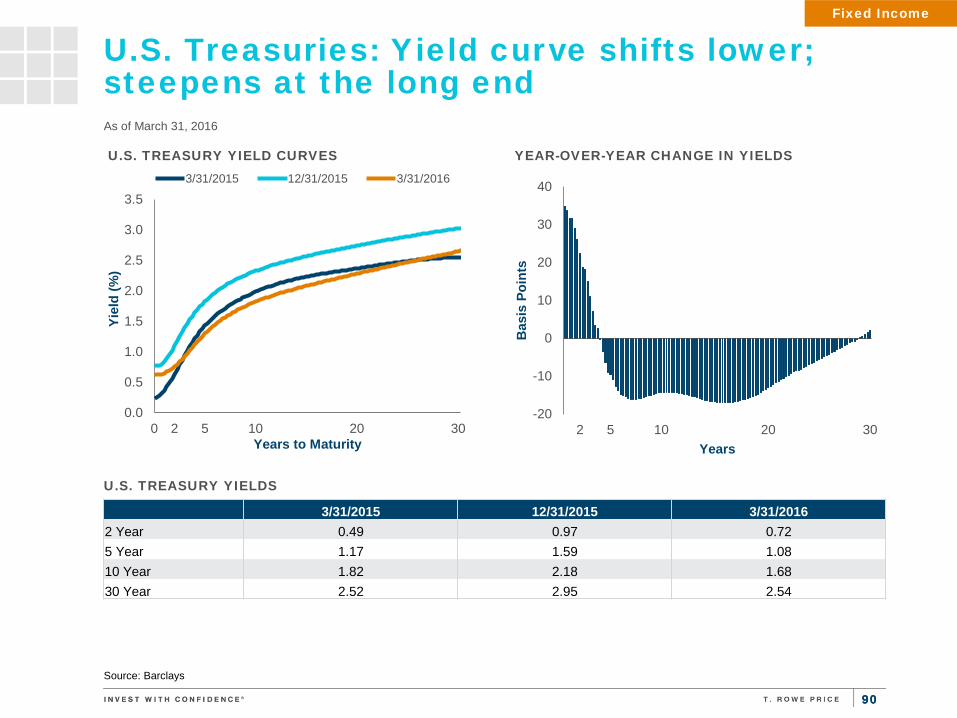
90 90
U.S. Treasuries: Yield curve shifts lower; steepens at the long end As of March 31, 2016
Source: Barclays
3/31/2015 12/31/2015 3/31/2016 2 Year 0.49 0.97 0.72 5 Year 1.17 1.59 1.08 10 Year 1.82 2.18 1.68 30 Year 2.52 2.95 2.54
U.S. TREASURY YIELDS
Fixed Income
0.0
0.5
1.0
1.5
2.0
2.5
3.0
3.5
0 2 5 10 20 30
Yiel
d (%
)
Years to Maturity
U.S. TREASURY YIELD CURVES 3/31/2015 12/31/2015 3/31/2016
-20
-10
0
10
20
30
40
2 5 10 20 30
Bas
is P
oint
s
Years
YEAR-OVER-YEAR CHANGE IN YIELDS

91 91
0.0
0.5
1.0
1.5
2.0
2.5
3.0
Perc
ent (
%)
10 YEAR BREAKEVEN SPREADS* 10 Years Ending March 2016
* Difference between 10-year nominal Treasury yield and 10-year Treasury Inflation Protected Securities (TIPS) yield Sources: Barclays, Haver Analytics, T. Rowe Price
U.S. Inflation: Inflation expectations remain subdued amid lower oil prices
Fixed Income
Energy prices continue to keep headline inflation tame, allowing the Fed to take a cautious approach to rate increases. However, base effects are moving year-over-year comparisons higher.
-2
-1
0
1
2
3
4
5
Year
-Ove
r-Ye
ar %
Cha
nge
PERSONAL CONSUMPTION EXPENDITURES (PCE) PRICE INDEX January 2006–February 2016
PCE Price Index
PCE Price Index Excl. Food & Energy
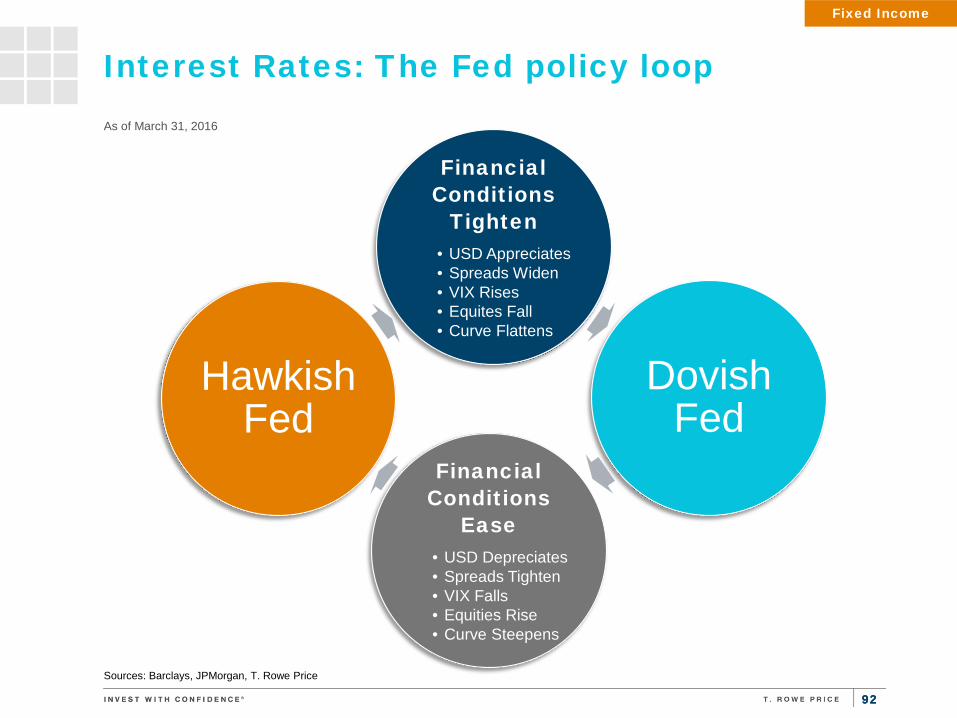
92 92
Interest Rates: The Fed policy loop As of March 31, 2016
Sources: Barclays, JPMorgan, T. Rowe Price
Financial Conditions
Tighten • USD Appreciates • Spreads Widen • VIX Rises • Equites Fall • Curve Flattens
Dovish Fed
Financial Conditions
Ease • USD Depreciates • Spreads Tighten • VIX Falls • Equities Rise • Curve Steepens
Hawkish Fed
Fixed Income
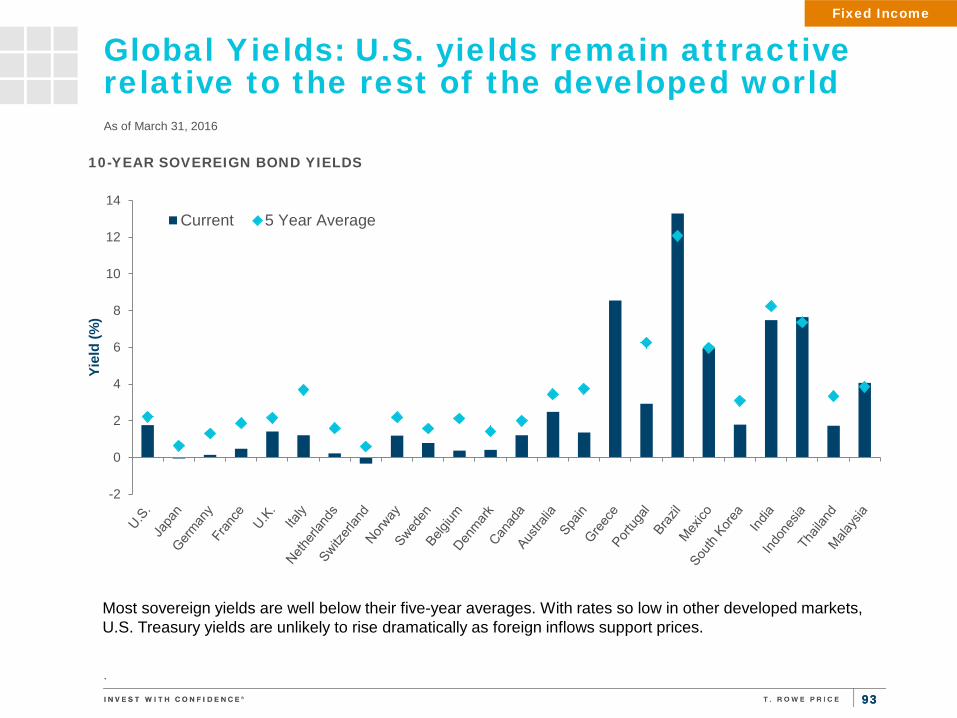
93 93
Global Yields: U.S. yields remain attractive relative to the rest of the developed world As of March 31, 2016
.
Fixed Income
-2
0
2
4
6
8
10
12
14
Yiel
d (%
)
10-YEAR SOVEREIGN BOND YIELDS
Current 5 Year Average
Most sovereign yields are well below their five-year averages. With rates so low in other developed markets, U.S. Treasury yields are unlikely to rise dramatically as foreign inflows support prices.

94 94
30
40
50
60
70
80
90
2013 2014 2015 2016
Spre
ads
(bps
)
ASSET-BACKED SECURITIES March 2013–March 2016
Barclays ABS
10 Year Median: 66 10 Year Average: 143
0
10
20
30
40
50
60
70
80
90
100
2013 2014 2015 2016
Spre
ads
(bps
)
AGENCY MBS SPREADS March 2013–March 2016
Barclays MBS
10 Year Median: 47 10 Year Average: 55
Investment Grade: Asset-backed spreads mixed, hold below 10-year average
Fundamentals remain strong in the asset backed sector, where bonds are primarily levered to consumer spending, and are well-insulated from energy weakness. None the less spreads continue to creep higher. Sources: Barclays, T. Rowe Price.
22
73
Fixed Income
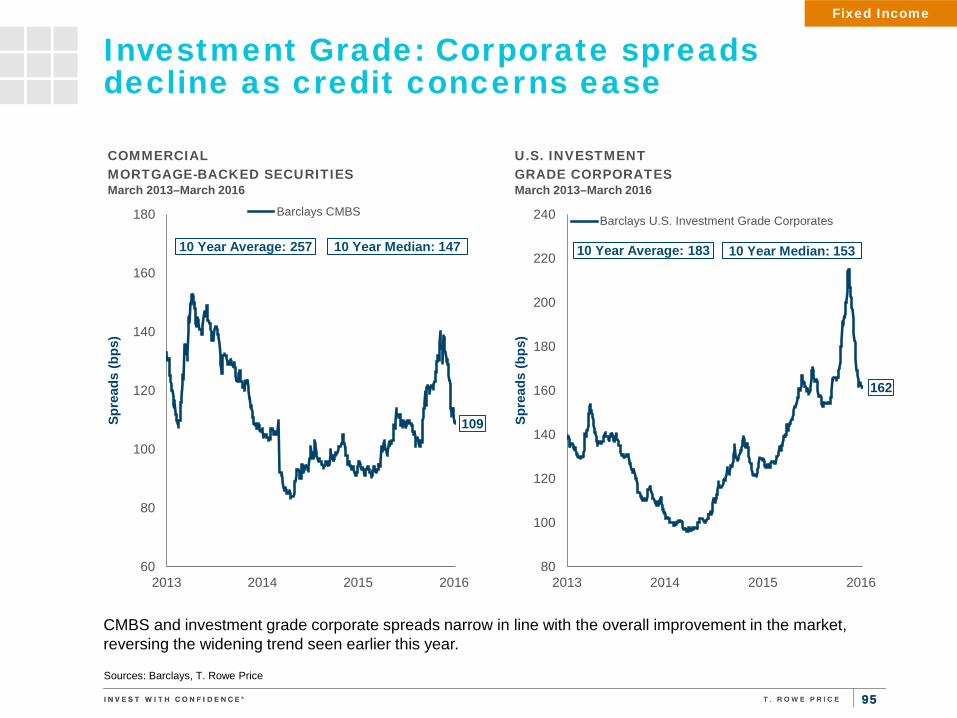
95 95
60
80
100
120
140
160
180
2013 2014 2015 2016
Spre
ads
(bps
)
COMMERCIAL MORTGAGE-BACKED SECURITIES March 2013–March 2016
Barclays CMBS
10 Year Median: 147 10 Year Average: 257
80
100
120
140
160
180
200
220
240
2013 2014 2015 2016
Spre
ads
(bps
)
U.S. INVESTMENT GRADE CORPORATES March 2013–March 2016
Barclays U.S. Investment Grade Corporates
10 Year Average: 183 10 Year Median: 153
Investment Grade: Corporate spreads decline as credit concerns ease
Sources: Barclays, T. Rowe Price
162
109
Fixed Income
CMBS and investment grade corporate spreads narrow in line with the overall improvement in the market, reversing the widening trend seen earlier this year.
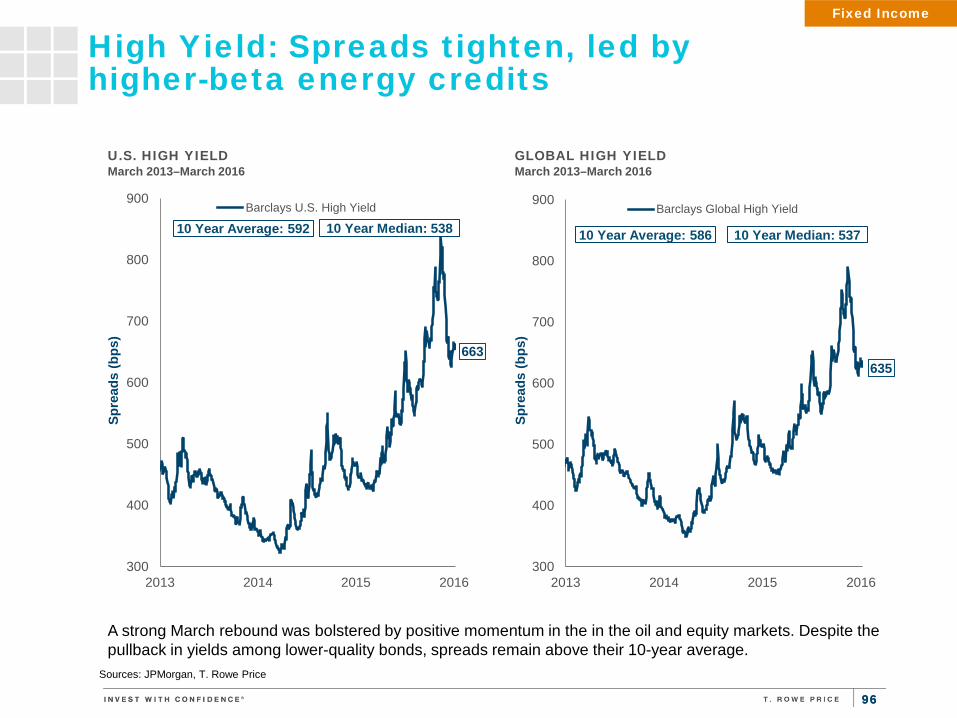
96 96
300
400
500
600
700
800
900
2013 2014 2015 2016
Spre
ads
(bps
)
GLOBAL HIGH YIELD March 2013–March 2016
Barclays Global High Yield
10 Year Median: 537 10 Year Average: 586
300
400
500
600
700
800
900
2013 2014 2015 2016
Spre
ads
(bps
)
U.S. HIGH YIELD March 2013–March 2016
Barclays U.S. High Yield
10 Year Average: 592 10 Year Median: 538
High Yield: Spreads tighten, led by higher-beta energy credits
Sources: JPMorgan, T. Rowe Price
Fixed Income
A strong March rebound was bolstered by positive momentum in the in the oil and equity markets. Despite the pullback in yields among lower-quality bonds, spreads remain above their 10-year average.
663 635

97 97
High Yield: Default rates expected to rise, driven by energy producers
*Forecasts as of March 2, 2016 **Based on the J.P. Morgan Domestic High Yield Index Sources: Barclays, J.P. Morgan, T. Rowe Price
Fixed Income
Default rates are likely to increase in 2016, led by defaults among energy producers. Barring a rebound in the price of oil, default rates among high yield energy companies could approach 20%. In the absence of a significant economic downturn, the broader market, however, is expected to see a much less dramatic increase.
27%
23%
15%
10%
2%
40%
36%
25%
16%
4%
30%
24%
11%
8%
2% 3%
1% 1% 1%
0%
5%
10%
15%
20%
25%
30%
35%
40%
45%
$20 $30 $40 $50 $60
Proj
ecte
d D
efau
lt R
ate
Oil Price Scenario
HIGH YIELD ENERGY SECTOR Barclays Default Rate Forecasts for 2016*
All Energy
Independent
Oil Field Services
Midstream
756 651
1339
300
500
700
900
1100
1300
1500
1700
1900
2100
Spre
ad to
Wor
st (b
ps)
HIGH YIELD SPREADS** December 31, 2013 Through March 31, 2016
High YieldHigh Yield Ex. Energy/Metals&MiningHigh Yield Energy
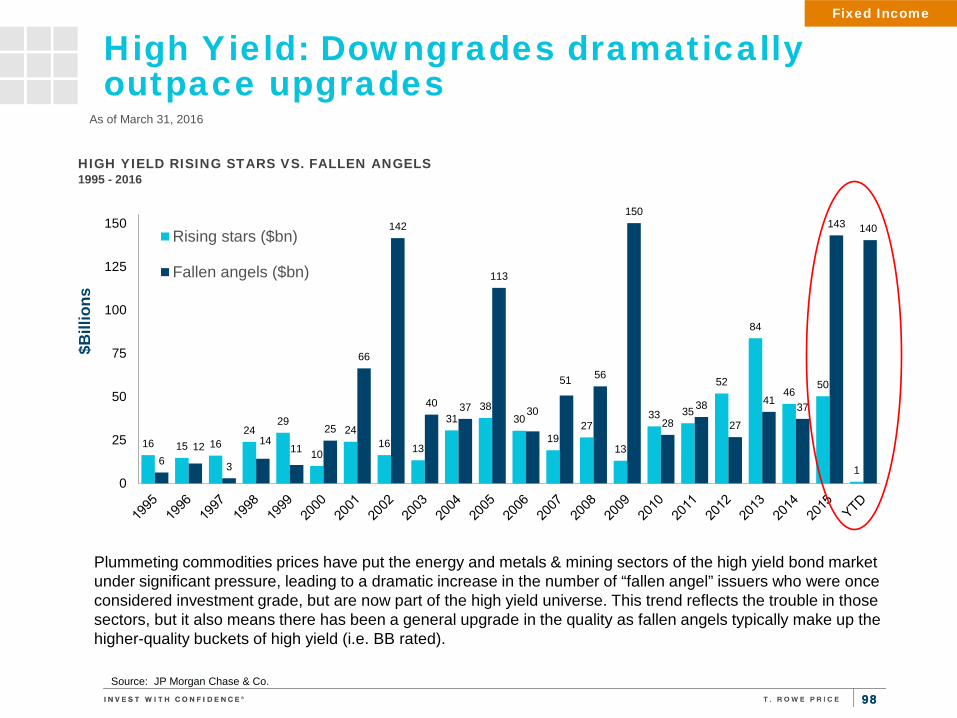
98 98
High Yield: Downgrades dramatically outpace upgrades
Source: JP Morgan Chase & Co.
As of March 31, 2016
Fixed Income
16 15 16 24
29
10
24 16 13
31 38
30
19 27
13
33 35
52
84
46 50
1 6
12
3
14 11
25
66
142
40 37
113
30
51 56
150
28
38
27
41 37
143 140
0
25
50
75
100
125
150
$Bill
ions
HIGH YIELD RISING STARS VS. FALLEN ANGELS 1995 - 2016
Rising stars ($bn)
Fallen angels ($bn)
Plummeting commodities prices have put the energy and metals & mining sectors of the high yield bond market under significant pressure, leading to a dramatic increase in the number of “fallen angel” issuers who were once considered investment grade, but are now part of the high yield universe. This trend reflects the trouble in those sectors, but it also means there has been a general upgrade in the quality as fallen angels typically make up the higher-quality buckets of high yield (i.e. BB rated).

99 99
200
250
300
350
400
450
500
550
600
2013 2014 2015 2016
Spre
ads
(bps
)
EUROPEAN HIGH YIELD March 2013–March 2016
Barclays Euro High Yield
10 Year Median: 436 10 Year Average: 528
50
70
90
110
130
150
170
190
210
2013 2014 2015 2016
Spre
ads
(bps
)
EURO INVESTMENT GRADE CORP. March 2013–March 2016
Barclays Euro Investment Grade Corporates
10 Year Median: 152 10 Year Average: 166
European Credit: Limited energy exposure, earlier credit cycle buoys high yield
Sources: JPMorgan, T. Rowe Price
Fixed Income
European credit continued to do well in first quarter. Europe’s exposure to energy producers is much smaller than that of the U.S. high yield market. Europe also appears to be in an earlier stage of the credit cycle.
129 413

100 100
5.5
6.0
6.5
7.0
7.5
Yiel
d (%
)
EM LOCAL YIELDS March 2014–March 2016
275
300
325
350
375
400
425
450
475
500
Spre
ad (b
ps)
EM CORPORATES SPREAD March 2014–March 2016
2Y Avg. 364
200
250
300
350
400
450
500
Spre
ad (b
ps)
EM $—SOVEREIGN SPREAD March 2014–March 2016
2Y Avg. 352
Emerging Markets: Yields and spreads end the quarter lower after an early spike
Sources: JP Morgan
409 420
2Y Avg. 6.6%
6.5%
Fixed Income
While concerns eased late in the quarter, anxiety about the near-term outlook for emerging markets debt is still widespread. Further tightening by the Fed may drive EM currencies lower, although much of this adjustment should already be priced in. Concerns in the corporate market are driven by the slowdown in China and associated weakness in commodity prices, as many EM companies derive revenue from the production of commodities. Sovereign issues have been primarily idiosyncratic, headlined by a very tumultuous situation in Brazil. On the bright side, valuations are attractive and long-term drivers are intact.
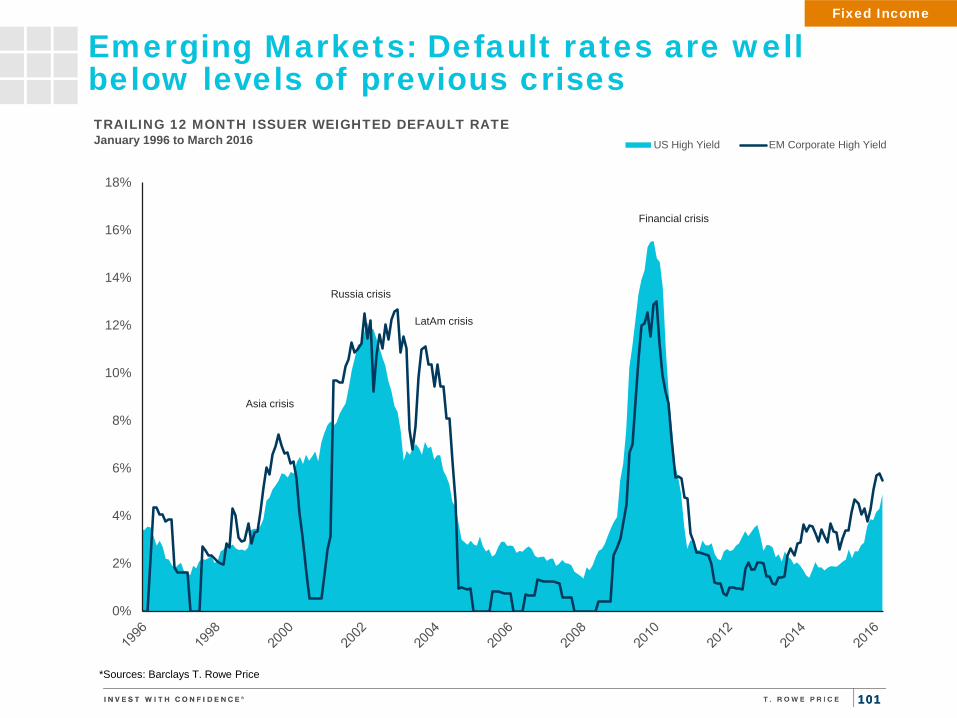
101 101
Emerging Markets: Default rates are well below levels of previous crises
*Sources: Barclays T. Rowe Price
Fixed Income
0%
2%
4%
6%
8%
10%
12%
14%
16%
18%
US High Yield EM Corporate High Yield
TRAILING 12 MONTH ISSUER WEIGHTED DEFAULT RATE January 1996 to March 2016
Financial crisis
Asia crisis
Russia crisis
LatAm crisis

102 102
Emerging Markets: Dollar-denominated debt obligations and supply peak in 2018
*Sources: Strategas
Fixed Income
$0
$20
$40
$60
$80
$100
$120
$140
$160
$180
$200
Bill
ions
of U
SD
Maturity Date
EMERGING MARKET CORPORATE & GOVERNMENT DOLLAR-DENOMINATED BOND DEBT OUTSTANDING
CorporateGovernment
'16-'50 Sum Corp: $1,398Bn Gov't: $788Bn
Investors remain concerned about the effect a stronger dollar may have on emerging market debt. The peak in maturities of dollar-denominated debt will arrive in 2017 – 2020 and will be concentrated among corporate issuers.
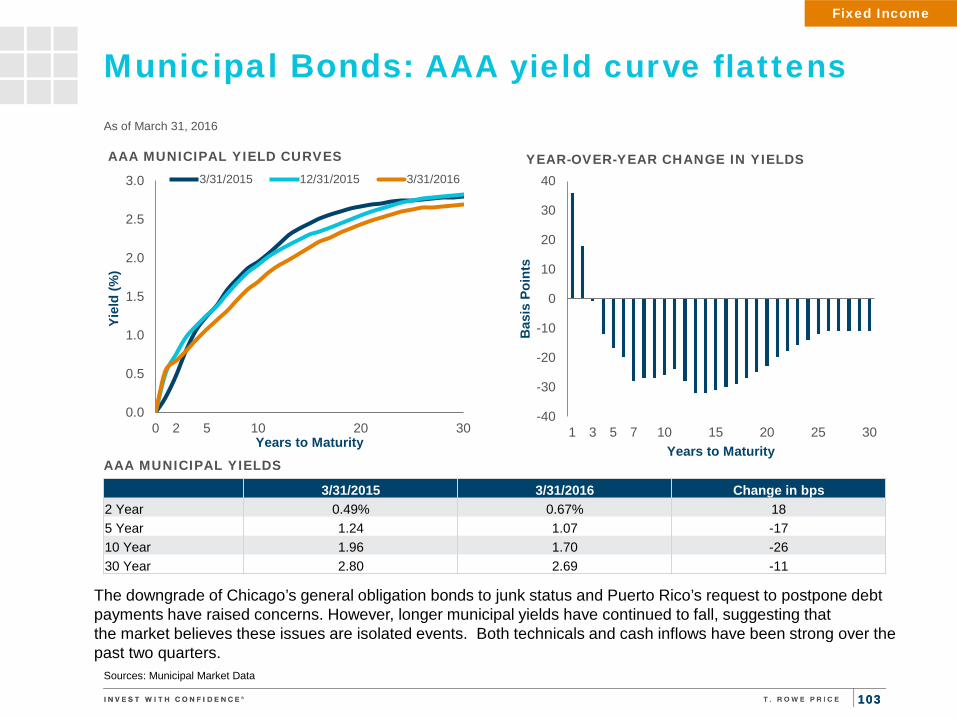
103 103
Municipal Bonds: AAA yield curve flattens
0.0
0.5
1.0
1.5
2.0
2.5
3.0
0 2 5 10 20 30
Yiel
d (%
)
Years to Maturity
AAA MUNICIPAL YIELD CURVES 3/31/2015 12/31/2015 3/31/2016
As of March 31, 2016
Sources: Municipal Market Data
3/31/2015 3/31/2016 Change in bps 2 Year 0.49% 0.67% 18 5 Year 1.24 1.07 -17 10 Year 1.96 1.70 -26 30 Year 2.80 2.69 -11
AAA MUNICIPAL YIELDS
The downgrade of Chicago’s general obligation bonds to junk status and Puerto Rico’s request to postpone debt payments have raised concerns. However, longer municipal yields have continued to fall, suggesting that the market believes these issues are isolated events. Both technicals and cash inflows have been strong over the past two quarters.
Fixed Income
-40
-30
-20
-10
0
10
20
30
40
1 3 5 7 10 15 20 25 30
Bas
is P
oint
s
Years to Maturity
YEAR-OVER-YEAR CHANGE IN YIELDS
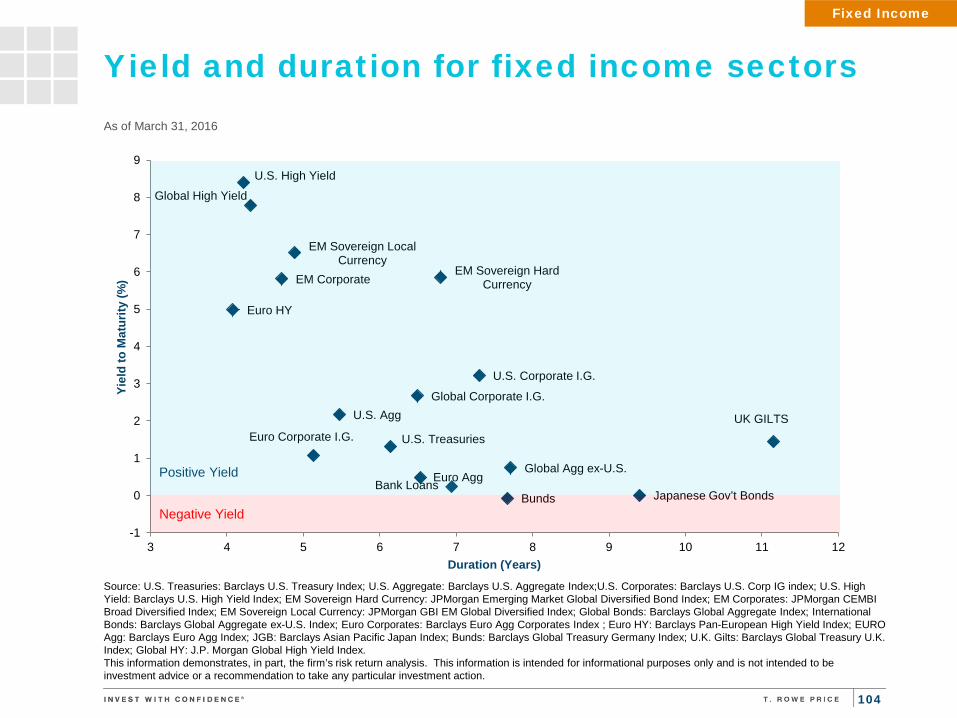
104
As of March 31, 2016
Source: U.S. Treasuries: Barclays U.S. Treasury Index; U.S. Aggregate: Barclays U.S. Aggregate Index;U.S. Corporates: Barclays U.S. Corp IG index; U.S. High Yield: Barclays U.S. High Yield Index; EM Sovereign Hard Currency: JPMorgan Emerging Market Global Diversified Bond Index; EM Corporates: JPMorgan CEMBI Broad Diversified Index; EM Sovereign Local Currency: JPMorgan GBI EM Global Diversified Index; Global Bonds: Barclays Global Aggregate Index; International Bonds: Barclays Global Aggregate ex-U.S. Index; Euro Corporates: Barclays Euro Agg Corporates Index ; Euro HY: Barclays Pan-European High Yield Index; EURO Agg: Barclays Euro Agg Index; JGB: Barclays Asian Pacific Japan Index; Bunds: Barclays Global Treasury Germany Index; U.K. Gilts: Barclays Global Treasury U.K. Index; Global HY: J.P. Morgan Global High Yield Index. This information demonstrates, in part, the firm’s risk return analysis. This information is intended for informational purposes only and is not intended to be investment advice or a recommendation to take any particular investment action.
Yield and duration for fixed income sectors
Fixed Income
U.S. Treasuries
U.S. Corporate I.G.
U.S. High Yield
EM Sovereign Hard Currency EM Corporate
EM Sovereign Local Currency
Global Corporate I.G.
Global Agg ex-U.S.
Euro Corporate I.G.
Euro HY
U.S. Agg
Euro Agg Japanese Gov’t Bonds Bunds
UK GILTS
Global High Yield
Bank Loans
-1
0
1
2
3
4
5
6
7
8
9
3 4 5 6 7 8 9 10 11 12
Yiel
d to
Mat
urity
(%)
Duration (Years)
Negative Yield
Positive Yield

105 105
0
50
100
150
200
250
300
Inde
x Le
vel
MERRILL LYNCH MOVE INDEX Past 20 Years
Fixed Income: Fed policy uncertainty spurs volatility As of March 31, 2016
Fixed Income
Source: Merrill Lynch, Factset
Fixed income volatility has increased, as Fed policy has become less certain, beginning in 2014 with the “taper tantrum”.
50
55
60
65
70
75
80
85
90
95
100
Inde
x Le
vel
MERRILL LYNCH MOVE INDEX Past 2 Years
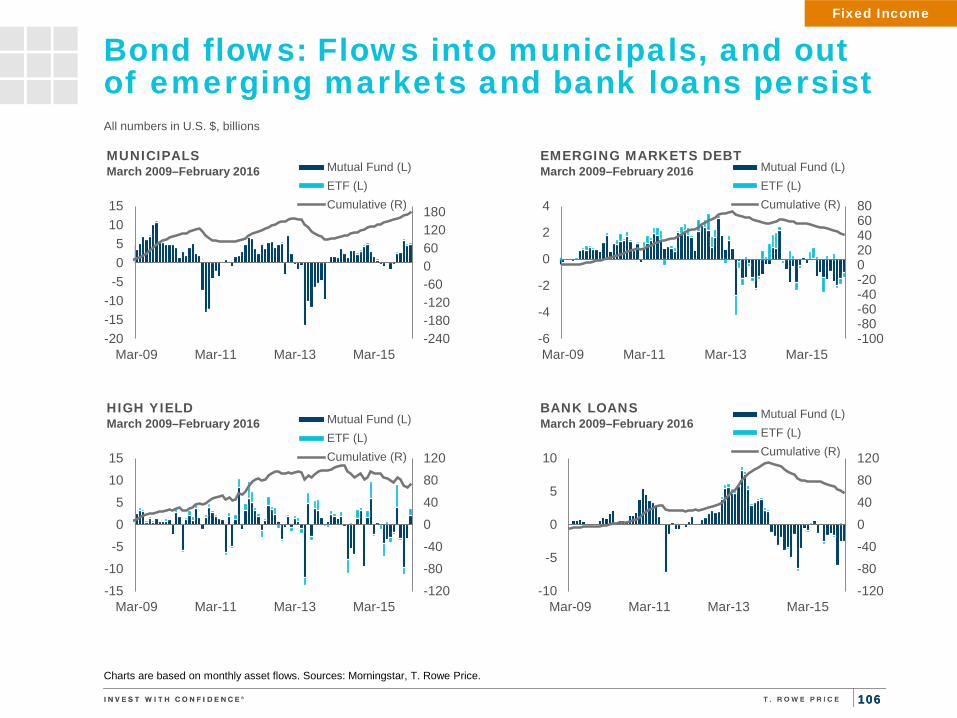
106 106
Bond flows: Flows into municipals, and out of emerging markets and bank loans persist All numbers in U.S. $, billions
Charts are based on monthly asset flows. Sources: Morningstar, T. Rowe Price.
-100-80-60-40-20020406080
-6
-4
-2
0
2
4
Mar-09 Mar-11 Mar-13 Mar-15
EMERGING MARKETS DEBT March 2009–February 2016 Mutual Fund (L)
ETF (L)Cumulative (R)
-120
-80
-40
0
40
80
120
-15
-10
-5
0
5
10
15
Mar-09 Mar-11 Mar-13 Mar-15
HIGH YIELD March 2009–February 2016 Mutual Fund (L)
ETF (L)Cumulative (R)
-240-180-120-60060120180
-20-15-10
-505
1015
Mar-09 Mar-11 Mar-13 Mar-15
MUNICIPALS March 2009–February 2016 Mutual Fund (L)
ETF (L)Cumulative (R)
-120
-80
-40
0
40
80
120
-10
-5
0
5
10
Mar-09 Mar-11 Mar-13 Mar-15
BANK LOANS March 2009–February 2016
Mutual Fund (L)ETF (L)Cumulative (R)
Fixed Income
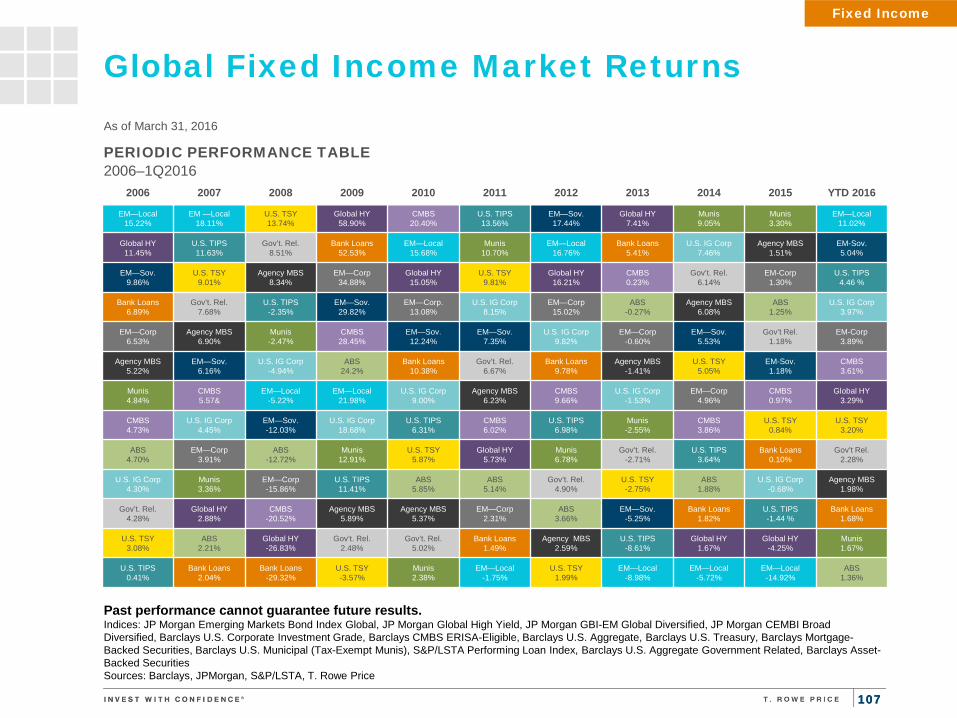
107 107
Global Fixed Income Market Returns
As of March 31, 2016
PERIODIC PERFORMANCE TABLE 2006–1Q2016
2006 2007 2008 2009 2010 2011 2012 2013 2014 2015 YTD 2016
EM—Local 15.22%
EM —Local 18.11%
U.S. TSY 13.74%
Global HY 58.90%
CMBS 20.40%
U.S. TIPS 13.56%
EM—Sov. 17.44%
Global HY 7.41%
Munis 9.05%
Munis 3.30%
EM—Local 11.02%
Global HY 11.45%
U.S. TIPS 11.63%
Gov’t. Rel. 8.51%
Bank Loans 52.53%
EM—Local 15.68%
Munis 10.70%
EM—Local 16.76%
Bank Loans 5.41%
U.S. IG Corp 7.46%
Agency MBS 1.51%
EM-Sov. 5.04%
EM—Sov. 9.86%
U.S. TSY 9.01%
Agency MBS 8.34%
EM—Corp 34.88%
Global HY 15.05%
U.S. TSY 9.81%
Global HY 16.21%
CMBS 0.23%
Gov’t. Rel. 6.14%
EM-Corp 1.30%
U.S. TIPS 4.46 %
Bank Loans 6.89%
Gov’t. Rel. 7.68%
U.S. TIPS -2.35%
EM—Sov. 29.82%
EM—Corp. 13.08%
U.S. IG Corp 8.15%
EM—Corp 15.02%
ABS -0.27%
Agency MBS 6.08%
ABS 1.25%
U.S. IG Corp 3.97%
EM—Corp 6.53%
Agency MBS 6.90%
Munis -2.47%
CMBS 28.45%
EM—Sov. 12.24%
EM—Sov. 7.35%
U.S. IG Corp 9.82%
EM—Corp -0.60%
EM—Sov. 5.53%
Gov’t Rel. 1.18%
EM-Corp 3.89%
Agency MBS 5.22%
EM—Sov. 6.16%
U.S. IG Corp -4.94%
ABS 24.2%
Bank Loans 10.38%
Gov’t. Rel. 6.67%
Bank Loans 9.78%
Agency MBS -1.41%
U.S. TSY 5.05%
EM-Sov. 1.18%
CMBS 3.61%
Munis 4.84%
CMBS 5.57&
EM—Local -5.22%
EM—Local 21.98%
U.S. IG Corp 9.00%
Agency MBS 6.23%
CMBS 9.66%
U.S. IG Corp -1.53%
EM—Corp 4.96%
CMBS 0.97%
Global HY 3.29%
CMBS 4.73%
U.S. IG Corp 4.45%
EM—Sov. -12.03%
U.S. IG Corp 18.68%
U.S. TIPS 6.31%
CMBS 6.02%
U.S. TIPS 6.98%
Munis -2.55%
CMBS 3.86%
U.S. TSY 0.84%
U.S. TSY 3.20%
ABS 4.70%
EM—Corp 3.91%
ABS -12.72%
Munis 12.91%
U.S. TSY 5.87%
Global HY 5.73%
Munis 6.78%
Gov’t. Rel. -2.71%
U.S. TIPS 3.64%
Bank Loans 0.10%
Gov’t Rel. 2.28%
U.S. IG Corp 4.30%
Munis 3.36%
EM—Corp -15.86%
U.S. TIPS 11.41%
ABS 5.85%
ABS 5.14%
Gov’t. Rel. 4.90%
U.S. TSY -2.75%
ABS 1.88%
U.S. IG Corp -0.68%
Agency MBS 1.98%
Gov’t. Rel. 4.28%
Global HY 2.88%
CMBS -20.52%
Agency MBS 5.89%
Agency MBS 5.37%
EM—Corp 2.31%
ABS 3.66%
EM—Sov. -5.25%
Bank Loans 1.82%
U.S. TIPS -1.44 %
Bank Loans 1.68%
U.S. TSY 3.08%
ABS 2.21%
Global HY -26.83%
Gov’t. Rel. 2.48%
Gov’t. Rel. 5.02%
Bank Loans 1.49%
Agency MBS 2.59%
U.S. TIPS -8.61%
Global HY 1.67%
Global HY -4.25%
Munis 1.67%
U.S. TIPS 0.41%
Bank Loans 2.04%
Bank Loans -29.32%
U.S. TSY -3.57%
Munis 2.38%
EM—Local -1.75%
U.S. TSY 1.99%
EM—Local -8.98%
EM—Local -5.72%
EM—Local -14.92%
ABS 1.36%
Fixed Income
Past performance cannot guarantee future results. Indices: JP Morgan Emerging Markets Bond Index Global, JP Morgan Global High Yield, JP Morgan GBI-EM Global Diversified, JP Morgan CEMBI Broad Diversified, Barclays U.S. Corporate Investment Grade, Barclays CMBS ERISA-Eligible, Barclays U.S. Aggregate, Barclays U.S. Treasury, Barclays Mortgage-Backed Securities, Barclays U.S. Municipal (Tax-Exempt Munis), S&P/LSTA Performing Loan Index, Barclays U.S. Aggregate Government Related, Barclays Asset-Backed Securities Sources: Barclays, JPMorgan, S&P/LSTA, T. Rowe Price
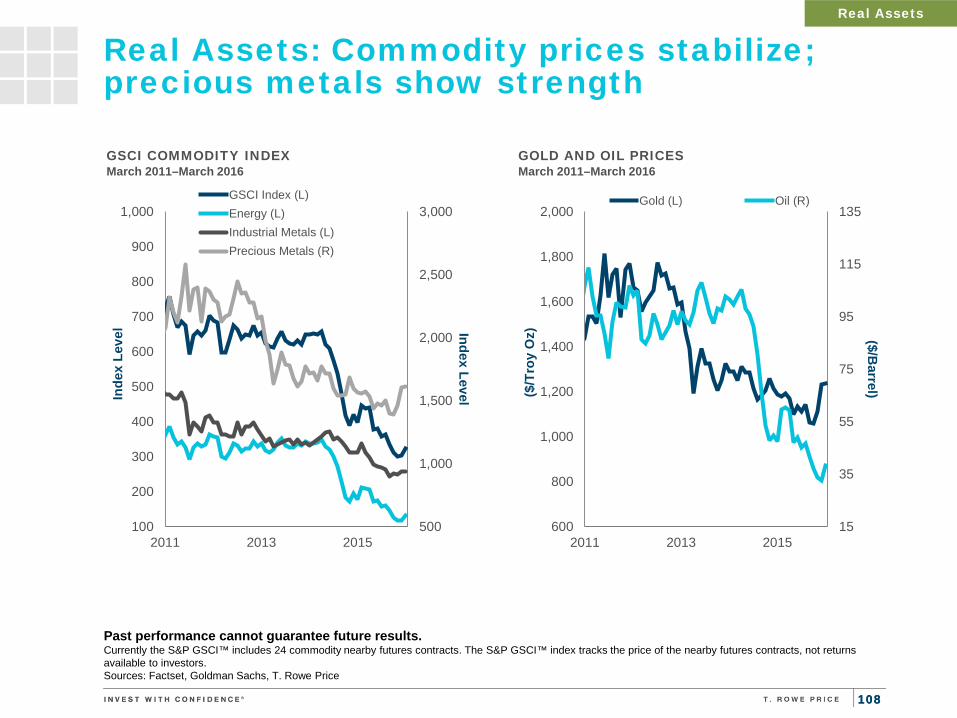
108 108
Real Assets: Commodity prices stabilize; precious metals show strength
Real Assets
500
1,000
1,500
2,000
2,500
3,000
100
200
300
400
500
600
700
800
900
1,000
2011 2013 2015
Index Level Inde
x Le
vel
GSCI COMMODITY INDEX March 2011–March 2016
GSCI Index (L)Energy (L)Industrial Metals (L)Precious Metals (R)
15
35
55
75
95
115
135
600
800
1,000
1,200
1,400
1,600
1,800
2,000
2011 2013 2015
($/Barrel) ($
/Tro
y O
z)
GOLD AND OIL PRICES March 2011–March 2016
Gold (L) Oil (R)
Past performance cannot guarantee future results. Currently the S&P GSCI™ includes 24 commodity nearby futures contracts. The S&P GSCI™ index tracks the price of the nearby futures contracts, not returns available to investors. Sources: Factset, Goldman Sachs, T. Rowe Price
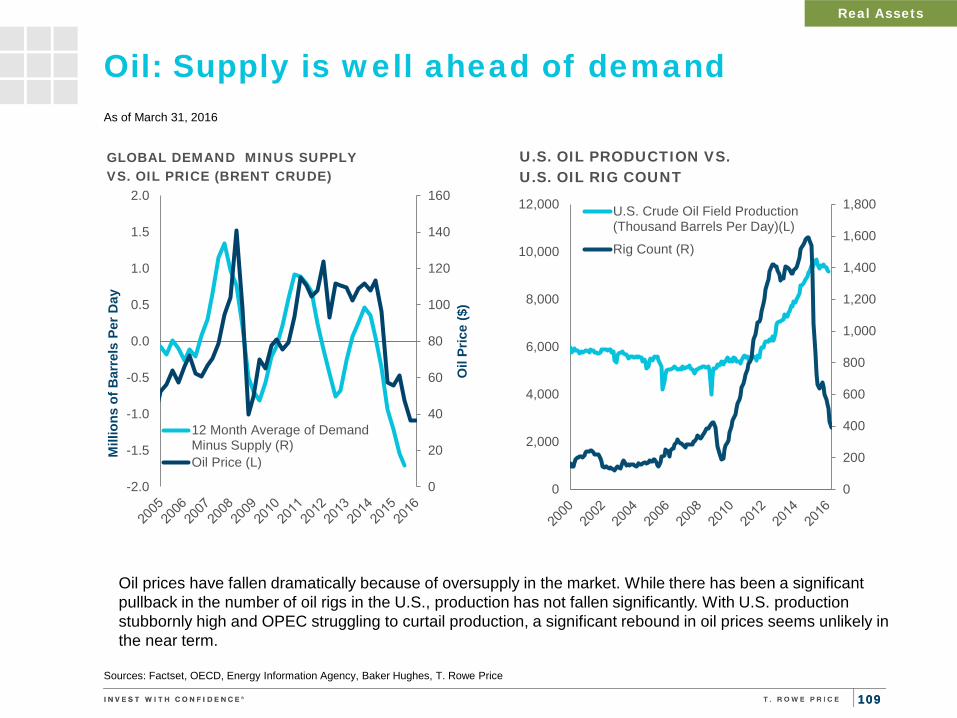
109 109
Oil: Supply is well ahead of demand
Real Assets
Sources: Factset, OECD, Energy Information Agency, Baker Hughes, T. Rowe Price
0
200
400
600
800
1,000
1,200
1,400
1,600
1,800
0
2,000
4,000
6,000
8,000
10,000
12,000
U.S. OIL PRODUCTION VS. U.S. OIL RIG COUNT
U.S. Crude Oil Field Production(Thousand Barrels Per Day)(L)
Rig Count (R)
As of March 31, 2016
Oil prices have fallen dramatically because of oversupply in the market. While there has been a significant pullback in the number of oil rigs in the U.S., production has not fallen significantly. With U.S. production stubbornly high and OPEC struggling to curtail production, a significant rebound in oil prices seems unlikely in the near term.
0
20
40
60
80
100
120
140
160
-2.0
-1.5
-1.0
-0.5
0.0
0.5
1.0
1.5
2.0
Oil
Pric
e ($
)
Mill
ions
of B
arre
ls P
er D
ay
GLOBAL DEMAND MINUS SUPPLY VS. OIL PRICE (BRENT CRUDE)
12 Month Average of DemandMinus Supply (R)Oil Price (L)
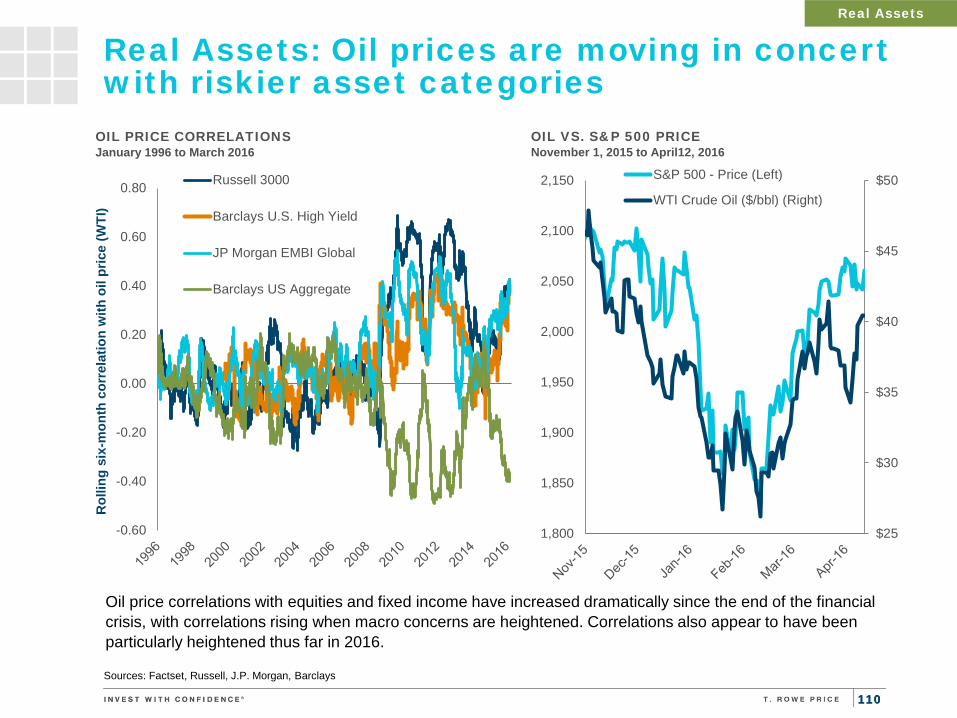
110 110
Real Assets: Oil prices are moving in concert with riskier asset categories
Real Assets
Sources: Factset, Russell, J.P. Morgan, Barclays
-0.60
-0.40
-0.20
0.00
0.20
0.40
0.60
0.80
Rol
ling
six-
mon
th c
orre
latio
n w
ith o
il pr
ice
(WTI
)
OIL PRICE CORRELATIONS January 1996 to March 2016
Russell 3000
Barclays U.S. High Yield
JP Morgan EMBI Global
Barclays US Aggregate
Oil price correlations with equities and fixed income have increased dramatically since the end of the financial crisis, with correlations rising when macro concerns are heightened. Correlations also appear to have been particularly heightened thus far in 2016.
$25
$30
$35
$40
$45
$50
1,800
1,850
1,900
1,950
2,000
2,050
2,100
2,150
OIL VS. S&P 500 PRICE November 1, 2015 to April12, 2016
S&P 500 - Price (Left)
WTI Crude Oil ($/bbl) (Right)
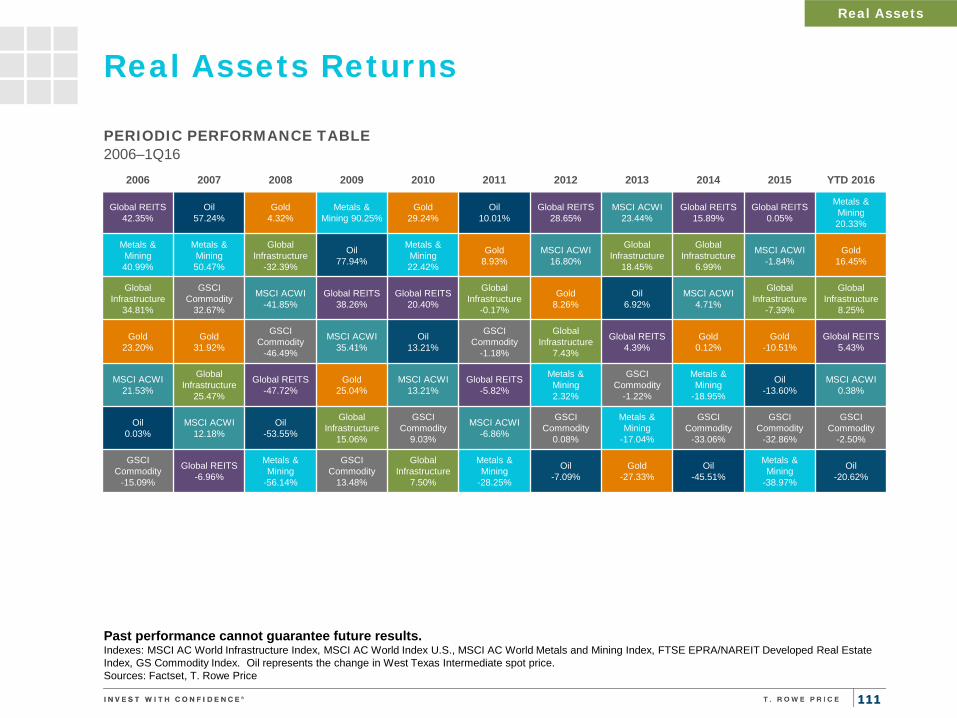
111 111
Real Assets Returns
PERIODIC PERFORMANCE TABLE 2006–1Q16
2006 2007 2008 2009 2010 2011 2012 2013 2014 2015 YTD 2016
Global REITS 42.35%
Oil 57.24%
Gold 4.32%
Metals & Mining 90.25%
Gold 29.24%
Oil 10.01%
Global REITS 28.65%
MSCI ACWI 23.44%
Global REITS 15.89%
Global REITS 0.05%
Metals & Mining 20.33%
Metals & Mining 40.99%
Metals & Mining 50.47%
Global Infrastructure
-32.39%
Oil 77.94%
Metals & Mining 22.42%
Gold 8.93%
MSCI ACWI 16.80%
Global Infrastructure
18.45%
Global Infrastructure
6.99%
MSCI ACWI -1.84%
Gold 16.45%
Global Infrastructure
34.81%
GSCI Commodity
32.67%
MSCI ACWI -41.85%
Global REITS 38.26%
Global REITS 20.40%
Global Infrastructure
-0.17%
Gold 8.26%
Oil 6.92%
MSCI ACWI 4.71%
Global Infrastructure
-7.39%
Global Infrastructure
8.25%
Gold 23.20%
Gold 31.92%
GSCI Commodity
-46.49%
MSCI ACWI 35.41%
Oil 13.21%
GSCI Commodity
-1.18%
Global Infrastructure
7.43%
Global REITS 4.39%
Gold 0.12%
Gold -10.51%
Global REITS 5.43%
MSCI ACWI 21.53%
Global Infrastructure
25.47%
Global REITS -47.72%
Gold 25.04%
MSCI ACWI 13.21%
Global REITS -5.82%
Metals & Mining 2.32%
GSCI Commodity
-1.22%
Metals & Mining
-18.95%
Oil -13.60%
MSCI ACWI 0.38%
Oil 0.03%
MSCI ACWI 12.18%
Oil -53.55%
Global Infrastructure
15.06%
GSCI Commodity
9.03%
MSCI ACWI -6.86%
GSCI Commodity
0.08%
Metals & Mining
-17.04%
GSCI Commodity
-33.06%
GSCI Commodity
-32.86%
GSCI Commodity
-2.50%
GSCI Commodity
-15.09%
Global REITS -6.96%
Metals & Mining
-56.14%
GSCI Commodity
13.48%
Global Infrastructure
7.50%
Metals & Mining
-28.25%
Oil -7.09%
Gold -27.33%
Oil -45.51%
Metals & Mining
-38.97%
Oil -20.62%
Real Assets
Past performance cannot guarantee future results. Indexes: MSCI AC World Infrastructure Index, MSCI AC World Index U.S., MSCI AC World Metals and Mining Index, FTSE EPRA/NAREIT Developed Real Estate Index, GS Commodity Index. Oil represents the change in West Texas Intermediate spot price. Sources: Factset, T. Rowe Price

112 112
Global Risk Summary
Source: T. Rowe Price
Summary
Upside Downside
United States
A positive, albeit muted, economic cycle continues as the slowdown in emerging markets has a limited effect on the domestic economy
An improved job market, lower energy costs, and rebounding housing demand support improving consumer spending
Business spending may rebound as the pullback in energy-related capex spending abates and weakness in the industrial economy proves transitory
Credit markets are stabilizing, having digested the uptick in energy defaults in an orderly fashion
The Fed maintains a slow pace of rate increases amid low inflation
The ongoing downshift in Chinese growth and fallout from plunging commodity prices weakens exports
A rising wave of defaults could cause credit markets to freeze Dollar strength slows U.S. exports and manufacturing sector capital spending An uptick in protectionist policies could ignite a global trade and currency war The specter of rising interest rates, a credit cycle downturn, and a dramatic
increase in volatility could weaken confidence and ignite a downward spiral in asset prices
Europe
The recovery remains on track despite tailwinds from China’s slowdown Quantitative easing continues to drive credit growth and consequently an
uptick in spending habits among consumers and corporations A weaker euro would support export growth Corporate profit margins have ample room to improve Pent-up demand would likely emerge if consumer and corporate confidence
improves Progress on structural reforms creates improved business conditions
Germany, Europe's strongest growth engine, is weakened by China exposure Political uncertainty has reignited amid the ongoing refugee crisis, and the UK
potentially exiting the European Union Although improving, growth remains muted, with a wide divergence between
countries Unemployment remains elevated, particularly in peripheral nations High government debt levels limit fiscal stimulus measures Banking sector challenged by extremely low interest rates
Japan
The BOJ is likely to attempt to weaken the yen to more favorable levels Exporters will gain share if BOJ is able to maintain a weaker yen Rebalancing of public pension funds supports equity markets Corporations continue to focus on improved corporate governance Corporate profit margins are improving Increased female participation in labor markets provides a much-needed
labor force expansion
China’s export demand weakens as Chinese growth slows Political relations with China remain tense Wage growth continues to stall Lower tax revenues and growing debt undermine fiscal sustainability Improvements in corporate governance may be cosmetic, as profitability
improvements are mostly driven by yen weakness Challenging structural issues remain, including an aging population and high debt
levels
Emerging Markets
Overall, EM countries have become less vulnerable to external forces, given
lower external debt, improved current accounts, and higher currency reserves. These elements should help EM avoid the near-crisis scenario that appears to be currently priced in.
Commodity-importing countries benefit from lower commodity prices Currencies have stabilized as anxiety over U.S. rate increases fades Potential for consumption growth remains attractive given the rising
purchasing power of the middle class and improving internet connectivity
Exposure to China is broad based, as many EM economies are heavily dependent on demand from China, either through direct exposure or exposure to commodity prices
Commodity exporting countries are highly vulnerable to an elongated period of weak commodity prices
Broad increases in credit growth throughout the 2000s leave numerous corporations unprepared for a sustained drop in commodity prices
Federal Reserve interest rate policy normalization remains a near-term risk to capital flows
China
The powerful central government is committed to engineering a gradual transition toward slower growth
Numerous policy tools are available, including more fiscal stimulus, rate cuts, lower reserve requirements, and quantitative easing
Consumption and service industries remain healthy, and are gradually becoming a more significant driver of economic growth
Lower oil prices and yuan devaluation would help trade surplus
Industrial production continues to weaken with significant excess capacity in many sectors, particularly among state-owned enterprises (SOEs)
Local governments in industrial-oriented regions are an obstacle to the transition toward a service-oriented economy
Infrastructure spending has become a poor tool for stimulating the economy, making policy intervention more complicated, experimental, and prone to errors
Weak profitability in industrial sector raises debt-service concerns Size and pace of China’s credit expansion remains risky Yuan devaluation fears create potential for massive capital outflows
113 113
Important Information This material, including any statements, information, data and content contained within it and any materials, information, images, links, graphics or recording provided in conjunction with this material are being furnished by T. Rowe Price for general informational purposes only. The material is not intended for use by persons in jurisdictions which prohibit or restrict the distribution of the material and in certain countries the material is provided upon specific request. It is not intended for distribution to retail investors in any jurisdiction. Under no circumstances should the material, in whole or in part, be copied or redistributed without consent from T. Rowe Price. The material does not constitute a distribution, an offer, an invitation, recommendation or solicitation to sell or buy any securities in any jurisdiction. The material has not been reviewed by any regulatory authority in any jurisdiction. The material does not constitute advice of any nature and prospective investors are recommended to seek independent legal, financial and tax advice before making any investment decision. Past performance is not a reliable indicator of future performance. The value of an investment and any income from it can go down as well as up. Investors may get back less than the amount invested. The views contained herein are as of April 14, 2016 and may have changed since that time. Unless indicated otherwise the source of all market data is Factset. Australia - Issued in Australia by T. Rowe Price International Ltd (ABN 84 104 852 191), Level 50, Governor Phillip Tower, 1 Farrer Place, Suite 50B, Sydney, NSW 2000, Australia. T. Rowe Price International Ltd is exempt from the requirement to hold an Australian financial services licence in respect of the financial services it provides in Australia. T. Rowe Price International Ltd is authorised and regulated by the UK Financial Conduct Authority under UK laws, which differ from Australian laws. For Wholesale Clients only. Canada - Issued in Canada by T. Rowe Price (Canada), Inc. T. Rowe Price (Canada), Inc. enters into written delegation agreements with affiliates to provide investment management services. T. Rowe Price (Canada), Inc. is not registered to provide investment management business in all Canadian provinces. The investment management services provided by T. Rowe Price (Canada), Inc. are only available for use by Accredited Investors as defined under National Instrument 45-106 in those provinces where it is able to provide such services. DIFC - Issued in the Dubai International Financial Centre by T. Rowe Price International Ltd. This material is communicated on behalf of T. Rowe Price International Ltd by its representative office which is regulated by the Dubai Financial Services Authority. For Professional Clients only. EEA - Issued in the European Economic Area by T. Rowe Price International Limited, 60 Queen Victoria Street, London EC4N 4TZ which is authorised and regulated by the UK Financial Conduct Authority. For Professional Clients only. Hong Kong - Issued in Hong Kong by T. Rowe Price Hong Kong Limited, 21/F, Jardine House, 1 Connaught Place, Central, Hong Kong. T. Rowe Price Hong Kong Limited is licensed and regulated by the Securities & Futures Commission. For Professional Investors only. Japan - Issued in Japan by T. Rowe Price International Ltd, Tokyo Branch (KLFB Registration No. 445 (Financial Instruments Service Provider), JIAA Membership No. 011-01162), located at GranTokyo South Tower 7F, 9-2, Marunouchi 1-chome, Chiyoda-ku, Tokyo 100-6607. This material is intended for use by Professional Investors only and may not be disseminated without the prior approval of T. Rowe Price International Ltd, Tokyo Branch. Singapore - Issued in Singapore by T. Rowe Price Singapore Private Limited, No. 501 Orchard Rd, #10-02 Wheelock Place, Singapore 238880. T. Rowe Price Singapore Private Limited is licensed and regulated by the Monetary Authority of Singapore. For Institutional and Accredited Investors only. Switzerland - Issued in Switzerland by T. Rowe Price (Switzerland) GmbH ("TRPSWISS"), Talstrasse 65, 6th Floor, 8001 Zurich, Switzerland. For Qualified Investors only. USA - Issued in the USA by T. Rowe Price Associates, Inc., 100 East Pratt Street, Baltimore, MD, 21202, which is regulated by the U.S. Securities and Exchange Commission. For Institutional Investors only. T. ROWE PRICE, INVEST WITH CONFIDENCE and the Bighorn Sheep design are, collectively and/or apart, trademarks or registered trademarks of T. Rowe Price Group, Inc. in the United States, European Union, and other countries. This material is intended for use only in select countries.

THANK YOU
C1JEKMWWL