Embed Size (px)
Citation preview
First Principles Investigation of Nanomaterials for Hydrogen
Generation and Hydrogen Storage
by
Shwetank Yadav
A thesis submitted in conformity with the requirements
for the degree of Masters of Applied Science
Graduate Department of Materials Science and Engineering
University of Toronto
c© Copyright 2015 by Shwetank Yadav

Abstract
First Principles Investigation of Nanomaterials for Hydrogen Generation and Hydrogen Storage
Shwetank Yadav
Masters of Applied Science
Graduate Department of Materials Science and Engineering
University of Toronto
2015
Ab initio computational modelling was used to examine nanoscale materials for renewable energy appli-
cations. Hydrogen production from water splitting was investigated on three edges of two-dimensional
monolayer molybdenum disulfide by studying active sites, reaction pathways, activation energies and
rates of reaction. The Mo-edge termination was found to adsorb and spontaneously dissociate water
at room temperature conditions. Hydrogen storage through adsorption was studied on metal decorated
graphene, defective graphene and metal decorated non-graphene 2-D carbon allotropes. Nickel was found
to produce the best hydrogen gravimetric density for metal decorated graphene at 6.12 wt.%, lower than
previous studies which neglected van der Waals forces. Defect engineered graphene produced a maximum
gravimetric density of 7.02 wt.% while the lithium decorated 2-D carbon allotropes produced a best of
7.12 wt.%.
ii

Acknowledgements
I would like to express thanks to my supervisor Professor Chandra Veer Singh. He has displayed tremen-
dous patience in guiding me through my research, greatly enhanced my learning experience and provided
with me valuable technical, career and personal advice. I would also like to extend my gratitude to the
members of the Computational Materials Engineering Laboratory, especially Kulbir Kaur Ghuman, for
their collobaration and advice throughout my time with them. I would also like to thank the Connaught
Research Fund, NSERC and the Department of Materials Science and Engineering for funding this re-
search. Finally I would like to acknowledge SciNet, Calcul Quebec and Compute Canada for providing
the computing resources for carrying out this research.
iii

Contents
1 Introduction 1
1.1 Background Information . . . . . . . . . . . . . . . . . . . . . . . . . . . . . . . . . . . . . 2
1.1.1 Hydrogen production . . . . . . . . . . . . . . . . . . . . . . . . . . . . . . . . . . . 2
1.1.2 Hydrogen storage . . . . . . . . . . . . . . . . . . . . . . . . . . . . . . . . . . . . . 3
1.2 Computational atomistic modeling . . . . . . . . . . . . . . . . . . . . . . . . . . . . . . . 3
1.3 Motivation . . . . . . . . . . . . . . . . . . . . . . . . . . . . . . . . . . . . . . . . . . . . 5
1.4 Thesis objectives . . . . . . . . . . . . . . . . . . . . . . . . . . . . . . . . . . . . . . . . . 5
1.5 Thesis organization . . . . . . . . . . . . . . . . . . . . . . . . . . . . . . . . . . . . . . . . 6
2 Atomistic Modeling 7
2.1 Density Functional Theory . . . . . . . . . . . . . . . . . . . . . . . . . . . . . . . . . . . 7
2.1.1 Born-Oppenheimer approximation . . . . . . . . . . . . . . . . . . . . . . . . . . . 8
2.1.2 Hartree-Fock and the variational principle . . . . . . . . . . . . . . . . . . . . . . . 9
2.1.3 Hohenberg-Kohn theorems and Kohn-Sham equations . . . . . . . . . . . . . . . . 9
2.1.4 Plane-wave periodic systems . . . . . . . . . . . . . . . . . . . . . . . . . . . . . . 11
2.1.5 Pseudopotentials . . . . . . . . . . . . . . . . . . . . . . . . . . . . . . . . . . . . . 12
2.2 Nudged Elastic Band . . . . . . . . . . . . . . . . . . . . . . . . . . . . . . . . . . . . . . . 12
2.3 Ab Initio Molecular Dynamics . . . . . . . . . . . . . . . . . . . . . . . . . . . . . . . . . . 12
2.3.1 Metadynamics . . . . . . . . . . . . . . . . . . . . . . . . . . . . . . . . . . . . . . 14
3 Water Dissociation on Two-dimensional Molybdenum Disulfide Edges 15
3.1 Introduction . . . . . . . . . . . . . . . . . . . . . . . . . . . . . . . . . . . . . . . . . . . . 15
3.2 Literature Review . . . . . . . . . . . . . . . . . . . . . . . . . . . . . . . . . . . . . . . . 15
3.3 Computational Details . . . . . . . . . . . . . . . . . . . . . . . . . . . . . . . . . . . . . . 16
3.3.1 Ab Initio Techniques . . . . . . . . . . . . . . . . . . . . . . . . . . . . . . . . . . . 16
3.3.2 Structure Model . . . . . . . . . . . . . . . . . . . . . . . . . . . . . . . . . . . . . 17
3.4 Results and discussion . . . . . . . . . . . . . . . . . . . . . . . . . . . . . . . . . . . . . . 17
3.4.1 Adsorption of H, OH and H2O . . . . . . . . . . . . . . . . . . . . . . . . . . . . . 17
3.4.2 Dissociation of H2O on MoS2 edges . . . . . . . . . . . . . . . . . . . . . . . . . . 26
3.4.3 Free Energy with Vibrational and Entropic Contributions . . . . . . . . . . . . . . 28
3.5 Finite temperature ab initio molecular dynamics . . . . . . . . . . . . . . . . . . . . . . . 29
3.6 Metadynamics biased finite temperature ab initio molecular dynamics . . . . . . . . . . . 29
3.6.1 Mechanism 1 . . . . . . . . . . . . . . . . . . . . . . . . . . . . . . . . . . . . . . . 31
3.6.2 Mechanism 2 . . . . . . . . . . . . . . . . . . . . . . . . . . . . . . . . . . . . . . . 31
iv

3.7 Surface Processes Subsequent to Water Dissociation . . . . . . . . . . . . . . . . . . . . . 34
3.8 Summary . . . . . . . . . . . . . . . . . . . . . . . . . . . . . . . . . . . . . . . . . . . . . 35
4 Hydrogen Storage on Metal Decorated Graphene 36
4.1 Introduction . . . . . . . . . . . . . . . . . . . . . . . . . . . . . . . . . . . . . . . . . . . . 36
4.2 Literature Review . . . . . . . . . . . . . . . . . . . . . . . . . . . . . . . . . . . . . . . . 37
4.3 Computational Details . . . . . . . . . . . . . . . . . . . . . . . . . . . . . . . . . . . . . . 37
4.4 Results and Discussion . . . . . . . . . . . . . . . . . . . . . . . . . . . . . . . . . . . . . . 38
4.4.1 Metal anchoring over graphene . . . . . . . . . . . . . . . . . . . . . . . . . . . . . 39
4.4.2 Hydrogen adsorption on metal-decorated graphene . . . . . . . . . . . . . . . . . . 42
4.4.3 Optimal hydrogen storage on Ni-decorated graphene . . . . . . . . . . . . . . . . . 45
4.4.4 Discussion . . . . . . . . . . . . . . . . . . . . . . . . . . . . . . . . . . . . . . . . . 50
4.5 Summary . . . . . . . . . . . . . . . . . . . . . . . . . . . . . . . . . . . . . . . . . . . . . 52
5 Hydrogen Storage on Defective Graphene 53
5.1 Introduction . . . . . . . . . . . . . . . . . . . . . . . . . . . . . . . . . . . . . . . . . . . . 53
5.2 Literature Review . . . . . . . . . . . . . . . . . . . . . . . . . . . . . . . . . . . . . . . . 54
5.3 Computational Details . . . . . . . . . . . . . . . . . . . . . . . . . . . . . . . . . . . . . . 54
5.4 Hydrogen Binding over Individual Defect Systems . . . . . . . . . . . . . . . . . . . . . . 56
5.4.1 Pristine Graphene . . . . . . . . . . . . . . . . . . . . . . . . . . . . . . . . . . . . 56
5.4.2 Stone-Wales Defect . . . . . . . . . . . . . . . . . . . . . . . . . . . . . . . . . . . . 58
5.4.3 Single Vacancy Defect . . . . . . . . . . . . . . . . . . . . . . . . . . . . . . . . . . 58
5.4.4 585 Double Vacancy Defect . . . . . . . . . . . . . . . . . . . . . . . . . . . . . . . 61
5.4.5 555-777 Double Vacancy Defect . . . . . . . . . . . . . . . . . . . . . . . . . . . . . 61
5.4.6 5555-6-7777 Double Vacancy Defect . . . . . . . . . . . . . . . . . . . . . . . . . . 61
5.4.7 Bilayer Graphene with Single Vacancy Defect . . . . . . . . . . . . . . . . . . . . . 62
5.5 Hydrogen Binding over Multiple Defect Systems . . . . . . . . . . . . . . . . . . . . . . . 62
5.5.1 Grain Boundary . . . . . . . . . . . . . . . . . . . . . . . . . . . . . . . . . . . . . 62
5.5.2 Mixed Stone-Wales and Single Vacancy . . . . . . . . . . . . . . . . . . . . . . . . 63
5.5.3 Single Vacancy with Metal Decoration . . . . . . . . . . . . . . . . . . . . . . . . . 63
5.5.4 Single Vacancy Maximum Hydrogen Density (SVMD) System . . . . . . . . . . . . 64
5.5.5 Stone Wales Single Vacancy Maximum Hydrogen Density (SWSVMD) System . . 66
5.6 Discussion: General Trends Towards Defect Engineering of Graphene for Hydrogen Storage 67
5.6.1 Individual Defect Systems . . . . . . . . . . . . . . . . . . . . . . . . . . . . . . . . 69
5.6.2 Mixed Defect Systems . . . . . . . . . . . . . . . . . . . . . . . . . . . . . . . . . . 73
5.7 Summary . . . . . . . . . . . . . . . . . . . . . . . . . . . . . . . . . . . . . . . . . . . . . 77
6 Hydrogen Storage on Two-Dimensional Carbon Allotropes 78
6.1 Introduction . . . . . . . . . . . . . . . . . . . . . . . . . . . . . . . . . . . . . . . . . . . . 78
6.2 Literature Review . . . . . . . . . . . . . . . . . . . . . . . . . . . . . . . . . . . . . . . . 79
6.3 Computational Details . . . . . . . . . . . . . . . . . . . . . . . . . . . . . . . . . . . . . . 79
6.4 Results and Discussion . . . . . . . . . . . . . . . . . . . . . . . . . . . . . . . . . . . . . . 80
6.4.1 Metal Adsorption . . . . . . . . . . . . . . . . . . . . . . . . . . . . . . . . . . . . . 80
6.4.2 Hydrogen Adsorption . . . . . . . . . . . . . . . . . . . . . . . . . . . . . . . . . . 83
v

6.4.3 Maximum Gravimetric Density . . . . . . . . . . . . . . . . . . . . . . . . . . . . . 87
6.5 Summary . . . . . . . . . . . . . . . . . . . . . . . . . . . . . . . . . . . . . . . . . . . . . 89
7 Conclusion and Future Work 90
7.1 Summary and overall contribution . . . . . . . . . . . . . . . . . . . . . . . . . . . . . . . 90
7.2 Future work . . . . . . . . . . . . . . . . . . . . . . . . . . . . . . . . . . . . . . . . . . . . 91
Bibliography 92
vi

List of Tables
1.1 Energy content by mass for hydrogen and conventional fuels. . . . . . . . . . . . . . . . . 2
3.1 Calculated structural parameters and adsorption energies of H2O, OH and H for the most
stable site on S100-edge, S-50-edge and Mo-edge. Eads (eV) represents the adsorption
energy, h(A) represents the vertical height of the H2O, OH and H species from the surface,
dO−H represents the OH bond lengths for OH and H2O molecules and αHOH represents
the H-O-H angle for H2O molecule. . . . . . . . . . . . . . . . . . . . . . . . . . . . . . . . 20
4.1 Binding energies (eV), vertical adatom distance with respect to graphene sheet (A) and
literature values (Lit.) for single sided metal decoration. The adatom positions over
graphene are indicated in brackets, where H stands for adatom at the hollow, B stands
for adatom on the bridge between two carbon atoms and T stands for adatom above a
carbon atom. . . . . . . . . . . . . . . . . . . . . . . . . . . . . . . . . . . . . . . . . . . . 40
4.2 Binding energies per atom (eV), vertical adatom distance with respect to graphene sheet
(A) and literature values (Lit.) for double sided metal decoration. The adatom positions
over graphene are indicated in brackets, where H stands for adatom at the hollow, B
stands for adatom on the bridge between two carbon atoms and T stands for adatom
above a carbon atom. . . . . . . . . . . . . . . . . . . . . . . . . . . . . . . . . . . . . . . 40
4.3 Average hydrogen binding energy (eV/H2) for metal graphene system. The adatom posi-
tions over graphene are indicated in brackets, where H stands for adatom at the hollow,
B stands for adatom on the bridge between two carbon atoms and T stands for adatom
above a carbon atom. . . . . . . . . . . . . . . . . . . . . . . . . . . . . . . . . . . . . . . 42
4.4 Average hydrogen binding energy (eV/H2) for increasing number of adsorbed hydrogen
molecules and different substrate sizes (in terms of number of carbon atoms). Dashed lines
indicate a simulation was not conducted, due to low chance of adsorption for 6C or low
gravimetric density for 32 C. The 16C substrate represents the best balance of substrate
size and binding energy which allows it to meet the DOE’s goal of 5.5% gravimetric density. 47
5.1 Binding energies of a hydrogen molecule placed over individual topological defects in
graphene. Multiple positions, shown in Figure 5.1, were tested for each defect type. Both
PBE-GGA and vdW-DF2 functionals were utilized to ascertain differences in binding
energies due to choice of density functional. The vdW-DF2 results all demonstrated
stronger binding and a smaller range of values among sites within a defect than the PBE-
GGA results. . . . . . . . . . . . . . . . . . . . . . . . . . . . . . . . . . . . . . . . . . . . 56
vii

6.1 Average lithium adsorption energy (eV) for each two-dimensional carbon allotrope and
adsorption position. Note the bulk cohesive energy for lithium is 1.63 eV. All structures
except C31 posses lithium binding energy greater than the cohesive energy and this should
prevent metal atom agglomeration. . . . . . . . . . . . . . . . . . . . . . . . . . . . . . . . 82
6.2 Average hydrogen adsorption energies (eV/H2) for each two-dimensional carbon allotrope
and adsorption position . . . . . . . . . . . . . . . . . . . . . . . . . . . . . . . . . . . . . 85
viii

List of Figures
1.1 Global carbon dioxide emissions from fossil fuels . . . . . . . . . . . . . . . . . . . . . . . 1
1.2 Hydrogen production methods . . . . . . . . . . . . . . . . . . . . . . . . . . . . . . . . . 3
1.3 Hydrogen storage technologies . . . . . . . . . . . . . . . . . . . . . . . . . . . . . . . . . . 4
2.1 Basic Molecular Dynamics (MD) algorithm. [1]. . . . . . . . . . . . . . . . . . . . . . . . . 13
3.1 (a) Top and (b) side view of the perfect basal plane of 2D MoS2. Blue, red and green dotted
lines show the location of the three most thermodynamically stable surface terminations.
These terminations, along with the their simulation supercells, are shown in the following:
(c) S-edge with 100 percent (S100-edge) sulfur coverage, (d) S-edge with 50 percent (S50-
edge) sulfur coverage and, (e) S-edge with 0 percent (Mo-edge) sulfur coverage. The yellow
and the purple spheres represent S and Mo atoms, respectively. . . . . . . . . . . . . . . . 18
3.2 Locations of H, OH and H2O adsorption sites on (a) S100-edge, (b) S50-edge and (c)
Mo-edge. The view of the edge with the MoS2 plane oriented perpendicular to the page
is shown in (d) with sites A and B. Mo atoms are in purple, S atoms are in yellow, and
sites A and B are represented by pink spheres. . . . . . . . . . . . . . . . . . . . . . . . . 19
3.3 Isosurfaces of the charge density difference ∆ρ for H2O molecule adsorbed on the most
stable site for (a) S100-edge, (b) S50-edge and (c) Mo-edge. The purple, yellow, blue and
red spheres are Mo, S, H and O atoms, respectively. The positive and negative isosurfaces
are in pink and blue, indicating regions of charge gain and loss respectively. . . . . . . . . 21
3.4 Reaction pathway and reaction barrier of single water dissociation on S100-edge from
Climbing Image Nudged Elastic Band (CI-NEB) simulation. Purple atoms represent Mo;
yellow atoms represent S. . . . . . . . . . . . . . . . . . . . . . . . . . . . . . . . . . . . . 24
3.5 Reaction pathway and reaction barrier of single water dissociation on S50-edge from
Climbing Image Nudged Elastic Band (CI-NEB) simulation. Purple atoms represent Mo;
yellow atoms represent S. . . . . . . . . . . . . . . . . . . . . . . . . . . . . . . . . . . . . 25
3.6 Reaction pathway and reaction barrier of single water dissociation on Mo-edge from Climb-
ing Image Nudged Elastic Band (CI-NEB) simulation. Purple atoms represent Mo; yellow
atoms represent S. . . . . . . . . . . . . . . . . . . . . . . . . . . . . . . . . . . . . . . . . 27
3.7 Reaction mechansim of H2O dissociation reaction on Mo-edge of MoS2 during unbiased
ab-intio molecular dynamics simulation at 300K. The reaction roughly follows the same
path as CI-NEB simulations . . . . . . . . . . . . . . . . . . . . . . . . . . . . . . . . . . . 30
ix

3.8 Free energy surface of Mechanism 1 in terms of collective variables for metadynamics
biased AIMD simulation at 300K with corresponding atomic configurations at specific
energy minima. The dissociation reaction proceeds from point A to B. However, the
deepest energy well and largest activation barrier corresponds to adsorption of the water
molecule at point C. . . . . . . . . . . . . . . . . . . . . . . . . . . . . . . . . . . . . . . . 32
3.9 Free energy surface of Mechanism 2 in terms of collective variables for metadynamics
biased AIMD simulation at 300K with corresponding atomic configurations at specific
energy minima. The dissociation reaction proceeds from point A to B and then C, leaving
behind a lone adsorbed O atom. . . . . . . . . . . . . . . . . . . . . . . . . . . . . . . . . 33
4.1 Possible adsorption sites for metal atoms. From left to right, the adatom is at the hollow
site, the top site and the bridge site respectively. . . . . . . . . . . . . . . . . . . . . . . . 38
4.2 Isosurfaces of charge density and charge density difference for (a) Ni and (b) Al adatoms
adsorbed on graphene. In the charge density difference isosurfaces, yellow indicates regions
of charge gain and blue indicates regions of charge loss. The Al atoms, a light metal, show
greater charge loss and a smaller region of remaining charge density than the heavy metal
Ni atoms. This might be one reason for heavier metal atoms possessing stronger hydrogen
binding energy as they have greater charge which can interact with hydrogen molecules. . 41
4.3 PDOS of Ni-graphene system simulations with (a) GGA functional alone and (b) GGA
functional with vdW-DF2 corrections. The greater number of peaks and width of the Ni
d-shell orbital for (a) indicates more distinct localized energy states and stronger potential
for interaction with a hydrogen molecule. . . . . . . . . . . . . . . . . . . . . . . . . . . . 44
4.4 Examples of the hydrogen-metal complexes formed by transition metals, palladium on the
left and copper on the right. The hydrogen molecule has dissociated and moved towards
a chemisorbed state, producing stronger hydrogen binding energies for transition metals. . 45
4.5 Supercells used for differing Ni metal coverage simulations: (a) 6 carbon atoms (b) 16
carbon atoms (c) 32 carbon atoms (d) 72 carbon atoms . . . . . . . . . . . . . . . . . . . 46
4.6 Average hydrogen binding energy (eV/H2) for Ni-decorated graphene systems at different
substrate sizes. . . . . . . . . . . . . . . . . . . . . . . . . . . . . . . . . . . . . . . . . . . 46
4.7 Average hydrogen binding energy (eV/H2) for increasing number of adsorbed hydrogen
molecules and different substrate sizes (in terms of number of carbon atoms) . . . . . . . 48
4.8 Maximum theoretical hydrogen gravimetric density (wt.%) for different number of ad-
sorbed hydrogen molecules and substrate sizes (in terms of number of carbon atoms).
Note that not all of the systems successfully adsorbed the hydrogen molecules (see Figure
4.7). . . . . . . . . . . . . . . . . . . . . . . . . . . . . . . . . . . . . . . . . . . . . . . . . 48
4.9 Configurations of adsorbed hydrogen on the 16 carbon Ni decorated supercell, with in-
creasing numbers of hydrogen molecules: (a) 2, (b) 4, (c) 6, (d) 8 & (e) 10. . . . . . . . . 49
4.10 Correlation between hydrogen gravimetric density (wt.%) and average binding energy
(eV/H2) for the 16 carbon substrate . . . . . . . . . . . . . . . . . . . . . . . . . . . . . . 50
4.11 PDOS of 16 carbon Ni decorated supercell system with increasing numbers of adsorbed
hydrogen molecules: (a) 2, (b) 4, (c) 6, (d) 8, & (e) 10. The Fermi level is indicated by a
dashed line. The charge density difference of the system with 2 hydrogen molecules (red
colored atoms) adsorbed is shown in (f), where yellow indicates regions of charge gain and
blue indicates regions of charge loss and carbon atoms are black colored. . . . . . . . . . . 51
x

5.1 Supercells for hydrogen binding over individual defect systems depicting different initial
positions for the adsorption of a hydrogen molecule: (a) Pristine (b) SW (c) SV (d) DV
585 (e) DV 555-777 (f) DV 5555-6-7777. . . . . . . . . . . . . . . . . . . . . . . . . . . . . 57
5.2 Top view of charge density for studied defective graphene systems (except for SV, found
in Fig. 5.10. The highest amount of charge can be seen to concentrate around the carbon
atoms arranged in rings. Conversely, the lowest amount of charge is present in the hollow
regions of these rings. The very high charge density around the carbon atoms make
the top and bridge positions unfavourable for adsorption. Among hollow positions, the
pentagon rings seem to have the most optimum charge density for favourable hydrogen
adsorption, whearas the lower charge densities of the larger rings leads to slightly weaker
binding energies. . . . . . . . . . . . . . . . . . . . . . . . . . . . . . . . . . . . . . . . . . 59
5.3 A side cross-section of the single vacancy defect: (a) prior to and (b) after adsorption of
hydrogen molecule. Adsorption of the hydrogen molecule clearly distorts the graphene
sheet, pushing the atoms adjacent to the vacancy out of the plane away from the hydrogen
molecule. . . . . . . . . . . . . . . . . . . . . . . . . . . . . . . . . . . . . . . . . . . . . . 60
5.4 Grain boundary defect consisting of 5-7 rings, analogous to Σ7 defect, and adsorbed
hydrogen molecules. Two adjacent supercells are shown to visualize the grain boundaries
indicated by the dashed lines. Note the different orientations of the graphene lattice on
each side of a grain boundary, indicating different grains. . . . . . . . . . . . . . . . . . . 63
5.5 Mixed defect system showing single vacancy at the top-left and Stone-Wales in the center.
The hydrogen molecule is adsorbed at the penta position in the Stone-Wales defect. The
hydrogen binding energy is significantly higher in this mixed defect system than for either
defect in isolation. . . . . . . . . . . . . . . . . . . . . . . . . . . . . . . . . . . . . . . . . 64
5.6 Single vacancy defect system with double-sided nickel metal decoration and hydrogen
molecule adsorption: (a) top view and (b) side view. The nickel atoms are anchored over
a single vacancy, while the adjacent vacancy is left undecorated. Although the hydrogen
molecule binding energy is still within the preferred range for hydrogen storage, it is
weaker than that of the corresponding system without vacancies. . . . . . . . . . . . . . 65
5.7 Defect engineered systems for hydrogen stroage: (a) SVMD system prior to hydrogen
adsorption, (b) SVMD system subsequent to hydrogen adsorption top view and (c) side
view. A total of 11 hydrogen molecules were adsorbed to yield a gravimetric density of
5.81%. Nine of the hydrogen molecules dissociated into individual atoms. The underly-
ing graphene sheet itself has undergone significant structural distoration subsequent to
hydrogen adsorption. The SWSVMD system prior to adsorption (d) is also shown, and
subsequent to hydrogen adsorption (b) top view and (c) side view. . . . . . . . . . . . . . 66
5.8 Change in average hydrogen binding energy of high defect density systems with increasing
number of hydrogen molecules: (a) single vacancy (SVMD) system (b) Stone-Wales and
single vacancy (SWSVMD) system. . . . . . . . . . . . . . . . . . . . . . . . . . . . . . . 67
5.9 The effect of interlayer spacing on the average hydrogen binding energy of high defect
density systems: (a) single vacancy (SVMD) system (b) Stone-Wales and single vacancy
(SWSVMD) system. . . . . . . . . . . . . . . . . . . . . . . . . . . . . . . . . . . . . . . . 68
xi

5.10 Top view charge density plot for the single vacancy defect. The three carbon atoms
adjacent to the vacancy can be observed to have lower charge density around them in
comparison to the rest of the carbon atoms in the graphene sheet. The carbon atom with
a dangling bond is located just above the vacancy in the figure. The other two adjacent
atoms have a greater amount of charge between them than the amount of charge between
either of them and the dangling bond atom, giving these two adjacent atoms slightly
higher stability than the dangling bond atom. . . . . . . . . . . . . . . . . . . . . . . . . . 71
5.11 Projected Density of States (PDOS) of graphene systems prior to hydrogen adsorption:
(a) pristine graphene (b) single vacancy defect (SV). The Fermi level is represented by
the dashed vertical line. The dangling bond carbon atom in the SV defect has less co-
ordination than atoms in the pristine graphene. Hence, its orbitals have a lower extent of
overlap and hybridization, leaving them more distinct and localized. This is visible from
the higher number of peaks in the PDOS for the SV defect at all energies. The unshared
charge in the more localized SV defect makes it more attractive for adsorpting a hydrogen
molecule. . . . . . . . . . . . . . . . . . . . . . . . . . . . . . . . . . . . . . . . . . . . . . 72
5.12 Side view of single vacancy (SV) charge density: (a) relaxed SV prior to adsorption and
(b) relaxed SV with adsorbed hydrogen molecule. Black filled circles represent carbon
atoms, while white filled circles represent hydrogen atoms. Regular hexagons of high
charge density usually found in graphene sheets can be seen on the left and right edges
of either diagram. In (a), the dangling bond carbon atom has a samller region of lower
charge than the hexagons and the low charge density of the vacancy region is also visible.
In (b), the dangling bond carbon atom has higher charge density equivalent to that of the
hexagons and the vacancy region also has visibly increased charge density. This increased
charge density is likely due to the charge supplied by the hydrogen molecule. . . . . . . . 74
5.13 Charge density plots of the mixed Stone-Wales and single vacancy system: (a) prior
to hydrogen adsorption and (b) subsequent to hydrogen adsorption. Single vacancies are
visible at the top left and right of the figures, while the Stone-Wales defect is in the center.
There is large redistribution of charge after adsorption of the hydrogen molecule (blue
atoms), with the regions around the pentagons of the Stone-Wales defect losing charge
to the single vacancies. This lower region of charge then strongly binds the hydrogen
molecule, leading to higher hydrogen binding energies than was the case for either defect
by itself. . . . . . . . . . . . . . . . . . . . . . . . . . . . . . . . . . . . . . . . . . . . . . . 75
6.1 Substrate structures and hydrogen adsorption sites of the six studied two-dimensional
carbon allotropes with double-sided lithium decoration: a) C31; b) C41; c) C62; d) C63
hexa; e) C63 tri; f) C64 hexa; g) C64 square; h) C65 hexa; i) C65 penta. . . . . . . . . . . 81
6.2 Average metal binding energies (eV/atom) at multiple sites for the six studied two-
dimensional carbon allotropes with double-sided lithium decoration . . . . . . . . . . . . . 82
6.3 Projected density of states (PDOS) for the lithium decorated two-dimensional carbon
allotropes from simulations using the vdW-DF2 functional: a) C31; b) C41; c) C62; d)
C63; e) C64; f) C65. There is evidence of sp hybridization within the carbon sheet and
hybridization between the lithium and carbon atoms. The C65 structure displays the
greatest degree of hybridization and electron sharing while the C31 structure displays the
highest localization of electrons. . . . . . . . . . . . . . . . . . . . . . . . . . . . . . . . . . 84
xii

6.4 Average hydrogen binding energies (eV/H2) at multiple sites for double sided lithium
decorated carbon allotrope systems . . . . . . . . . . . . . . . . . . . . . . . . . . . . . . . 85
6.5 Charge density difference isosurfaces for (a) C64-hexa and (b) C63-hexa systems. Yellow
indicates regions of charge gain, blue indicates regions of charge loss, green indicates
lithium atoms and red indicates hydrogen atoms. The isosurfaces show clear polarization
around the hydrogen molecules. . . . . . . . . . . . . . . . . . . . . . . . . . . . . . . . . . 86
6.6 Configuration of C64 system with maximum number of adsorbed hydrogen molecules.
Each lithium atom binds two hydrogen molecules to give eight molecules in the system
and a hydrogen gravimetric density of 2.6 wt%. . . . . . . . . . . . . . . . . . . . . . . . . 87
6.7 Configuration of C41 system with maximum number of adsorbed hydrogen molecules.
Each lithium atom binds three hydrogen molecules to give twenty four molecules in the
system and a hydrogen gravimetric density of 7.1 wt%. . . . . . . . . . . . . . . . . . . . . 88
xiii
List of Acronyms and Symbols
Acronym DescriptionAIMD ab initio molecular dynamicsCV collective variableDFT density functional theoryFS final stateGGA generalized gradient approximationIS initial stateLDA local density approximationMEP minimum energy pathNEB nudged elastic bandPDOS projected density of statesTISE time independent Schrodinger equationTS transition state
Symbol Units Descriptionr spatial coordinates of electronsR spatial coordinates of nuclein(r) - electron density
H - Hamiltonian operatorΨ - eigenvector term representing wavefunctionsE - eigenfunction term representing system energyExc - exchange-correlation functional, component of system energy EEsubscript eV DFT obtained ground state energy for subscript specified system or
process (activation, adsorption), representing potential energy for afixed configuration of atoms
Gsubscript eV free energy of subscript specified system or process (activation, ad-sorption)
xiv
Chapter 1
Introduction
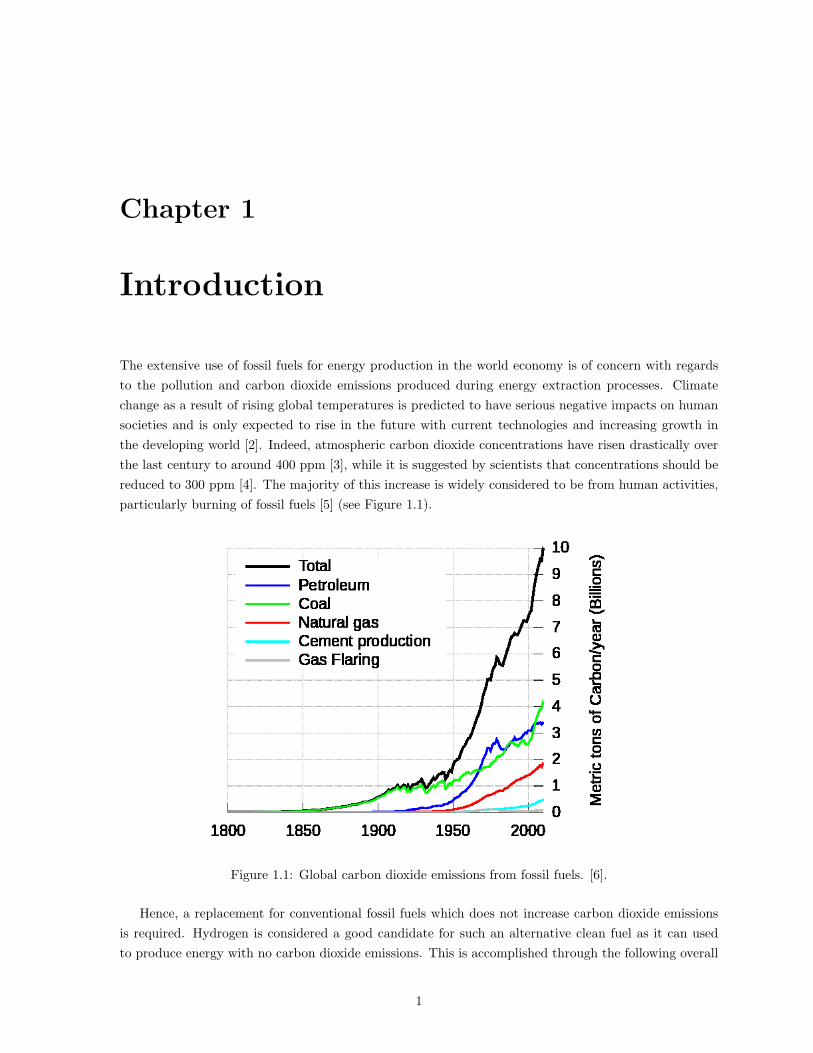
The extensive use of fossil fuels for energy production in the world economy is of concern with regards
to the pollution and carbon dioxide emissions produced during energy extraction processes. Climate
change as a result of rising global temperatures is predicted to have serious negative impacts on human
societies and is only expected to rise in the future with current technologies and increasing growth in
the developing world [2]. Indeed, atmospheric carbon dioxide concentrations have risen drastically over
the last century to around 400 ppm [3], while it is suggested by scientists that concentrations should be
reduced to 300 ppm [4]. The majority of this increase is widely considered to be from human activities,
particularly burning of fossil fuels [5] (see Figure 1.1).
Figure 1.1: Global carbon dioxide emissions from fossil fuels. [6].
Hence, a replacement for conventional fossil fuels which does not increase carbon dioxide emissions
is required. Hydrogen is considered a good candidate for such an alternative clean fuel as it can used
to produce energy with no carbon dioxide emissions. This is accomplished through the following overall
1

Chapter 1. Introduction 2
reaction, where the only byproduct is water:
2H2(g) +O2(g) → 2H2O(l) (1.1)
Hydrogen also has a high energy content by mass compared to conventional fossil fuels such as gasoline
(Table 1.1). Furthermore, hydrogen provides flexibility in that it can produce energy through combustion
Fuel Energy Content (MJ/kg)Hydrogen 120Liquefied natural gas 54.4Propane 49.6Automotive gasoline 46.4Automotive diesel 45.6Ethanol 29.6
Table 1.1: Energy content by mass for hydrogen and conventional fuels. Adapted from Ni et al.[7]
(via internal combustion engines or gas turbines) or electrolytic reaction (via fuel cells) and can be used
in both stationary and transportation applications. However, there are several technical challenges,
such as high cost and low efficiency, [8, 9] facing the practical implementation of a widespread hydrogen
energy system which consists of clean and renewable hydrogen production, storage and usage. Novel
nanomaterials such as two-dimensional substances and nanoparticles offer the possibility of overcoming
these technical challenges which current solutions are unable to satisfactorily solve.
1.1 Background Information
1.1.1 Hydrogen production
One of the problems associated with using hydrogen as a fuel is that it is not easily found in nature and
so must be extracted from other compounds. There are currently multiple possible routes for hydrogen
production (Figure 1.2), however the majority of current global hydrogen is produced from fossil fuels
[8] through steam reformation of natural gas or from crude oil fractions in refineries. This defeats the
purpose of using hydrogen to reduce fossil fuel use and so there is a focus on renewable methods of
production. Hydrogen from water splitting is particularly attractive as it uses an abundant feedstock
present in much higher quantities and requiring less processing than biomass.
The splitting of water itself presents several challenges due to the high energy input required for
traditional electrolytic dissociation. As such, there are numerous thermochemical, photochemical and
electrochemical approaches proposed which utilize energy from renewable sources and catalysts to reduce
the energy needed to drive the water dissociation reaction forward [9]. Photocatalytic materials are
interesting as they split water powered by passive sunlight and thus have greatly reduced greenhouse
gas emissions [10]. Many studied photocatalytic materials are heterogeneous metal compounds such as
metal oxides, nitrides and sulfides [11].

Chapter 1. Introduction 3
Figure 1.2: Hydrogen production methods. Reprinted from [9] with permission from Elsevier.
1.1.2 Hydrogen storage
One major issue facing deployment of hydrogen fuel systems is that of easy storage and transportation,
which is not possible with current technologies [12]. Despite having a high energy content by mass,
hydrogen has very low volumetric densities compared to fossil fuels. Conventional systems such as high
pressure compressed gas storage or low temperature cryogenic gas storage present problems as they
operate under extreme and unsafe conditions [13]. As a result, a variety of storage methods have been
proposed and adsorption of hydrogen on solid substrates has received intense research focus [14], looking
at high specific area substrates such as metal organic frameworks [15], carbon nanotubes [16] and boron
nitride sheets [17] and fullerenes [18]. Figure 1.3 showcases many of the hydrogen storage technologies
being currently looked at.
Adsorption based technologies also have to deal with providing sufficient hydrogen gravimetric den-
sity due to the added mass of the substrate and low relative mass of hydrogen. The United States
Department of Energy (DOE) has set an initial hydrogen gravimetric density target [19] of 5.5 wt.%
for light transportation applications and this is often the goal for adsorption based hydrogen storage
solutions.
1.2 Computational atomistic modeling
This study primarily consists of first principles based modeling of material properties at the atomic scale.
Computational modeling complements experimental investigations by probing processes inaccessible or
unfavorable to experimental study or by speeding up and providing direction to experimental discovery
of materials. In the latter role, it can screen materials and rank them according to a specific property,
yielding the most suitable materials for further experimental testing. This process can be potentially
much faster and cheaper than experimental based screening and more logically directed than the trial
and error approach often used in experimental discovery [20]. Computational simulations can predict the
stable phases, structural properties, thermal properties and electronic properties such as band structure
of these materials and greatly contribute to optimization of a material for a particular application. These
abilities are especially useful for the study of nanoscale materials such as graphene, a two-dimensional
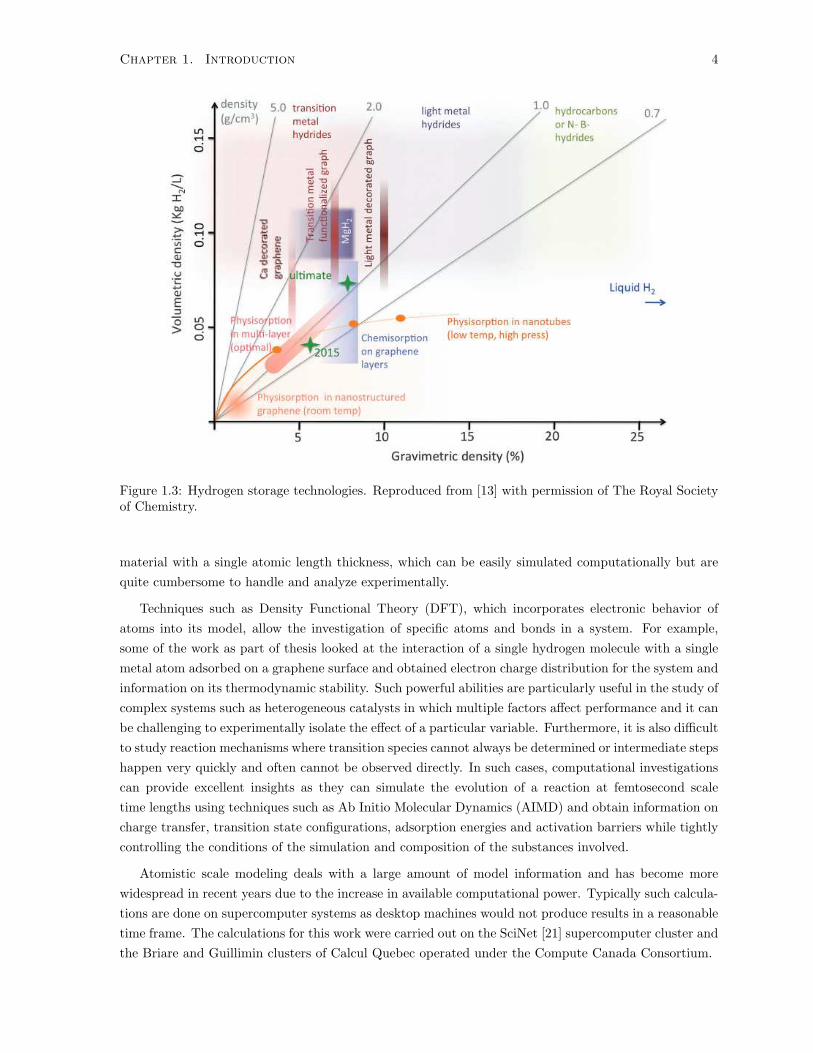
Chapter 1. Introduction 4
Figure 1.3: Hydrogen storage technologies. Reproduced from [13] with permission of The Royal Societyof Chemistry.
material with a single atomic length thickness, which can be easily simulated computationally but are
quite cumbersome to handle and analyze experimentally.
Techniques such as Density Functional Theory (DFT), which incorporates electronic behavior of
atoms into its model, allow the investigation of specific atoms and bonds in a system. For example,
some of the work as part of thesis looked at the interaction of a single hydrogen molecule with a single
metal atom adsorbed on a graphene surface and obtained electron charge distribution for the system and
information on its thermodynamic stability. Such powerful abilities are particularly useful in the study of
complex systems such as heterogeneous catalysts in which multiple factors affect performance and it can
be challenging to experimentally isolate the effect of a particular variable. Furthermore, it is also difficult
to study reaction mechanisms where transition species cannot always be determined or intermediate steps
happen very quickly and often cannot be observed directly. In such cases, computational investigations
can provide excellent insights as they can simulate the evolution of a reaction at femtosecond scale
time lengths using techniques such as Ab Initio Molecular Dynamics (AIMD) and obtain information on
charge transfer, transition state configurations, adsorption energies and activation barriers while tightly
controlling the conditions of the simulation and composition of the substances involved.
Atomistic scale modeling deals with a large amount of model information and has become more
widespread in recent years due to the increase in available computational power. Typically such calcula-
tions are done on supercomputer systems as desktop machines would not produce results in a reasonable
time frame. The calculations for this work were carried out on the SciNet [21] supercomputer cluster and
the Briare and Guillimin clusters of Calcul Quebec operated under the Compute Canada Consortium.
Chapter 1. Introduction 5
1.3 Motivation
Nanomaterials provide exceptional properties, such as very high specific surface area, and an unprece-
dented ability to modify and tune such characteristics. Hence, they make very promising candidates
for overcoming the technical challenges related to the very important sustainable energy issues outlined
in Section 1.1. For example, the atomic layer thick two-dimensional material called graphene has been
labeled a wonder material which has phenomenal properties and possible applications across an enor-
mous number of fields [22]. Since the discovery of graphene there have been a large number of further
two-dimensional materials, both synthesized and theoretically proposed, which also display exceptional
properties [23]. Nanoparticles have also been the focus of intense research activity and optimism in
producing superior materials properties [24, 25]. Such nanoscale materials make ideal candidates for in-
vestigation through DFT modeling and there has been an explosive growth in research papers with such
studies over the last two decades. Hence, DFT was used to explore graphene and other two-dimensional
carbon allotropes such as graphyne for their use in hydrogen storage applications, two-dimensional MoS2
as a photocatalyst for water splitting as part of hydrogen production and In2O3 nanoparticles as pho-
tocatalysts for hydrogenation of carbon dioxide into methanol. Each of these materials shows great
promise in improving on the performance of the best currently available technologies for each of these
applications.
1.4 Thesis objectives
The use of nanoscale materials, consisting of two-dimensional materials and nanoparticles, for use in
renewable hydrogen production hydrogen storage and atmospheric carbon dioxide mitigation applications
was evaluated through density functional theory with the following specific objectives:
• Investigate Hydrogen Production from Water on Two-Dimensional Molybdenum Disul-
fide
◦ Determine active sites and binding energies for water adsorption on MoS2-edge terminations
◦ Determine reaction mechanisms and activation barriers for water dissociation on MoS2-edge
terminations
• Investigate Hydrogen Storage on Two-Dimensional Carbon Substrates
◦ Study the hydrogen binding energies of metal decorated graphene with various metal adsor-
bates and accurate van der Waals corrections and determine the maximum possible hydrogen
gravimetric density for such systems
◦ Investigate the effect of point defects and mixed defect regions on hydrogen adsorption ability
of graphene and determine the maximum possible hydrogen gravimetric density for such
systems
◦ Evaluate the hydrogen adsorption ability of lithium decorated two-dimensional carbon al-
lotropes other than graphene and determine their maximum possible hydrogen gravimetric
density

Chapter 1. Introduction 6
1.5 Thesis organization
The outline of this thesis is as follows: chapter 2 introduces the theoretical concepts behind the atomistic
modeling techniques used for this work; chapter 3 focuses on evaluating water adsorption and dissociation
on MoS2-edge terminations; chapter 4 focuses on hydrogen storage on metal decorated graphene; chapter
5 focuses on hydrogen storage on defective graphene; chapter 6 focuses on hydrogen storage on non-
graphene metal decorated two-dimensional carbon allotropes; and chapter 7 provides conclusions and
possibilities for future work.

Chapter 2
Atomistic Modeling
The research presented in this thesis utilized the computational technique of Density Functional Theory
(DFT) which allows for the atomic scale modelling of materials with the inclusion of electron effects in a
relatively efficient manner. The DFT technique was used to calculate the ground state energies of systems
with various compositions and configurations. The energy difference in system configurations allowed
for the prediction of stability and relative favorability of each configuration. This was then used to find
the adsorption energy of various chemical species on substrates throughout the study. Additionally, the
Nudge Elastic Band (NEB) method was used in conjunction with DFT calculations to find the activation
energy barrier for the water dissociation reaction. Ab Initio Molecular Dynamics (AIMD) was used to
include finite temperature effects in which a system was allowed to dynamically evolve over time while
keeping track of its potential energy. Such AIMD simulations were also biased using a metadynamics
potential which allowed for the calculation of the system’s free energy and the energy barrier for the
water dissociation reaction. The Quantum Espresso [26] software suite was used to carry out all DFT
simulations in this work, with the added PLUMED [27] plug-in to facilitate metadynamics biased AIMD.
The following sections explain the theoretical basis for the mentioned techniques.
2.1 Density Functional Theory
The Schrodinger equation can fully describe the quantum state of a particular set of atoms. However,
solving the partial differential equation for most systems is infeasible as the equation becomes a many-
body problem with an enormous number of dimensions. Building on a number of approximations, DFT
is able solve the non-relativistic time-independent Schrodinger equation (TISE) by greatly reducing the
number of dimensions and can reasonably predict the ground (lowest energy) state quantum properties
for a wide variety of systems in a practical time frame. The TISE is of the basic form:
HΨ = EΨ (2.1)
and consists of a Hamiltonian operator H, eigenvectors Ψ (which represent wavefunctions) and eigen-
values E (which represent system energy). The Hamiltonian in turn is composed of the following terms,
which describe a set of atoms with interacting nuclei (with spatial coordinates represented by R) and
electrons (with spatial coordinates represented by r):
7

Chapter 2. Atomistic Modeling 8
H = Te(r) + TN (R) + VeN (r,R) + VNN (R) + Vee(r) (2.2)
Here, the first term on the right represents the kinetic energy of electrons, the second term represents
kinetic energy of nuclei, the third term represents electron-nuclei interactions, the fourth term represents
nuclei-nuclei interactions and the last term represents electron-electron intereactions. This Hamiltonian
does not include a term for spin-orbit effects which are generally neglected for DFT calculations but
can be added later if desired for a particular system. The simulations in this thesis did not include
spin effects; their effect was tested for particular metal atoms and it was confirmed their effect could
be ignored. Equation 2.2 clearly shows the multiple-body problem inherent in solving the TISE as
there are interacting terms (in terms of both r and R) which must be simultaneously solved. The
Born-Oppenheimer approximation helps to reduce the difficulty in solving this equation.
2.1.1 Born-Oppenheimer approximation
The Born-Oppenheimer (BO) approximation separates an atom’s wavefunctions into components corre-
sponding to nuclei and electrons, in which the wavefunction is expressed as a product of its individual
components, Ψ(r,R) = Ψ(r)χ(R). As nuclei are much more massive than electrons, their velocities are
substantially smaller and electron motion can be considered to be occuring on a timescale where the
nuclei are almost stationary. This fact leads to the computational methodology which takes advantage
of the BO approximation as it allows the solution of two distinct math problems [28]. First positions of
the nuclei are fixed while the wavefunctions describing electronic motion within the field of the nuclei
are determined for their lowest ground state energy. As the nuclei are fixed, R acts as a parameter for
the electronic component of the wavefunction:
Ψ(r,R) = Ψ(r;R)χ(R) (2.3)
The stationary nuclei also mean that the TN (R) term of the Hamiltonian in Equation 2.2 can be
removed and the VNN (R) term can be neglected for further Hamiltonian formulations as it is a constant
and can be grouped with other such terms. The TISE, with expanded terms, is now of the form:
− h2
2m
N∑
i=1
∇2i +
N∑
i=1
V (ri) +
N∑
i=1
∑
j<i
U(ri, rj)
Ψ = EΨ (2.4)
where the the first term on the left represents the kinetic energy of electrons, the second term
represents electron-nuclei interactions and the last term represents electron-electron interactions for a
system with N electrons. Here Ψ essentially consists of the electronic wavefunction (Ψ(r)) alone. All
constants, such as χ(R) have been rolled into the E term.
Next the parameter corresponding to nuclear position (R) can be repeatedly changed and Equation
2.4 solved again for each new value to give system energy as a function of the nuclei position. This
multidimensional energy potential function describes the adiabatic potential energy surface, also known
as the Born-Oppenheimer potential energy surface. Hence, this method effectively separates electronic
and nuclear motion and solves for them independently.

Chapter 2. Atomistic Modeling 9
2.1.2 Hartree-Fock and the variational principle
After the Born-Oppenheimer approximation, the electronic wavefunction is still a function of the co-
ordinates of all electrons in the system. The Hartree product assumes that this wavefunction can be
expressed a product of individual electron wavefunctions, which for N electrons is:
Ψ = Ψ1(r1)Ψ2(r2), . . . ,ΨN (rN ) (2.5)
These individual wavefunctions could now be solved independently of each other and again this sepa-
ration of functions would help to greatly reduce mathematical complexity. However, the simple Hartree
product does not always satisfy the antisymmetry principle which states that the wavefunction must
change sign whenever any two electrons are exchanged (from which is derived the Pauli exclusion prin-
ciple). The Hartree-Fock approximation instead approximates the electronic wavefunction with a Slater
determinant to create an anti-symmetric product of non-interacting wavefunctions. The Slater determi-
nant for N electrons is essentially a determinant of a N x N matrix of individual electron wavefunctions
which produces a sum of N! Hartree products each with individual electron wavefunctions in a different
order and has the following form:
Ψ(r1, r2, . . . , rN ) =1√N !
∣
∣
∣
∣
∣
∣
∣
∣
∣
∣
Ψ1(r1) Ψ2(r1) · · · ΨN (r1)
Ψ1(r2) Ψ2(r2) · · · ΨN (r2)...
.... . .
...
Ψ1(rN ) Ψ2(rN ) · · · ΨN (rN )
∣
∣
∣
∣
∣
∣
∣
∣
∣
∣
(2.6)
This product can be treated in a similar fashion to the Hartree product in that each electron can be
assumed to move independently of other electrons. Next the variational principle helps us to solve for
the energy and eventually wavefunction solutions of the problem. The energy is expressed as a function
of the wavefunction as:
E [Ψ] =< Ψ|H|Ψ >
< Ψ|Ψ >
< Ψ|H|Ψ > =
∫
Ψ∗HΨd−→r(2.7)
The variational principle says that this energy is always an upper bound to the true energy. By varying
the wavefunction parameters, we can minimize the energy for the particular system (find it’s ground
state energy) and better approximate the actual wavefunctions. Therefore, the true wavefunctions will
minimize the energy.
2.1.3 Hohenberg-Kohn theorems and Kohn-Sham equations
Even after the Hartree-Fock method, we are still left with solving for a high number of individual
electron wavefunctions and this remains a computationaly difficult problem. Hohenberg and Kohn
helped to simplify this problem and established DFT by introducing two important theorems which
used the electron density of the system. The electron density of the system is a spatial quantity defined
Chapter 2. Atomistic Modeling 10
as a function of individual wavefunctions:
n(r) = 2∑
i
Ψ∗i (r)Ψi(r) (2.8)
The first theorem stated that the ground state energy in the Schrodinger equation of system is a
unique functional of the electron density. This manages to remove the many-body issue by allowing the
expression of the Schrodinger equation in terms of the electron density which only depends on three
spatial coordinates, thereby reducing the electronic description of the system to a three dimensional
problem instead of the 3N dimensions needed previously for N electrons. The second theorem stated
that the electron density which minimizes the energy functional is the true electron density which would
be produced by the exact ground state solution of the Schrodinger equation. Hence, by finding the energy
functional minimum, we can now solve for the exact electron density of the system. Unfortunately, the
Hohenberg-Kohn theorems do not provide the exact form of the energy functional and finding the form
of this energy functional remains the principle challenge in DFT to this day. The energy functional, in
terms of electron density n(r), can be written as:
E(n) = Te(n) + Vext(n) + VH(n) + Exc(n) (2.9)
The terms on the right hand side, other than the Exc [n] term, include electron kinetic energy and
Coulombic interactions between and amongst nuclei and electrons and their exact forms are known. The
remaining Exc [n] term is known as the exchange-correlation functional and includes the effects of ex-
change interaction and correlation between electrons as well any other effects, such as self-interaction cor-
rections, which are not included in the earlier known terms. The exact form of the exchange-correlation
functional for any system other than the free electron gas is not known. Over the years there have been
several approximate forms proposed to represent this term. One of the earliest and simplest functionals
is called the Local Density Approximation (LDA) which uses the local density of the exactly known
uniform electron gas to define the exchange-correlation functional. The next class of functional which is
still very widely used today is the Generalized Gradient Approximation (GGA) which incorporates both
the local density and the local gradient of the electron gas. There are numerous specific implementations
of these functionals as well more complex and hybrid functionals with additional terms available.
The energy functional in Equation 2.9 was then used by Kohn and Sham to reformulate the TISE in
terms of electron density as:
[
− h2
2m∇2 + V (r) + VH(r) + VXC(r)
]
ψi(r) = εiψi(r) (2.10)
This equation contains similar terms to those in Equation 2.4. The second term on the left defines
interaction between an electron and nuclei and the third term describes interaction between an electron
and total electron density with the following form:
VH (r) = e2∫
n(r′)
|r− r′|d3r′ (2.11)
This highlights how Equation 2.10 differs from the original TISE in the key fact that it involves only
electron density and single electron wavefunctions of three spatial variables for the terms on the left hand
side as opposed to the summation terms which included the effects of all other electrons in the original

Chapter 2. Atomistic Modeling 11
TISE. The last potential term in the left hand side of Equation 2.10 is related to the exchange-correlation
functional from Equation 2.9 through the following relationship:
VXC (r) =δEXC(r)
δn(r)(2.12)
The Kohn-Sham equations can be then iteratively solved in a self consistent manner to find the
ground state electron density, single-particle wavefunctions and ground-state system energy.
2.1.4 Plane-wave periodic systems
When studying continuous periodic systems, as is common for solid materials and was the case for all
investigations in this work, the solution to Schrodinger’s equation must satisfy the Bloch theorem. Such
systems have a periodically repeating system space known as the supercell. The Bloch theorem states
that the Schrodinger equation solution can be expressed as a sum of terms where the wavefunction has
the following form:
ψk(r) = exp(ik · r)uk(r) (2.13)
where uk(r) is periodic in space with the same periodicity as the supercell. This implies that the
Schrodinger equation can solved for each value of k independently. The k vectors are part of k-space
which is also known as the reciprocal space used in crystallography and solid state physics fields. Solving
the DFT mathematical expressions is easier when working in k-space and this approach is commonly
adopted when working with periodic systems. Such methods are referred to as plane wave calculations as
functions with the form of the exponent on the right hand side of Equation 2.13 are known as plane wave
functions. Many calculations in k-space involve integrating functions of k vectors over the primitive cell
of the system in reciprocal space known as the Brillouin zone. The selection of k values over which to
perform integration in the Brillouin zone is an important parameter that must be specified in most DFT
implementations.
The periodic uk(r) term in Equation 2.13 can be further expanded in terms of a special set of plane
waves:
uk(r) =∑
G
cGexp(iG · r) (2.14)
Combining this equation with Equation 2.13 results in an expression involving summation over an
infinite number of G vector values. However, the functions in this combined expression can be interpreted
as solutions of the Schrodinger equation involving kinetic energy, E = h2m |k+G|2. As such, the lower
energy solutions are more significant physically and the higher energy solutions can be ignored for most
practical applications. Therefore, the infinite sum of the G vector expressions is truncated to solutions
which have kinetic energies below a certain cutoff energy. This then reduces the expression for the
solutions to the following form:
ψk(r) =∑
|G+k|<Gcut
cG+kexp[i(k+G)r] (2.15)
The cutoff energy is an important parameter that must be selected in most DFT implementations.

Chapter 2. Atomistic Modeling 12
2.1.5 Pseudopotentials
The core electrons of atoms are often not very important for physical interactions between atoms, such
as those involving chemical bonding or electronic conductivity. Furthermore, such core electrons require
very large energy cutoffs to model in plane wave calculations due to their small length scale oscillations.
As a result the core electrons can be approximated by pseudopotentials. Pseudopotentials make use of
the frozen core approach in which the electron density for core electrons up to a certain radial cutoff is
replaced with an effective density which matches the density calculated from an all electron simulation.
This allows the usage of much lower energy cutoffs as only valence electron plane waves are solved in
each calculation and thus reduces computational expense. The three common types of pseudopotentials
are ultrasoft pseudopotentials (USPP), projected augmented wave (PAW) and norm-conserving. The
USPPs usually require the lowest energy cutoffs but contain more empirical parameters and so can be
less easily used across differing systems and computational setups.
2.2 Nudged Elastic Band
The Nudged Elastic Band (NEB) technique is essentially a method for finding the Minimum Energy
Pathway (MEP) connecting two local minima on a potential energy surface [29]. This is useful for
finding the reaction path and transition states in a proposed chemical reaction. The method works by
linearly interpolating a set of images (each image corresponding to a certain configuration of atoms)
between the initial and final states and minimizing the energy of this set of images. The images are
forced to maintain their distance to neighboring images during energy minimization by adding spring
forces between them along the path or band they form. The component of the potential force parallel
to to the band is also removed from acting on the images, ensuring that only the spring forces act on
images along the path and only potential forces act on the images perpendicular to the path (this is
referred to as the nudging). This prevents the images from relaxing to the energy minima of the initial
and final states. The Climbing Image (CI) implementation of NEB is a method for finding the true
saddle point along the MEP as normal NEB rarely has images present at this point [30]. In CI-NEB,
the highest energy image is driven up to the saddle point by removing the spring forces acting on this
image and inverting the true forces acting on this image along the tangent of the band. This results
in the highest image moving towards the maximum of the potential energy surface in the direction of
the band while minimizing its values on the potential energy surface in directions perpendicular to the
band, which causes it to reach the definition of a saddle point.
2.3 Ab Initio Molecular Dynamics
The previously described DFT methods study essentially static systems at their lowest ground state
energies where the atoms posses zero velocities. Molecular dynamics (MD) allows one to look at the dy-
namic evolution of an atom’s trajectory with atomic velocities assigned at finite temperatures. Classical
MD is described by the general algorithm outlined in Figure 2.1.
The basic premise of MD involves calculating the potential energy field for a particular configuration
of atoms. This potential can be calculated by a large number of available methods and in classical
simulations it is generally based on regarding atoms as spheres with no separation of nuclei and electrons
and taking into account various interatomic interactions. Next the potential is used to calculate the forces

Chapter 2. Atomistic Modeling 13
Figure 2.1: Basic Molecular Dynamics (MD) algorithm. [1].
acting on each atom in the system, generally obtained by taking some form of derivative of the potential.
These forces are then fed into equations of motion which are solved for each component of the system
over some time interval. The solutions are used to propagate the positions of each atom. The equations
of motion are generally classical Newtonian or Lagrangian in form and integrated numerically. There
are various numerical schemes for the equation of motion integration and atomic propagation steps, with
one of the most common methods being the velocity verlet scheme [31] which is also used for simulations
in this work. This entire process is repeated iteratively for the desired simulation time interval.
The macroscopic properties of the system, such as temperature, are sampled using various statistical
mechanics ensemble averages, as long as the system obeys the ergodic hypothesis. In fact, MD simulations
are usually constrained based on these ensembles, common examples being the microcanonical ensemble
(in which the total system energy is conserved) and canonical ensemble (in which the system temperature
is kept constant). The latter ensemble allows the system to exchange energy with its surroundings and
is generally more representative of real world experimental conditions in which we are interested. There
are a variety of thermostats available which exchange energy with the system to maintain the canonical
ensemble (and hence maintain the temperature), for instance they often modify the velocities (and hence
kinetic energy) of the atoms in the system. The simulations in this work utilized the Andersen thermostat
[32], in which the system is coupled to a heat bath which modifies the kinetic energies of atoms using
random collision events whose collision frequency is determined stochastically. These collisions produce
new velocities based on the Boltzman distribution of velocity at the set temperature.
Ab initio molecular dynamics (AIMD) differs from classical MD chiefly in that it explicitly includes
electronic effects separately from nuclei instead of considering the whole atom as a single hard sphere
[33]. These electronic effects are then incorporated into the calculation of potentials and forces. In the
simplest form of AIMD, named Born-Oppenheimer molecular dynamics (BOMD) and the method used
for simulations in this work, the electronic and nuclear systems are fully decoupled from each other
in a manner similar to that in DFT. BOMD follows the exact same algorithm as classical MD except
that the potential and force calculation steps are performed with more in-depth calculations. A full
DFT electronic ground state calculation is conducted to obtain the potential energy of the system as
Chapter 2. Atomistic Modeling 14
a function of spatial electron density (where as part of a normal DFT calculation following the BO
approximation, the nuclei are fixed). The forces acting on nuclei in the system are then calculated based
on the Hellmann-Feynmann theorem:
~Fi = − dE
d ~Ri
= −d⟨
Ψ∣
∣
∣H∣
∣
∣Ψ⟩
d ~Ri
=
⟨
Ψ
∣
∣
∣
∣
∣
− dH
d ~Ri
∣
∣
∣
∣
∣
Ψ
⟩
=
⟨
Ψ
∣
∣
∣
∣
∣
− dV
d ~Ri
∣
∣
∣
∣
∣
Ψ
⟩
(2.16)
These forces are then used in the normal MD algorithm to solve classical equations of motion and
then propagate the atomic nuclei as if they were classical particles. This ensures that as the system
evolves with time, it follows the Born-Oppenheimer or adiabatic potential energy surface.
2.3.1 Metadynamics
Metadynamics is a technique that can accelerate rare events in molecular dynamics simulations (both
classical MD and AIMD) by adding an extra potential to the system and can also reconstruct the free
energy of the simulation [34, 35]. The metadynamics algorithm relies on selecting a number of collective
variables (CV) to describe the system, where the collective variables are functions of spatial coordinates
(S(r)) and represent degrees of freedom analogous to reaction coordinates in other approaches. The
equilibrium probability distribution of these variables is given by :
P (s) =exp(−(1/T )F (s))
∫
ds exp(−(1/T )F (s))(2.17)
where s denotes the d dimenionsional vector representing values of the d CVs describing the system.
Here F(s) represents the free energy as a function of CVs through the following relationship:
F (s) = −T ln
(∫
dx exp
(
− 1
TV (r)
)
δ(s− S(r))
)
(2.18)
The metadynamics algorithm adds a history dependent potential to the Hamiltonian describing the
system, where the potential is built from a sum of Gaussians centered along the trajectory of the CVs.
The form of the external potential added by the metadynamics algorithm at time t is the following:
VG(S(r), t) = ω∑
t′=τG, 2τG, ... for t<t′
exp
(
− (S(r)− s(t′))2
2δs2
)
(2.19)
Here τG is the frequency of Gaussian deposition, ω is the Gaussian height and δs is the Gaussian
width. This potential helps to accelerate rare events which would take excessive simulation times to occur
in normal MD simulations. By biasing the simulation trajectory it helps to push the system out of local
free energy minima and discourages the system from returning to energy minima it has already escaped.
This is especially useful for exploring reaction pathways as the system will usually escape energy minima
through the lowest saddle points, the system can sample a wide variety of possible configurations if the
CVs are chosen well and knowledge of the final state of the system is not required (unlike in NEB).
Additionally the recorded history of the deposited Gaussians can be used to reconstruct the free energy
surface of the evolving system as the metadynamics potential eventually mirrors the free energy, after a
sufficient period of time, through the following relation:
limt→∞
VG(s, t) ∼ −F (s) (2.20)

Chapter 3
Water Dissociation on
Two-dimensional Molybdenum
Disulfide Edges
3.1 Introduction
The interaction of water molecules with solid surfaces and their possible subsequent dissociation is of
particular interest [36], especially as this is a process which serves as a precursor to various important
reactions, including the renewable generation of hydrogen from water through the hydrogen evolution
reaction (HER) and the syntheis of methanol through the water gas shift (WGS, CO + H2O→ CO2+H2)
reaction. Due to the high energetic costs of water splitting, there are many catalysts being investigated
to facilitate this process [37, 11, 38]. This work looks at two-dimensional MoS2 as one such possible
catalyst in promoting water dissociation, which has been suggested to be the rate limiting step for
hydrogen production for a variety of metals [39]. The geometries and active sites for water adsorption
were studied for three edge terminations of MoS2. Next, the activation energies for the water dissociation
reaction on each edge were determined using climbing image nudged elastic band (CI-NEB) methodology.
Finally, finite temperature effects were included through ab initio molecular dynamics (AIMD) and
metadynamics to study the water dissociation reaction on the most favorable edge. The activation
barriers were then used to estimate the rate of reaction for water dissociation.
3.2 Literature Review
Recently, various experimental studies have reported the synthesis of chalcogenide MX2 monolayers,
such as MoS2, WoS2, MoSe2, MoTe2, TiS2, TaS2, TaSe2, NiTe2, and ZrS2 [40, 41] and they have
attracted attention for a broad range of applications including electronics, optoelectronics, photovoltaics
and photocatalysis. As two-dimensional (2D) materials, they possesses a high specific surface area ideal
for catalysis and a small band-gap which allows them to be strong visible light absorbers and possibly
promote photocatalytic reactions [42]. In fact, both MoX2 and WX2 have indirect band-gaps as bulk
materials while their monolayers posses direct bandgaps [43, 44], highlighting the interesting properties
15

Chapter 3. Water Dissociation on Two-dimensional Molybdenum Disulfide Edges 16
of 2D materials. Furthermore, out of these monolayeres, only molybdenum disulphide (MoS2) has its
band positions aligned with the water oxidation and reduction potentials [45], which combined with its
stability against photocorrosion [46], make it an interesting material for use as a photocatalyst for water
splitting. Additionally, MoS2 might serve as a possible cheaper and more abundant future replacement
for precious metal catalysts (such as the optimally performing but expensive platinum).
MoS2 itself has been previously studied for potential applications as an electrocatalyst for hydrogen
evolution. While large scale bulk MoS2 is a poor catalyst [47], nanoparticles of MoS2 have shown high
activity [48, 49, 50, 51]. The HER activity for these nanoparticles is strongly associated with exposed
edge sites that have a local stoichiometry, physical structure and electronic structure that differs from
the catalytically inert basal planes of MoS2 [52, 53, 54]. Similar investigations of 2D MoS2 are critical
for designing and developing 2D MoS2 based catalytic materials. A recent theoretical study reported
that, similar to the inert basal planes of bulk MoS2, the surface of pristine 2D MoS2 is not very favorable
for water adsorption and dissociation due to the repulsive interaction between free H2O and the perfect
surface [55]. The study looked at triple vacancy defects as a way of disrupting the perfect surface and
found that they lead to exothermic adsorption and dissociation of water molecules. Another theoretical
has found that 2D MoS2 edges are potentially favorable for proton reduction [56]. However, despite
the excellent activity of bulk MoS2 edges, there is no available theoretical or experimental investigation
of the catalytic activity of 2D MoS2 monolayer edges for water adsorption and dissociation (H2O →OH + H) mechanisms in terms of thermodynamic stability, active sites, activation barriers and rates of
reactions.
3.3 Computational Details
3.3.1 Ab Initio Techniques
IIn order to understand the electronic structure and photocatalytic properties of MoS2, density functional
theory (DFT) was utilized. The Quantum Espresso [57] software package within the plane-wave basis
set approach was utilized throughout this study. Interactions between the valence electrons and the
ionic core were represented by the projector augmented wave (PAW) [58] method with Perdew-Burke-
Ernzerhof (PBE) formulation[59]. Kinetic energy cutoffs of 680 eV and 6800 eV were used for the
wave functions and the charge density, respectively. Brillouin zone integrations were performed using
a Monkhorst-Pack [60] grid of 4× 4× 1 k-points. To obtain better equilibrium separations, structural
parameters (like bond length, bond angle) and adsorption energies, long range non-local effects such as
van der Waals (vdW) forces were taken into account by applying van der Waals corrections through the
vdW-DF2 functional [61]. The structures were relaxed using a conjugate gradient minimization algorithm
until the magnitude of the residual Hellman-Feynman force on each atom was less than 0.025 eVA−1.
The evaluation of the minimum energy reaction paths (MEPs) and Transition states (TS) has been
done using the climbing image nudged elastic-band (CI-NEB) method [62, 63, 64]. Finite temperature
analysis of the system at 300 K was conducted through ab-initio molecular dynamics (AIMD) on the
Born-Oppenheimer surface which maintained temperature through the Andersen thermostat. A time
step of 2.5 fs was employed for the AIMD and Brillouin zone integrations were performed on the Γ point
in order to decrease simulation times. Biased AIMD simulations were conducted using the metadynamics
[34, 35] technique applied through the PLUMED [27] plugin with the same timestpe and temperature.

Chapter 3. Water Dissociation on Two-dimensional Molybdenum Disulfide Edges 17
3.3.2 Structure Model
The basal plane of 2D MoS2 consists of two hexagonal planes of sulfur (S) atoms and an intercalated
hexagonal plane of molybdenum (Mo) atoms bonded to the S atoms in a trigonal prismatic arrangement,
as indicated in Fig. 3.1(a, b). A single MoS2 sheet cut along the dotted lines (Fig. 3.1(a) is terminated
by three different 1D edge terminations Fig. 3.1(c-e). The first edge termination consists of two S
atoms per Mo atom (100% S coverage) shown in Fig. 3.1(c), the second consists of single S atoms
(50% S coverage) shown in Fig. 3.1(d) and finally the third consists of Mo atoms only (0% S coverage)
as shown in Fig.3.1(e). The present study was restricted to these sulfur coverages as previous slab
calculations [65] indicate that only these coverages are thermodynamically stable. In agreement with
previous studies [65], the 100% S coverage or S100-edge exhibits S2 dimers after relaxation and the outer
Mo atoms are sixfold coordinated. Furthermore it should be noted that a slight pairing of the S2 dimers
is observed. Reducing the S coverage to 50% leads to a zigzag configuration, where the S monomers
are in a bridging position and the Mo atoms again have sixfold coordination. The S-edge with 0% S
coverage (Mo-edge) is subjected to reconstructions due to the very low coordination (twofold) of the Mo
atoms.
3.4 Results and discussion
3.4.1 Adsorption of H, OH and H2O
As a first step, active sites for the adsorption of the H2O, OH and H species were investigated. A water
coverage of 0.25 ML (i.e. one water molecule per unit cell) was used. The adsorption energy of an
adsorbate on the surface was calculated as:
∆Eads = Etot − Ebare − Ead, (3.1)
where Etot, (Ebare) are the energy of the slab with (without) adsorbate and Ead is the energy of the
isolated adsorbate species calculated in the same supercell. Hence, a negative ∆ Eads indicates stable
adsorption whereas a positive value indicates unstability. To check the advantage of the edge termina-
tions we first investigated the possibility of water dissociation on the stoichiometric 2D MoS2 surface
(basal plane). We considered various high-symmetry sites and found that the configuration of the water
molecule remains intact with it possessing a postive adsorption energy. This indicates a repulsive inter-
action between free H2O and the perfect surface of MoS2. The ∆ Eads values for H and OH were also
positive which suggests that dissociation of water on the MoS2 basal plane will not take place. This is
likely because the O atom cannot receive sufficient electrons in order to release H and is in agreement
with previous study [55].
Next, the adsorption of H, OH and H2O on the three MoS2 edges was investigated. Although each
edge had different surface configurations, they were all composed of the same basic pattern of a plane
of Mo atoms sandwiched between two planes of S atoms and thus had similar types of adsorption sites.
These common adsorption site types are shown in Fig. 3.2(a) for the S50-edge, Fig. 3.2(b) for the
S100-edge and Fig. 3.2(c) for the Mo-edge. They consisted of the following: on top of a S atom (marked
S1); on top of a Mo atom (marked Mo1); a bridge site (labelled A) between two S atoms (marked S2
and S3), above a S atom (marked S4), a bridge site (labelled B) between two S atoms (marked S1 and

Chapter 3. Water Dissociation on Two-dimensional Molybdenum Disulfide Edges 18
Mo S
(a) Top view of Basal Plane
(b) Side view of Basal Plane
(c) S100-edge (d) S50-edge
(e) Mo-edge
Figure 3.1: (a) Top and (b) side view of the perfect basal plane of 2D MoS2. Blue, red and greendotted lines show the location of the three most thermodynamically stable surface terminations. Theseterminations, along with the their simulation supercells, are shown in the following: (c) S-edge with100 percent (S100-edge) sulfur coverage, (d) S-edge with 50 percent (S50-edge) sulfur coverage and, (e)S-edge with 0 percent (Mo-edge) sulfur coverage. The yellow and the purple spheres represent S and Moatoms, respectively.

Chapter 3. Water Dissociation on Two-dimensional Molybdenum Disulfide Edges 19
S1
Mo1
S2
B
S3
S4
A
Mo2
(a)
S1
Mo1
A
S2
B
S3
S4
Mo2
(b)
S2 Mo1
S1
B
S3
S4
A
Mo2
(c)
A
B
(d)
Figure 3.2: Locations of H, OH and H2O adsorption sites on (a) S100-edge, (b) S50-edge and (c) Mo-edge. The view of the edge with the MoS2 plane oriented perpendicular to the page is shown in (d) withsites A and B. Mo atoms are in purple, S atoms are in yellow, and sites A and B are represented by pinkspheres.

Chapter 3. Water Dissociation on Two-dimensional Molybdenum Disulfide Edges 20
S2) and above a Mo atom (marked Mo2). In Fig. 3.2(d) a different perspective further displays the two
bridge sites.
S100-edge
Most stable species Eads (eV) h(A) dO−H αHOH
H2O(on site Mo1) 0.15 2.989 0.9796, 0.9797 103.85OH(on site S1) -0.215 0.251 0.988 -H (on site S1) -0.155 0.206 - -
S50-edgeH2O (on site A) 0.23 2.848 0.9783,0.9838 103.55OH (on site S1) -0.275 1.682 0.995 -H (on site S1) -0.199 1.304 - -
Mo-edgeH2O (on site Mo1) -0.55 2.274 0.9905, 0.9768 108.82OH (on site B) -3.863 1.630 0.983 -H (on site B) -4.921 1.346 - -
Table 3.1: Calculated structural parameters and adsorption energies of H2O, OH and H for the moststable site on S100-edge, S-50-edge and Mo-edge. Eads (eV) represents the adsorption energy, h(A)represents the vertical height of the H2O, OH and H species from the surface, dO−H represents the OHbond lengths for OH and H2O molecules and αHOH represents the H-O-H angle for H2O molecule.
Table 3.1 gives the most stable adsorption energies and sites for each species on the three edges and
also contains the corresponding structural parameters (OH bond lengths and H-O-H bond angle). It was
found that the H2O molecule was energetically most stable on top of a Mo atom (marked Mo1) for both
S100-edge and Mo-edge whereas it was most stable at site A for S50-edge. For all the edges, the water
molecule oriented itself to have the O atom closest to the MoS2 surface with the H atoms located further
at roughly similar distances and seemingly facing away from the surface as seen in Fig. 3.3. This also
indicated that the O atom possesses a greater affinity for the surface than the H atoms. The distance of
the O atom from S100-edge, S50-edge and Mo-edge surfaces was 2.989, 2.848 and 2.274 A respectively.
The O-H bond lengths for S100-edge, S50-edge and Mo-edge were 0.980 and 0.980 A 0.978 and 0.984 A
and 0.991 and 0.977 A respectively which are slightly larger than that of a free H2O molecule (0.958 A) in
vacuum. This indicates that the O-H bond is slightly weakened when the molecule is adsorbed on MoS2
edges. The magnitudes of the most stable adsorption energies on S100-edge, S50-edge and Mo-edge are
0.15, 0.23 and -0.55 eV respectively. The difference in energy between the most stable site and the next
most stable site on S100-edge, S50-edge and Mo-edge was only 0.016, 0.004, 0.380 eV respectively.
The H2O molecule demonstrated a stable negative adsorption energy favourable for binding only on
the Mo-edge, while both the S100-edge and S50-edge produced positive adsorption energies unfavourable
to adsorption. This is likely related to the interaction of the O atom with the surface atoms on the
edges. In the normal 2D MoS2 structure, the Mo atoms have sixfold coordination and the S atoms have
threefold coordination. Amongst the investigated edge terminations, the S100-edge and S50-edge also
have surface Mo atoms with sixfold coordination as discussed. However, the Mo-edge has surface Mo
atoms with twofold coordination and hence its Mo atoms are less stable than those of the other two
edges and more likely to interact with adsorbate species. Furthermore, the O atom is more likely to be
attracted to Mo atoms whose electronegativity differs from its own more than that for the S atoms and
this plays a role in charge transfer as discussed later. For this reason, sites above Mo atoms were more
favourable than those above S atoms for the edge systems.

Chapter 3. Water Dissociation on Two-dimensional Molybdenum Disulfide Edges 21
(a) (b)
(c)
Figure 3.3: Isosurfaces of the charge density difference ∆ρ for H2O molecule adsorbed on the most stablesite for (a) S100-edge, (b) S50-edge and (c) Mo-edge. The purple, yellow, blue and red spheres are Mo,S, H and O atoms, respectively. The positive and negative isosurfaces are in pink and blue, indicatingregions of charge gain and loss respectively.
Chapter 3. Water Dissociation on Two-dimensional Molybdenum Disulfide Edges 22
Another factor which likely affected adsorbate binding ability conisted of geometrical constraints.
For the Mo-edge surface, the Mo1 site atoms are well exposed in isolation allowing free interaction with
the H2O molecule, whereas access to Mo atoms for the S100-edge and S50-edge is blocked by S atoms to
a certain degree. For both the S100-edge and S50-edge, the most favored site provides the best access to
a Mo atom while maintaining a greater distance from S atoms than the other sites. Hence, the S atoms
actually seem to be repulsive to the H2O molecule and this is in line with similar results found by Ataca
et. al where the layer of S atoms in the perfect non-terminated structure is repulsive to the O atom [55].
This repulsion makes sense in terms of electonegativities and the usually negative partial charges of both
O and S atom species, as discussed later. The S50-edge seems to provide slightly better access to the
underlying Mo atom due to greater spacing between overlying S atoms than the S100-edge, however the
latter is slightly more stable for adsorption due to opposite acting charge based factors discussed later.
It should be noted that even for the Mo-edge, although there is adsorption and attraction between the
H2O molecule and surface, the adsorption energy is still weaker than typical covalent bond energies (for
example, the bond energy of O-H bond in water is about 5.0 eV).
The electrostatic repulsions and charge transfer interactions between the H2O molecule and edge
surfaces were further confirmed by Bader charge analysis. The surface S atoms for each edge had
negative effective charges, while the Mo atoms had positive effective charges. This helps to explain the
previously noted repulsion felt by the O atom in the H2O molecule from the surface S atoms as the O
atom has an effective negative charge as well. On the other hand, the positive effective charge of Mo
atoms in the MoS2 systems attracts the O atom in H2O molecules and provides an opportunity for the
strongly electronegative O atom to strip away charge from the weakly electronegative Mo atoms. This
is one reason that the pristine MoS2 surface does not strongly interact with H2O molecules as the layer
of negatively charged S atoms shields the inner Mo atoms and the more highly coordinated Mo atoms
have less charge available to donate to interacting molecules. For the edge terminations, charge analysis
was focused on the atoms of the H2O molecule and the nearest surface atoms at the adsorption location.
The free H2O molecule was found to have effective charges of -1.18e for the O atom and 0.59e for the
H atoms. For adsorption on the S50-edge, the effective charges had almost no change, with O atom now
having a charge of -1.17e and the H atoms have charges of 0.53e and 0.58e. The four surface S atoms
closest to the H2O molecule changed from having charges of -0.51e each to charges of -0.47e, -0.50e,
-0.47e & -0.49e. This demonstrates the repulsion felt between the O and S atoms as they seem to push
charge away from each other, with the O atom transferring charge to the H atoms and the S atoms likely
transferring charge to surrounding Mo atoms. For the S100-edge, there is a stronger degree of interaction
as expected. The O atom now gains additional negative charge going to an effective charge of -1.22e
while the H atoms have charges of 0.59e and 0.60e. The four surface S atoms closest to the H2O molecule
changed from having charges of -0.11e and -0.25e to charges of -0.14e, -0.16e, -0.15e & -0.19e, thus going
from an average effective charge of -0.18e to -0.16e. The two underlying Mo atoms bonded to these four
S atoms go from charges of 1.27e and 1.28e to 1.30e each. Hence, there is a charge redistribution within
the H2O molecule and the closest surface MoS2 atoms, with the effect that the more negative O atom
has greater attraction to the more positive Mo atoms and experiences reduced repulsion from the less
negative S atoms. It should be also noted that the surface S atoms for S100-edge were less negatively
charged than the S50-edge atoms, possibly due to less number of bonds to Mo atoms from which they
can draw charge. This helps explain why there is stronger interaction with the H2O molecule for the
S100-edge than S50-edge as their is less repulsion from the overlying negative S atoms and this factor

Chapter 3. Water Dissociation on Two-dimensional Molybdenum Disulfide Edges 23
overcomes the geometrical advantages which should make S50-edge more favorable for interaction as
discussed previously. The Mo-edge displayed the greatest charge redistribution with the H2O molecule’s
O atom possessing an effective charge of -1.30e and the H atoms having charges of 0.68e and 0.62e. The
Mo atom closest to the molecule went from a charge of 0.97e to 1.22e. This demonstrates a clear increase
in the polarization of the H2O molecule. There does not seem to be a transfer of charge from Mo to O
as the overall charge on the H2O molecule remains zero. Instead the charge on the Mo atom was likely
pushed away further into the surface. Hence, the adsorption of the H2O molecule appears to take place
through electrostatic attraction.
In order to further study the interaction between the H2O molecule and edge terminations and any
possible charge transfer, we plotted the charge density difference ∆ρ for the best adsorption site of each
edge as shown in Fig. 3.3. Here ∆ρ = ρ (edge+H2O) - ρ (edge) - ρ (H2O), where ρ (edge + H2O)
and ρ (edge) are the charge densities of the edge with and without H2O adsorbed on the terminated
surface respectively, and ρ (H2O) is the charge density of the isolated H2O molecule. With this definition,
isosurfaces of positive values (pink) indicate charge gain, while negative values (blue) indicate charge loss.
As expected, the greatest charge redistribution occurs for the Mo-edge, indicating a strong interaction
between the H2O molecule and nearest neighboring Mo atom. Both the O atom and the nearest Mo
atom seem to be polarized and this points to a electrostatic attraction between them as proposed earlier.
The increase in negative charge below the Mo atom, away from the surface, further confirms that there
is likely no charge transfer from the Mo atom to the O atom and instead charge polarization as proposed
earlier based on Bader analysis. The stronger interaction is also likely responsible for the elongation of
OH bond lengths in the H2O molecule for the Mo-edge system. The large regions of charge loss between
the H2O molecule and the nearest two S atoms for the two S-edges points to the repulsion felt between
the O and S atoms. On all the edges the charge gets redistributed within the H2O molecule, indicating
there atleast some level of interaction for each system and this occurs the most for the Mo-edge.
Unlike H2O, both H and OH species were able to stably adsorb with negative adsorption energies
on all edges, as expected since the latter two are no longer part of the stable water molecule. The most
stable absorption energies for the H and OH species were -0.155 and -0.215 eV for S100-edge, -0.199
and -0.275 eV for S50-edge and -4.921 and -3.863 eV for Mo-edge. For the two S-edges, OH had a
stronger adsorption energy than the H atom, while the H atom had stronger adsorption for the Mo-edge.
Furthermore, the adsorption energies for the Mo-edge are significantly stronger than for S-edges and are
into typical covalent bond energy ranges. The most stable adsorption position for both species on the
S-edges was on an S atom (marked S1) while it was at bridge site B for both species on the Mo-edge.
Hence, both H and OH seemed to have formed covalent bonds on the Mo-edge due the strong adsorption
energies and the fact that they seem to be equally spaced between adjacent Mo atoms which suggests a
charge sharing arrangement. The distances of the H and OH species were 0.206 and 0.251 A from the
S100-edge, 1.304 and 1.682 A from S50-edge and 1.346 and 1.630 A from Mo-edge surfaces respectively.
The O-H bond lengths for the most stable adsorbed OH species were 0.988, 0.995 and 0.983 A for
S100-edge, S50-edge and Mo-edge respectively. As the Mo-edge is also most favourable for adsorption of
the OH and H species in addition to the H2O molecule, it can be considered most likely to successfully
participate in the dissociation reaction of water.

Chapter 3. Water Dissociation on Two-dimensional Molybdenum Disulfide Edges 24
-1
-0.5
0
0.5
1
1.5
2
2.5
0 0.2 0.4 0.6 0.8 1 1.2
Ene
rgy
(eV
)
Reaction coordinate (arb. units)
2.31 eV
Figure 3.4: Reaction pathway and reaction barrier of single water dissociation on S100-edge from Climb-ing Image Nudged Elastic Band (CI-NEB) simulation. Purple atoms represent Mo; yellow atoms repre-sent S.

Chapter 3. Water Dissociation on Two-dimensional Molybdenum Disulfide Edges 25
-0.4
-0.2
0
0.2
0.4
0.6
0.8
1
0 0.2 0.4 0.6 0.8 1 1.2
Ene
rgy
(eV
)
Reaction coordinate (arb. units)
0.82 eV
Figure 3.5: Reaction pathway and reaction barrier of single water dissociation on S50-edge from ClimbingImage Nudged Elastic Band (CI-NEB) simulation. Purple atoms represent Mo; yellow atoms representS.

Chapter 3. Water Dissociation on Two-dimensional Molybdenum Disulfide Edges 26
3.4.2 Dissociation of H2O on MoS2 edges
To understand the mechanism of water dissociation on the 1D MoS2 edges, we performed NEB calcu-
lations with 11 images in order to evaluate the MEP and the TS energy. For each edge, the initial
state (IS) and final state (FS) were obtained from the adsorption simulations discussed in section 3.4.1,
with the IS corresponding to H2O adsorption (whole water molecule) and the FS corresponding to OH
and H adsorption (dissociated water molecule). Fig. 3.4, 3.5 and 3.6 present the energy profiles that
represent MEP between IS and FS for S100-edge, S50-edge and Mo-edge respectively along with their IS,
TS and FS geometries and activation energy barriers. The chosen TS configuration corresponds to the
highest energy point along the MEP. All the reaction paths have similar TSs where the H2O molecule
has dissociated into OH and H species. The OH group has then bonded to a surface atom for all the
edges, while the H atom has bonded to a surface atom for the S100-edge but remains unbonded for
the remaining two edges. Eventually the H atoms do draw close to the surface and form bonds in the
FS for each edge. For the Mo-edge FS, the H atom remains in a position roughly equidistant between
two adjacent surface Mo atoms, which suggests it shares bonds with both surface atoms. For the two
S-edges, the H atoms form bonds with a single surface atom in the FS configrations.
The TSs can be used to find the activation energies for the dissociation reactions. The activation
energy barriers are defined as Ea = ETS - EIS , where ETS is the energy of the transition state and EIS is
the energy of the IS. The calculated activation energy barrier Ea for water dissociation on S100-edge was
a relatively high value of 2.31 eV. The S50-edge had a significantly lower barrier of 0.82 eV while the Mo-
edge had the lowest barrier at 0.54 eV. The activation energy barriers for all the edges were significantly
lower than that for water splitting in free space (∼5eV). The energy barriers for S50-edge and Mo-edge
were even lower than water splitting in liquid water (∼1eV) [36, 66] and on the surfaces of Cu, Ni, and
Pd (∼1 eV) [37]. The activation energy barrier for water splitting on Mo-edge was comparable with
that of water dissociation over a semiconducting (8,0) CNT (∼0.48 eV) and on a metallic (5,5) CNT
(∼0.41eV) [67]. In particular, this compares favorablly with platinum surface, which is often regarded as
the best performing catalyst for such reactions. A recent DFT based study found a minimum activation
energy of 0.44 eV for Pt(110) surface but higher than 0.54 eV for the other four crystal surfaces tested
[39]. Thus, the magnitude of the activation barriers for the S50-edge and Mo-edge can likely be overcome
with relatively low energy inputs (thermal, electric or photonic).
The reaction energy is defined as ∆E = EFS - EIS , where EFS is the energy of the FS, so that
a negative ∆E indicates an exothermic reaction and a positive ∆E represents an endothermic one.
The H2O dissociation on S100-edge was endothermic with positive reaction energy difference of 1.4 eV
(Fig. 3.4). On the other hand, both S50-edge (Fig. 3.5) and Mo-edge ( 3.6) had exothermic negative
reaction energies of -0.22 eV and -1.29 eV respectively. This beats the best reaction energy obained
for Pt surfaces, with a figure of -0.20 eV [39]. The much larger magnitude of the Mo-edge reaction
energy in relation to the S-edges is likely in relation to its superior water adsorption ability, whereas
the S-edges did not even favorably adsorb H2O molecules in their ISs. The negative reaction energies
for both edges point to thermodynamic favourbility and the low activation barriers point to favourable
kinetics. On the other hand, water dissociation on the S100-edge is energetically less favorable due to
its comparatively higher activation barrier and large positive reaction energy and thus the S100-edge is
not a good candidate for water splitting.
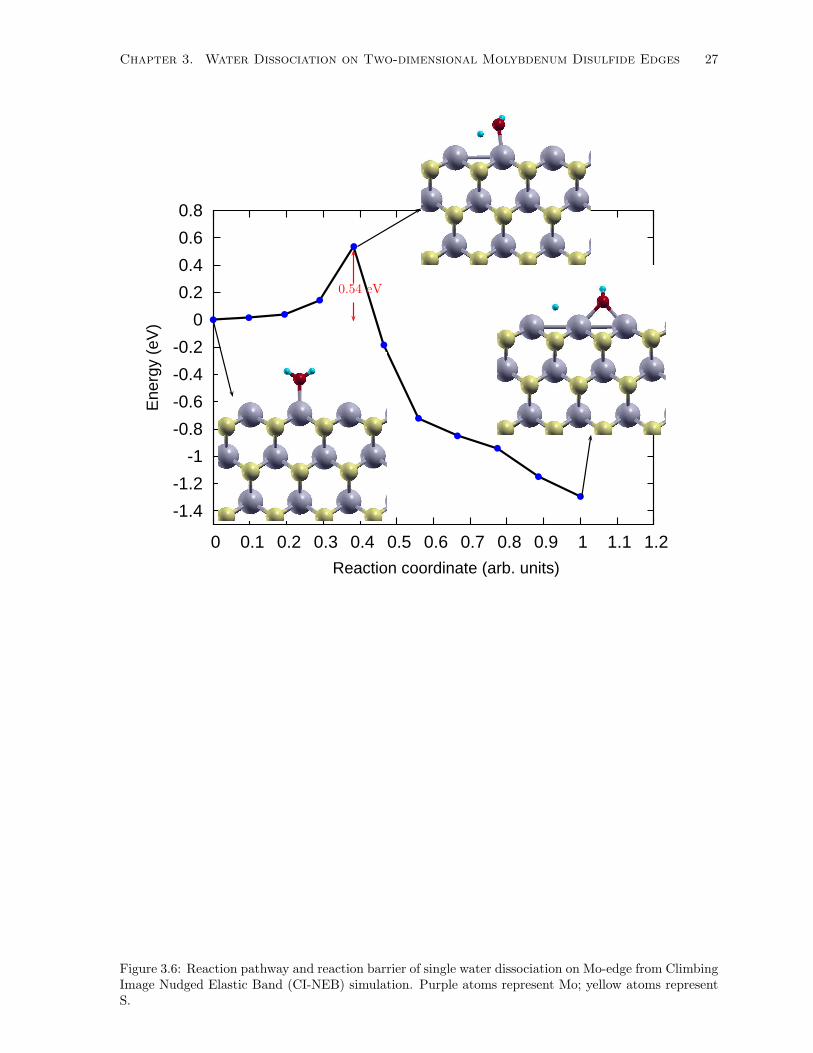
Chapter 3. Water Dissociation on Two-dimensional Molybdenum Disulfide Edges 27
-1.4
-1.2
-1
-0.8
-0.6
-0.4
-0.2
0
0.2
0.4
0.6
0.8
0 0.1 0.2 0.3 0.4 0.5 0.6 0.7 0.8 0.9 1 1.1 1.2
Ene
rgy
(eV
)
Reaction coordinate (arb. units)
0.54 eV
Figure 3.6: Reaction pathway and reaction barrier of single water dissociation on Mo-edge from ClimbingImage Nudged Elastic Band (CI-NEB) simulation. Purple atoms represent Mo; yellow atoms representS.

Chapter 3. Water Dissociation on Two-dimensional Molybdenum Disulfide Edges 28
3.4.3 Free Energy with Vibrational and Entropic Contributions
Although NEB analysis revealed the Mo-edge as highly active for water dissociation, the reaction energy
results only provided potential energy differences at ground state. In order to get a more complete
picture of behaviour at room temperature conditions, it is typical to consider quantum corrections to
the activation barrier in order to account for the discreteness of vibrational modes at room tempera-
ture (300K). Therefore, the entropic contribution as well as zero point energy (ZPE) correction were
incorporated by computing Gibbs free energy ∆G between IS and TS.
∆G = Ea +∆ZPE − T∆S, (3.2)
where Ea is activation energy barrier obtained by subtracting total energies of IS and TS as defined
in Section 3.4.2 and obtained from NEB, ∆ZPE is the difference of zero point energies between IS and
TS, ∆S is the change of entropy of water between IS and TS and T is the temperature. The ∆ZPE was
computed through the phonon frequencies obtained within linear response [68] and found to be -0.404
eV. The entropic contribution (T∆S) can be considered to be very low for adsorbate species as they are
already bound to a surface with little configurational freedom [69]. The entropy of adsorbed molecules
is elmost entirely in the vibrational partition with little translational or rotational contributions, with
most of the freedom related to vibration of the molecule normal to the surface and so largely dependent
on bond length and strength between between adsorbate and surface [70]. Both the water molecule
in the IS and OH species in the TS are bound to the surface at similar distances (2.23 and 2.12
respectively) and can be considered to have zero entropy difference. The dissociated H atom in the
TS might produce an entropy difference depending on how strongly it is bound to the surface; if it is
considered to have strong adsorption like the other species then the entropy difference remains zero as
a lower bound estimate. An upper bound for the entropy difference term can be obtained if the H atom
in the TS is considered to be fully free of the surface and act as a free gas, in which case the T∆S value
is 0.20 eV/H2O at room temperature [69]. After considering these corrections, we calculated the free
energy change ∆G of activation for the reaction to be from 0.14 eV (T∆S=0) to -0.06 eV (T∆S=0.20)
on Mo-edge which suggests that the Mo-edge has not only excellent catalytic activity but that water
dissociation on Mo-edge could be spontaneous at finite temperature.
The kinetic rate constant can be estimated by the transition-state theory expression:
k =kBT
hexp−∆G/kBT , (3.3)
where kB and h denote Boltzmanns and Planks constant, respectively. From the formula above, we
derived a rate constant range from k = 2.8 × 10¹⁰ s−1 (T∆S=0) to k = 6.4 × 10¹³ s−1 (T∆S=0.14)
at 300 K. A change of 0.06 eV in activation barrier produces an approximate rise or fall in reaction rate
by one order of magnitude. However, even with a few orders of magnitude change in value, this would
still be a very high rate constant. This very clearly suggests that the Mo-edge is very favourable for
the water dissociation reaction not only thermodynamically but kinetically as well and the reaction is
likely to occur spontaneously and quickly at room temperature. Hence, this dissociation step is likely
not going to be rate limiting as part of an overall set of reactions.

Chapter 3. Water Dissociation on Two-dimensional Molybdenum Disulfide Edges 29
3.5 Finite temperature ab initio molecular dynamics
Water dissociation on the Mo-edge, the best performing of the MoS2 surfaces, was selected to be simu-
lated with finite temperature AIMD to observe temperature effects in dynamic evolution of the system.
The system was initialized with the H2O molecule oriented so as to have the O atom facing the MoS2
surface (see Fig. 3.7(a)) and then allowed to evolve along the Born-Oppenheimer energy surface at 300K.
As the simulation progressed, the H2O molecule started to move towards the MoS2 surface and tilt to
allow the O atom to decrease its distance to the nearest Mo atom and eventually started to form a bond
between the O and Mo atoms (see Fig. 3.7(b)) at around 0.37 ps in the dynamics. Next, one of the
H atoms in the H2O molecule started to detach from the O atom and form a bond with the Mo atom
adjacent to the O bonded Mo atom (Fig. 3.7(c)). By 1.07 ps, the first H atom to detach had moved to
a postion intermediate between two Mo atoms and seemed to form slight bonds with both of them in a
manner similar to that observed for the adsorption simulations in Section 3.4.1, while the remaining H
atom moved further away from the O atom (see Fig. 3.7(d)). This configuration continued to be stable
for the remaining simulation time upto 1.48 ps at which point the simulation was stopped as complete
dissociation had been achieved and there was little change in the atomic configurations.
The quick and straight forward dissociation of the H2O molecule into OH and H in under 1.5ps
indicates that the energy barrier for dissociation is not larger than the thermal energy available at 300K.
This confirms the spontaneous nature of H2O molecule dissociation on the Mo-edge surface and that it
strongly favors this reaction even at room temperature. This also correlates with the earlier calculated
rate constants as it falls within the range of prediction of a dissociation happening once every 0.02-36.0ps
on average, with it falling closer to the lower bound which corresponds to a free H atom and bound
OH species. The initial H2O adsorption took place at the same active site found most favorable in the
adsorption simulations (marked Mo1 in Fig.3.2(c)). The overall evolution of the reaction is generally
similar to the adsorption and NEB based results, especially the final configuration of the dissociated
water molecule. The O atoms first forms a bond to the nearest Mo atom while the H2O molecule is
still intact in both approaches. The first H atom to detach from the water molecule stabilizes roughly
intermediate between two Mo atoms in both the AIMD and adsorption results. Hence, the dissociation
proceeds in a roughly similar manner even with entropic and temperature effects.
3.6 Metadynamics biased finite temperature ab initio molecu-
lar dynamics
The water dissociation AIMD simulation conducted on the Mo-edge in section 3.5 was repeated with a
metadynamics based bias and the same timestep of 2.5 fs in order to obtain a free energy surface of the
reaction and explore possible alternate reaction mechanisms. Two schemes of collective variables were
tested in two different biased simulations and each resulted in a different reaction mechanism, both of
which are presented in the following sections. Once an energy surface was obtained for a mechanism,
specific regions of the surface corresponding to important energy barriers were explored with a smaller
timestep of 1.25 fs in order to obtain a more detailed and accurate estimate of free energy barriers.

Chapter 3. Water Dissociation on Two-dimensional Molybdenum Disulfide Edges 30
(a)t=0.37 ps (b)t=0.45 ps
(d) t=0.58 ps (c)t=1.07 ps
Figure 3.7: Reaction mechansim of H2O dissociation reaction on Mo-edge of MoS2 during unbiasedab-intio molecular dynamics simulation at 300K. The reaction roughly follows the same path as CI-NEBsimulations

Chapter 3. Water Dissociation on Two-dimensional Molybdenum Disulfide Edges 31
3.6.1 Mechanism 1
In the first simulation, two collective variables were biased, the first (CV1) representing coordination
number between the O atom in the H2O molecule and the nearest Mo atom and the second (CV2)
representing coordination number between the O atom in the H2O molecule and a H atom in the
same molecule (see Supporting Information for coordination number collective variable definitions).
The reaction proceeds according to the same mechanism as found from NEB and the unbiased AIMD
simulations, namely the H2O molecule dissociates into OH and H species which both adsorb on Mo
atoms on the Mo-edge surface. During the dissociation, the H2O molecule’s O atom first forms a bond
with a Mo atom and then a H atom splits from the molecule, leaving the OH species adsorbed initially,
and eventually the H also adsorbs to surface Mo atoms.
The resulting free energy surface for the first biased simulation is described in Figure 3.8. The free
energy minima corresponding to the IS (representing the adsorbed H2O molecule) and FS (representing
the fully dissociated representing the adsorbed H2O molecule) from the NEB simulations are labelled A
and B respectively. The free energy barrier for escaping from the free energy well at A, which corresponds
to the activation energy barrier from the NEB calculations, is roughly 0.014 eV (0.33 kcal/mol). This
energy well was then further explored with a smaller timestep of 1.25 fs, which yielded an activation
energy barrier of 0.061 eV (1.4 kcal/mol). This value falls within the range of free energy barriers
calculated from the NEB calculations (-0.06 to 0.14 eV) and lies closer to the lower bound which was
associated with the intermediate transition state (TS) consisting of a bound OH and free H atom (while
the upper bound consisted of both OH and H species bound to the surface with practically no freedom of
movement). This also matches the results of the non-biased AIMD simulation in which the dissociation
also happened with a time closer to that predicted by the lower bound of a free H atom. Hence, the TS
probably has an H atom loosely attracted to and held by the surface which is not fully adsorbed and
possesses more freedom of movement than the final bound state but less than in free gas state.
The free energy surface also confirms that the water dissociation step is not the rate limiting step
in the overall water to hydrogen process as it does not involve the deepest energy well labelled as C in
Figure 3.8. Instead, the deepest energy well corresponds to the unadsorbed free water molecule and the
barrier for escaping from this well is 0.023 eV or 0.17 eV when simulated with a 1.25 fs timestep. This
demonstrates that, even for the Mo-edge which is thermodynamically favorable for water adsorption,
the water adsorption step is a candidate for the rate limiting step for the hydrogen production process.
3.6.2 Mechanism 2
The second biased simulation also utilized two collective variables, the first (CV1) representing coordi-
nation number between the O atom in the H2O and the nearest two surface Mo atoms and the second
(CV2) representing coordination number between an H atom and the two nearest Mo atoms to which
it was bound in the final state of the unbiased AIMD simulation. The dissociation of this reaction
proceeded by a different mechanism than for the first biased simulation. The common process for gen-
eration of hydrogen from water on catalyst surfaces involves water dissociation in which both species
resulting from water splitting eventually adsorb to the surface (as was the case for our NEB and AIMD
simulations) and then adsorbed hydrogens eventually combine to form a hydrogen molecule (through
the simple route 2H* → H2 or more complex intermediates), leaving behind the adsorbed OH species;
giving an overall reaction of (H2O + * → OH* + 1/2H2) [69]. However, an alternate mechanism involves

Chapter 3. Water Dissociation on Two-dimensional Molybdenum Disulfide Edges 32
ΔG
(kcal/m
ol)
CV1CV2
B A
C
C
Figure 3.8: Free energy surface of Mechanism 1 in terms of collective variables for metadynamics biasedAIMD simulation at 300K with corresponding atomic configurations at specific energy minima. Thedissociation reaction proceeds from point A to B. However, the deepest energy well and largest activationbarrier corresponds to adsorption of the water molecule at point C.

Chapter 3. Water Dissociation on Two-dimensional Molybdenum Disulfide Edges 33
C B A
Figure 3.9: Free energy surface of Mechanism 2 in terms of collective variables for metadynamics biasedAIMD simulation at 300K with corresponding atomic configurations at specific energy minima. Thedissociation reaction proceeds from point A to B and then C, leaving behind a lone adsorbed O atom.

Chapter 3. Water Dissociation on Two-dimensional Molybdenum Disulfide Edges 34
the hydrogen atoms of the water molecule directly combing to form a hydrogen molecule while leaving
behind only the O atom adsorbed (H2O + * → O* + H2). The second simulation seems to follow
this second mechanism. This demonstrates the utility of metadynamics in exploring different possible
reaction mechanisms and also the importance and influence of collective variable selection.
Figure 3.9 describes the free energy surface for the second biased simulation. The free energy minima
corresponding to the whole water molecule which is attracted and loosely bound to the MoS2 surface
is labelled A. The O atom proceds to adsorb strongly to the nearest Mo atom while the H atoms are
starting to break free of the O atom by point B. At point C, the two H atoms have fully broken away
from the O atom and are moving away from the MoS2 surface while drawing closer to each other to
form what looks like an H2 molecule. The free energy barrier for the H atoms to escape the O atom
and go from point B to C was roughly 0.024 eV (0.56 kcal/mol). This energy well was then further
explored with a smaller timestep of 1.25 fs, which yielded an activation energy barrier of 0.360 eV (8.3
kcal/mol). This is significantly higher than the energy barrier for breaking the O-H bond in Mechanism
1, which is to be expected as there now two bonds being broken at roughly the same time. This means
that this mechanism will occur far less frequently than Mechanism 1 at room temperature. However,
the activation barrier is not particularly high and can be overcome with a slight energy input. It should
be noted that the barrier is also greater than that for water adsorption in Mechanism 1.
3.7 Surface Processes Subsequent to Water Dissociation
Following the splitting of the water molecule into OH and H species in Mechanism 1, there are several
additional steps required for hydrogen gas production. A prelimanary examination of these was done
by studying the further dissociation of the OH species into O and H, the migration of H atoms across
the Mo-edge surface and the possible formation of hydrogen by the simple route of the Tafel reaction
(2H* → H2) at ground state conditions. The OH splitting reaction was found to be thermodynamically
favorable with a reaction energy ∆E of -1.58 eV but had a significant activation energy Ea of 2.00 eV.
The migration of individual H atoms across the Mo-edge surface atoms was found to have a barrier of
1.15 eV. The desorption of two adjacent H atoms adsorbed on the same Mo-atom to then form an H2
molecule was found to have an equivalent Ea and ∆E of 1.07 eV, indicating there is not an intermediate
transition state. The activation energy for these post-dissociation processes are higher than that for the
water splitting step, hinting that one of these steps is likely the rate-limiting step for a full hydrogen
evolution reaction. The hydrogen desorption step is especially troublesome as even the overall reaction
seems to be thermodynamically unfavorable with a positive potential energy change. However, it should
also be noted that for desorption processes, where the gas phase transition or final state can have
significantly greater freedom of movement than the initial adsorbed state, entropy can be a significant
factor and greatly lower the free energy of activation or reaction for the step [70]. Furthermore, the
hydrogen evolution step might proceed by a more complex route with several intermediate species than
the simple Tafel mechanism tested.
The prelimanary simulations demonstrate that the hydrogen desorption mechanism needs to be
studied in greater detailed with finite temperature entropy effects and exploration of multiple possible
reaction pathways. Additionally, this work was restricted to studying a single H2O molecule on the edge
surface and did not consider the impact of multiple H2O molecules. Other H2O molecules can affect
reaction mechanisms due to their polar nature, although this is much more significant in liquid phase

Chapter 3. Water Dissociation on Two-dimensional Molybdenum Disulfide Edges 35
reactions where they can protonate H atoms. Another important factor for surface catalytic reactions
involves surface coverage effects where adsorbed molecules can interact with each other and even form
surface layers. Surface layers themselves can interfere with adsorption of reactants and affect reaction
rates. This also brings up the issue of the O atom which is left adsorbed to the surface and whether it
is removed by some reaction such as O2 evolution, otherwise this might result in the poisoning of the
catalytic surface. Such considerations will have to be properly investigated before the MoS2 monolayer
material can be used for practical applications. As such these should be investigated in future studies
and are out of the current study’s scope.
3.8 Summary
This work looked at the three edge terminations (S100, S50 and Mo) of MoS2 for their water adsorption
and dissociation abilities. The S100 and S50 edges were found to be thermodynamiclly unfavorable for
H2O adsorption, with the S100 being slightly more stable than the S50-edge. The Mo-edge was found
to bind the H2O molecule in a stable configuration which the O atom of the H2O forms a bond with a
surface Mo atom. All edges were able strongly bind the individual OH and H species on their surface.
Next the water dissociation mechanism was simulated for all edges using nudged elastic band method,
with all followeing roughly the same path during which an H atom split from the H2O molecule to leave
an adsorbed OH and eventully adsorbed itself onto the surface. The S100-edge turned out to have a very
high activation potential energy barrier of 2.31 eV, while the S50-edge had a barrier of 0.82 eV and the
Mo-edge had the lowest barrier of 0.54 eV. The Mo-edge free energy activation barrier was then found
using zero-point energy and entropy corrections to produce a barrier in the range of -0.06 eV to 0.14
eV and a very high rate constant which indicated that the water dissociation reaction would proceed
spontaneously on the Mo-edge at room temperature. Water dissociation was then further studied on the
Mo-edge using the alternative technique of ab initio molecular dynamics with metadynamics to study
the reaction when the system was allowed to evolve freely at finite temperature with no fixed final state.
These simulations confirmed that the reaction occurs very quickly and produced a free energy activation
barrier of 0.014 eV. Furthermore, they also demonstrated that the reaction can occur via an alternate
pathway in which the H atoms of the H2O molecule directly form a hydrogen molecule while leaving
behind an adsorbed O atom. This latter mechanism was also found to have a very favorable, albeit
higher, free energy activation barrier of 0.024 eV.

Chapter 4
Hydrogen Storage on Metal
Decorated Graphene
The material in this chapter has been published as a journal article under the title of “A van der Waals
density functional theory comparison of metal decorated graphene systems for hydrogen adsorption”. Text
and figures are reprinted from “Journal of Applied Physics” [71], Copyright 2014, AIP Publishing LLC.
4.1 Introduction
In the past few years, there has been an increasing interest in using hydrogen as a clean alternative fuel
[72]. Presently, one of the main issues associated with hydrogen fuel technology is its energy storage
capacity, which is still far from being able to compete with fossil fuels [73, 12]. For hydrogen storage
systems in transportation applications, the US DOE has set a target of achieving a hydrogen gravimetric
capacity of 5.5 wt% and a volumetric capacity of 0.04 kg/m3 by 2015 [74]. One approach for room
temperature storage is through the adsorption of hydrogen on substrate materials. Among proposed
substrates, including hydrides, zeolites, and metal organic frameworks, porous carbon structures are
some of the most appealing [75]. These substrates are low in weight and have the potential to be the
most economically viable. Within this class of materials is graphene, a single layer of carbon atoms with
a unique 2D structure which gives it a large specific surface area and great mechanical strength. These
properties make graphene an ideal material for hydrogen adsorption citeSun2011.
This study compares the hydrogen binding ability of several metal adatoms (Al, Li, Na, Ca, Cu,
Ni, Pd, Pt) on graphene and evaluates the importance of including van der Waals (vdW) interactions,
incorporated using the vdW-DF2 functional. This should help provide a more accurate prediction for
the hydrogen binding ability of each atom in comparison to earlier studies. In total, four light metals and
four transition metals were investigated. The best overall metal system for reversible storage was used
to study changes in binding ability for varying metal decoration coverage. The gravimetric density for
these varying metal coverage systems was also investigated by adsorbing multiple hydrogen molecules.
36

Chapter 4. Hydrogen Storage on Metal Decorated Graphene 37
4.2 Literature Review
Molecular hydrogen, as found in its gaseous form for practical storage devices, adhers to graphene
through physisorption. However, for the case of pristine graphene, this process is too weak for it to stably
bind enough hydrogen molecules to reach the DOE hydrogen density targets [13]. Metal decoration of
graphene sheets shows potential in increasing their hydrogen adsorption ability to levels required for
the DOE targets [76, 77]. In such cases, the hydrogen molecules generally bind to the metal atoms
through physisorption, although they may dissociate and chemisorb due to the infuence of some metals
[13]. Theoretical studies conducted on metal decorated graphene systems predict very high gravimetric
densities which easily surpass the DOE target. For instance, it has been claimed that a Li decorated
system can achieve 16 wt.% hydrogen storage [77], Al decoration can achieve 13.8 wt.% [78] and Ca
decoration can achieve 8.4 wt.% [79]. Contrary to these theoretical studies, the experimental results for
metal decorated graphene have fallen far short of these numbers and none have been able to achieve
greater than 2 wt.% at room temperature [80, 81, 82, 83]. Theoretical predictions are generally made with
density functional theory (DFT) calculations using local density approximation (LDA) and generalized
gradient approximation (GGA) functionals. It should be noted that this can cause inaccuracies associated
with hydrogen binding energy values as generally they can be overestimated by LDA or underestimated
by GGA. The LDA functional is usually inaccurate for interactions in such complex systems, while the
GGA functional is accurate for strong covalent type forces but neglects van der Waals (vdW) interactions.
For metal decorated graphene systems, vdW interactions are significant for describing the physisorption
of hydrogen and the interaction between neighboring metal atoms, especially at higher coverages [76, 77]
and this might be one reason as to why experimental results fall short of theoretical assertions. A
recent study which attempted to consider the effect of vdW forces in Ca decorated graphene [76] hints
at this as it concluded that the system could only achieve a gravimetric density of 2.6 wt.%, a marked
decrease from previous claims. Amongst theoretical studies, the highest gravimetric densities have been
generally achieved for light metals. However, it is difficult to compare different metal predictions as
various studies use widely varying exchange-correlation functionals, pseudopotentials and simulation
parameters. Therefore, a comprehensive understanding of the realistic hydrogen binding ability of metal
decorated systems is currently lacking.
4.3 Computational Details
The hydrogen storage capacity of a metal decorated graphene sheet was studied using first princi-
ples methods based on density functional theory (DFT). The DFT calculations were performed with
Quantum-Espresso [26] which uses the plane-wave pseudopotential approach. The generalized gradient
approximation (GGA) functional described by Perdew-Burke-Ernzerhof (PBE) [84] was used to describe
the exchange-correlation of electrons. Ultrasoft pseudopotentials were used for all calculations. Van der
Waals interactions were modeled by adding a correction to the GGA functional, when applied, through
the vdW-DF2 functional [85]. This functional was used instead of the earlier vdW-DF [86] for increased
accuracy in estimating the equilibrium separation, H2 bond strengths and van der Waals attractions at
intermediate separation longer than equilibrium ones [85]. The kinetic energy cutoff value was set to
60 Ry for the wave functions and to 600 Ry for the charge density. The supercell and atomic positions
were optimized using the conjugate gradient algorithm. The convergence threshold was set to 7E-7 Ry

Chapter 4. Hydrogen Storage on Metal Decorated Graphene 38
Figure 4.1: Possible adsorption sites for metal atoms. From left to right, the adatom is at the hollowsite, the top site and the bridge site respectively.
for self consistency in energy and to 8E-3 a.u. for forces. The total energy convergence was maintained
at ≤ 5 meV/atom.
The metal-graphene systems for comparing different metals were modeled with 1 × 1 supercells (6
C atoms) and a vacuum layer thickness ≥ 20 A. The Brillouin zone was sampled using a 8 × 8 × 1
Monkhorst-Pack [60] k-point grid and Methfessel-Paxton [87] smearing of 0.01 Ry [88]. In addition, each
metal adatom was placed at its most stable adsorption site on the graphene sheet according to literature.
Based on previous work by Wang et al. [76] and Sigal et al. [89, 90], the most favorable adsorption site
for Al, Ca, Li, Na, and Ni on graphene is at the “hollow” position, while Pd and Pt prefer the “bridge”
position and Cu prefers the “top” position. See Figure 4.1 for the schematic diagram of the different
binding sites. Simulations investigating metal coverage and gravimetric density were conducted with a
single metal adatom placed on each side of the graphene sheet (to give a total of two metal adatoms in
the entire supercell) and varying the number of surrounding carbon atoms.
The binding energy of a metal atom on graphene was calculated as:
Eb = −[Egraphene+nmetal − (Egraphene + nEmetal)]/n (4.1)
where Egraphene+nmetal is the total energy of the graphene sheet with either single- or double-sided metal
decoration, Egraphene is the total energy of the pristine graphene sheet, Emetal is the total energy of the
free metal adatom and n corresponds to the number of metal adatoms.
The average binding energy per hydrogen molecule was calculated with the following equation:
Eb = −[Emetal−graphene+iH2− (Emetal−graphene + iEH2
)]/i (4.2)
where Emetal−graphene+iH2is the total energy of the hydrogen adsorbed on the metal-graphene system,
Emetal−graphene is the total energy of the metal-graphene sheet, EH2is the total energy of the free H2
molecule and i corresponds to the number of H2 molecules.
4.4 Results and Discussion
In this section, we first report the adsorption energy of metal adatoms over graphene sheets for eight
metals and consider both single and double sided metal decoration. Thereafter, adsorption of hydrogen
molecules over different metal-decorated systems is described, considering the same substrate size among
the investigated metals. A careful analysis of these hydrogen adsorption studies pointed to Ni as the
most promising metal adatom. Thus, a more thorough investigation was conducted for the Ni deco-
rated graphene system to understand the effect of substrate size, and determine its optimum hydrogen
adsorption capability.
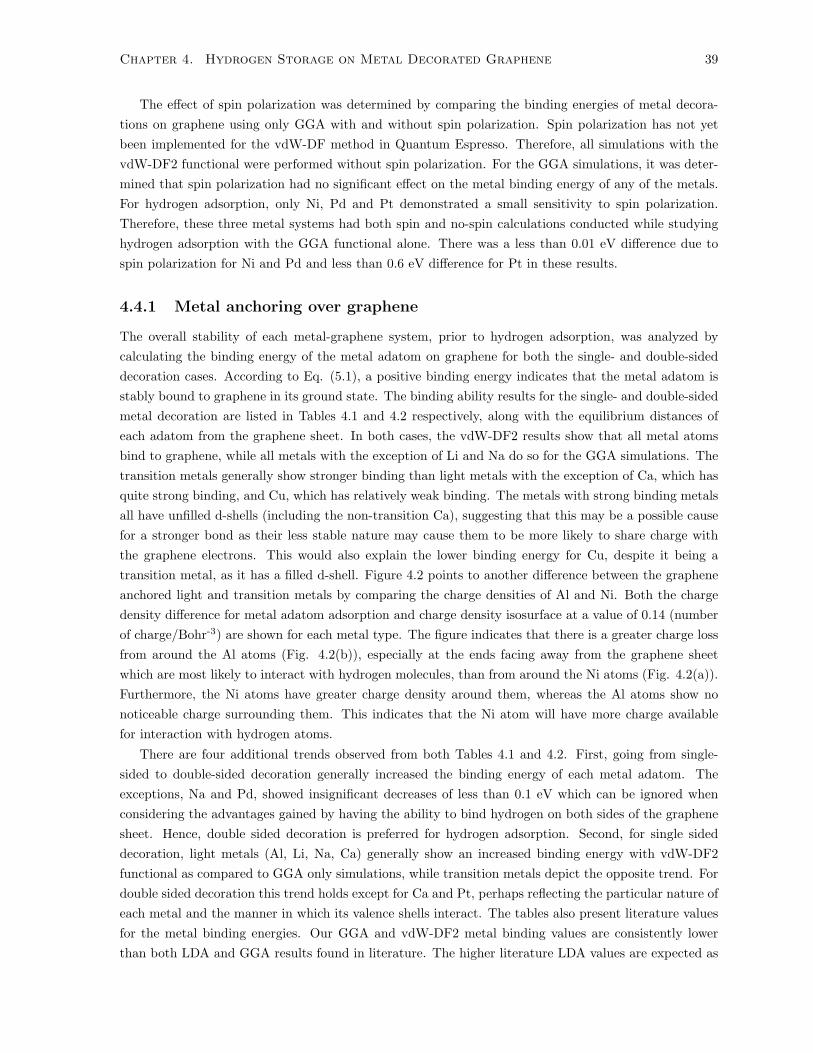
Chapter 4. Hydrogen Storage on Metal Decorated Graphene 39
The effect of spin polarization was determined by comparing the binding energies of metal decora-
tions on graphene using only GGA with and without spin polarization. Spin polarization has not yet
been implemented for the vdW-DF method in Quantum Espresso. Therefore, all simulations with the
vdW-DF2 functional were performed without spin polarization. For the GGA simulations, it was deter-
mined that spin polarization had no significant effect on the metal binding energy of any of the metals.
For hydrogen adsorption, only Ni, Pd and Pt demonstrated a small sensitivity to spin polarization.
Therefore, these three metal systems had both spin and no-spin calculations conducted while studying
hydrogen adsorption with the GGA functional alone. There was a less than 0.01 eV difference due to
spin polarization for Ni and Pd and less than 0.6 eV difference for Pt in these results.
4.4.1 Metal anchoring over graphene
The overall stability of each metal-graphene system, prior to hydrogen adsorption, was analyzed by
calculating the binding energy of the metal adatom on graphene for both the single- and double-sided
decoration cases. According to Eq. (5.1), a positive binding energy indicates that the metal adatom is
stably bound to graphene in its ground state. The binding ability results for the single- and double-sided
metal decoration are listed in Tables 4.1 and 4.2 respectively, along with the equilibrium distances of
each adatom from the graphene sheet. In both cases, the vdW-DF2 results show that all metal atoms
bind to graphene, while all metals with the exception of Li and Na do so for the GGA simulations. The
transition metals generally show stronger binding than light metals with the exception of Ca, which has
quite strong binding, and Cu, which has relatively weak binding. The metals with strong binding metals
all have unfilled d-shells (including the non-transition Ca), suggesting that this may be a possible cause
for a stronger bond as their less stable nature may cause them to be more likely to share charge with
the graphene electrons. This would also explain the lower binding energy for Cu, despite it being a
transition metal, as it has a filled d-shell. Figure 4.2 points to another difference between the graphene
anchored light and transition metals by comparing the charge densities of Al and Ni. Both the charge
density difference for metal adatom adsorption and charge density isosurface at a value of 0.14 (number
of charge/Bohr-3) are shown for each metal type. The figure indicates that there is a greater charge loss
from around the Al atoms (Fig. 4.2(b)), especially at the ends facing away from the graphene sheet
which are most likely to interact with hydrogen molecules, than from around the Ni atoms (Fig. 4.2(a)).
Furthermore, the Ni atoms have greater charge density around them, whereas the Al atoms show no
noticeable charge surrounding them. This indicates that the Ni atom will have more charge available
for interaction with hydrogen atoms.
There are four additional trends observed from both Tables 4.1 and 4.2. First, going from single-
sided to double-sided decoration generally increased the binding energy of each metal adatom. The
exceptions, Na and Pd, showed insignificant decreases of less than 0.1 eV which can be ignored when
considering the advantages gained by having the ability to bind hydrogen on both sides of the graphene
sheet. Hence, double sided decoration is preferred for hydrogen adsorption. Second, for single sided
decoration, light metals (Al, Li, Na, Ca) generally show an increased binding energy with vdW-DF2
functional as compared to GGA only simulations, while transition metals depict the opposite trend. For
double sided decoration this trend holds except for Ca and Pt, perhaps reflecting the particular nature of
each metal and the manner in which its valence shells interact. The tables also present literature values
for the metal binding energies. Our GGA and vdW-DF2 metal binding values are consistently lower
than both LDA and GGA results found in literature. The higher literature LDA values are expected as

Chapter 4. Hydrogen Storage on Metal Decorated Graphene 40
System Eb (eV) d⊥ (A) Literature NotesGGA vdW-DF2 Lit. GGA vdW-DF2 Lit.
AlC6 (H) 0.03 0.22 0.82 2.06 3.49 2.08 System was C8 with 18 A c-axis using LDAPP [78]
LiC6 (H) -0.43 0.17 1.00 5.99 1.91 1.88 System was C6 with 16 A c-axis using PBE-GGA and PAW PP [77]
NaC6 (H) -0.01 0.04 0.59 2.70 2.81 – System was C60 with 20 A c-axis usingGGA-PBE, localized basis sets and norm-conserving PP [89]
CaC6 (H) 0.52 0.50 2.19,1.53,1.60
2.33 2.49 – (LDA,GGA & vdW-DF respectively) Sys-
tem was C6 with 20 A c-axis with indicatedfunctionals [76]
CuC6 (T) 0.15 0.17 0.39 2.14 3.21 – System was C60 with 20 A c-axis usingGGA-PBE, localized basis sets and norm-conserving PP [89]
NiC6 (H) 1.27 0.48 1.99 1.59 1.77 1.65 System was C24 with 20 A c-axis usingGGA-PBE, localized basis sets and norm-conserving PP [90]
PdC6 (B) 0.76 0.48 1.08 2.12 2.34 2.25 System was C24 with 20 A c-axis usingGGA-PBE, localized basis sets and norm-conserving PP [91]
PtC6 (B) 1.13 0.66 1.73 2.03 2.15 – System was C60 with 20 A c-axis usingGGA-PBE, localized basis sets and norm-conserving PP [89]
Table 4.1: Binding energies (eV), vertical adatom distance with respect to graphene sheet (A) andliterature values (Lit.) for single sided metal decoration. The adatom positions over graphene areindicated in brackets, where H stands for adatom at the hollow, B stands for adatom on the bridgebetween two carbon atoms and T stands for adatom above a carbon atom.
System Eb (eV) d⊥ (A) Literature NotesGGA vdW-DF2 Lit. GGA vdW-DF2 Lit.
Al2C6 (H) 0.15 0.21 0.96 2.26 3.55 2.14 System was C8 with 18 A c-axis using LDAPP [78]
Li2C6 (H) -0.37 0.18 0.99 6.05 1.86 1.85 System was C6 with 16 A c-axis using PBE-GGA and PAW PP [77]
Na2C6 (H) -0.01 0.03 – 2.08 2.16 – –Ca2C6 (H) 0.66 0.64 2.33,
1.63,1.69
2.31 2.39 (LDA,GGA & vdW-DF respectively) Sys-
tem was C6 with 20 A c-axis with indicatedfunctionals[76]
Cu2C6 (T) 0.14 0.18 – 2.26 3.35 – –Ni2C6 (H) 1.18 0.49 – 1.63 1.83 – –Pd2C6 (B) 0.64 0.43 – 2.18 2.46 – –Pt2C6 (B) 0.84 1.00 – 2.16 2.17 – –
Table 4.2: Binding energies per atom (eV), vertical adatom distance with respect to graphene sheet(A) and literature values (Lit.) for double sided metal decoration. The adatom positions over grapheneare indicated in brackets, where H stands for adatom at the hollow, B stands for adatom on the bridgebetween two carbon atoms and T stands for adatom above a carbon atom.
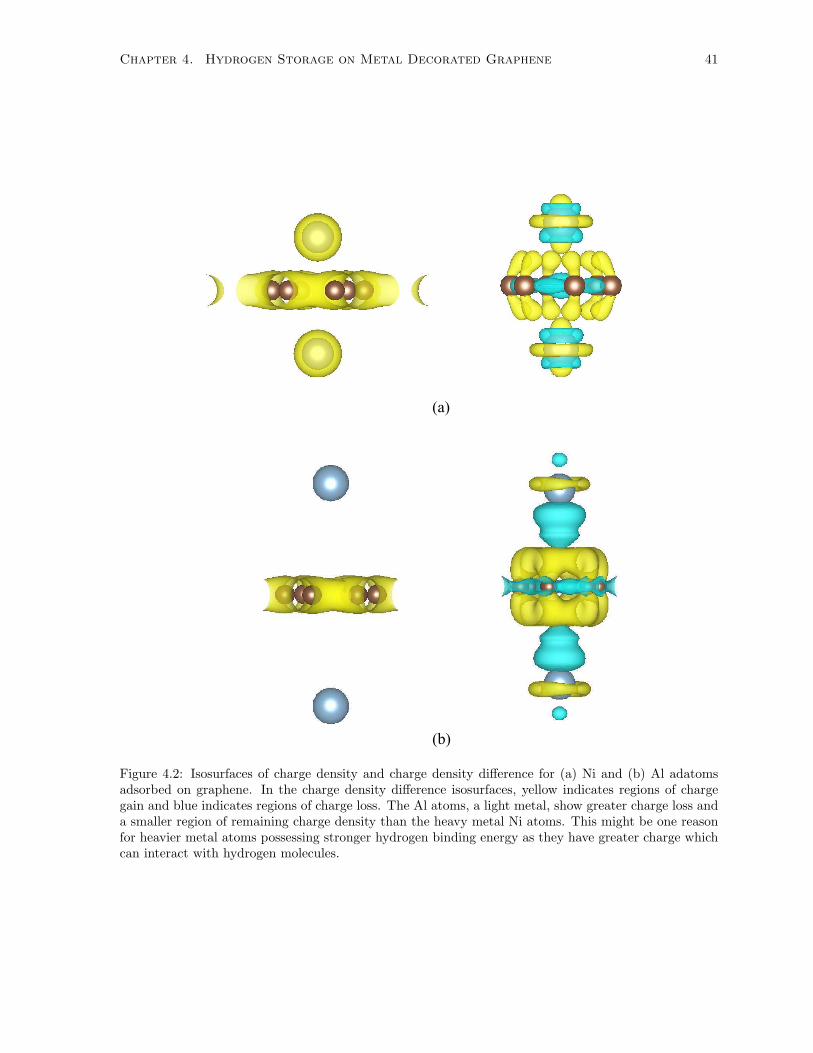
Chapter 4. Hydrogen Storage on Metal Decorated Graphene 41
(b)
(a)
Figure 4.2: Isosurfaces of charge density and charge density difference for (a) Ni and (b) Al adatomsadsorbed on graphene. In the charge density difference isosurfaces, yellow indicates regions of chargegain and blue indicates regions of charge loss. The Al atoms, a light metal, show greater charge loss anda smaller region of remaining charge density than the heavy metal Ni atoms. This might be one reasonfor heavier metal atoms possessing stronger hydrogen binding energy as they have greater charge whichcan interact with hydrogen molecules.

Chapter 4. Hydrogen Storage on Metal Decorated Graphene 42
Eb (eV)System GGA
(no-spin)
GGA(spin)
vdw-DF2(no-spin)
Literature Value Literature Notes
Al2C6-2H2 (H) 0.004 - 0.044 Eb = 0.2 eV [78] System was C8 with 18 A c-axis using LDA PP
Li2C6-2H2 (H) 0.356 - 0.118 Eb = 0.10 eV [77] System was C6 with 16 A c-axis using PBE-GGA and PAW PP
Na2C6-2H2 (H) 0.021 - 0.000 Eb = 0.02 eV [89] System was single-side decorated C60 with 20 Ac-axis using GGA-PBE, localized basis sets andnorm-conserving PP
Ca2C6-2H2 (H) 0.007 - 0.025 Eb=0.03 eV (LDA),0.01 eV (GGA), 0.06eV (vdW-DF) [76]
System was C6 with 20 A c-axis with indicatedfunctionals
Cu2C6-2H2 (T) 0.506 - 0.262 Eb = 0.04 eV [89] System was single-side decorated C60 with 20 Ac-axis using GGA-PBE, localized basis sets andnorm-conserving PP
Ni2C6-2H2 (H) 0.268 0.267 0.171 Eb = 1.21 eV [90] System was single-side decorated C24 with 20 Ac-axis using GGA-PBE, localized basis sets andnorm-conserving PP
Pd2C6-2H2 (B) 0.843 0.842 0.510 Eb = 1.86 eV [91] System was single-sided C24 with 20 A c-axisusing GGA-PBE, localized basis sets and norm-conserving PP
Pt2C6-2H2 (B) 1.75 1.15 1.02 Eb = 1.65 eV [89] System was single-side decorated C60 with 20 Ac-axis using GGA-PBE, localized basis sets andnorm-conserving PP
Table 4.3: Average hydrogen binding energy (eV/H2) for metal graphene system. The adatom positionsover graphene are indicated in brackets, where H stands for adatom at the hollow, B stands for adatomon the bridge between two carbon atoms and T stands for adatom above a carbon atom.
the functional is known to overestimate binding. The reasons for the difference between our GGA results
and those from literature are likely due to very different metal coverage and simulation parameters such
as vacuum spacing, pseudopotential and software implementation, partially described in the Literature
Notes section of Tables 4.1 and 4.2. We have tried to produce highly accurate GGA simulations by
using vacuum spacing much larger than previous studies as we found interlayer interactions even at the
spacing level of the previous studies, as well as stringent energy cutoffs and a high number of k-points.
As a third trend, there is a distinct pattern observed for transition metal vdW-DF2 results that is
less apparent in the calculations made using only GGA. The binding energy tends to increase as the
number of d-electrons increases. However, when the number of d-electrons increases to more than half
occupancy, the binding energy starts to decrease. Finally, the distance of the adatom from the graphene
sheet is greater for vdW-DF2 results than GGA only results for all cases. This trend may be due to the
presence of stronger long range interactions allowed in vdW-DF2, which allows the metal atom to be
energetically stable at a farther distance from the graphene sheet. On the other hand, GGA simulations
without vdW corrections would require greater proximity to feel the same level of attractive force. It
should be pointed out that while the earlier vdW-DF functional tended to overestimate distances, the
vdW-DF2 functional has improved distance estimation [85] and hence we expect the present results to
be more accurate.
4.4.2 Hydrogen adsorption on metal-decorated graphene
The binding energy for the adsorption of a single hydrogen molecule on each metal adatom is summarized
in Table 4.3. Since previous calculations showed that double-sided metal decoration is more stable in most
cases, the hydrogen adsorption energies were calculated for that configuration only. GGA calculations

Chapter 4. Hydrogen Storage on Metal Decorated Graphene 43
with and without spin polarization are also included for the transitions metals Ni, Pd and Pt. These
GGA results confirmed that spin polarization can be ignored for Ni and Pd, while Pt does show a
difference of 0.6 eV in binding energy owing to its inclusion. However, this difference in energy for Pt
is not large enough to affect its comparison to other metals and our conclusions from the simulations
remain unaffected. As stated earlier, the vdW-DF2 functional has not been be implemented with spin-
polarization in Quantum Espresso at present and so only unpolarized simulations were conducted for this
functional. For the light non-transition metal adatoms (Al, Ca, Na, Li), the vdW-DF2 results produced
higher binding energies than GGA results by an order of magnitude but were still much weaker than
those of the transition metals. For the heavier transition metals, the GGA results produced stronger
binding energies than vdW-DF2 results; although the difference was not an order of magnitude. The
difference occuring due to the vdW-DF2 correction can be analyzed by looking at the partial density of
states (PDOS) of the Ni system, as shown in Figure 4.3. The PDOS for the GGA simulation shows a
greater number of peaks and wider distribution for the Ni d-shell compared to the plotted PDOS after
including the vdW-DF2 functional. This indicates that the GGA Ni has more localized distinct energy
states which are likely to more strongly interact and share charge with hydrogen molecules. On the other
hand, the reduced number of peaks in the vdW-DF2 Ni indicates that its d-shell is filled due to greater
charge sharing with the graphene substrate. It is thus more stable and less likely to strongly interact
with a hydrogen molecule. Consequently, the vdW-DF2 simulated Ni will have a weaker hydrogen
binding energy than the GGA simulated Ni. The increased sharing of charge between the Ni atoms
and the graphene substrate when vdW corrections are included also helps to explain why the vdW-DF2
simulation showcased a stronger metal binding energy than the GGA simulation. These results reinforce
that vdW interactions can affect the charge distribution in a metal decorated system and its hydrogen
binding ability and should be taken into account when modelling such systems. Amongst the considered
metals, Pt possessed the strongest hydrogen binding ability, while Na possessed the weakest.
After system relaxation, both the GGA and vdW-DF2 simulations displayed the formation of a
complex involving a hydrogen molecule and metal adatoms for the transition metals (Cu, Ni, Pd and Pt),
as can be seen from Figure 4.4. This complex, involving the dissociation of the H-H bond, corresponds
to structure III described previously by Lopez-Corral [91] for their H2-Pd-graphene system. The H-
H distance after adsorption for our Pd-graphene system was about 0.80 A. The H-H distance after
adsorption for Lopez-Corral’s Pd-graphene system with single-sided metal decoration ranges from 0.85
to 0.87 A. The formation of the complex is likely the cause for the much stronger binding energies of
the transition metals as the hydrogen atoms move towards a more chemical type of adsorption.
Optimal binding energies for reversible hydrogen storage should lie within the range of 0.2 to 0.6
eV per H2 molecule [78]. If the binding energy is too high, then releasing the hydrogen molecules will
be difficult at moderate operating conditions. If the converse occurs, then the storage of hydrogen will
be minimal. Based on our results, three metal-graphene systems fulfill this optimal criterion. The Cu-
graphene system displayed a hydrogen binding energy of 0.51 eV for GGA only results and 0.26 eV for
vdW-DF2 results. The Ni-graphene system had a hydrogen binding energy of 0.27 eV for GGA only
results and 0.17 eV for vdW-DF2 results. Lastly, the Pd-graphene system demonstrated a hydrogen
binding energy of 0.84 eV for GGA only results and 0.51 eV for vdW-DF2 results. The GGA binding
energy value for Pd is too high and outside of the optimal range of values 0.2 to 0.6 eV, while the
vdW-DF2 value for Ni is just lower than the lower limit of preferred values. The vdW-DF2 result of Ni
is outside of the needed range of values by only 0.03 eV, which is a small enough difference to effectively

Chapter 4. Hydrogen Storage on Metal Decorated Graphene 44
0
5
10
15
20
-14 -12 -10 -8 -6 -4 -2 0 2 4
DO
S
Energy (eV)
Ni 4sNi 4dC 2sC 2pH 1s
(a)
0
5
10
15
20
-14 -12 -10 -8 -6 -4 -2 0 2 4
DO
S
Energy (eV)
Ni 4sNi 4dC 2sC 2pH 1s
(b)
Figure 4.3: PDOS of Ni-graphene system simulations with (a) GGA functional alone and (b) GGAfunctional with vdW-DF2 corrections. The greater number of peaks and width of the Ni d-shell orbitalfor (a) indicates more distinct localized energy states and stronger potential for interaction with ahydrogen molecule.

Chapter 4. Hydrogen Storage on Metal Decorated Graphene 45
Figure 4.4: Examples of the hydrogen-metal complexes formed by transition metals, palladium on theleft and copper on the right. The hydrogen molecule has dissociated and moved towards a chemisorbedstate, producing stronger hydrogen binding energies for transition metals.
still consider Ni suitable for reversible storage. The slight improvement needed in binding ability may
be provided by moderately increased gas pressure or other techniques.
As the goal of the studied metal-graphene systems is to maximize hydrogen gravimetric density, a
heavy metal mass is disadvantageous as it would reduce the relative mass percentage of hydrogen in
the system. Among the three selected metals best suited for reversible hydrogen storage, the increased
binding energies of Pd and Cu compared to Ni will allow them to bind more hydrogen molecules.
However, Pd and Cu are also heavier than Ni and this offsets any advantage offered by the few additional
hydrogen molecules they can adsorb. Hence, binding more hydrogen molecules does not necessarily lead
to higher hydrogen mass percentage in the system. Nickel provides the best balance by still having a
fairly strong hydrogen binding ability while possessing the lowest mass of the studied transition metals.
The nickel-graphene system also showed the strongest binding to the graphene substrate among the three
selected candidates, making it the most stable among the three. Furthermore, investigations conducted
by Sigal et al. [90] observed that chemical treatment can be used to deposit nickel compounds onto a
graphene surface, suggesting experimental feasibility of a nickel-graphene system. In the same study,
nickel was determined to be less easily oxidized than other metal decorations. Oxidation may occur in
real world situations where the system is exposed to air, and acts as a strong inhibitor for hydrogen
adsorption. The combination of strong hydrogen binding ability suited to reversible storage, relatively
low mass and increased practical feasibility due its highly stable metal-graphene system and resistance
to oxidation make nickel the best candidate for use in a metal decorated graphene hydrogen storage
system. Therefore, nickel was selected for use in all subsequent simulations looking at metal coverage
and maximum gravimetric density.
4.4.3 Optimal hydrogen storage on Ni-decorated graphene
Effect of Varying Ni Coverage
The effect of metal coverage, described by the relative density of or equivalently the distance between
metal adatoms on the graphene sheet, can be quite significant due to the complex mix of attractive
and repulsive forces acting within each system. As observed by Wang et al. [76], changes in metal
adatom distance result in variations in interaction energy between adatoms, thus influencing their binding

Chapter 4. Hydrogen Storage on Metal Decorated Graphene 46
(a) (b) (c) (d)
Figure 4.5: Supercells used for differing Ni metal coverage simulations: (a) 6 carbon atoms (b) 16 carbonatoms (c) 32 carbon atoms (d) 72 carbon atoms
0 20 40 60
0.5
1
Carbon atoms in supercell
Bindingenergy(eV)permolecule
GGA
vdW-DF2
Figure 4.6: Average hydrogen binding energy (eV/H2) for Ni-decorated graphene systems at differentsubstrate sizes.
abilities with the hydrogen molecules. Since each simulation uses a repeating supercell with a single metal
adatom on each side of the graphene sheet, the size of the graphene substrate supercell determines the
metal coverage of the system. The small 6 carbon supercell used for the simulations comparing different
metal systems represents the highest metal coverage where metal adatoms have the shortest distance
between them. Four supercells of increasing size (6, 16, 32 and 72 carbon atoms as seen in Figure 4.5)
were simulated with GGA alone and with vdW-DF2 included. The results are presented in Figure 4.6.
In general, an increase in supercell size yielded an increase in hydrogen adsorption binding energy.
The 32 carbon atom graphene substrates provided the highest binding energy for GGA only results
(just slightly higher than 72 atoms) while the 72 carbon atom supercell provided the highest energy
for vdW-DF2 results. This suggests that at close range, the proximity of metal atoms has a negative
effect on hydrogen binding ability. This might be due to the increased stability felt by the closer metal
atoms, making the hydrogen molecule less attractive to them for achieving stability. There might also be
repulsive forces between hydrogen molecules at such close range, as they become partially charged after

Chapter 4. Hydrogen Storage on Metal Decorated Graphene 47
Graphene Substrate Number of Hydrogen molecules2 4 6 8 10
6 C 0.171 -2.148 Not converged -0.956 –16 C 1.119 0.470 0.323 0.260 0.232
32 C 1.157 0.638 0.160 0.261 –
Table 4.4: Average hydrogen binding energy (eV/H2) for increasing number of adsorbed hydrogenmolecules and different substrate sizes (in terms of number of carbon atoms). Dashed lines indicate asimulation was not conducted, due to low chance of adsorption for 6C or low gravimetric density for 32C. The 16C substrate represents the best balance of substrate size and binding energy which allows itto meet the DOE’s goal of 5.5% gravimetric density.
donating electronic charge towards the metal adatoms. The finding that increased supercell size leads
to higher binding energy suggests that lower metal coverage might be beneficial for hydrogen storage.
However, an increased supercell size also increases the number of carbon atoms and this will very quickly
outweigh any gains from additional adsorbed hydrogen. Hence, a balance must be found between the
need for fewer carbon atoms per metal adatom to decrease non-hydrogen mass and for larger supercells
to increase hydrogen binding energies. It should be noted that the lower metal cover simulations all
produce strong hydrogen binding energies outside the range of -0.2 to -0.6 eV preferred for reversible
storage.
Maximum Gravimetric Density for Ni Graphene Systems
The gravimetric density for each varying metal coverage system studied in the previous section was
investigated by adding increasing numbers of hydrogen molecules to each metal adatom. The results
of the gravimetric density simulations and average hydrogen molecule binding energy are presented in
Table 4.4 and Figure 4.7, while Figure 4.8 presents the theoretical gravimetric density numbers for each
system if the hydrogen molecules successfully adsorbed. The 6 carbon atom supercell fails to bind more
than two hydrogen molecules, with higher numbers of molecules producing negative binding energies or
failing to converge in their simulations which would suggest unstable configurations. This is caused by
the relatively lower binding energy for this metal coverage as discussed in the previous section, which
prevents the binding of large numbers of hydrogen molecules and hence simulations were stopped after
attempting to adsorb 8 molecules. Note that the 6 carbon substrate also has the highest theoretical
gravimetric density for each number of hydrogen molecules, indicating it is preferable to have higher
metal adatom coverage. The 16 carbon atom supercell is the next smallest substrate and has a high
enough binding density to adsorb up to 10 hydrogen molecules. This is also the point at which this
substrate is able to surpass the DOE goal of 5.5% gravimetric density, achieving 6.2 wt %. Hence, the
16 carbon substrate is able to provide a good balance between having a supercell size which allows high
gravimetric densities and binding energies strong enough to adsorb multiple hydrogen molecules. The
configurations for the increasing numbers of hydrogen molecules can be seen in Figure 4.9.
A correlation between the gravimetric density and average binding energy for the 16 carbon substrate
is shown in Figure 4.10, where a rapid drop of binding strength with increasing number of hydrogen
molecules shows the importance of vdW interactions as the binding strength moves away from the
chemisorption type of binding towards weaker physisorption strengths. The final data point for the
maximum 10 hydrogen molecules is just within the desired range of -0.2 to -0.6 eV. The PDOS of the 16
carbon substrate with the different number of hydrogen molecules adsorbed are shown in Figure 4.11.
The distance of the hydrogen from the Fermi level and the lack of overlap between hydrogen and Ni

Chapter 4. Hydrogen Storage on Metal Decorated Graphene 48
2 4 6 8 10
−2
−1
0
1
Hydrogen Molecules
Bin
din
gen
ergy
(eV)per
molecu
le
6C
16C
32C
stable
unstable
Figure 4.7: Average hydrogen binding energy (eV/H2) for increasing number of adsorbed hydrogenmolecules and different substrate sizes (in terms of number of carbon atoms)
2 4 6 8 100
2
4
6
8
10
Hydrogen Molecules
GravimetricDensity%
6C
16C
32C
Figure 4.8: Maximum theoretical hydrogen gravimetric density (wt.%) for different number of adsorbedhydrogen molecules and substrate sizes (in terms of number of carbon atoms). Note that not all of thesystems successfully adsorbed the hydrogen molecules (see Figure 4.7).

Chapter 4. Hydrogen Storage on Metal Decorated Graphene 49
(a) (b) (c) (d) (e)
Figure 4.9: Configurations of adsorbed hydrogen on the 16 carbon Ni decorated supercell, with increasingnumbers of hydrogen molecules: (a) 2, (b) 4, (c) 6, (d) 8 & (e) 10.
peaks indicates that the hydrogen is not binding through a Kubas type interaction [92], despite the fact
that Ni has unfilled d-shells. This would then suggest that the hydrogen binds by a weak electrostatic
dipole mechanism. This is further confirmed by looking at the charge density difference for two adsorbed
hydrogen molecules in Figure 4.11(f), where sharp charge accumulation and depletion zones around the
hydrogen atoms indicate polarization of the hydrogen molecule. As expected, the number of states
for hydrogen increase as the number of adsorbed hydrogen molecules increases. Another interesting
aspect is the interaction between hydrogen molecules which is visible as the peaks of hydrogen change
in number and spread with different numbers of molecules. The system with 6 hydrogen molecules has
the most distinct peaks, demonstrating a broad range of occupancies for quite differently configured
hydrogen molecules. For the 10 molecule system, the number of peaks goes down again to two while the
number of states at these two peaks’ energies increases, indicating overlap and stabilization in the more
symmetrically configured molecules.
The 32 carbon atom substrate initially showed the highest binding energy as expected but surprisingly
produced lower average binding energies than the 16 carbon substrate for increasing numbers of hydrogen
molecules. This might be because the increased distance between hydrogen molecules adsorbed to
different metal adatoms allows them to interact and stabilize each other to a lower extent, whereas
this distance seems to be closer to optimal for the 16 carbon substrate and too small for the 6 carbon
substrate. The 32 carbon substrate also has very low theoretical gravimetric densities and hence no
simulations were attempted beyond 8 hydrogen molecules as they would not be able to meet the DOE’s
target. By the same reasoning, the 72 carbon atom supercell would have had particularly low gravimetric
densities due to the large number of carbon atoms and was thus excluded from the gravimetric density
simulations altogether. This addresses the point discussed in the previous section, where the increased
binding energy of larger supercells comes at the price of more carbon atoms which negate any gains of
additional hydrogen adsorption as a greater number of heavier carbon atoms actually decreases the mass
fraction of hydrogen.

Chapter 4. Hydrogen Storage on Metal Decorated Graphene 50
1 2 3 4 5 6
0.2
0.4
0.6
0.8
1
1.2
Gravimetric Density %
Bindingenergy(eV)permolecule
Figure 4.10: Correlation between hydrogen gravimetric density (wt.%) and average binding energy(eV/H2) for the 16 carbon substrate
4.4.4 Discussion
The disjointed set of previous studies cannot be used to confidently evaluate the comparative performance
of metal-graphene systems. This is because these earlier studies used different types of pseudopotentials,
exchange-correlation functionals, DFT simulation package implementations, metal coverages and calcu-
lation parameters such as number of k-points, vacuum spacing and energy cutoffs. This points to the
motivation for and one of the advantages of this paper’s investigations, where the simulation of a large
number of metals using the same consistent conditions allows the proper comparison of these systems.
Our results on the whole show less spectacular performance for metal decorated systems with regards to
hydrogen storage as opposed to some earlier studies which have claimed very high hydrogen binding ener-
gies and gravimetric densities which easily exceed the DOE target of 5.5% wt. The lack of consideration
of vdW forces, the use of small vacuum spacings and the use of the LDA functional, which is known to
overpredict binding energies, likely all lead to earlier studies overestimating the hydrogen binding ability
of metal decorated systems. In fact, several of the metal systems which previously reported studies claim
can exceed the DOE’s target (such as Al and Li) have been found in our investigations to be unable to
meet this goal. On the other hand, even our best case result for Ni barely manages to surpass the DOE
target in its theoretical gravimetric density. This value will likely decrease in real life conditions as part
of a larger contained system and may turn out to be below the target value. This suggests that metal
decoration alone will be unlikely to meet the DOE gravimetric density targets, although it can get us
there most of the way. This is also likely one of the reasons that experimental results are not able to
replicate the spectacular values claimed by earlier studies. Therefore, additional methods for increasing
hydrogen adsorption abilities of graphene will have to be explored together with metal decoration. These
could include manipulating the curvature or interlayer distance of the graphene substrate as suggested
by Tozzini et al.[13] or defect engineering some of the graphene substrate as suggest by Yadav et al.[93].
The combination of both approaches would lead to a higher hydrogen storage capacity than either one
by itself and metal decoration would continue to play an important role in significantly increasing the
hydrogen binding ability of graphene systems.

Chapter 4. Hydrogen Storage on Metal Decorated Graphene 51
0
5
10
15
20
25
-10 -8 -6 -4 -2 0 2 4
DO
S
Energy (eV)
NiHC
0
5
10
15
20
25
-10 -8 -6 -4 -2 0 2 4
Energy (eV)
NiHC
0
5
10
15
20
25
-10 -8 -6 -4 -2 0 2 4
DO
S
Energy (eV)
NiHC
0
5
10
15
20
25
-10 -8 -6 -4 -2 0 2 4
DO
S
Energy (eV)
NiHC
0
5
10
15
20
25
-10 -8 -6 -4 -2 0 2 4
Energy (eV)
NiHC
(a) (b)
(c) (d)
(e) (f)
Figure 4.11: PDOS of 16 carbon Ni decorated supercell system with increasing numbers of adsorbedhydrogen molecules: (a) 2, (b) 4, (c) 6, (d) 8, & (e) 10. The Fermi level is indicated by a dashed line.The charge density difference of the system with 2 hydrogen molecules (red colored atoms) adsorbed isshown in (f), where yellow indicates regions of charge gain and blue indicates regions of charge loss andcarbon atoms are black colored.
Chapter 4. Hydrogen Storage on Metal Decorated Graphene 52
4.5 Summary
The atomic adsorption ability of eight metals on graphene, four light metals and four transition metals,
was investigated using the PBE-GGA functional first and then with the addition of the vdW-DF2
functional. The use of vdW-DF2 generally led to stronger binding of the metal adatom for lighter
metals and weaker binding for heavier metals in comparison to GGA only simulations. Both single and
double-sided decoration were found to obey the same trends and double sided decoration did not decrease
system stability. Therefore, all subsequent simulations were carried out using double-sided decoration.
The hydrogen binding ability of these metals was then investigated through the adsorption of a single
hydrogen molecule over each adatom. The light metals were found to weakly bind hydrogen, whereas
the transition metals displayed an order of magnitude stronger binding. The transition metals produced
hydrogen-metal complexes where the hydrogen molecule had dissociated into individual atoms over a
metal atom. Similar to metal atom binding, it was found that hydrogen binding ability was increased
with the use of vdW-DF2 for light metals but decreased for transition metals.
Three metals (Cu, Ni, Pd) demonstrated hydrogen binding energies close to the range of 0.2 to 0.6
eV considered useful for practical reversible hydrogen storage. Among these, Ni was selected as the best
candidate for a metal-graphene hydrogen storage system due to its low mass and stability in practical
systems. The effect of varying metal coverage on a graphene sheet was investigated for four different
sized (6-72 carbon atoms) supercells. It was found that decreasing metal coverage by increasing the
supercell size (thereby increasing the number of carbon atoms per Ni atom) generally improved the
hydrogen binding ability of the metal. Next, the gravimetric density of the three smallest supercells
was studied as additional hydrogen molecules were adsorbed onto the system. The 16 carbon supercell
displayed the best balance of small supercell size and ability to bind several hydrogen molecules (up to
10), giving it the highest produced gravimetric density of 6.12 wt.%.
Our investigations show that vdW forces can have a significant impact on simulation results. Correc-
tions to better represent such forces should be applied with functionals such as vdW-DF2, particularly
as vdW forces play an important role in hydrogen interactions and adsorption. The inclusion of vdW
forces was also found to decrease the hydrogen binding ability of transition metals, which means that
earlier studies which neglected such effects might have overestimated the usefulness of metal adatoms
for hydrogen adsorption. This could be a reason for the inability of experimental studies to replicate the
phenomenal hydrogen storage results of theoretical metal decoration studies. Our results suggest that
even the best case scenario would produce a gravimetric density of 6.12 wt.%, just above the DOE target
of 5.5 wt.%. This means that additional techniques for enhancing hydrogen storage, such as graphene
sheet curvature and defect engineering, should be investigated to be used in conjunction with metal
decoration to produce a truly feasible real world hydrogen storage system.

Chapter 5
Hydrogen Storage on Defective
Graphene
The material in this chapter has been published in the journal “International Journal of Hydrogen En-
ergy” under the title of “Defect engineering of graphene for effective hydrogen storage“ [93]. Text and
figures are reproduced with permission from the International Association of Hydrogen Energy.
5.1 Introduction
Hydrogen is considered to be a promising environmentally friendly fuel for the future as it possesses
a very high energy content by mass compared to conventional fuels and can cleanly produce energy
with no harmful by-products. However, it is impractical to store and transport hydrogen using existing
methods. Therefore, research efforts in recent years have focused on finding systems which can store
hydrogen through adsorption on various media [14], with an initial goal of 5.5wt% gravimetric capacity
targeted by the US Department of Energy (DOE) [74]. A class of materials that can act as effective
adsorption media for hydrogen molecules are carbon-based nanostructures, due to their relative low
weight and high surface areas [75, 94]. Amongst these, graphene is considered particularly promising
as a one atom thick two-dimensional structure gives it the highest specific surface area among these
materials [73].
This study looked at the effect of individual Stone-Wales (SW), single vacancy (SV) and double
vacancy (DV) 585, 555-777 and 5555-6-7777 defects on the hydrogen binding ability of graphene. Based
on the individual defect simulation results, a combined SW and SV defect system was created to inves-
tigate mixed defect regions. Similarly, a system consisting of SV anchored metal atoms with adjacent
undecorated SVs was created to investigate the effect of undecorated vacancies on the hydrogen binding
ability of metal atoms. A grain boundary structure, commonly created during graphene synthesis [95],
was also investigated for hydrogen adsorption. Finally, the results of the individual and mixed defect
simulations were utilized to engineer two high defect density structures to evaluate the maximum pos-
sible hydrogen molecule adsorption in graphene systems modified solely using defects. The first system
consisted of closely spaced SVs, named the single vacancy maximum hydrogen density (SVMD) system.
The second system consisted of half SW and half SV defects, named the Stone Wales single vacancy
maximum hydrogen density (SWSVMD) system.
53

Chapter 5. Hydrogen Storage on Defective Graphene 54
5.2 Literature Review
The need for reversible storage, where hydrogen can be both easily stored and released under near-
ambient conditions, requires that hydrogen binding should be neither too strong nor too weak. Based
on this practical need, the ideal binding energy range for reversible hydrogen adsorption is considered to
be between -0.2 to -0.6 eV [96]. Pristine graphene, with a hydrogen binding energy in the range of -0.01
to -0.09 eV, does not meet this requirement [97, 13]. Consequently, several modifications to graphene
have been proposed to improve its storage capacity. They include metal decoration [76, 98], doping
with hetero-atoms such as nitrogen and oxygen [99, 100], and the introduction of strain, curvature and
edges [13]. An important issue with these studies is that they analyze idealized graphene structures
and usually ignore the effect of defects on hydrogen adsorption, even though commercially prepared
graphene sheets would typically contain topological defects [95]. When they are considered in some
studies, defects are looked at for the sole purpose of anchoring metal atoms over defect sites [101]. To
the best of our knowledge, the direct interaction of defects with hydrogen molecules and their modifying
role in hydrogen adsorption has not been characterized thus far in the literature.
Furthermore, the metal-decorated systems studied so far have not been reproduced experimentally,
rendering these theoretical results less useful in practice. There are additional concerns to these proposed
systems. For instance, metal-decorated systems require the challenging task of isolating and placing
single metal atoms at exact locations over the graphene layer, which might prove difficult to achieve
under experimental conditions. On the other hand, the creation and control of topological defects
over graphene layers has already been demonstrated experimentally [102]. Importantly, defect control
would still be required for many proposed metal-decorated systems. Thus, it is necessary to understand
the fundamental role of defects in graphene with respect to its hydrogen storage ability. Moreover, if
defective graphene is shown to have sufficient binding ability, a system modified solely with defects would
be potentially easier to implement in practice than the current proposed approaches.
In this paper, the hydrogen molecule binding ability of a graphene sheet with the Stone-Wales (SW),
single vacancy (SV) and double vacancy (DV) 585, 555-777 and 5555-6-7777 defects is investigated.
These five point defects were chosen as they have been observed experimentally and are known to be
stable at room temperature. They are usually formed during manufacturing processes such as chemical
vapor deposition, or can be induced by irradiation with electrons or ions [95]. The hydrogen binding
ability in each case was evaluated using density functional theory (DFT) with the generalized gradient
approximation (GGA) functional. The GGA functional is good at modeling covalent type bonding but
poorly represents van der Waals (vdW) forces. Although vdW forces are negligible in covalent bonding
dominated systems, they are a significant component in hydrogen molecule adsorption [103, 104]. Hence,
all systems were also studied with the recently implemented vdW-DF2 functional [105] which better
accounts for vdW forces.
5.3 Computational Details
The simulations were performed using plane wave based DFT as implemented in the Quantum Espresso
software [26]. The exchange-correlation functional was represented using GGA as described by Perdew-
Burke-Ernzerhof (PBE) [84]. Interactions between the valence electrons and the ionic core were rep-
resented by Vanderbilt Ultra-Soft Pseudopotentials [106]. The kinetic energy cutoff for wavefunction

Chapter 5. Hydrogen Storage on Defective Graphene 55
expansion was set at 60 Ry (1 Ry = 13.61 eV) and for the charge density it was set at 600 Ry. Each self
consistent field calculation had a convergence threshold of 1E-5 Ry for the total system energy. Each
system was relaxed with variable cell size using conjugate gradient minimization until the magnitude
of the residual Hellman-Feynman force on each atom was less than 1E-3 Ry/Bohr. The total system
energy during relaxation was minimized to within 1E-3 Ry. Brillouin zone integrations were performed
using a Monkhorst-Pack grid with 8× 8× 1 k-points [60].
All simulations, except for the SVMD and SWSVMD systems, were performed with a vacuum spacing
of 30 A to sufficiently isolate the graphene layer and remove interactive effects between layers. All such
simulations also allowed variable cell dimensions during system relaxation. The SVMD and SWSVMD
systems were first simulated using a vacuum spacing of 6 A and variable cell dimensions to allow for
enhanced hydrogen adsorption through interaction effects between graphene layers. Subsequently, the
effect of interlayer spacing effects was investigated for both SVMD and SWSVMD systems using fixed
cell dimensions and vacuum spacings ranging from 2 to 7 A. For the individual defect simulations, the
graphene sheet size varied in proportion to the defect size so as to minimize interaction energies between
periodic defect images. Specifically, the pristine graphene and SW supercells were modeled using 50
carbon atom 4× 4 graphene sheets, while the SV used a 49 atom 4× 4 sheet. The supercell containing
the 585 DV was modeled using a 58 atom 4× 5 sheet; the 555-777 DV using a 72 atom 5× 5 sheet; and
the 5555-6-7777 DV using a 82 atom 5× 6 sheet. Bilayer graphene was modelled using a 24 atom sheet
stacked with a 23 atom sheet in an AB stacking configuration. The mixed SV and SW system and the
SWSVMD system were modeled using a 49 carbon atom 4 × 4 graphene sheet. The metal decorated
system and SVMD system simulations used 30 atom 3× 3 sheets. The semi-metallic nature of graphene
was represented using Methfessel-Paxton [87] smearing with a degauss value of 0.01. The binding energy
of a hydrogen molecule for each system was calculated as :
Eb = (Esystem+iH2− Esystem − iEH2
)/i (5.1)
where Esystem+iH2is the total energy of the modified graphene system with hydrogen adsorbed, Esystem
is the total energy of the modified graphene system without hydrogen, EH2is the total energy of the
free H2 molecule and i corresponds to the number of H2 molecules. In order to accurately obtain
energy changes, the three simulations required to produce values for the terms on the right hand side of
the equation used the same supercell size and parameters. The hydrogen molecule was placed in several
starting configurations for each individual defect system by varying its position laterally across the sheet.
Its orientation with regards to the plane of the sheet (perpendicular or parallel) was also analyzed.
It was recognized that in addition to the above, the PBE-GGA functional is only good at accounting
for localized effects and describing strong bonds, but is not good at describing long-range nonlocal effects
such as vdW forces which have long decay tails. There have been several functionals proposed to help
better model such weak interactions, and among them the vdW-DF approach provides a generalized
truly nonlocal functional independent of system geometry [86]. The vdW-DF2 functional is a further
improvement over the originally proposed vdW-DF functional [105], and provides better equilibrium
separations, hydrogen bond lengths and more accurate vdW interactions at intermediate distances longer
than equilibrium ones. More importantly, for our purpose at hand, when compared with several DFT
functional approaches, the vdW-DF2 functional has been found to most closely match experimental data
for adsorption of a hydrogen molecule on copper surfaces [103], as well as molecular adsorption on metal
surfaces [104]. All individual defect simulations were repeated with van der Waals corrections to the

Chapter 5. Hydrogen Storage on Defective Graphene 56
PBE-GGA through the vdW-DF2 functional while keeping all other simulation parameters the same.
This allowed for comparison with previous literature and investigation of the effect of different density
functionals. The remaining simulations were all performed solely with the vdW-DF2 correction since it
probably models complex hydrogen systems more accurately.
5.4 Hydrogen Binding over Individual Defect Systems
In this section, the five individual defect simulation results are presented and their binding energy values
are available in Table 5.1. It was found that the orientation of the hydrogen molecule with regards to the
plane of the sheet (perpendicular or parallel) had a negligible impact on binding energies and so only the
differences in energy at different locations over the defect are reported in the table. The corresponding
plots of charge density variation around each defect are found in Figure 5.2. According to Eq. (5.1),
a negative binding energy indicates favorable conditions for hydrogen adsorption, with a more negative
value indicating stronger binding.
Binding Energy (eV)PBE-GGA vdW-DF2
Pristine -0.0102 -0.0618Stone-Wales (SW)
top -0.0100 -0.0610hepta 0.0011 -0.0620penta -0.0136 -0.0727
Single Vacancy (SV) -0.3282 -0.4020Double Vacancy (DV)
585octa -0.0082 -0.0624penta -0.0156 -0.0646
555-777bridge57 -0.0080 -0.0592bridge77 -0.0091 -0.0571top -0.0037 -0.0542hepta -0.0020 -0.0655penta -0.0051 -0.0678
5555-6-7777hepta 0.0009 -0.0614hex -0.0067 -0.0618penta -0.0127 -0.0656
Table 5.1: Binding energies of a hydrogen molecule placed over individual topological defects in graphene.Multiple positions, shown in Figure 5.1, were tested for each defect type. Both PBE-GGA and vdW-DF2functionals were utilized to ascertain differences in binding energies due to choice of density functional.The vdW-DF2 results all demonstrated stronger binding and a smaller range of values among sites withina defect than the PBE-GGA results.
5.4.1 Pristine Graphene
To establish a baseline for binding energy results, in comparison to which modifications of graphene
should offer an advantage, hydrogen adsorption over pristine graphene was studied first. Previous

Chapter 5. Hydrogen Storage on Defective Graphene 57
h����
�t�
octa
��p��
��p��
bridge57
hepta
bridge77
top
hepta hex
penta
(a) (b)
(c)(d)
(e)
(f)
Figure 5.1: Supercells for hydrogen binding over individual defect systems depicting different initialpositions for the adsorption of a hydrogen molecule: (a) Pristine (b) SW (c) SV (d) DV 585 (e) DV555-777 (f) DV 5555-6-7777.

Chapter 5. Hydrogen Storage on Defective Graphene 58
literature [107] has shown that the hollow position, as shown in Figure 5.1(a), has the lowest adsorption
energy with a binding value of -0.011 eV using the PBE-GGA functional and -0.054 eV using the
vdW-WF functional (another functional used to better represent vdW forces). In the current paper,
the hydrogen binding energy of pristine graphene layer was found to be -0.010 eV using PBE-GGA
(consistent with literature value) and -0.062 eV with vdW-DF2 (slightly different from [107] due to a
different functional used for vdW interactions). These values indicate a very weak binding of hydrogen on
pristine graphene, far from the preferred -0.2 to -0.6 eV range, and demonstrates that pristine graphene
cannot fulfill the requirements for a practical hydrogen storage medium.
5.4.2 Stone-Wales Defect
For the SW defect, the hydrogen molecule was placed over three positions as indicated in Figure 5.1(b).
For the top position, the PBE-GGA binding energy was found to be identical to that of the pristine
graphene case and seemed to offer no additional advantage for hydrogen binding. The penta position,
however, offered a small improvement while the hepta position was unfavorable with a positive binding
energy. The non-existent binding in the hepta position is likely due to the hydrogen molecule’s increased
distance from the surrounding carbon atoms, resulting in weaker covalent interactions as represented
by PBE-GGA. The reason for the better penta binding energy was likely due to the closer equilibrium
distance of the H2 molecule to the surrounding ring atoms leading to a stronger interaction of the
electrons in the hydrogen molecule with those of the carbon atoms. For the top position, there was a
high density of electrons near the carbon atom, as shown in Figure 5.2. This resulted in a relatively
stronger repulsive force being felt by the hydrogen molecule, making this a less stable position.
For the vdW-DF2 calculations, the binding energy at top position was found to be very similar to
that of pristine graphene. The hepta position was also found to have a virtually identical binding value,
while the penta position offered slightly stronger binding. A previous study, using atomic orbital basis
sets with GGA and Double Zeta Polarization (DBZ) for this system, has reported a binding value of
-0.082 eV at the penta position and a binding value of -0.090 eV at the hepta position [108]. These are
closest to the vdW-DF2 results in our study (-0.073 eV for penta and -0.0620 eV for hepta), suggesting
the DBZ can provide corrections similar to those of vdW-DF2 for atomic basis sets, at least for this
type of defect. These somewhat better values in the cited study could be due to differences in the DFT
approach and simulation parameters, although in both cases the penta position is found to be slightly
stronger than the hepta position. The stronger binding energy of the hepta position for vdW- DF2
compared to PBE-GGA is likely due to vdW interactions which act over the increased distance of the
hydrogen molecule from surrounding atoms. As can be seen, the SW binding values were still outside
the preferred range of -0.2 to -0.6 eV. Yet, since the SW defect had a better binding ability than pristine
graphene, it is expected that the presence of SW defects will increase the ability of a graphene system
to draw hydrogen molecules closer to the surface even though it will not bind them strongly enough for
practical purposes.
5.4.3 Single Vacancy Defect
The supercell for this defect system is shown in Fig. 5.1(c). The single vacancy defect was observed to
have binding energy values much stronger than those for any of the other single layer individual defect
systems. They fall comfortably within the desired range required for practical reversible adsorption.

Chapter 5. Hydrogen Storage on Defective Graphene 59
Pristine SW
DV 585DV 555-777
DV 5555-6-7777
Figure 5.2: Top view of charge density for studied defective graphene systems (except for SV, found inFig. 5.10. The highest amount of charge can be seen to concentrate around the carbon atoms arrangedin rings. Conversely, the lowest amount of charge is present in the hollow regions of these rings. Thevery high charge density around the carbon atoms make the top and bridge positions unfavourable foradsorption. Among hollow positions, the pentagon rings seem to have the most optimum charge densityfor favourable hydrogen adsorption, whearas the lower charge densities of the larger rings leads to slightlyweaker binding energies.

Chapter 5. Hydrogen Storage on Defective Graphene 60
The vacancy has three carbon atoms adjacent to it, which were found to undergo significant movement
after adsorption of the hydrogen molecule. This is quite different than the other studied individual
defects, for which the carbon atoms did not undergo any appreciable movement after introduction of
the hydrogen molecule. The change in the carbon atom configurations is shown in Figure 5.3 (a), a side
cross-section of the graphene sheet prior to adsorption. From the figure, it is clear that the atoms were
more or less contained within a single plane of the graphene sheet. However, after adsorption of the
hydrogen molecule, as depicted in Figure 5.3(b), the adjacent atoms have moved out of the plane of the
sheet away from the hydrogen molecule. This configuration was found to be the most optimal in helping
to share electronic charge between the hydrogen molecule and the atoms around the vacancy as further
discussed in section 5.6.
Figure 5.3: A side cross-section of the single vacancy defect: (a) prior to and (b) after adsorption ofhydrogen molecule. Adsorption of the hydrogen molecule clearly distorts the graphene sheet, pushingthe atoms adjacent to the vacancy out of the plane away from the hydrogen molecule.
A variable which might also affect hydrogen binding is the distance between defects in the graphene
sheet. As the SV defect was found to be the most promising of the single layer individual defects, the
effect of defect density was briefly investigated for this defect using different sized supercells. Both 31
carbon atom and 71 carbon atom supercells with a SV in each were simulated to observe the effect of
higher and lower defect density respectively. The 31 atom supercell exhibited a hydrogen binding energy
of -0.494 eV while the 71 atom supercell showed a hydrogen binding energy of -0.323 eV. This indicates
a monotic increase in hydrogen binding strength with increasing defect density (created by decreasing
supercell size) and was a motivation for creating the very high defect density structures studied in

Chapter 5. Hydrogen Storage on Defective Graphene 61
sections 4.4 and 4.5.
5.4.4 585 Double Vacancy Defect
Two positions were investigated for the 585 defect for H2 adsorption, as displayed in Figure 5.1(d). While
PBE-GGA showed large differences in binding energies between the two locations, with the penta position
found to have the lower energy of the two, this positional difference was observed to be inconsequential
in the case of the vdW-DF2 functional. This is similar to the case of the SW defect where the hepta
(or octa here) position was at the center of a large region of very low electron density and far from the
surrounding atoms, causing it to experience a lower amount of interaction with them (see Fig. 5.2). The
use of vdW-DF2, on the other hand, allowed for interactions to occur over larger distances. The vdW-
DF2 results displayed a much stronger binding of the hydrogen molecule than the PBE-GGA results,
although they were only marginally better than the pristine graphene case and weaker than the preferred
range of values.
5.4.5 555-777 Double Vacancy Defect
The 555-777 defect had the most unique available positions for the adsorption of the hydrogen molecule,
a total of five as shown in Figure 5.1(e). For PBE-GGA simulations, the hepta position produced the
weakest binding energy, followed by the top position, penta position and the two bridge positions. On
the other hand, for vdW-DF2, the top position displayed the weakest binding energy, followed by the two
bridge positions, the hepta position and then the penta position. The vdW-DF2 results followed expected
trends, similar to those seen for the SW and 585 defects, where the top and bridge positions possessed
weaker binding energies due to the repulsion felt by the hydrogen molecule from close proximity to high
electron density (see Fig. 5.2). The hepta and penta positions in the hollow of the rings both exhibited
better binding energies as the hydrogen molecule can easily fill a region previously devoid of charge and
interact well with electrons belonging to the surrounding carbon atoms. Once again, the penta position
demonstrated slightly stronger binding than the larger hepta position, indicating that the penta position
is closest to an optimal distance from the surrounding carbon atoms. For the PBE-GGA simulations,
the strange order of binding energies was likely due to the poor ability of the functional to account for
vdW forces. The distance of the H2 molecule was greater from surrounding atoms in hollow positions in
the center of rings and this produced low stability due to the absence of long-range interactions. This
caused the penta and hepta positions to have weaker binding energies relative to other positions. In fact,
PBE-GGA results for all positions in this defect demonstrated weaker binding energies than the pristine
graphene case. The vdW-DF2 results were only marginally better than the pristine graphene case and
still weaker than the preferred range of values. As was the case in other individual defect systems, the
spread in the binding energy values for vdW-DF2 cases was observed to be much smaller than that for
the PBE-GGA calculations.
5.4.6 5555-6-7777 Double Vacancy Defect
As depicted in Figure 5.1(f), three positions were analyzed as potential sites for H2 adsorption for the
5555-6-7777 defect. Both PBE-GGA and vdW-DF2 showed the hepta position with the weakest binding
energy and the penta position with the strongest binding, following the same trends as SW, 585 and
555-777 defects. The PBE-GGA hepta position binding energy was exceptionally weak and actually the

Chapter 5. Hydrogen Storage on Defective Graphene 62
lowest binding energy of the individual point defect simulations in this paper. Once again, the vdW-DF2
simulations had similar binding values for all locations while the PBE-GGA showed a much wider spread.
Again the vdW-DF2 binding energies were found to be much stronger than the PBE-GGA values but
still offered no significant improvement over the vdW-DF2 pristine graphene results and do not lie in
the preferred range of values.
5.4.7 Bilayer Graphene with Single Vacancy Defect
During graphene manufacturing, a particular form of graphene produced is bilayer graphene which has
a specific interlayer spacing. In an attempt to study the effect of defects on hydrogen adsorption in
this structure, bilayer graphene in an AB stacking with a SV defect on one of the layers was simulated
for two cases. In the first case, the hydrogen molecule was placed above the defect and between the
two carbon layers and in the second case the hydrogen molecule was placed above the defect as well
as the entire bilayer structure. For the first case, the hydrogen binding energy turned out to be 0.505
eV while the second case resulted in a hydrogen binding energy of -2.824 eV. The first case was clearly
unfavourable for hydrogen adsorption. The second case had a very strong binding energy which was
well outside the preferred range of values and thus would be impractical in creating a reversible storage
process. Furthermore, the bilayer structures consist of two carbon layers in which only one of the layers
participates in hydrogen adsorption on one of its surfaces. This is quite inefficient and drastically reduces
hydrogen density of the overall system. Finally, a bilayer structure with AA stacking falls within the
range of interlayer spacings investigated for the high defect density structures explored in sections 4.4
and 4.5.
5.5 Hydrogen Binding over Multiple Defect Systems
5.5.1 Grain Boundary
Large scale graphene sheets, such as those synthesized from chemical vapor deposition, are usually poly-
crystalline and contain one dimensional defects along grain boundaries. These defects are generally tilt
boundaries and can be thought of as a line of individual point defects [95]. Several such defects consisting
of arrangements of pentagons and heptagons, found to be the most thermodynamically stable among
possible ring structures, have been previously simulated to obtain mechanical properties [109]. One such
system, shown in Figure 5.4 and analogous to the Σ7 grain boundary defect, was selected to simulate the
hydrogen adsorption ability of grain boundaries in graphene. This defect is likely representative of other
similar grain boundary defects which also consist of ring structures. Our previous simulations suggest
that these structures would have hydrogen adsorption abilities similar to other ring structure defects
such as double vacancies. This was confirmed as the resulting binding energy of -0.081 eV was barely
stronger than that of graphene and the point defects (beating the SW penta position by just 0.008 eV)
and similarly outside of the range of values preferred for reversible storage. Thus, it can be reasonably
concluded that while grain boundaries are not detrimental to hydrogen adsorption ability in graphene
sheets, they do not offer much benefit either.

Chapter 5. Hydrogen Storage on Defective Graphene 63
Figure 5.4: Grain boundary defect consisting of 5-7 rings, analogous to Σ7 defect, and adsorbed hydrogenmolecules. Two adjacent supercells are shown to visualize the grain boundaries indicated by the dashedlines. Note the different orientations of the graphene lattice on each side of a grain boundary, indicatingdifferent grains.
5.5.2 Mixed Stone-Wales and Single Vacancy
Both the SW and SV defects were modeled in the same supercell to study the effect of mixed defect
regions. They were placed in close proximity and only separated by a hexagon ring of carbon atoms, as
shown in Figure 5.5. The SW defect penta position was studied, as this position presented the strongest
binding energy after that of the SV in all individual point defect simulations. The binding energy of -
0.545 eV at the penta position showed a significant improvement in binding ability, by a factor of 7.5 over
the same position in the isolated SW defect, due to the presence of the single vacancy. This represents
the highest H2 binding energy amongst all 30 A vacuum spacing single layer simulations. This system
shows that the mixture of single vacancies with other point defects, unlike the mixture of only ring
structure defects found in the grain boundary system, is very beneficial to hydrogen adsorption ability.
5.5.3 Single Vacancy with Metal Decoration
A structure consisting of closely spaced SVs was modeled with double sided metal decoration. Only
half the vacancies anchored nickel atoms as seen in Figure 5.6, thereby ensuring each metal atom had
an adjacent empty vacancy. The SVs themselves were separated from each other by at least a hexagon
of carbon atoms. A hydrogen molecule was in turn adsorbed on each of the nickel atoms. The binding
energy of -0.238 eV for each hydrogen molecule was found to be within the preferred range of values
for practical hydrogen storage. However, it is lower than the value of -1.157 eV found for a similar
system sans defects, simulated in a separate study by Wong et al. [71] . This suggests that the presence
of adjacent SVs decreases the hydrogen binding ability of metal atoms. This is despite the fact that
the metal atoms were anchored in vacancies, which in earlier studies have been shown to increase the
hydrogen binding ability of metal atoms when there are no empty adjacent vacancies [110].

Chapter 5. Hydrogen Storage on Defective Graphene 64
Figure 5.5: Mixed defect system showing single vacancy at the top-left and Stone-Wales in the center.The hydrogen molecule is adsorbed at the penta position in the Stone-Wales defect. The hydrogenbinding energy is significantly higher in this mixed defect system than for either defect in isolation.
5.5.4 Single Vacancy Maximum Hydrogen Density (SVMD) System
A structure with a very high density of SVs, where the vacancies are separated by a minimum of only
one hexagon of carbon atoms, was chosen to represent a defect engineered system for use in hydrogen
storage as shown in Figure 5.7(a). This structure was then packed with the maximum number of
hydrogen molecules which were still able to produce a negative binding energy. In total 11 H2 molecules
were accommodated, which represents 5.81% gravimetric density for hydrogen storage. The change
in the average H2 binding energy with successive addition of molecules to the structure is shown in
Figure 5.8(a). The binding ability of the system rapidly drops after the first four hydrogen molecules,
indicating that each vacancy is quickly stabilized and saturated by about two hydrogen molecules each.
The lowest binding energy of -0.1 eV is just below the preferred range of values for reversible hydrogen
storage. After relaxation, the interlayer spacing had decreased to 2.65 A from the initial 6 A. Nine
of the hydrogen molecules had been split apart and their individual hydrogen atoms were observed to
move closer to carbon atoms, as can be seen in Figure 5.7(b). Most of these individual hydrogen atoms
were now positioned over carbon atoms in the top position but stayed out of chemical bonding range.
The exception was around the vacancy sites, where three hydrogen atoms appear to have moved into
chemical bond range with the three carbon atoms surrounding each vacancy. The graphene structure
itself underwent significant distortion from its flat planar shape as can be seen from Figure 5.7(c).
This suggests that the carbon and hydrogen atoms formed a complex network stable at the decreased
interlayer spacing.
The effect of interlayer spacing was further explored by calculating the average hydrogen binding
energy with different vacuum spacing in the supercell, going from 3A to 7A, the results of which are
presented in Figure 5.9(a). The strongest binding energy was found to be at 3 A, a sharp drop from the
energy at 2.65 A which had been achieved when the supercell dimensions were allowed to vary during
relaxation. There is also a sharp rise in energy when going to 4 A, which displays an unstable positive
average binding energy. Thereafter, the binding energy once again starts to decrease and become stable
upto 7 A, at which point it has even stronger than the energy at 2.65 A.

Chapter 5. Hydrogen Storage on Defective Graphene 65
(a)
(b)
Figure 5.6: Single vacancy defect system with double-sided nickel metal decoration and hydrogenmolecule adsorption: (a) top view and (b) side view. The nickel atoms are anchored over a singlevacancy, while the adjacent vacancy is left undecorated. Although the hydrogen molecule binding en-ergy is still within the preferred range for hydrogen storage, it is weaker than that of the correspondingsystem without vacancies.

Chapter 5. Hydrogen Storage on Defective Graphene 66
(a) (b) (c)
(d) (e) (f)
Figure 5.7: Defect engineered systems for hydrogen stroage: (a) SVMD system prior to hydrogen ad-sorption, (b) SVMD system subsequent to hydrogen adsorption top view and (c) side view. A totalof 11 hydrogen molecules were adsorbed to yield a gravimetric density of 5.81%. Nine of the hydro-gen molecules dissociated into individual atoms. The underlying graphene sheet itself has undergonesignificant structural distoration subsequent to hydrogen adsorption. The SWSVMD system prior toadsorption (d) is also shown, and subsequent to hydrogen adsorption (b) top view and (c) side view.
5.5.5 Stone Wales Single Vacancy Maximum Hydrogen Density (SWSVMD)
System
The mixed SW and SV system investigated previously, seen in Figure 5.7(d), was considered for use
in a defect engineered hydrogen storage system in a manner similar to that of the SVMD system. In
total, 22 H2 molecules were successfully adsorbed, leading to 7.02% gravimetric density for hydrogen.
The change in average H2 binding energy with successive addition of molecules to the structure is shown
in Figure 5.8(b). The energy follows a more linear pattern than the SVMD system and displays fairly
strong hydrogen binding. After relaxation, the interlayer spacing had decreased to 2.65 A from the initial
6 A, similar to the SVMD structure. Twenty of the hydrogen molecules had been dissociated and the
substrate structure of carbon atoms itself was heavily distorted, as can be seen in Figure 5.7(e). Several
of the carbon rings, especially the heptagons in the SW defect, have broken up and carbon atoms have
moved out of their standard sp2 bond range to open up vacancy like gaps. Unlike the SVMD system,
the individual hydrogen atoms did not seem to prefer the top position over carbon atoms and were more
randomly distributed, with most not positioned directly over a carbon atom. The majority of hydrogen
atoms were also well out of covalent bonding range of carbon atoms and positioned in the space between
graphene layers, as seen in Figure 5.7(f). Hence, the whole system consisting of carbon and hydrogen
atoms appears to have rearranged itself to form a stable complex.
The effect of interlayer spacing was further explored by calculating the average hydrogen binding
energy with different vacuum spacing in the supercell, going from 3A to 7A, the results of which are
presented in Figure 5.9(b). This range was selected as these provide a relatively practical range, with

Chapter 5. Hydrogen Storage on Defective Graphene 67
2 4 6 8 10
−0.6
−0.5
−0.4
−0.3
−0.2
−0.1
Number Adsorbed Hydrogen Molecules
Bin
din
gen
ergy
(eV
)per
mole
cule
(a)
0 5 10 15 20−14
−12
−10
−8
−6
−4
−2
Number Adsorbed Hydrogen Molecules
Bin
din
gen
ergy
(eV
)per
mole
cule
(b)
Figure 5.8: Change in average hydrogen binding energy of high defect density systems with increasingnumber of hydrogen molecules: (a) single vacancy (SVMD) system (b) Stone-Wales and single vacancy(SWSVMD) system.
3 A being just below spacing for graphite and spacings beyond 7A reducing volumetric density. The
strongest binding energy was found to be at 7 A, while 3A provides the weakest binding energy.
5.6 Discussion: General Trends Towards Defect Engineering of
Graphene for Hydrogen Storage
In this section, we discuss the general trends in hydrogen binding over individual and mixed defect
systems, identify important parameters which affect hydrogen adsorption ability and suggest a way
towards defect-engineering of graphene for effective hydrogen storage.

Chapter 5. Hydrogen Storage on Defective Graphene 68
3 4 5 6 7
−0.
− .
− .
Interlayer Spacing Å
Bindingenergy(eV)permolecule
(a)
3 4 5 6 7−1
−0.9
−0.8
−0.7
Interlayer Spacing Å
Bindingenergy(eV)permolecule
(b)
Figure 5.9: The effect of interlayer spacing on the average hydrogen binding energy of high defect densitysystems: (a) single vacancy (SVMD) system (b) Stone-Wales and single vacancy (SWSVMD) system.

Chapter 5. Hydrogen Storage on Defective Graphene 69
5.6.1 Individual Defect Systems
Choice of Exchange Functional
The vdW-DF2 results consistently showed stronger binding values and a smaller range of these val-
ues among different sites within a defect than the PBE-GGA results. The adsorption of the hydrogen
molecule itself appeared to be in the form of physisorption, which is typified by the molecule not disso-
ciating and the lack of strong covalent character bonds between the hydrogen and carbon atoms. This
kind of adsorption is dominated by weak interactive van der Waals forces. The vdW-DF2 functional
captures such interactions much better than the plain PBE-GGA. Since van der Waals forces are mostly
attractive except at very close range (at which point Pauli repulsion dominates), their inclusion generally
results in a stronger binding of the hydrogen molecule to the graphene surface. Furthermore, since they
act over a long-range, molecules experience similar levels of interactions regardless of their location in the
studied ring structures. Conversely, the short-range covalent bond forming forces, modeled well by PBE-
GGA, are highly localized and thus small changes in molecule position can cause large changes in the
amount of interaction felt by the molecule and hence a larger variation in binding values for the same
defect. As the vdW-DF2 results are more accurate for physisorbed systems, the following discussion
summarizes key trends based on the this functional’s simulations.
Ring Structure Defects
The SV defect differs from other defective systems because all the other structures consist of convex
polygon rings where the atoms have rearranged themselves to provide each carbon atom with bonds to
three surrounding carbon atoms. On the other hand, the SV defect consists of a non-convex polygon
in which atoms adjacent to the vacancy have bonds to only two other atoms. These differences lead
to different hydrogen binding trends between the two types of defects. For non-SV structures, binding
energy seems to be determined primarily by the distance of the hydrogen molecule from regions of
charge. The highest electron density is found to concentrate around the carbon atoms arranged in rings,
as can be seen from the top-view of charge density for each of the simulated systems (prior to hydrogen
adsorption) in Figure 5.2. These diagrams all display contours of charge density from 0.0015 to 0.35
(number of charge/Bohr-3). The trends for binding energies in relation to the position of the hydrogen
molecule on the defect can be qualitatively understood by carefully analyzing these contours. It can be
observed that top and bridge positions over regions of very high charge have weak binding ability, likely
due to the appreciable Pauli repulsion felt by the hydrogen molecule. This is in fact opposite to the
case of chemisorption of a single hydrogen atom over graphene, where the top position would be most
preferable as it helps stabilize the charge deficient atom [111].
For ring structures (ranging in size from pentagons to octagons), the charge density is observed to
decrease towards the center of the ring. This suggests that hydrogen binding improves in going from
hollow positions in octagons to heptagons to hexagons and finally pentagons, with the last position
showing the most optimal distance from surrounding charge among ring structures. These binding
energy trends hold true within the same defect for different hydrogen molecule positions, but not across
different defect types. For instance, the octagon ring in the DV 585 defect displayed a weaker binding
energy than the pentagon ring in the same defect as expected, yet it showed a stronger binding energy
than the hexagonal and heptagonal positions in the DV 5555-6-7777 defect and in pristine graphene.
This could be due to the different sizes of the same type of ring found in different defects and also due to

Chapter 5. Hydrogen Storage on Defective Graphene 70
the nature of the surrounding rings. Each ring is somewhat distorted from its regular geometric shape,
depending on the type and arrangement of rings around it. All the binding energies for the ring positions
were found to lie between -0.06 and -0.07 eV, with the exception of the pentagon in the SW defect which
produced a slightly lower energy of -0.0727 eV. The 5555-6-7777 defect was the most complex and largest
area defect studied, with regions of several unsymmetrical non-hexagonal rings. Yet the fact that its
binding value results were similar to that of the smaller area defects suggests that the binding energy
in carbon rings is not influenced by the nature of the surrounding rings and the size of the defect area.
Hence, it can be speculated that larger and more complex defects that have been discovered or theorized
in graphene sheets, consisting of arrangements of rings ranging in size from octagons to pentagons and
sp2 bonded carbon atoms, will likely have binding energies similar to those found for the DV defects in
this paper. Binding energies thus seem to be size independent for ring defects.
Single Vacancy Defect
The SV defect on the other hand has quite different characteristics as seen in Figure 5.10. Even though
the range of charge found to be preferable for binding in ring structures is found around the edges of
the vacancy region, the much lower and uneven charge distribution on the carbon atoms adjacent to
the vacancy means that the same kind of trend analysis is not applicable. The missing carbon atom
in the vacancy leaves behind three dangling bonds on its three adjacent atoms. This causes the defect
to undergo a Jahn-Teller distortion which allows two of the adjacent atoms to form a new albeit weak
bond between them, replacing two of the dangling bonds. However, one of the dangling bonds remains
unable to attach to a second atom and leaves the last adjacent atom with a coordination number of two.
As a result, this defect is quite different compared to the other defects studied in this paper, none of
which have dangling bonds. The carbon atom with the dangling bond has a dearth of negative electronic
charge. This is demonstrated in Figure 5.10, which also shows the stronger electron density representing
a weak bond between the other two adjacent atoms. This leads to an expectation that the vacancy defect
will attract the hydrogen molecule strongly so that it can share in the molecule’s cloud of negative charge,
making it the preferred adsorption position for the molecule. The dangling bond nature of the SV defect
can also be observed by examining PDOS graphs of the defect prior to adsorption and comparing it to
that of pristine graphene, as shown in Figure 6.3. When the carbon atoms in a ring are able to bond to
three adjacent atoms, two of their px and py orbitals participate in sp2 hybrid orbitals formed within
the plane of the sheet, while the remaining pz orbitals, oriented perpendicular to the sheet, overlap and
share charge amongst themselves above and below the plane of the sheet. However, when a carbon atom
is not able to bond with three other atoms, its p-orbitals are unable to hybridize or overlap to the same
extent and are more distinctly localized on the atom as a result. This can be seen in Figure 6.3(b), where
the greater number of peaks for the p-orbitals indicates more distinct localized states when compared to
the much smoother curves for pristine graphene in Figure 6.3(a). The unshared charge in these localized
orbitals is then more likely to interact with the hydrogen molecule in comparison to charge on more
highly co-ordinated atoms in ring structures.
The dangling bond atom would prefer to be close to the hydrogen molecule to share in its increased
electronic charge. This could be accomplished by the atom moving out of the plane towards the hydrogen
molecule on the side from which the molecule approached or moving in the opposite direction as was
observed in our simulation. The first option would cause the dangling bond atom to move further
away from its surrounding carbon atoms and give up sharing of charge with them. On the other hand,

Chapter 5. Hydrogen Storage on Defective Graphene 71
Figure 5.10: Top view charge density plot for the single vacancy defect. The three carbon atoms adjacentto the vacancy can be observed to have lower charge density around them in comparison to the rest ofthe carbon atoms in the graphene sheet. The carbon atom with a dangling bond is located just abovethe vacancy in the figure. The other two adjacent atoms have a greater amount of charge betweenthem than the amount of charge between either of them and the dangling bond atom, giving these twoadjacent atoms slightly higher stability than the dangling bond atom.

Chapter 5. Hydrogen Storage on Defective Graphene 72
0
5
10
15
20
25
30
35
-20 -18 -16 -14 -12 -10 -8 -6 -4 -2 0 2 4 6
DO
S
Energy (eV)
C 1sC 2p
(a)
0
5
10
15
20
25
30
35
-20 -18 -16 -14 -12 -10 -8 -6 -4 -2 0 2 4 6
DO
S
Energy (eV)
C 1sC 2p
(b)
Figure 5.11: Projected Density of States (PDOS) of graphene systems prior to hydrogen adsorption: (a)pristine graphene (b) single vacancy defect (SV). The Fermi level is represented by the dashed verticalline. The dangling bond carbon atom in the SV defect has less co-ordination than atoms in the pristinegraphene. Hence, its orbitals have a lower extent of overlap and hybridization, leaving them more distinctand localized. This is visible from the higher number of peaks in the PDOS for the SV defect at allenergies. The unshared charge in the more localized SV defect makes it more attractive for adsorptinga hydrogen molecule.

Chapter 5. Hydrogen Storage on Defective Graphene 73
the latter option allows it to still share in the charge of the graphene sheet while being closer to the
hydrogen molecule and is thus the most stable configuration. Figure 5.12(a) depicts a side-view of the
charge density variation of the vacancy defect. Regular hexagons in pristine graphene, when looked at
from the side, have an elongated bright purple region indicating high charge density, as seen at the left
and right ends of the figure. On the other hand, the single dangling-bond carbon atom has a smaller
circular region of slightly lower and less evenly distributed charge. Furthermore, there is a large gap with
moderately low charge between the dangling bond atom and the regular hexagon at the right end of the
figure, indicating the electronically deficient vacancy region. Figure 5.12(b), shows the cross-sectional
charge density after adsorption of the hydrogen molecule. The dangling bond carbon atom possesses
a larger region of increased electronic density around the atom. Furthermore, the region between the
dangling bond atom and the regular hexagon at the right of the figure and adjacent to the hydrogen
molecule clearly shows greatly increased charge density which was probably drawn from the hydrogen
molecule.
5.6.2 Mixed Defect Systems
Single Hydrogen Molecule Adsorption
The binding ability of the mixed SW and SV defect was found to be surprisingly strong. Since the two
defects individually had the two highest binding energies, mixing them seems to have resulted in an
additive effect. Figure 5.13(a) shows the charge density plot of this system prior to hydrogen adsorption.
The low electron density regions at the single vacancies at the top left and right of the figure (the right
vacancy being part of the next repeating unit of the supercell) and the center of the two heptagons of the
SW defect are clearly visible. The hexagons towards the bottom of the figure have the greatest amount
of high charge (purple color) regions while the hexagons towards the top of the figure, between the two
vacancies and adjacent to a SW heptagon, have greatly reduced regions of low charge. Presumably some
of the charge from the latter hexagons has been transferred to the single vacancies to better stabilize
them. Figure 5.13(b) shows the charge density plot of the system after hydrogen adsorption. The
redistribution of electronic density is now found to be more acute. The region around the pentagon
where the hydrogen molecule is adsorbed has significantly lower charge as does the region around the
other pentagon towards the bottom of the figure (although to a lesser extent). The single vacancies now
show higher charge densities, suggesting that there has been charge transfer from the regions around the
pentagons to the single vacancies. The relatively lower charge density around the hydrogen molecule’s
location would cause it to strongly attract the hydrogen molecule to share in its charge density and would
help explain the high hydrogen binding energy for the system. Therefore, the addition of the hydrogen
molecule has allowed a greater amount of charge redistribution which has made the single vacancy and
hence the entire system more stable.
The results of the mixed SW-SV system and grain boundary system demonstrate that mixed topolog-
ical defect regions are not detrimental to hydrogen adsorption ability and actually have higher hydrogen
binding ability than each isolated individual defect. Yet the mixture of only ring defects, such as that
found in the grain boundary system, provide only a modest improvement which is still below levels of
desired binding ability. The single vacancy on the other hand seems to greatly enhance the binding
ability of ring defects to the required levels. However, its presence is not always beneficial. The reduced
binding ability of the nickel atoms when compared with a defect free system might be due to the adja-

Chapter 5. Hydrogen Storage on Defective Graphene 74
(a)
(b)
Dangling Bond Carbon Atom
Vacancy Region
Dangling Bond Carbon Atom
Vacancy Region
Figure 5.12: Side view of single vacancy (SV) charge density: (a) relaxed SV prior to adsorption and(b) relaxed SV with adsorbed hydrogen molecule. Black filled circles represent carbon atoms, whilewhite filled circles represent hydrogen atoms. Regular hexagons of high charge density usually found ingraphene sheets can be seen on the left and right edges of either diagram. In (a), the dangling bondcarbon atom has a samller region of lower charge than the hexagons and the low charge density of thevacancy region is also visible. In (b), the dangling bond carbon atom has higher charge density equivalentto that of the hexagons and the vacancy region also has visibly increased charge density. This increasedcharge density is likely due to the charge supplied by the hydrogen molecule.

Chapter 5. Hydrogen Storage on Defective Graphene 75
(a)
(b)
Figure 5.13: Charge density plots of the mixed Stone-Wales and single vacancy system: (a) prior tohydrogen adsorption and (b) subsequent to hydrogen adsorption. Single vacancies are visible at the topleft and right of the figures, while the Stone-Wales defect is in the center. There is large redistribution ofcharge after adsorption of the hydrogen molecule (blue atoms), with the regions around the pentagonsof the Stone-Wales defect losing charge to the single vacancies. This lower region of charge then stronglybinds the hydrogen molecule, leading to higher hydrogen binding energies than was the case for eitherdefect by itself.

Chapter 5. Hydrogen Storage on Defective Graphene 76
cent vacancy competing with the metal atom for the hydrogen molecule’s charge and creating a more
energetically unfavorable system overall. This indicates that the presence of nearby vacancies might be
detrimental to the hydrogen adsorption ability of anchored metal systems. Furthermore, it suggests that
it might be more beneficial to construct a structure purely from single vacancies, which provided better
binding ability than the investigated nickel adatoms.
High Defect Density Structures and Gravimetric Density
The results of the SVMD and SWSVMD system simulations demonstrate the potential of defect en-
gineered systems for hydrogen storage. The gravimetric density of the SVMD system (5.81%) is just
above the initial DOE goal of 5.5%. This is achieved with an average binding energy (-0.1 eV) slightly
weaker than the lower limit (-0.2 eV) of binding energy values thought to be required for practical room
temperature storage. Therefore, at room temperature conditions, the gravimetric density will likely
decrease somewhat to just below target values. The SWSVMD system, on the other hand, has a higher
gravimetric density of 7.02%, and its average binding energy (-2.52 eV) is actually much stronger than
the higher end (-0.6 eV) of preferred values. With such a strong binding energy, it was surprising that
the SWSVMD system was unable to accommodate even more hydrogen molecules. This might possibly
be due to crowding of hydrogen molecules and a strong repulsion felt by squeezing additional molecules
into the remaining small gaps and destabilizing the carbon-hydrogen complex that had formed. As
discussed, these values will likely decrease at room temperature and probably reach desired values.
The designed SVMD and SWSVMD systems thus will likely be able to store hydrogen to a level
which is within the ballpark of the DOE targets, with the latter providing higher levels of storage. Yet,
they will fall short of the targets in real world conditions as the effects of temperature and fluctuating
environmental conditions which cannot be easily modeled become a factor. Furthermore, it is noted here
that these results are for the material alone and in a practical storage device with a container and various
other components, the hydrogen mass fraction in the whole system will decrease even further. In order
to provide a boost in storage ability and a safety factor beyond the targets, additional modifications
through the utilization of curvature effects and high pressure environments should allow such defect
engineered systems to comfortably meet requirements. This would be achievable without the need for
cumbersome and as yet undemonstrated atomic metal decoration.
Clearly interactive effects between graphene layers have played a role in stabilizing the hydrogen
atoms, which are mostly located in the voids between successive graphene layers. The change in hy-
drogen binding energy with interlayer spacing also points to a possible method for reversible storage
by controlling interlayer spacing. Certain spacings are more favorable to adsorption and could be used
when hydrogen is loaded into and stored in the system. Others are less favorable and likely help cause
association and release of hydrogen molecules which could be used during unloading of hydrogen from
the storage system. For instance, for the SVMD system, the interlayer spacing could be changed to 4
A during unloading to desorb hydrogen and changed to 7 A during loading to help adsorb hydrogen
(although 3 A provides even stronger binding energy useful for adsorption, it is too close to 4 A and it
might be difficult to maintain a 1 A gap). For the SWSVMD system, 7 A would be best for loading and
3 A would be best for unloading. The control of interlayer spacing through the use of spacer molecules or
piezoelectric crystals could be implemented through methods proposed by Tozzini et al. [13]. However,
the stability and behavior of the significantly distorted structures during loading and unloading cycles,
especially the SWSVMD system which seemed to form a new complex with the hydrogen atoms, might

Chapter 5. Hydrogen Storage on Defective Graphene 77
be an issue during practical operation and needs to be further investigated. It should be noted though,
that the out of plane displacements and curvature introduced in the high defect density structures does
not likely impeded hydrogen adsorption ability as curvature as been shown to increase hydrogen binding
ability [?]. Nevertheless, mixed defect graphene sheets will undoubtedly prove to be a useful tool in the
design and implementation of practical hydrogen storage systems.
5.7 Summary
Commercially prepared low cost graphene is bound to contain topological defects. With significant
attention on graphene as a hydrogen storage medium, this paper analyzed the role of topological defects
on its hydrogen binding ability and their possible use in defect engineering a better storage system. The
ability to adsorb a hydrogen molecule was examined for five types of individual point defects: Stone-
Wales, single vacancy and three different double vacancy defects. Two types of density functionals were
utilized for all point defect simulations, PBE-GGA and the more recent vdW-DF2 functional which better
models long range van der Waals forces. The vdW-DF2 simulations in general resulted in a stronger
hydrogen binding ability than PBE-GGA, demonstrating that the vdW forces are a significant factor in
hydrogen molecule adsorption and should be accounted for to accurately model this phenomenon. The
vdW-DF2 results also showed a smaller variation in binding energies for different H2 binding sites than
the PBE-GGA computations. The single vacancy defect had the strongest binding value and had only
value which fell within the range desirable for reversible hydrogen adsorption. The Stone-Wales and
double vacancy defects did not display significant improvement in binding ability over that of pristine
graphene, however they were shown to not have a detrimental effect on hydrogen storage ability. Defects
consisting of various planar carbon rings ranging in size from pentagons to octagons, such as the Stone-
Wales and double vacancy defects, were found to have similar hydrogen binding values and the binding
value for a particular site within such a ring was found to be independent of the nature of the surrounding
rings or defect size range.
Subsequent to investigation of isolated defects, a number of multiple defect systems were modeled
using the vdW-DF2 functional only. A grain boundary system analogous to a Σ7 grain boundary defect
and consisting of pentagon and heptagon rings was found to have a hydrogen binding energy similar
to that of the Stone-Wales and double vacancy ring defects. A metal decorated system, consisting
of vacancy anchored nickel adatoms with an adjacent undecorated vacancy, was simulated and it was
found that the presence of an undecorated vacancy decreased the binding ability of the nickel adatom
when compared to a system with no vacancies. On the other hand, the presence of a single vacancy
was found to significantly enhance the hydrogen binding ability of an adjacent Stone-Wales defect and
move its hydrogen binding energy into the range desirable for reversible hydrogen adsorption. Two
high defect density systems, the first consisting of only closely spaced single vacancies and the second
consisting of closely spaced single vacancies and Stone-Wales defects, were then designed and tested for
their ability to bind a large number of hydrogen molecules. The first system managed to produce a
maximum gravimetric density of 5.81% while the latter achieved 7.02%. These results were achieved
at relatively small graphene interlayer spacings, with both systems showing the best average hydrogen
binding energy at 3A spacing and weaker binding ability for both smaller and larger spacings. Hence,
defect engineering of graphene systems shows great potential in meeting hydrogen storage requirements
while avoiding the need for the potentially more challenging metal decoration that is proposed currently.

Chapter 6
Hydrogen Storage on
Two-Dimensional Carbon Allotropes
6.1 Introduction
In recent years, the numerous environmental issues presented by fossil fuels have acted as a major driving
force for the research community to place focus on greener and more sustainable alternatives. Among
the many energy sources being investigated at the moment are hydrogen fuels as they do not create any
carbon emissions when used to produce energy [112]. One obstacle that researchers face with regards
to hydrogen fuels is finding a method to effectively store hydrogen prior to fuel consumption. The US
Department of Energy has set a target to achieve 5.5 wt% gravimetric density for hydrogen storage in
light-duty vehicles by 2015 [19]. Conventional technologies have been unable to meet these targets in
a safe and practical manner [113]. Hydrogen adsorption on substrates has been explored as a possible
route towards meeting these storage goals [14], including the use of materials such as metal organic
frameworks [15], carbon nanotubes [16] and boron nitride sheets [17] and fullerenes [18]. Among carbon
based substrate materials, two-dimensional graphene has been found to be particularly promising [114].
Graphene’s high specific surface area in addition to its unique mechanical and electronic properties
allow it be an ideal substrate which can be modified through metal decoration for increased hydrogen
adsorption [13]. Since the discovery of graphene several other two dimensional carbon structures, such
as graphyne [115, 116] and graphdiyne [117], have been synthesized or theorized and show promise for
hydrogen adsorption applications. This work looked at the hydrogen adsorption ability of graphyne,
graphenylene and four newly theorized and as yet unnamed two-dimensional carbon allotropes using
the LDA, GGA and vdW-DF2 functionals. The lithium binding ability and hydrogen binding ability
on lithium decorations for each of these structures was investigated, with lithium being selected for
metal decoration as it is the lightest known metal and so would help increase relative hydrogen mass in
the system. Finally, this study tried to maximize hydrogen gravimetric density by adsorbing multiple
hydrogen molecules on the lithium-decorated structures.
78

Chapter 6. Hydrogen Storage on Two-Dimensional Carbon Allotropes 79
6.2 Literature Review
In a study by Zhang et al.[109] lithium decorated graphyne was predicted to have a gravimetric density
of 15.15 wt%, higher than that of graphene. In 2013, Lu et al. [118] theoretically predicted four new
two-dimensional carbon structures which they propose will be mechanically stable at room temperature.
These structures, along with graphyne and another proposed carbon allotrope called graphenylene [119],
have different carbon bond hybridizations and electron density distributions than graphene. This may
give them potential to better interact with and bind metal adatoms and hydrogen molecules, as graphyne
has already been predicted to do [109].
The present study investigated the hydrogen storage ability with metal decoration of the six carbon
allotropes discussed by Lu et al. [118], which according to the naming convention followed by them are:
C65, C64 (graphenylene), C63, C62 (graphyne), C31 and C41. The C6n structures consist of hexagons
connected by n-sided polygons, going from a pentagon for n=5 to a triangle for n=3 and a straight
chain of two carbon atoms for n=2. Similarly the C31 and C41 structures consist of triangles and
squares connected by single carbon C1 units. Three of the new structures (C65, C63 and C41) are
considered more stable than graphyne and the fourth (C31) is just barely less stable.
Another issue associated with most theoretical predictions of hydrogen adsorption on metal-decorated
carbon-based structures is that they utilize density functional theory (DFT) with local density approxi-
mation (LDA) and generalized gradient approximation (GGA) functionals. For example, the previously
mentioned study by Zhang et el. [109] of lithium decorated graphyne utilized LDA. However, the
LDA functional can be quite inaccurate for such complex systems and will often overpredict adsorption
strength. On the other hand, while the GGA functional models covalent type forces well, it poorly rep-
resents van der Waals (vdW) interactions. Such vdW interactions are significant in describing the weak
physisorption type of bonding typical of molecular hydrogen adsorption on carbon substrates [76, 77]
and the interaction between neighboring metal atoms especially at higher coverages [77]. The more
recently implemented vdW-DF2 [85] functional is said to better account for vdW forces [120] and so
should provide more accurate adsorption energies. Hence, this study compares theoretical predictions
for lithium and hydrogen adsorption energies using the LDA, GGA and vdW-DF2 functionals for each
simulation.
6.3 Computational Details
The various carbon allotrope systems were studied using first principles calculations through density
functional theory (DFT) as implemented using the plane-wave pseudopotential approach in Quantum
Espresso [26]. In order to ascertain accuracy and the effect of different functionals, three electron
exchange functional types were used. The local density approximation (LDA) functional was described
using the Perdew-Wang method [121]. The generalized gradient approximation (GGA) functional was
described using the Perdew-Burke-Ernzerhof (PBE) [84] method. The vdW-DF2 functional [85] was
used to better describe van der Waals forces. This functional was used instead of the earlier vdW-DF
[86] for increased accuracy in estimating equilibrium separations, H2 bond strengths and van der Waals
attraction at intermediate separations longer than equilibrium ones [85]. Ultrasoft pseudopotentials
were used for GGA and vdW-DF2 calculations, while norm-conserving pseudopotentials were used for
the LDA calculations. The kinetic energy cutoff value was set to 60 Ry (1 Ry∼=13.606 eV) for the

Chapter 6. Hydrogen Storage on Two-Dimensional Carbon Allotropes 80
wave functions and to 600 Ry for the charge density. The Brillouin zone was sampled using a 8× 8× 1
Monkhorst-Pack [60] k-point grid and Methfessel-Paxton [87] smearing of 0.01 Ry [88]. The supercell
and atomic positions were optimized using the conjugate gradient (CG) algorithm. The total energy
convergence was converged to within less than 5 meV/atom. Each of the structures were modeled using
periodic supercells of 48 carbon atoms, except for the C65 supercell which had 40 carbon atoms. Each
system had a vacuum layer thickness of more than 30 A.
The average binding energy for a metal atom was calculated through the following equation:
Eb = −[Ecarbon+nmetal − (Ecarbon + nEmetal)]/n (6.1)
where Ecarbon+nmetal is the total energy of the metal decorated carbon allotrope system, Ecarbon is the
energy of the carbon allotrope sheet alone, Emetal is the total energy of the free metal adatom and n
corresponds with the number of metal adatoms.
Consequently, the average binding energy for hydrogen adsorption on the lithium-decorated carbon
allotropes can be calculated through the following equation:
Eb = −[Emetal−carbon+iH2 − (Emetal−carbon + iEH2)]/i (6.2)
where Emetal−carbon+iH2 is the total energy of the metal decorated carbon allotrope system with hydrogen
adsorbed, Emetal−carbon is the total energy of the metal decorated carbon allotrope sheet, EH2 is the
total energy of the free H2 molecule and i corresponds to the number of H2 molecules. A positive binding
energy in the previous two equations indicates a stable system configuration.
The charge density differences were obtained from the following equation:
∆ρ = ρmetal−carbon+iH2 − (ρmetal−carbon + ρiH2) (6.3)
where ρmetal−carbon+iH2 is the charge density of the metal decorated carbon allotrope system with
hydrogen adsorbed, ρmetal−carbon is the charge density of the metal decorated carbon allotrope sheet
and ρiH2 is the charge density of the iH2 molecules in their adsorbed positions.
6.4 Results and Discussion
6.4.1 Metal Adsorption
As previously reported, metal decoration on graphene greatly enhances its limited hydrogen adsorption
ability as the hydrogen molecules bind to the metal atoms rather than the carbon substrate [13]. Hence,
double sided lithium decoration was conducted for each carbon substrate to increase the maximum
possible hydrogen storage ability. Lithium was selected as the metal adatom as it is the lightest metal
and hence it would create a relatively lower non-hydrogen mass fraction in the system. The multiple
adsorption positions and system configurations investigated are illustrated in Figure 6.1. The adsorption
positions are above the center of various polygon shapes formed by carbon atoms in the plane of the
various structures; these include a triangle site for the C31 surface, a square site for C41, a hexagon site
for C62, hexagon and triangle sites for C63, hexagon and square sites for C64 and hexagon and pentagon
sites for C65. Generally positions in the large hollow rings of several of the structures (such as in the

Chapter 6. Hydrogen Storage on Two-Dimensional Carbon Allotropes 81
a) b) c) d) e)
f) g) h) i)
Figure 6.1: Substrate structures and hydrogen adsorption sites of the six studied two-dimensional carbonallotropes with double-sided lithium decoration: a) C31; b) C41; c) C62; d) C63 hexa; e) C63 tri; f) C64
hexa; g) C64 square; h) C65 hexa; i) C65 penta.

Chapter 6. Hydrogen Storage on Two-Dimensional Carbon Allotropes 82
C31
C41
C62 xa
C64-square
C64-hexa
C65-penta
C65-hexa
1
2
3
4
BindingEnergy(eV)
vdW-DF2
PBE-GGA
LDA
Figure 6.2: Average metal binding energies (eV/atom) at multiple sites for the six studied two-dimensional carbon allotropes with double-sided lithium decoration
C65 C41 C63 C64 C62 C31Hexa Penta Square Hexa Tri Hexa Square Hexa Tri
LDA 3.348 3.341 2.678 2.524 2.261 2.688 2.678 2.462 0.964GGA 2.538 2.526 2.106 2.121 1.869 2.225 2.113 2.015 0.687vdW-DF2 2.203 2.210 1.775 1.791 1.618 1.859 1.798 1.696 0.420
Table 6.1: Average lithium adsorption energy (eV) for each two-dimensional carbon allotrope and ad-sorption position. Note the bulk cohesive energy for lithium is 1.63 eV. All structures except C31 posseslithium binding energy greater than the cohesive energy and this should prevent metal atom agglomer-ation.
center of C64) were not investigated as they were presumed to produce weak lithium binding due to
the large distance from surrounding atoms, based on previous work with graphene systems with similar
large hollow spaces [93]. The lithium binding energies for these systems are displayed in Table 6.1 and
Figure 6.2 for easy comparison. All of the positions show positive stable binding energies, indicating that
double sided lithium decoration is physically feasible. Furthermore, all structures except C31, display
lithium binding energies greater than the cohesive energy for bulk lithium (1.63 eV) and so should
have well dispersed lithium atoms which avoid clustering. The C31 structure stands out by having a
metal binding energies significantly below the others. In fact, its binding energy values (0.964, 0.687
& 0.420 eV for LDA, GGA and vdW-DF2 respectively) are below the bulk cohesive energy, indicating
that lithium atoms are likely to cluster into agglomerates by migrating across the C31 surface. Adatom
clustering due to low metal binding energy has been a problem in previous metal decoration systems
[101]. Therefore, our results show that the studied C31 is not a good candidate for practical hydrogen
storage. Nevertheless, it may still be possible to prevent lithium clustering by anchoring the metal
adatoms on a vacancy, as has been previously suggested for other systems [101]. Overall, these results
suggest that the remaining allotropes are more viable candidates for use in a practical storage device.
The Li binding energies for the C65 allotrope are the highest among the studied structures (from
3.348 eV with LDA at its strongest down to 2.203 eV with vdW-DF2), while the remaining allotropes

Chapter 6. Hydrogen Storage on Two-Dimensional Carbon Allotropes 83
show more or less similar binding energies (with the exception of C31 as discussed previously). For all
allotropes, a specific pattern can be observed for the energies produced when using different exchange
correlation functionals. The LDA functional consistently produces the highest lithium binding energy,
followed by the GGA functional and the vdW-DF2 functional produces the lowest binding energy for each
allotrope system. The vdW-DF2 functional is known to have a stronger repulsion for electron exchange
effects than PBE GGA [122] and this is likely contributing to its relative lower metal adsorption energies.
It is interesting to note that all the GGA and vdW-DF2 lithium binding energies are stronger than the
corresponding lithium binding energies for double sided decoration on graphene [71], suggesting metal
decoration for these structures might be more favorable than for graphene.
In order to understand the nature of bonding in the systems, the projected density of states (PDOS)
for each of the metal decorated carbon allotropes simulated with the vdW-DF2 functional are presented
in Figure 6.3. For structures with multiple adsorption positions, only one PDOS diagram is shown for
the position with the strongest binding energy as the other positions are likely to have very similar
states. The carbon substrates clearly show sp hybridization within the carbon sheet where the carbon
s and p shell peaks overlap in each diagram. The lithium atoms have very localized peaks which
overlap with carbon peaks to some degree in all the structures and so there is likely some degree of
hybridization between the lithium orbitals and surrounding carbon orbitals. The C65 structure shows
the highest degree of hybridization as the two lithium peaks line up very well with corresponding carbon
peaks; in fact the red carbon p-orbital peak which overlaps the rightmost green lithium peak is barely
visible. This indicates a strong degree of hybridization for the C65 structure and explains its stronger
lithium binding energies. The C65 structure also has the fewest zero state energy regions or number
of deep valleys which are close to zero value in density of states, indicating it has a greater degree of
delocalization of the electrons which are shared well amongst the system atoms and demonstrates that
the lithium atoms have integrated well into the substrate system. Conversely, the C31 structure displays
the greatest number of deep valleys and has several energy regions with zero or near zero states. This
indicates a greater degree of localization of electrons on atoms and decreased charge sharing within the
system, indicating that the lithium adsorption is less favorable for the C31 system configuration. The
PDOS diagrams also demonstrate that none of the lithium adsorbed structures have a band gap, unlike
the bare substrates where the C62 and C64 structures have small energy band gaps indicating they are
semiconductors [118]. On the other hand, the adsorption of lithium seems to have metalized all the
allotropes which all now display conductor like PDOS.
6.4.2 Hydrogen Adsorption
Following lithium adsorption, a hydrogen molecule was adsorbed on each lithium atom for all the carbon
allotrope structures. The average hydrogen molecule binding energy (eV/H2) results are given in Table
6.2. The optimized configurations of the adsorbed hydrogen molecules for each position can be seen
in Figure 6.1. Unlike the lithium adsorption simulations, there is no clear pattern among the binding
energies produced by the different exchange correlation functionals for hydrogen adsorption. In most
cases (seven out of nine) the LDA functional produces the highest binding energy while the lowest binding
energies are almost equally split between GGA and vdW-DF2 functionals. Overall, the C31 allotrope
displays much stronger binding energy than the other structures, opposite to its behavior for lithium
adsorption, as can be seen in Figure 6.4 for easy comparison. As the Li decorated C31 structure was found
to be relatively less stable (with a lithium binding energy even less than bulk lithium’s cohesive energy),

Chapter 6. Hydrogen Storage on Two-Dimensional Carbon Allotropes 84
0
5
10
15
20
25
30
35
-20 -10 0
DO
S
Energy (eV)
C sC p
Li
0
5
10
15
20
25
30
35
-20 -10 0
Energy (eV)
C sC p
Li
0
5
10
15
20
25
30
35
-20 -10 0
DO
S
Energy (eV)
C sC p
Li
0
5
10
15
20
25
30
35
-20 -10 0
Energy (eV)
C sC p
Li
0
5
10
15
20
25
30
35
-20 -10 0
DO
S
Energy (eV)
C sC p
Li
0
5
10
15
20
25
30
35
-20 -10 0
Energy (eV)
C sC p
Li
(a) (b)
(c) (d)
(e) (f)
Figure 6.3: Projected density of states (PDOS) for the lithium decorated two-dimensional carbon al-lotropes from simulations using the vdW-DF2 functional: a) C31; b) C41; c) C62; d) C63; e) C64; f) C65.There is evidence of sp hybridization within the carbon sheet and hybridization between the lithiumand carbon atoms. The C65 structure displays the greatest degree of hybridization and electron sharingwhile the C31 structure displays the highest localization of electrons.
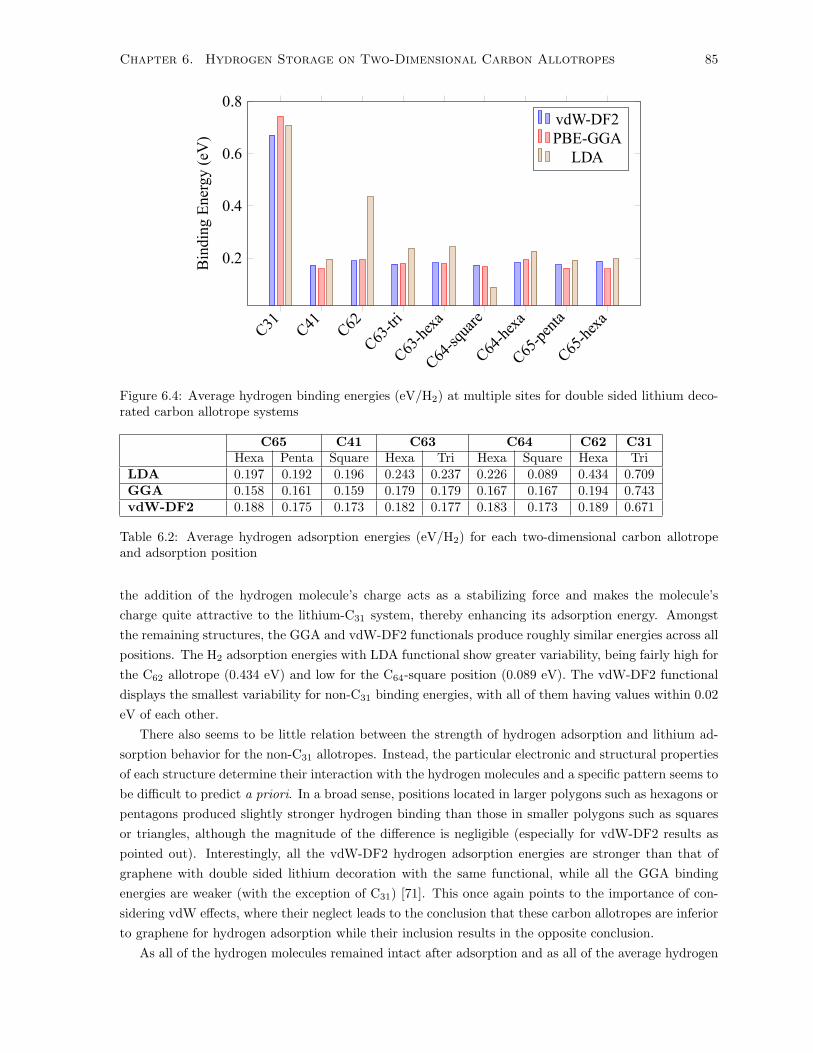
Chapter 6. Hydrogen Storage on Two-Dimensional Carbon Allotropes 85
C31
C41
C62
C63-tri
C63-hexa
C64-square
C64-hexa
C65-penta
C65-hexa
0.2
0.4
0.6
0.8
BindingEnergy(eV)
vdW-DF2
PBE-GGA
LDA
Figure 6.4: Average hydrogen binding energies (eV/H2) at multiple sites for double sided lithium deco-rated carbon allotrope systems
C65 C41 C63 C64 C62 C31Hexa Penta Square Hexa Tri Hexa Square Hexa Tri
LDA 0.197 0.192 0.196 0.243 0.237 0.226 0.089 0.434 0.709GGA 0.158 0.161 0.159 0.179 0.179 0.167 0.167 0.194 0.743vdW-DF2 0.188 0.175 0.173 0.182 0.177 0.183 0.173 0.189 0.671
Table 6.2: Average hydrogen adsorption energies (eV/H2) for each two-dimensional carbon allotropeand adsorption position
the addition of the hydrogen molecule’s charge acts as a stabilizing force and makes the molecule’s
charge quite attractive to the lithium-C31 system, thereby enhancing its adsorption energy. Amongst
the remaining structures, the GGA and vdW-DF2 functionals produce roughly similar energies across all
positions. The H2 adsorption energies with LDA functional show greater variability, being fairly high for
the C62 allotrope (0.434 eV) and low for the C64-square position (0.089 eV). The vdW-DF2 functional
displays the smallest variability for non-C31 binding energies, with all of them having values within 0.02
eV of each other.
There also seems to be little relation between the strength of hydrogen adsorption and lithium ad-
sorption behavior for the non-C31 allotropes. Instead, the particular electronic and structural properties
of each structure determine their interaction with the hydrogen molecules and a specific pattern seems to
be difficult to predict a priori. In a broad sense, positions located in larger polygons such as hexagons or
pentagons produced slightly stronger hydrogen binding than those in smaller polygons such as squares
or triangles, although the magnitude of the difference is negligible (especially for vdW-DF2 results as
pointed out). Interestingly, all the vdW-DF2 hydrogen adsorption energies are stronger than that of
graphene with double sided lithium decoration with the same functional, while all the GGA binding
energies are weaker (with the exception of C31) [71]. This once again points to the importance of con-
sidering vdW effects, where their neglect leads to the conclusion that these carbon allotropes are inferior
to graphene for hydrogen adsorption while their inclusion results in the opposite conclusion.
As all of the hydrogen molecules remained intact after adsorption and as all of the average hydrogen

Chapter 6. Hydrogen Storage on Two-Dimensional Carbon Allotropes 86
(a)
(b)
Figure 6.5: Charge density difference isosurfaces for (a) C64-hexa and (b) C63-hexa systems. Yellowindicates regions of charge gain, blue indicates regions of charge loss, green indicates lithium atoms andred indicates hydrogen atoms. The isosurfaces show clear polarization around the hydrogen molecules.
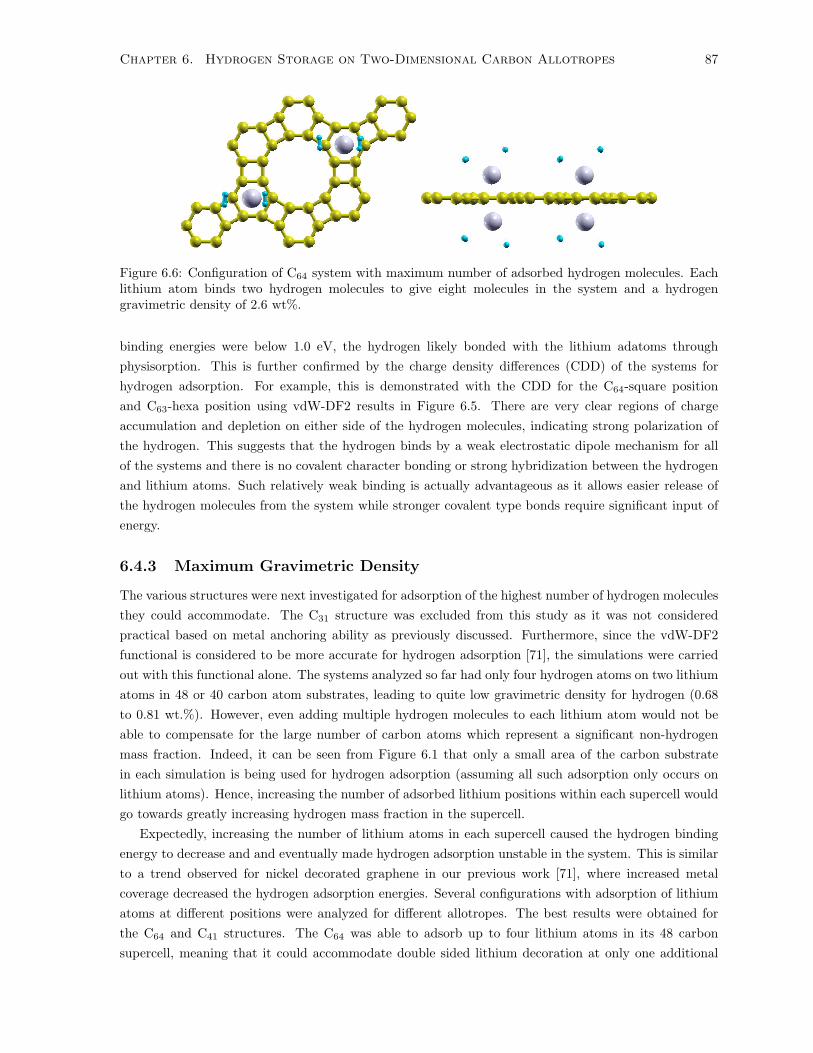
Chapter 6. Hydrogen Storage on Two-Dimensional Carbon Allotropes 87
Figure 6.6: Configuration of C64 system with maximum number of adsorbed hydrogen molecules. Eachlithium atom binds two hydrogen molecules to give eight molecules in the system and a hydrogengravimetric density of 2.6 wt%.
binding energies were below 1.0 eV, the hydrogen likely bonded with the lithium adatoms through
physisorption. This is further confirmed by the charge density differences (CDD) of the systems for
hydrogen adsorption. For example, this is demonstrated with the CDD for the C64-square position
and C63-hexa position using vdW-DF2 results in Figure 6.5. There are very clear regions of charge
accumulation and depletion on either side of the hydrogen molecules, indicating strong polarization of
the hydrogen. This suggests that the hydrogen binds by a weak electrostatic dipole mechanism for all
of the systems and there is no covalent character bonding or strong hybridization between the hydrogen
and lithium atoms. Such relatively weak binding is actually advantageous as it allows easier release of
the hydrogen molecules from the system while stronger covalent type bonds require significant input of
energy.
6.4.3 Maximum Gravimetric Density
The various structures were next investigated for adsorption of the highest number of hydrogen molecules
they could accommodate. The C31 structure was excluded from this study as it was not considered
practical based on metal anchoring ability as previously discussed. Furthermore, since the vdW-DF2
functional is considered to be more accurate for hydrogen adsorption [71], the simulations were carried
out with this functional alone. The systems analyzed so far had only four hydrogen atoms on two lithium
atoms in 48 or 40 carbon atom substrates, leading to quite low gravimetric density for hydrogen (0.68
to 0.81 wt.%). However, even adding multiple hydrogen molecules to each lithium atom would not be
able to compensate for the large number of carbon atoms which represent a significant non-hydrogen
mass fraction. Indeed, it can be seen from Figure 6.1 that only a small area of the carbon substrate
in each simulation is being used for hydrogen adsorption (assuming all such adsorption only occurs on
lithium atoms). Hence, increasing the number of adsorbed lithium positions within each supercell would
go towards greatly increasing hydrogen mass fraction in the supercell.
Expectedly, increasing the number of lithium atoms in each supercell caused the hydrogen binding
energy to decrease and and eventually made hydrogen adsorption unstable in the system. This is similar
to a trend observed for nickel decorated graphene in our previous work [71], where increased metal
coverage decreased the hydrogen adsorption energies. Several configurations with adsorption of lithium
atoms at different positions were analyzed for different allotropes. The best results were obtained for
the C64 and C41 structures. The C64 was able to adsorb up to four lithium atoms in its 48 carbon
supercell, meaning that it could accommodate double sided lithium decoration at only one additional

Chapter 6. Hydrogen Storage on Two-Dimensional Carbon Allotropes 88
Figure 6.7: Configuration of C41 system with maximum number of adsorbed hydrogen molecules. Eachlithium atom binds three hydrogen molecules to give twenty four molecules in the system and a hydrogengravimetric density of 7.1 wt%.
position (another hexa position) compared to the earlier simulation. Each of the lithium atoms was able
to adsorb only two hydrogen molecules to give a total of eight hydrogen molecules in the system, as seen
in Figure 6.6, which produced a hydrogen gravimetric density of 2.6 wt.%. The average binding energy
per molecule for these 8 hydrogen molecules was 0.147 eV, a slight decrease from 0.183 eV binding energy
for the initial system with lithium adsorbed at only one position.
The C41 structure was able to adsorb lithium atoms at three additional positions within its 48 atom
supercell, giving it a total of 8 adsorbed lithium atoms. Each of these in turn were able to adsorb
a maximum of 3 hydrogen molecules, resulting in a total of 24 hydrogen molecules being successfully
adsorbed in the supercell, as seen in Figure 6.7. This produced a hydrogen gravimetric density of 7.12
wt.%, by far the highest of any of the carbon allotrope structures studied and the only one to exceed the
DOE target of 5.5 wt.%. The average hydrogen binding energy per molecule was reduced to 0.087 eV, a
marked decrease from the 0.173 eV energy for the initial single site adsorption case. Although the C41
structure’s gravimetric density is lower than the extremely high density of 15.15 wt% reported by Zhang
et al.[109], it should be noted that the previous study used the LDA functional which is less accurate
than the vdW-DF2 functional we have utilized and often overpredicts binding energies. Indeed, in a
previous study we have reported that using the newer vdW-DF2 functional produces drastically lower
hydrogen gravimetric density for graphene (6.12 wt.% at best) compared to earlier studies which used
LDA (with a value reported up to 16 wt.%) [71]. Hence, the C41 structure demonstrates higher possible
hydrogen gravimetric density than graphene. This also demonstrates the importance of selecting a
proper exchange correlation functional which can represent weak van der Waals interactions for molecular
hydrogen systems.
The geometry of the C41 structure likely plays a role in its outstanding performance. The structure
has less large open hollow spaces compared to the other allotropes, allowing for more efficient packing of

Chapter 6. Hydrogen Storage on Two-Dimensional Carbon Allotropes 89
its square lithium adsorption sites within a certain area. Yet the lithium adsorption sites are not too close
to each other, as in the adjacent hexa sites of the C64 structure, which can cause less stable hydrogen
adsorption as well as impose geometrical constraints on hydrogen molecule packing. Hence, the C41
carbon allotrope seems to have a balanced structure with potential to be used in a practical hydrogen
storage device. It should be noted the stated hydrogen gravimetric density is its theoretical best for the
allotrope medium and in real life conditions and as part of a wider system the overall figure will likely
drop somewhat. However, the structure will still likely produce hydrogen density in the ballpark of the
DOE target value. Furthermore, the storage capacity of the structure may be even further enhanced by
effects such as the presence of vacancies and other topological defects, which tend to increase hydrogen
storage capability in graphene systems [93], and would be a good candidate for further investigation.
6.5 Summary
The hydrogen storage capacity of six theorized two-dimensional carbon allotropes (C65, C64, C63, C62,
C31 and C41) was investigated using density functional theory. Multiple positions on the allotrope
structures were tested for double sided lithium decoration using LDA, GGA and vdW-DF2 functionals.
Subsequently, the adsorption energy of a single hydrogen molecule on each lithium atom at these positions
was determined using the same three functionals. All the structures were able to successfully bind
lithium atoms with adsorption energies stronger than bulk lithium cohesive energy, with the exception
of the C31 structure which had lithium adsorption energies significantly lower than the other allotropes.
The remaining allotropes showed roughly similar lithium adsorption energies, with the C65 structure
possessing the strongest binding energies. The vdW-DF2 functional resulted in the lowest lithium
binding energies for all structures followed by the GGA functional, while the LDA functional produced
the highest binding energies for all structures. For hydrogen adsorption, all of the structures were again
able to successfully bind hydrogen molecules. The GGA and vdW-DF2 hydrogen adsorption energies for
all of the allotropes, except C31, were roughly similar, while the LDA functional produced more widely
fluctuating though generally stronger binding energies. In contrast to it’s lithium binding energies,
the C31 structure had significantly stronger hydrogen binding energies than the other allotropes. The
maximum possible hydrogen adsorption capacity of each carbon allotrope, other than C31, was then
examined using the vdW-DF2 functional alone. The C41 allotrope produced the highest hydrogen
gravimetric density at 7.12 wt%, better than that of metal decorated graphene, and was the only one to
exceed the DOE hydrogen storage target.

Chapter 7
Conclusion and Future Work
7.1 Summary and overall contribution
This work aimed to use first princples based Density Functional Theory (DFT) to study the possible
use of nanomaterials in addressing the issues of fossil fuel based energy systems through applications in
sustainable hydrogen production and storage.
Hydrogen production from water was looked at by using two-dimensional (2-D) molybdenum disulfide
(MoS2) as a catalyst for water dissociation in Chapter 3. This was accomplished by locating the active
sites for water (H2O) adsorption on the edge terminations of MoS2, studying the water dissociation
reaction on each edge using nudged elastic band method (NEB) and obtaining activation free energy
barriers and rate constant, studying the behaviour of a water molecule on the most favorable MoS2 edge
using finite temperaturab-initio molecular dynamics (AIMD) and using metadynamics biased AIMD
to explore reaction mechanisms for water adsorption and dissociation on the most favorable edge and
obtain free energy reaction barriers.
Hydrogen storage was looked at through adsorption on carbon substrates in Chapters 4, 5 and 6.
In Chapter 4, metal decorated graphene was studied by finding the adsorption energies of eight metals
(Al, Li, Na, Ca, Cu, Ni, Pd, Pt) on graphene with single and double sided decoration, the adsorption
energies of hydrogen on each double sided metal decoration system, the effect of varying metal coverage
on hydrogen adsorption energies and maximum possible hydrogen gravimetric density. In Chapter 5,
defective graphene was studied by finding hydrogen adsorption energies on five point defects (Stone-
Wales (SW), single vacancy (SV) and 585, 555-77 and 5555-6-7777 double vacancies (DV)), hydrogen
adsorption energies on mixed defect systems (a grain boundary, a metal-decorated SV with adjacent SV
and a mixed SV-SW system) and maximum possible hydrogen gravimetric density on two high defect
density systems (consiting of SW-SV and SV-SV mixtures). In Chapter 6, six two-dimensional carbon
allotropes other than graphene were studied by finding the adsorption energies for lithium for each
system with double-sided decoration, the adsorption energies of hydrogen on each double sided metal
decoration system and the maximum possible hydrogen gravimetric density.
The main conclusions of this work are the following:
• The Mo-edge termination of the 2-D MoS2 sheet is its only edge which successfully adsorbs the
H2O molecule in a stable configuration.
90

Chapter 7. Conclusion and Future Work 91
• The Mo-edge termination of 2-D MoS2 dissociates water spontaneously at a room temperature
with a negligible free energy activation barrier and very high reaction rate constant. The reaction
prefers to proceed through cleaving of the O-H bond in H2O, with both OH and H adsorbing on
the catalyst surface but may also proceed by release of both H atoms of H2O to directly form H2
with only O adsorbing on the catalyst surface.
• The effect of van der Waals forces on adsorption of energies of weakly interacting processes such
as H2 physisorption is significant and GGA functionals utilized in previous first principles are
inadequet for describing these interactions
• Light metals have weak hydrogen binding ability when adsorbed on graphene. Nickel is one of the
best metals for graphene decoration with regards to reversible hydrogen storage.
• Previous metal decorated graphene studies overestimated the maximum hydrogen gravimetric den-
sity. Nickel decorated graphene was able to achieve a maximum hydrogen gravimetric density of
6.12 wt.%.
• Topological defects on graphene are not detrimental to hydrogen storage ability. SV defects and
mixed defects involving SVs significantly enhance hydrogen storage ability of graphene.
• Graphene can be defect engineered to make a high defect density system with a maximum hydrogen
gravimetric density higher than metal decorated graphene at 7.02 wt.%.
• Non-graphene 2-D carbon allotropes show promise as hydrogen storage media and through lithium
decoration can achieve a higher maximum hydrogen gravimetric density than metal decorated
graphene at 7.12 wt.%.
7.2 Future work
The research presented in this thesis has looked at one particular part or step of larger processes.
Specifically, there are additional details which must be obtained to provide a more complete picture at
the practical real-world level for each of the areas studied. Hence, the following avenues of investigation
should be explored further in the future:
• Hydrogen Production from Water on Two-Dimensional Molybdenum Disulfide
• Study mechanism and activation energy barriers of hydrogen desorption and evolution on 2-D
MoS2 and possible use of photoactivation to drive forward reaction.
• Study effects multiple H2O molecules, surface coverage and oxygen atom removal on water disso-
ciation and hydrogen evolution reactions.
• Hydrogen Storage on Two-Dimensional Carbon Substrates
• Study the hydrogen storage ability of graphene and other 2-D carbon allotropes under realistic am-
bient temperature and pressure conditions and look at system level hydrogen loading and unloading
processes.

Bibliography
[1] Knordlun. ”mdalgorithm” by knordlun - own work. licensed under public domain via wikimedia
commons, 2007.
[2] Field C.B., V.R. Barros, D.J. Dokken, K.J. Mach, M.D. Mastrandrea, T.E. Bilir, M. Chatterjee,
K.L. Ebi, Y.O. Estrada, R.C. Genova, B. Girma, E.S. Kissel, A.N. Levy, S. MacCracken, P.R.
Mastrandrea, and L.L. White. Geoengineering the climate: science, governance and uncertainty.
Technical report, 2009.
[3] Pieter Tans and Ralph Keeling. Trends in atmospheric carbon dioxide - earth system research
laboratory global monitoring division, noaa, 2014.
[4] J. Rockstrom, W. Steffen, K. Noone, A. Persson, F.S. Chapin, E.F. Lambin, T.M. Lenton, M. Schef-
fer, C. Folke, H.J. Schellnhuber, et al. A safe operating space for humanity. Nature, 461(7263):472–
475, 2009.
[5] D. M. Etheridge, L. P. Steele, R. L. Langenfelds, R. J. Francey, J.-M. Barnola, and V. I. Mor-
gan. Natural and anthropogenic changes in atmospheric CO2 over the last 1000 years from air in
Antarctic ice and firn. , 101:4115–4128, 1996.
[6] Mak Thorpe derivative work of, G. Marland, T.A. Boden, and R. J. Andres. Global carbon
emissions - global, regional, and national co2 emissions. in trends: A compendium of data on
global change. carbon dioxide information analysis center, oak ridge national laboratory, united
states department of energy, oak ridge, tenn., u.s.a. licensed under creative commons attribution-
share alike 3.0-2.5-2.0-1.0 via wikimedia commons., 2007.
[7] Meng Ni, Michael K.H. Leung, K. Sumathy, and Dennis Y.C. Leung. Potential of renewable
hydrogen production for energy supply in hong kong. International Journal of Hydrogen Energy,
31(10):1401 – 1412, 2006.
[8] Michael Ball and Martin Wietschel. The future of hydrogen opportunities and challenges. Inter-
national Journal of Hydrogen Energy, 34(2):615 – 627, 2009.
[9] Suman Dutta. A review on production, storage of hydrogen and its utilization as an energy
resource. Journal of Industrial and Engineering Chemistry, 20(4):1148 – 1156, 2014.
[10] Takashi Hisatomi, Jun Kubota, and Kazunari Domen. Recent advances in semiconductors for
photocatalytic and photoelectrochemical water splitting. Chem. Soc. Rev., pages –, 2014.
92
Bibliography 93
[11] Akihiko Kudo and Yugo Miseki. Heterogeneous photocatalyst materials for water splitting. Chem.
Soc. Rev., 38:253–278, 2009.
[12] Andreas Zttel. Materials for hydrogen storage. Materials Today, 6(9):24 – 33, 2003.
[13] Valentina Tozzini and Vittorio Pellegrini. Prospects for hydrogen storage in graphene. NEST-
Istituto Nanoscienze - Cnr and Scuola Normale Superiore, pages 1 – 11, 2012.
[14] Kean L. Lim, Hossein Kazemian, Zahira Yaakob, and Wan R. W. Daud. Solid-state materials and
methods for hydrogen storage: A critical review. Chemical Engineering & Technology, 33(2):213–
226, FEB 2010 2010. PT: J; TC: 14; UT: WOS:000275131500002.
[15] Jacob Goldsmith, Antek G. Wong-Foy, Michael J. Cafarella, and Donald J. Siegel. Theoretical
limits of hydrogen storage in metalorganic frameworks: Opportunities and trade-offs. Chemistry
of Materials, 25(16):3373–3382, 2013.
[16] Chang Liu, Yong Chen, Cheng-Zhang Wu, Shi-Tao Xu, and Hui-Ming Cheng. Hydrogen storage
in carbon nanotubes revisited. Carbon, 48(2):452 – 455, 2010.
[17] Natarajan Sathiyamoorthy Venkataramanan, Mohammad Khazaei, Ryoji Sahara, Hiroshi
Mizuseki, and Yoshiyuki Kawazoe. First-principles study of hydrogen storage over ni and rh
doped {BN} sheets. Chemical Physics, 359(13):173 – 178, 2009.
[18] Natarajan Sathiyamoorthy Venkataramanan, Rodion Vladimirovich Belosludov, Ryunosuke Note,
Ryoji Sahara, Hiroshi Mizuseki, and Yoshiyuki Kawazoe. Theoretical investigation on the alkali-
metal doped {BN} fullerene as a material for hydrogen storage. Chemical Physics, 377(13):54 –
59, 2010.
[19] Office of Energy Efficiency Us Department of Energy, the FreedomCAR Renewable Energy, and
Fuel Partnership. Targets for onboard hydrogen storage systems for light-duty vehicles. Department
of Energy, pages 1–22, SEPT 2009 2009.
[20] Anubhav Jain, Shyue Ping Ong, Geoffroy Hautier, Wei Chen, William Davidson Richards, Stephen
Dacek, Shreyas Cholia, Dan Gunter, David Skinner, Gerbrand Ceder, and Kristin A. Persson.
Commentary: The materials project: A materials genome approach to accelerating materials
innovation. APL Materials, 1(1):–, 2013.
[21] Chris Loken, Daniel Gruner, Leslie Groer, Richard Peltier, and Neil Bunn et al. Scinet: Lessons
learned from building a power-efficient top-20 system and data centre. J. Phys.: Conf. Ser.,
256:012026, 2010.
[22] A. K. Geim. Graphene: Status and prospects. Science, 324(5934):1530–1534, 2009.
[23] Pere Miro, Martha Audiffred, and Thomas Heine. An atlas of two-dimensional materials. Chem.
Soc. Rev., pages –, 2014.
[24] W. Patrick McCray. Will small be beautiful? making policies for our nanotech future. History
and Technology, 21(2):177–203, 2005.
Bibliography 94
[25] Robert Taylor, Sylvain Coulombe, Todd Otanicar, Patrick Phelan, Andrey Gunawan, Wei Lv,
Gary Rosengarten, Ravi Prasher, and Himanshu Tyagi. Small particles, big impacts: A review of
the diverse applications of nanofluids. Journal of Applied Physics, 113(1):–, 2013.
[26] P. Giannozzi, S. Baroni, N. Bonini, M. Calandra, R. Car, C. Cavazzoni, D. Ceresoli, G.L. Chiarotti,
M. Cococcioni, I. Dabo, et al. Quantum espresso: a modular and open-source software project for
quantum simulations of materials. Journal of Physics: Condensed Matter, 21:395502, 2009.
[27] Gareth A. Tribello, Massimiliano Bonomi, Davide Branduardi, Carlo Camilloni, and Giovanni
Bussi. {PLUMED} 2: New feathers for an old bird. Computer Physics Communications, 185(2):604
– 613, 2014.
[28] C. Eckart. The Kinetic Energy of Polyatomic Molecules. Physical Review, 46:383–387, September
1934.
[29] Graeme Henkelman, Gsli Jhannesson, and Hannes Jnsson. Methods for finding saddle points and
minimum energy paths. In StevenD. Schwartz, editor, Theoretical Methods in Condensed Phase
Chemistry, volume 5 of Progress in Theoretical Chemistry and Physics, pages 269–302. Springer
Netherlands, 2002.
[30] Graeme Henkelman, Blas P. Uberuaga, and Hannes Jnsson. A climbing image nudged elastic band
method for finding saddle points and minimum energy paths. The Journal of Chemical Physics,
113(22):9901–9904, 2000.
[31] William C. Swope, Hans C. Andersen, Peter H. Berens, and Kent R. Wilson. A computer simula-
tion method for the calculation of equilibrium constants for the formation of physical clusters of
molecules: Application to small water clusters. The Journal of Chemical Physics, 76(1):637–649,
1982.
[32] Hans C. Andersen. Molecular dynamics simulations at constant pressure and/or temperature. The
Journal of Chemical Physics, 72(4):2384–2393, 1980.
[33] Thomas D. Khne. Second generation carparrinello molecular dynamics. Wiley Interdisciplinary
Reviews: Computational Molecular Science, 4(4):391–406, 2014.
[34] Alessandro Laio and Michele Parrinello. Escaping free-energy minima. Proceedings of the National
Academy of Sciences, 99(20):12562–12566, 2002.
[35] Alessandro Laio and Francesco L Gervasio. Metadynamics: a method to simulate rare events and
reconstruct the free energy in biophysics, chemistry and material science. Reports on Progress in
Physics, 71(12):126601, 2008.
[36] M. A. Henderson. The interaction of water with solid surfaces: Fundamental aspects revisited .”
surface science reports. Surf. Sci. Rep., 46:1, 2002.
[37] A. A. Phatak, W. N. Delgass, F. H. Ribeiro, and W. F. Schneider. Dft comparison of water
dissociation steps on cu, au, ni, pd and pt. J. Phys. Chem. C, 113:7269, 2009.
[38] K. S. Sandhya and Cherumuttathu H. Suresh. Designing metal hydride complexes for water
splitting reactions: a molecular electrostatic potential approach. Dalton Trans., 43:12279–12287,
2014.

Bibliography 95
[39] Jos L. C. Fajn, M. Natlia D. S. Cordeiro, and Jos R. B. Gomes. Density functional theory study of
the water dissociation on platinum surfaces: General trends. The Journal of Physical Chemistry
A, 118(31):5832–5840, 2014.
[40] S. Tongay, J. Zhou, C. Ataca, K. Lo, T. S. Matthew, J. Li, J. C. Grossman, and J. Wu. Nano
Lett., 12:5576, 2012.
[41] J. N. Coleman, M. Lotya, A. O’Neill, S. D. Bergin, P. J. King, U. Khan, K. Young, A. Gaucher,
S. De, R. J. Simth, and Smith et al. Science, 331:568, 2011.
[42] M.; Grossman Bernardi, M.; Palummo. Extraordinary sunlight absorption and 1 nm-thick photo-
voltaics using two-dimensional monolayer materials. J. C. Nano Lett., 13:3664–3670, 2013.
[43] W. S. Yun, S. W. Han, S. C. Hong, I. G. Kim, and J. D. Lee. Phys. Rev. B, 2012:033305, 85.
[44] Y. Ding, Y. Wang, J. Ni, L. Shi, S. Shi, and W. Tang. Physica B, 406:2254, 2011.
[45] J. Kang, S. Tongay, J. Zhou, J. Li, and J. Wu. Band offsets and heterostructures of two-dimensional
semiconductors. Appl Phys Lett, 102:012111, 2013.
[46] YuLin Min, GuangQiang He, QunJie Xu, and YouCun Chen. Dual-functional mos2 sheet-modified
cds branch-like heterostructures with enhanced photostability and photocatalytic activity. J.
Mater. Chem. A, 2:2578–2584, 2014.
[47] W. Jaegermann and H. Tributsch. Prog. Surf. Sci., 29:1–167., 1988.
[48] J. V. Lauritsen, J. Kibsgaard, S. Helveg, H. Topsoe, B. S. Clausen, E. Laegsgaard, and F. Besen-
bacher. Nat. Nanotechnol., 2:53, 2007.
[49] T. F. Jaramillo, K. P. Jorgensen, J. Bonde, J. H. Nielsen, S. Horch, and I Chorkendorff. Iden-
tification of active edge sites for electrochemical h2 evolution from mos2 nanocatalysts. Science,
317:100, 2007.
[50] B. Hinnemann, P. G. Moses, J. Bonde, K. P. Jorgensen, I. Chorkendorff J. H. Nielsen, S. Horch,
and J. K. Norskov. Biomimetic hydrogen evolution: Mos2 nanoparticles as catalyst for hydrogen
evolution. J. Am. Chem. Soc., 127:5308–5309, 2005.
[51] Y. Li, H. Wang, L. Xie, Y. Liang, G. Hong, and H. Dai. Mos2 nanoparticles grown on graphene:
An advanced catalyst for the hydrogen evolution reaction. J. Am. Chem. Soc., 133:7296–7299,
2011.
[52] J. Bonde, P. G. Moses, T. F. Jaramillo, J. K. Norskov, and I. Chorkendorff. Faraday Discuss.,
140:219–231, 2009.
[53] J. Kibsgaard, Z. Chen, B. N. Reinecke, and T. F. Jaramillo. Engineering the surface structure of
mos2 to preferentially expose active edge sites for electrocatalysis. Nat. Mater., 11:963969, 2012.
[54] D. Y. Chung, S.-K. Park, Y.-H. Chung, S.-H. Yu, D.-H. Lim, N. J., H. C. Ham, H.-Y. Park,
Y. Piao, S. J. Yoo, and Y.-E. Sung. Edge-exposed mos2 nano-assembled structures as efficient
electrocatalysts for hydrogen evolution reaction. Nanoscale, 6:2131, 2014.

Bibliography 96
[55] C. Ataca and S. Ciraci. Dissociation of h2o at the vacancies of single-layer mos2. Phy Rev B,
85:195410, 2012.
[56] W. I. Choi, B. C. Wood, E. Schwegler, and T. Ogitsu. Site-dependent free energy barrier for proton
reduction on mos2 edges. J. Phys. Chem. C, 117:21772–21777, 2013.
[57] P. Giannozzi, S. Baroni, N. Bonini, M. Calandra, and et al. Quantum espresso: a modular and
open-source software project for quantum simulations of materials. J. Phys.: Condens. Matter,
21:395502, 2009.
[58] G. Kresse and D. Joubert. From ultrasoft pseudopotentials to the projector augmented-wave
method. Phys. Rev. B, 59:1758–1775, Jan 1999.
[59] J.P. Perdew, K. Burke, and M. Ernzerhof. Generalized gradient approximation made simple. Phys
Rev Lett, 77:3865, 1996.
[60] H. J. Monkhorst and J. D. Pack. Special points for brillouin-zone integrations. Phys. Rev. B,
13:5188, 1976.
[61] K. Lee, E. D. Murray, L. Kong, B. I. Lundqvist, and D. C. Langreth. Higher-accuracy van der
waals density functional. Phys. Rev. B, 82:081101, 2010.
[62] G. Mills, H. Jonsson, and G. K. Schenter. Reversible work transition state theory: application to
dissociative adsorption of hydrogen. Surf. Sci., 324:305–337, 1995.
[63] H. Jonsson, G. Mills, and K. W. Jacobsen. Classical and quantum dynamics in condensed phase
simulations edited by b. j. berne, g. ciccotti, and d. f. coker. World Scientific, Singapore, 1998.
[64] G. Henkelman and H. G. Jonsson. Improved tangent estimate in the nudged elastic band method
for finding minimum energy paths and saddle points. J Chem Phys, 113:9978, 2000.
[65] P. Raybaud, J. Hafner, G. Kresse, S. Kasztelan, and H. Toulhoat. Ab initio study of the h2h2s/mos2
gassolid interface: The nature of the catalytically active sites. J. Catal., 189:129, 2000.
[66] M. K. Kostov, E. E. Santiso, A. M. George, and K. E.and Nardelli Gubbins. Dissociation of water
on defective carbon substrates. Phys. Rev. Lett., 95:136105, 2005.
[67] Y. Lei and Z. X. Guo. Initial interactions between water molecules and ti-adsorbed carbon nan-
otubes. Appl. Phys. Lett., 91:161906, 2007.
[68] S. Baroni, S. D. Gironcoli, A. D. Corso, and P. Giannozzi. Phonons and related crystal properties
from density-functional perturbation theory. Rev. Mod. Phys., 73:515–562, 2001.
[69] J. K. Norskov, T. Bligaard, A. Logadottir, J. R. Kitchin andJ. G. Chen, S. Pandelov, and U. Stim-
ming. Trends in the exchange current for hydrogen evolution. Journal of The Electrochemical
Society, 152(3):J23–J26, 2005.
[70] Rutger Anthony van Santen and Matthew Neurock. Principles of Molecular Heterogeneous Catal-
ysis, pages 19–81. Wiley-VCH Verlag GmbH Co. KGaA, 2007.

Bibliography 97
[71] Jasmine Wong, Shwetank Yadav, Jasmine Tam, and Chandra Veer Singh. A van der waals dft
comparison of metal decorated graphene systems for hydrogen adsorption. Journal of Applied
Physics, 115(23), 2014.
[72] Mario Pagliaro, Athanasios G. Konstandopoulos, Rosaria Ciriminna, and Giovanni Palmisano.
Solar hydrogen: fuel of the near future. Energy Environ. Sci., 3:279 – 287, 2010.
[73] Yiqing Sun, Qiong Wu, and Gaoquan Shi. Graphene based new energy materials. Energy Environ.
Sci., 4:1113 – 1132, 2011.
[74] Targets for Onboard Hydrogen Storage Systems for Light-Duty Vehicles. Technical report, US
Department of Energy Office of Energy Efficiency and Renewable Energy and The FreedomCAR
and Fuel Partnership, 2009.
[75] L. Firlej, B. Kuchta, C. Wexler, and P. Pfeifer. Boron substituted graphene: energy landscape for
hydrogen adsorption. Adsorption, 15:312 – 317, 2009.
[76] V. Wang, H. Mizuseki, H. P. He, G. Chen, S. L. Zhang, and Y. Kawazoe. Calcium-decorated
graphene for hydrogen storage: A van der waals density functional study. Computational Materials
Science, 55:180 – 185, APR 2012.
[77] Weiwei Zhou, Jingjing Zhou, Jingqin Shen, Chuying Oujang, and Siqi Shi. First-principles study of
high-capacity hydrogen storage on graphene with li atoms. Journal of Physical Chemistry Solids,
73:245 – 251, 2012.
[78] Z. M. Ao and F. M. Peeters. High-capacity hydrogen storage in al-adsorbed graphene. Physical
Review B, 81(20):205406, MAY 2010.
[79] C. Ataca, E. Akturk, and S. Ciraci. Hydrogen storage of calcium atoms adsorbed on graphene:
First-principles plane wave calculations. Phys. Rev. B, 79:041406, JAN 2009.
[80] Chien-Hung Chen, Tsui-Yun Chung, Chin-Chang Shen, Ming-Sheng Yu, Cheng-Si Ts, Gia-Nan
Shi, Chen-Chia Huang, Ming-Der Ger, and Wen-Lung Lee. Hydrogen storage performance
in palladium-doped graphene/carbon composites. International Journal of Hydrogen Energy,
38(9):3681 – 3688, 2013.
[81] Won G. Hong, Byung H. Kim, Sang M. Lee, Han Y. Yu, Yong J. Yun, Yongseok Jun, Jin B. Lee,
and Hae J. Kim. Agent-free synthesis of graphene oxide/transition metal oxide composites and
its application for hydrogen storage. International Journal of Hydrogen Energy, 37(9):7594–7599,
MAY 2012 2012. PT: J; TC: 0; UT: WOS:000305040200029.
[82] Chen-Chia Huang, Yi-Hua Li, Yen-Wen Wang, and Chien-Hung Chen. Hydrogen storage in cobalt-
embedded ordered mesoporous carbon. International Journal of Hydrogen Energy, 38(10):3994 –
4002, 2013.
[83] Hu Zhou, Xiaoqing Liu, Jun Zhang, Xiufen Yan, Yuanjun Liu, and Aihua Yuan. Enhanced
room-temperature hydrogen storage capacity in pt-loaded graphene oxide/hkust-1 composites.
International Journal of Hydrogen Energy, 39(5):2160 – 2167, 2014.

Bibliography 98
[84] J.P. Perdew, K. Burke, and M. Ernzerhof. Generalized gradient approximation made simple. Phys
Rev Lett, 77(18):3865 – 3868, 1996.
[85] Kyuho Lee, Eamonn D. Murray, Lingzhu Kong, Bengt I. Lundqvist, and David C. Langreth.
Higher-accuracy van der waals density functional. Phys. Rev. B, 82:081101, AUG 2010.
[86] M. Dion, H. Rydberg, E. Schroder, D.C. Langreth, and B.I. Lundqvist. Van der waals density
functional for general geometries. Physical Review Letters, 92(24):246401, Jun 2004.
[87] M. Methfessel and A. T. Paxton. High-precision sampling for brillouin-zone integration in metals.
Phys. Rev. B, 40:3616–3621, AUG 1989.
[88] Jiayu Dai, Jianmin Yuan, and Paolo Giannozzi. Gas adsorption on graphene doped with b, n, al,
and s: A theoretical study. Applied Physics Letters, 95(23):232105, 2009.
[89] A. Sigal, M. I. Rojas, and E. P. M. Leiva. Is hydrogen storage possible in metal-doped graphite
2d systems in conditions found on earth? Phys. Rev. Lett., 107:158701, OCT 2011.
[90] A. Sigal, M. I. Rojas, and E. P. M. Leiva. Interferents for hydrogen storage on a graphene sheet
decorated with nickel: A dft study. International Journal of Hydrogen Energy, 36(5):3537–3546,
MAR 2011 2011. PT: J; TC: 4; UT: WOS:000288833600031.
[91] I. Lopez-Corral, E. German, A. Juan, M. A. Volpe, and G. P. Brizuela. Dft study of hydrogen
adsorption on palladium decorated graphene. The Journal of Physical Chemistry, 115:4315–4323,
2011.
[92] Gregory J Kubas. Metaldihydrogen and -bond coordination: the consummate extension of the
dewarchattduncanson model for metalolefin bonding. Journal of Organometallic Chemistry,
635(12):37 – 68, 2001.
[93] Shwetank Yadav, Zhihui Zhu, and Chandra Veer Singh. Defect engineering of graphene for effective
hydrogen storage. International Journal of Hydrogen Energy, 39(10):4981 – 4995, 2014.
[94] Puru Jena. Materials for Hydrogen Storage: Past, Present, and Future. The Journal of Physical
Chemistry Letters, 2(3):206–211, February 2011.
[95] Florian Banhart, Jani Kotakoski, and Arkady V Krasheninnikov. Structural defects in graphene.
ACS nano, 5(1):26–41, January 2011.
[96] Mina Yoon, Shenyuan Yang, Enge Wang, and Zhenyu Zhang. Charged fullerenes as high-capacity
hydrogen storage media. Nano Letters, 7(9):2578–2583, 2007.
[97] D. Henwood and J. D. Carey. Ab initio investigation of molecular hydrogen physisorption on
graphene and carbon nanotubes. Physical Review B, 75(24):245413, JUN 2007 2007. PT: J; TC:
52; UT: WOS:000247625000112.
[98] Abhishek Kumar Singh and Boris I. Yakobson. First principles calculations of H-storage in sorption
materials. Journal of Materials Science, 47(21):7356–7366, May 2012.

Bibliography 99
[99] Lu Wang, Kyuho Lee, Yi-Yang Sun, Michael Lucking, Zhongfang Chen, Ji Jun Zhao, and Sheng-
bai B Zhang. Graphene oxide as an ideal substrate for hydrogen storage. ACS nano, 3(10):2995–
3000, October 2009.
[100] Martin Pumera. Graphene-based nanomaterials for energy storage. Energy & Environmental
Science, 4(3):668, 2011.
[101] A. Bhattacharya, S. Bhattacharya, C. Majumder, and G. P. Das. Transition-metal decoration
enhanced room-temperature hydrogen storage in a defect-modulated graphene sheet. The Journal
of Physical Chemistry C, 114(22):10297–10301, 2010.
[102] Alex W Robertson, Christopher S Allen, Yimin a Wu, Kuang He, Jaco Olivier, Jan Neethling,
Angus I Kirkland, and Jamie H Warner. Spatial control of defect creation in graphene at the
nanoscale. Nature communications, 3:1144, January 2012.
[103] Kyuho Lee, Kristian Berland, Mina Yoon, Stig Andersson, Elsebeth Schroder, Per Hyldgaard,
and Bengt I Lundqvist. Benchmarking van der Waals density functionals with experimental data:
potential-energy curves for H2 molecules on Cu(111), (100) and (110) surfaces. Journal of physics.
Condensed matter : an Institute of Physics journal, 24(42):424213, October 2012.
[104] Guo Li, Isaac Tamblyn, Valentino R. Cooper, Hong-Jun Gao, and Jeffrey B. Neaton. Molecular
adsorption on metal surfaces with van der waals density functionals. Phys. Rev. B, 85:121409, Mar
2012.
[105] Hoonkyung Lee, Jisoon Ihm, Marvin L. Cohen, and Steven G. Louie. Calcium-decorated graphene-
based nanostructures for hydrogen storage. Nano Letters, 10(3):793–798, MAR 2010 2010. PT: J;
TC: 51; UT: WOS:000275278200008.
[106] D. Vanderbilt. Soft self-consistent pseudopotentials in a generalized eigenvalue formalism. Phys
Rev B, 41(11):7892, 1990.
[107] Francesca Costanzo, Pier Luigi Silvestrelli, and Francesco Ancilotto. Physisorption, diffusion,
and chemisorption pathways of h(2) molecule on graphene and on (2,2) carbon nanotube by first
principles calculations. Journal of Chemical Theory and Computation, 8(4):1288–1294 ST – Ph-
ysisorption, Diffusion, and Chem, 2012.
[108] Kwon Young-Kyun. Hydrogen adsorption on sp2-bonded carbon structures: Ab-initio study. Jour-
nal of the Korean Physical Society, 57(4):778, Oct 2010.
[109] Hongyu Zhang, Mingwen Zhao, Hongxia Bu, Xiujie He, Meng Zhang, Lixia Zhao, and Youhua
Luo. Ultra-high hydrogen storage capacity of li-decorated graphyne: A first-principles prediction.
Journal of Applied Physics, 112:08435–084310, OCT 17 2012 2012.
[110] Gyubong Kim, Seung-Hoon Jhi, Seokho Lim, and Noejung Park. Effect of vacancy defects in
graphene on metal anchoring and hydrogen adsorption. Applied Physics Letters, 94(17):173102,
APR 27 2009 2009. PT: J; TC: 17; UT: WOS:000265738700061.
[111] L. Chen, H. Hu, Yu. Ouyang, H.Z. Pan, Y.Y. Sun, and F. Liu. Atomic chemisorption on graphene
with stonethrowerwales defects. Carbon, 49(10):3356 – 3361, 2011.

Bibliography 100
[112] Sunita Satyapal, John Petrovic, Carole Read, George Thomas, and Grace Ordaz. The u.s. depart-
ment of energy’s national hydrogen storage project: Progress towards meeting hydrogen-powered
vehicle requirements. Catalysis Today, 120(34):246 – 256, 2007. Proceedings of the Korea Confer-
ence on Innovative Science and Technology (KCIST-2005):Frontiers in Hydrogen Storage Materials
and Technology.
[113] Louis Schlapbach and Andreas Zuttel. Hydrogen-storage materials for mobile applications. Nature,
414(6861):353–8, Nov 15 2001. Copyright - Copyright Macmillan Journals Ltd. Nov 15, 2001; Last
updated - 2013-01-28; CODEN - NATUAS.
[114] Konstantinos Spyrou, Dimitrios Gournis, and Petra Rudolf. Hydrogen storage in graphene-based
materials: Efforts towards enhanced hydrogen absorption. ECS Journal of Solid State Science and
Technology, 2(10):M3160–M3169, 2013.
[115] Wenzhi Wu, Wanlin Guo, and Xiao Cheng Zeng. Intrinsic electronic and transport properties of
graphyne sheets and nanoribbons. Nanoscale, 5:9264–9276, 2013.
[116] K. Srinivasu and Swapan K. Ghosh. Graphyne and graphdiyne: Promising materials for nanoelec-
tronics and energy storage applications. The Journal of Physical Chemistry C, 116(9):5951–5956,
2012.
[117] Yan Jiao, Aijun Du, Marlies Hankel, Zhonghua Zhu, Victor Rudolph, and Sean C. Smith.
Graphdiyne: a versatile nanomaterial for electronics and hydrogen purification. Chem. Commun.,
47:11843–11845, 2011.
[118] H. Lu and S.D. Li. Two-dimensional carbon allotropes from graphene to graphyne. Journal of
Materials Chemistry C, 1:3677–3680, JAN 2013.
[119] Qi Song, Bing Wang, Ke Deng, Xinliang Feng, Manfred Wagner, Julian D. Gale, Klaus Mullen,
and Linjie Zhi. Graphenylene, a unique two-dimensional carbon network with nondelocalized
cyclohexatriene units. J. Mater. Chem. C, 1:38–41, 2013.
[120] Guo Li, Isaac Tamblyn, Valentino R. Cooper, Hong-Jun Gao, and Jeffrey B. Neaton. Molecular
adsorption on metal surfaces with van der waals density functionals. Phys. Rev. B, 85:121409, Mar
2012.
[121] John P. Perdew and Yue Wang. Accurate and simple analytic representation of the electron-gas
correlation energy. Phys. Rev. B, 45:13244–13249, Jun 1992.
[122] Kristian Berland and Per Hyldgaard. Analysis of van der waals density functional components:
Binding and corrugation of benzene and c60 on boron nitride and graphene. Phys. Rev. B,
87:205421, May 2013.