Embed Size (px)
Citation preview

FIRST NATIONS ENVIRONMENTAL HEALTH R
ESOURCES PROJECT
FEASIBILITY STUDY
“BUILDING FIRST NATIONS CAPACITY IN ENVIRONMENTAL HEALTH”
Assembly of First Nations Environmental Stewardship Unit
March 2008

TABLE OF CONTENTS
EXECUTIVE SUMMARY ...........................................................................................................................3
INTRODUCTION .........................................................................................................................................5
RATIONALE.................................................................................................................................................6
SURVEY DESIGN/ METHODOLOGY .....................................................................................................8 QUESTIONNAIRE DEVELOPMENT:........................................................................................................8
SURVEY RESULTS ...................................................................................................................................10 DEMOGRAPHIC INFORMATION: .........................................................................................................10 GENERAL SURVEY: ................................................................................................................................11 LEADERSHIP SURVEY: ..........................................................................................................................14 TECHNICAL SURVEY: ............................................................................................................................17 YOUTH SURVEY:.....................................................................................................................................20 TELEPHONE SURVEY: ...........................................................................................................................22 COMMON QUESTIONS: .........................................................................................................................25
DISCUSSION...............................................................................................................................................34
RECOMMENDATIONS ............................................................................................................................35 PROPOSED RESOURCE KIT COMPONENTS:......................................................................................35 COST ANALYSIS: .....................................................................................................................................39 PROPOSED PROJECT IMPLEMENTATION: ........................................................................................40 :

EXECUTIVE SUMMARY
This report presents the results of a feasibility study to determine the viability of the First Nations Environmental Health Resources Project. This study provides a thorough analysis of the cultural and economic feasibility of the project, as well as, its need, practicality and usefulness.
The First Nations Environmental Health Resources Project involves the development and production of a series of First Nation’s specific environmental health resource materials meant to address issues of general concern, and promote awareness and community action. These resource materials will include practical guides, tools, best practices, and project ideas on how best to address environmental health and stewardship concerns at the community level.
The feasibility study, requested and financed by Health Canada, was conducted by the staff of the Environmental Stewardship Unit (ESU) of the Assembly of First Nation (AFN) and presents information obtained by a survey administered across Canada during the months of January/ February 2008. This survey of First Nation constituencies was designed to analyze what is currently known about environmental health, understand user views on potential options for resource materials, and guage what tools and resource materials First Nations requires to initiate community action.
To be representative, the survey incorporated five different questionnaires, each intended to obtain information from different target groups. These target groups were: the general public, First Nation leaders, technical personnel with experience in environmental health, and youth (at the secondary school level). One questionnaire was designed to be administered over the telephone to persons in those Provinces or Territories where few if any questionnaires where returned. The surveys asked questions about environmental health concerns on topics such as indoor and outdoor air quality, water resources protection and drinking water safety, environmental contaminants, chemicals, unsafe and un‐maintained environments, climate change, etc.
The response rate, particularly for the General Survey (the most widely distributed), was considered to be quite high, with 41% of First Nations responding. Of that group, 59% were female and 41% male, with 33% residing in Manitoba. The top five concerns were: Drinking water quality, Accident prevention, Food safety, Improvements to private homes and occupational safety and health.
The results of this study indicate that First Nation communities not only need and want information; but to be effective, this information should be presented in a way that promotes action and self‐reliance. For instance, it was found that although there are First Nation personnel responsible for environmental health, many lack the training and experience necessary to carry out monitoring and surveillance activities, which is complicated by a lack of resources to purchase monitoring equipment. As a result there is very little, if any, baseline information on the state of the environment in First Nation communities. Due to this lack of capacity, there is a dependence on outside expertise to identify and solve environmental health problems.

The survey highlights the need and interest in a resource kit with tools that focus on those environmental health issues of concern to First Nations in Canada. It is therefore justified that a First Nation specific Environmental Health Resources Kit be developed, one which includes practical information and tools on how best to promote self‐reliance and
n a r p lecommu ity ction on identifying and solving envi onmental health rob ms.
A list of suggested tools and preliminary cost estimates are contained in the “Recommendations” section of this report. It is suggested that the next stage of work focus on providing the details of each specific tool to be contained in the resource kit.

INTRODUCTION
According to the World Health Organization (WHO) Environmental Health can be defined as:
Environmental Health comprises of those aspects of human health, including quality of life, that are determined by physical, chemical, biological, social, and psychosocial factors in the environment. It also refers to the theory and practice of assessing, correcting, controlling, and preventing those factors in the environment that can potentially affect adversely the health of present and future generations.1
In addition, environmental protection, although different in meaning, is a concept that cannot be excluded when it comes to First Nation’s issues on the environment, see below.
Environmental Protection pertains to protecting (keeping from harm, attack, or injury) the combination of external conditions which affect the life, growth, development, and survival of an organism or group of organisms. Subject areas include: air and water quality; biodiversity; ecological dynamics; environmental effects; environmental monitoring; hazardous substances and
exposures; land use; pollution; resource management; and waste treatments.2
These definitions serve as the basis of this study, and are imbedded in Principle 22 of the Rio Declaration on Environment and Development which states that: “Indigenous people and their communities have a vital role in environmental management and development because of their knowledge and traditional practices;” and that, “States should recognize and duly support their identity, culture and interests and enable their effective participation in the achievement of sustainable development.”
This document provides the results of a multifaceted survey on environmental health that was carried out in First Nations across Canada. This survey was conducted during the months of January and February 2008 and is in response to Health Canada’s request for more information on the design and production of a First Nation’s specific “Environmental Health Resource Kit.”
1 World Health Organization (WHO) draft definition developed at a WHO consultation in Sofia, Bulgaria, 1993. 2 From a WHO sponsored “Workshop for Nurses and Environmental Health Assistants” Funafuti, Tuvalu; 17‐18 July 2003

RATIONALE Environmental health plays an immense role in the lives of First Nation peoples, as many continue to rely heavily on the environment for their subsistence, including their social, cultural, economic and physical survival. First Nation dependence on the land has unfortunately presented higher than ‘normal’ risks to health. Traditional uses of plant species and regular consumption of “wild” foods has significantly increased exposure to chemical and biological contaminants. This in turn has caused a suspected decline in First Nation’s overall health status either as a result of consuming foods contaminated with
b o l dchemicals or iol gica agents or from turning to less nutritious “processed” market foo s.
In addition to the environmental risks associated with traditional lifestyles and consumption of traditional foods, First Nation peoples across Canada are deeply concerned about environmental health issues related to deteriorating clean air, the need to address chronic drinking water contamination problems, exposure to contaminants and toxins in food, poor housing, and the potential long‐term impacts of climate change. The AFN recognizes that protecting the environment and human health is a necessary goal that should be harmonized with economic development.
Despite the fact that First Nation communities are increasingly interested in playing an active role in improving environmental health, many communities have still not been able to participate. First Nation’s involvement and intervention into environmental processes, assessments and impact analyses have been hampered by a number of concerns. These include lack of knowledge of the issues, lack of capacity within First Nation communities to deal with the issues, lack of resources and expertise to properly monitor the environment, lack of awareness of which office to file for interventions or request inspection services, inability to navigate through complex regulatory frameworks, and a lack of knowledge of relevant legislation.
In order to address these challenges, the AFN is proposing the First Nation Environmental Health Resource Project. This project involves the development of a resource kit made‐up of different components containing First Nation specific guides, materials and modules that will provide practical information to First Nations on how to address environmental health and stewardship concerns in their communities. These resource materials will focus on First Nation environmental health concerns on topics such as indoor and outdoor air quality, water resources protection and drinking water safety, environmental contaminants, chemical safety, how to avoid unsafe and un‐maintained environments, climate change impacts, etc. The AFN is seeking to develop easy‐to‐use guidelines, forms, procedures, project ideas and tools for First Nation communities to use as precedents, samples and templates for further adaptation, if applicable. The project will also contribute to knowledge of the issues, environmental laws, regulations and processes. Finally, and most importantly, the project will be designed to promote community action and self‐reliance.
In the past, the AFN has received numerous requests from First Nation communities for such resources so they may begin community‐driven initiatives, but to date little has been accomplished. As a result, the AFN is proposing a comprehensive resource kit with a set of training/ information modules to effectively meet First Nation needs on addressing

environmental health concerns and promoting action. They include three categories of information;
•
How the environment impacts First Nation health;
• Ways and means of creating healthy environments; and,
• Community‐based environmental health research and surveillance activities.
In general, the purpose of this feasibility study is to determine the nature and extent of perceived environmental health problems faced by First Nation Communities, and to assess culturally sensitive needs in terms of gaps in awareness. This was done via a survey that solicited information on current knowledge, attitudes and practices concerning these issues. rom this information, the proposed content and needed support materials were Fdetermined. See the “Recommendations” section at the end of this report. It should be noted that the responses to some of the questions in this survey may be based on the previous experiences of the respondents and may not reflect the current “actual” situation. And, some of what is expressed as high priority may be due to previous awareness of an issue and not what exists and vice versa. This being said, the results of this survey clearly indicate what First Nations believe to be issues of concern, all of which we propose to be covered by the Environmental Health Resource Project.

SURVEY DESIGN/ METHODOLOGY
QUESTIONNAIRE DEVELOPMENT: In order to obtain information and opinions from a representative cross‐section of First Nations across Canada it was decided to develop questionnaires for different target groups; i.e. community leaders, secondary school students (youth), the general community, and those persons with environmental health program knowledge (nurse practitioners, environmental health officer, etc). Using a team approach, the Environmental Stewardship Unit (ESU) developed five questionnaires, four to be filled out by respondents on a paper‐based format and one to be administered over the telephone. Although the questions on each were similar in terms of information to be obtained, they were designed to be answered by the particular target group by using a format and phraseology most familiar to the group. Moreover, by inserting additional questions that focused on the target group’s interest or expertise, it was anticipated that the information received would provide a comprehensive data set for identifying those tools that best meet the perceived needs of each community. See appendix.
The youth survey was designed to be carried out as a class exercise whereby the teacher ould ask the question, discuss it and ask for a show of hands on whether they agreed with w
the answer, did not agree, or did not have enough information to respond. The telephone survey also used a unique approach. Respondents were asked to respond to answers on a scale of 1‐5, one being “not a problem” and five being a “serious problem”, or six as “don’t know.” The Telephone Survey was meant to fill in information from Provinces or Territories where little information was received from the general mailing; i.e. the hard copy “faxed” survey.
While in the process of developing the questionnaires, the ESU staff tested proposed questions on each other and all comments for improvements were shared. This resulted in several drafts before finalization. The questionnaires were distributed via fax or email to all 633 First Nation communities with a cover letter explaining the purpose of the survey, instructions on what to do, and deadline for submittal. As mentioned above, the aim was to obtain a representative sample of First Nation respondents from all regions and from all First Nation communities. The Community leader’s survey was meant to be completed by those who considered themselves in a leadership position and was not limited to just Chiefs and Councilors. The youth survey (to be completed by students with the assistance of their teachers) was limited to grades 7‐12. The general survey was aimed at the general public, and the technical survey was meant for those with a working knowledge of environmental
a a shealth like public health nurses nd environment l/ nur e practitioners.
All questionnaires requested information on their community and its location, the respondent’s age (within a range) and gender. A more complete identification of the respondent was optional so that anonymity (if desired) could be maintained. The Youth Survey however, asked for the name of the Instructor or Teacher, the grade, and number of male and female students in the class. The reason for this is that at the end of the questionnaire they were asked if they wished to be involved in a project that was aimed at

improving their environment. We anticipate that the resource kit will contain project ideas and materials for youth and we would like a school or schools to field test a prototype toolkit. Having detailed contact information will be useful for follow‐up.
With the exception of the Youth Survey, copies of questionnaires were faxed or emailed to Band Offices and First Nation Environment Offices where they were asked (in the cover letter) to duplicate and distribute them to the selected target groups.
Upon receipt of the completed questionnaires, the data was entered into an MS Access database. The database was set‐up with data entry forms resembling each questionnaire, thus eliminating the need for coding. The telephone survey was designed for direct entry and was administered at the computer, no paper copies were used. For security reasons, electronic backups were done daily.
Most of the survey results are expressed in numbers of responses or percents of those responding to the question; i.e. numerator based on the number of persons who responded to the question, not the number of people in the survey. A blank or no response was not counted in the tally. In some cases where the response to a question was a range, it was considered appropriate to calculate the mode, i.e. the most frequently occurring or repetitive value in the range.

SURVEY RESULTS The following are the results of the analysis of the survey data by target group. A General Results section (below) provides the findings from the questions that were similar or identical across all surveys, allowing aggregation of responses. Subsequent sections provide the results of responses for each target group where the questions were unique. Some of the data (below) is presented in order of response; i.e. the greatest number of interviewees responding to that question.
DEMOGRAPHIC INFORMATION: Table 1 shows the number of questionnaires of each type returned and the gender of the
age group. interviewees. Table 2 is a breakdown by Province or Territory, gender and
Table 1. Number of questionnaires received by survey type and gender.
Type Survey Questionnaires received
# Males # Females
General 204 41% 74 37% 1 26 63%
Leaders 1 19 24% 42 37% 74 63%
Technical 10 2% 1 11% 9 89%
Youth 1 54 31% 78 51% 76 49%
Telephone 9 2% 3 33% 6 67%
Total: 496 100% 198 41% 291 59%
It is interesting to note that more females than males responded, and the age range of 50% of those responding was between the ages of 30 and 59 years. It is also interesting that 64% f those responding to the Leadership Survey were female. o
Table 2. Questionnaires received by Province or Territory, gender and age group.
Province or Territory
Males Females <15
1519
2029
3039
4049
5059
6069
70+
AB 48 56 18 48 3 11 4 8 6 5
BC 9 26 1 3 4 8 4

Province or Territory
Males Females <15
1519
2029
3039
4049
5059
6069
70+
MB 60 102 9 45 41 36 31 3 1
NB 1 6 0 1 3 2 0
NL 0 0 0 0 0 0 0
NT 11 12 23 0 0 0 0 0
NS 4 17 1 6 6 3 0
NU 0 0 0 0 0 0 0
ON 37 38 44 2 4 16 14 3
PE 0 0 0 0 0 0 0
QC 6 3 1 2 0 4 0
SK 19 25 6 12 0 6 10 8 2
YT 0 3 0 2 0 0 0
Totals 195 288 47 113 53 76 79 78 18 6
It should be pointed out that thirty‐three percent of those responding were from Manitoba with no responses from Newfoundland or Prince Edward Island. Of the 496 responses seven ere in Frenchw 3.
GENERAL SURVEY: Of the five surveys, 203 or 41% responses were to the General Survey. Of those completing this particular questionnaire, 37% were male and 63% female. In this survey, 50% of all respondents were between the ages of 40‐59 years of age, with the highest number belonging to the age group of 50‐59.
Concerning the question asking if there was a person responsible for environmental health in their community 62% said “yes,” and of those only 26% said this person was effective. Twenty‐two percent said they had contacted the government for assistance to solve an environmental health problem, but only 12% said the requested assistance was given.
ether or not the Band Office had provided information about Concerning the question on wh
3 The questionnaires were translated and sent in both official languages (French and English).

environmental health problems, 40% responded positively. Of those that said the band office provided information 72% said it was helpful.
Issues c ity problems are as follows: onsidered as commun
• Water quality issues* • Landfill issues • s Mold in housing unit
** • • Flood preparation
• Community cleanup Substance abuse
• Chemical spills• Sexually transm
; and, itted diseases.
*Most common issue.
**Second most common issue.
When asked if they have been involved in community activities that reduce risks to health and safe . Of those, the listed activities are as follows: ty, 42% confirmed that they had
• Community clean‐up, recycling*
• formation/ training sessions** • Flood control assistance
in•
Participation in health
• Newsletter distribution
ng ples
CPR/ first aid trainir samrse
• Collecting wate• Food safety cou
*Most common issue.
**Second most common issue.
When asked if they would participate in future community activities, 76% said “yes” they would.
Also, when asked if their community had an emergency response plan/ procedures in place, 43% said “yes”, 15% said “no” and 34% were not aware of a plan. The remainder did not answer.
One question in this survey focused on opinions concerning the need for developing resource materials for environmental health. The following “resource kit” topics are listed in order of priority with the percent of those indicating that information on this topic would be useful. Water quality control ranked highest followed by infrastructure improvements
air quality, etc.). (mold prevention and removal, overcrowding, indoor
Table 3. Resource kit topics listed in order of priority.
RESOURCE KIT TOPICS PERCENT SAYING THIS TOPIC WOULD BE USEFUL

RESOURCE KIT TOPICS PERCENT SAYING THIS TOPIC WOULD BE USEFUL
Improved drinking water quality: 70%
Improvements to private homes: 66%
Improved indoor air quality: 60%
Improvements to public buildings: 59%
Accident prevention: 59%
Occupational safety and health: 58%
Improved food safety: 56%
Improved waste disposal system: 54%
Monitor / improved lake, river, stream quality: 52%
Improved outdoor air quality: 47%
Mitigation of climate change impacts: 45%
Recovery of degraded natural ecosystems: 43%
Improved wastewater disposal system: 43%
When asked, which of the following resources and information types would be helpful in responding to the above issues, the following responded:
• A list of funding sources for community‐based projects: 72% hools: 65%
• e general community: 66% • Educational materials and projects for sc
d pamphlets for th•
Fact sheets, posters an
• Legal information and/or support: 54% Monitoring data: 51%
• Other (please specify): 5%; of which an officer or person responsible; statistical information and/or direct funding were listed.
Finally, when asked what the best way to disseminate information was, the following was the response:
• 65% Public meetings:
• • Posters: 62%
Schools: 59% • % Reports/ flyers: 59• Newspapers: 58%

• Word of mouth:
•
55% • 4% Chief and council: 5
• Radio: 52%
0%•
Canada Post: 5 36%Television:
• Internet: 35% • Other: 0%
It is interesting to note that radio, television and the internet rank the lowest, which could e due to the fact that First Nation issues are not usually addressed in the public media. b
LEADERSHIP SURVEY: The Leadership Survey resulted in 119 responses from those who considered themselves a leader in their community. This comprised 24% of all questionnaires received. Of those responding, 37% were male and 63% female (the same ratio as the General Survey). In this survey, 52% of the respondents were between the ages of 40‐59 years of age, with the highest number belonging to the age group of 50‐59.
Although 77% of those surveyed said there was a person responsible for environmental health in their community, only 38% said that person was effective. Thirty‐six percent said they had contacted the government for assistance to solve an environmental health problem, but only 21% said that assistance was given. This is a concern and illustrates the need to promote self‐reliance in environmental health matters.
When asked if they as leaders had met with the community to discuss environmental health problems, 20% said “yes.” Of those, most said they meet “as often as necessary.” This illustrates the need for an Environmental Health Resource Kit to assist in facilitation and community awareness.
Concerning the question on whether or not these leaders considered the community to be knowledgeable about environmental health problems; only 30% said “yes”; 29% said “no” and 36% said they “did not know.” Of those saying “no”, the topics they suggested commun mation on were: ity members needed more infor
• Mold prevention and removal* • Rodent/ vector control
unity cleanlines• ponsibilities • s General comm
• Home owner res
• Public safety Water pollution
• isposal** Safe drinking water and sewage dwareness
• al air pollution • Environmental a
• Airborne industri
• Climate change Blue/greeWaste disp
• Recycling
n algae • osal in general

• Animal control/ contrMost common issue. *Second most common issue.
ol of pets **
The results on the remaining questions appear in Table 4 and are summarized by counts of he number of persons that responded. t

Table 4: Leadership Survey
QUESTION YES NO UNSURE
1. Does your community have an emergency response procedure in place?
47
45%
14
13%
44
42%
2. Would you like more information about projects or materials to help develop projects that are aimed at improving environmental health?
79
77%
5
5%
19
18%
3. Would your community like to be involved in a research project that would provide answers on the nature and extent of any suspected environmental health hazard?
68
66%
4
4%
31
30%
4. Would your community like to be involved in developing and testing the materials to be contained in the Environmental Health Resource Kit?
97
91%
9
8%
1
1%
5. Would your community like to be involved in an environmental surveillance/ monitoring program?
90
88%
10
10%
2
2%
6. If project funds are made available for environmental improvement/ projects, would your office provide support?
72
67%
2
2%
33
31%
At the end of this survey there was a place to record “other comments.” They were as follows:
• We need information on how to prevent environmental damage from flood waters, construction of proper drainage systems, mosquito control (using less toxic chemicals), and how recognize and eliminate poisonous weeds.
• More community meetings or conferences/ workshops etc. would do a lot for raising awareness about environmental health concerns. They are usually more effective.
• g. Need information to deal with poor housin
• Need information on how to check water.
• We do not have information on problems in our community. If we did we could do more to solve those problems.

• Respondent asked for more information on blue/green algae and also listed it as one of the most severe environmental health problems.
• Special needs children ‐ births and deaths are off the charts – 55 times the normal rates.
• Cancer rates are off the charts – 100 times the normal rates.
• For over 25 years, posters and pamphlets have not resulted in change.
• nks, etc. on our Reserve. Non‐native neighbors dump old fridges, stoves, hot water ta
• Odors present from composting site at nearby community.
• There is a lot of information needed by our community; i.e. the Health Dept., Public Works Dept., Water and Sewer Dept., Fire Department, OCN and CNC Offices. This
t to the editor our weekly paper. information could also be sen
• Recycling programs needed.
• goEven our fish are “no od.” Damn pulp mill!
• Please ensure that a local contact person to disseminate, monitor, and coordinate environmental assessment information is not already on the existing staff.
TECHNICAL SURVEY: The Technical Survey was designed and intended for those persons responsible for some aspect of environmental health in their community. However, only 10 people responded, probably due to the length of the questionnaire (this was the longest survey). Of all those that responded, the total comprised only 2% of questionnaires received. Of these, 11% were male and 89% female. Most respondents were from NS. No ages were provided.
When asked if they considered their community a healthy place to live, 60% said “yes”, 30% said “no” and 10% were “unsure.”
When asked if they meet with the community to discuss environmental health problems, 40% said “yes.” Of those, most said they met “as often as necessary.” Concerning the question on whether or not they considered the community knowledgeable about environmental health issues; 67% said “yes”; 33% said “no”, and 0% said they “did not know.” Of those saying “no”, the topic they suggested community members needed more information on was housing conditions.
Concerning emergency preparedness, 80% said that in their community there was “a plan in place.” However, it should be noted that there was no indication that this plan had ever been activated.
When asked if litter was a problem, only 10% said “yes”, with 60% saying “sometimes.” Concerning mode of waste disposal, 70% said it was taken to the dump, 10% said it was

burned, 10% said they buried it, and 50% said they practiced recycling.4 As for the disposal of toxic wastes like used batteries and household pesticides, most respondents did not know how they were disposed of, while on the other hand they said medical wastes were either disposed of at the clinic or taken off‐site.
A question was asked about the perceived health of wildlife. Only 20% said they thought there was a problem. In this regard, 50% did not know if their community was aware of the government fish consumption guidelines; as well, the same 50% did not know if those that were aware were abiding by those guidelines.
As for h hnical staff; the following is in order of prevalence:ealth conditions observed by tec
•
5
Upper respiratory illness: 50% • Cancer: 30%
fections: 20% • stomach: 10% • Skin diseases/ in
et•
Diarrhea/ upsAccidents: 10%
• Allergies: 0%
This is what one would expect, although cancers seem to rank high.
A question was asked to determine if they knew of community members that worked in a place that exposes them to chemical risks. Forty percent said chemical exposure was a problem with 30% attributing this exposure to aquaculture6. As for physical risks, 50% responded positively “that there are risks.” The majority indicated that those in the construction industry were most at risk.
As for air pollution; 33% did not identify ambient air quality as a problem, while 22% thought it was a problem and indicated odor, dust and poor ventilation as the cause. Forty‐four percent did not know if the ambient air they were breathing was healthy.
A for drinking water, 89% said their water was tested on a regular basis with “no” boil water advisories issued. This response was higher than expected, but that could be due to the fact that this questionnaire was filled out by those who may be responsible for water quality control.
4 More than one answer was permitted on this question.
5 It should be noted that due to the small sample size, the reliability of these answers is questionable This being said, the results still give an indication of the types of health problems presenting themselves at First Nation clinics.
6 It is not clear what this means. More research would have to be conducted on the nature of the exposure. Also, aquaculture could mean offshore fishing, not necessarily the raising of fish in fish ponds.

Finally, most respondents indicated that the public water supply was either from a lake or wells. However, 78% indicated that private wells are an alternative source of drinking water, of which 89% have been tested.7
lts of the remaining questions asked on this questionnaire. The following are the resu
Table 5: Technical Survey
QUESTION YES NO UNSURE
1. Are there any air or water monitoring stations in or nearby your community?
6
67%
2
22%
1
11%
2. Are there facilities (industrial or otherwise) releasing or using toxic substances in or around your community?
4
44%
4
44%
1
11%
3. If there is a pond, lake or stream in or nearby your community, do you think it is polluted?
5
56%
2
22%
2
22%
4. Have you received any information about climate change and its impact?
3
33%
3
33%
3
33%
5. In your community is there any interest in knowing about climate change?
4
44%
0
0%
5
56%
6. Does your community have an environmental action plan?
0
0%
8
89%
1
11%
7. Would you like information about projects, or materials to help you develop projects?
5
56%
0
0%
4
44%
8. Would you like to be involved in a research project that would provide answers on the nature and extent of any suspected EH hazards in your community?
6
60%
4
40%
0
%
9. Would you like to be involved in an environmental surveillance/ monitoring program?
5
50%
5
50%
0
0%
7 It should be noted that this survey represents only seven communities and is not representative of First Nations as a whole. We are aware water quality is a problem on many reserves and do not want to say that this study contradicts that premise.
QUESTION YES NO UNSURE
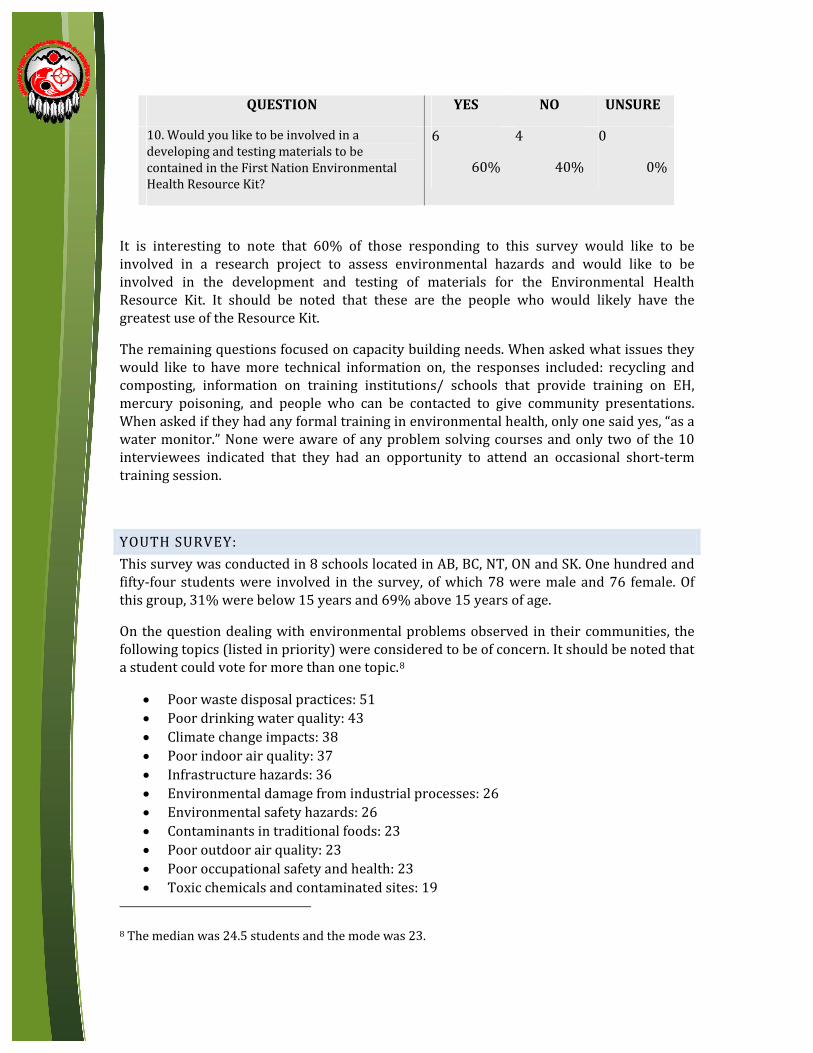
10. Would you like to be involved in a developing and testing materials to be contained in the First Nation Environmental Health Resource Kit?
6
60%
4
40%
0
0%
It is interesting to note that 60% of those responding to this survey would like to be involved in a research project to assess environmental hazards and would like to be involved in the development and testing of materials for the Environmental Health Resource Kit. It should be noted that these are the people who would likely have the greatest use of the Resource Kit.
The remaining questions focused on capacity building needs. When asked what issues they would like to have more technical information on, the responses included: recycling and composting, information on training institutions/ schools that provide training on EH, mercury poisoning, and people who can be contacted to give community presentations. When asked if they had any formal training in environmental health, only one said yes, “as a water monitor.” None were aware of any problem solving courses and only two of the 10 interviewees indicated that they had an opportunity to attend an occasional short‐term training session.
YOUTH SURVEY: This survey was conducted in 8 schools located in AB, BC, NT, ON and SK. One hundred and fifty‐four students were involved in the survey, of which 78 were male and 76 female. Of this group, 31% were below 15 years and 69% above 15 years of age.
On the question dealing with environmental problems observed in their communities, the following topics (listed in priority) were considered to be of concern. It should be noted that a studen ic.t could vote for more than one top
• 1
8
Poor waste disposal practice
•
s: 5• : 43 Poor drinking water quality
• Climate change impacts: 38
• Poor indoor air quality: 37
• l processes: 26 Infrastructure hazards: 36
• Environmental damage from industria
s: 26 •
Environmental safety hazard
• Contaminants in traditional foods: 23 Poor outdoor air quality: 23
afety and health: 23 ntaminated sites: 19
• Poor occupational s• Toxic chemicals and co
8 The median was 24.5 students and the mode was 23.

• Noise pollRadiation
ution: 18 exposure: 2 •• Others: 9
The last topic “Others” consisted of substance abuse (drugs, alcohol and inhalants), playground safety, and oil on roads as a dust suppressant. It is interesting to note that potential climate change impacts (as a problem) ranked 3rd on the Youth Survey.
Of the number of students responding to the question on perceived environmental iorities. problems, toxic substances, noise and radiation are low pr
The following are the results for the remaining questions.
Table 6. “Youth Survey” questions showing number of students responding.
QUESTION YES NO UNSURE
1. Are you concerned about the environment and health of the planet?
90
75%
9
8%
21
17%
2. Are you satisfied with the health and cleanliness of the environment in your community?
18
15%
85
71%
17
14%
3. Are you worried that your water is not safe to drink?
88
73%
10
8%
22
18%
4. Are you worried that the traditional foods you eat may be unsafe?
72
60%
16
13%
32
27%
5. Does anyone smoke inside your home? 60
53%
47
41%
7
6%
6. Are you aware of how the environment can affect your own personal health?
71
61%
7
6%
38
33%
7. At school, do you learn about protecting the environment and how an unhealthy environment can affect your health?
59
50%
30
25%
29
25%
8. If yes, do you share this information with the people in your home?
39
43%
40
44%
11
12%
9. Are you interested in learning about, or having more information on, how the environment can affect your health?
91
83%
5
4%
14
13%

QUESTION YES NO UNSURE
10. Would you like to be involved in a project that is aimed at improving the environment?
44
47%
26
28%
23
25%
Of those that answered “yes” on question #9, the following is a list of topics they would like more in riority by number of students responding: formation on, listed in order of p
• Poor drinking water quality: 49
• • Poor indoor air quality: 35
s: 35 •
Poor waste disposal practice
• Contaminants in traditional foods: 35
• Climate change impacts: 34
• Toxic chemicals and contaminated sites: 30
• trial processes: 28
Poor outdoor air quality: 30
• Environmental damage from indus
• Infrastructure hazards: 25
zards: 21 • and health: 19
Environmental safety hasafety
• Poor occupational
• Radiation exposure: 15 Noise pollution: 3
• Others: 6; consisting of global warming, substance abuse and recreational safety.
Of those students responding to question 9 (above), the median was 29 students and the mode was 35.
Results on the question that asked how students contribute to a healthy environment are as follows . Students indicated that they: , listed in order of priority
• Conserved electricity: 63
• 1 • Conserved water: 61
ity: 5• s: 45
Picked up waste in the commun and glas
• rly: 44 Recycled plastic, paper
• Disposed of waste prope
wildlife: 38 Protected• Involved in a project: 28 • Others: 7
Others” mainly consisted of: “not” smoking. “
TELEPHONE SURVEY: Due to the nature of this survey (see above) only 9 persons responded, representing only 2% of all those surveyed. They were from the Provinces of SK, ON, NB and MB. Of this group 33% were male and 67% female ranging in age between 30 and 59.

After introductions, the first question asked was: “What do you think Environmental Health means?” The responses were varied but most focused on cleanliness. The best response was:
“Longevity, sustainability, cleanliness (water & air), and good spirits.”
A component of the telephone survey focused on finding out how the respondents felt about s problem. an issue on a scale of 1‐5 where 1 was not a problem, 3 neutral, and 5 a seriou
he following are the responses to the questions asked using in this manner. T

Table 7: Telephone Survey
Questions – responses are on a scale of 15.
Mode Mean Min Max
AIR QUALITY
1. How much of an environmental health problem is indoor/ outdoor air quality?
3 2.4 1 3
2. How would you rank the level of priority in addressing vehicle emissions in your community?
2 1.88 1 3
3. Are vehicle emissions a problem? 1 1.77 1 4
4. Is your community affected by industrial air pollution?
1 2.1 1 5
5. Is the use of wood burning stoves and/ or fireplaces to health homes considered a health problem in your community?
1 1.25 1 2
6. Do you consider the burning of household garbage a health problem in your community?
1 1.88 1 2
7. How much of an environmental health problem is tobacco smoke and secondhand smoke in your household?
1 2 1 5
8. Do you believe that tobacco smoke or secondhand smoke is a health problem in your community?
5 3.77 1 5
9. Do you believe that mold is a health problem in your community?
5 4 2 5
WATER QUALITY
1. Do you believe that your community’s drinking water quality is a problem?
1 2 1 4
2. Does your community consider drinking water quality a priority?
5 4.22 1 5
NUISANCES
1. How much of an environmental health problem is abandon vehicles and junk yards?
2 2 1 3
2. How much of an environmental health problem is illegal dumping and open dumps in your community?
3 2 1 3

Questions – responses are on a scale of 15.
Mode Mean Min Max
3. How much of a health concern is loose dogs or wild animals in your community?
4 3.33 1 4
PUBLIC AWARENES S
1. How prepared is your household for an emergency or natural disaster?
3 3.22 1 4
When asked to rank a problem on a scale of 1‐5, Table 6 shows that mold in homes and drinking water quality were considered to be the most serious.
When a responses: sked questions about climate change, the following were some of the
• Migration of wildlife; we're seeing species we’ve never Sunburn! I'm very sensitive, and I can't be outside the w
seen before. ay I used to. •• Shoreline erosion and flooding is becoming a problem.
When asked if they would like more information on the impact of climate change, 78% said “yes.”
When asked if they were interested in activities that reduce risk to public health and safety, 89% said “yes.”
COMMON QUESTIONS: Each questionnaire covered some of the same material. The data below was consolidated by question with some responses appearing in table form. For example a common question concerned opinions on whether or not they thought their community was a healthy place to live. Out of 338 interviewees who responded, 181 or 54% responded “Yes”, while 146 or 43% said “No.” The remaining respondents (3%) were unsure.
Concerning the question on whether or not the Band Office provides information about environmental health problems, 42% of all respondents answered positively.
The table below is in response to the question: “Which of following environmental health problems exist in your community?” More than one answer could be ticked. Of those responding to this question, a follow‐up question asked respondents to pick which of the ssues listed in bold they considered to be a priority action item. i

Table 8: Environmental Health Problems and priority issues.
Table 8
Environmental Issues
Yes No I Don’t know
Considered a priority
a) Unsafe drinking water 153 100 38 30
b) Poor lake, river and stream quality 146 72 73 17
c) Environmental Contamination from: 31
• industry (mines, pulp & paper, etc)
147 66 47
• agricultural activity 68 106 69
• isposal improper sewage d 103 94 62
• community dump 159 71 34
• other (please specify)
d) Degraded wildlife habitat / destruction of natural ecosystems
115 69 87 22
e) Problems with rats, insects or other pests
134 100 42 9
f) Poor outdoor air quality from: 26
• nearby industry 151 90 23
• vehicle exhaust 141 100 126
• barrel burning 80 138 141
• ltural dust/burning agricu 89 125 42
• odors 146 91 27
• ust road or construction d 177 87 17
• other (please specify)
g) Poor indoor air quality 79 49 19 13
h) Do you smoke or are you or any of your family members exposed to second‐hand smoke in the indoor air:
10

Table 8
Environmental Issues
Yes No I Don’t know
Considered a priority
• ome in your h 57 50 2
• at work 28 73 2
i) Inadeq isposal uate waste d 29
• open dumps 171 89 24
• g indiscriminate dumpin 134 100 46
• hazardous waste sites 81 125 61
j) Environmental contamination from inappropriate use or storage of toxics / chemical waste / pesticides / herbicides
66 112 93 7
k) Inadequate wastewater disposal system or drainage
90 106 92 11
l) Inadequate public infrastructure (including buildings, plumbing or electrical)
123 82 77 14
m) Inadequate housing conditions: 93
• need new buildings or capacity to better maintain existing buildings
226 48 23
• houses are frequently over‐crowded
232 46 19
n) Environmental hazards, including: forest / grass fires, flooding, drought, extreme heat, extreme cold, climate change impacts, or other
147 75 47 10
o) Food safety 11
• s contaminated traditional food 86 125 62
• contaminated / unsafe store‐bought foods
81 134 71
p) Accidents (including sports related) 131 88 71 6
q) Occupational health and safety (noise, chemicals, safety hazards)
112 105 68 4
r) Other Issues (please list)

It is interesting to note that in general “inadequate housing” is considered a priority issue, ypes). followed by environmental contamination (all t
Comme as follows: nts on (c) “Other Issues” are
• in water Suspected arsenic
• • Minor fuel spills
• ntake Blue/ green algae
r source i• disposal
Questionable location of watege
• r Improper household garba
inated ground wate• m landfill site
Contam
• Leachate fro
• Mold* Insecticide
•
s • Chemicals in river
• ites Dog feces
dumps•
Unknown
• Uncapped wells
ities Asbestos
• Dust from logging activ• Petrochemical spills**
Most common concern *Second most common concern **
Under ( the following was listed. f), “Poor outdoor air quality from (other)”
• y factories and railroad* Noise form nearb• age Burning garb• Bush fires • Airport dust
Most common concern *
Under ( g were of concern. r) “Other issues” the followin
• No street ligh
•
ts or sidewalks • t homes Overcrowding and single paren
• Land erosion
• ug dealing))* Lack of hazardous waste depot Social problems (stress, violence, d
ose dogs and• marked)
rugs, abuse, alcohol, crime (dr• wildlife (bears and cougars)) No animal control (lo
ATV accidents (trails notars tions**
• Too many junk c• Oil and gas opera
*Most common concern

* *Second most common concern
Table 8 shows which issues people would like more information on.9 These issues are listed in order of priority by the number of responses, with the top five coded in red.
Table 8: ENV HEALTH CONCERNS
1. Improved drinking water quality 59
10. Accident prevention 49
13. Improve food safety 46
8. Improvements to private homes 46
11. Occupational safety and health 45
12. Mitigate climate change impacts 45
3. Improve degraded natural ecosystems 43
2. Monitor / improve lake, river, stream quality 42
9. Improvements to public buildings 42
6. Improve waste disposal system 41
5. Improve indoor air quality 40
4. Improve outdoor air quality 38
7. Improve wastewater disposal system 37
9 On all tables, more than one answer was allowed.

Table 9 shows interests in resource kits and preferred modes of communication. The top five issues are coded in red.
Resource kit required
Funding sources for com
munity projects
Legal information/ support
Educational materials and
projects for schools
Fact sheets posters and pam
phlets for the general com
munity
Monitoring data
Other (please specify)
Priorities – top tow modes
of intervention
TABLE 9
Environmental Issues
A B C D E F G
1. Improve drinking water quality
59 30 22 31 31 30 0 Funding; fact sheets & monitoring data
2 Monitor/ improve lake, river, stream quality
42 31 19 26 33 28 3 Fact sheets & funding
3. Improve degraded natural ecosystems
43 28 25 26 34 26 4 Fact sheets & funding
4. Improve outdoor air quality
38 29 20 19 23 27 4 Funding & monitoring data
5. Improve indoor air quality
40 28 20 21 30 29 3 Fact sheets & monitoring data
6. Improve solid waste disposal systems
41 30 19 18 26 28 3 Funding & monitoring data
7. Improve wastewater disposal systems
37 36 18 18 32 28 3 Funding & fact sheets
8. Improvements to private homes
46 40 20 21 33 23 3 Funding & fact sheets
9. improvements to public buildings
42 39 21 22 32 26 3 Funding & fact sheets

Resource kit required
Funding sources for com
munity projects
Legal information/ support
Educational materials and
projects for schools
Fact sheets posters and pam
phlets for the general com
munity
Monitoring data
Other (please specify)
Priorities – top tow modes
of intervention
TABLE 9
Environmental Issues
A B C D E F G
10. Accident prevention 49 22 21 26 36 29 3 Fact sheets & monitoring data
11. Occupational safety and health
45 32 28 22 40 31 3 Fact sheets & funding
12. Mitigate climate change impacts
45 23 18 21 26 28 3 Monitoring data & fact sheets
13. Improve food safety 46 22 18 18 34 24 4 Fact sheets & monitoring data
Column Totals: 573 390 269 280 410 357
39

Table 10 shows what the interviewees considered the best mode of intervention in terms of issues10. The top five issues are coded in red.
Inform
ation pam
phlets/
posters/ b
rochures
Elementary/ secon
dary sch
ool program
Infrastru
cture im
provem
ent
project
Particip
ation in govern
ment
funded program
s (GFP)
Lobbyin
g/ negotiation
s with
related industry or govern
ment
Profession
al training p
rograms
Other (p
lease specify)
Priorities – top
tow modes of
interven
tion
TABLE 10
Environmental Issues
A B C D E F G
1. Poor drinking water quality
78 26 42 39 21 50 9 Professional Training & Infrastructure
2. Poor lake, river, stream quality
37 18 23 30 28 23 9 GFP & Lobbying
3. Degraded wildlife habitat
40 27 18 33 21 19 9 GFP & School Programs
4. Poor outdoor air quality
39 19 18 17 19 11 8 Lobbying & School Programs
5. Poor indoor air quality
50 19 22 18 20 19 8 Infrastructure & Lobbying
6. Insufficient waste disposal
42 11 26 19 24 21 10 Infrastructure & Lobbying
7. Inadequate wastewater disposal system
33 14 28 22 24 18 9 Infrastructure & Lobbying
8. Inadequate public infrastructure (including buildings, piped water etc)
36 20 37 26 26 27 10 Infrastructure & Professional training
10 The analysis does not include the provision of information pamphlets/ posters and brochures, which is a given.

Inform
ation pam
phlets/
posters/ b
rochures
Elementary/ secon
dary sch
ool program
Infrastru
cture im
provem
ent
project
Particip
ation in govern
ment
funded program
s (GFP)
Lobbyin
g/ negotiation
s with
related industry or govern
ment
Profession
al training p
rograms
Other (p
lease specify)
Priorities – top
tow modes of
interven
tion
TABLE 10
Environmental Issues
A B C D E F G
9. Inadequate housing conditions (need more buildings or capacity to better maintain existing buildings)
39 21 39 36 31 23 10 Infrastructure & GFP
10. Accident prevention
84 33 14 22 14 41 14 School programs & Professional training
11. Occupational safety and health
74 31 17 21 18 42 12 School Programs & Professional Training
12. Mitigation of climate change impacts
46 23 15 19 22 23 12 School Programs & Professional Training
13. Improving food safety
71 34 13 20 16 37 10 Professional Training & School Programs
Column Totals: 669 296 312 322 284 354 130
Note: Concerning the five highest ranked issues, professional training and participation in government funded programs is seen as the most effective mode of intervention.

DISCUSSION From the demographic information, we believe we have sampled a representative cross‐section of First Nations across Canada. The response rate for this survey is considered quite high when compared to other comparable First Nation surveys. It is clear from the responses that First Nation peoples are often provided with various types of public information packages/ campaigns, which include facts sheets, posters and other printed material. While these materials provide public awareness information on a particular issue, they seldom provide community members with guidelines for alternative practices and practical solutions to rectify problems. The survey therefore posed questions on other ways
ivatto communicate that not only raise awareness, but mot e action.
Concerning the best way to communicate and raise awareness, most of those surveyed preferred direct contact through public meetings, workshops or training sessions. Visual materials like posters, flyers and pamphlets, and even newsletters are of interest, but this could be due to familiarity with this mode of communication. It is interesting to note that 59% of those surveyed thought information dissemination through the schools would be appropriate. The Band Office was also noted as a central point for communications. From the above, it is inferred that person to person contact with somebody knowledgeable is crucial.
As for the pr st Nation communities, the top five concerns were: oblem issues faced by Fir
• ty Drinking water quali
• vention Accident pre
• Food safety
• Improvements to private homes
• Occupational safety and health
This however does not mean that other topics are not important and should not be covered. The survey revealed that issues varied from region to region, community to community and by target group. Nevertheless, it should be noted that of 13 common issues listed in the survey questionnaires, those of least concern were: radiation exposure and noise pollution.
It is interesting to note that climate change was an issue of concern with the younger generation, but not the older generations. Animal control was another priority concern, which is likely due to an uncontrolled population of dogs. This however, should not be downplayed as poor animal control could result in a rabies outbreak. Other issues (some unexpected) were blue/green algae, the need for recycling, flood control procedures, home owner responsibilities, drug and substance abuse information, and environmental safety hazards, which included recreational safety.
It should be noted that what one perceives as a community problem (as identified by this survey) may not actually be a priority in terms of community health, while other issues

sometimes overlooked or under‐rated could pose significant hazards to public health. The only way the environmental health of a community can be determined is by systematic and periodic monitoring by qualified technicians. There is a definitely a need for trained technicians to conduct such monitoring and surveillance activities. Although this is the ideal, it may not be practical due to the remote location of some communities and lack of funding to support training. However, low‐cost community‐based, participatory methods can provide relevant data, i.e. enough information to develop an environmental health action lan. Guidelines for these methods can be included in the resource kit. p
RECOMMENDATIONS PROPOSED RESOURCE KIT COMPONENTS: This survey indicates that an Environmental Health Resource Kit is feasible and justified. The interest expressed by First Nations in taking the time to complete a lengthy questionnaire and return it to us is in itself proof that there is an interest in the subject matter and in having a resource kit to learn more about what can be done to address the issues. However, it should be more than just a booklet of information or a set of brightly colored posters. While such items can be useful in starting an awareness‐raising campaign, what is needed over the long‐term is a kit that contains practical information and tools on how to best promote self‐reliance and take action on identifying and solving environmental health problems. The adoption and use of such a resource kit demonstrates that it is not necessary to rely on outside help to initiate action. Such resource kits are not new. In developing countries, they are a vital component of an aid agency’s package of tools. Although this method of promoting action has been successful in other settings (in developing countries), the materials (such as those suggested below) will be specific to First Nations. However, to enhance a successful outcome, some of these materials will require field testing. This is why in both the technical and school surveys we requested contact information. It is anticipated that we will be asking those that responded to these survey’s if they are interested in assist us in the development and testing of a resource kit in the next phase of this project.
It is also evident that communications within and among First Nation’s communities can and should be improved. We therefore suggest including guidelines and instructions on setting up websites and on purchasing and licensing low‐power FM broadcast transmitters, which have a five to 12 mile transmission range. FM community radio can be operated out
of a home or the band office by volunteers.
The internet, where applicable, and/or community radio would make it possible to communicate environmental health information that is relevant and community specific, both of which have yet to be used to their full potential.
Another issue that should be addressed in the First Nation Environmental Health Resource Kit is a lack of capacity in First Nation communities to address environmental health issues.

We therefore suggest that the resource kit include available course outlines, available funding sources and contact information.11
In order to involve school age youth in the program we suggest that water quality test kits12 and project materials be included in the kits. These kits are simple and inexpensive and can easily be made through subcontract with a University or a laboratory. We also suggest purchasing simple weather measuring instruments, which we feel will not only promote the
aconcept of environment l surveillance, but will make it possible to monitor climate change.
The following is a list of suggested tools (and estimated costs). These cost figures are estimates based on distribution to 633 First Nation’s communities, plus another 120 (or so)
ties. for First Nation’s organizations, schools and other interested par
Table 11. Resource kit components and estimated costs.
Table 11: Recommended resource kit components
Estimated cost
Comments/ Description
AWARENESS MATERIALS:
1. Posters on climate change impact; the water cycle; environmentally related diseases; food safety, etc.
$5,00013 This only requires art and graphics work. The concepts are readily available.
2. Fact‐sheets and directories of contact persons/ agencies and grant organizations including professional training options..
$4,500 Much of this material is already accessible to AFN and just has to be collected and collated.
PARTICIPATORY RESEARCH (includes accident prevention):
3. Materials on participatory research, composting, recycling and waste reuse, chemical safety, accident prevention, and environmental health
There are several documents, pamphlets and booklets that contain “how to” information that can be adapted for First Nation’s use.
11 If it is found that in the process of compiling the toolkit there are gaps in available environmental health services, this exercise will make it possible to lobby for those services.
12 These kits can also be used by community members for private well testing and to verify that the public water supply is safe. They can also be used as an educational tool to show how water becomes contaminated and the importance of disinfection.
13 Please note that this is the cost for layout and design and does not include printing. The same applies to Item #’s 1, 2, 9, 11, &14.
14 Items #3, #7 & #12 can be done by AFN’s ESU staff. Cost of art/graphics work, printing and packaging are not included.

Table 11: Recommended resource kit com op nents
Estimated cost
Comments/ Description
action planning, etc.14
WATER QUALITY:
4. H2S water quality test kit (10 tests per kit); including a pH and Chlorine comparator with instructions.
$15,00015 This test kit can be made in a high school lab with readily available chemicals. Each test comprises a screw top test tube containing a strip of absorbent paper impregnated with reagent that will turn black within three days of incubation at room temperature if filled with water that is bacteriological contaminated.
5. Materials for the Microtox test to determine the toxicity of soils and water samples.
$6,000 This is a very simple test that compares the growth of roots of lettuce seedlings or onion bulbs in pure water and sample water. Toxins inhibit root growth.
CLIMATE CHANGE:
6. Basic weather instruments for collecting meteorological data.
$69 ea Concerning the topic of climate change, we suggest that the resource kit include basic weather measuring instruments like a relative humidity meter, indoor/outdoor thermometer and anemometer.
HOUSING IMPROVEMENT:
7. A document on homeowner responsibilities, and guidelines for improvements.
This document would include information on mold prevention and removal, care of septic systems, household food safety, pest control, storage and use of chemicals, etc.
FOOD SAFETY:
8. Information on food safety, nutrition, and how to prevent contamination of traditional foods16.
A booklet on regulations and information on how to keep food safe. Fish consumption guidelines could be included.
15 Estimated cost for 750 kits. Also applies to item #4.

Table 11: Recommended resource kit components
Estimated cost
Comments/ Description
MISCELLANEOUS INFORMATION and SUPPORT MATERIALS:
9. Environmental health training/ information modules.
See table 12 below.
Information on specific environmental health issues.
10. Other documents provided to First Nation by agencies in support of First Nation’s programs (includes ACCIDENT PREVENTION and OCCUPATIONAL SAFETY AND HEALTH).
Example, “Communities at Risk: Security Infrastructure Pilot Program Application Guide” distributed by Public Safety Canada.
11. Activity books and instructions for school projects on environmental health.
$10,500 There are materials available over the internet for projects such as for monitoring the health of a river called the “River Watch Program.” Other booklets and guides for school projects can be produced at a relatively low cost.
12. Information on environmentally related social programs (case studies).
Successful programs should be documented. By promoting ATK, First Nations outreach, life skills and survival programs many social problems associated with today’s youth can be avoided.
13. CD‐ROM $16,000 Includes audio and video clips and PowerPoint presentations for community awareness.
16 A special (label) thermometer that can measure refrigeration temperatures will be included in the kit at $1.00 ea.

Table 11: Recommended resource kit components
Estimated cost
Comments/ Description
14. PowerPoint Presentations $4,400 Any number of presentations could be developed that focus on environmental health. These are meant to be used in conjunction with the modules proposed in item 9.
Item 9 in Table 11 are training modules. This is a document that ties all the other components together. It is a training/ information manual with modules that provide key information or “how‐to” information and guidance for understanding the other components ncluded in the First Nations Environmental Health Resource Kit. i
COST ANALYSIS: Table 12, below, provides estimated costs of various versions of the module component as describe under the Project Implementation (below). This however is an estimate and will vary according to the final contents of the resource kit. The total cost of developing the resource kit can vary depending on how much detail is required for each component including the modules. The human resource aspect of the project will naturally be the greatest expense. This will need to be negotiated once the project (in principle) is approved. However, once the draft components are completed, the prototype will be sent to a publisher who will provide graphic design, edits and desktop services for the kit. The approximate costs relating to the design and production of the “module” component are as ollows: f
Table 12: Cost comparison of three types of resource kit (each module):
Estimated cost
Comments/ Description
1. Low budget –
A series of binders; colored cover, plain black and white interior.
$5,250 This only requires art/graphics work. The concepts are readily available and need only be adapted to First Nation’s reality.
2. Medium Budget –
Modules in a stapled booklet format: colored cover, three colors in the interior,
$7,250 Colored graphs, some color in the text and borders

Table 12: Cost comparison of three types of resource kit (each module):
Estimated cost
Comments/ Description
3. High Budget –
Modules in a soft cover book format: fully colored cover and interior
$9,250 Colored graphs, photographs
Tables 11 and 12 are rough estimates. Accurate costing will require a more complete description of each tool (component). Such details will require preliminary research, identification of appropriate materials and consultation with potential subcontractors for graphics work, printing and packaging.
The above noted figures are for the design of the First Nations Environmental Health Resource Kit. The actual printing and packaging costs and an electronic version of print materials (on CD ROM) will be extra. These costs were not calculated as it is presently unknown if only 633 kits (one for each First Nation) will be produced, or a higher number to allow for multiple target audiences such as band offices, health centers, schools, tribal councils, friendship centers, affiliated organizations, etc.
Other requirements: In order to efficiently develop the kit components and field test those om Fir t .aspects requiring input fr st Na ions, we propose hiring a Coordinator
It is suggested that the next stage of work focus on providing further details on each omponent and costs. c
PROPOSED PROJECT IMPLEMENTATION :: A project implementation group will be established by the AFN Environmental Stewardship Unit to undertake the execution of the First Nation Environmental Health Resource Project. Staff with an interest and expertise in a particular topic will be assigned the task of researching that topic and developing First Nation specific materials. These activities will be coordinated by a staff person hired for this purpose. If appropriate, AFN ESU team members or coordinator will work with outside contractors to develop the suggested resources, materials and pre‐production drafts. The components will then be assembled and handed over to a contractor for final production and packaging.
The overall project will take about 21 months to complete; i.e. from the scheduled approval date, to material identification, adaptation, draft production, field testing, revisions, printing, packaging and distribution. A detailed work plan showing responsibilities and
etimelines will b forthcoming.
The AFN ESU will use competitive tendering to obtain the best quality material and contractors. Emphasis will be placed on using contractors who are familiar with First Nation cultures and organizations, provided it does not significantly affect costs, scheduling, or quality of the work.

As discussed, traditional public awareness campaigns are popular and have been successful in transmitting a message to First Nations, but they do not provide information on what to do next to promote action. The AFN ESU First Nation Environmental Health Resource Project will provide First Nation communities, officials and residents with detailed information on how to identify, resolve and correct environmental health problems as well as conduct surveillance activities and monitor conditions as benchmarks for future reference. The resource kits will contain components (tools) and a set of modules that will provide general information on how to use those components. It will also contain easy‐to use guidelines and procedures on a variety of issues. In addition, the module section will contain appendices or work books that will provide forms, draft letters, by‐law references, contact lists and actual precedents to instigate corrective action or utilize available government processes. This will also be included on the CD‐ROM. It must be kept in mind,
ehowever, that the primary objective of the resource kit is to promote s lf‐reliance.
At the outset, the AFN ESU estimates that a total of 14 components are necessary for the resource kit, including the set of training/ information modules. The modules will provide specific information on environmental health issues; i.e. what to monitor, how to monitor, health concerns and suggested corrective actions, the resources for which will be contained in one or more of the other resource kit components. The modules will also provide a number of resources for First Nation officials to use on a macro level, which could be case studies of what other communities across Canada have done, how to trigger an environmental assessment, who to contact for assistance, how to access laboratory services, and/or other relevant information.
As an example of what the modules might contain, it is proposed that they focus on (but not be limited to) the following topics:
• ated diseases Environmentally rel
• Ambient air quality
• ti‐smoking Indoor air quality – includes an
• l control Vector control/ anima
• Water quality control
• Climate change impact assessment
• redness Emergency management/ prepa
• rces Protection of natural resou
• Food safety and nutrition
• Toxic substances in the environment
• s Safe housing and homeowner responsibilitie
• n Recreational safety and accident preventio
• Waste disposal, recycling and waste reuse
• Environmental monitoring and surveillance

• Community‐based research methods
• Raising awareness and promoting action
The key n stre gths of this approach are:
• First Nation officials will have easy access to relevant information on issues of concern;
• First Nation officials will have detailed contact lists for outside assistance such as laboratory services, expert advice and on‐going government programs, training facilities and project funds;
• First Nations communities will become empowered, self reliant and will not have to rely on outside help or consultants for issues they can handle;
• First Nations communities will be able to monitor the health of their own environment and create action plans to improve conditions; and,
• Individuals within First Nations communities will become motivated to pursue a career in environmental health that is relevant to community needs.
Key Weaknesses include:
• ted in using them; Materials do not find there way to those most capable and interes
• x to be Materials are too comple useful to the general population;
• The level of poverty in a First Nations community is such that survival, chronic l health; illness and social issues are more important than improving environmenta
• m nThe odules require “hands‐on” trai ing in their use to be effective; and,
• The materials and the information they contain are not shared with the general population.
In addition to the core elements of the resource kit, the modules will refer to a number of supporting public informational documents, guidelines, posters, etc. These materials will provide quick information on environmental issues and will provide additional references. It is anticipated that WHO’s electronic library on “Water, Sanitation and health” (on CD ROM) will be included at no extra cost. In addition, several items have been included that are necessary for active community participation such as the H2S paper‐strip water quality

test, which costs about $0.05 per test;17 a low‐cost pH and Chlorine comparator; a Microtox test kit; basic meteorological instruments; a special low‐cost refrigeration thermometer18; etc. Both the Microtox and H2S test kits can be made locally from readily available materials. It is anticipated that (if successful) there would be interest within First Nations in creating a small‐scale business enterprise to make and sell these materials
It is anticipated that the resource materials contained in the kit will not only promote interest in environmental health, but will provide practical, on‐the‐ground information and step‐by‐step instructions that will assist, as well as train First Nation community members and officials on how to identify and address environmental health concerns, thus promoting self‐reliance.
17 The H2S test was successfully introduced to the Cree Nation of Split Lake in 1990 via an IDRC ponsored project. See report at the following web address: t tml
sh tp://archive.idrc.ca/books/reports/V211/indig.h 18 Refrigerator temperature labels at $1.00 each.