Embed Size (px)
Citation preview

First half 2021
Financial report

July 29, 2021 Second quarter and first half 2021 financial report 2/28
Regulated information Published on July 29, 2021, at 7:00 a.m.
Forenote Besides IFRS accounts, Solvay also presents alternative performance indicators to provide a more consistent and comparable indication of the Group’s underlying financial performance and financial position, as well as cash flows. These indicators provide a balanced view of the Group’s operations and are considered useful to investors, analysts and credit rating agencies as these measures provide relevant information on the Group’s past or future performance, position or cash flows. These indicators are generally used in the sector it operates in and therefore serve as a useful aid for investors to compare the Group’s performance with its peers. The underlying performance indicators adjust IFRS figures for the non-cash Purchase Price Allocation (PPA) accounting impacts related to acquisitions, for the coupons of perpetual hybrid bonds, classified as equity under IFRS but treated as debt in the underlying statements, for impairments and for other elements that would distort the analysis of the Group’s underlying performance. The comments on the results made on pages 3 to 9 are on an underlying basis, unless otherwise stated.

July 29, 2021 Second quarter and first half 2021 financial report 3/28
Underlying business review Solvay raises full year guidance following double-digit sales and EBITDA growth in Q2 2021 Highlights
• Net sales in the second quarter of 2021 were up +20% organically versus Q2 2020 and back to 2019 levels in most markets with particularly strong demand in automotive, electronics and building industries. Excluding composites and oil & gas, sales were up +22% versus Q2 2020 and up +6% versus Q2 2019.
• Structural cost savings of €51 million were delivered in Q2, totalling €131 million in the first half 2021, on track to meet the projected annual savings of €200 million.
• Underlying EBITDA of €602 million in Q2 2021 was up +47% year on year on a comparable scope and foreign exchange basis, reflecting strong demand and continued cost reductions. First half 2021 EBITDA is 5% higher than first half 2019.
• EBITDA margin of 24.5% is 4.3 percentage points higher than Q2 2020 as a result of the higher volumes and structural cost measures, though rising raw material, energy and logistics costs impacted Q2 by approximately €50 million.
• Underlying Net Profit was €276 million in Q2 2021, more than double the delivery in Q2 2020. • Free Cash Flow was €135 million in Q2 2021 reflecting the expected seasonal payments of
employee bonuses and higher financial charges. Excluding scope and one-time benefits in 2020, first half 2021 FCF of €417 million was around 25% stronger than in H1 2020.
• Portfolio simplification continues, with the divestment of six business lines and the completion of a bolt-on acquisition in Agro.
• Solvay ONE Planet extends the ‘better life’ pillar with the launch of Solvay ONE Dignity, which includes nine goals by 2025 to accelerate Diversity, Equity and Inclusion.
Second quarter First half
Underlying (in € million) 2021 2020 2019 % org 21/20
% org 21/19 2021 2020 2019
% org 21/20
% org 21/19
Net sales 2,456 2,175 2,654 +20.4% -1.4% 4,829 4,649 5,225 +10.5% -2.3%
EBITDA 602 439 624 +47.4% +3.3% 1,185 1,008 1,195 +26.5% +5.0%
EBITDA margin 24.5% 20.2% 23.5% - - 24.5% 21.7% 22.9% - -
FCF 135 233 123 - - 417 435 33 - -
FCF conversion ratio (LTM) 46.1% 49.0% 28.2% - - 46.1% 49.0% 28.2% - -
CEO Quote “I’m proud of our team’s determination to take full advantage of the robust demand environment as we drive strong top line growth, with June volumes surpassing 2019 levels. Our structural cost actions and pricing initiatives sustained our leading margins in the quarter. Further, our disciplined approach to cash management is contributing to continued deleveraging. As we look ahead, we remain focused on mitigating the inflationary environment, and on reinvesting in our key growth areas including batteries and electronics, which will drive superior growth across the mid-term.” 20211 Outlook Full year underlying EBITDA estimate is increased from €2.0 to €2.2 billion previously to €2.2 to €2.3 billion. Free Cash Flow estimate is increased from €650 million previously to around €750 million.
1 Barring additional deterioration related to a third wave of Covid-19 in the second half.
July 29, 2021 Second quarter and first half 2021 financial report 4/28
Key figures
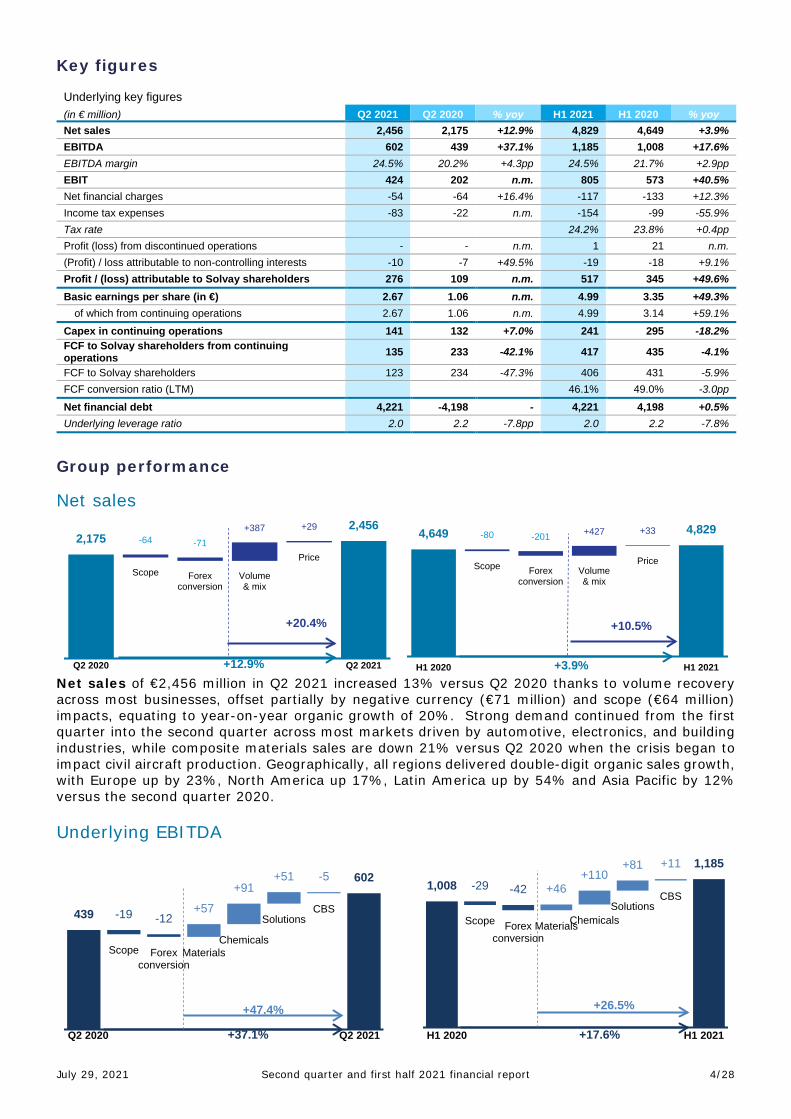
Underlying key figures (in € million) Q2 2021 Q2 2020 % yoy H1 2021 H1 2020 % yoy Net sales 2,456 2,175 +12.9% 4,829 4,649 +3.9% EBITDA 602 439 +37.1% 1,185 1,008 +17.6% EBITDA margin 24.5% 20.2% +4.3pp 24.5% 21.7% +2.9pp EBIT 424 202 n.m. 805 573 +40.5% Net financial charges -54 -64 +16.4% -117 -133 +12.3% Income tax expenses -83 -22 n.m. -154 -99 -55.9% Tax rate 24.2% 23.8% +0.4pp Profit (loss) from discontinued operations - - n.m. 1 21 n.m. (Profit) / loss attributable to non-controlling interests -10 -7 +49.5% -19 -18 +9.1% Profit / (loss) attributable to Solvay shareholders 276 109 n.m. 517 345 +49.6% Basic earnings per share (in €) 2.67 1.06 n.m. 4.99 3.35 +49.3%
of which from continuing operations 2.67 1.06 n.m. 4.99 3.14 +59.1%
Capex in continuing operations 141 132 +7.0% 241 295 -18.2% FCF to Solvay shareholders from continuing operations 135 233 -42.1% 417 435 -4.1%
FCF to Solvay shareholders 123 234 -47.3% 406 431 -5.9% FCF conversion ratio (LTM) 46.1% 49.0% -3.0pp
Net financial debt 4,221 -4,198 - 4,221 4,198 +0.5% Underlying leverage ratio 2.0 2.2 -7.8pp 2.0 2.2 -7.8%
Group performance
Net sales
Net sales of €2,456 million in Q2 2021 increased 13% versus Q2 2020 thanks to volume recovery across most businesses, offset partially by negative currency (€71 million) and scope (€64 million) impacts, equating to year-on-year organic growth of 20%. Strong demand continued from the first quarter into the second quarter across most markets driven by automotive, electronics, and building industries, while composite materials sales are down 21% versus Q2 2020 when the crisis began to impact civil aircraft production. Geographically, all regions delivered double-digit organic sales growth, with Europe up by 23%, North America up 17%, Latin America up by 54% and Asia Pacific by 12% versus the second quarter 2020. Underlying EBITDA
Q2 2020
Scope Forexconversion
Volume& mix
Price
Q2 2021
2,175 -64 -71+387 +29 2,456
+20.4%
+12.9% H1 2020
Scope Forexconversion
Volume& mix
Price
H1 2021
4,649 -80 -201 +427 +33 4,829
+10.5%
+3.9%
Q2 2020
Scope Forexconversion
MaterialsChemicals
SolutionsCBS
Q2 2021
439 -19 -12+57
+91+51 -5 602
+47.4%
+37.1% H1 2020
Scope Forexconversion
MaterialsChemicalsSolutions
CBS
H1 2021
1,008 -29 -42 +46+110
+81 +11 1,185
+26.5%
+17.6%

July 29, 2021 Second quarter and first half 2021 financial report 5/28
Underlying EBITDA of €602 million in Q2 2021 was up +37.1% as a result of the higher sales volumes, offset partially by scope and foreign exchange, or +47% organically year on year. Structural cost savings supported the sustained EBITDA margin of 24.5% in the second quarter despite higher cost of raw materials, energy and logistics. Free cash flow Q2 2021
H1 2021
Free cash flow to shareholders from continuing operations reached €135 million in the second quarter, reflecting payments of employee bonuses and the usual seasonally higher financial charges. Free cash flow in the first half of 2021 was €417 million, 25% higher than first half 2020 excluding scope and currency and one-time impacts in 2020. Underlying net debt Underlying net financial debt was stable at €4.2 billion in the first half 2021, with free cash flow and proceeds from divestments more than offsetting the dividend payment. Provisions Provisions decreased by €320 million to €2.77 billion compared to December 2020, primarily reflecting the impact from higher discount rates. The €234 million of net new liabilities mainly relates to the restructuring provisions recorded in Q1 2021. Additional voluntary contributions in H1 2021 amounted to €102 million, and will be followed by two last tranches of €150 million each in the next 12 months.
UnderlyingEBITDA
Capex
Workingcapital Provisions:
Employeebenefits -26
Environment -13Other -36
Taxes -60Other FCF -4
Financing:Net interests -28
Hybrid coupons -29Dividends to
non-ctrlinterests -5
FCF toSolvay
share fromcont. ops.
602 -141
-124
-75-64
-62 135
UnderlyingEBITDA
CapexWorkingcapital Provisions:
Employeebenefits -49
Environment -22Other -67
Taxes -100Other FCF -10
Financing:Net interests -34
Hybrid coupons -48Dividends to
non-ctrlinterests -5
FCF toSolvay
share fromcont. ops.
1,185 -241
-190-138
-110-88 417
December 31, 2020
FCF toSolvayshare-holders
Dividendsto Solvay
share-holders
Voluntary pension
contributions
In/outflowfrom M&A
Remeasu-rements
(forex) -29Changesin scope& other 2
June 30, 2021
-4,198 406 -388-102 89 -27 -4,221
IFRSdebt…
Hybridbonds-1,800
Hybridbonds-1,800
IFRSdebt…
December 31, 2020
Payments Net newprovisions
Unwinding of provisions
Voluntary pension
contributions
Asset returnRemeasu-rements
Changesin scope& other
June 30, 2021
-3,087 138 -234 -47 102 37 367-43 -2,767
Employeebenefits…
Environ-ment-621
Environ-ment-614
Employeebenefits…
Other
Other
July 29, 2021 Second quarter and first half 2021 financial report 6/28
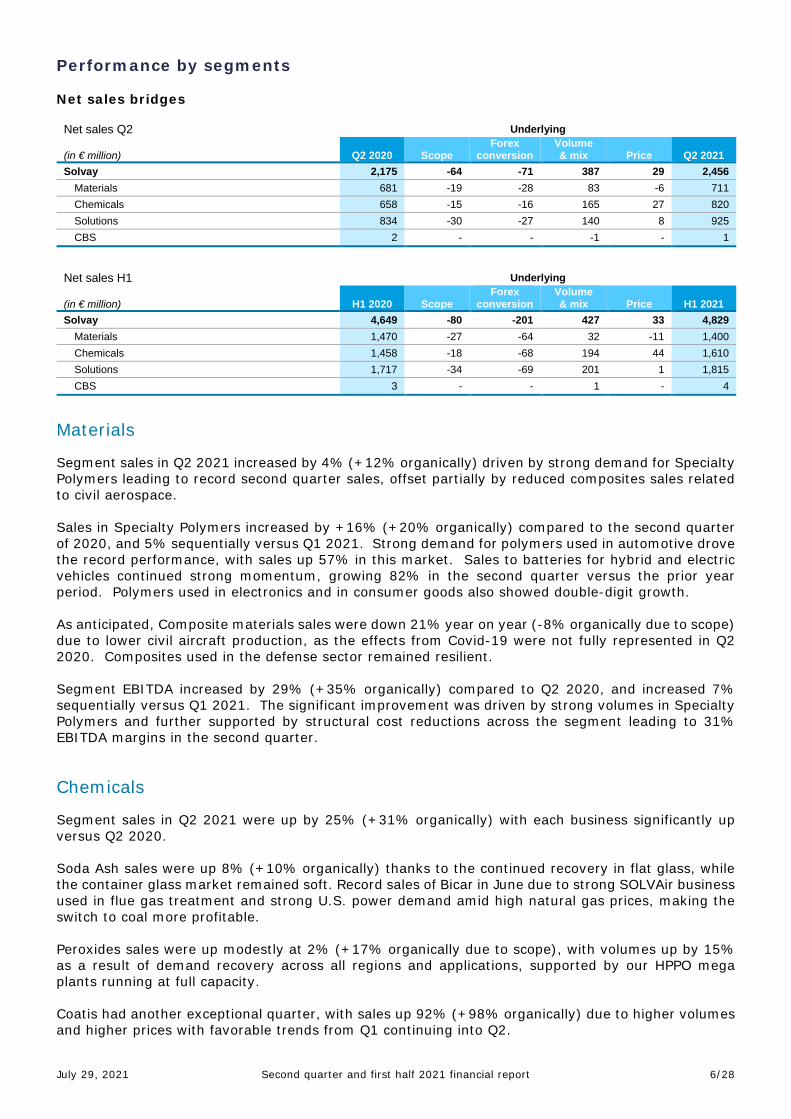
Performance by segments Net sales bridges
Net sales Q2 Underlying
(in € million) Q2 2020 Scope Forex
conversion Volume & mix Price Q2 2021
Solvay 2,175 -64 -71 387 29 2,456 Materials 681 -19 -28 83 -6 711 Chemicals 658 -15 -16 165 27 820 Solutions 834 -30 -27 140 8 925 CBS 2 - - -1 - 1
Net sales H1 Underlying
(in € million) H1 2020 Scope Forex
conversion Volume & mix Price H1 2021
Solvay 4,649 -80 -201 427 33 4,829 Materials 1,470 -27 -64 32 -11 1,400 Chemicals 1,458 -18 -68 194 44 1,610 Solutions 1,717 -34 -69 201 1 1,815 CBS 3 - - 1 - 4
Materials Segment sales in Q2 2021 increased by 4% (+12% organically) driven by strong demand for Specialty Polymers leading to record second quarter sales, offset partially by reduced composites sales related to civil aerospace. Sales in Specialty Polymers increased by +16% (+20% organically) compared to the second quarter of 2020, and 5% sequentially versus Q1 2021. Strong demand for polymers used in automotive drove the record performance, with sales up 57% in this market. Sales to batteries for hybrid and electric vehicles continued strong momentum, growing 82% in the second quarter versus the prior year period. Polymers used in electronics and in consumer goods also showed double-digit growth. As anticipated, Composite materials sales were down 21% year on year (-8% organically due to scope) due to lower civil aircraft production, as the effects from Covid-19 were not fully represented in Q2 2020. Composites used in the defense sector remained resilient. Segment EBITDA increased by 29% (+35% organically) compared to Q2 2020, and increased 7% sequentially versus Q1 2021. The significant improvement was driven by strong volumes in Specialty Polymers and further supported by structural cost reductions across the segment leading to 31% EBITDA margins in the second quarter. Chemicals Segment sales in Q2 2021 were up by 25% (+31% organically) with each business significantly up versus Q2 2020. Soda Ash sales were up 8% (+10% organically) thanks to the continued recovery in flat glass, while the container glass market remained soft. Record sales of Bicar in June due to strong SOLVAir business used in flue gas treatment and strong U.S. power demand amid high natural gas prices, making the switch to coal more profitable. Peroxides sales were up modestly at 2% (+17% organically due to scope), with volumes up by 15% as a result of demand recovery across all regions and applications, supported by our HPPO mega plants running at full capacity. Coatis had another exceptional quarter, with sales up 92% (+98% organically) due to higher volumes and higher prices with favorable trends from Q1 continuing into Q2.

July 29, 2021 Second quarter and first half 2021 financial report 7/28
Silica sales grew by 68% (+70% organically) thanks to strong demand for replacement tires and also as a result of recent market share gains in higher specialty grades. Sales were significantly ahead of 2019 levels. Segment EBITDA was up by 49% (+58% organically) versus Q2 2020 thanks to higher volumes across all of the businesses. Performance was further supported by higher pricing in Coatis as well as contributions from Rusvinyl due to continuing strength in PVC demand. As a result of the widespread growth and cost actions, the Chemicals segment delivered an EBITDA margin of 30.4% in the second quarter. Solutions Sales in the second quarter of 2021 were up +11% (+19% organically) driven by strong demand across many markets including automotive, electronics, and mining. Second quarter sales in Novecare increased by +11% (+21% organically) year on year. Growth was driven by higher volumes across all markets, led by growth in Coatings and Building industries. Oil & gas improved sequentially by +10% versus Q1, and by 48% year on year. Special Chem sales increased +21% (organically by +33%) year on year thanks to the continued strong volumes in the automotive and semiconductors industries. Technology Solutions sales increased by +15% (+17% organically) compared to Q2 2020 thanks to continued strong production levels supported by high demand for our extractant solutions and supportive copper prices. Aroma Performance sales were stable sequentially in Q2 versus Q1 but were down 8% (-5% organically) compared to a very strong Q2 2020, while food & beverage, flavors & fragrances demand remains strong. Second quarter EBITDA in the segment was up +29% (+42% organically) year and year, continuing on the solid trend seen across most markets in Q1 2021. EBITDA margin in the segment was up +2.5pp to 18.5% in Q2 2021, once again reflecting both sales momentum and our cost reduction improvements.

July 29, 2021 Second quarter and first half 2021 financial report 8/28
Key segment figures
Segment review Underlying
(in € million) Q2 2021 Q2 2020 % yoy %
organic H1 2021 H1 2020 % yoy %
organic Net sales 2,456 2,175 +12.9% +20.4% 4,829 4,649 +3.9% +10.5%
Materials 711 681 +4.4% +12.1% 1,400 1,470 -4.8% +1.5% Specialty Polymers 536 462 +16.2% +20.3% 1,047 942 +11.1% +15.1% Composite Materials 175 220 -20.5% -7.5% 352 528 -33.2% -24.9%
Chemicals 820 658 +24.5% +30.6% 1,610 1,458 +10.4% +17.3% Soda Ash & Derivatives 378 350 +8.0% +10.4% 745 740 +0.7% +3.4% Peroxides 153 150 +2.0% +17.4% 305 321 -5.0% +5.2% Coatis 177 92 n.m. +98.7% 334 220 +52.2% +75.5% Silica 112 67 +67.8% +69.5% 226 178 +27.1% +31.6%
Solutions 925 834 +10.9% +19.1% 1,815 1,717 +5.7% +12.5% Novecare 443 399 +11.0% +21.4% 859 820 +4.7% +12.8% Special Chem 210 174 +20.5% +33.3% 421 380 +10.8% +19.7% Technology Solutions 162 141 +14.7% +17.3% 316 282 +12.1% +16.0% Aroma Performance 110 119 -7.9% -5.5% 220 235 -6.5% -3.6%
Corporate & Business Services 1 2 -36.2% -30.6% 4 3 +14.6% +23.8%
EBITDA 602 439 +37.1% +47.4% 1,185 1,008 +17.6% +26.5% Materials 220 170 +29.3% +34.6% 426 398 +7.0% +12.2% Chemicals 249 167 +49.4% +57.8% 489 405 +20.6% +29.2% Solutions 171 133 +28.6% +42.0% 344 287 +19.9% +30.6%
Corporate & Business Services -38 -31 -23.7% - -74 -83 +10.3% -
EBITDA margin 24.5% 20.2% +4.3pp - 24.5% 21.7% +2.9pp - Materials 31.0% 25.0% +6.0pp - 30.4% 27.1% +3.4pp - Chemicals 30.4% 25.3% +5.1pp - 30.4% 27.8% +2.6pp - Solutions 18.5% 16.0% +2.5pp - 19.0% 16.7% +2.2pp -

July 29, 2021 Second quarter and first half 2021 financial report 9/28
Key IFRS figures As announced on June 24, 2020, a non-cash impairment charge of €1.46 billion was recorded in Q2 2020. As a result, the underlying profit/(loss) attributable to Solvay shareholders was €109 million in Q2 2020, whereas it totaled €-1,540 million on an IFRS basis. Further details are available in the financial report of Q2 2020.
Q2 key figures IFRS Underlying
(in € million) Q2 2021 Q2 2020 % yoy Q2 2021 Q2 2020 % yoy Net sales 2,456 2,175 +12.9% 2,456 2,175 +12.9% EBITDA 550 398 +38.2% 602 439 +37.1% EBITDA margin 24.5% 20.2% +4.3pp EBIT 333 -1,347 n.m. 424 202 n.m. Net financial charges -28 -45 +38.9% -54 -64 +16.4% Income tax expenses -72 -155 +53.5% -83 -22 n.m. Profit (loss) from discontinued operations - 15 n.m. - - n.m. (Profit) / loss attributable to non-controlling interests -11 -7 +62.4% -10 -7 +49.5%
Profit / (loss) attributable to Solvay shareholders 222 -1,540 n.m. 276 109 n.m.
Basic earnings per share (in €) 2.15 -14.94 n.m. 2.67 1.06 n.m. of which from continuing operations 2.15 -15.08 n.m. 2.67 1.06 n.m.
Capex in continuing operations 141 132 +7.0% FCF to Solvay shareholders from continuing operations 135 233 -42.1%
FCF to Solvay shareholders 123 234 -47.3%
Net financial debt 4,221 4,198 +0.5% Underlying leverage ratio 2.0 2.2 -7.8pp
H1 key figures IFRS Underlying
(in € million) H1 2021 H1 2020 % yoy H1 2021 H1 2020 % yoy Net sales 4,829 4,649 +3.9% 4,829 4,649 +3.9% EBITDA 964 883 +9.1% 1,185 1,008 +17.6% EBITDA margin 24.5% 21.7% +2.9pp
EBIT 502 -1,114 n.m. 805 573 +40.5% Net financial charges -58 -72 +19.9% -117 -133 +12.3% Income tax expenses -98 -203 +51.8% -154 -99 -55.9% Tax rate 24.2% 24% +0.4pp Profit (loss) from discontinued operations - 117 n.m. 1 21 n.m. (Profit) / loss attributable to non-controlling interests -20 -18 +12.8% -19 -18 +9.1%
Profit / (loss) attributable to Solvay shareholders 326 -1,290 n.m. 517 345 +49.6%
Basic earnings per share (in €) 3.16 -12.51 n.m. 4.99 3.35 +49.3% of which from continuing operations 3.16 -13.64 n.m. 4.99 3.14 +59.1%
Capex in continuing operations 241 295 -18.2% FCF to Solvay shareholders from continuing operations 417 435 -4.1%
FCF to Solvay shareholders 406 431 -5.9% FCF conversion ratio (LTM) 46.1% 49.0% -3.0pp
Net financial debt 4,221 4,198 +0.5%
Underlying leverage ratio 2.0 2.2 -7.8%

July 29, 2021 Second quarter and first half 2021 financial report 10/28
Supplementary information Reconciliation of alternative performance metrics Solvay measures its financial performance using alternative performance metrics, which can be found below. Solvay believes that these measurements are useful for analyzing and explaining changes and trends in its historical results of operations, as they allow performance to be compared on a consistent basis. Definitions of the different metrics presented here are included in the glossary at the end of this financial report.
Tax rate Underlying
(in € million) H1 2021 H1 2020 Profit / (loss) for the period before taxes a 689 440 Earnings from associates & joint ventures b 62 36 Interests and realized foreign exchange gains (losses) on the RusVinyl joint venture c -8 -10 Income taxes d -154 -99
Tax rate e = -d/(a-b-c) 24% 24%
Free cash flow (FCF) (in € million) Q2 2021 Q2 2020 H1 2021 H1 2020
Cash flow from operating activities a 330 452 633 393 of which voluntary pension contributions b - - -102 -460
Cash flow from investing activities c -119 -99 -112 995 of which capital expenditures required by share sale
agreement d - - - -14
Acquisition (-) of subsidiaries e -20 - -22 -9 Acquisition (-) of investments - Other f -2 -2 -3 -26 Loans to associates and non-consolidated companies g -4 -3 3 3 Sale (+) of subsidiaries and investments h 26 12 103 1,304 Increase/decrease of borrowings related to environmental
remediation i - 1 - 6
Payment of lease liabilities j -26 -26 -48 -54 FCF k = a-b+c-d-e-f-g-h+i+j 185 321 494 541
FCF from discontinued operations l -11 - -11 -4 FCF from continuing operations m = k-l 197 321 505 545
Net interests paid n -28 -30 -34 -39 Coupons paid on perpetual hybrid bonds o -29 -55 -48 -68 Dividends paid to non-controlling interests p -5 -2 -5 -4
FCF to Solvay shareholders q = k+n+o+p 123 234 406 431 FCF to Solvay shareholders from discontinued operations r -11 1 -11 -4
FCF to Solvay shareholders from continuing operations s = q-r 135 233 417 435 FCF to Solvay shareholders from continuing operations (LTM) t 944 1,008 944 1,008
Dividends paid to non-controlling interests from continuing operations (LTM) u -34 -39 -34 -39
Underlying EBITDA (LTM) v 2,122 2,135 2,122 2,135 FCF conversion ratio (LTM) w = (t-u)/v 46.1% 49.0% 46.1% 49.0%
Net working capital 2021 2020
(in € million) June
30 December
31 Inventories a 1,443 1,241 Trade receivables b 1,521 1,264 Other current receivables c 870 519 Trade payables d -1,474 -1,197 Other current liabilities e -891 -720
Net working capital f = a+b+c+d+e 1,469 1,107 Sales g 2,690 2,418 Annualized quarterly total sales h = 4*g 10,758 9,673 Net working capital / sales i = f / h 13.7% 11.4% Year-to-date average j = µ(Q1,Q2,Q3,Q4) 13.0% 14.7%

July 29, 2021 Second quarter and first half 2021 financial report 11/28
Capital expenditure (capex) (in € million) Q2 2021 Q2 2020 H1 2021 H1 2020
Acquisition (-) of tangible assets a -96 -87 -159 -233 Acquisition (-) of intangible assets b -20 -19 -34 -41 Payment of lease liabilities c -26 -26 -48 -54
Capex d = a+b+c -141 -132 -241 -328 Capex in discontinued operations e - - - -33
Capex in continuing operations f = d-e -141 -132 -241 -295 Underlying EBITDA g 602 439 1,185 1,008 Cash conversion h = (f+g)/g 76.5% 70.0% 79.6% 70.7%
Net financial debt 2021 2020
(in € million) June
30 December
31 Non-current financial debt a -3,246 -3,233 Current financial debt b -558 -287
IFRS gross debt c = a+b -3,803 -3,519 Underlying gross debt d = c+h -5,603 -5,319
Other financial instruments (current + non-current) e 167 119 Cash & cash equivalents f 1,216 1,002
Total cash and cash equivalents g = e+f 1,382 1,121 IFRS net debt i = c+g -2,421 -2,398
Perpetual hybrid bonds h -1,800 -1,800 Underlying net debt j = i+h -4,221 -4,198 Underlying EBITDA (LTM) k 2,122 1,945
Adjustment for discontinued operations l - - Adjusted underlying EBITDA for leverage calculation m = k+l 2,122 1,945 Underlying leverage ratio 2.0 2.2
The definition of the net financial debt has been adapted to take into account the long term financial instruments that were not present until Q2 2021.

July 29, 2021 Second quarter and first half 2021 financial report 12/28
Reconciliation of underlying income statement indicators Besides IFRS accounts, Solvay also presents underlying Income Statement performance indicators to provide a more consistent and comparable indication of Solvay’s economic performance. These figures adjust IFRS figures for the non-cash Purchase Price Allocation (PPA) accounting impacts related to acquisitions, for the coupons of perpetual hybrid bonds classified as equity under IFRS but treated as debt in the underlying statements, and for other elements to generate a measure that avoids distortion and facilitates the appreciation of performance and comparability of results over time. Consolidated income statement Q2 Q2 2021 Q2 2020
(in € million) IFRS Adjust-ments
Under-lying IFRS
Adjust-ments
Under-lying
Sales 2,690 - 2,690 2,339 - 2,339 of which revenues from non-core activities 233 - 233 164 - 164 of which net sales 2,456 - 2,456 2,175 - 2,175
Cost of goods sold -1,941 - -1,941 -1,805 - -1,804 Gross margin 748 - 748 534 - 535
Commercial costs -70 - -70 -77 - -77 Administrative costs -223 - -222 -200 5 -195 Research & development costs -72 1 -71 -73 1 -72 Other operating gains & losses -31 36 5 -47 42 -5 Earnings from associates & joint ventures 33 1 34 19 -4 15 Result from portfolio management & major restructuring -34 34 - -1,496 1,496 - Result from legacy remediation & major litigations -19 19 - -9 9 -
EBITDA 550 52 602 398 41 439 Depreciation, amortization & impairments [1] -217 38 -179 -1,745 1,508 -237
EBIT 333 91 424 -1,347 1,549 202 Net cost of borrowings -22 - -22 -30 - -30 Coupons on perpetual hybrid bonds - -20 -20 - -24 -24
Interests and realized foreign exchange gains (losses) on the RusVinyl joint venture - -1 -1 - -2 -2
Cost of discounting provisions -7 -5 -12 -16 6 -10 Result from equity instruments measured at fair value
through other comprehensive income 2 - 2 1 - 1
Profit / (loss) for the period before taxes 305 64 370 -1,393 1,531 138 Income taxes -72 -11 -83 -155 133 -22
Profit / (loss) for the period from continuing operations 233 53 287 -1,548 1,664 116
Profit / (loss) for the period from discontinued operations - - - 15 -14 -
Profit / (loss) for the period 233 53 286 -1,533 1,649 116 attributable to Solvay shareholders 222 54 276 -1,540 1,649 109 attributable to non-controlling interests 11 -1 10 7 - 7
Basic earnings per share (in €) 2.15 0.52 2.67 -14.94 16.00 1.06 of which from continuing operations 2.15 0.52 2.67 -15.08 16.14 1.06
Diluted earnings per share (in €) 2.14 0.52 2.66 -14.94 16.00 1.06 of which from continuing operations 2.14 0.52 2.66 -15.08 16.14 1.06

July 29, 2021 Second quarter and first half 2021 financial report 13/28
EBITDA on an IFRS basis totaled €550 million, versus €602 million on an underlying basis. The difference of €52 million is explained by the following adjustments to IFRS results, which are done to improve the comparability of underlying results:
• €1 million in “Earnings from associates & joint ventures” for Solvay’s share in the financial charges of the Rusvinyl joint venture and the foreign exchange losses on the €-denominated debt of the joint venture, the Russian ruble being broadly stable vs EUR over the period. These elements are reclassified in “Net financial charges”.
• €32 million to adjust for the “Result from portfolio management and major restructuring”, excluding depreciation, amortization and impairment elements, mainly related to post-closing adjustments resulting from M&A warranties.
• €19 million to adjust for the “Result from legacy remediation and major litigations”, primarily indemnities for environmental remediation.
EBIT on an IFRS basis totaled €333 million, versus €424 million on an underlying basis. The difference of €91 million is explained by the above-mentioned €52 million adjustments at the EBITDA level and €38 million of “Depreciation, amortization & impairments”. The latter consist of:
• €37 million to adjust for the non-cash impact of purchase price allocation (PPA), consisting of amortization charges on intangible assets, which are adjusted in "Research & development costs" for €1 million, and in "Other operating gains & losses" for €36 million.
• €2 million to adjust for the impact of impairments reported in “Result from portfolio management and major restructuring” resulting primarily from the impairment of non-performing assets
Net financial charges on an IFRS basis were €-27 million versus €-53 million on an underlying basis. The €-26 million adjustment made to IFRS net financial charges consists of:
• €-20 million reclassification of coupons on perpetual hybrid bonds, which are treated as dividends under IFRS, and as financial charges in underlying results.
• €-1 million reclassification of financial charges and realized foreign exchange result on the €-denominated debt of RusVinyl as net financial charges.
• €-5 million for the net impact of decreasing discount rates on the valuation of environmental liabilities in the period.
Income taxes on an IFRS basis were €-72 million, versus €-83 million on an underlying basis. The €-11 million adjustment mainly relates to the adjustments of the earnings before taxes described above. Profit / (loss) attributable to Solvay shareholders was €222 million on an IFRS basis and €276 million on an underlying basis. The delta of €54 million reflects the above-mentioned adjustments to EBIT, net financial charges, income taxes and minor adjustments for discontinued operations. There was €-1 million impact from non-controlling interests.

July 29, 2021 Second quarter and first half 2021 financial report 14/28
H1 consolidated income statement H1 2021 H1 2020
(in € million) IFRS Adjust-ments
Under-lying IFRS
Adjust-ments
Under-lying
Sales 5,294 - 5,294 5,026 - 5,026 of which revenues from non-core activities 465 - 465 377 - 377 of which net sales 4,829 - 4,829 4,649 - 4,649
Cost of goods sold -3,811 - -3,811 -3,748 1 -3,747 Gross margin 1,483 - 1,483 1,278 1 1,279
Commercial costs -140 - -140 -163 - -163 Administrative costs -443 - -442 -444 12 -432 Research & development costs -165 1 -164 -151 1 -150 Other operating gains & losses -67 74 7 -83 86 3 Earnings from associates & joint ventures 63 - 62 23 13 36
Result from portfolio management & major restructuring -195 195 - -1,554 1,554 -
Result from legacy remediation & major litigations -33 33 - -21 21 -
EBITDA 964 221 1,185 883 125 1,008 Depreciation, amortization & impairments [1] -462 82 -380 -1,998 1,562 -435
EBIT 502 303 805 -1,114 1,687 573 Net cost of borrowings -48 - -48 -57 - -57 Coupons on perpetual hybrid bonds - -41 -41 - -47 -47 Interests and realized foreign exchange gains (losses)
on the RusVinyl joint venture - -8 -8 - -10 -10
Cost of discounting provisions -12 -10 -21 -17 -4 -20 Result from equity instruments measured at fair value
through other comprehensive income 2 - 2 1 - 1
Profit / (loss) for the period before taxes 444 245 689 -1,187 1,627 440 Income taxes -98 -56 -154 -203 104 -99
Profit / (loss) for the period from continuing operations 346 189 535 -1,389 1,731 342
Profit / (loss) for the period from discontinued operations - 1 1 117 -95 21
Profit / (loss) for the period 346 190 536 -1,273 1,636 363 attributable to Solvay shareholders 326 190 517 -1,290 1,636 345 attributable to non-controlling interests 20 -1 19 18 - 18
Basic earnings per share (in €) 3.16 1.84 4.99 -12.51 15.85 3.35 of which from continuing operations 3.16 1.84 4.99 -13.64 16.77 3.14
Diluted earnings per share (in €) 3.15 1.83 4.98 -12.50 15.85 3.34 of which from continuing operations 3.15 1.83 4.98 -13.63 16.77 3.14

July 29, 2021 Second quarter and first half 2021 financial report 15/28
EBITDA on an IFRS basis totaled €964 million, versus €1,185 million on an underlying basis. The difference of €221 million is explained by the following adjustments to IFRS results, which are done to improve the comparability of underlying results:
• €0 million in “Earnings from associates & joint ventures” for Solvay’s share in the financial charges of the Rusvinyl joint venture which were offset by the foreign exchange gains on the €-denominated debt of the joint venture, the Russian ruble strengthening by 5% vs EUR over the period. These elements are reclassified in “Net financial charges”.
• €188 million to adjust for the “Result from portfolio management and major restructuring”, excluding depreciation, amortization and impairment elements, mainly related to the new restructuring plan launched in Q1 2021 (€148 million) and to post-closing adjustments resulting from M&A warranties.
• €33 million to adjust for the “Result from legacy remediation and major litigations”, primarily indemnities for environmental remediation.
EBIT on an IFRS basis totaled €502 million, versus €805 million on an underlying basis. The difference of €303 million is explained by the above-mentioned €221 million adjustments at the EBITDA level and €82 million of “Depreciation, amortization & impairments”. The latter consist of:
• €75 million to adjust for the non-cash impact of purchase price allocation (PPA), consisting of amortization charges on intangible assets, which are adjusted in "Research & development costs" for €1 million, and in "Other operating gains & losses" for €74 million.
• €7 million to adjust for the impact of impairments reported in “Result from portfolio management and major restructuring” resulting primarily from the impairment of non-performing assets
Net financial charges on an IFRS basis were €-58 million versus €-116 million on an underlying basis. The €-58 million adjustment made to IFRS net financial charges consists of:
• €-41 million reclassification of coupons on perpetual hybrid bonds, which are treated as dividends under IFRS, and as financial charges in underlying results.
• €-8 million reclassification of financial charges and realized foreign exchange result on the €-denominated debt of RusVinyl as net financial charges.
• €-10 million for the net impact of decreasing discount rates on the valuation of environmental liabilities in the period.
Income taxes on an IFRS basis were €-98 million, versus €-154 million on an underlying basis. The €-56 million adjustment mainly relates to the adjustments of the earnings before taxes described above. Profit / (loss) attributable to Solvay shareholders was €326 million on an IFRS basis and €517 million on an underlying basis. The delta of €190 million reflects the above-mentioned adjustments to EBIT, net financial charges, income taxes and minor adjustments for discontinued operations. There was a €-1 million impact from non-controlling interests.

July 29, 2021 Second quarter and first half 2021 financial report 16/28
Condensed consolidated financial statements[1] Consolidated income statement IFRS (in € million) Q2 2021 Q2 2020 H1 2021 H1 2020 Sales 2,690 2,339 5,294 5,026
of which revenues from non-core activities 233 164 465 377 of which net sales 2,456 2,175 4,829 4,649
Cost of goods sold -1,941 -1,805 -3,811 -3,748 Gross margin 748 534 1,483 1,278
Commercial costs -70 -77 -140 -163 Administrative costs -223 -200 -443 -444 Research & development costs -72 -73 -165 -151 Other operating gains & losses -31 -47 -67 -83 Earnings from associates & joint ventures 33 19 63 23 Result from portfolio management & major restructuring [2] -34 -1,496 -195 -1,554 Result from legacy remediation & major litigations -19 -9 -33 -21
EBIT 333 -1,347 502 -1,114 Cost of borrowings -26 -29 -54 -58 Interest on loans & short term deposits 2 2 4 5 Other gains & losses on net indebtedness 1 -3 1 -3 Cost of discounting provisions -7 -16 -12 -17 Result from equity instruments measured at fair value through other
comprehensive income 2 1 2 1
Profit / (loss) for the period before taxes 305 -1,393 444 -1,187 Income taxes -72 -155 -98 -203
Profit / (loss) for the period from continuing operations 233 -1,548 346 -1,389 attributable to Solvay shareholders 222 -1,555 326 -1,407 attributable to non-controlling interests 11 7 20 18
Profit / (loss) for the period from discontinued operations - 15 - 117 Profit / (loss) for the period 233 -1,533 346 -1,273
attributable to Solvay shareholders 222 -1,540 326 -1,290 attributable to non-controlling interests 11 7 20 18
Weighted average of number of outstanding shares, basic 103,575,552 103,073,974 103,425,920 103,193,910 Weighted average of number of outstanding shares, diluted 103,891,967 103,073,974 103,671,794 103,221,352 Basic earnings per share (in €) 2.15 -14.94 3.16 -12.51
of which from continuing operations 2.15 -15.08 3.16 -13.64 Diluted earnings per share (in €) 2.14 -14.94 3.15 -12.50
of which from continuing operations 2.14 -15.08 3.15 -13.63
Consolidated statement of comprehensive income IFRS (in € million) Q2 2021 Q2 2020 H1 2021 H1 2020
Profit / (loss) for the period 233 -1,533 346 -1,273 Gains and losses on hedging instruments in a cash flow hedge 25 9 15 -39 Currency translation differences from subsidiaries & joint operations -25 -116 218 -117 Share of other comprehensive income of associates and joint ventures
accounted for using equity method that will be reclassified to profit or loss 12 10 23 -62
Recyclable components 12 -96 257 -218 Gains and losses on equity instruments measured at fair value through other
comprehensive income 16 -3 19 -2
Remeasurement of the net defined benefit liability [3] 151 -201 424 -166 Share of other comprehensive income of associates and joint ventures
accounted for using equity method that will not be reclassified to profit or loss - -2 - -
Non-recyclable components 167 -205 442 -168 Income tax relating to components of other comprehensive income -20 22 -66 16
Other comprehensive income, net of related tax effects 159 -280 633 -370 Total comprehensive income 392 -1,813 979 -1,643
attributed to Solvay share 382 -1,817 956 -1,660 attributed to non-controlling interests 10 4 23 17
[1] Reviewed for H1 2021 and H1 2020 figures. [2] H1 2021 Result from portfolio management & major restructuring mainly relates to the €148 million provision in relation with the new strategic transformation announced in February, resulting in a net reduction of approximately 500 roles. In H1 2020, it mainly related to the €1.5 billion impairment largely attributable to goodwill at Composite Materials (€0.8 billion) and Technology Solutions (€0.3 billion). An additional impairment was recorded on Oil & Gas and some specific assets within Special Chem. It also included a restructuring charge of €85 million. [3] The remeasurement of the net defined benefit liability of €424 million in H1 2021 was mainly due to increase of discount rates applicable to post-employment provisions in the Euro-zone, the UK and US, reinforced by the return of plan assets.
July 29, 2021 Second quarter and first half 2021 financial report 17/28
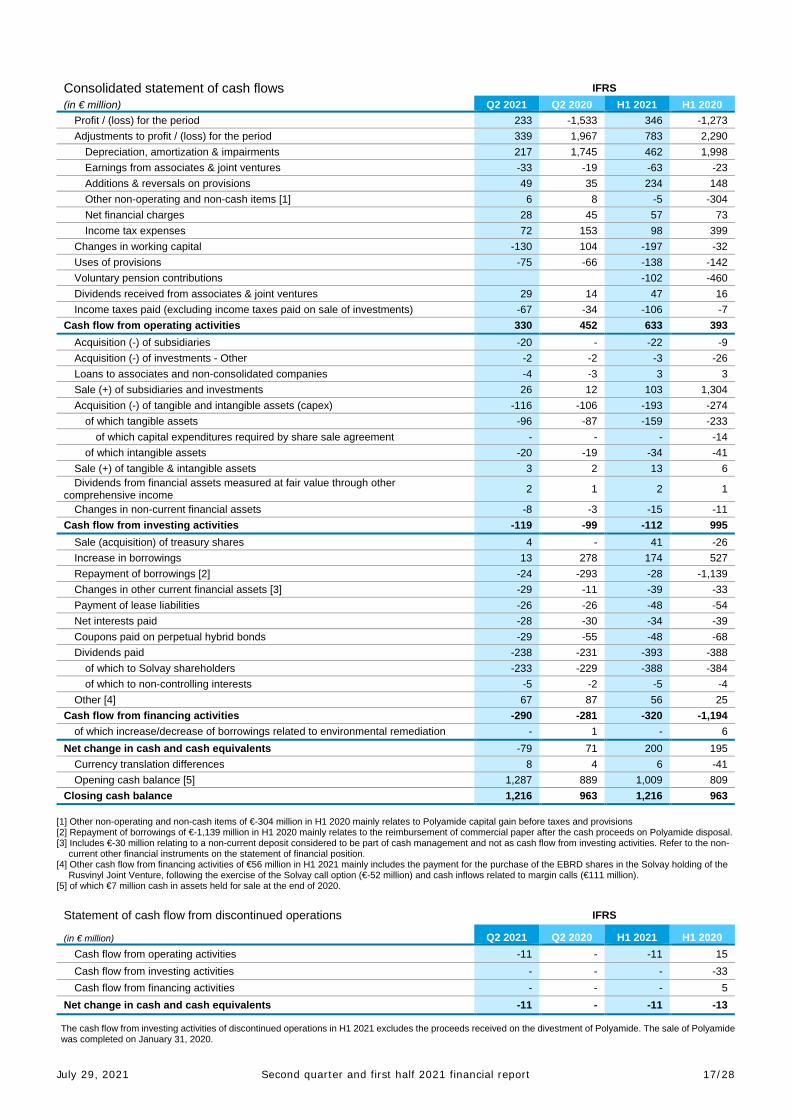
Consolidated statement of cash flows IFRS (in € million) Q2 2021 Q2 2020 H1 2021 H1 2020
Profit / (loss) for the period 233 -1,533 346 -1,273 Adjustments to profit / (loss) for the period 339 1,967 783 2,290
Depreciation, amortization & impairments 217 1,745 462 1,998 Earnings from associates & joint ventures -33 -19 -63 -23 Additions & reversals on provisions 49 35 234 148 Other non-operating and non-cash items [1] 6 8 -5 -304 Net financial charges 28 45 57 73 Income tax expenses 72 153 98 399
Changes in working capital -130 104 -197 -32 Uses of provisions -75 -66 -138 -142 Voluntary pension contributions -102 -460 Dividends received from associates & joint ventures 29 14 47 16 Income taxes paid (excluding income taxes paid on sale of investments) -67 -34 -106 -7
Cash flow from operating activities 330 452 633 393 Acquisition (-) of subsidiaries -20 - -22 -9 Acquisition (-) of investments - Other -2 -2 -3 -26 Loans to associates and non-consolidated companies -4 -3 3 3 Sale (+) of subsidiaries and investments 26 12 103 1,304 Acquisition (-) of tangible and intangible assets (capex) -116 -106 -193 -274
of which tangible assets -96 -87 -159 -233 of which capital expenditures required by share sale agreement - - - -14
of which intangible assets -20 -19 -34 -41 Sale (+) of tangible & intangible assets 3 2 13 6 Dividends from financial assets measured at fair value through other
comprehensive income 2 1 2 1
Changes in non-current financial assets -8 -3 -15 -11 Cash flow from investing activities -119 -99 -112 995
Sale (acquisition) of treasury shares 4 - 41 -26 Increase in borrowings 13 278 174 527 Repayment of borrowings [2] -24 -293 -28 -1,139 Changes in other current financial assets [3] -29 -11 -39 -33 Payment of lease liabilities -26 -26 -48 -54 Net interests paid -28 -30 -34 -39 Coupons paid on perpetual hybrid bonds -29 -55 -48 -68 Dividends paid -238 -231 -393 -388
of which to Solvay shareholders -233 -229 -388 -384 of which to non-controlling interests -5 -2 -5 -4
Other [4] 67 87 56 25 Cash flow from financing activities -290 -281 -320 -1,194
of which increase/decrease of borrowings related to environmental remediation - 1 - 6 Net change in cash and cash equivalents -79 71 200 195
Currency translation differences 8 4 6 -41 Opening cash balance [5] 1,287 889 1,009 809
Closing cash balance 1,216 963 1,216 963
[1] Other non-operating and non-cash items of €-304 million in H1 2020 mainly relates to Polyamide capital gain before taxes and provisions [2] Repayment of borrowings of €-1,139 million in H1 2020 mainly relates to the reimbursement of commercial paper after the cash proceeds on Polyamide disposal. [3] Includes €-30 million relating to a non-current deposit considered to be part of cash management and not as cash flow from investing activities. Refer to the non-
current other financial instruments on the statement of financial position. [4] Other cash flow from financing activities of €56 million in H1 2021 mainly includes the payment for the purchase of the EBRD shares in the Solvay holding of the
Rusvinyl Joint Venture, following the exercise of the Solvay call option (€-52 million) and cash inflows related to margin calls (€111 million). [5] of which €7 million cash in assets held for sale at the end of 2020. Statement of cash flow from discontinued operations IFRS
(in € million) Q2 2021 Q2 2020 H1 2021 H1 2020 Cash flow from operating activities -11 - -11 15 Cash flow from investing activities - - - -33 Cash flow from financing activities - - - 5
Net change in cash and cash equivalents -11 - -11 -13
The cash flow from investing activities of discontinued operations in H1 2021 excludes the proceeds received on the divestment of Polyamide. The sale of Polyamide was completed on January 31, 2020.

July 29, 2021 Second quarter and first half 2021 financial report 18/28
Consolidated statement of financial position 2021 2020
(in € million) June
30 December
31 Intangible assets 2,095 2,141
Goodwill 3,310 3,265
Property, plant and equipment 4,717 4,717
Right-of-use assets 392 405
Equity instruments measured at fair value through other comprehensive income 90 66
Investments in associates & joint ventures 540 495 Other investments 43 42 Deferred tax assets 761 788 Loans & other assets [1] 640 390 Other financial instruments 30 -
Non-current assets 12,619 12,308 Inventories 1,443 1,241 Trade receivables 1,521 1,264 Income tax receivables 130 109 Other financial instruments 137 119 Other receivables [1] 870 519 Cash & cash equivalents 1,216 1,002 Assets held for sale - 229
Current assets 5,317 4,484 Total assets 17,936 16,792
Share capital 1,588 1,588 Issue premiums 1,170 1,170 Other reserves 5,159 4,439 Non-controlling interests 123 106
Total equity 8,040 7,304 Provisions for employee benefits 1,728 2,209 Other provisions 815 689 Deferred tax liabilities 532 487 Financial debt 3,246 3,233 Other liabilities [1] 290 95
Non-current liabilities 6,611 6,713 Other provisions 224 190 Financial debt [2] 558 287 Trade payables 1,474 1,197 Income tax payables 133 113 Dividends payables 5 159 Other liabilities [1] 891 720 Liabilities associated with assets held for sale - 110
Current liabilities 3,285 2,775 Total equity & liabilities 17,936 16,792
[1] The increase is largely driven by the fair value adjustments of energy-related financial assets and liabilities due to price
increases in gas and electricity. As the fair value adjustments are on sales and purchase contracts of energy, they impact both assets and liabilities.
[2] The current financial debt (€558 million at the end of June 2021) is composed of short term financing (which include €91 million of short term portion of leases). The increase compared to the end of 2020 is due to the temporary drawdown of €150 million on a new credit line and for €111 million to margin calls (see note 4 in the cash flow statement)

July 29, 2021 Second quarter and first half 2021 financial report 19/28
Consolidated statement of changes in equity Revaluation reserve
(fair value)
(in € million) Share capital
Share premiums
Treasury shares
Perpetual hybrid bonds
Retained earnings
Currency translation differences
Equity instruments measured at
fair value through other
comprehensive income
Cash flow
hedges
Defined benefit
pension plans
Total other
reserves
Non-controlling interests
Total equity
Balance on December 31, 2019 1,588 1,170 -274 1,789 6,462 -454 10 -20 -756 6,757 110 9,625 Profit / (loss) for the period - - - - -1,290 - - - - -1,290 18 -1,273 Items of other comprehensive
income - - - - - -179 -1 -28 -162 -370 2 -371
Comprehensive income - - - - -1,290 -179 -1 -28 -162 -1,660 17 -1,643 Cost of stock options - - - - 3 - - - - 3 - 3 Dividends - - - - -232 - - - - -232 -3 -235 Coupons of perpetual hybrid bonds - - - - -68 - - - - -68 - -68 Sale (acquisition) of treasury shares - - -26 - - - - - - -26 - -26 Other - - - - -7 - - - 6 -1 - -1
Balance on June 30, 2020 1,588 1,170 -300 1,789 4,868 -633 9 -48 -913 4,772 124 7,654 Balance on December 31, 2020 1,588 1,170 -286 1,786 4,985 -1,153 12 14 -919 4,439 106 7,304
Profit / (loss) for the period - - - - 326 - - - - 326 20 346 Items of other comprehensive
income - - - - - 239 15 10 366 630 3 633
Comprehensive income - - - - 326 239 15 10 366 956 23 979 Cost of stock options - - - - 4 - - - - 4 - 4 Dividends - - - - -233 - - - - -233 -6 -239 Coupons of perpetual hybrid bonds - - - - -48 - - - - -48 - -48 Sale (acquisition) of treasury shares - - 41 - - - - - - 41 - 41 Other - - - - -11 - - - 12 - - -
Balance on June 30, 2021 1,588 1,170 -245 1,786 5,022 -914 27 24 -541 5,159 123 8,040
H1 2021 Equity increased by €239 million after currency translation differences mainly due to the USD revaluation against EUR in the semester.

July 29, 2021 Second quarter and first half 2021 financial report 20/28
Notes to the condensed consolidated financial statements 1. General information and significant events Solvay is a public limited liability company governed by Belgian law and quoted on Euronext Brussels and Euronext Paris. These condensed consolidated financial statements were authorized for issue by the Board of Directors on July 28, 2021. On January 18, 2021 Solvay sent a Call option Notice to the European Bank for Reconstruction and Development (EBRD) to purchase the EBRD shares in the Solvay holding of the Rusvinyl Joint Venture. The option price of €52 million was booked as an Other current liability at the end of 2020 and has been paid in Q1 2021. An additional voluntary contribution of €102 million was made in January 2021 to the Belgian pension plans. In January, Solvay launched a new chapter of its strategic transformation aimed to further align its structure to its G.R.O.W. strategy. This builds on previous plans announced in 2020, and represents a profound simplification of all support functions to serve the business more effectively. The plan will lead to an additional net reduction of approximately 500 roles by the end of 2022 and incremental annual cost savings of €75 million. As a consequence of the new restructuring plan, a non-cash restructuring provision of around €150 million was recognized in Q1 2021. Portfolio management During Q1, 2021, the assets and liabilities related to the following businesses previously classified as “held for sale” were divested: - the Peroxides sodium chlorate business line and related assets in Povoa (Portugal), - the various fluorine chemicals assets in Onsan, South Korea, part of Special Chem, - the Peroxides sodium percarbonate business line and related assets in Bad Hönningen (Germany), - the Barium Strontium business and the joint venture with Chemical Products Corporation (CPC) and - the Process Materials business (part of Composites) On May 3, 2021, Solvay announced that it has completed the sale of the amphoterics surfactants activities, which includes the three main production sites supporting the amphoteric product lines located in University Park, Illinois (USA), Genthin (Germany), Halifax (United Kingdom), and a tolling arrangement in Turkey. These divestments lead to a decrease in sales of €80 million in H1 2021 compared to H1 2020. There was no material capital gain/loss on these divestments. As a consequence, there were no remaining assets held for sale at the end of June 2021. Contingent Asset Following a legal proceeding started in 2012, the Arbitration Court of Geneva issued on June 22, 2021 a decision award in favor of Solvay, ordering Edison S.p.A. to pay approximately €91 million for the losses and damages incurred up to the end of 2016 in relation to the environmental issues of the Spinetta Marengo and Bussi sites, previously owned and operated by Edison (Ausimont) SpA. A further phase of the arbitration proceeding or an amicable settlement will define the compensation for the additional losses and damages from 2017 onwards, as well as the interests applicable to the amount awarded and the costs of litigation. No income was recognized in Q2 in relation to the award, pending the enforcement procedures of the arbitration. COVID-19 impact The total net impact of COVID-19 on H1 2021 EBITDA was not considered to be material to the Group as the short-term mitigation actions related to labor costs (including furloughs) and indirect spend were substantially completed at December 31, 2020. The Group will continue to monitor any future evolution of the sanitary crisis. COVID-19 began to impact the group in Q2 2020 with an estimated EBITDA impact of €-220 million (after mitigation actions related to labor costs (including furloughs) and indirect spend). In addition, in Q2 2020, the impact of COVID-19 indicated that some assets could be impaired. The review confirmed that there was an impairment which impacted Composite Materials (€0.8 billion), Technology Solutions (€0.3 billion), and the Oil & Gas (€160 million) GBUs as well as other small assets (€189 million). For additional information see the 2020 annual report. 2. Accounting policies Solvay prepares its condensed consolidated interim financial statements on a quarterly basis, in accordance with IAS 34 “Interim Financial Reporting” using the same accounting policies as those adopted for the preparation of the consolidated financial statements for the year ended December 31, 2020. They do not include all the information required for the preparation of the annual consolidated financial statements and should be read in conjunction with the consolidated financial statements for the year ended December 31, 2020. The critical accounting judgments and key sources of estimation uncertainty included in the 2020 annual report remain

July 29, 2021 Second quarter and first half 2021 financial report 21/28
applicable. Relevant updates on specific topics are included in these notes and should be read together with the 2020 annual report. During H1 2021, Amendments to IFRS 9, IFRS 7 and IFRS 16 – Interest Rate Benchmark Reform – Phase 2 became effective for the Group and its adoption did not have an impact on the consolidated financial statements during the period. Going forward the Group’s management will continue to monitor the market evolution resulting from the decisions taken by each of the relevant authorities of such benchmarks, however, based on the current understanding IBOR Reform Phase 2 is not expected to have more than an insignificant impact on the Group’s consolidated financial statements. Attributing Benefit to Periods of Service (IAS 19 Employee Benefits) – IFRS IC Agenda Decision In April 2021, the International Financial Reporting Standards Interpretations Committee (IFRS IC) issued a financial agenda decision on IAS 19 Employee Benefits which included updates regarding the periods of service to which an entity attributes benefit for a particular defined benefit plan. Solvay is currently analyzing the potential impact this may have on the post-retirement plans of the Group. If any, this would be a decrease of the defined benefit obligation. 3. Segment information Solvay is organized in the following operating segments:
● Materials offer a unique portfolio of high-performance polymers and composite technologies used primarily in sustainable mobility applications. Its solutions enable weight reduction and enhance performance while improving CO2 and energy efficiency. Major markets served include next-generation mobility in automotive and aerospace, healthcare and electronics.
● Chemicals host chemical intermediate businesses focused on mature and resilient markets. Solvay is a world leader in soda ash and peroxides and major markets served include building and construction, consumer goods and food. Its Silica, Coatis and RusVinyl businesses are also high quality assets with strong positions in their markets. This segment provides resilient cash flows and the company selectively invests in these businesses to become the #1 cash conversion chemical player.
● Solutions offer a unique formulation & application expertise through customized specialty formulations for surface chemistry & liquid behavior, maximizing yield and efficiency of the processes they are used in while minimizing the eco-impact. Novecare, Technology Solutions, Aroma and Special Chem focus on specific areas such as resources (improving the extraction yield of metals, minerals and oil), industrial applications (such as coatings) or consumer goods and healthcare (including vanillin and guar for home and personal care).
● Corporate & Business Services includes corporate and other business services, such as Group research & innovation or energy services, whose mission is to optimize energy consumption and reduce CO2 emissions.
Reconciliation of segment, underlying and IFRS data (in € million) Q2 2021 Q2 2020 H1 2021 H1 2020 Net sales 2,456 2,175 4,829 4,649
Materials 711 681 1,400 1,470 Chemicals 820 658 1,610 1,458 Solutions 925 834 1,815 1,717 Corporate & Business Services 1 2 4 3
Underlying EBITDA 602 439 1,185 1,008 Materials 220 170 426 398 Chemicals 249 167 489 405 Solutions 171 133 344 287 Corporate & Business Services -38 -31 -74 -83 Underlying depreciation, amortization & impairments -179 -237 -380 -435
Underlying EBIT 424 202 805 573 Non-cash accounting impact from amortization & depreciation of purchase price
allocation (PPA) from acquisitions -37 -49 -75 -100
Net financial charges and remeasurements of equity book value of the RusVinyl joint venture -1 4 - -13
Result from portfolio management & major restructuring -34 -1,496 -195 -1,554 Result from legacy remediation & major litigations -19 -9 -33 -21
EBIT 333 -1,347 502 -1,114 Net financial charges -28 -45 -58 -72
Profit / (loss) for the period before taxes 305 -1,393 444 -1,187 Income taxes -72 -155 -98 -203
Profit / (loss) for the period from continuing operations 233 -1,548 346 -1,389 Profit / (loss) for the period from discontinued operations - 15 - 117
Profit / (loss) for the period 233 -1,533 346 -1,273 attributable to non-controlling interests 11 7 20 18
attributable to Solvay shareholders 222 -1,540 326 -1,290
The non-cash PPA impacts can be found in the reconciliation table on pages 12 and 14.
July 29, 2021 Second quarter and first half 2021 financial report 22/28
4. Financial Instruments Valuation techniques Compared to December 31, 2020, there are no changes in valuation techniques. Fair value of financial instruments measured at amortized cost For all financial instruments not measured at fair value in Solvay’s consolidated statement of financial position, the fair value of those financial instruments as of June 30, 2021, is not significantly different from the ones published in Note F35 of the consolidated financial statements for the year ended December 31, 2020. Financial instruments measured at fair value For financial instruments measured at fair value in Solvay’s consolidated statement of financial position, the fair value hierarchy and valuation method of those instruments as of June 30, 2021, remained the same as published in the Note F35 of the consolidated financial statements for the year ended December 31, 2020. The evolutions in fair value can be observed from the statement of financial position and are mainly due to the evolution in energy prices. 5. Events after the reporting period On July 1, Solvay announced the closing of the acquisition, from Bayer, of a seed coating business, with facilities in Méréville, France, and tolling operations in the U.S. and Brazil. This is a natural extension to Solvay’s own AgRHO® family of sustainable seed boosting solutions (part of Novecare) and supports the drive toward more bio-based, sustainable technologies. A preliminary payment of €19 million has been made in June 2021, subject to customary post-closing adjustments. 6. Declaration by responsible persons Ilham Kadri, Chief Executive Officer, and Karim Hajjar, Chief Financial Officer, of the Solvay Group, declare that to the best of their knowledge:
● The condensed consolidated financial information, prepared in accordance with IAS 34 “Interim Financial Reporting” as adopted by the European Union, reflects a faithful image of the assets and liabilities, financial situation and results of the Solvay Group;
● The management report contains a faithful presentation of significant events occurring during the first six months of 2021, and their impact on the condensed consolidated financial information;
● The main risks and uncertainties are in accordance with the assessment disclosed in the Risk Management section of the Solvay 2020 Annual Integrated Report, taking into account the current economic and financial environment.

July 29, 2021 Second quarter and first half 2021 financial report 23/28
7. Auditor’s report
Report on the review of the condensed consolidated interim financial information of Solvay SA/NV for the six-month period ended 30 June 2021 In the context of our appointment as the company’s statutory auditor, we report to you on the condensed consolidated interim financial information. This condensed consolidated interim financial information comprises the condensed consolidated statement of financial position as at 30 June 2021, the condensed consolidated income statement, the condensed consolidated statement of comprehensive income, the condensed consolidated statement of changes in equity and the condensed consolidated statement of cash flows for the period of six months then ended, as well as selective notes 1 to 6. Report on the consolidated interim financial information We have reviewed the condensed consolidated interim financial information of Solvay SA/NV (“the company”) and its subsidiaries (jointly “the group”), prepared in accordance with International Accounting Standard (IAS) 34, “Interim Financial Reporting” as adopted by the European Union. The condensed consolidated condensed statement of financial position shows total assets of 17 936 million EUR and the consolidated condensed income statement shows a consolidated profit (group share) for the period then ended of 326 million EUR. The board of directors of the company is responsible for the preparation and fair presentation of the condensed consolidated interim financial information in accordance with IAS 34, “Interim Financial Reporting” as adopted by the European Union. Our responsibility is to express a conclusion on this condensed consolidated interim financial information based on our review. Scope of review We conducted our review of the condensed consolidated interim financial information in accordance with International Standard on Review Engagements (ISRE) 2410, “Review of interim financial information performed by the independent auditor of the entity”. A review of interim financial information consists of making inquiries, primarily of persons responsible for financial and accounting matters, and applying analytical and other review procedures. A review is substantially less in scope than an audit performed in accordance with the International Standards on Auditing (ISA) and consequently does not enable us to obtain assurance that we would become aware of all significant matters that might be identified in an audit. Accordingly, we do not express an audit opinion on the condensed consolidated interim financial information. Conclusion Based on our review, nothing has come to our attention that causes us to believe that the condensed consolidated interim financial information of Solvay SA/NV has not been prepared, in all material respects, in accordance with IAS 34, “Interim Financial Reporting” as adopted by the European Union. Zaventem, 28 July 2021 The statutory auditor Deloitte Bedrijfsrevisoren/Réviseurs d’Entreprises BV/SRL Represented by ____________ ___________ Michel Denayer Corine Magnin

July 29, 2021 Second quarter and first half 2021 financial report 24/28
Glossary Adjustments: Each of these adjustments made to the IFRS results is considered to be significant in nature and/or value. Excluding these items from the profit metrics provides readers with relevant additional information on the Group’s underlying performance over time because it is consistent with how the business’ performance is reported to the Board of Directors and the Executive Committee. These adjustments consist of:
• Results from portfolio management and major restructurings, • Results from legacy remediation and major litigations, • Amortization of intangible assets resulting from Purchase Price Allocation (PPA) and inventory step-up in
gross margin, • Net financial results related to changes in discount rates, coupons of hybrid bonds deducted from equity
under IFRS and debt management impacts (mainly including gains/(losses) related to the early repayment of debt,
• Adjustments of equity earnings for impairment gains or losses and unrealized foreign exchange gains or losses on debt,
• Results from equity instruments measured at fair value through other comprehensive income, • Tax effects related to the items listed above and tax expense or income of prior years • All adjustments listed above apply to both continuing and discontinuing operations, and include the
impacts on non-controlling interests Basic earnings per share: Net income (Solvay’s share) divided by the weighted average number of shares, after deducting own shares purchased to cover stock option programs. Capital expenditure (capex): Cash paid for the acquisition of tangible and intangible assets presented in cash flows from investing activities, and cash paid on the lease liabilities (excluding interests paid), presented in cash flows from financing activities. This indicator is used to manage capital employed in the Group. Cash conversion: Is a ratio used to measure the conversion of EBITDA into cash. It is defined as (Underlying EBITDA + Capex from continuing operations) / Underlying EBITDA. CFROI: Cash Flow Return On Investment measures the cash returns of Solvay’s business activities. Movements in CFROI levels are relevant indicators for showing whether economic value is being added, though it is accepted that this measure cannot be benchmarked or compared with industry peers. The definition uses a reasonable estimate (management estimate) of the replacement cost of assets and avoids accounting distortions, e.g. for impairments. It is calculated as the ratio between recurring cash flow and invested capital, where:
• Recurring cash flow = Underlying EBITDA + (Dividends from associates and joint ventures – Underlying Earnings from associates and joint ventures) + Recurring capex + Recurring income taxes;
• Invested capital = Replacement value of goodwill & fixed assets + Net working capital + Carrying amount of associates and joint ventures;
• Recurring capex is normalized at 2,3% of the Replacement value of fixed assets net of Goodwill; • Recurring income taxes are normalized at 28% of (Underlying EBIT – Underlying Earnings from associates
and joint ventures); CTA: Currency Translation Adjustment Diluted earnings per share: Net income (Solvay’s share) divided by the weighted average number of shares adjusted for the effects of dilution. Discontinued operations: Component of the Group which the Group has disposed of or which is classified as held for sale, and:
• Represents a separate major line of business or geographical area of operations; • Is part of a single coordinated plan to dispose of a separate major line of business or geographical area
of operations; or • Is a subsidiary acquired exclusively with a view to resale
EBIT: Earnings before interest and taxes. Performance indicator that is a measure of the Group’s operating profitability irrespective of the funding’s structure. EBITDA: Earnings before interest and taxes, depreciation and amortization. The Group has included EBITDA as an alternative performance indicator because management believes that the measure provides useful information to assess the Group’s operating profitability as well as the Group’s ability to generate operating cash flows.

July 29, 2021 Second quarter and first half 2021 financial report 25/28
Extra-financial indicators: Indicators used that measure the sustainability performance of the company in complement to financial indicators. Solvay has selected 10 indicators that are included in the ONE Planet initiative. For more information, we refer to the last available annual report available on www.solvay.com Free cash flow: Cash flows from operating activities (excluding cash flows linked to acquisitions or disposals of subsidiaries and cash outflows of Voluntary Pension Contributions, as they are deleveraging in nature as a reimbursement of debt), cash flows from investing activities (excluding cash flows from or related to acquisitions and disposals of subsidiaries, cash flows related to internal management of portfolio (one-off external costs of internal carve-out, related taxes...) and other investments, and excluding loans to associates and non-consolidated investments, and recognition of factored receivables), payment of lease liabilities, and increase/decrease of borrowings related to environmental remediation. Prior to the adoption of IFRS 16, operating lease payments were included within free cash flow. Following the application of IFRS 16, because leases are generally considered to be operating in nature, free cash flow incorporates the payment of the lease liability (excluding the interest expense). Excluding this item in the free cash flow would result in a significant improvement of free cash flow compared to prior periods, whereas the operations themselves have not been affected by the implementation of IFRS 16. It is a measure of cash generation, working capital efficiency and capital discipline of the Group. Free cash flow to Solvay shareholders: Free cash flow after payment of net interests, coupons of perpetual hybrid bonds and dividends to non-controlling interests. This represents the cash flow available to Solvay shareholders, to pay their dividend and/or to reduce the net financial debt. Free cash flow conversion: Calculated as the ratio between the free cash flow to Solvay shareholders of the last rolling 12 months (before netting of dividends paid to non-controlling interest) and underlying EBITDA of the last rolling 12 months. GBU: Global business unit. HPPO: Hydrogen peroxide propylene oxide, new technology to produce propylene oxide using hydrogen peroxide. IFRS: International Financial Reporting Standards. LTM: Last twelve months Leverage ratio: Net debt / underlying EBITDA of last 12 months. Underlying leverage ratio = underlying net debt / underlying EBITDA of last 12 months. Mandatory contributions to employee benefits plans: For funded plans, contributions to plan assets corresponding to amounts required to be paid during the respective period, in accordance with agreements with trustees or regulation, as well as, for unfunded plans, benefits paid to beneficiaries. Net cost of borrowings: cost of borrowings netted with interest on loans and short-term deposits, as well as other gains (losses) on net indebtedness. Net financial debt: Non-current financial debt + current financial debt – cash & cash equivalents – other financial instruments (current and non-current). Underlying net debt reclassifies as debt 100% of the hybrid perpetual bonds, considered as equity under IFRS. It is a key measure of the strength of the Group’s financial position and is widely used by credit rating agencies. Net financial charges: Net cost of borrowings, and costs of discounting provisions (namely, related to post-employment benefits and Health Safety and Environmental liabilities). Net pricing: The difference between the change in sales prices versus the change in variable costs. Net sales: Sales of goods and value added services corresponding to Solvay’s know-how and core business. Net sales exclude Revenue from non-core activities. Net working capital: Includes inventories, trade receivables and other current receivables, netted with trade payables and other current liabilities.

July 29, 2021 Second quarter and first half 2021 financial report 26/28
OCI: Other Comprehensive Income. Operational deleveraging: Reduction of liabilities (net debt or provisions) through operational performance only, i.e. excluding impacts from acquisitions and divestitures, as well as remeasurement impacts (changes of foreign exchange, inflation, mortality and discount rates). Organic growth: Growth of Net sales or underlying EBITDA excluding scope changes and forex conversion effects. The calculation is made by rebasing the prior period at the business scope and forex conversion rate of the current period. PA: Polyamide, polymer type. pp: Unit of percentage points, used to express the evolution of ratios. PPA: Purchase Price Allocation (PPA) accounting impacts related to acquisitions, primarily for Rhodia and Cytec. Pricing power: The ability to create positive net pricing. PSU: Performance Share Unit. PVC: Polyvinyl chloride, polymer type. Research & innovation: Research & development costs recognized in the income statement and as capital expenditure before deduction of related subsidies, royalties and depreciation and amortization expense. It measures the total cash effort in research & innovation, regardless of whether the costs were expensed or capitalized. Research & innovation intensity: Ratio of Research & innovation / net sales Result from legacy remediation and major litigations: It includes:
• The remediation costs not generated by on-going production facilities (shut-down of sites, discontinued productions, previous years’ pollution), and
• The impact of significant litigations Results from portfolio management and major restructuring: It includes:
• Gains and losses on the sale of subsidiaries, joint operations, joint ventures, and associates that do not qualify as discontinued operations;
• Acquisition costs of new businesses; • One-off operating external costs related to internal management of portfolio (carve-out of major lines of
businesses); • Gains and losses on the sale of real estate not directly linked to an operating activity; • Restructuring charges driven by portfolio management and by major reorganization of business activities,
including impairment losses resulting from the shutdown of an activity or a plant; • Impairment losses resulting from testing of Cash Generating Units (CGUs); • It excludes non-cash accounting impact from amortization and depreciation resulting from the purchase
price allocation (PPA) from acquisitions Revenue from non-core activities: Revenues primarily comprising commodity and utility trading transactions and other revenue, considered to not correspond to Solvay’s know-how and core business. ROCE: Return on Capital Employed, calculated as the ratio between underlying EBIT (before adjustment for the amortization of PPA) and capital employed. Capital employed consists of net working capital, tangible and intangible assets, goodwill, rights-of-use assets, investments in associates & joint ventures and other investments, and is taken as the average of the situation at the end of the last 4 quarters. SBTi: Science-based target initiative SOP: Stock Option Plan. SPM: The Sustainable Portfolio Management tool is integrated into the Solvay Way framework (linked to five practices). It serves as a strategic tool for developing information on our portfolio and analyzing the impacts of sustainability megatrends on our businesses.
July 29, 2021 Second quarter and first half 2021 financial report 27/28
Underlying: Underlying results are deemed to provide a more comparable indication of Solvay’s fundamental performance over the reference periods. They are defined as the IFRS figures adjusted for the “Adjustments” as defined above. They provide readers with additional information on the Group’s underlying performance over time as well as the financial position and they are consistent with how the business’ performance and financial position are reported to the Board of Directors and the Executive Committee. Underlying Tax rate: Income taxes / (Result before taxes – Earnings from associates & joint ventures – interests & realized foreign exchange results on RusVinyl joint venture) – all determined on an Underlying basis. The adjustment of the denominator regarding associates and joint ventures is made as these contributions are already net of income taxes. This provides an indication of the tax rate across the Group. Voluntary pension contributions: Contributions to plan assets in excess of Mandatory Contributions to employee benefits plans. These payments are discretionary and are driven by the objective of value creation. These voluntary contributions are excluded from free cash flow as they are deleveraging in nature as a reimbursement of debt. WACC: Weighted Average Cost of Capital yoy: Year on year comparison.

July 29, 2021 Second quarter and first half 2021 financial report 28/28
Contacts Investor relations Media relations Jodi Allen Nathalie Van Ypersele +1 609 860 4608 +32 478 20 10 62 [email protected] Geoffroy d’Oultremont +32 2 264 29 97 Brian Carroll +32 2 264 15 30 Bisser Alexandrov [email protected] +32 2 264 36 87 [email protected] Peter Boelaert +32 479 30 91 59 [email protected] Safe harbor This press release may contain forward-looking information. Forward-looking statements describe expectations, plans, strategies, goals, future events or intentions. The achievement of forward-looking statements contained in this press release is subject to risks and uncertainties relating to a number of factors, including general economic factors, interest rate and foreign currency exchange rate fluctuations, changing market conditions, product competition, the nature of product development, impact of acquisitions and divestitures, restructurings, products withdrawals, regulatory approval processes, all-in scenario of R&I projects and other unusual items. Consequently, actual results or future events may differ materially from those expressed or implied by such forward-looking statements. Should known or unknown risks or uncertainties materialize, or should our assumptions prove inaccurate, actual results could vary materially from those anticipated. Solvay undertakes no obligation to publicly update or revise any forward-looking statements. About Solvay Solvay is a science company whose technologies bring benefits to many aspects of daily life. With more than 23,000 employees in 64 countries, Solvay bonds people, ideas and elements to reinvent progress. The Group seeks to create sustainable shared value for all, notably through its Solvay One Planet plan crafted around three pillars: protecting the climate, preserving resources and fostering better life. The Group’s innovative solutions contribute to safer, cleaner, and more sustainable products found in homes, food and consumer goods, planes, cars, batteries, smart devices, health care applications, water and air purification systems. Founded in 1863, Solvay today ranks among the world’s top three companies for the vast majority of its activities and delivered net sales of €9.0 billion in 2020. Solvay is listed on Euronext Brussels (SOLB) and Paris and in the United States, where its shares (SOLVY) are traded through a Level I ADR program. Learn more at www.solvay.com. About Solvay Investor Relations Results’ documentation G.R.O.W. Strategy Share information Credit information ESG information Annual report Webcasts, podcasts and presentations

www.solvay.com/en/investors
Our SolvaLite™ composites are up to40% lighter than metal, allowingmanufacturers to create lighter andmore energy-efficient vehicles thatcontribute to reducing CO2 emissions.