Embed Size (px)
Citation preview
First Half 2021 Earnings ReleaseJuly 26, 2021
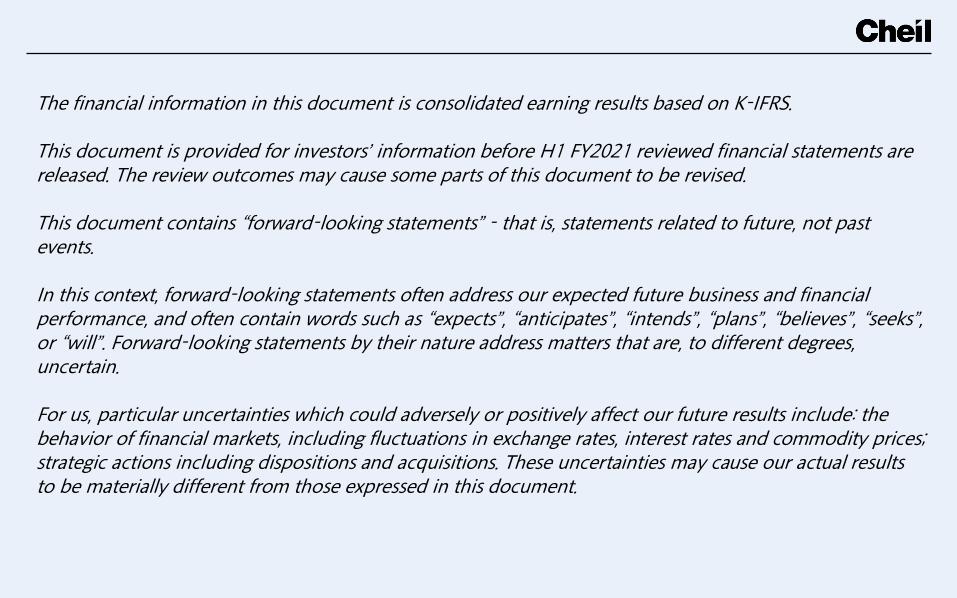
The financial information in this document is consolidated earning results based on K-IFRS.
This document is provided for investors’ information before H1 FY2021 reviewed financial statements are released. The review outcomes may cause some parts of this document to be revised.
This document contains “forward-looking statements” - that is, statements related to future, not past events.
In this context, forward-looking statements often address our expected future business and financial performance, and often contain words such as “expects”, “anticipates”, “intends”, “plans”, “believes”, “seeks”, or “will”. Forward-looking statements by their nature address matters that are, to different degrees, uncertain.
For us, particular uncertainties which could adversely or positively affect our future results include: the behavior of financial markets, including fluctuations in exchange rates, interest rates and commodity prices; strategic actions including dispositions and acquisitions. These uncertainties may cause our actual results to be materially different from those expressed in this document.
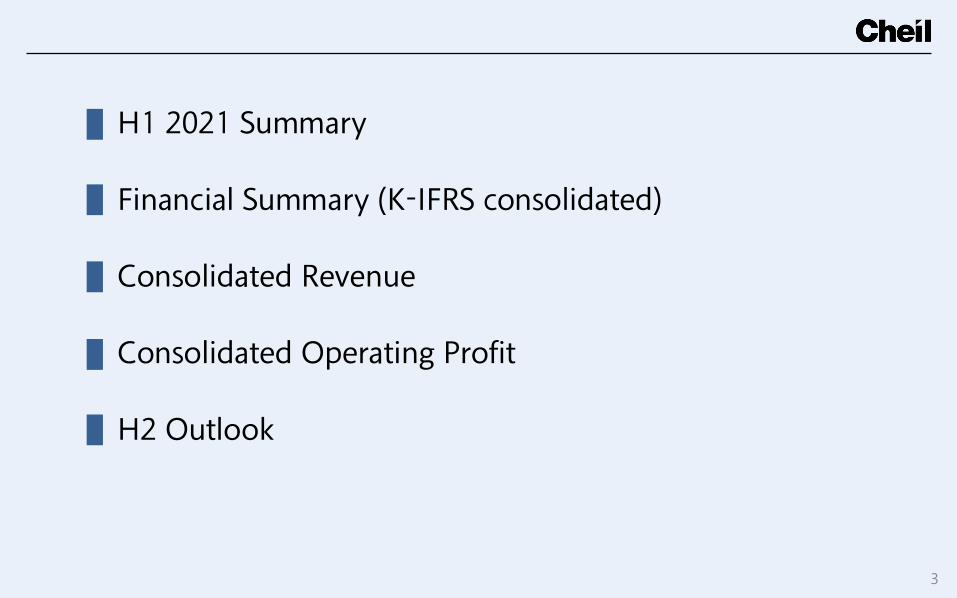
H1 2021 Summary
Financial Summary (K-IFRS consolidated)
Consolidated Revenue
Consolidated Operating Profit
H2 Outlook
3
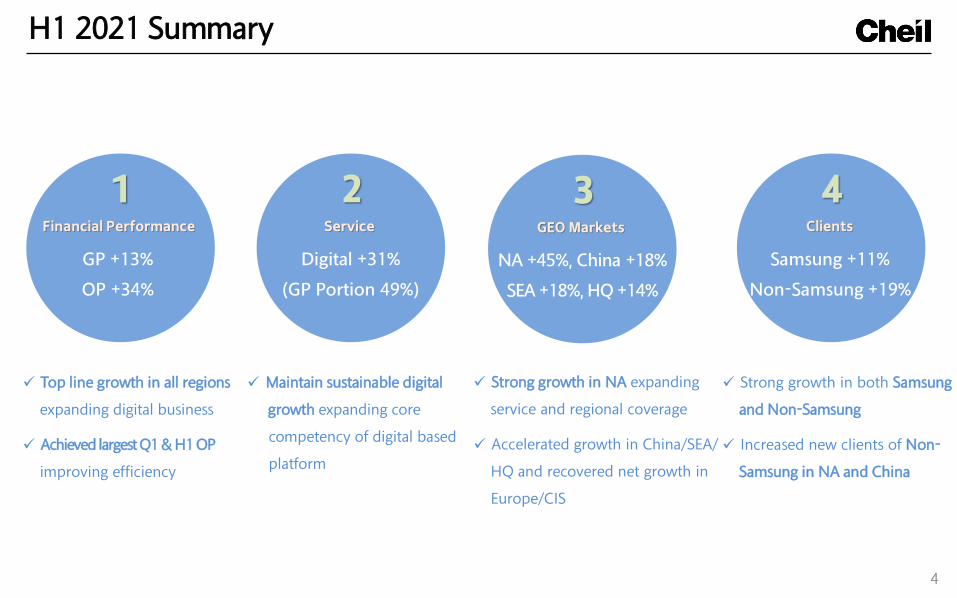
H1 2021 Summary
1Financial Performance
GP +13%
OP +34%
4Clients
Samsung +11%
Non-Samsung +19%
2Service
Digital +31%
(GP Portion 49%)
Top line growth in all regions
expanding digital business
Achieved largest Q1 & H1 OP
improving efficiency
Maintain sustainable digital
growth expanding core
competency of digital based
platform
Strong growth in both Samsung
and Non-Samsung
Increased new clients of Non-
Samsung in NA and China
3GEO Markets
NA +45%, China +18%
SEA +18%, HQ +14%
Strong growth in NA expanding
service and regional coverage
Accelerated growth in China/SEA/
HQ and recovered net growth in
Europe/CIS
4

Financial Summary (K-IFRS consolidated)
(KRW billion)
Q2 2020 Q2 2021 H1 2020 H1 2021Growth Growth
Revenue(Gross Profit)
263.1 316.1 20% 520.2 587.3 13%
SG&A 209.3 244.0 17% 435.9 474.2 9%
Operating Profit
53.8 72.1 34% 84.3 113.1 34%
Non-operatingExpenses and Income
△4.8 1.2 - 0.5 5.7 1,040%
Income Before Income Taxes
49.0 73.3 50% 84.8 118.8 40%
Net Income 33.4 55.2 65% 58.5 88.1 51%
5
6
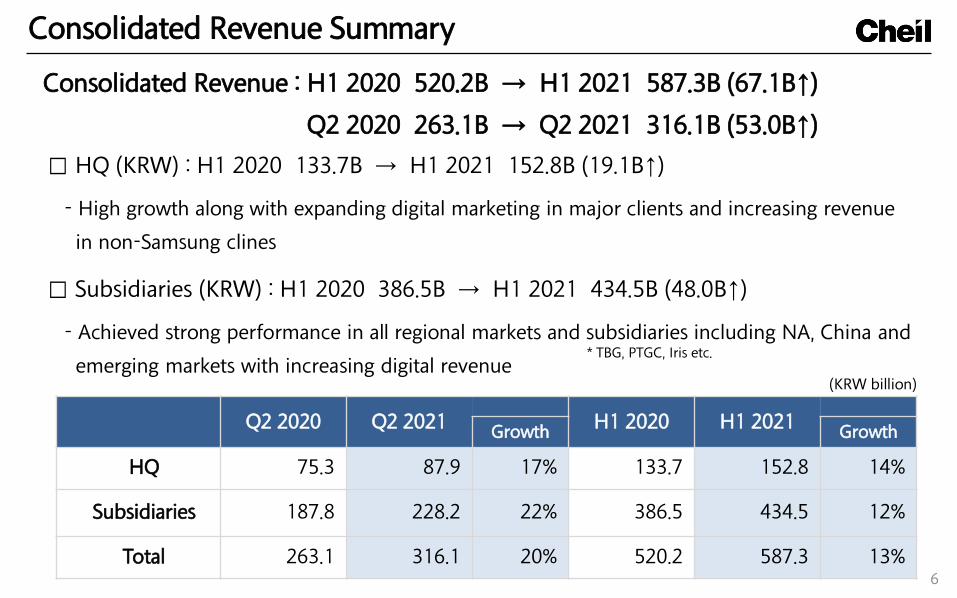
Consolidated Revenue : H1 2020 520.2B → H1 2021 587.3B (67.1B↑)
Q2 2020 263.1B → Q2 2021 316.1B (53.0B↑)
□ HQ (KRW) : H1 2020 133.7B → H1 2021 152.8B (19.1B↑)
- High growth along with expanding digital marketing in major clients and increasing revenue
in non-Samsung clines
□ Subsidiaries (KRW) : H1 2020 386.5B → H1 2021 434.5B (48.0B↑)
- Achieved strong performance in all regional markets and subsidiaries including NA, China and
emerging markets with increasing digital revenue(KRW billion)
Consolidated Revenue Summary
* TBG, PTGC, Iris etc.
Q2 2020 Q2 2021 H1 2020 H1 2021Growth Growth
HQ 75.3 87.9 17% 133.7 152.8 14%
Subsidiaries 187.8 228.2 22% 386.5 434.5 12%
Total 263.1 316.1 20% 520.2 587.3 13%
Consolidated Revenue | by Service
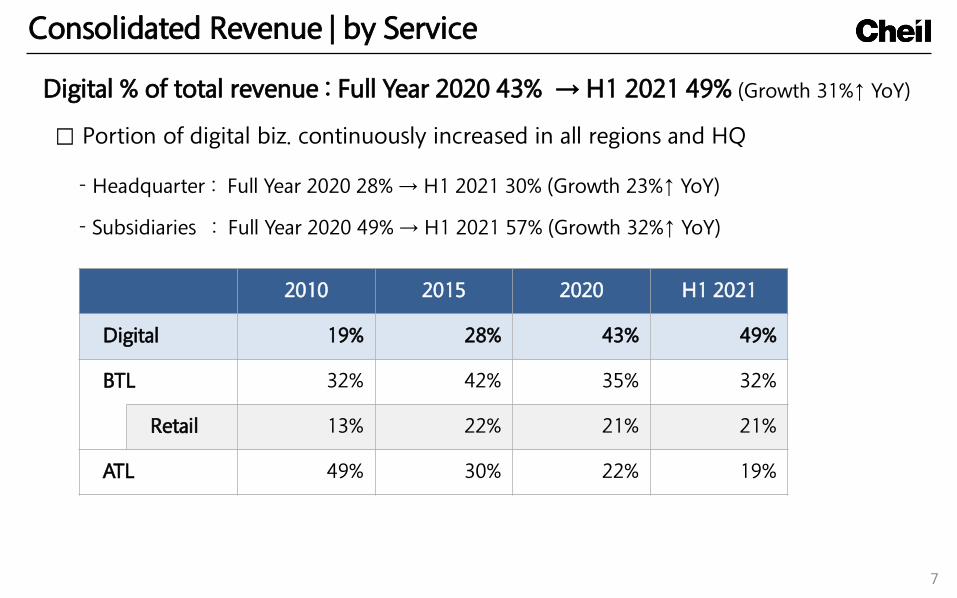
2010 2015 2020 H1 2021
Digital 19% 28% 43% 49%
BTL 32% 42% 35% 32%
Retail 13% 22% 21% 21%
ATL 49% 30% 22% 19%
7
Digital % of total revenue : Full Year 2020 43% → H1 2021 49% (Growth 31%↑ YoY)
□ Portion of digital biz. continuously increased in all regions and HQ
- Headquarter : Full Year 2020 28% → H1 2021 30% (Growth 23%↑ YoY)
- Subsidiaries : Full Year 2020 49% → H1 2021 57% (Growth 32%↑ YoY)
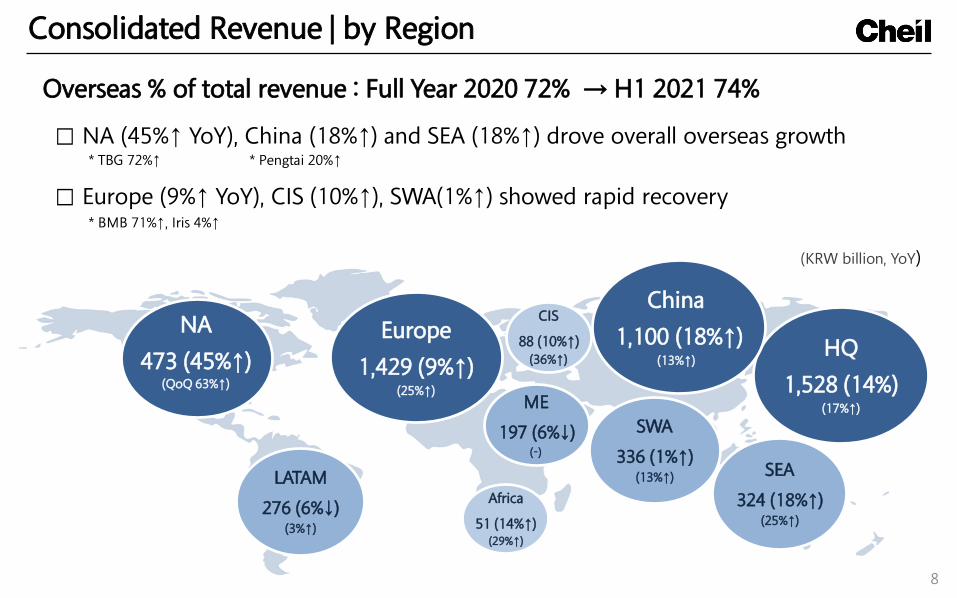
LATAM
276 (6%↓)(3%↑)
Europe
1,429 (9%↑)(25%↑)
SWA
336 (1%↑)(13%↑)
ME
197 (6%↓)(-)
SEA
324 (18%↑)(25%↑)
CIS
88 (10%↑)(36%↑)
Africa
51 (14%↑)(29%↑)
HQ
1,528 (14%)(17%↑)
NA
473 (45%↑)(QoQ 63%↑)
(KRW billion, YoY)
China
1,100 (18%↑)(13%↑)
Consolidated Revenue | by Region
8
Overseas % of total revenue : Full Year 2020 72% → H1 2021 74%
□ NA (45%↑ YoY), China (18%↑) and SEA (18%↑) drove overall overseas growth
□ Europe (9%↑ YoY), CIS (10%↑), SWA(1%↑) showed rapid recovery
* Pengtai 20%↑
* BMB 71%↑, Iris 4%↑
* TBG 72%↑
9
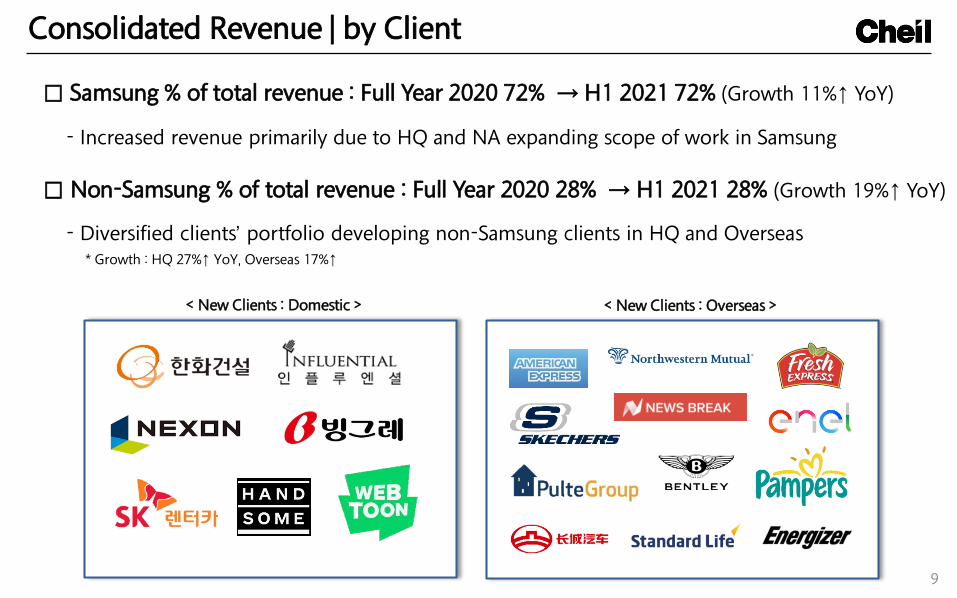
Consolidated Revenue | by Client
- Increased revenue primarily due to HQ and NA expanding scope of work in Samsung
□ Samsung % of total revenue : Full Year 2020 72% → H1 2021 72% (Growth 11%↑ YoY)
□ Non-Samsung % of total revenue : Full Year 2020 28% → H1 2021 28% (Growth 19%↑ YoY)
- Diversified clients’ portfolio developing non-Samsung clients in HQ and Overseas* Growth : HQ 27%↑ YoY, Overseas 17%↑
< New Clients : Overseas >< New Clients : Domestic >
Consolidated OP
10
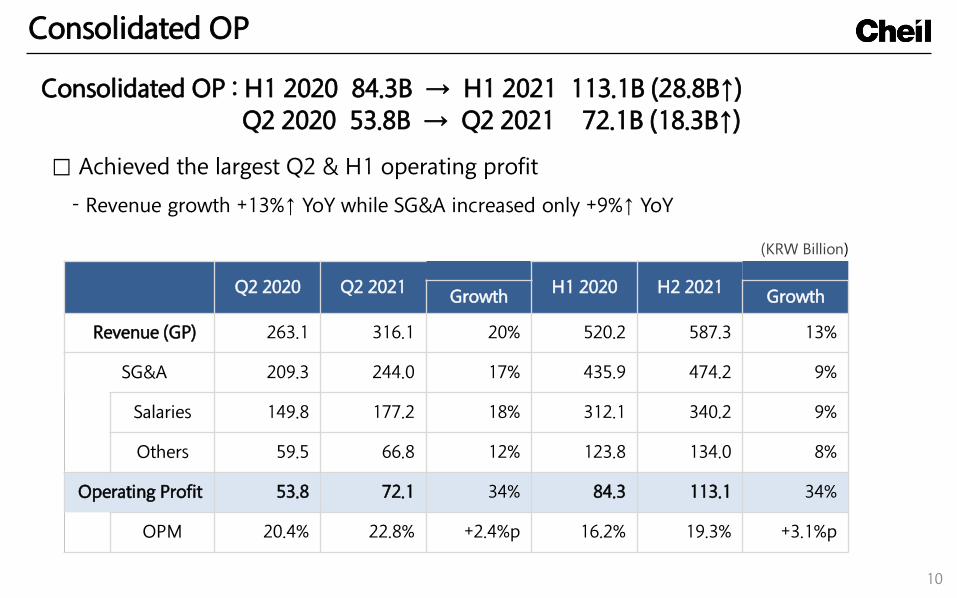
Consolidated OP : H1 2020 84.3B → H1 2021 113.1B (28.8B↑)Q2 2020 53.8B → Q2 2021 72.1B (18.3B↑)
□ Achieved the largest Q2 & H1 operating profit
(KRW Billion)
Q2 2020 Q2 2021 H1 2020 H2 2021Growth Growth
Revenue (GP) 263.1 316.1 20% 520.2 587.3 13%
SG&A 209.3 244.0 17% 435.9 474.2 9%
Salaries 149.8 177.2 18% 312.1 340.2 9%
Others 59.5 66.8 12% 123.8 134.0 8%
Operating Profit 53.8 72.1 34% 84.3 113.1 34%
OPM 20.4% 22.8% +2.4%p 16.2% 19.3% +3.1%p
- Revenue growth +13%↑ YoY while SG&A increased only +9%↑ YoY
SustainableGrowth
11
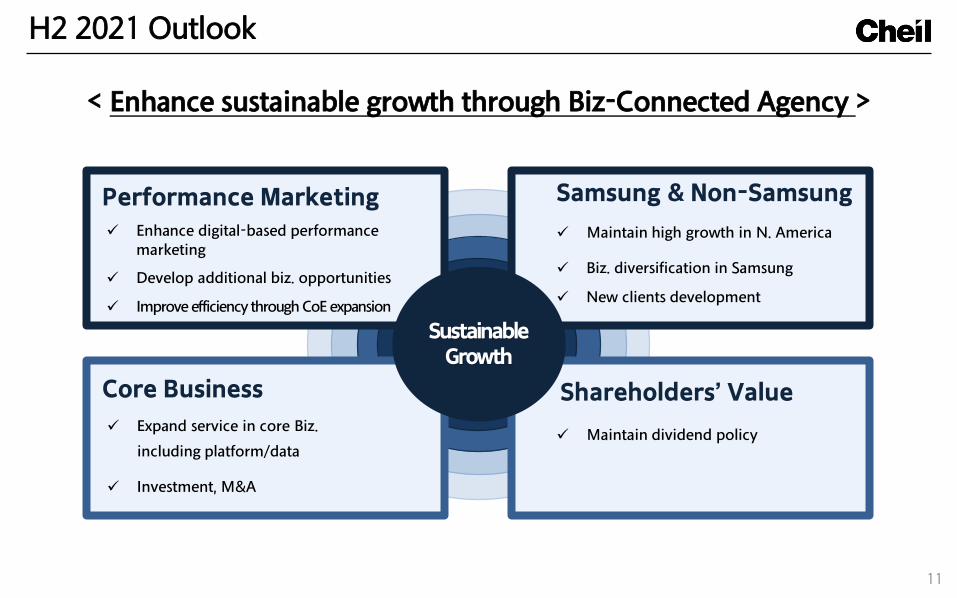
Performance Marketing Samsung & Non-Samsung
Maintain high growth in N. America
Biz. diversification in Samsung
New clients development
Core Business
Expand service in core Biz.
including platform/data
Investment, M&A
Shareholders’ Value
Maintain dividend policy
< Enhance sustainable growth through Biz-Connected Agency >
H2 2021 Outlook
Enhance digital-based performance marketing
Develop additional biz. opportunities
Improve efficiency through CoE expansion
12
- EOD -