Embed Size (px)
Citation preview

Physics in Medicine amp Biology
PAPER bull OPEN ACCESS
First full-beam PET acquisitions in proton therapywith a modular dual-head dedicated systemTo cite this article G Sportelli et al 2014 Phys Med Biol 59 43
View the article online for updates and enhancements
You may also likeStudy of resonances produced in lightnuclei through two and multi particlecorrelationsL Quattrocchi L Acosta F Amorini et al
-
ForewordR Pucci G G N Angilella and F Siringo
-
Diffusion and Electrical Behavior of AlImplanted into Capped SiA Scandurra G Galvagno V Raineri etal
-
This content was downloaded from IP address 211204247125 on 16032022 at 0619
OPEN ACCESSInstitute of Physics and Engineering in Medicine Physics in Medicine and Biology
Phys Med Biol 59 (2014) 43ndash60 doi1010880031-915559143
First full-beam PET acquisitions in protontherapy with a modular dual-headdedicated system
G Sportelli12 N Belcari12 N Camarlinghi12 G A P Cirrone3G Cuttone3 S Ferretti12 A Kraan12 J E Ortuno45F Romano3 A Santos45 K Straub12 A Tramontana36A Del Guerra12 and V Rosso12
1 Department of Physics University of Pisa Largo Bruno Pontecorvo 3 I-56127 PisaItaly2 Istituto Nazionale di Fisica Nucleare Sezione di Pisa Largo Bruno Pontecorvo 3I-56127 Pisa Italy3 Istituto Nazionale di Fisica Nucleare Laboratori Nazionali del Sud Via Santa Sofia62 I-95125 Catania Italy4 Department of Electronic Engineering ETSI de Telecomunicacion UniversidadPolitecnica de Madrid 28040 Madrid Spain5 CIBER de Bioingenierıa Biomateriales y Nanomedicina (CIBER-BBN) 28040Madrid Spain6 Department of Physics and Astronomy University of Catania Via Santa Sofia 64Catania Italy
E-mail sportellidfunipiit
Received 1 August 2013 revised 6 November 2013Accepted for publication 15 November 2013Published 10 December 2013
AbstractDuring particle therapy irradiation positron emitters with half-lives rangingfrom 2 to 20 min are generated from nuclear processes The half-lives are suchthat it is possible either to detect the positron signal in the treatment roomusing an in-beam positron emission tomography (PET) system right after theirradiation or to quickly transfer the patient to a close PETCT scanner Sincethe activity distribution is spatially correlated with the dose it is possible to usePET imaging as an indirect method to assure the quality of the dose delivery Inthis work we present a new dedicated PET system able to operate in-beam ThePET apparatus consists in two 10 cm times 10 cm detector heads Each detectoris composed of four scintillating matrices of 23 times 23 LYSO crystals The
Content from this work may be used under the terms of the Creative Commons Attribution 30licence Any further distribution of this work must maintain attribution to the author(s) and the title
of the work journal citation and DOI
0031-915514010043+18$3300 copy 2014 Institute of Physics and Engineering in Medicine Printed in the UK amp the USA 43
Phys Med Biol 59 (2014) 43 G Sportelli et al
crystal size is 19 mm times 19 mm times 16 mm Each scintillation matrix is read outindependently with a modularized acquisition system The distance betweenthe two opposing detector heads was set to 20 cm The system has very lowdead time per detector area and a 3 ns coincidence window which is capableto sustain high single count rates and to keep the random counts relativelylow This allows a new full-beam monitoring modality that includes dataacquisition also while the beam is on The PET system was tested duringthe irradiation at the CATANA (INFN Catania Italy) cyclotron-based protontherapy facility Four acquisitions with different doses and dose rates wereanalysed In all cases the random to total coincidences ratio was equal or lessthan 25 For each measurement we estimated the accuracy and precision ofthe activity range on a set of voxel lines within an irradiated PMMA phantomResults show that the inclusion of data acquired during the irradiation referredto as beam-on data improves both the precision and accuracy of the rangemeasurement with respect to data acquired only after irradiation Beam-on dataalone are enough to give precisions better than 1 mm when at least 5 Gy aredelivered
1 Introduction
Dose range in proton therapy is subject to several sources of uncertainty including theincompleteness of physical models (Pia et al 2010) and the effects of registration and patientmovement (Hui et al 2008) These uncertainties worsen the already limited capabilities inpredicting relative biological effectiveness for all tissues especially those close to the Braggpeak As a result the use of beam angles that would place the distal edge close to criticalstructures is discouraged (Grassberger et al 2011) This partially neutralizes the advantage ofcharged particles with respect to photons
One of the main actions that are being taken in order to overcome these problems is toresearch effective methods for in vivo verification of the beam delivery and in particular of theproton range in the patient Since the sum of range uncertainties typically exceeds 2 mm exceptin some cases such as lung or deep-seated treatments where it might be bigger (Paganetti2012) an in vivo range verification tool has to provide both millimetric accuracy and precisionin order to effectively contribute to the clinical practice If effective an in vivo monitoringwould allow better treatment planning by assuring the detection of discrepancies between theplanned and the actual delivery close to critical organs Also it could support experimentalactivities for better understanding uncertainties and their sources thus contributing to increasethe reliability of safety margins and eventually to enhance the number and diversity of beamdirections
The most used in vivo range verification method is positron emission tomography (PET)(Enghardt et al 2004 Knopf et al 2009 2011) PET monitoring is based on the fact that duringproton therapy several positron emitters are generated in the irradiated region (Bennett et al1978 Litzenberg et al 1992) These emitters eg 11C 13N and 15O have half-lives that allowto examine the subject during and after the irradiation with a PET scan (Parodi et al 2002)The resulting images can then be used to measure indirectly the delivered dose (Del Guerraet al 1997 Parodi and Enghardt 2000) Another similar method exists where the detectedradiation comes from prompt gamma emission after nuclear excitation by the protons in tissue(Polf et al 2009a 2009b) Prompt gamma detection has the main advantage of a more directcorrelation between the photon signal and the dose range with respect to PET However it still
44
Phys Med Biol 59 (2014) 43 G Sportelli et al
suffers from low detector efficiencies thus leaving PET as the only practical method at thistime (Moteabbed et al 2011)
The PET signal results from inelastic nuclear reactions with energy thresholds rangingfrom 3 to 20 MeV Therefore the distal activity fall-off is correlated but not directly matchedto the dose distribution Thus there is much interest in determining how the β+ activationcan be used to estimate the dose distribution (Oelfke et al 1996 Parodi and Bortfeld 2006Attanasi et al 2008a Grogg et al 2013 Knopf and Lomax 2013)
The established method is to use a Monte Carlo-simulated distribution of the positronemitters and compare the predicted image with the measured image (Parodi et al 2007aPaganetti et al 2008) Other methods use analytical forward or back-filters that transform theaxial dose profile into the activity profile (Parodi and Bortfeld 2006) and vice versa (Attanasiet al 2008a 2011) A successful estimation of the dose range from the activity depends on theaccuracy of underlying cross section data (Espana et al 2011) and requires in any case PETimages of excellent quality (Remmele et al 2011 Aiello et al 2013) However achieving highimage quality is not always possible PET imaging for proton therapy is subject to geometricaland temporal constraints that are absent in clinical PET applications (Crespo et al 2006 Nishioet al 2010) For systems placed around the immobilized patient in the beam line ie in-beamthe angular coverage is limited by the free passage needed for the beam port Conversely full-ring systems need to be placed out of the beam line thus requiring a mechanical movementbetween the irradiation and the monitoring This reintroduces registration uncertainties partialwaste of the emitted radiation and worsens the effects of biological washout
A systematic comparison of these modalities shows that off-beam monitoring is notrecommended except for some specific tumours or unless the PET system is placed in thesame treatment room (ie in-room) (Shakirin et al 2011)
In-beam monitoring is the first clinical implementation of PET for monitoring ofradiotherapy It was launched in 1997 at the experimental carbon ion therapy facility at GSIHelmholtzzentrum fur Schwerionenforschung (centre for heavy ions research) DarmstadtGermany (Enghardt et al 2004) The PET installation is completely integrated into the therapyfacility and has the potential to provide the best quality feedback for treatment monitoringsince it requires no additional time to move the patient to the PET scanner The ability to detectalignment errors is lower than in other modalities However the artefacts due to incompleteangular coverage can be mitigated at least with respect to the beam direction by increasing thedetectors size and reducing the gaps between the two heads (Crespo et al 2006) Additionallycounting statistics can be improved if the acquisition is performed also during the dose delivery
The main technological problem consists in filtering out data acquired during particlesextraction because the strong beam-induced background noise floods the PET detectors(Enghardt et al 2004 Parodi et al 2005 Crespo et al 2005) Such noise might originatefrom the decay of β+-emitters with half-lives in the millisecond range (eg 8B 9C and 12N)with correspondingly high β+-endpoint energies positron generating processes accompanyingnuclear reactions and random coincidences with the γ -decay of excited nuclear levels (Pawelkeet al 1997) Therefore the effect is either a broadening of the β+ activity spatial distributionor a paralysis of the acquisition system due to excessive random coincidence data that do notcarry any information regarding the β+ distribution (Enghardt et al 1999 Parodi et al 2002)Thus state of the art in-beam PET solutions are only applicable to synchrotron-based facilitiesand their effectiveness is limited by the accelerator duty cycle (Nishikido et al 2010 Tashimaet al 2012 Nishio et al 2010 Shakirin et al 2011)
Based on previous experiences with the first dedicated in-beam DoPET system (Vecchioet al 2009) we developed a new in-beam PET with wider detectors and modularizedacquisition for better counting performances (Sportelli et al 2011a) In the following we
45
Phys Med Biol 59 (2014) 43 G Sportelli et al
present the first reconstructed PET images of the activity produced during the continuousirradiation of a polymethyl methacrylate (PMMA) phantom at the CATANA cyclotron-basedproton therapy facility The new architecture and the improved dead time at the front-end(Belcari et al 2007) allowed to mitigate the effects of random coincidence rates and toacquire valid PET data in the high noisy environment produced by the irradiation (Sportelliet al 2012)
The paper is organized as follows in section 2 the distribution of PET activity in timeis described to give an idea of the trade-off between acquisition duration and availablestatistics The PET system the experimental set-up and the software algorithms used forimage reconstruction and range determination are described in section 3 Section 4 reports theobtained results counting statistics energy spectra in-beam images and activity ranges Insection 5 we discuss and conclude the work
2 PET activity and range verification quality
Positron emitters production rate during irradiation is proportional to the current of theaccelerator ie to the treatment dose rate The production of radioisotopes competes withthe decay process For most of the observed radioisotopes the irradiation condition is farfrom the secular equilibrium and the result is a continuous increase on the β+ activityAfter the irradiation the β+ decay is the only process occurring and the expected behaviourof the activity over time is a sum of exponential decays which is the convolution of thecontribution of the various isotopes present in different quantities and decaying at differentspeeds
We are interested in quantifying the amount of statistics available from most abundantisotopes produced by a continuous irradiation (beam-on) as compared to those available afterthe end of it (beam-off) To do so we assume that the PET detectors have sufficiently low deadtime in order not to paralyze during the irradiation because of the high background noise Inthis kind of comparison the proportion between beam-on and beam-off data is independentfrom the dose rate ie it only depends on the half-life of each produced isotope and theinvolved time intervals For simplicity let us consider two main isotopes produced by protonson PMMA ie 15O and 11C in a likely scenario in which the irradiation lasts 3 min and theacquisition 10 min Assuming that the production is a constant process we can describe thesebehaviours in arbitrary units for each separated isotope To give an idea of the proportionsbetween beam-on and beam-off available data we report in figure 1 (left) the activity ratescalculated as the result of the productionndashdecay processes with the corresponding integralcontribution of data acquired during and after the irradiation (right)
Since one of the main limiting factors in state of the art PET for in vivo monitoring isthe low statistics we aim at demonstrating that in-beam data taken while the beam is on caneffectively contribute to improve the statistical accuracy of the reconstructed image
In the following discussion we use three dataset types we refer to the data acquiredduring the irradiation as lsquobeam-onrsquo data all the remaining data is referred to as lsquobeam-offrsquodata We call lsquofull-beamrsquo data the union of both datasets for a given acquisition In orderto characterize the trade-off between acquisition duration and reconstruction noise beam-offdata are reconstructed at 60 180 300 or 600 s after the end of the irradiation To evaluate theimpact of beam-on data in range verification we will compare the activity ranges calculated onthe reconstructed images and their statistical precision for a given monoenergetic irradiationand for each dataset
46
Phys Med Biol 59 (2014) 43 G Sportelli et al
(a) (b)
(c) (d)
Figure 1 Expected activity rates for 15O (a) and 11C (c) Integral of the activities overtime for 15O (b) and 11C (d) In (b) and (d) the grey line is the annihilation integratedactivity over time for beam-on only acquisitions the black line is the integrated activitythat can be acquired after the beam shut down
3 Materials and methods
31 The PET system
A planar positron imaging system was arranged at the beam line at CATANA proton therapyfacility (INFN Catania Italy) (Cirrone et al 2004) as in previous experiments (Attanasi et al2008b) In comparison to the previous system (Vecchio et al 2009) the two detector heads wereincreased four-fold ie from 5 cm times 5 cm to 10 cm times 10 cm (Rosso et al 2013) The numberof detector modules per detector head was increased from 1 to 4 The gap between each moduleis 6 mm Each module is composed of 23 times 23 LYSO crystals of 19 mm times 19 mm times 16 mmThe energy response of the used LYSO crystals is characterized by a high-energy tail due tooptical effects (Bonifacio et al 2010) The PET system was installed on the patient chair andthe centre of its detection area was aligned with the isocentre of the beam line in the treatmentroom (Sportelli et al 2012 Rosso et al 2013) The distance between the two opposing detectorheads is adjustable from 7 to 30 cm The field of view (FOV) is 10 cmtimes10 cmtimesD cm whereD is the distance between the two detector heads The point source resolution at the centre is12 mm times 12 mm times 60 mm full width at half maximum
The acquisition system features a custom modular board able to handle up to 18 modules(Sportelli et al 2011a) Coincidence detection is performed by a synchronous processoroperating at 240 MHz and providing a coincidence resolution of 3 ns (Sportelli et al 2011b)The maximum data collection rate for detected coincidences is about 1 million counts persecond (cps) though this limit has been never reached with eight modules because of thecounting limits of single photons at the front-end
47
Phys Med Biol 59 (2014) 43 G Sportelli et al
Table 1 Acquisitions performed at the CATANA facility
Acquisition Total dose (Gy) Delivery time (s) Dose rate (Gy minminus1)
1 2 170 072 5 186 163 10 197 304 20 124 97
The information of the onndashoff time points of beam irradiation is currently inferred fromthe count rates and double checked with the beam monitors with a resolution of 1 s For futureacquisitions it is planned to record the beam status from an external signal synchronized withthe accelerator
The detection efficiency was calibrated by using a 11 cm times 11 cm times 03 cm planar plasticcontainer filled with 18F-fluorodeoxyglucose (FDG) placed at the middle of the FOV andparallel to the detectors surface The calibration is used for a correction of the imaginguniformity and the detection sensitivity The maximum coincidence counting rate observedwith the planar source filled with 26 MBq of FDG is 300 kcps
32 Experimental set-up
Eye melanoma treatments at CATANA use typically 62 MeV proton beams with dose ratesthat vary from 10 to 20 Gy minminus1 (Cuttone et al 2011) Our measurements were performedwith monoenergetic passively collimated proton beams of 62 MeV Only pristine Bragg peakswere used which are characterized by a peak-to-plateau ratio of 5 We did not apply any rangemodulation in order to simplify the analysis at the activity distal endpoint This differs from theclinical practice where a spread out Bragg peak (SOBP) obtained with a PMMA modulatorwheel is generally used to cover the whole extension of the tumour in depth with the prescribeddose In our experiment variable accelerator currents were delivered on the PMMA phantomwith dose rates at the low end of the typical values ie ranging from 07 to 97 Gy minminus1 Ahomogeneous PMMA block phantom was placed at the centre of the FOV and irradiated witha beam of 34 mm diameter The distance between the two heads was set at 20 cm A list of thefour performed irradiations is reported in table 1 The value of the absolute dose correspondsto the dose at the entrance of the phantom
Each measurement was performed sequentially on initially inactive phantoms of PMMAThe dose and the beam current were preset at the beginning of the irradiation The phantomwas irradiated continuously until reaching the preset dose in the beam monitor The dose ratewas calculated as the total dose divided by the irradiation time Activity position and intensitywere measured during the irradiation plus 600 s immediately after the end of the irradiation
Coincidence data were stored in a list mode format Single coincident and random countsrates were recorded in a separate file with binning intervals of one second Random coincidencerates were measured but their spatial distribution was not acquired
33 Image reconstruction
Images were reconstructed using an iterative Maximum Likelihood Expectation Maximization(MLEM) reconstruction algorithm The implemented algorithm makes use of a system modelcomputed using a multi-ray variant of the Siddon algorithm (Moehrs et al 2008) Imagesand profiles used in this work were all obtained by performing five MLEM iterations Eachiteration took 5 s to be computed on a 64 bit Intel i5-2400 based machine with four cores
48
Phys Med Biol 59 (2014) 43 G Sportelli et al
(a) (b)
Figure 2 Example of range determination on voxel line profiles for two images withrelatively low (a) and high (b) statistics The lines marked in grey are the detectedproximal and distal edges of each line profile whose endpoints are circled in blackHorizontal dashed lines are the local threshold levels while vertical ones are the detectededge positions used for range determination
running at 31 GHz There are also plans for performing the same reconstruction on a GPU-based implementation (Sportelli et al 2013) Data were reconstructed using a LOR based datastructure and applying a 350ndash850 keV energy window The size of the reconstructed image is100 times 100 times 100 voxels 1 mm times 1 mm times 1 mm each thus including the complete FOV up to5 cm from the detectors surface At present no random or attenuation correction was applied
34 Estimation of the activity distal fall-off
Several methods have been used for the estimation of the activity distal fall-off The depth inthe phantom where the distal fall-off of the activity profile occurs can be measured by findingin the axial profile of the reconstructed activity distribution the coordinate of the point wherethe activity falls at 20 or 50 of the maximum value reached along the beam path (Parodi andBortfeld 2006 Parodi et al 2007b Moteabbed et al 2011 Min et al 2013) A way to evaluatethe precision of this estimation is to repeat this measurement for each 1 mm2 thin profile alongthe beam direction drawn in a defined region of interest (ROI) within the activated region Forirradiations along the axial direction of the scanner the profiles are naturally defined by linesof voxels in the image space (Helmbrecht et al 2012 Min et al 2013 Surti et al 2011)
A problem in estimating the activity distal range on voxels lines is that such lines havemuch lower statistics with respect to macroscopic profiles over larger regions The low statisticscan cause spikes that make it difficult to properly determine the threshold level Our approachhas been to first detect the proximal and distal edges of each line as the two longest monotonicpaths in the profile In doing so any relatively small spike with respect to the detected pathwas removed (figure 2) The position of each edge was then determined as the threshold levelover the local path maximum The proper choice of the range verification position in thefall-off region in the clinical practice can be controversial because ranges obtained with highthresholds are affected by the width of the SOBP while those obtained with low thresholds aregenerally more sensitive to image noise and to the beam energy spread (Parodi et al 2007a)Thus thresholds ranging from 20 to 50 are generally used (Knopf et al 2008) For ourpurposes a 50 threshold value is a reliable choice because in this study we have do notuse SOBP Also lower thresholds would be more problematic due to the low statistics of thedatasets involved in this study
For irradiations performed with monoenergetic beams like in the present set-up one cansuppose that the proton range is the same for each profile and then a constant depth for thedistal activity fall-off can be expected Thus the precision of the range measurement was
49
Phys Med Biol 59 (2014) 43 G Sportelli et al
(a) (b)
(c) (d)
Figure 3 Activity rates recorded during the four examined acquisitions Vertical dashedlines mark the end of each irradiation Solid lines represent the total coincidence ratesdotndashdashed lines represent the randoms rates
estimated by calculating the standard deviation of the measurements performed in each profile(σdepth) The accuracy of the measurement of the distal fall-off of the activity profile can beestimated as the deviation of the average depth (μdeptht) as calculated from all the 1D profilemeasurements with data acquired up to a time t from the estimation of the average depthcalculated in the same way but using the whole statistics of 10 min of PET measurement withbeam-off (μdepth600s) The latter is considered here as the best estimation for each irradiationof the depth of the activity distal fall-off being the measurement with the lesser statistical error
4 Results
41 Comparison of counting statistics
Total and random coincidence rates for the four acquisitions are shown in figure 3 During theirradiation the count rates for both true and random coincidences increase abruptly indicatingthe presence of fast nuclear processes The random to total coincidence ratio decreases duringthe irradiation The maximum observed random to total coincidence ratio is 245 at thebeginning of the 97 Gy minminus1 irradiation The acquisition rates at the beginning at the endand right after the irradiation are reported in table 2
42 Energy distribution of the acquired data
Energy histograms of the acquired coincidences are reported in figure 4 The blackline corresponds to the coincidences acquired during the irradiation (beam-on) The greyline corresponds to the coincidences acquired after it (beam-off) Dashed lines mark the350ndash850 keV energy window used for image reconstruction The spectrum of beam-off data
50
Phys Med Biol 59 (2014) 43 G Sportelli et al
Figure 4 Energy histograms for beam-on and beam-off data related to the four examinedacquisitions
Table 2 Total (T) and random (R) coincidence rates for the four acquisitions at thebeginning at the end and right after the irradiation
Irradiation begin Irradiation end After irradiation
T R RT() T R RT() T R RT()
1 13 kHz 82 Hz 66 29 kHz 98 Hz 34 19 kHz 24 Hz 132 24 kHz 221 Hz 90 67 kHz 318 Hz 47 44 kHz 42 Hz 103 54 kHz 07 kHz 122 128 kHz 10 kHz 74 85 kHz 89 Hz 104 170 kHz 41 kHz 245 358 kHz 62 kHz 174 191 kHz 261 Hz 14
remains almost unchanged with the different dose rates except for the 307 keV intrinsicemission peak of 176Lu which is more evident at low dose rates as expected A high-energy tailis present in both beam-off and beam-on data due to optical attenuation in the used scintillatingcrystals (Bonifacio et al 2010) This tail goes from the 511 keV peak to roughly 1 MeV Withhigher dose rates beam-on data show an increasing degradation of the annihilation photo-peakand a generally higher base level at all energies This behaviour was also expected due to theradiation noise during the delivery The fraction of events within the selected energy windowis reported in table 3 While the beam is on the fraction of events with energies gt850 keV ismuch higher and is increasing with the dose rate
43 Distal fall-off during and after the irradiation
The reconstructed images for acquisition 1 (2 Gy) and 4 (20 Gy) are shown in figures 5 and 6respectively including beam-on only data (a) 60 s of beam-off data (b) 60 s of full-beam data
51
Phys Med Biol 59 (2014) 43 G Sportelli et al
Table 3 Percentage of events within and at the two sides of the 350ndash850 keV energywindow used for image reconstructions The sum of percentages may not be 100 dueto rounding errors
Beam-off Beam-on
lt 350 keV 350ndash850 keV gt 850 keV lt 350 keV 350ndash850 keV gt 850 keV
1 291 688 21 278 619 1032 256 723 21 252 637 1113 234 745 20 256 622 1224 224 757 19 260 546 193
Table 4 Mean values for the range profiles of the four examined acquisitions Standarddeviations are reported within parentheses Beam-on only column includes all data fromthe beginning to the end of the irradiation (EOI) All values are expressed in mm
Beam-on only Beam-off only Full-beam
EOI 60 s 180 s 300 s 600 s 60 s 180 s 300 s 600 s
1 187 (22) 175 (30) 185 (13) 188 (10) 189 (09) 189 (15) 189 (09) 190 (08) 191 (07)2 193 (08) 186 (14) 190 (05) 190 (05) 191 (05) 193 (06) 192 (05) 193 (05) 192 (05)3 192 (06) 189 (07) 190 (05) 190 (04) 191 (04) 192 (05) 192 (04) 191 (04) 191 (04)4 199 (06) 190 (05) 192 (03) 192 (03) 193 (02) 195 (04) 195 (03) 194 (03) 195 (02)
(c) and 600 s of full-beam data (d) The ROIs used for range determination are marked with adashed line The ROIs are cylindrical with 2 cm diameter and 9 cm height Profiles calculatedon such images are shown in figure 7(a)ndash(d) ie 2 Gy and compared with images of thefourth acquisition (e)ndash(h) ie 20 Gy The dose range is reported as a black dashed line ineach plot Dose range has been calculated given the depth of the Bragg peak in homogeneousPMMA ie 29 mm (Oelfke et al 1996) starting from the activity rising edge In figure 7 itcan be seen how the image background noise is higher when the reconstruction is performedwith low statistics ie low dose (a)ndash(d) rather than with high dose rates (e)ndash(h)
The noise level in the image is reflected in the distribution of the calculated distal rangesfigure 8 shows the variation of the average depth and the relative standard deviation of themeasurement of the distal fall-off related to the activity profile for each of the four acquisitionshere considered For each acquisition μdepth and σdepth are reported as estimated from beam-ondata only (t = 0 dotted line) beam-off data only (at t = 60 s t = 180 s t = 300 s andt = 600 s) and full-beam data including both beam-on and beam-off data Values for μdeptht
and σdeptht are also reported in table 4 Plots show that the value of μdeptht derived withbeam-off data only (grey line) is slightly underestimated with respect to the reference valueof μdepth600s (highest statistics) when the acquisition time is short while it converges to thelatter as the time increases The μdepth0s value (beam-on only) is overestimated with respectto μdepth600s in all cases but the 2 Gy irradiation The inclusion of beam-on data (full-beam)always improves the convergence speed As for image noise a higher standard deviation isobtained for low doses and thus a less precise range is determined
In each of the four acquisitions the largest mean range deviation from the reference valueis seen in the images reconstructed with only 60 s of beam-off data The same effect has beenobserved in all the acquisitions with less than one million events (figure 9) thus suggesting asystematic range determination error for very low statistics
52
Phys Med Biol 59 (2014) 43 G Sportelli et al
(a)
(b)
(c)
(d)
Figure 5 Reconstructed images of the 2 Gy irradiation in three orthogonal planescentred in the field of view for different time-sets beam-on only data (a) first 60 s ofbeam-off data (b) beam-on data plus 60 s of beam-off data (c) beam-on data plus 600 sof beam-off data (d) The region marked with a dashed line represents the cylindricalROI used for range calculation The diameter of the cylinder is 2 cm the height is9 cm
53
Phys Med Biol 59 (2014) 43 G Sportelli et al
(a)
(b)
(c)
(d)
Figure 6 Reconstructed images of the 20 Gy irradiation in three orthogonal planescentred in the field of view for different time-sets beam-on only data (a) first 60 s ofbeam-off data (b) beam-on data plus 60 s of beam-off data (c) beam-on data plus 600 sof beam-off data (d) The region marked with a dashed line represents the cylindricalROI used for range calculation The diameter of the cylinder is 2 cm the height is9 cm
54
Phys Med Biol 59 (2014) 43 G Sportelli et al
(a)
(b)
(c)
(d)
(e)
(f)
(g)
(h)
Figure 7 Profiles of the reconstructed images for 2 Gy (left column (a)ndash(d)) and20 Gy (right column (e)ndash(h)) irradiations on different time-sets beam-on only data((a) (e)) first 60 s of beam-off data ((b) (f)) beam-on data plus 60 s of beam-off data((c) (g)) beam-on data plus 600 s of beam-off data ((d) (h)) The plot is obtained bysuperimposing the profiles of each voxel line included in the ROI (see figures 5 and 6)The white dashed line is the mean of all voxel lines The z coordinate of the dose rangeis indicated with a black dashed line Dose range has been calculated given the depth ofthe Bragg peak in homogeneous PMMA ie 29 mm starting from the activity risingedge
5 Conclusions
We have built and optimized a modular dual-head PET system for treatment monitoring inhadron therapy The system can operate continuously in-beam and is able to successfullyacquire the produced β+ activity in a field-of-view of 10 cm times 10 cm times 10 cm also during
55
Phys Med Biol 59 (2014) 43 G Sportelli et al
Figure 8 Means and standard deviations of activity ranges versus time for all thereconstructed images The expected dose range of the used 62 MeV proton beams inPMMA is 29 mm
0 1 2 3 4 5
Events [106]
170
175
180
185
190
195
200
205
210
Pro
files
mea
nra
nge
[mm
]
Range vs statistics
20 Gy - 97 Gymin Beam off only
10 Gy - 30 Gymin Beam off only
5 Gy - 16 Gymin Beam off only
2 Gy - 07 Gymin Beam off only
Figure 9 Means and standard deviations of activity ranges versus total acquired eventsfor all the reconstructed images The expected dose range of the used 62 MeV protonbeams in PMMA is 29 mm
the irradiation A distinction has been introduced between beam-on beam-off and full-beamdata referring to the acquisition output during the irradiation after or both respectively Thequestion that has been addressed is if beam-on data can be used either alone or jointly withbeam-off data to improve the quality of the system response for monitoring purposes A set
56
Phys Med Biol 59 (2014) 43 G Sportelli et al
of PET measurements was then performed at the cyclotron-based proton therapy facility atCATANA during the irradiation of a PMMA phantom at different dose rates and stopping theacquisition 10 min after
As already observed in other studies a characteristic high random count rate appearsduring the irradiation This count rate is roughly constant with a continuous beam and increasesquickly with the dose rate Since the phantom activation increases during the irradiation therandoms to total coincidences fraction decreases with time and becomes abruptly negligibleright after the beam turns off The maximum observed fraction at the beginning of an irradiationwith 97 Gy minminus1 dose rate is 245 This value is of the same order of an acceptablerandoms fraction in clinical PET imaging However the noise structure is different fromrandom coincidence noise in conventional PET thus future studies are expected to bettercharacterize its nature with respect to useful β+ activity and to improve the techniques usedfor reconstructing such data
The coincidence energy spectra of beam-on and beam-off data were also compared Asmall flat contamination from radiation with energies up to 2 MeV was observed in beam-ondata (2 MeV is the dynamic range of the system) With dose rates up to about 10 Gy minminus1 nosignificant degradation of the energy spectra was observed being the percentage of acquiredevents within the 350ndash850 keV energy window up to 622 of the total
For each measurement and modality we estimated accuracy and precision by studyingthe distribution of the activity ranges of a set of voxel lines within the activated materialResults show that the inclusion of beam-on data improves both the precision and accuracyof the proton range measurement with respect to data acquired after the irradiation only Theuse of beam-on data is enough to give a precision better that 1 mm (σ ) when at least 5 Gyare delivered Alternatively beam-on data can be effectively used to increase the availablestatistics for image reconstruction when the dose is lower For the lowest available dose rate(2 Gy minminus1) beam-on data did not produce sub-millimetric range precision but the precisionof the first 60 s of full-beam data is half with respect to that obtained with beam-off dataonly
The PET reconstructed signal is not quantitative No developments were carried out tostudy its capability as a quantitative instrument but with proper calibration we expect itsresponse to be linear within a wide range of input rates There are no reasons a priori thatwould hamper its ability to give quantitative results more than in conventional PET systems
The results of this investigation are promising for improving the quality and promptnessof PET monitoring though there is still a big margin for improvement The proposed in-beamPET system has in principle the same geometrical limitations as previous in-beam solutionsbut uses new electronics that allow to reduce the acquisition duration It is compatible withMonte Carlo based simulations as well as with all the range verification techniques that havebeen used so far However it requires the detectors response to be included in the simulationmodel so as to take into account the artefacts due to the limited angular coverage Washouteffects are expected to be less prominent than in any other PET imaging technique since theacquisition lasts only a few minutes from the beginning of the irradiation
Future work is planned to increase the angular coverage of the system in order to improverandom coincidences management to refine system synchronization with the beam and tocharacterize the detectors response Extending the detectors area from 10 cm times 10 cm to15 cm times 15 cm would require no major changes The number of detector modules wouldincrease from 8 to 18 and the software analysis would be more complex but the overallacquisition architecture and implementation would remain the same
57
Phys Med Biol 59 (2014) 43 G Sportelli et al
Acknowledgments
This research has been supported by the INFN-RT 60141 POR CRO FSE 2007-2013 SpainrsquosMinistry of Economy (TEC2010-21619-C04-03 TEC2011-28972-C02-02 and AMIT-CDTI)Comunidad de Madrid (ARTEMIS S2009DPI-1802) FULLBEAM-300838 Marie Curie IntraEuropean Fellowship within the lsquo7th European Community Framework Programmersquo (FP7)ENVISION project (FP7) and the European Regional Development Funds (FEDER)
References
Aiello M Attanasi F Belcari N Rosso V Straub K and Del Guerra A 2013 A dose determinationprocedure by PET monitoring in proton therapy Monte Carlo validation IEEE Trans NuclSci 60 3298ndash304
Attanasi F Knopf A Parodi K Paganetti H Bortfeld T Rosso V and Del Guerra A 2011 Extensionand validation of an analytical model for in vivo PET verification of proton therapyndasha phantom andclinical study Phys Med Biol 56 5079ndash98
Attanasi F et al 2008a Experimental validation of the filtering approach for dose monitoring in protontherapy at low energy Phys Med 24 102ndash6
Attanasi F et al 2008b Preliminary results of an in-beam PET prototype for proton therapy Nucl InstrumMethods Phys Res A 591 296ndash9
Belcari N Del Guerra A Camarda M Spontoni L Vecchio S and Bianchi D 2007 Performance of afour-output front-end electronics for multi-anode PMTS readout of scintillator arrays Nucl InstrumMethods Phys Res A 572 335ndash7
Bennett G Archambeau J Archambeau B Meltzer J and Wingate C 1978 Visualization and transport ofpositron emission from proton activation in vivo Science 200 1151ndash3
Bonifacio D A Belcari N Moehrs S Moralles M Rosso V Vecchio S and Del Guerra A 2010 A timeefficient optical model for GATE simulation of a LYSO scintillation matrix used in PET applicationsIEEE Trans Nucl Sci 57 2483ndash9
Cirrone G A P et al 2004 A 62-MeV proton beam for the treatment of ocular melanoma at LaboratoriNazionali del Sud-INFN IEEE Trans Nucl Sci 51 860ndash5
Crespo P Barthel T Frais-Kolbl H Griesmayer E Heidel K Parodi K Pawelke J P and Enghardt W 2005Suppression of random coincidences during in-beam PET measurements at ion beam radiotherapyfacilities IEEE Trans Nucl Sci 52 980ndash7
Crespo P Shakirin G and Enghardt W 2006 On the detector arrangement for in-beam PET for hadrontherapy monitoring Phys Med Biol 51 2143ndash63
Cuttone G et al 2011 CATANA protontherapy facility The state of art of clinical and dosimetricexperience Eur Phys J Plus 126 1ndash7
Del Guerra A Di Domenico G and Mukhopadhayay D 1997 PET dosimetry in proton radiotherapy aMonte Carlo study Appl Radiat Isot A 48 1617ndash24
Enghardt W Crespo P Fiedler F Hinz R Parodi K Pawelke J and Ponisch F 2004 Charged hadrontumour therapy monitoring by means of PET Nucl Instrum Methods Phys Res 525 284ndash8
Enghardt W Debus J Haberer T Hasch B Hinz R Jakel O Kramer M Lauckner K and Pawelke J 1999Strahlenther Onkol 175 33ndash36
Espana S Zhu X Daartz J Fakhri G E Bortfeld T and Paganetti H 2011 The reliability of proton-nuclearinteraction cross-section data to predict proton-induced PET images in proton therapy Phys MedBiol 56 2687ndash98
Grassberger C Trofimov A Lomax A and Paganetti H 2011 Variations in linear energy transfer withinclinical proton therapy fields and the potential for biological treatment planning Int J RadiatOncol 80 1559ndash66
Grogg K Zhu X Min C H Wilney B Bortfeld T Paganetti H Shih H A and El Fakhri G 2013 Feasibilityof using distal endpoints for in-room PET range verification of proton therapy IEEE Trans NuclSci 60 3290ndash7
Helmbrecht S Santiago A Enghardt W Kuess P and Fiedler F 2012 On the feasibility of automaticdetection of range deviations from in-beam PET data Phys Med Biol 57 1387ndash97
Hui Z Zhang X Starkschall G Li Y Mohan R Komaki R Cox J D and Chang J Y 2008 Effects ofinterfractional motion and anatomic changes on proton therapy dose distribution in lung cancer IntJ Radiat Oncol 72 1385ndash95
58
Phys Med Biol 59 (2014) 43 G Sportelli et al
Knopf A Parodi K Bortfeld T Shih H A and Paganetti H 2009 Systematic analysis of biologicaland physical limitations of proton beam range verification with offline PETCT scans Phys MedBiol 54 4477ndash95
Knopf A Parodi K Paganetti H Cascio E Bonab A and Bortfeld T 2008 Quantitative assessment of thephysical potential of proton beam range verification with PETCT Phys Med Biol 53 4137ndash51
Knopf A C and Lomax A 2013 In vivo proton range verification a review Phys Med Biol58 R131ndash60
Knopf A C Parodi K Paganetti H Bortfeld T Daartz J Engelsman M Liebsch N and Shih H2011 Accuracy of proton beam range verification using post-treatment positron emissiontomographycomputed tomography as function of treatment site Int J Radiat Oncol 79 297ndash304
Litzenberg D et al 1992 On-line monitoring and PET imaging of proton radiotherapy beams Conf RecordIEEE Nuclear Science Symp and Medical Imaging Conf vol 2 pp 954ndash6
Min C H Zhu X Winey B A Grogg K Testa M El Fakhri G Bortfeld T R Paganetti H and Shih H A2013 Clinical application of in-room positron emission tomography for in vivo treatment monitoringin proton radiation therapy Int J Radiat Oncol 86 183ndash9
Moehrs S Defrise M Belcari N Del Guerra A Bartoli A Fabbri S and Zanetti G 2008 Multi-ray-basedsystem matrix generation for 3D PET reconstruction Phys Med Biol 53 6925ndash45
Moteabbed M Espana S and Paganetti H 2011 Monte Carlo patient study on the comparison of promptgamma and PET imaging for range verification in proton therapy Phys Med Biol 56 1063ndash82
Nishikido F Mitsuhashi T Inadama N Inaniwa T Satoh S Tashima H Yoshida E Murayama Hand Yamaya T 2010 Performance evaluation of an OpenPET detector for heavy Ion therapyunder actual in-beam condition IEEE Nuclear Science Symp and Medical Imaging Conf Recordpp 3380ndash82
Nishio T Miyatake A Ogino T Nakagawa K Saijo N and Esumi H 2010 The development and clinicaluse of a beam on-line PET system mounted on a rotating gantry port in proton therapy Int J RadiatOncol 76 277ndash86
Oelfke U Lam G K and Atkins M S 1996 Proton dose monitoring with PET quantitative studies inLucite Phys Med Biol 41 177ndash96
Paganetti H 2012 Range uncertainties in proton therapy and the role of Monte Carlo simulations PhysMed Biol 57 R99ndash117
Paganetti H Jiang H Parodi K Slopsema R and Engelsman M 2008 Clinical implementation of fullMonte Carlo dose calculation in proton beam therapy Phys Med Biol 53 4825ndash53
Parodi K and Bortfeld T 2006 A filtering approach based on Gaussianndashpowerlaw convolutions for localPET verification of proton radiotherapy Phys Med Biol A 51 1991ndash2009
Parodi K Crespo P Eickhoff H Haberer T Pawelke J Schardt D and Enghardt W 2005 Randomcoincidences during in-beam PET measurements at microbunched therapeutic ion beams NuclInstrum Methods Phys Res A 545 446ndash458
Parodi K and Enghardt W 2000 Potential application of PET in quality assurance of proton therapy PhysMed Biol 45 N151ndash6
Parodi K Enghardt W and Haberer T 2002 In-beam PET measurements of β+ radioactivity Phys MedBiol 47 21ndash36
Parodi K Paganetti H Cascio E Flanz J B Bonab A A Alpert N M Lohmann K and Bortfeld T 2007aPETCT imaging for treatment verification after proton therapy a study with plastic phantoms andmetallic implants Med Phys 34 419ndash35
Parodi K et al 2007b Int J Radiat Oncol 68 920ndash34Pawelke J Enghardt W Haberer T Hasch B Hinz R Kramer M Lauckner E and Sobiella M 1997
In-beam PET imaging for the control of heavy-ion tumour therapy IEEE Trans Nucl Sci 44 1492ndash8Pia M G Begalli M Lechner A Quintieri L and Saracco P 2010 Physics-related epistemic uncertainties
in proton depth dose simulation IEEE Trans Nucl Sci 57 2805ndash30Polf J Peterson S Ciangaru G Gillin M and Beddar S 2009a Prompt gamma-ray emission from biological
tissues during proton irradiation a preliminary study Phys Med Biol 54 731ndash43Polf J Peterson S McCleskey M Roeder B Spiridon A Beddar S and Trache L 2009b Measurement
and calculation of characteristic prompt gamma ray spectra emitted during proton irradiation PhysMed Biol 54 N519ndash27
Remmele S Hesser J Paganetti H and Bortfeld T 2011 A deconvolution approach for PET-based dosereconstruction in proton radiotherapy Phys Med Biol 56 7601ndash19
Rosso V et al 2013 A new PET prototype for proton therapy comparison of data and Monte Carlosimulations J Instrum 8 C03021
59
Phys Med Biol 59 (2014) 43 G Sportelli et al
Shakirin G Braess H Fiedler F Kunath D Laube K Parodi K Priegnitz M and Enghardt W 2011Implementation and workflow for PET monitoring of therapeutic ion irradiation a comparison ofin-beam in-room and off-line techniques Phys Med Biol 56 1281ndash98
Sportelli G Belcari N Guerra P and Santos A 2011b Low-resource synchronous coincidence processorfor positron emission tomography Nucl Instrum Methods Phys Res A 648 S199ndash201
Sportelli G Belcari N Guerra P Spinella F Franchi G Attanasi F Moehrs S Rosso V Santos Aand Del Guerra A 2011a Reprogrammable acquisition architecture for dedicated positron emissiontomography IEEE Trans Nucl Sci 58 695ndash702
Sportelli G Ortuno J Vaquero J Desco M and Santos A 2013 Massively parallelizable list-modereconstruction using a Monte Carlo-based elliptical Gaussian model Med Phys 40 012504
Sportelli G et al 2012 Full in-beam PET measurements of 62 MeV protons onto a PMMA target NuclInstrum Methods A 718 151ndash3
Surti S Zou W Daube-Witherspoon M McDonough J and Karp J 2011 Design study of an in situ PETscanner for use in proton beam therapy Phys Med Biol 56 2667ndash85
Tashima H Yamaya T Yoshida E Kinouchi S Watanabe M and Tanaka E 2012 A single-ring OpenPETenabling PET imaging during radiotherapy Phys Med Biol 57 4705ndash18
Vecchio S et al 2009 A PET prototype for in-beam monitoring of proton therapy IEEE Trans NuclSci 56 51ndash56
60

Phys Med Biol 59 (2014) 43 G Sportelli et al
(a) (b)
(c) (d)
Figure 1 Expected activity rates for 15O (a) and 11C (c) Integral of the activities overtime for 15O (b) and 11C (d) In (b) and (d) the grey line is the annihilation integratedactivity over time for beam-on only acquisitions the black line is the integrated activitythat can be acquired after the beam shut down
3 Materials and methods
31 The PET system
A planar positron imaging system was arranged at the beam line at CATANA proton therapyfacility (INFN Catania Italy) (Cirrone et al 2004) as in previous experiments (Attanasi et al2008b) In comparison to the previous system (Vecchio et al 2009) the two detector heads wereincreased four-fold ie from 5 cm times 5 cm to 10 cm times 10 cm (Rosso et al 2013) The numberof detector modules per detector head was increased from 1 to 4 The gap between each moduleis 6 mm Each module is composed of 23 times 23 LYSO crystals of 19 mm times 19 mm times 16 mmThe energy response of the used LYSO crystals is characterized by a high-energy tail due tooptical effects (Bonifacio et al 2010) The PET system was installed on the patient chair andthe centre of its detection area was aligned with the isocentre of the beam line in the treatmentroom (Sportelli et al 2012 Rosso et al 2013) The distance between the two opposing detectorheads is adjustable from 7 to 30 cm The field of view (FOV) is 10 cmtimes10 cmtimesD cm whereD is the distance between the two detector heads The point source resolution at the centre is12 mm times 12 mm times 60 mm full width at half maximum
The acquisition system features a custom modular board able to handle up to 18 modules(Sportelli et al 2011a) Coincidence detection is performed by a synchronous processoroperating at 240 MHz and providing a coincidence resolution of 3 ns (Sportelli et al 2011b)The maximum data collection rate for detected coincidences is about 1 million counts persecond (cps) though this limit has been never reached with eight modules because of thecounting limits of single photons at the front-end
47
Phys Med Biol 59 (2014) 43 G Sportelli et al
Table 1 Acquisitions performed at the CATANA facility
Acquisition Total dose (Gy) Delivery time (s) Dose rate (Gy minminus1)
1 2 170 072 5 186 163 10 197 304 20 124 97
The information of the onndashoff time points of beam irradiation is currently inferred fromthe count rates and double checked with the beam monitors with a resolution of 1 s For futureacquisitions it is planned to record the beam status from an external signal synchronized withthe accelerator
The detection efficiency was calibrated by using a 11 cm times 11 cm times 03 cm planar plasticcontainer filled with 18F-fluorodeoxyglucose (FDG) placed at the middle of the FOV andparallel to the detectors surface The calibration is used for a correction of the imaginguniformity and the detection sensitivity The maximum coincidence counting rate observedwith the planar source filled with 26 MBq of FDG is 300 kcps
32 Experimental set-up
Eye melanoma treatments at CATANA use typically 62 MeV proton beams with dose ratesthat vary from 10 to 20 Gy minminus1 (Cuttone et al 2011) Our measurements were performedwith monoenergetic passively collimated proton beams of 62 MeV Only pristine Bragg peakswere used which are characterized by a peak-to-plateau ratio of 5 We did not apply any rangemodulation in order to simplify the analysis at the activity distal endpoint This differs from theclinical practice where a spread out Bragg peak (SOBP) obtained with a PMMA modulatorwheel is generally used to cover the whole extension of the tumour in depth with the prescribeddose In our experiment variable accelerator currents were delivered on the PMMA phantomwith dose rates at the low end of the typical values ie ranging from 07 to 97 Gy minminus1 Ahomogeneous PMMA block phantom was placed at the centre of the FOV and irradiated witha beam of 34 mm diameter The distance between the two heads was set at 20 cm A list of thefour performed irradiations is reported in table 1 The value of the absolute dose correspondsto the dose at the entrance of the phantom
Each measurement was performed sequentially on initially inactive phantoms of PMMAThe dose and the beam current were preset at the beginning of the irradiation The phantomwas irradiated continuously until reaching the preset dose in the beam monitor The dose ratewas calculated as the total dose divided by the irradiation time Activity position and intensitywere measured during the irradiation plus 600 s immediately after the end of the irradiation
Coincidence data were stored in a list mode format Single coincident and random countsrates were recorded in a separate file with binning intervals of one second Random coincidencerates were measured but their spatial distribution was not acquired
33 Image reconstruction
Images were reconstructed using an iterative Maximum Likelihood Expectation Maximization(MLEM) reconstruction algorithm The implemented algorithm makes use of a system modelcomputed using a multi-ray variant of the Siddon algorithm (Moehrs et al 2008) Imagesand profiles used in this work were all obtained by performing five MLEM iterations Eachiteration took 5 s to be computed on a 64 bit Intel i5-2400 based machine with four cores
48
Phys Med Biol 59 (2014) 43 G Sportelli et al
(a) (b)
Figure 2 Example of range determination on voxel line profiles for two images withrelatively low (a) and high (b) statistics The lines marked in grey are the detectedproximal and distal edges of each line profile whose endpoints are circled in blackHorizontal dashed lines are the local threshold levels while vertical ones are the detectededge positions used for range determination
running at 31 GHz There are also plans for performing the same reconstruction on a GPU-based implementation (Sportelli et al 2013) Data were reconstructed using a LOR based datastructure and applying a 350ndash850 keV energy window The size of the reconstructed image is100 times 100 times 100 voxels 1 mm times 1 mm times 1 mm each thus including the complete FOV up to5 cm from the detectors surface At present no random or attenuation correction was applied
34 Estimation of the activity distal fall-off
Several methods have been used for the estimation of the activity distal fall-off The depth inthe phantom where the distal fall-off of the activity profile occurs can be measured by findingin the axial profile of the reconstructed activity distribution the coordinate of the point wherethe activity falls at 20 or 50 of the maximum value reached along the beam path (Parodi andBortfeld 2006 Parodi et al 2007b Moteabbed et al 2011 Min et al 2013) A way to evaluatethe precision of this estimation is to repeat this measurement for each 1 mm2 thin profile alongthe beam direction drawn in a defined region of interest (ROI) within the activated region Forirradiations along the axial direction of the scanner the profiles are naturally defined by linesof voxels in the image space (Helmbrecht et al 2012 Min et al 2013 Surti et al 2011)
A problem in estimating the activity distal range on voxels lines is that such lines havemuch lower statistics with respect to macroscopic profiles over larger regions The low statisticscan cause spikes that make it difficult to properly determine the threshold level Our approachhas been to first detect the proximal and distal edges of each line as the two longest monotonicpaths in the profile In doing so any relatively small spike with respect to the detected pathwas removed (figure 2) The position of each edge was then determined as the threshold levelover the local path maximum The proper choice of the range verification position in thefall-off region in the clinical practice can be controversial because ranges obtained with highthresholds are affected by the width of the SOBP while those obtained with low thresholds aregenerally more sensitive to image noise and to the beam energy spread (Parodi et al 2007a)Thus thresholds ranging from 20 to 50 are generally used (Knopf et al 2008) For ourpurposes a 50 threshold value is a reliable choice because in this study we have do notuse SOBP Also lower thresholds would be more problematic due to the low statistics of thedatasets involved in this study
For irradiations performed with monoenergetic beams like in the present set-up one cansuppose that the proton range is the same for each profile and then a constant depth for thedistal activity fall-off can be expected Thus the precision of the range measurement was
49
Phys Med Biol 59 (2014) 43 G Sportelli et al
(a) (b)
(c) (d)
Figure 3 Activity rates recorded during the four examined acquisitions Vertical dashedlines mark the end of each irradiation Solid lines represent the total coincidence ratesdotndashdashed lines represent the randoms rates
estimated by calculating the standard deviation of the measurements performed in each profile(σdepth) The accuracy of the measurement of the distal fall-off of the activity profile can beestimated as the deviation of the average depth (μdeptht) as calculated from all the 1D profilemeasurements with data acquired up to a time t from the estimation of the average depthcalculated in the same way but using the whole statistics of 10 min of PET measurement withbeam-off (μdepth600s) The latter is considered here as the best estimation for each irradiationof the depth of the activity distal fall-off being the measurement with the lesser statistical error
4 Results
41 Comparison of counting statistics
Total and random coincidence rates for the four acquisitions are shown in figure 3 During theirradiation the count rates for both true and random coincidences increase abruptly indicatingthe presence of fast nuclear processes The random to total coincidence ratio decreases duringthe irradiation The maximum observed random to total coincidence ratio is 245 at thebeginning of the 97 Gy minminus1 irradiation The acquisition rates at the beginning at the endand right after the irradiation are reported in table 2
42 Energy distribution of the acquired data
Energy histograms of the acquired coincidences are reported in figure 4 The blackline corresponds to the coincidences acquired during the irradiation (beam-on) The greyline corresponds to the coincidences acquired after it (beam-off) Dashed lines mark the350ndash850 keV energy window used for image reconstruction The spectrum of beam-off data
50
Phys Med Biol 59 (2014) 43 G Sportelli et al
Figure 4 Energy histograms for beam-on and beam-off data related to the four examinedacquisitions
Table 2 Total (T) and random (R) coincidence rates for the four acquisitions at thebeginning at the end and right after the irradiation
Irradiation begin Irradiation end After irradiation
T R RT() T R RT() T R RT()
1 13 kHz 82 Hz 66 29 kHz 98 Hz 34 19 kHz 24 Hz 132 24 kHz 221 Hz 90 67 kHz 318 Hz 47 44 kHz 42 Hz 103 54 kHz 07 kHz 122 128 kHz 10 kHz 74 85 kHz 89 Hz 104 170 kHz 41 kHz 245 358 kHz 62 kHz 174 191 kHz 261 Hz 14
remains almost unchanged with the different dose rates except for the 307 keV intrinsicemission peak of 176Lu which is more evident at low dose rates as expected A high-energy tailis present in both beam-off and beam-on data due to optical attenuation in the used scintillatingcrystals (Bonifacio et al 2010) This tail goes from the 511 keV peak to roughly 1 MeV Withhigher dose rates beam-on data show an increasing degradation of the annihilation photo-peakand a generally higher base level at all energies This behaviour was also expected due to theradiation noise during the delivery The fraction of events within the selected energy windowis reported in table 3 While the beam is on the fraction of events with energies gt850 keV ismuch higher and is increasing with the dose rate
43 Distal fall-off during and after the irradiation
The reconstructed images for acquisition 1 (2 Gy) and 4 (20 Gy) are shown in figures 5 and 6respectively including beam-on only data (a) 60 s of beam-off data (b) 60 s of full-beam data
51
Phys Med Biol 59 (2014) 43 G Sportelli et al
Table 3 Percentage of events within and at the two sides of the 350ndash850 keV energywindow used for image reconstructions The sum of percentages may not be 100 dueto rounding errors
Beam-off Beam-on
lt 350 keV 350ndash850 keV gt 850 keV lt 350 keV 350ndash850 keV gt 850 keV
1 291 688 21 278 619 1032 256 723 21 252 637 1113 234 745 20 256 622 1224 224 757 19 260 546 193
Table 4 Mean values for the range profiles of the four examined acquisitions Standarddeviations are reported within parentheses Beam-on only column includes all data fromthe beginning to the end of the irradiation (EOI) All values are expressed in mm
Beam-on only Beam-off only Full-beam
EOI 60 s 180 s 300 s 600 s 60 s 180 s 300 s 600 s
1 187 (22) 175 (30) 185 (13) 188 (10) 189 (09) 189 (15) 189 (09) 190 (08) 191 (07)2 193 (08) 186 (14) 190 (05) 190 (05) 191 (05) 193 (06) 192 (05) 193 (05) 192 (05)3 192 (06) 189 (07) 190 (05) 190 (04) 191 (04) 192 (05) 192 (04) 191 (04) 191 (04)4 199 (06) 190 (05) 192 (03) 192 (03) 193 (02) 195 (04) 195 (03) 194 (03) 195 (02)
(c) and 600 s of full-beam data (d) The ROIs used for range determination are marked with adashed line The ROIs are cylindrical with 2 cm diameter and 9 cm height Profiles calculatedon such images are shown in figure 7(a)ndash(d) ie 2 Gy and compared with images of thefourth acquisition (e)ndash(h) ie 20 Gy The dose range is reported as a black dashed line ineach plot Dose range has been calculated given the depth of the Bragg peak in homogeneousPMMA ie 29 mm (Oelfke et al 1996) starting from the activity rising edge In figure 7 itcan be seen how the image background noise is higher when the reconstruction is performedwith low statistics ie low dose (a)ndash(d) rather than with high dose rates (e)ndash(h)
The noise level in the image is reflected in the distribution of the calculated distal rangesfigure 8 shows the variation of the average depth and the relative standard deviation of themeasurement of the distal fall-off related to the activity profile for each of the four acquisitionshere considered For each acquisition μdepth and σdepth are reported as estimated from beam-ondata only (t = 0 dotted line) beam-off data only (at t = 60 s t = 180 s t = 300 s andt = 600 s) and full-beam data including both beam-on and beam-off data Values for μdeptht
and σdeptht are also reported in table 4 Plots show that the value of μdeptht derived withbeam-off data only (grey line) is slightly underestimated with respect to the reference valueof μdepth600s (highest statistics) when the acquisition time is short while it converges to thelatter as the time increases The μdepth0s value (beam-on only) is overestimated with respectto μdepth600s in all cases but the 2 Gy irradiation The inclusion of beam-on data (full-beam)always improves the convergence speed As for image noise a higher standard deviation isobtained for low doses and thus a less precise range is determined
In each of the four acquisitions the largest mean range deviation from the reference valueis seen in the images reconstructed with only 60 s of beam-off data The same effect has beenobserved in all the acquisitions with less than one million events (figure 9) thus suggesting asystematic range determination error for very low statistics
52
Phys Med Biol 59 (2014) 43 G Sportelli et al
(a)
(b)
(c)
(d)
Figure 5 Reconstructed images of the 2 Gy irradiation in three orthogonal planescentred in the field of view for different time-sets beam-on only data (a) first 60 s ofbeam-off data (b) beam-on data plus 60 s of beam-off data (c) beam-on data plus 600 sof beam-off data (d) The region marked with a dashed line represents the cylindricalROI used for range calculation The diameter of the cylinder is 2 cm the height is9 cm
53
Phys Med Biol 59 (2014) 43 G Sportelli et al
(a)
(b)
(c)
(d)
Figure 6 Reconstructed images of the 20 Gy irradiation in three orthogonal planescentred in the field of view for different time-sets beam-on only data (a) first 60 s ofbeam-off data (b) beam-on data plus 60 s of beam-off data (c) beam-on data plus 600 sof beam-off data (d) The region marked with a dashed line represents the cylindricalROI used for range calculation The diameter of the cylinder is 2 cm the height is9 cm
54
Phys Med Biol 59 (2014) 43 G Sportelli et al
(a)
(b)
(c)
(d)
(e)
(f)
(g)
(h)
Figure 7 Profiles of the reconstructed images for 2 Gy (left column (a)ndash(d)) and20 Gy (right column (e)ndash(h)) irradiations on different time-sets beam-on only data((a) (e)) first 60 s of beam-off data ((b) (f)) beam-on data plus 60 s of beam-off data((c) (g)) beam-on data plus 600 s of beam-off data ((d) (h)) The plot is obtained bysuperimposing the profiles of each voxel line included in the ROI (see figures 5 and 6)The white dashed line is the mean of all voxel lines The z coordinate of the dose rangeis indicated with a black dashed line Dose range has been calculated given the depth ofthe Bragg peak in homogeneous PMMA ie 29 mm starting from the activity risingedge
5 Conclusions
We have built and optimized a modular dual-head PET system for treatment monitoring inhadron therapy The system can operate continuously in-beam and is able to successfullyacquire the produced β+ activity in a field-of-view of 10 cm times 10 cm times 10 cm also during
55
Phys Med Biol 59 (2014) 43 G Sportelli et al
Figure 8 Means and standard deviations of activity ranges versus time for all thereconstructed images The expected dose range of the used 62 MeV proton beams inPMMA is 29 mm
0 1 2 3 4 5
Events [106]
170
175
180
185
190
195
200
205
210
Pro
files
mea
nra
nge
[mm
]
Range vs statistics
20 Gy - 97 Gymin Beam off only
10 Gy - 30 Gymin Beam off only
5 Gy - 16 Gymin Beam off only
2 Gy - 07 Gymin Beam off only
Figure 9 Means and standard deviations of activity ranges versus total acquired eventsfor all the reconstructed images The expected dose range of the used 62 MeV protonbeams in PMMA is 29 mm
the irradiation A distinction has been introduced between beam-on beam-off and full-beamdata referring to the acquisition output during the irradiation after or both respectively Thequestion that has been addressed is if beam-on data can be used either alone or jointly withbeam-off data to improve the quality of the system response for monitoring purposes A set
56
Phys Med Biol 59 (2014) 43 G Sportelli et al
of PET measurements was then performed at the cyclotron-based proton therapy facility atCATANA during the irradiation of a PMMA phantom at different dose rates and stopping theacquisition 10 min after
As already observed in other studies a characteristic high random count rate appearsduring the irradiation This count rate is roughly constant with a continuous beam and increasesquickly with the dose rate Since the phantom activation increases during the irradiation therandoms to total coincidences fraction decreases with time and becomes abruptly negligibleright after the beam turns off The maximum observed fraction at the beginning of an irradiationwith 97 Gy minminus1 dose rate is 245 This value is of the same order of an acceptablerandoms fraction in clinical PET imaging However the noise structure is different fromrandom coincidence noise in conventional PET thus future studies are expected to bettercharacterize its nature with respect to useful β+ activity and to improve the techniques usedfor reconstructing such data
The coincidence energy spectra of beam-on and beam-off data were also compared Asmall flat contamination from radiation with energies up to 2 MeV was observed in beam-ondata (2 MeV is the dynamic range of the system) With dose rates up to about 10 Gy minminus1 nosignificant degradation of the energy spectra was observed being the percentage of acquiredevents within the 350ndash850 keV energy window up to 622 of the total
For each measurement and modality we estimated accuracy and precision by studyingthe distribution of the activity ranges of a set of voxel lines within the activated materialResults show that the inclusion of beam-on data improves both the precision and accuracyof the proton range measurement with respect to data acquired after the irradiation only Theuse of beam-on data is enough to give a precision better that 1 mm (σ ) when at least 5 Gyare delivered Alternatively beam-on data can be effectively used to increase the availablestatistics for image reconstruction when the dose is lower For the lowest available dose rate(2 Gy minminus1) beam-on data did not produce sub-millimetric range precision but the precisionof the first 60 s of full-beam data is half with respect to that obtained with beam-off dataonly
The PET reconstructed signal is not quantitative No developments were carried out tostudy its capability as a quantitative instrument but with proper calibration we expect itsresponse to be linear within a wide range of input rates There are no reasons a priori thatwould hamper its ability to give quantitative results more than in conventional PET systems
The results of this investigation are promising for improving the quality and promptnessof PET monitoring though there is still a big margin for improvement The proposed in-beamPET system has in principle the same geometrical limitations as previous in-beam solutionsbut uses new electronics that allow to reduce the acquisition duration It is compatible withMonte Carlo based simulations as well as with all the range verification techniques that havebeen used so far However it requires the detectors response to be included in the simulationmodel so as to take into account the artefacts due to the limited angular coverage Washouteffects are expected to be less prominent than in any other PET imaging technique since theacquisition lasts only a few minutes from the beginning of the irradiation
Future work is planned to increase the angular coverage of the system in order to improverandom coincidences management to refine system synchronization with the beam and tocharacterize the detectors response Extending the detectors area from 10 cm times 10 cm to15 cm times 15 cm would require no major changes The number of detector modules wouldincrease from 8 to 18 and the software analysis would be more complex but the overallacquisition architecture and implementation would remain the same
57
Phys Med Biol 59 (2014) 43 G Sportelli et al
Acknowledgments
This research has been supported by the INFN-RT 60141 POR CRO FSE 2007-2013 SpainrsquosMinistry of Economy (TEC2010-21619-C04-03 TEC2011-28972-C02-02 and AMIT-CDTI)Comunidad de Madrid (ARTEMIS S2009DPI-1802) FULLBEAM-300838 Marie Curie IntraEuropean Fellowship within the lsquo7th European Community Framework Programmersquo (FP7)ENVISION project (FP7) and the European Regional Development Funds (FEDER)
References
Aiello M Attanasi F Belcari N Rosso V Straub K and Del Guerra A 2013 A dose determinationprocedure by PET monitoring in proton therapy Monte Carlo validation IEEE Trans NuclSci 60 3298ndash304
Attanasi F Knopf A Parodi K Paganetti H Bortfeld T Rosso V and Del Guerra A 2011 Extensionand validation of an analytical model for in vivo PET verification of proton therapyndasha phantom andclinical study Phys Med Biol 56 5079ndash98
Attanasi F et al 2008a Experimental validation of the filtering approach for dose monitoring in protontherapy at low energy Phys Med 24 102ndash6
Attanasi F et al 2008b Preliminary results of an in-beam PET prototype for proton therapy Nucl InstrumMethods Phys Res A 591 296ndash9
Belcari N Del Guerra A Camarda M Spontoni L Vecchio S and Bianchi D 2007 Performance of afour-output front-end electronics for multi-anode PMTS readout of scintillator arrays Nucl InstrumMethods Phys Res A 572 335ndash7
Bennett G Archambeau J Archambeau B Meltzer J and Wingate C 1978 Visualization and transport ofpositron emission from proton activation in vivo Science 200 1151ndash3
Bonifacio D A Belcari N Moehrs S Moralles M Rosso V Vecchio S and Del Guerra A 2010 A timeefficient optical model for GATE simulation of a LYSO scintillation matrix used in PET applicationsIEEE Trans Nucl Sci 57 2483ndash9
Cirrone G A P et al 2004 A 62-MeV proton beam for the treatment of ocular melanoma at LaboratoriNazionali del Sud-INFN IEEE Trans Nucl Sci 51 860ndash5
Crespo P Barthel T Frais-Kolbl H Griesmayer E Heidel K Parodi K Pawelke J P and Enghardt W 2005Suppression of random coincidences during in-beam PET measurements at ion beam radiotherapyfacilities IEEE Trans Nucl Sci 52 980ndash7
Crespo P Shakirin G and Enghardt W 2006 On the detector arrangement for in-beam PET for hadrontherapy monitoring Phys Med Biol 51 2143ndash63
Cuttone G et al 2011 CATANA protontherapy facility The state of art of clinical and dosimetricexperience Eur Phys J Plus 126 1ndash7
Del Guerra A Di Domenico G and Mukhopadhayay D 1997 PET dosimetry in proton radiotherapy aMonte Carlo study Appl Radiat Isot A 48 1617ndash24
Enghardt W Crespo P Fiedler F Hinz R Parodi K Pawelke J and Ponisch F 2004 Charged hadrontumour therapy monitoring by means of PET Nucl Instrum Methods Phys Res 525 284ndash8
Enghardt W Debus J Haberer T Hasch B Hinz R Jakel O Kramer M Lauckner K and Pawelke J 1999Strahlenther Onkol 175 33ndash36
Espana S Zhu X Daartz J Fakhri G E Bortfeld T and Paganetti H 2011 The reliability of proton-nuclearinteraction cross-section data to predict proton-induced PET images in proton therapy Phys MedBiol 56 2687ndash98
Grassberger C Trofimov A Lomax A and Paganetti H 2011 Variations in linear energy transfer withinclinical proton therapy fields and the potential for biological treatment planning Int J RadiatOncol 80 1559ndash66
Grogg K Zhu X Min C H Wilney B Bortfeld T Paganetti H Shih H A and El Fakhri G 2013 Feasibilityof using distal endpoints for in-room PET range verification of proton therapy IEEE Trans NuclSci 60 3290ndash7
Helmbrecht S Santiago A Enghardt W Kuess P and Fiedler F 2012 On the feasibility of automaticdetection of range deviations from in-beam PET data Phys Med Biol 57 1387ndash97
Hui Z Zhang X Starkschall G Li Y Mohan R Komaki R Cox J D and Chang J Y 2008 Effects ofinterfractional motion and anatomic changes on proton therapy dose distribution in lung cancer IntJ Radiat Oncol 72 1385ndash95
58
Phys Med Biol 59 (2014) 43 G Sportelli et al
Knopf A Parodi K Bortfeld T Shih H A and Paganetti H 2009 Systematic analysis of biologicaland physical limitations of proton beam range verification with offline PETCT scans Phys MedBiol 54 4477ndash95
Knopf A Parodi K Paganetti H Cascio E Bonab A and Bortfeld T 2008 Quantitative assessment of thephysical potential of proton beam range verification with PETCT Phys Med Biol 53 4137ndash51
Knopf A C and Lomax A 2013 In vivo proton range verification a review Phys Med Biol58 R131ndash60
Knopf A C Parodi K Paganetti H Bortfeld T Daartz J Engelsman M Liebsch N and Shih H2011 Accuracy of proton beam range verification using post-treatment positron emissiontomographycomputed tomography as function of treatment site Int J Radiat Oncol 79 297ndash304
Litzenberg D et al 1992 On-line monitoring and PET imaging of proton radiotherapy beams Conf RecordIEEE Nuclear Science Symp and Medical Imaging Conf vol 2 pp 954ndash6
Min C H Zhu X Winey B A Grogg K Testa M El Fakhri G Bortfeld T R Paganetti H and Shih H A2013 Clinical application of in-room positron emission tomography for in vivo treatment monitoringin proton radiation therapy Int J Radiat Oncol 86 183ndash9
Moehrs S Defrise M Belcari N Del Guerra A Bartoli A Fabbri S and Zanetti G 2008 Multi-ray-basedsystem matrix generation for 3D PET reconstruction Phys Med Biol 53 6925ndash45
Moteabbed M Espana S and Paganetti H 2011 Monte Carlo patient study on the comparison of promptgamma and PET imaging for range verification in proton therapy Phys Med Biol 56 1063ndash82
Nishikido F Mitsuhashi T Inadama N Inaniwa T Satoh S Tashima H Yoshida E Murayama Hand Yamaya T 2010 Performance evaluation of an OpenPET detector for heavy Ion therapyunder actual in-beam condition IEEE Nuclear Science Symp and Medical Imaging Conf Recordpp 3380ndash82
Nishio T Miyatake A Ogino T Nakagawa K Saijo N and Esumi H 2010 The development and clinicaluse of a beam on-line PET system mounted on a rotating gantry port in proton therapy Int J RadiatOncol 76 277ndash86
Oelfke U Lam G K and Atkins M S 1996 Proton dose monitoring with PET quantitative studies inLucite Phys Med Biol 41 177ndash96
Paganetti H 2012 Range uncertainties in proton therapy and the role of Monte Carlo simulations PhysMed Biol 57 R99ndash117
Paganetti H Jiang H Parodi K Slopsema R and Engelsman M 2008 Clinical implementation of fullMonte Carlo dose calculation in proton beam therapy Phys Med Biol 53 4825ndash53
Parodi K and Bortfeld T 2006 A filtering approach based on Gaussianndashpowerlaw convolutions for localPET verification of proton radiotherapy Phys Med Biol A 51 1991ndash2009
Parodi K Crespo P Eickhoff H Haberer T Pawelke J Schardt D and Enghardt W 2005 Randomcoincidences during in-beam PET measurements at microbunched therapeutic ion beams NuclInstrum Methods Phys Res A 545 446ndash458
Parodi K and Enghardt W 2000 Potential application of PET in quality assurance of proton therapy PhysMed Biol 45 N151ndash6
Parodi K Enghardt W and Haberer T 2002 In-beam PET measurements of β+ radioactivity Phys MedBiol 47 21ndash36
Parodi K Paganetti H Cascio E Flanz J B Bonab A A Alpert N M Lohmann K and Bortfeld T 2007aPETCT imaging for treatment verification after proton therapy a study with plastic phantoms andmetallic implants Med Phys 34 419ndash35
Parodi K et al 2007b Int J Radiat Oncol 68 920ndash34Pawelke J Enghardt W Haberer T Hasch B Hinz R Kramer M Lauckner E and Sobiella M 1997
In-beam PET imaging for the control of heavy-ion tumour therapy IEEE Trans Nucl Sci 44 1492ndash8Pia M G Begalli M Lechner A Quintieri L and Saracco P 2010 Physics-related epistemic uncertainties
in proton depth dose simulation IEEE Trans Nucl Sci 57 2805ndash30Polf J Peterson S Ciangaru G Gillin M and Beddar S 2009a Prompt gamma-ray emission from biological
tissues during proton irradiation a preliminary study Phys Med Biol 54 731ndash43Polf J Peterson S McCleskey M Roeder B Spiridon A Beddar S and Trache L 2009b Measurement
and calculation of characteristic prompt gamma ray spectra emitted during proton irradiation PhysMed Biol 54 N519ndash27
Remmele S Hesser J Paganetti H and Bortfeld T 2011 A deconvolution approach for PET-based dosereconstruction in proton radiotherapy Phys Med Biol 56 7601ndash19
Rosso V et al 2013 A new PET prototype for proton therapy comparison of data and Monte Carlosimulations J Instrum 8 C03021
59
Phys Med Biol 59 (2014) 43 G Sportelli et al
Shakirin G Braess H Fiedler F Kunath D Laube K Parodi K Priegnitz M and Enghardt W 2011Implementation and workflow for PET monitoring of therapeutic ion irradiation a comparison ofin-beam in-room and off-line techniques Phys Med Biol 56 1281ndash98
Sportelli G Belcari N Guerra P and Santos A 2011b Low-resource synchronous coincidence processorfor positron emission tomography Nucl Instrum Methods Phys Res A 648 S199ndash201
Sportelli G Belcari N Guerra P Spinella F Franchi G Attanasi F Moehrs S Rosso V Santos Aand Del Guerra A 2011a Reprogrammable acquisition architecture for dedicated positron emissiontomography IEEE Trans Nucl Sci 58 695ndash702
Sportelli G Ortuno J Vaquero J Desco M and Santos A 2013 Massively parallelizable list-modereconstruction using a Monte Carlo-based elliptical Gaussian model Med Phys 40 012504
Sportelli G et al 2012 Full in-beam PET measurements of 62 MeV protons onto a PMMA target NuclInstrum Methods A 718 151ndash3
Surti S Zou W Daube-Witherspoon M McDonough J and Karp J 2011 Design study of an in situ PETscanner for use in proton beam therapy Phys Med Biol 56 2667ndash85
Tashima H Yamaya T Yoshida E Kinouchi S Watanabe M and Tanaka E 2012 A single-ring OpenPETenabling PET imaging during radiotherapy Phys Med Biol 57 4705ndash18
Vecchio S et al 2009 A PET prototype for in-beam monitoring of proton therapy IEEE Trans NuclSci 56 51ndash56
60

Phys Med Biol 59 (2014) 43 G Sportelli et al
(a) (b)
Figure 2 Example of range determination on voxel line profiles for two images withrelatively low (a) and high (b) statistics The lines marked in grey are the detectedproximal and distal edges of each line profile whose endpoints are circled in blackHorizontal dashed lines are the local threshold levels while vertical ones are the detectededge positions used for range determination
running at 31 GHz There are also plans for performing the same reconstruction on a GPU-based implementation (Sportelli et al 2013) Data were reconstructed using a LOR based datastructure and applying a 350ndash850 keV energy window The size of the reconstructed image is100 times 100 times 100 voxels 1 mm times 1 mm times 1 mm each thus including the complete FOV up to5 cm from the detectors surface At present no random or attenuation correction was applied
34 Estimation of the activity distal fall-off
Several methods have been used for the estimation of the activity distal fall-off The depth inthe phantom where the distal fall-off of the activity profile occurs can be measured by findingin the axial profile of the reconstructed activity distribution the coordinate of the point wherethe activity falls at 20 or 50 of the maximum value reached along the beam path (Parodi andBortfeld 2006 Parodi et al 2007b Moteabbed et al 2011 Min et al 2013) A way to evaluatethe precision of this estimation is to repeat this measurement for each 1 mm2 thin profile alongthe beam direction drawn in a defined region of interest (ROI) within the activated region Forirradiations along the axial direction of the scanner the profiles are naturally defined by linesof voxels in the image space (Helmbrecht et al 2012 Min et al 2013 Surti et al 2011)
A problem in estimating the activity distal range on voxels lines is that such lines havemuch lower statistics with respect to macroscopic profiles over larger regions The low statisticscan cause spikes that make it difficult to properly determine the threshold level Our approachhas been to first detect the proximal and distal edges of each line as the two longest monotonicpaths in the profile In doing so any relatively small spike with respect to the detected pathwas removed (figure 2) The position of each edge was then determined as the threshold levelover the local path maximum The proper choice of the range verification position in thefall-off region in the clinical practice can be controversial because ranges obtained with highthresholds are affected by the width of the SOBP while those obtained with low thresholds aregenerally more sensitive to image noise and to the beam energy spread (Parodi et al 2007a)Thus thresholds ranging from 20 to 50 are generally used (Knopf et al 2008) For ourpurposes a 50 threshold value is a reliable choice because in this study we have do notuse SOBP Also lower thresholds would be more problematic due to the low statistics of thedatasets involved in this study
For irradiations performed with monoenergetic beams like in the present set-up one cansuppose that the proton range is the same for each profile and then a constant depth for thedistal activity fall-off can be expected Thus the precision of the range measurement was
49
Phys Med Biol 59 (2014) 43 G Sportelli et al
(a) (b)
(c) (d)
Figure 3 Activity rates recorded during the four examined acquisitions Vertical dashedlines mark the end of each irradiation Solid lines represent the total coincidence ratesdotndashdashed lines represent the randoms rates
estimated by calculating the standard deviation of the measurements performed in each profile(σdepth) The accuracy of the measurement of the distal fall-off of the activity profile can beestimated as the deviation of the average depth (μdeptht) as calculated from all the 1D profilemeasurements with data acquired up to a time t from the estimation of the average depthcalculated in the same way but using the whole statistics of 10 min of PET measurement withbeam-off (μdepth600s) The latter is considered here as the best estimation for each irradiationof the depth of the activity distal fall-off being the measurement with the lesser statistical error
4 Results
41 Comparison of counting statistics
Total and random coincidence rates for the four acquisitions are shown in figure 3 During theirradiation the count rates for both true and random coincidences increase abruptly indicatingthe presence of fast nuclear processes The random to total coincidence ratio decreases duringthe irradiation The maximum observed random to total coincidence ratio is 245 at thebeginning of the 97 Gy minminus1 irradiation The acquisition rates at the beginning at the endand right after the irradiation are reported in table 2
42 Energy distribution of the acquired data
Energy histograms of the acquired coincidences are reported in figure 4 The blackline corresponds to the coincidences acquired during the irradiation (beam-on) The greyline corresponds to the coincidences acquired after it (beam-off) Dashed lines mark the350ndash850 keV energy window used for image reconstruction The spectrum of beam-off data
50
Phys Med Biol 59 (2014) 43 G Sportelli et al
Figure 4 Energy histograms for beam-on and beam-off data related to the four examinedacquisitions
Table 2 Total (T) and random (R) coincidence rates for the four acquisitions at thebeginning at the end and right after the irradiation
Irradiation begin Irradiation end After irradiation
T R RT() T R RT() T R RT()
1 13 kHz 82 Hz 66 29 kHz 98 Hz 34 19 kHz 24 Hz 132 24 kHz 221 Hz 90 67 kHz 318 Hz 47 44 kHz 42 Hz 103 54 kHz 07 kHz 122 128 kHz 10 kHz 74 85 kHz 89 Hz 104 170 kHz 41 kHz 245 358 kHz 62 kHz 174 191 kHz 261 Hz 14
remains almost unchanged with the different dose rates except for the 307 keV intrinsicemission peak of 176Lu which is more evident at low dose rates as expected A high-energy tailis present in both beam-off and beam-on data due to optical attenuation in the used scintillatingcrystals (Bonifacio et al 2010) This tail goes from the 511 keV peak to roughly 1 MeV Withhigher dose rates beam-on data show an increasing degradation of the annihilation photo-peakand a generally higher base level at all energies This behaviour was also expected due to theradiation noise during the delivery The fraction of events within the selected energy windowis reported in table 3 While the beam is on the fraction of events with energies gt850 keV ismuch higher and is increasing with the dose rate
43 Distal fall-off during and after the irradiation
The reconstructed images for acquisition 1 (2 Gy) and 4 (20 Gy) are shown in figures 5 and 6respectively including beam-on only data (a) 60 s of beam-off data (b) 60 s of full-beam data
51
Phys Med Biol 59 (2014) 43 G Sportelli et al
Table 3 Percentage of events within and at the two sides of the 350ndash850 keV energywindow used for image reconstructions The sum of percentages may not be 100 dueto rounding errors
Beam-off Beam-on
lt 350 keV 350ndash850 keV gt 850 keV lt 350 keV 350ndash850 keV gt 850 keV
1 291 688 21 278 619 1032 256 723 21 252 637 1113 234 745 20 256 622 1224 224 757 19 260 546 193
Table 4 Mean values for the range profiles of the four examined acquisitions Standarddeviations are reported within parentheses Beam-on only column includes all data fromthe beginning to the end of the irradiation (EOI) All values are expressed in mm
Beam-on only Beam-off only Full-beam
EOI 60 s 180 s 300 s 600 s 60 s 180 s 300 s 600 s
1 187 (22) 175 (30) 185 (13) 188 (10) 189 (09) 189 (15) 189 (09) 190 (08) 191 (07)2 193 (08) 186 (14) 190 (05) 190 (05) 191 (05) 193 (06) 192 (05) 193 (05) 192 (05)3 192 (06) 189 (07) 190 (05) 190 (04) 191 (04) 192 (05) 192 (04) 191 (04) 191 (04)4 199 (06) 190 (05) 192 (03) 192 (03) 193 (02) 195 (04) 195 (03) 194 (03) 195 (02)
(c) and 600 s of full-beam data (d) The ROIs used for range determination are marked with adashed line The ROIs are cylindrical with 2 cm diameter and 9 cm height Profiles calculatedon such images are shown in figure 7(a)ndash(d) ie 2 Gy and compared with images of thefourth acquisition (e)ndash(h) ie 20 Gy The dose range is reported as a black dashed line ineach plot Dose range has been calculated given the depth of the Bragg peak in homogeneousPMMA ie 29 mm (Oelfke et al 1996) starting from the activity rising edge In figure 7 itcan be seen how the image background noise is higher when the reconstruction is performedwith low statistics ie low dose (a)ndash(d) rather than with high dose rates (e)ndash(h)
The noise level in the image is reflected in the distribution of the calculated distal rangesfigure 8 shows the variation of the average depth and the relative standard deviation of themeasurement of the distal fall-off related to the activity profile for each of the four acquisitionshere considered For each acquisition μdepth and σdepth are reported as estimated from beam-ondata only (t = 0 dotted line) beam-off data only (at t = 60 s t = 180 s t = 300 s andt = 600 s) and full-beam data including both beam-on and beam-off data Values for μdeptht
and σdeptht are also reported in table 4 Plots show that the value of μdeptht derived withbeam-off data only (grey line) is slightly underestimated with respect to the reference valueof μdepth600s (highest statistics) when the acquisition time is short while it converges to thelatter as the time increases The μdepth0s value (beam-on only) is overestimated with respectto μdepth600s in all cases but the 2 Gy irradiation The inclusion of beam-on data (full-beam)always improves the convergence speed As for image noise a higher standard deviation isobtained for low doses and thus a less precise range is determined
In each of the four acquisitions the largest mean range deviation from the reference valueis seen in the images reconstructed with only 60 s of beam-off data The same effect has beenobserved in all the acquisitions with less than one million events (figure 9) thus suggesting asystematic range determination error for very low statistics
52
Phys Med Biol 59 (2014) 43 G Sportelli et al
(a)
(b)
(c)
(d)
Figure 5 Reconstructed images of the 2 Gy irradiation in three orthogonal planescentred in the field of view for different time-sets beam-on only data (a) first 60 s ofbeam-off data (b) beam-on data plus 60 s of beam-off data (c) beam-on data plus 600 sof beam-off data (d) The region marked with a dashed line represents the cylindricalROI used for range calculation The diameter of the cylinder is 2 cm the height is9 cm
53
Phys Med Biol 59 (2014) 43 G Sportelli et al
(a)
(b)
(c)
(d)
Figure 6 Reconstructed images of the 20 Gy irradiation in three orthogonal planescentred in the field of view for different time-sets beam-on only data (a) first 60 s ofbeam-off data (b) beam-on data plus 60 s of beam-off data (c) beam-on data plus 600 sof beam-off data (d) The region marked with a dashed line represents the cylindricalROI used for range calculation The diameter of the cylinder is 2 cm the height is9 cm
54
Phys Med Biol 59 (2014) 43 G Sportelli et al
(a)
(b)
(c)
(d)
(e)
(f)
(g)
(h)
Figure 7 Profiles of the reconstructed images for 2 Gy (left column (a)ndash(d)) and20 Gy (right column (e)ndash(h)) irradiations on different time-sets beam-on only data((a) (e)) first 60 s of beam-off data ((b) (f)) beam-on data plus 60 s of beam-off data((c) (g)) beam-on data plus 600 s of beam-off data ((d) (h)) The plot is obtained bysuperimposing the profiles of each voxel line included in the ROI (see figures 5 and 6)The white dashed line is the mean of all voxel lines The z coordinate of the dose rangeis indicated with a black dashed line Dose range has been calculated given the depth ofthe Bragg peak in homogeneous PMMA ie 29 mm starting from the activity risingedge
5 Conclusions
We have built and optimized a modular dual-head PET system for treatment monitoring inhadron therapy The system can operate continuously in-beam and is able to successfullyacquire the produced β+ activity in a field-of-view of 10 cm times 10 cm times 10 cm also during
55
Phys Med Biol 59 (2014) 43 G Sportelli et al
Figure 8 Means and standard deviations of activity ranges versus time for all thereconstructed images The expected dose range of the used 62 MeV proton beams inPMMA is 29 mm
0 1 2 3 4 5
Events [106]
170
175
180
185
190
195
200
205
210
Pro
files
mea
nra
nge
[mm
]
Range vs statistics
20 Gy - 97 Gymin Beam off only
10 Gy - 30 Gymin Beam off only
5 Gy - 16 Gymin Beam off only
2 Gy - 07 Gymin Beam off only
Figure 9 Means and standard deviations of activity ranges versus total acquired eventsfor all the reconstructed images The expected dose range of the used 62 MeV protonbeams in PMMA is 29 mm
the irradiation A distinction has been introduced between beam-on beam-off and full-beamdata referring to the acquisition output during the irradiation after or both respectively Thequestion that has been addressed is if beam-on data can be used either alone or jointly withbeam-off data to improve the quality of the system response for monitoring purposes A set
56
Phys Med Biol 59 (2014) 43 G Sportelli et al
of PET measurements was then performed at the cyclotron-based proton therapy facility atCATANA during the irradiation of a PMMA phantom at different dose rates and stopping theacquisition 10 min after
As already observed in other studies a characteristic high random count rate appearsduring the irradiation This count rate is roughly constant with a continuous beam and increasesquickly with the dose rate Since the phantom activation increases during the irradiation therandoms to total coincidences fraction decreases with time and becomes abruptly negligibleright after the beam turns off The maximum observed fraction at the beginning of an irradiationwith 97 Gy minminus1 dose rate is 245 This value is of the same order of an acceptablerandoms fraction in clinical PET imaging However the noise structure is different fromrandom coincidence noise in conventional PET thus future studies are expected to bettercharacterize its nature with respect to useful β+ activity and to improve the techniques usedfor reconstructing such data
The coincidence energy spectra of beam-on and beam-off data were also compared Asmall flat contamination from radiation with energies up to 2 MeV was observed in beam-ondata (2 MeV is the dynamic range of the system) With dose rates up to about 10 Gy minminus1 nosignificant degradation of the energy spectra was observed being the percentage of acquiredevents within the 350ndash850 keV energy window up to 622 of the total
For each measurement and modality we estimated accuracy and precision by studyingthe distribution of the activity ranges of a set of voxel lines within the activated materialResults show that the inclusion of beam-on data improves both the precision and accuracyof the proton range measurement with respect to data acquired after the irradiation only Theuse of beam-on data is enough to give a precision better that 1 mm (σ ) when at least 5 Gyare delivered Alternatively beam-on data can be effectively used to increase the availablestatistics for image reconstruction when the dose is lower For the lowest available dose rate(2 Gy minminus1) beam-on data did not produce sub-millimetric range precision but the precisionof the first 60 s of full-beam data is half with respect to that obtained with beam-off dataonly
The PET reconstructed signal is not quantitative No developments were carried out tostudy its capability as a quantitative instrument but with proper calibration we expect itsresponse to be linear within a wide range of input rates There are no reasons a priori thatwould hamper its ability to give quantitative results more than in conventional PET systems
The results of this investigation are promising for improving the quality and promptnessof PET monitoring though there is still a big margin for improvement The proposed in-beamPET system has in principle the same geometrical limitations as previous in-beam solutionsbut uses new electronics that allow to reduce the acquisition duration It is compatible withMonte Carlo based simulations as well as with all the range verification techniques that havebeen used so far However it requires the detectors response to be included in the simulationmodel so as to take into account the artefacts due to the limited angular coverage Washouteffects are expected to be less prominent than in any other PET imaging technique since theacquisition lasts only a few minutes from the beginning of the irradiation
Future work is planned to increase the angular coverage of the system in order to improverandom coincidences management to refine system synchronization with the beam and tocharacterize the detectors response Extending the detectors area from 10 cm times 10 cm to15 cm times 15 cm would require no major changes The number of detector modules wouldincrease from 8 to 18 and the software analysis would be more complex but the overallacquisition architecture and implementation would remain the same
57
Phys Med Biol 59 (2014) 43 G Sportelli et al
Acknowledgments
This research has been supported by the INFN-RT 60141 POR CRO FSE 2007-2013 SpainrsquosMinistry of Economy (TEC2010-21619-C04-03 TEC2011-28972-C02-02 and AMIT-CDTI)Comunidad de Madrid (ARTEMIS S2009DPI-1802) FULLBEAM-300838 Marie Curie IntraEuropean Fellowship within the lsquo7th European Community Framework Programmersquo (FP7)ENVISION project (FP7) and the European Regional Development Funds (FEDER)
References
Aiello M Attanasi F Belcari N Rosso V Straub K and Del Guerra A 2013 A dose determinationprocedure by PET monitoring in proton therapy Monte Carlo validation IEEE Trans NuclSci 60 3298ndash304
Attanasi F Knopf A Parodi K Paganetti H Bortfeld T Rosso V and Del Guerra A 2011 Extensionand validation of an analytical model for in vivo PET verification of proton therapyndasha phantom andclinical study Phys Med Biol 56 5079ndash98
Attanasi F et al 2008a Experimental validation of the filtering approach for dose monitoring in protontherapy at low energy Phys Med 24 102ndash6
Attanasi F et al 2008b Preliminary results of an in-beam PET prototype for proton therapy Nucl InstrumMethods Phys Res A 591 296ndash9
Belcari N Del Guerra A Camarda M Spontoni L Vecchio S and Bianchi D 2007 Performance of afour-output front-end electronics for multi-anode PMTS readout of scintillator arrays Nucl InstrumMethods Phys Res A 572 335ndash7
Bennett G Archambeau J Archambeau B Meltzer J and Wingate C 1978 Visualization and transport ofpositron emission from proton activation in vivo Science 200 1151ndash3
Bonifacio D A Belcari N Moehrs S Moralles M Rosso V Vecchio S and Del Guerra A 2010 A timeefficient optical model for GATE simulation of a LYSO scintillation matrix used in PET applicationsIEEE Trans Nucl Sci 57 2483ndash9
Cirrone G A P et al 2004 A 62-MeV proton beam for the treatment of ocular melanoma at LaboratoriNazionali del Sud-INFN IEEE Trans Nucl Sci 51 860ndash5
Crespo P Barthel T Frais-Kolbl H Griesmayer E Heidel K Parodi K Pawelke J P and Enghardt W 2005Suppression of random coincidences during in-beam PET measurements at ion beam radiotherapyfacilities IEEE Trans Nucl Sci 52 980ndash7
Crespo P Shakirin G and Enghardt W 2006 On the detector arrangement for in-beam PET for hadrontherapy monitoring Phys Med Biol 51 2143ndash63
Cuttone G et al 2011 CATANA protontherapy facility The state of art of clinical and dosimetricexperience Eur Phys J Plus 126 1ndash7
Del Guerra A Di Domenico G and Mukhopadhayay D 1997 PET dosimetry in proton radiotherapy aMonte Carlo study Appl Radiat Isot A 48 1617ndash24
Enghardt W Crespo P Fiedler F Hinz R Parodi K Pawelke J and Ponisch F 2004 Charged hadrontumour therapy monitoring by means of PET Nucl Instrum Methods Phys Res 525 284ndash8
Enghardt W Debus J Haberer T Hasch B Hinz R Jakel O Kramer M Lauckner K and Pawelke J 1999Strahlenther Onkol 175 33ndash36
Espana S Zhu X Daartz J Fakhri G E Bortfeld T and Paganetti H 2011 The reliability of proton-nuclearinteraction cross-section data to predict proton-induced PET images in proton therapy Phys MedBiol 56 2687ndash98
Grassberger C Trofimov A Lomax A and Paganetti H 2011 Variations in linear energy transfer withinclinical proton therapy fields and the potential for biological treatment planning Int J RadiatOncol 80 1559ndash66
Grogg K Zhu X Min C H Wilney B Bortfeld T Paganetti H Shih H A and El Fakhri G 2013 Feasibilityof using distal endpoints for in-room PET range verification of proton therapy IEEE Trans NuclSci 60 3290ndash7
Helmbrecht S Santiago A Enghardt W Kuess P and Fiedler F 2012 On the feasibility of automaticdetection of range deviations from in-beam PET data Phys Med Biol 57 1387ndash97
Hui Z Zhang X Starkschall G Li Y Mohan R Komaki R Cox J D and Chang J Y 2008 Effects ofinterfractional motion and anatomic changes on proton therapy dose distribution in lung cancer IntJ Radiat Oncol 72 1385ndash95
58
Phys Med Biol 59 (2014) 43 G Sportelli et al
Knopf A Parodi K Bortfeld T Shih H A and Paganetti H 2009 Systematic analysis of biologicaland physical limitations of proton beam range verification with offline PETCT scans Phys MedBiol 54 4477ndash95
Knopf A Parodi K Paganetti H Cascio E Bonab A and Bortfeld T 2008 Quantitative assessment of thephysical potential of proton beam range verification with PETCT Phys Med Biol 53 4137ndash51
Knopf A C and Lomax A 2013 In vivo proton range verification a review Phys Med Biol58 R131ndash60
Knopf A C Parodi K Paganetti H Bortfeld T Daartz J Engelsman M Liebsch N and Shih H2011 Accuracy of proton beam range verification using post-treatment positron emissiontomographycomputed tomography as function of treatment site Int J Radiat Oncol 79 297ndash304
Litzenberg D et al 1992 On-line monitoring and PET imaging of proton radiotherapy beams Conf RecordIEEE Nuclear Science Symp and Medical Imaging Conf vol 2 pp 954ndash6
Min C H Zhu X Winey B A Grogg K Testa M El Fakhri G Bortfeld T R Paganetti H and Shih H A2013 Clinical application of in-room positron emission tomography for in vivo treatment monitoringin proton radiation therapy Int J Radiat Oncol 86 183ndash9
Moehrs S Defrise M Belcari N Del Guerra A Bartoli A Fabbri S and Zanetti G 2008 Multi-ray-basedsystem matrix generation for 3D PET reconstruction Phys Med Biol 53 6925ndash45
Moteabbed M Espana S and Paganetti H 2011 Monte Carlo patient study on the comparison of promptgamma and PET imaging for range verification in proton therapy Phys Med Biol 56 1063ndash82
Nishikido F Mitsuhashi T Inadama N Inaniwa T Satoh S Tashima H Yoshida E Murayama Hand Yamaya T 2010 Performance evaluation of an OpenPET detector for heavy Ion therapyunder actual in-beam condition IEEE Nuclear Science Symp and Medical Imaging Conf Recordpp 3380ndash82
Nishio T Miyatake A Ogino T Nakagawa K Saijo N and Esumi H 2010 The development and clinicaluse of a beam on-line PET system mounted on a rotating gantry port in proton therapy Int J RadiatOncol 76 277ndash86
Oelfke U Lam G K and Atkins M S 1996 Proton dose monitoring with PET quantitative studies inLucite Phys Med Biol 41 177ndash96
Paganetti H 2012 Range uncertainties in proton therapy and the role of Monte Carlo simulations PhysMed Biol 57 R99ndash117
Paganetti H Jiang H Parodi K Slopsema R and Engelsman M 2008 Clinical implementation of fullMonte Carlo dose calculation in proton beam therapy Phys Med Biol 53 4825ndash53
Parodi K and Bortfeld T 2006 A filtering approach based on Gaussianndashpowerlaw convolutions for localPET verification of proton radiotherapy Phys Med Biol A 51 1991ndash2009
Parodi K Crespo P Eickhoff H Haberer T Pawelke J Schardt D and Enghardt W 2005 Randomcoincidences during in-beam PET measurements at microbunched therapeutic ion beams NuclInstrum Methods Phys Res A 545 446ndash458
Parodi K and Enghardt W 2000 Potential application of PET in quality assurance of proton therapy PhysMed Biol 45 N151ndash6
Parodi K Enghardt W and Haberer T 2002 In-beam PET measurements of β+ radioactivity Phys MedBiol 47 21ndash36
Parodi K Paganetti H Cascio E Flanz J B Bonab A A Alpert N M Lohmann K and Bortfeld T 2007aPETCT imaging for treatment verification after proton therapy a study with plastic phantoms andmetallic implants Med Phys 34 419ndash35
Parodi K et al 2007b Int J Radiat Oncol 68 920ndash34Pawelke J Enghardt W Haberer T Hasch B Hinz R Kramer M Lauckner E and Sobiella M 1997
In-beam PET imaging for the control of heavy-ion tumour therapy IEEE Trans Nucl Sci 44 1492ndash8Pia M G Begalli M Lechner A Quintieri L and Saracco P 2010 Physics-related epistemic uncertainties
in proton depth dose simulation IEEE Trans Nucl Sci 57 2805ndash30Polf J Peterson S Ciangaru G Gillin M and Beddar S 2009a Prompt gamma-ray emission from biological
tissues during proton irradiation a preliminary study Phys Med Biol 54 731ndash43Polf J Peterson S McCleskey M Roeder B Spiridon A Beddar S and Trache L 2009b Measurement
and calculation of characteristic prompt gamma ray spectra emitted during proton irradiation PhysMed Biol 54 N519ndash27
Remmele S Hesser J Paganetti H and Bortfeld T 2011 A deconvolution approach for PET-based dosereconstruction in proton radiotherapy Phys Med Biol 56 7601ndash19
Rosso V et al 2013 A new PET prototype for proton therapy comparison of data and Monte Carlosimulations J Instrum 8 C03021
59
Phys Med Biol 59 (2014) 43 G Sportelli et al
Shakirin G Braess H Fiedler F Kunath D Laube K Parodi K Priegnitz M and Enghardt W 2011Implementation and workflow for PET monitoring of therapeutic ion irradiation a comparison ofin-beam in-room and off-line techniques Phys Med Biol 56 1281ndash98
Sportelli G Belcari N Guerra P and Santos A 2011b Low-resource synchronous coincidence processorfor positron emission tomography Nucl Instrum Methods Phys Res A 648 S199ndash201
Sportelli G Belcari N Guerra P Spinella F Franchi G Attanasi F Moehrs S Rosso V Santos Aand Del Guerra A 2011a Reprogrammable acquisition architecture for dedicated positron emissiontomography IEEE Trans Nucl Sci 58 695ndash702
Sportelli G Ortuno J Vaquero J Desco M and Santos A 2013 Massively parallelizable list-modereconstruction using a Monte Carlo-based elliptical Gaussian model Med Phys 40 012504
Sportelli G et al 2012 Full in-beam PET measurements of 62 MeV protons onto a PMMA target NuclInstrum Methods A 718 151ndash3
Surti S Zou W Daube-Witherspoon M McDonough J and Karp J 2011 Design study of an in situ PETscanner for use in proton beam therapy Phys Med Biol 56 2667ndash85
Tashima H Yamaya T Yoshida E Kinouchi S Watanabe M and Tanaka E 2012 A single-ring OpenPETenabling PET imaging during radiotherapy Phys Med Biol 57 4705ndash18
Vecchio S et al 2009 A PET prototype for in-beam monitoring of proton therapy IEEE Trans NuclSci 56 51ndash56
60
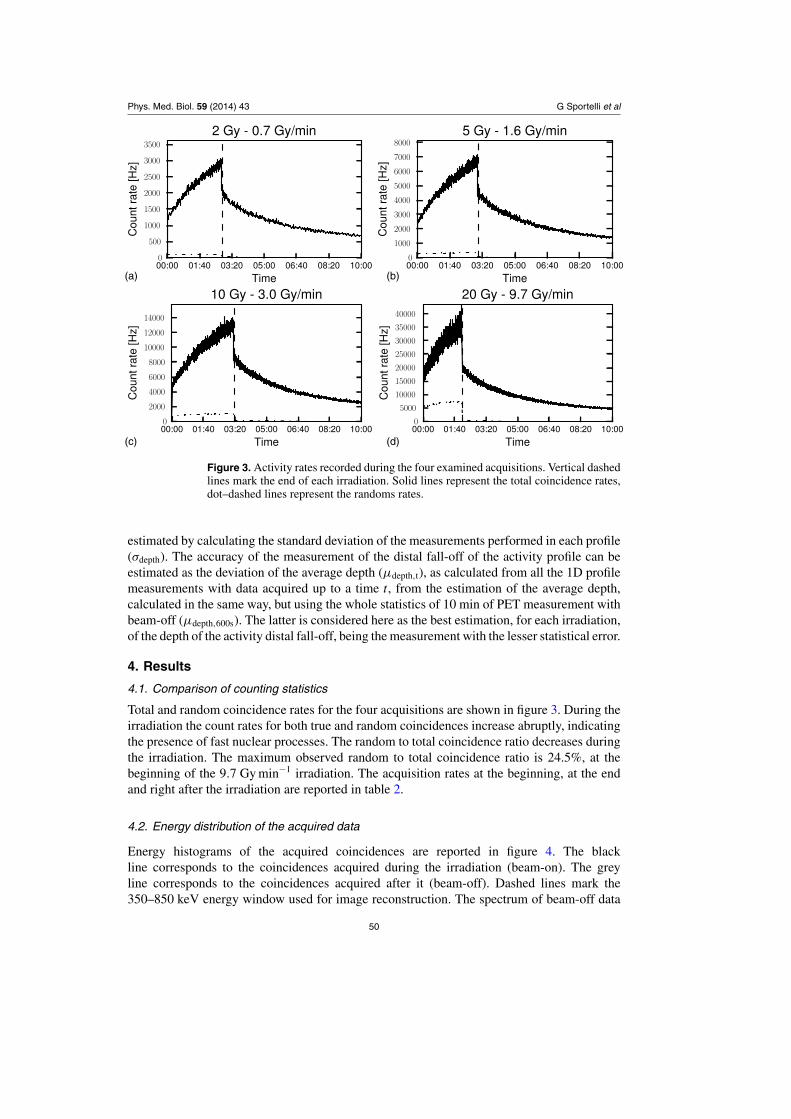
Phys Med Biol 59 (2014) 43 G Sportelli et al
(a) (b)
(c) (d)
Figure 3 Activity rates recorded during the four examined acquisitions Vertical dashedlines mark the end of each irradiation Solid lines represent the total coincidence ratesdotndashdashed lines represent the randoms rates
estimated by calculating the standard deviation of the measurements performed in each profile(σdepth) The accuracy of the measurement of the distal fall-off of the activity profile can beestimated as the deviation of the average depth (μdeptht) as calculated from all the 1D profilemeasurements with data acquired up to a time t from the estimation of the average depthcalculated in the same way but using the whole statistics of 10 min of PET measurement withbeam-off (μdepth600s) The latter is considered here as the best estimation for each irradiationof the depth of the activity distal fall-off being the measurement with the lesser statistical error
4 Results
41 Comparison of counting statistics
Total and random coincidence rates for the four acquisitions are shown in figure 3 During theirradiation the count rates for both true and random coincidences increase abruptly indicatingthe presence of fast nuclear processes The random to total coincidence ratio decreases duringthe irradiation The maximum observed random to total coincidence ratio is 245 at thebeginning of the 97 Gy minminus1 irradiation The acquisition rates at the beginning at the endand right after the irradiation are reported in table 2
42 Energy distribution of the acquired data
Energy histograms of the acquired coincidences are reported in figure 4 The blackline corresponds to the coincidences acquired during the irradiation (beam-on) The greyline corresponds to the coincidences acquired after it (beam-off) Dashed lines mark the350ndash850 keV energy window used for image reconstruction The spectrum of beam-off data
50
Phys Med Biol 59 (2014) 43 G Sportelli et al
Figure 4 Energy histograms for beam-on and beam-off data related to the four examinedacquisitions
Table 2 Total (T) and random (R) coincidence rates for the four acquisitions at thebeginning at the end and right after the irradiation
Irradiation begin Irradiation end After irradiation
T R RT() T R RT() T R RT()
1 13 kHz 82 Hz 66 29 kHz 98 Hz 34 19 kHz 24 Hz 132 24 kHz 221 Hz 90 67 kHz 318 Hz 47 44 kHz 42 Hz 103 54 kHz 07 kHz 122 128 kHz 10 kHz 74 85 kHz 89 Hz 104 170 kHz 41 kHz 245 358 kHz 62 kHz 174 191 kHz 261 Hz 14
remains almost unchanged with the different dose rates except for the 307 keV intrinsicemission peak of 176Lu which is more evident at low dose rates as expected A high-energy tailis present in both beam-off and beam-on data due to optical attenuation in the used scintillatingcrystals (Bonifacio et al 2010) This tail goes from the 511 keV peak to roughly 1 MeV Withhigher dose rates beam-on data show an increasing degradation of the annihilation photo-peakand a generally higher base level at all energies This behaviour was also expected due to theradiation noise during the delivery The fraction of events within the selected energy windowis reported in table 3 While the beam is on the fraction of events with energies gt850 keV ismuch higher and is increasing with the dose rate
43 Distal fall-off during and after the irradiation
The reconstructed images for acquisition 1 (2 Gy) and 4 (20 Gy) are shown in figures 5 and 6respectively including beam-on only data (a) 60 s of beam-off data (b) 60 s of full-beam data
51
Phys Med Biol 59 (2014) 43 G Sportelli et al
Table 3 Percentage of events within and at the two sides of the 350ndash850 keV energywindow used for image reconstructions The sum of percentages may not be 100 dueto rounding errors
Beam-off Beam-on
lt 350 keV 350ndash850 keV gt 850 keV lt 350 keV 350ndash850 keV gt 850 keV
1 291 688 21 278 619 1032 256 723 21 252 637 1113 234 745 20 256 622 1224 224 757 19 260 546 193
Table 4 Mean values for the range profiles of the four examined acquisitions Standarddeviations are reported within parentheses Beam-on only column includes all data fromthe beginning to the end of the irradiation (EOI) All values are expressed in mm
Beam-on only Beam-off only Full-beam
EOI 60 s 180 s 300 s 600 s 60 s 180 s 300 s 600 s
1 187 (22) 175 (30) 185 (13) 188 (10) 189 (09) 189 (15) 189 (09) 190 (08) 191 (07)2 193 (08) 186 (14) 190 (05) 190 (05) 191 (05) 193 (06) 192 (05) 193 (05) 192 (05)3 192 (06) 189 (07) 190 (05) 190 (04) 191 (04) 192 (05) 192 (04) 191 (04) 191 (04)4 199 (06) 190 (05) 192 (03) 192 (03) 193 (02) 195 (04) 195 (03) 194 (03) 195 (02)
(c) and 600 s of full-beam data (d) The ROIs used for range determination are marked with adashed line The ROIs are cylindrical with 2 cm diameter and 9 cm height Profiles calculatedon such images are shown in figure 7(a)ndash(d) ie 2 Gy and compared with images of thefourth acquisition (e)ndash(h) ie 20 Gy The dose range is reported as a black dashed line ineach plot Dose range has been calculated given the depth of the Bragg peak in homogeneousPMMA ie 29 mm (Oelfke et al 1996) starting from the activity rising edge In figure 7 itcan be seen how the image background noise is higher when the reconstruction is performedwith low statistics ie low dose (a)ndash(d) rather than with high dose rates (e)ndash(h)
The noise level in the image is reflected in the distribution of the calculated distal rangesfigure 8 shows the variation of the average depth and the relative standard deviation of themeasurement of the distal fall-off related to the activity profile for each of the four acquisitionshere considered For each acquisition μdepth and σdepth are reported as estimated from beam-ondata only (t = 0 dotted line) beam-off data only (at t = 60 s t = 180 s t = 300 s andt = 600 s) and full-beam data including both beam-on and beam-off data Values for μdeptht
and σdeptht are also reported in table 4 Plots show that the value of μdeptht derived withbeam-off data only (grey line) is slightly underestimated with respect to the reference valueof μdepth600s (highest statistics) when the acquisition time is short while it converges to thelatter as the time increases The μdepth0s value (beam-on only) is overestimated with respectto μdepth600s in all cases but the 2 Gy irradiation The inclusion of beam-on data (full-beam)always improves the convergence speed As for image noise a higher standard deviation isobtained for low doses and thus a less precise range is determined
In each of the four acquisitions the largest mean range deviation from the reference valueis seen in the images reconstructed with only 60 s of beam-off data The same effect has beenobserved in all the acquisitions with less than one million events (figure 9) thus suggesting asystematic range determination error for very low statistics
52
Phys Med Biol 59 (2014) 43 G Sportelli et al
(a)
(b)
(c)
(d)
Figure 5 Reconstructed images of the 2 Gy irradiation in three orthogonal planescentred in the field of view for different time-sets beam-on only data (a) first 60 s ofbeam-off data (b) beam-on data plus 60 s of beam-off data (c) beam-on data plus 600 sof beam-off data (d) The region marked with a dashed line represents the cylindricalROI used for range calculation The diameter of the cylinder is 2 cm the height is9 cm
53
Phys Med Biol 59 (2014) 43 G Sportelli et al
(a)
(b)
(c)
(d)
Figure 6 Reconstructed images of the 20 Gy irradiation in three orthogonal planescentred in the field of view for different time-sets beam-on only data (a) first 60 s ofbeam-off data (b) beam-on data plus 60 s of beam-off data (c) beam-on data plus 600 sof beam-off data (d) The region marked with a dashed line represents the cylindricalROI used for range calculation The diameter of the cylinder is 2 cm the height is9 cm
54
Phys Med Biol 59 (2014) 43 G Sportelli et al
(a)
(b)
(c)
(d)
(e)
(f)
(g)
(h)
Figure 7 Profiles of the reconstructed images for 2 Gy (left column (a)ndash(d)) and20 Gy (right column (e)ndash(h)) irradiations on different time-sets beam-on only data((a) (e)) first 60 s of beam-off data ((b) (f)) beam-on data plus 60 s of beam-off data((c) (g)) beam-on data plus 600 s of beam-off data ((d) (h)) The plot is obtained bysuperimposing the profiles of each voxel line included in the ROI (see figures 5 and 6)The white dashed line is the mean of all voxel lines The z coordinate of the dose rangeis indicated with a black dashed line Dose range has been calculated given the depth ofthe Bragg peak in homogeneous PMMA ie 29 mm starting from the activity risingedge
5 Conclusions
We have built and optimized a modular dual-head PET system for treatment monitoring inhadron therapy The system can operate continuously in-beam and is able to successfullyacquire the produced β+ activity in a field-of-view of 10 cm times 10 cm times 10 cm also during
55
Phys Med Biol 59 (2014) 43 G Sportelli et al
Figure 8 Means and standard deviations of activity ranges versus time for all thereconstructed images The expected dose range of the used 62 MeV proton beams inPMMA is 29 mm
0 1 2 3 4 5
Events [106]
170
175
180
185
190
195
200
205
210
Pro
files
mea
nra
nge
[mm
]
Range vs statistics
20 Gy - 97 Gymin Beam off only
10 Gy - 30 Gymin Beam off only
5 Gy - 16 Gymin Beam off only
2 Gy - 07 Gymin Beam off only
Figure 9 Means and standard deviations of activity ranges versus total acquired eventsfor all the reconstructed images The expected dose range of the used 62 MeV protonbeams in PMMA is 29 mm
the irradiation A distinction has been introduced between beam-on beam-off and full-beamdata referring to the acquisition output during the irradiation after or both respectively Thequestion that has been addressed is if beam-on data can be used either alone or jointly withbeam-off data to improve the quality of the system response for monitoring purposes A set
56
Phys Med Biol 59 (2014) 43 G Sportelli et al
of PET measurements was then performed at the cyclotron-based proton therapy facility atCATANA during the irradiation of a PMMA phantom at different dose rates and stopping theacquisition 10 min after
As already observed in other studies a characteristic high random count rate appearsduring the irradiation This count rate is roughly constant with a continuous beam and increasesquickly with the dose rate Since the phantom activation increases during the irradiation therandoms to total coincidences fraction decreases with time and becomes abruptly negligibleright after the beam turns off The maximum observed fraction at the beginning of an irradiationwith 97 Gy minminus1 dose rate is 245 This value is of the same order of an acceptablerandoms fraction in clinical PET imaging However the noise structure is different fromrandom coincidence noise in conventional PET thus future studies are expected to bettercharacterize its nature with respect to useful β+ activity and to improve the techniques usedfor reconstructing such data
The coincidence energy spectra of beam-on and beam-off data were also compared Asmall flat contamination from radiation with energies up to 2 MeV was observed in beam-ondata (2 MeV is the dynamic range of the system) With dose rates up to about 10 Gy minminus1 nosignificant degradation of the energy spectra was observed being the percentage of acquiredevents within the 350ndash850 keV energy window up to 622 of the total
For each measurement and modality we estimated accuracy and precision by studyingthe distribution of the activity ranges of a set of voxel lines within the activated materialResults show that the inclusion of beam-on data improves both the precision and accuracyof the proton range measurement with respect to data acquired after the irradiation only Theuse of beam-on data is enough to give a precision better that 1 mm (σ ) when at least 5 Gyare delivered Alternatively beam-on data can be effectively used to increase the availablestatistics for image reconstruction when the dose is lower For the lowest available dose rate(2 Gy minminus1) beam-on data did not produce sub-millimetric range precision but the precisionof the first 60 s of full-beam data is half with respect to that obtained with beam-off dataonly
The PET reconstructed signal is not quantitative No developments were carried out tostudy its capability as a quantitative instrument but with proper calibration we expect itsresponse to be linear within a wide range of input rates There are no reasons a priori thatwould hamper its ability to give quantitative results more than in conventional PET systems
The results of this investigation are promising for improving the quality and promptnessof PET monitoring though there is still a big margin for improvement The proposed in-beamPET system has in principle the same geometrical limitations as previous in-beam solutionsbut uses new electronics that allow to reduce the acquisition duration It is compatible withMonte Carlo based simulations as well as with all the range verification techniques that havebeen used so far However it requires the detectors response to be included in the simulationmodel so as to take into account the artefacts due to the limited angular coverage Washouteffects are expected to be less prominent than in any other PET imaging technique since theacquisition lasts only a few minutes from the beginning of the irradiation
Future work is planned to increase the angular coverage of the system in order to improverandom coincidences management to refine system synchronization with the beam and tocharacterize the detectors response Extending the detectors area from 10 cm times 10 cm to15 cm times 15 cm would require no major changes The number of detector modules wouldincrease from 8 to 18 and the software analysis would be more complex but the overallacquisition architecture and implementation would remain the same
57
Phys Med Biol 59 (2014) 43 G Sportelli et al
Acknowledgments
This research has been supported by the INFN-RT 60141 POR CRO FSE 2007-2013 SpainrsquosMinistry of Economy (TEC2010-21619-C04-03 TEC2011-28972-C02-02 and AMIT-CDTI)Comunidad de Madrid (ARTEMIS S2009DPI-1802) FULLBEAM-300838 Marie Curie IntraEuropean Fellowship within the lsquo7th European Community Framework Programmersquo (FP7)ENVISION project (FP7) and the European Regional Development Funds (FEDER)
References
Aiello M Attanasi F Belcari N Rosso V Straub K and Del Guerra A 2013 A dose determinationprocedure by PET monitoring in proton therapy Monte Carlo validation IEEE Trans NuclSci 60 3298ndash304
Attanasi F Knopf A Parodi K Paganetti H Bortfeld T Rosso V and Del Guerra A 2011 Extensionand validation of an analytical model for in vivo PET verification of proton therapyndasha phantom andclinical study Phys Med Biol 56 5079ndash98
Attanasi F et al 2008a Experimental validation of the filtering approach for dose monitoring in protontherapy at low energy Phys Med 24 102ndash6
Attanasi F et al 2008b Preliminary results of an in-beam PET prototype for proton therapy Nucl InstrumMethods Phys Res A 591 296ndash9
Belcari N Del Guerra A Camarda M Spontoni L Vecchio S and Bianchi D 2007 Performance of afour-output front-end electronics for multi-anode PMTS readout of scintillator arrays Nucl InstrumMethods Phys Res A 572 335ndash7
Bennett G Archambeau J Archambeau B Meltzer J and Wingate C 1978 Visualization and transport ofpositron emission from proton activation in vivo Science 200 1151ndash3
Bonifacio D A Belcari N Moehrs S Moralles M Rosso V Vecchio S and Del Guerra A 2010 A timeefficient optical model for GATE simulation of a LYSO scintillation matrix used in PET applicationsIEEE Trans Nucl Sci 57 2483ndash9
Cirrone G A P et al 2004 A 62-MeV proton beam for the treatment of ocular melanoma at LaboratoriNazionali del Sud-INFN IEEE Trans Nucl Sci 51 860ndash5
Crespo P Barthel T Frais-Kolbl H Griesmayer E Heidel K Parodi K Pawelke J P and Enghardt W 2005Suppression of random coincidences during in-beam PET measurements at ion beam radiotherapyfacilities IEEE Trans Nucl Sci 52 980ndash7
Crespo P Shakirin G and Enghardt W 2006 On the detector arrangement for in-beam PET for hadrontherapy monitoring Phys Med Biol 51 2143ndash63
Cuttone G et al 2011 CATANA protontherapy facility The state of art of clinical and dosimetricexperience Eur Phys J Plus 126 1ndash7
Del Guerra A Di Domenico G and Mukhopadhayay D 1997 PET dosimetry in proton radiotherapy aMonte Carlo study Appl Radiat Isot A 48 1617ndash24
Enghardt W Crespo P Fiedler F Hinz R Parodi K Pawelke J and Ponisch F 2004 Charged hadrontumour therapy monitoring by means of PET Nucl Instrum Methods Phys Res 525 284ndash8
Enghardt W Debus J Haberer T Hasch B Hinz R Jakel O Kramer M Lauckner K and Pawelke J 1999Strahlenther Onkol 175 33ndash36
Espana S Zhu X Daartz J Fakhri G E Bortfeld T and Paganetti H 2011 The reliability of proton-nuclearinteraction cross-section data to predict proton-induced PET images in proton therapy Phys MedBiol 56 2687ndash98
Grassberger C Trofimov A Lomax A and Paganetti H 2011 Variations in linear energy transfer withinclinical proton therapy fields and the potential for biological treatment planning Int J RadiatOncol 80 1559ndash66
Grogg K Zhu X Min C H Wilney B Bortfeld T Paganetti H Shih H A and El Fakhri G 2013 Feasibilityof using distal endpoints for in-room PET range verification of proton therapy IEEE Trans NuclSci 60 3290ndash7
Helmbrecht S Santiago A Enghardt W Kuess P and Fiedler F 2012 On the feasibility of automaticdetection of range deviations from in-beam PET data Phys Med Biol 57 1387ndash97
Hui Z Zhang X Starkschall G Li Y Mohan R Komaki R Cox J D and Chang J Y 2008 Effects ofinterfractional motion and anatomic changes on proton therapy dose distribution in lung cancer IntJ Radiat Oncol 72 1385ndash95
58
Phys Med Biol 59 (2014) 43 G Sportelli et al
Knopf A Parodi K Bortfeld T Shih H A and Paganetti H 2009 Systematic analysis of biologicaland physical limitations of proton beam range verification with offline PETCT scans Phys MedBiol 54 4477ndash95
Knopf A Parodi K Paganetti H Cascio E Bonab A and Bortfeld T 2008 Quantitative assessment of thephysical potential of proton beam range verification with PETCT Phys Med Biol 53 4137ndash51
Knopf A C and Lomax A 2013 In vivo proton range verification a review Phys Med Biol58 R131ndash60
Knopf A C Parodi K Paganetti H Bortfeld T Daartz J Engelsman M Liebsch N and Shih H2011 Accuracy of proton beam range verification using post-treatment positron emissiontomographycomputed tomography as function of treatment site Int J Radiat Oncol 79 297ndash304
Litzenberg D et al 1992 On-line monitoring and PET imaging of proton radiotherapy beams Conf RecordIEEE Nuclear Science Symp and Medical Imaging Conf vol 2 pp 954ndash6
Min C H Zhu X Winey B A Grogg K Testa M El Fakhri G Bortfeld T R Paganetti H and Shih H A2013 Clinical application of in-room positron emission tomography for in vivo treatment monitoringin proton radiation therapy Int J Radiat Oncol 86 183ndash9
Moehrs S Defrise M Belcari N Del Guerra A Bartoli A Fabbri S and Zanetti G 2008 Multi-ray-basedsystem matrix generation for 3D PET reconstruction Phys Med Biol 53 6925ndash45
Moteabbed M Espana S and Paganetti H 2011 Monte Carlo patient study on the comparison of promptgamma and PET imaging for range verification in proton therapy Phys Med Biol 56 1063ndash82
Nishikido F Mitsuhashi T Inadama N Inaniwa T Satoh S Tashima H Yoshida E Murayama Hand Yamaya T 2010 Performance evaluation of an OpenPET detector for heavy Ion therapyunder actual in-beam condition IEEE Nuclear Science Symp and Medical Imaging Conf Recordpp 3380ndash82
Nishio T Miyatake A Ogino T Nakagawa K Saijo N and Esumi H 2010 The development and clinicaluse of a beam on-line PET system mounted on a rotating gantry port in proton therapy Int J RadiatOncol 76 277ndash86
Oelfke U Lam G K and Atkins M S 1996 Proton dose monitoring with PET quantitative studies inLucite Phys Med Biol 41 177ndash96
Paganetti H 2012 Range uncertainties in proton therapy and the role of Monte Carlo simulations PhysMed Biol 57 R99ndash117
Paganetti H Jiang H Parodi K Slopsema R and Engelsman M 2008 Clinical implementation of fullMonte Carlo dose calculation in proton beam therapy Phys Med Biol 53 4825ndash53
Parodi K and Bortfeld T 2006 A filtering approach based on Gaussianndashpowerlaw convolutions for localPET verification of proton radiotherapy Phys Med Biol A 51 1991ndash2009
Parodi K Crespo P Eickhoff H Haberer T Pawelke J Schardt D and Enghardt W 2005 Randomcoincidences during in-beam PET measurements at microbunched therapeutic ion beams NuclInstrum Methods Phys Res A 545 446ndash458
Parodi K and Enghardt W 2000 Potential application of PET in quality assurance of proton therapy PhysMed Biol 45 N151ndash6
Parodi K Enghardt W and Haberer T 2002 In-beam PET measurements of β+ radioactivity Phys MedBiol 47 21ndash36
Parodi K Paganetti H Cascio E Flanz J B Bonab A A Alpert N M Lohmann K and Bortfeld T 2007aPETCT imaging for treatment verification after proton therapy a study with plastic phantoms andmetallic implants Med Phys 34 419ndash35
Parodi K et al 2007b Int J Radiat Oncol 68 920ndash34Pawelke J Enghardt W Haberer T Hasch B Hinz R Kramer M Lauckner E and Sobiella M 1997
In-beam PET imaging for the control of heavy-ion tumour therapy IEEE Trans Nucl Sci 44 1492ndash8Pia M G Begalli M Lechner A Quintieri L and Saracco P 2010 Physics-related epistemic uncertainties
in proton depth dose simulation IEEE Trans Nucl Sci 57 2805ndash30Polf J Peterson S Ciangaru G Gillin M and Beddar S 2009a Prompt gamma-ray emission from biological
tissues during proton irradiation a preliminary study Phys Med Biol 54 731ndash43Polf J Peterson S McCleskey M Roeder B Spiridon A Beddar S and Trache L 2009b Measurement
and calculation of characteristic prompt gamma ray spectra emitted during proton irradiation PhysMed Biol 54 N519ndash27
Remmele S Hesser J Paganetti H and Bortfeld T 2011 A deconvolution approach for PET-based dosereconstruction in proton radiotherapy Phys Med Biol 56 7601ndash19
Rosso V et al 2013 A new PET prototype for proton therapy comparison of data and Monte Carlosimulations J Instrum 8 C03021
59
Phys Med Biol 59 (2014) 43 G Sportelli et al
Shakirin G Braess H Fiedler F Kunath D Laube K Parodi K Priegnitz M and Enghardt W 2011Implementation and workflow for PET monitoring of therapeutic ion irradiation a comparison ofin-beam in-room and off-line techniques Phys Med Biol 56 1281ndash98
Sportelli G Belcari N Guerra P and Santos A 2011b Low-resource synchronous coincidence processorfor positron emission tomography Nucl Instrum Methods Phys Res A 648 S199ndash201
Sportelli G Belcari N Guerra P Spinella F Franchi G Attanasi F Moehrs S Rosso V Santos Aand Del Guerra A 2011a Reprogrammable acquisition architecture for dedicated positron emissiontomography IEEE Trans Nucl Sci 58 695ndash702
Sportelli G Ortuno J Vaquero J Desco M and Santos A 2013 Massively parallelizable list-modereconstruction using a Monte Carlo-based elliptical Gaussian model Med Phys 40 012504
Sportelli G et al 2012 Full in-beam PET measurements of 62 MeV protons onto a PMMA target NuclInstrum Methods A 718 151ndash3
Surti S Zou W Daube-Witherspoon M McDonough J and Karp J 2011 Design study of an in situ PETscanner for use in proton beam therapy Phys Med Biol 56 2667ndash85
Tashima H Yamaya T Yoshida E Kinouchi S Watanabe M and Tanaka E 2012 A single-ring OpenPETenabling PET imaging during radiotherapy Phys Med Biol 57 4705ndash18
Vecchio S et al 2009 A PET prototype for in-beam monitoring of proton therapy IEEE Trans NuclSci 56 51ndash56
60

Phys Med Biol 59 (2014) 43 G Sportelli et al
Table 3 Percentage of events within and at the two sides of the 350ndash850 keV energywindow used for image reconstructions The sum of percentages may not be 100 dueto rounding errors
Beam-off Beam-on
lt 350 keV 350ndash850 keV gt 850 keV lt 350 keV 350ndash850 keV gt 850 keV
1 291 688 21 278 619 1032 256 723 21 252 637 1113 234 745 20 256 622 1224 224 757 19 260 546 193
Table 4 Mean values for the range profiles of the four examined acquisitions Standarddeviations are reported within parentheses Beam-on only column includes all data fromthe beginning to the end of the irradiation (EOI) All values are expressed in mm
Beam-on only Beam-off only Full-beam
EOI 60 s 180 s 300 s 600 s 60 s 180 s 300 s 600 s
1 187 (22) 175 (30) 185 (13) 188 (10) 189 (09) 189 (15) 189 (09) 190 (08) 191 (07)2 193 (08) 186 (14) 190 (05) 190 (05) 191 (05) 193 (06) 192 (05) 193 (05) 192 (05)3 192 (06) 189 (07) 190 (05) 190 (04) 191 (04) 192 (05) 192 (04) 191 (04) 191 (04)4 199 (06) 190 (05) 192 (03) 192 (03) 193 (02) 195 (04) 195 (03) 194 (03) 195 (02)
(c) and 600 s of full-beam data (d) The ROIs used for range determination are marked with adashed line The ROIs are cylindrical with 2 cm diameter and 9 cm height Profiles calculatedon such images are shown in figure 7(a)ndash(d) ie 2 Gy and compared with images of thefourth acquisition (e)ndash(h) ie 20 Gy The dose range is reported as a black dashed line ineach plot Dose range has been calculated given the depth of the Bragg peak in homogeneousPMMA ie 29 mm (Oelfke et al 1996) starting from the activity rising edge In figure 7 itcan be seen how the image background noise is higher when the reconstruction is performedwith low statistics ie low dose (a)ndash(d) rather than with high dose rates (e)ndash(h)
The noise level in the image is reflected in the distribution of the calculated distal rangesfigure 8 shows the variation of the average depth and the relative standard deviation of themeasurement of the distal fall-off related to the activity profile for each of the four acquisitionshere considered For each acquisition μdepth and σdepth are reported as estimated from beam-ondata only (t = 0 dotted line) beam-off data only (at t = 60 s t = 180 s t = 300 s andt = 600 s) and full-beam data including both beam-on and beam-off data Values for μdeptht
and σdeptht are also reported in table 4 Plots show that the value of μdeptht derived withbeam-off data only (grey line) is slightly underestimated with respect to the reference valueof μdepth600s (highest statistics) when the acquisition time is short while it converges to thelatter as the time increases The μdepth0s value (beam-on only) is overestimated with respectto μdepth600s in all cases but the 2 Gy irradiation The inclusion of beam-on data (full-beam)always improves the convergence speed As for image noise a higher standard deviation isobtained for low doses and thus a less precise range is determined
In each of the four acquisitions the largest mean range deviation from the reference valueis seen in the images reconstructed with only 60 s of beam-off data The same effect has beenobserved in all the acquisitions with less than one million events (figure 9) thus suggesting asystematic range determination error for very low statistics
52
Phys Med Biol 59 (2014) 43 G Sportelli et al
(a)
(b)
(c)
(d)
Figure 5 Reconstructed images of the 2 Gy irradiation in three orthogonal planescentred in the field of view for different time-sets beam-on only data (a) first 60 s ofbeam-off data (b) beam-on data plus 60 s of beam-off data (c) beam-on data plus 600 sof beam-off data (d) The region marked with a dashed line represents the cylindricalROI used for range calculation The diameter of the cylinder is 2 cm the height is9 cm
53
Phys Med Biol 59 (2014) 43 G Sportelli et al
(a)
(b)
(c)
(d)
Figure 6 Reconstructed images of the 20 Gy irradiation in three orthogonal planescentred in the field of view for different time-sets beam-on only data (a) first 60 s ofbeam-off data (b) beam-on data plus 60 s of beam-off data (c) beam-on data plus 600 sof beam-off data (d) The region marked with a dashed line represents the cylindricalROI used for range calculation The diameter of the cylinder is 2 cm the height is9 cm
54
Phys Med Biol 59 (2014) 43 G Sportelli et al
(a)
(b)
(c)
(d)
(e)
(f)
(g)
(h)
Figure 7 Profiles of the reconstructed images for 2 Gy (left column (a)ndash(d)) and20 Gy (right column (e)ndash(h)) irradiations on different time-sets beam-on only data((a) (e)) first 60 s of beam-off data ((b) (f)) beam-on data plus 60 s of beam-off data((c) (g)) beam-on data plus 600 s of beam-off data ((d) (h)) The plot is obtained bysuperimposing the profiles of each voxel line included in the ROI (see figures 5 and 6)The white dashed line is the mean of all voxel lines The z coordinate of the dose rangeis indicated with a black dashed line Dose range has been calculated given the depth ofthe Bragg peak in homogeneous PMMA ie 29 mm starting from the activity risingedge
5 Conclusions
We have built and optimized a modular dual-head PET system for treatment monitoring inhadron therapy The system can operate continuously in-beam and is able to successfullyacquire the produced β+ activity in a field-of-view of 10 cm times 10 cm times 10 cm also during
55
Phys Med Biol 59 (2014) 43 G Sportelli et al
Figure 8 Means and standard deviations of activity ranges versus time for all thereconstructed images The expected dose range of the used 62 MeV proton beams inPMMA is 29 mm
0 1 2 3 4 5
Events [106]
170
175
180
185
190
195
200
205
210
Pro
files
mea
nra
nge
[mm
]
Range vs statistics
20 Gy - 97 Gymin Beam off only
10 Gy - 30 Gymin Beam off only
5 Gy - 16 Gymin Beam off only
2 Gy - 07 Gymin Beam off only
Figure 9 Means and standard deviations of activity ranges versus total acquired eventsfor all the reconstructed images The expected dose range of the used 62 MeV protonbeams in PMMA is 29 mm
the irradiation A distinction has been introduced between beam-on beam-off and full-beamdata referring to the acquisition output during the irradiation after or both respectively Thequestion that has been addressed is if beam-on data can be used either alone or jointly withbeam-off data to improve the quality of the system response for monitoring purposes A set
56
Phys Med Biol 59 (2014) 43 G Sportelli et al
of PET measurements was then performed at the cyclotron-based proton therapy facility atCATANA during the irradiation of a PMMA phantom at different dose rates and stopping theacquisition 10 min after
As already observed in other studies a characteristic high random count rate appearsduring the irradiation This count rate is roughly constant with a continuous beam and increasesquickly with the dose rate Since the phantom activation increases during the irradiation therandoms to total coincidences fraction decreases with time and becomes abruptly negligibleright after the beam turns off The maximum observed fraction at the beginning of an irradiationwith 97 Gy minminus1 dose rate is 245 This value is of the same order of an acceptablerandoms fraction in clinical PET imaging However the noise structure is different fromrandom coincidence noise in conventional PET thus future studies are expected to bettercharacterize its nature with respect to useful β+ activity and to improve the techniques usedfor reconstructing such data
The coincidence energy spectra of beam-on and beam-off data were also compared Asmall flat contamination from radiation with energies up to 2 MeV was observed in beam-ondata (2 MeV is the dynamic range of the system) With dose rates up to about 10 Gy minminus1 nosignificant degradation of the energy spectra was observed being the percentage of acquiredevents within the 350ndash850 keV energy window up to 622 of the total
For each measurement and modality we estimated accuracy and precision by studyingthe distribution of the activity ranges of a set of voxel lines within the activated materialResults show that the inclusion of beam-on data improves both the precision and accuracyof the proton range measurement with respect to data acquired after the irradiation only Theuse of beam-on data is enough to give a precision better that 1 mm (σ ) when at least 5 Gyare delivered Alternatively beam-on data can be effectively used to increase the availablestatistics for image reconstruction when the dose is lower For the lowest available dose rate(2 Gy minminus1) beam-on data did not produce sub-millimetric range precision but the precisionof the first 60 s of full-beam data is half with respect to that obtained with beam-off dataonly
The PET reconstructed signal is not quantitative No developments were carried out tostudy its capability as a quantitative instrument but with proper calibration we expect itsresponse to be linear within a wide range of input rates There are no reasons a priori thatwould hamper its ability to give quantitative results more than in conventional PET systems
The results of this investigation are promising for improving the quality and promptnessof PET monitoring though there is still a big margin for improvement The proposed in-beamPET system has in principle the same geometrical limitations as previous in-beam solutionsbut uses new electronics that allow to reduce the acquisition duration It is compatible withMonte Carlo based simulations as well as with all the range verification techniques that havebeen used so far However it requires the detectors response to be included in the simulationmodel so as to take into account the artefacts due to the limited angular coverage Washouteffects are expected to be less prominent than in any other PET imaging technique since theacquisition lasts only a few minutes from the beginning of the irradiation
Future work is planned to increase the angular coverage of the system in order to improverandom coincidences management to refine system synchronization with the beam and tocharacterize the detectors response Extending the detectors area from 10 cm times 10 cm to15 cm times 15 cm would require no major changes The number of detector modules wouldincrease from 8 to 18 and the software analysis would be more complex but the overallacquisition architecture and implementation would remain the same
57
Phys Med Biol 59 (2014) 43 G Sportelli et al
Acknowledgments
This research has been supported by the INFN-RT 60141 POR CRO FSE 2007-2013 SpainrsquosMinistry of Economy (TEC2010-21619-C04-03 TEC2011-28972-C02-02 and AMIT-CDTI)Comunidad de Madrid (ARTEMIS S2009DPI-1802) FULLBEAM-300838 Marie Curie IntraEuropean Fellowship within the lsquo7th European Community Framework Programmersquo (FP7)ENVISION project (FP7) and the European Regional Development Funds (FEDER)
References
Aiello M Attanasi F Belcari N Rosso V Straub K and Del Guerra A 2013 A dose determinationprocedure by PET monitoring in proton therapy Monte Carlo validation IEEE Trans NuclSci 60 3298ndash304
Attanasi F Knopf A Parodi K Paganetti H Bortfeld T Rosso V and Del Guerra A 2011 Extensionand validation of an analytical model for in vivo PET verification of proton therapyndasha phantom andclinical study Phys Med Biol 56 5079ndash98
Attanasi F et al 2008a Experimental validation of the filtering approach for dose monitoring in protontherapy at low energy Phys Med 24 102ndash6
Attanasi F et al 2008b Preliminary results of an in-beam PET prototype for proton therapy Nucl InstrumMethods Phys Res A 591 296ndash9
Belcari N Del Guerra A Camarda M Spontoni L Vecchio S and Bianchi D 2007 Performance of afour-output front-end electronics for multi-anode PMTS readout of scintillator arrays Nucl InstrumMethods Phys Res A 572 335ndash7
Bennett G Archambeau J Archambeau B Meltzer J and Wingate C 1978 Visualization and transport ofpositron emission from proton activation in vivo Science 200 1151ndash3
Bonifacio D A Belcari N Moehrs S Moralles M Rosso V Vecchio S and Del Guerra A 2010 A timeefficient optical model for GATE simulation of a LYSO scintillation matrix used in PET applicationsIEEE Trans Nucl Sci 57 2483ndash9
Cirrone G A P et al 2004 A 62-MeV proton beam for the treatment of ocular melanoma at LaboratoriNazionali del Sud-INFN IEEE Trans Nucl Sci 51 860ndash5
Crespo P Barthel T Frais-Kolbl H Griesmayer E Heidel K Parodi K Pawelke J P and Enghardt W 2005Suppression of random coincidences during in-beam PET measurements at ion beam radiotherapyfacilities IEEE Trans Nucl Sci 52 980ndash7
Crespo P Shakirin G and Enghardt W 2006 On the detector arrangement for in-beam PET for hadrontherapy monitoring Phys Med Biol 51 2143ndash63
Cuttone G et al 2011 CATANA protontherapy facility The state of art of clinical and dosimetricexperience Eur Phys J Plus 126 1ndash7
Del Guerra A Di Domenico G and Mukhopadhayay D 1997 PET dosimetry in proton radiotherapy aMonte Carlo study Appl Radiat Isot A 48 1617ndash24
Enghardt W Crespo P Fiedler F Hinz R Parodi K Pawelke J and Ponisch F 2004 Charged hadrontumour therapy monitoring by means of PET Nucl Instrum Methods Phys Res 525 284ndash8
Enghardt W Debus J Haberer T Hasch B Hinz R Jakel O Kramer M Lauckner K and Pawelke J 1999Strahlenther Onkol 175 33ndash36
Espana S Zhu X Daartz J Fakhri G E Bortfeld T and Paganetti H 2011 The reliability of proton-nuclearinteraction cross-section data to predict proton-induced PET images in proton therapy Phys MedBiol 56 2687ndash98
Grassberger C Trofimov A Lomax A and Paganetti H 2011 Variations in linear energy transfer withinclinical proton therapy fields and the potential for biological treatment planning Int J RadiatOncol 80 1559ndash66
Grogg K Zhu X Min C H Wilney B Bortfeld T Paganetti H Shih H A and El Fakhri G 2013 Feasibilityof using distal endpoints for in-room PET range verification of proton therapy IEEE Trans NuclSci 60 3290ndash7
Helmbrecht S Santiago A Enghardt W Kuess P and Fiedler F 2012 On the feasibility of automaticdetection of range deviations from in-beam PET data Phys Med Biol 57 1387ndash97
Hui Z Zhang X Starkschall G Li Y Mohan R Komaki R Cox J D and Chang J Y 2008 Effects ofinterfractional motion and anatomic changes on proton therapy dose distribution in lung cancer IntJ Radiat Oncol 72 1385ndash95
58
Phys Med Biol 59 (2014) 43 G Sportelli et al
Knopf A Parodi K Bortfeld T Shih H A and Paganetti H 2009 Systematic analysis of biologicaland physical limitations of proton beam range verification with offline PETCT scans Phys MedBiol 54 4477ndash95
Knopf A Parodi K Paganetti H Cascio E Bonab A and Bortfeld T 2008 Quantitative assessment of thephysical potential of proton beam range verification with PETCT Phys Med Biol 53 4137ndash51
Knopf A C and Lomax A 2013 In vivo proton range verification a review Phys Med Biol58 R131ndash60
Knopf A C Parodi K Paganetti H Bortfeld T Daartz J Engelsman M Liebsch N and Shih H2011 Accuracy of proton beam range verification using post-treatment positron emissiontomographycomputed tomography as function of treatment site Int J Radiat Oncol 79 297ndash304
Litzenberg D et al 1992 On-line monitoring and PET imaging of proton radiotherapy beams Conf RecordIEEE Nuclear Science Symp and Medical Imaging Conf vol 2 pp 954ndash6
Min C H Zhu X Winey B A Grogg K Testa M El Fakhri G Bortfeld T R Paganetti H and Shih H A2013 Clinical application of in-room positron emission tomography for in vivo treatment monitoringin proton radiation therapy Int J Radiat Oncol 86 183ndash9
Moehrs S Defrise M Belcari N Del Guerra A Bartoli A Fabbri S and Zanetti G 2008 Multi-ray-basedsystem matrix generation for 3D PET reconstruction Phys Med Biol 53 6925ndash45
Moteabbed M Espana S and Paganetti H 2011 Monte Carlo patient study on the comparison of promptgamma and PET imaging for range verification in proton therapy Phys Med Biol 56 1063ndash82
Nishikido F Mitsuhashi T Inadama N Inaniwa T Satoh S Tashima H Yoshida E Murayama Hand Yamaya T 2010 Performance evaluation of an OpenPET detector for heavy Ion therapyunder actual in-beam condition IEEE Nuclear Science Symp and Medical Imaging Conf Recordpp 3380ndash82
Nishio T Miyatake A Ogino T Nakagawa K Saijo N and Esumi H 2010 The development and clinicaluse of a beam on-line PET system mounted on a rotating gantry port in proton therapy Int J RadiatOncol 76 277ndash86
Oelfke U Lam G K and Atkins M S 1996 Proton dose monitoring with PET quantitative studies inLucite Phys Med Biol 41 177ndash96
Paganetti H 2012 Range uncertainties in proton therapy and the role of Monte Carlo simulations PhysMed Biol 57 R99ndash117
Paganetti H Jiang H Parodi K Slopsema R and Engelsman M 2008 Clinical implementation of fullMonte Carlo dose calculation in proton beam therapy Phys Med Biol 53 4825ndash53
Parodi K and Bortfeld T 2006 A filtering approach based on Gaussianndashpowerlaw convolutions for localPET verification of proton radiotherapy Phys Med Biol A 51 1991ndash2009
Parodi K Crespo P Eickhoff H Haberer T Pawelke J Schardt D and Enghardt W 2005 Randomcoincidences during in-beam PET measurements at microbunched therapeutic ion beams NuclInstrum Methods Phys Res A 545 446ndash458
Parodi K and Enghardt W 2000 Potential application of PET in quality assurance of proton therapy PhysMed Biol 45 N151ndash6
Parodi K Enghardt W and Haberer T 2002 In-beam PET measurements of β+ radioactivity Phys MedBiol 47 21ndash36
Parodi K Paganetti H Cascio E Flanz J B Bonab A A Alpert N M Lohmann K and Bortfeld T 2007aPETCT imaging for treatment verification after proton therapy a study with plastic phantoms andmetallic implants Med Phys 34 419ndash35
Parodi K et al 2007b Int J Radiat Oncol 68 920ndash34Pawelke J Enghardt W Haberer T Hasch B Hinz R Kramer M Lauckner E and Sobiella M 1997
In-beam PET imaging for the control of heavy-ion tumour therapy IEEE Trans Nucl Sci 44 1492ndash8Pia M G Begalli M Lechner A Quintieri L and Saracco P 2010 Physics-related epistemic uncertainties
in proton depth dose simulation IEEE Trans Nucl Sci 57 2805ndash30Polf J Peterson S Ciangaru G Gillin M and Beddar S 2009a Prompt gamma-ray emission from biological
tissues during proton irradiation a preliminary study Phys Med Biol 54 731ndash43Polf J Peterson S McCleskey M Roeder B Spiridon A Beddar S and Trache L 2009b Measurement
and calculation of characteristic prompt gamma ray spectra emitted during proton irradiation PhysMed Biol 54 N519ndash27
Remmele S Hesser J Paganetti H and Bortfeld T 2011 A deconvolution approach for PET-based dosereconstruction in proton radiotherapy Phys Med Biol 56 7601ndash19
Rosso V et al 2013 A new PET prototype for proton therapy comparison of data and Monte Carlosimulations J Instrum 8 C03021
59
Phys Med Biol 59 (2014) 43 G Sportelli et al
Shakirin G Braess H Fiedler F Kunath D Laube K Parodi K Priegnitz M and Enghardt W 2011Implementation and workflow for PET monitoring of therapeutic ion irradiation a comparison ofin-beam in-room and off-line techniques Phys Med Biol 56 1281ndash98
Sportelli G Belcari N Guerra P and Santos A 2011b Low-resource synchronous coincidence processorfor positron emission tomography Nucl Instrum Methods Phys Res A 648 S199ndash201
Sportelli G Belcari N Guerra P Spinella F Franchi G Attanasi F Moehrs S Rosso V Santos Aand Del Guerra A 2011a Reprogrammable acquisition architecture for dedicated positron emissiontomography IEEE Trans Nucl Sci 58 695ndash702
Sportelli G Ortuno J Vaquero J Desco M and Santos A 2013 Massively parallelizable list-modereconstruction using a Monte Carlo-based elliptical Gaussian model Med Phys 40 012504
Sportelli G et al 2012 Full in-beam PET measurements of 62 MeV protons onto a PMMA target NuclInstrum Methods A 718 151ndash3
Surti S Zou W Daube-Witherspoon M McDonough J and Karp J 2011 Design study of an in situ PETscanner for use in proton beam therapy Phys Med Biol 56 2667ndash85
Tashima H Yamaya T Yoshida E Kinouchi S Watanabe M and Tanaka E 2012 A single-ring OpenPETenabling PET imaging during radiotherapy Phys Med Biol 57 4705ndash18
Vecchio S et al 2009 A PET prototype for in-beam monitoring of proton therapy IEEE Trans NuclSci 56 51ndash56
60
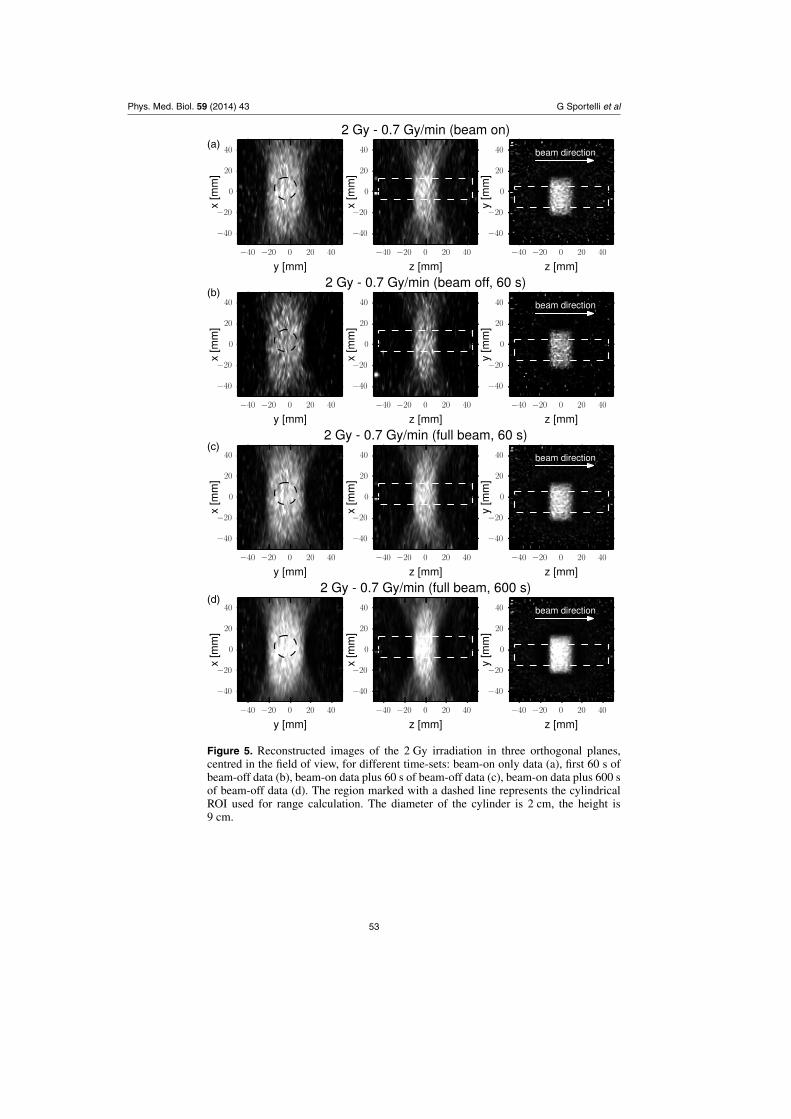
Phys Med Biol 59 (2014) 43 G Sportelli et al
(a)
(b)
(c)
(d)
Figure 6 Reconstructed images of the 20 Gy irradiation in three orthogonal planescentred in the field of view for different time-sets beam-on only data (a) first 60 s ofbeam-off data (b) beam-on data plus 60 s of beam-off data (c) beam-on data plus 600 sof beam-off data (d) The region marked with a dashed line represents the cylindricalROI used for range calculation The diameter of the cylinder is 2 cm the height is9 cm
54
Phys Med Biol 59 (2014) 43 G Sportelli et al
(a)
(b)
(c)
(d)
(e)
(f)
(g)
(h)
Figure 7 Profiles of the reconstructed images for 2 Gy (left column (a)ndash(d)) and20 Gy (right column (e)ndash(h)) irradiations on different time-sets beam-on only data((a) (e)) first 60 s of beam-off data ((b) (f)) beam-on data plus 60 s of beam-off data((c) (g)) beam-on data plus 600 s of beam-off data ((d) (h)) The plot is obtained bysuperimposing the profiles of each voxel line included in the ROI (see figures 5 and 6)The white dashed line is the mean of all voxel lines The z coordinate of the dose rangeis indicated with a black dashed line Dose range has been calculated given the depth ofthe Bragg peak in homogeneous PMMA ie 29 mm starting from the activity risingedge
5 Conclusions
We have built and optimized a modular dual-head PET system for treatment monitoring inhadron therapy The system can operate continuously in-beam and is able to successfullyacquire the produced β+ activity in a field-of-view of 10 cm times 10 cm times 10 cm also during
55
Phys Med Biol 59 (2014) 43 G Sportelli et al
Figure 8 Means and standard deviations of activity ranges versus time for all thereconstructed images The expected dose range of the used 62 MeV proton beams inPMMA is 29 mm
0 1 2 3 4 5
Events [106]
170
175
180
185
190
195
200
205
210
Pro
files
mea
nra
nge
[mm
]
Range vs statistics
20 Gy - 97 Gymin Beam off only
10 Gy - 30 Gymin Beam off only
5 Gy - 16 Gymin Beam off only
2 Gy - 07 Gymin Beam off only
Figure 9 Means and standard deviations of activity ranges versus total acquired eventsfor all the reconstructed images The expected dose range of the used 62 MeV protonbeams in PMMA is 29 mm
the irradiation A distinction has been introduced between beam-on beam-off and full-beamdata referring to the acquisition output during the irradiation after or both respectively Thequestion that has been addressed is if beam-on data can be used either alone or jointly withbeam-off data to improve the quality of the system response for monitoring purposes A set
56
Phys Med Biol 59 (2014) 43 G Sportelli et al
of PET measurements was then performed at the cyclotron-based proton therapy facility atCATANA during the irradiation of a PMMA phantom at different dose rates and stopping theacquisition 10 min after
As already observed in other studies a characteristic high random count rate appearsduring the irradiation This count rate is roughly constant with a continuous beam and increasesquickly with the dose rate Since the phantom activation increases during the irradiation therandoms to total coincidences fraction decreases with time and becomes abruptly negligibleright after the beam turns off The maximum observed fraction at the beginning of an irradiationwith 97 Gy minminus1 dose rate is 245 This value is of the same order of an acceptablerandoms fraction in clinical PET imaging However the noise structure is different fromrandom coincidence noise in conventional PET thus future studies are expected to bettercharacterize its nature with respect to useful β+ activity and to improve the techniques usedfor reconstructing such data
The coincidence energy spectra of beam-on and beam-off data were also compared Asmall flat contamination from radiation with energies up to 2 MeV was observed in beam-ondata (2 MeV is the dynamic range of the system) With dose rates up to about 10 Gy minminus1 nosignificant degradation of the energy spectra was observed being the percentage of acquiredevents within the 350ndash850 keV energy window up to 622 of the total
For each measurement and modality we estimated accuracy and precision by studyingthe distribution of the activity ranges of a set of voxel lines within the activated materialResults show that the inclusion of beam-on data improves both the precision and accuracyof the proton range measurement with respect to data acquired after the irradiation only Theuse of beam-on data is enough to give a precision better that 1 mm (σ ) when at least 5 Gyare delivered Alternatively beam-on data can be effectively used to increase the availablestatistics for image reconstruction when the dose is lower For the lowest available dose rate(2 Gy minminus1) beam-on data did not produce sub-millimetric range precision but the precisionof the first 60 s of full-beam data is half with respect to that obtained with beam-off dataonly
The PET reconstructed signal is not quantitative No developments were carried out tostudy its capability as a quantitative instrument but with proper calibration we expect itsresponse to be linear within a wide range of input rates There are no reasons a priori thatwould hamper its ability to give quantitative results more than in conventional PET systems
The results of this investigation are promising for improving the quality and promptnessof PET monitoring though there is still a big margin for improvement The proposed in-beamPET system has in principle the same geometrical limitations as previous in-beam solutionsbut uses new electronics that allow to reduce the acquisition duration It is compatible withMonte Carlo based simulations as well as with all the range verification techniques that havebeen used so far However it requires the detectors response to be included in the simulationmodel so as to take into account the artefacts due to the limited angular coverage Washouteffects are expected to be less prominent than in any other PET imaging technique since theacquisition lasts only a few minutes from the beginning of the irradiation
Future work is planned to increase the angular coverage of the system in order to improverandom coincidences management to refine system synchronization with the beam and tocharacterize the detectors response Extending the detectors area from 10 cm times 10 cm to15 cm times 15 cm would require no major changes The number of detector modules wouldincrease from 8 to 18 and the software analysis would be more complex but the overallacquisition architecture and implementation would remain the same
57
Phys Med Biol 59 (2014) 43 G Sportelli et al
Acknowledgments
This research has been supported by the INFN-RT 60141 POR CRO FSE 2007-2013 SpainrsquosMinistry of Economy (TEC2010-21619-C04-03 TEC2011-28972-C02-02 and AMIT-CDTI)Comunidad de Madrid (ARTEMIS S2009DPI-1802) FULLBEAM-300838 Marie Curie IntraEuropean Fellowship within the lsquo7th European Community Framework Programmersquo (FP7)ENVISION project (FP7) and the European Regional Development Funds (FEDER)
References
Aiello M Attanasi F Belcari N Rosso V Straub K and Del Guerra A 2013 A dose determinationprocedure by PET monitoring in proton therapy Monte Carlo validation IEEE Trans NuclSci 60 3298ndash304
Attanasi F Knopf A Parodi K Paganetti H Bortfeld T Rosso V and Del Guerra A 2011 Extensionand validation of an analytical model for in vivo PET verification of proton therapyndasha phantom andclinical study Phys Med Biol 56 5079ndash98
Attanasi F et al 2008a Experimental validation of the filtering approach for dose monitoring in protontherapy at low energy Phys Med 24 102ndash6
Attanasi F et al 2008b Preliminary results of an in-beam PET prototype for proton therapy Nucl InstrumMethods Phys Res A 591 296ndash9
Belcari N Del Guerra A Camarda M Spontoni L Vecchio S and Bianchi D 2007 Performance of afour-output front-end electronics for multi-anode PMTS readout of scintillator arrays Nucl InstrumMethods Phys Res A 572 335ndash7
Bennett G Archambeau J Archambeau B Meltzer J and Wingate C 1978 Visualization and transport ofpositron emission from proton activation in vivo Science 200 1151ndash3
Bonifacio D A Belcari N Moehrs S Moralles M Rosso V Vecchio S and Del Guerra A 2010 A timeefficient optical model for GATE simulation of a LYSO scintillation matrix used in PET applicationsIEEE Trans Nucl Sci 57 2483ndash9
Cirrone G A P et al 2004 A 62-MeV proton beam for the treatment of ocular melanoma at LaboratoriNazionali del Sud-INFN IEEE Trans Nucl Sci 51 860ndash5
Crespo P Barthel T Frais-Kolbl H Griesmayer E Heidel K Parodi K Pawelke J P and Enghardt W 2005Suppression of random coincidences during in-beam PET measurements at ion beam radiotherapyfacilities IEEE Trans Nucl Sci 52 980ndash7
Crespo P Shakirin G and Enghardt W 2006 On the detector arrangement for in-beam PET for hadrontherapy monitoring Phys Med Biol 51 2143ndash63
Cuttone G et al 2011 CATANA protontherapy facility The state of art of clinical and dosimetricexperience Eur Phys J Plus 126 1ndash7
Del Guerra A Di Domenico G and Mukhopadhayay D 1997 PET dosimetry in proton radiotherapy aMonte Carlo study Appl Radiat Isot A 48 1617ndash24
Enghardt W Crespo P Fiedler F Hinz R Parodi K Pawelke J and Ponisch F 2004 Charged hadrontumour therapy monitoring by means of PET Nucl Instrum Methods Phys Res 525 284ndash8
Enghardt W Debus J Haberer T Hasch B Hinz R Jakel O Kramer M Lauckner K and Pawelke J 1999Strahlenther Onkol 175 33ndash36
Espana S Zhu X Daartz J Fakhri G E Bortfeld T and Paganetti H 2011 The reliability of proton-nuclearinteraction cross-section data to predict proton-induced PET images in proton therapy Phys MedBiol 56 2687ndash98
Grassberger C Trofimov A Lomax A and Paganetti H 2011 Variations in linear energy transfer withinclinical proton therapy fields and the potential for biological treatment planning Int J RadiatOncol 80 1559ndash66
Grogg K Zhu X Min C H Wilney B Bortfeld T Paganetti H Shih H A and El Fakhri G 2013 Feasibilityof using distal endpoints for in-room PET range verification of proton therapy IEEE Trans NuclSci 60 3290ndash7
Helmbrecht S Santiago A Enghardt W Kuess P and Fiedler F 2012 On the feasibility of automaticdetection of range deviations from in-beam PET data Phys Med Biol 57 1387ndash97
Hui Z Zhang X Starkschall G Li Y Mohan R Komaki R Cox J D and Chang J Y 2008 Effects ofinterfractional motion and anatomic changes on proton therapy dose distribution in lung cancer IntJ Radiat Oncol 72 1385ndash95
58
Phys Med Biol 59 (2014) 43 G Sportelli et al
Knopf A Parodi K Bortfeld T Shih H A and Paganetti H 2009 Systematic analysis of biologicaland physical limitations of proton beam range verification with offline PETCT scans Phys MedBiol 54 4477ndash95
Knopf A Parodi K Paganetti H Cascio E Bonab A and Bortfeld T 2008 Quantitative assessment of thephysical potential of proton beam range verification with PETCT Phys Med Biol 53 4137ndash51
Knopf A C and Lomax A 2013 In vivo proton range verification a review Phys Med Biol58 R131ndash60
Knopf A C Parodi K Paganetti H Bortfeld T Daartz J Engelsman M Liebsch N and Shih H2011 Accuracy of proton beam range verification using post-treatment positron emissiontomographycomputed tomography as function of treatment site Int J Radiat Oncol 79 297ndash304
Litzenberg D et al 1992 On-line monitoring and PET imaging of proton radiotherapy beams Conf RecordIEEE Nuclear Science Symp and Medical Imaging Conf vol 2 pp 954ndash6
Min C H Zhu X Winey B A Grogg K Testa M El Fakhri G Bortfeld T R Paganetti H and Shih H A2013 Clinical application of in-room positron emission tomography for in vivo treatment monitoringin proton radiation therapy Int J Radiat Oncol 86 183ndash9
Moehrs S Defrise M Belcari N Del Guerra A Bartoli A Fabbri S and Zanetti G 2008 Multi-ray-basedsystem matrix generation for 3D PET reconstruction Phys Med Biol 53 6925ndash45
Moteabbed M Espana S and Paganetti H 2011 Monte Carlo patient study on the comparison of promptgamma and PET imaging for range verification in proton therapy Phys Med Biol 56 1063ndash82
Nishikido F Mitsuhashi T Inadama N Inaniwa T Satoh S Tashima H Yoshida E Murayama Hand Yamaya T 2010 Performance evaluation of an OpenPET detector for heavy Ion therapyunder actual in-beam condition IEEE Nuclear Science Symp and Medical Imaging Conf Recordpp 3380ndash82
Nishio T Miyatake A Ogino T Nakagawa K Saijo N and Esumi H 2010 The development and clinicaluse of a beam on-line PET system mounted on a rotating gantry port in proton therapy Int J RadiatOncol 76 277ndash86
Oelfke U Lam G K and Atkins M S 1996 Proton dose monitoring with PET quantitative studies inLucite Phys Med Biol 41 177ndash96
Paganetti H 2012 Range uncertainties in proton therapy and the role of Monte Carlo simulations PhysMed Biol 57 R99ndash117
Paganetti H Jiang H Parodi K Slopsema R and Engelsman M 2008 Clinical implementation of fullMonte Carlo dose calculation in proton beam therapy Phys Med Biol 53 4825ndash53
Parodi K and Bortfeld T 2006 A filtering approach based on Gaussianndashpowerlaw convolutions for localPET verification of proton radiotherapy Phys Med Biol A 51 1991ndash2009
Parodi K Crespo P Eickhoff H Haberer T Pawelke J Schardt D and Enghardt W 2005 Randomcoincidences during in-beam PET measurements at microbunched therapeutic ion beams NuclInstrum Methods Phys Res A 545 446ndash458
Parodi K and Enghardt W 2000 Potential application of PET in quality assurance of proton therapy PhysMed Biol 45 N151ndash6
Parodi K Enghardt W and Haberer T 2002 In-beam PET measurements of β+ radioactivity Phys MedBiol 47 21ndash36
Parodi K Paganetti H Cascio E Flanz J B Bonab A A Alpert N M Lohmann K and Bortfeld T 2007aPETCT imaging for treatment verification after proton therapy a study with plastic phantoms andmetallic implants Med Phys 34 419ndash35
Parodi K et al 2007b Int J Radiat Oncol 68 920ndash34Pawelke J Enghardt W Haberer T Hasch B Hinz R Kramer M Lauckner E and Sobiella M 1997
In-beam PET imaging for the control of heavy-ion tumour therapy IEEE Trans Nucl Sci 44 1492ndash8Pia M G Begalli M Lechner A Quintieri L and Saracco P 2010 Physics-related epistemic uncertainties
in proton depth dose simulation IEEE Trans Nucl Sci 57 2805ndash30Polf J Peterson S Ciangaru G Gillin M and Beddar S 2009a Prompt gamma-ray emission from biological
tissues during proton irradiation a preliminary study Phys Med Biol 54 731ndash43Polf J Peterson S McCleskey M Roeder B Spiridon A Beddar S and Trache L 2009b Measurement
and calculation of characteristic prompt gamma ray spectra emitted during proton irradiation PhysMed Biol 54 N519ndash27
Remmele S Hesser J Paganetti H and Bortfeld T 2011 A deconvolution approach for PET-based dosereconstruction in proton radiotherapy Phys Med Biol 56 7601ndash19
Rosso V et al 2013 A new PET prototype for proton therapy comparison of data and Monte Carlosimulations J Instrum 8 C03021
59
Phys Med Biol 59 (2014) 43 G Sportelli et al
Shakirin G Braess H Fiedler F Kunath D Laube K Parodi K Priegnitz M and Enghardt W 2011Implementation and workflow for PET monitoring of therapeutic ion irradiation a comparison ofin-beam in-room and off-line techniques Phys Med Biol 56 1281ndash98
Sportelli G Belcari N Guerra P and Santos A 2011b Low-resource synchronous coincidence processorfor positron emission tomography Nucl Instrum Methods Phys Res A 648 S199ndash201
Sportelli G Belcari N Guerra P Spinella F Franchi G Attanasi F Moehrs S Rosso V Santos Aand Del Guerra A 2011a Reprogrammable acquisition architecture for dedicated positron emissiontomography IEEE Trans Nucl Sci 58 695ndash702
Sportelli G Ortuno J Vaquero J Desco M and Santos A 2013 Massively parallelizable list-modereconstruction using a Monte Carlo-based elliptical Gaussian model Med Phys 40 012504
Sportelli G et al 2012 Full in-beam PET measurements of 62 MeV protons onto a PMMA target NuclInstrum Methods A 718 151ndash3
Surti S Zou W Daube-Witherspoon M McDonough J and Karp J 2011 Design study of an in situ PETscanner for use in proton beam therapy Phys Med Biol 56 2667ndash85
Tashima H Yamaya T Yoshida E Kinouchi S Watanabe M and Tanaka E 2012 A single-ring OpenPETenabling PET imaging during radiotherapy Phys Med Biol 57 4705ndash18
Vecchio S et al 2009 A PET prototype for in-beam monitoring of proton therapy IEEE Trans NuclSci 56 51ndash56
60
Phys Med Biol 59 (2014) 43 G Sportelli et al
(a)
(b)
(c)
(d)
(e)
(f)
(g)
(h)
Figure 7 Profiles of the reconstructed images for 2 Gy (left column (a)ndash(d)) and20 Gy (right column (e)ndash(h)) irradiations on different time-sets beam-on only data((a) (e)) first 60 s of beam-off data ((b) (f)) beam-on data plus 60 s of beam-off data((c) (g)) beam-on data plus 600 s of beam-off data ((d) (h)) The plot is obtained bysuperimposing the profiles of each voxel line included in the ROI (see figures 5 and 6)The white dashed line is the mean of all voxel lines The z coordinate of the dose rangeis indicated with a black dashed line Dose range has been calculated given the depth ofthe Bragg peak in homogeneous PMMA ie 29 mm starting from the activity risingedge
5 Conclusions
We have built and optimized a modular dual-head PET system for treatment monitoring inhadron therapy The system can operate continuously in-beam and is able to successfullyacquire the produced β+ activity in a field-of-view of 10 cm times 10 cm times 10 cm also during
55
Phys Med Biol 59 (2014) 43 G Sportelli et al
Figure 8 Means and standard deviations of activity ranges versus time for all thereconstructed images The expected dose range of the used 62 MeV proton beams inPMMA is 29 mm
0 1 2 3 4 5
Events [106]
170
175
180
185
190
195
200
205
210
Pro
files
mea
nra
nge
[mm
]
Range vs statistics
20 Gy - 97 Gymin Beam off only
10 Gy - 30 Gymin Beam off only
5 Gy - 16 Gymin Beam off only
2 Gy - 07 Gymin Beam off only
Figure 9 Means and standard deviations of activity ranges versus total acquired eventsfor all the reconstructed images The expected dose range of the used 62 MeV protonbeams in PMMA is 29 mm
the irradiation A distinction has been introduced between beam-on beam-off and full-beamdata referring to the acquisition output during the irradiation after or both respectively Thequestion that has been addressed is if beam-on data can be used either alone or jointly withbeam-off data to improve the quality of the system response for monitoring purposes A set
56
Phys Med Biol 59 (2014) 43 G Sportelli et al
of PET measurements was then performed at the cyclotron-based proton therapy facility atCATANA during the irradiation of a PMMA phantom at different dose rates and stopping theacquisition 10 min after
As already observed in other studies a characteristic high random count rate appearsduring the irradiation This count rate is roughly constant with a continuous beam and increasesquickly with the dose rate Since the phantom activation increases during the irradiation therandoms to total coincidences fraction decreases with time and becomes abruptly negligibleright after the beam turns off The maximum observed fraction at the beginning of an irradiationwith 97 Gy minminus1 dose rate is 245 This value is of the same order of an acceptablerandoms fraction in clinical PET imaging However the noise structure is different fromrandom coincidence noise in conventional PET thus future studies are expected to bettercharacterize its nature with respect to useful β+ activity and to improve the techniques usedfor reconstructing such data
The coincidence energy spectra of beam-on and beam-off data were also compared Asmall flat contamination from radiation with energies up to 2 MeV was observed in beam-ondata (2 MeV is the dynamic range of the system) With dose rates up to about 10 Gy minminus1 nosignificant degradation of the energy spectra was observed being the percentage of acquiredevents within the 350ndash850 keV energy window up to 622 of the total
For each measurement and modality we estimated accuracy and precision by studyingthe distribution of the activity ranges of a set of voxel lines within the activated materialResults show that the inclusion of beam-on data improves both the precision and accuracyof the proton range measurement with respect to data acquired after the irradiation only Theuse of beam-on data is enough to give a precision better that 1 mm (σ ) when at least 5 Gyare delivered Alternatively beam-on data can be effectively used to increase the availablestatistics for image reconstruction when the dose is lower For the lowest available dose rate(2 Gy minminus1) beam-on data did not produce sub-millimetric range precision but the precisionof the first 60 s of full-beam data is half with respect to that obtained with beam-off dataonly
The PET reconstructed signal is not quantitative No developments were carried out tostudy its capability as a quantitative instrument but with proper calibration we expect itsresponse to be linear within a wide range of input rates There are no reasons a priori thatwould hamper its ability to give quantitative results more than in conventional PET systems
The results of this investigation are promising for improving the quality and promptnessof PET monitoring though there is still a big margin for improvement The proposed in-beamPET system has in principle the same geometrical limitations as previous in-beam solutionsbut uses new electronics that allow to reduce the acquisition duration It is compatible withMonte Carlo based simulations as well as with all the range verification techniques that havebeen used so far However it requires the detectors response to be included in the simulationmodel so as to take into account the artefacts due to the limited angular coverage Washouteffects are expected to be less prominent than in any other PET imaging technique since theacquisition lasts only a few minutes from the beginning of the irradiation
Future work is planned to increase the angular coverage of the system in order to improverandom coincidences management to refine system synchronization with the beam and tocharacterize the detectors response Extending the detectors area from 10 cm times 10 cm to15 cm times 15 cm would require no major changes The number of detector modules wouldincrease from 8 to 18 and the software analysis would be more complex but the overallacquisition architecture and implementation would remain the same
57
Phys Med Biol 59 (2014) 43 G Sportelli et al
Acknowledgments
This research has been supported by the INFN-RT 60141 POR CRO FSE 2007-2013 SpainrsquosMinistry of Economy (TEC2010-21619-C04-03 TEC2011-28972-C02-02 and AMIT-CDTI)Comunidad de Madrid (ARTEMIS S2009DPI-1802) FULLBEAM-300838 Marie Curie IntraEuropean Fellowship within the lsquo7th European Community Framework Programmersquo (FP7)ENVISION project (FP7) and the European Regional Development Funds (FEDER)
References
Aiello M Attanasi F Belcari N Rosso V Straub K and Del Guerra A 2013 A dose determinationprocedure by PET monitoring in proton therapy Monte Carlo validation IEEE Trans NuclSci 60 3298ndash304
Attanasi F Knopf A Parodi K Paganetti H Bortfeld T Rosso V and Del Guerra A 2011 Extensionand validation of an analytical model for in vivo PET verification of proton therapyndasha phantom andclinical study Phys Med Biol 56 5079ndash98
Attanasi F et al 2008a Experimental validation of the filtering approach for dose monitoring in protontherapy at low energy Phys Med 24 102ndash6
Attanasi F et al 2008b Preliminary results of an in-beam PET prototype for proton therapy Nucl InstrumMethods Phys Res A 591 296ndash9
Belcari N Del Guerra A Camarda M Spontoni L Vecchio S and Bianchi D 2007 Performance of afour-output front-end electronics for multi-anode PMTS readout of scintillator arrays Nucl InstrumMethods Phys Res A 572 335ndash7
Bennett G Archambeau J Archambeau B Meltzer J and Wingate C 1978 Visualization and transport ofpositron emission from proton activation in vivo Science 200 1151ndash3
Bonifacio D A Belcari N Moehrs S Moralles M Rosso V Vecchio S and Del Guerra A 2010 A timeefficient optical model for GATE simulation of a LYSO scintillation matrix used in PET applicationsIEEE Trans Nucl Sci 57 2483ndash9
Cirrone G A P et al 2004 A 62-MeV proton beam for the treatment of ocular melanoma at LaboratoriNazionali del Sud-INFN IEEE Trans Nucl Sci 51 860ndash5
Crespo P Barthel T Frais-Kolbl H Griesmayer E Heidel K Parodi K Pawelke J P and Enghardt W 2005Suppression of random coincidences during in-beam PET measurements at ion beam radiotherapyfacilities IEEE Trans Nucl Sci 52 980ndash7
Crespo P Shakirin G and Enghardt W 2006 On the detector arrangement for in-beam PET for hadrontherapy monitoring Phys Med Biol 51 2143ndash63
Cuttone G et al 2011 CATANA protontherapy facility The state of art of clinical and dosimetricexperience Eur Phys J Plus 126 1ndash7
Del Guerra A Di Domenico G and Mukhopadhayay D 1997 PET dosimetry in proton radiotherapy aMonte Carlo study Appl Radiat Isot A 48 1617ndash24
Enghardt W Crespo P Fiedler F Hinz R Parodi K Pawelke J and Ponisch F 2004 Charged hadrontumour therapy monitoring by means of PET Nucl Instrum Methods Phys Res 525 284ndash8
Enghardt W Debus J Haberer T Hasch B Hinz R Jakel O Kramer M Lauckner K and Pawelke J 1999Strahlenther Onkol 175 33ndash36
Espana S Zhu X Daartz J Fakhri G E Bortfeld T and Paganetti H 2011 The reliability of proton-nuclearinteraction cross-section data to predict proton-induced PET images in proton therapy Phys MedBiol 56 2687ndash98
Grassberger C Trofimov A Lomax A and Paganetti H 2011 Variations in linear energy transfer withinclinical proton therapy fields and the potential for biological treatment planning Int J RadiatOncol 80 1559ndash66
Grogg K Zhu X Min C H Wilney B Bortfeld T Paganetti H Shih H A and El Fakhri G 2013 Feasibilityof using distal endpoints for in-room PET range verification of proton therapy IEEE Trans NuclSci 60 3290ndash7
Helmbrecht S Santiago A Enghardt W Kuess P and Fiedler F 2012 On the feasibility of automaticdetection of range deviations from in-beam PET data Phys Med Biol 57 1387ndash97
Hui Z Zhang X Starkschall G Li Y Mohan R Komaki R Cox J D and Chang J Y 2008 Effects ofinterfractional motion and anatomic changes on proton therapy dose distribution in lung cancer IntJ Radiat Oncol 72 1385ndash95
58
Phys Med Biol 59 (2014) 43 G Sportelli et al
Knopf A Parodi K Bortfeld T Shih H A and Paganetti H 2009 Systematic analysis of biologicaland physical limitations of proton beam range verification with offline PETCT scans Phys MedBiol 54 4477ndash95
Knopf A Parodi K Paganetti H Cascio E Bonab A and Bortfeld T 2008 Quantitative assessment of thephysical potential of proton beam range verification with PETCT Phys Med Biol 53 4137ndash51
Knopf A C and Lomax A 2013 In vivo proton range verification a review Phys Med Biol58 R131ndash60
Knopf A C Parodi K Paganetti H Bortfeld T Daartz J Engelsman M Liebsch N and Shih H2011 Accuracy of proton beam range verification using post-treatment positron emissiontomographycomputed tomography as function of treatment site Int J Radiat Oncol 79 297ndash304
Litzenberg D et al 1992 On-line monitoring and PET imaging of proton radiotherapy beams Conf RecordIEEE Nuclear Science Symp and Medical Imaging Conf vol 2 pp 954ndash6
Min C H Zhu X Winey B A Grogg K Testa M El Fakhri G Bortfeld T R Paganetti H and Shih H A2013 Clinical application of in-room positron emission tomography for in vivo treatment monitoringin proton radiation therapy Int J Radiat Oncol 86 183ndash9
Moehrs S Defrise M Belcari N Del Guerra A Bartoli A Fabbri S and Zanetti G 2008 Multi-ray-basedsystem matrix generation for 3D PET reconstruction Phys Med Biol 53 6925ndash45
Moteabbed M Espana S and Paganetti H 2011 Monte Carlo patient study on the comparison of promptgamma and PET imaging for range verification in proton therapy Phys Med Biol 56 1063ndash82
Nishikido F Mitsuhashi T Inadama N Inaniwa T Satoh S Tashima H Yoshida E Murayama Hand Yamaya T 2010 Performance evaluation of an OpenPET detector for heavy Ion therapyunder actual in-beam condition IEEE Nuclear Science Symp and Medical Imaging Conf Recordpp 3380ndash82
Nishio T Miyatake A Ogino T Nakagawa K Saijo N and Esumi H 2010 The development and clinicaluse of a beam on-line PET system mounted on a rotating gantry port in proton therapy Int J RadiatOncol 76 277ndash86
Oelfke U Lam G K and Atkins M S 1996 Proton dose monitoring with PET quantitative studies inLucite Phys Med Biol 41 177ndash96
Paganetti H 2012 Range uncertainties in proton therapy and the role of Monte Carlo simulations PhysMed Biol 57 R99ndash117
Paganetti H Jiang H Parodi K Slopsema R and Engelsman M 2008 Clinical implementation of fullMonte Carlo dose calculation in proton beam therapy Phys Med Biol 53 4825ndash53
Parodi K and Bortfeld T 2006 A filtering approach based on Gaussianndashpowerlaw convolutions for localPET verification of proton radiotherapy Phys Med Biol A 51 1991ndash2009
Parodi K Crespo P Eickhoff H Haberer T Pawelke J Schardt D and Enghardt W 2005 Randomcoincidences during in-beam PET measurements at microbunched therapeutic ion beams NuclInstrum Methods Phys Res A 545 446ndash458
Parodi K and Enghardt W 2000 Potential application of PET in quality assurance of proton therapy PhysMed Biol 45 N151ndash6
Parodi K Enghardt W and Haberer T 2002 In-beam PET measurements of β+ radioactivity Phys MedBiol 47 21ndash36
Parodi K Paganetti H Cascio E Flanz J B Bonab A A Alpert N M Lohmann K and Bortfeld T 2007aPETCT imaging for treatment verification after proton therapy a study with plastic phantoms andmetallic implants Med Phys 34 419ndash35
Parodi K et al 2007b Int J Radiat Oncol 68 920ndash34Pawelke J Enghardt W Haberer T Hasch B Hinz R Kramer M Lauckner E and Sobiella M 1997
In-beam PET imaging for the control of heavy-ion tumour therapy IEEE Trans Nucl Sci 44 1492ndash8Pia M G Begalli M Lechner A Quintieri L and Saracco P 2010 Physics-related epistemic uncertainties
in proton depth dose simulation IEEE Trans Nucl Sci 57 2805ndash30Polf J Peterson S Ciangaru G Gillin M and Beddar S 2009a Prompt gamma-ray emission from biological
tissues during proton irradiation a preliminary study Phys Med Biol 54 731ndash43Polf J Peterson S McCleskey M Roeder B Spiridon A Beddar S and Trache L 2009b Measurement
and calculation of characteristic prompt gamma ray spectra emitted during proton irradiation PhysMed Biol 54 N519ndash27
Remmele S Hesser J Paganetti H and Bortfeld T 2011 A deconvolution approach for PET-based dosereconstruction in proton radiotherapy Phys Med Biol 56 7601ndash19
Rosso V et al 2013 A new PET prototype for proton therapy comparison of data and Monte Carlosimulations J Instrum 8 C03021
59
Phys Med Biol 59 (2014) 43 G Sportelli et al
Shakirin G Braess H Fiedler F Kunath D Laube K Parodi K Priegnitz M and Enghardt W 2011Implementation and workflow for PET monitoring of therapeutic ion irradiation a comparison ofin-beam in-room and off-line techniques Phys Med Biol 56 1281ndash98
Sportelli G Belcari N Guerra P and Santos A 2011b Low-resource synchronous coincidence processorfor positron emission tomography Nucl Instrum Methods Phys Res A 648 S199ndash201
Sportelli G Belcari N Guerra P Spinella F Franchi G Attanasi F Moehrs S Rosso V Santos Aand Del Guerra A 2011a Reprogrammable acquisition architecture for dedicated positron emissiontomography IEEE Trans Nucl Sci 58 695ndash702
Sportelli G Ortuno J Vaquero J Desco M and Santos A 2013 Massively parallelizable list-modereconstruction using a Monte Carlo-based elliptical Gaussian model Med Phys 40 012504
Sportelli G et al 2012 Full in-beam PET measurements of 62 MeV protons onto a PMMA target NuclInstrum Methods A 718 151ndash3
Surti S Zou W Daube-Witherspoon M McDonough J and Karp J 2011 Design study of an in situ PETscanner for use in proton beam therapy Phys Med Biol 56 2667ndash85
Tashima H Yamaya T Yoshida E Kinouchi S Watanabe M and Tanaka E 2012 A single-ring OpenPETenabling PET imaging during radiotherapy Phys Med Biol 57 4705ndash18
Vecchio S et al 2009 A PET prototype for in-beam monitoring of proton therapy IEEE Trans NuclSci 56 51ndash56
60

Phys Med Biol 59 (2014) 43 G Sportelli et al
Shakirin G Braess H Fiedler F Kunath D Laube K Parodi K Priegnitz M and Enghardt W 2011Implementation and workflow for PET monitoring of therapeutic ion irradiation a comparison ofin-beam in-room and off-line techniques Phys Med Biol 56 1281ndash98
Sportelli G Belcari N Guerra P and Santos A 2011b Low-resource synchronous coincidence processorfor positron emission tomography Nucl Instrum Methods Phys Res A 648 S199ndash201
Sportelli G Belcari N Guerra P Spinella F Franchi G Attanasi F Moehrs S Rosso V Santos Aand Del Guerra A 2011a Reprogrammable acquisition architecture for dedicated positron emissiontomography IEEE Trans Nucl Sci 58 695ndash702
Sportelli G Ortuno J Vaquero J Desco M and Santos A 2013 Massively parallelizable list-modereconstruction using a Monte Carlo-based elliptical Gaussian model Med Phys 40 012504
Sportelli G et al 2012 Full in-beam PET measurements of 62 MeV protons onto a PMMA target NuclInstrum Methods A 718 151ndash3
Surti S Zou W Daube-Witherspoon M McDonough J and Karp J 2011 Design study of an in situ PETscanner for use in proton beam therapy Phys Med Biol 56 2667ndash85
Tashima H Yamaya T Yoshida E Kinouchi S Watanabe M and Tanaka E 2012 A single-ring OpenPETenabling PET imaging during radiotherapy Phys Med Biol 57 4705ndash18
Vecchio S et al 2009 A PET prototype for in-beam monitoring of proton therapy IEEE Trans NuclSci 56 51ndash56
60