Embed Size (px)
Citation preview
Sustainable Streets Index 2011
First Avenue / Second Avenue Select Bus Service
51Sustainable Streets Index 2011
Purpose
• Improve the speed and reliability of bus service• Improve pedestrian safety• Expand bicycle lane network• Maintain traffic speeds and curb access
Outreach
• DOT and New York City Transit (NYCT) convened a Community Advisory Committee (CAC) comprised of key stakeholders along the corridor including Community Board members, which met six times between May 2009 and April 2011
• DOT and NYCT met two or more times with the Transportation Committees of Manhattan Community Boards 1,3,6,8 and 11 (CBs) to present project plans and to address questions and concerns from November 2009 to September 2010
• DOT and NYCT modified plans based on community input and received support for the final plan
• DOT and NYCT held two public open houses in March 2010 and two more in September 2010 to solicit input from the community and stakeholders
Approach
• Installed a combination of curbside and offset bus lanes from Houston Street to 125th Street on First Avenue and Second Avenue (except within Second Avenue Subway construction zone from 68th Street to 101st Street)
• Installed pedestrian refuge islands next to protected bicycle paths
• Installed first phase of protected bicycle paths on First Avenue and Second Avenue between Houston Street and 34th Street
• Implemented midday delivery windows on blocks with curbside bus lane
• Installed bus shelters where feasible at Select Bus Service (SBS) stations
Results
• Improved travel time for the M15 service by 15-18% • Increased ridership on the M15 by 12%• 37% reduction in pedestrian crashes involving injuries
along First Avenue from 1st Street to 34th Street; 27% reduction for motor vehicle occupants involving injuries and 22% reduction in total crashes involving injuries on the same segment of First Avenue
• Increased cycling volumes by 18-177% in areas where bicycle lanes were upgraded
BQE
31 AV
21 ST
8 AV9 AV
MYRTLE AV31
ST
MA
DIS
ON
AV
37 S
T
35 ST
7 AV
32 AV
37 AV
1 AV
58
ST
23 S
T
30 AV
AM
STER
DA
M A
V
34 AV
35 AV
92 ST
33 S
T
F D
R D
R
20 AV
34 ST
11 A
V
21 AV
36
ST
FLUSHING AV
38 S
T
76 ST
65
PL
81 ST88 ST
73 ST
85 ST
GATES AV
41 ST
42 S
T30 S
T
AV C
43 S
T
44
ST
EA
ST
DR
32 S
T
84 ST
45 ST
WES
T D
R
46 S
T
5 AV
BUSHWICK AV3
9 S
T
WE
ST S
T
BRO
AD
WAY
90 ST10 S
T
KENT AV
48 S
T
98 ST
ELIOT AV
YORK
AV 96 ST
E 138 ST
E 149 ST
HEN
RY H
UD
SO
N P
KWY
23 AV
WES
T EN
D A
V
LEN
OX
AV
E 10 ST
NO NAM
E
CYPRESS AV
57 AV
BRO
OK
AV
25 AV
11 S
T
CO
LUM
BUS
AV
24 S
T
MA
NH
ATTAN
AV
E 4 ST LOR
IMER
ST
12 S
T
27 ST
GRAND ST
29
STW 30 ST
IRVING AV
W 42 ST
W 57 ST
19 AV
WILSON AV
W 26 ST
94 ST
W 46 ST
W 51 ST
DRIGGS A
V
LEONARD ST
DE KALB AV
E 141 ST
HU
MBO
LDT ST
PALMETTO ST
40
ST
MO
RGAN AV
VE
RN
ON
BLV
D
TRIBORO PLZ
E 83 ST
57
ST
CEN
TRA
L PA
RK W
56 RD
62
ST
W 23 ST
80 ST
E 90 ST
E 79 ST
E 86 ST
E 75 ST
W 19 ST
E 71 ST
HA
RLE
M R
IVE
R D
R
ST
NIC
HO
LAS
AV
BQE W
56 DR
E 23 STW 15 ST
E 161 ST
STARR S
T
E 63 ST
60 PL
BQE
E
DECAT
UR ST
UN
ION
AV
E 59 ST
E 132 ST
E 56 ST
E 14 ST
65 ST
E 119 ST
E 67 ST
69 LA
BRUCKNER EXW
Y
E 30 ST
27 AV
E 52 ST
MAI
N ST
S 2 STBO
WE
RY
32
PL
W 123 ST
W 12 ST
E 34 ST
LEE AV
E 38 ST
E 42 ST
68 AV
CANAL ST
AV A
E 163 ST
E 96 ST
E 111 ST
49
ST
E 106 ST
50 AV
JOHNSON AV
E 46 ST
E 18 ST
31 DR
49 AV
80 AV
MAN
IDA ST
30 RD
46 AV7
AV S NASSAU AV
E 125 ST
45 AV
W 70 ST
70 ST
S 4 ST
2 S
T
72 ST
W 66 ST
E 115 ST
W 118 ST
S 5 ST
RIK
ERS
IS B
R
51
ST
AV F
MER
CER
ST
W 115 ST
72
PL
64 ST
E 99 ST
70 AV
55 AV
60 ST
W 111 ST
JAY ST
12 A
V
43 AV
EAST RD
54 RD
59 S
T
FRONT ST
68 ST
RUST ST
MADISON ST
69 ST
59 RD
51 AV
10 A
V
63
ST
JOHN ST
1 S
T
E 153 ST
5 ST
54
ST
47
ST
CLAY ST
WARREN ST75 AV
42 RD
E 134 ST
55 ST
JUDGE ST
WALL ST
GREENE AVLO
CUST AV
56 ST
61 ST
NO
LL S
T
62 AV
71 ST
KAY AV
W 61 ST
66 ST
67 ST76 ST
KEN
T AV
5 AV
F D
R D
R
F D
R D
R2 S
T
F D R DR
70
ST
BQE
43
ST
LEONARD ST
BQE
WEST ST
63
ST29
ST
5 AV
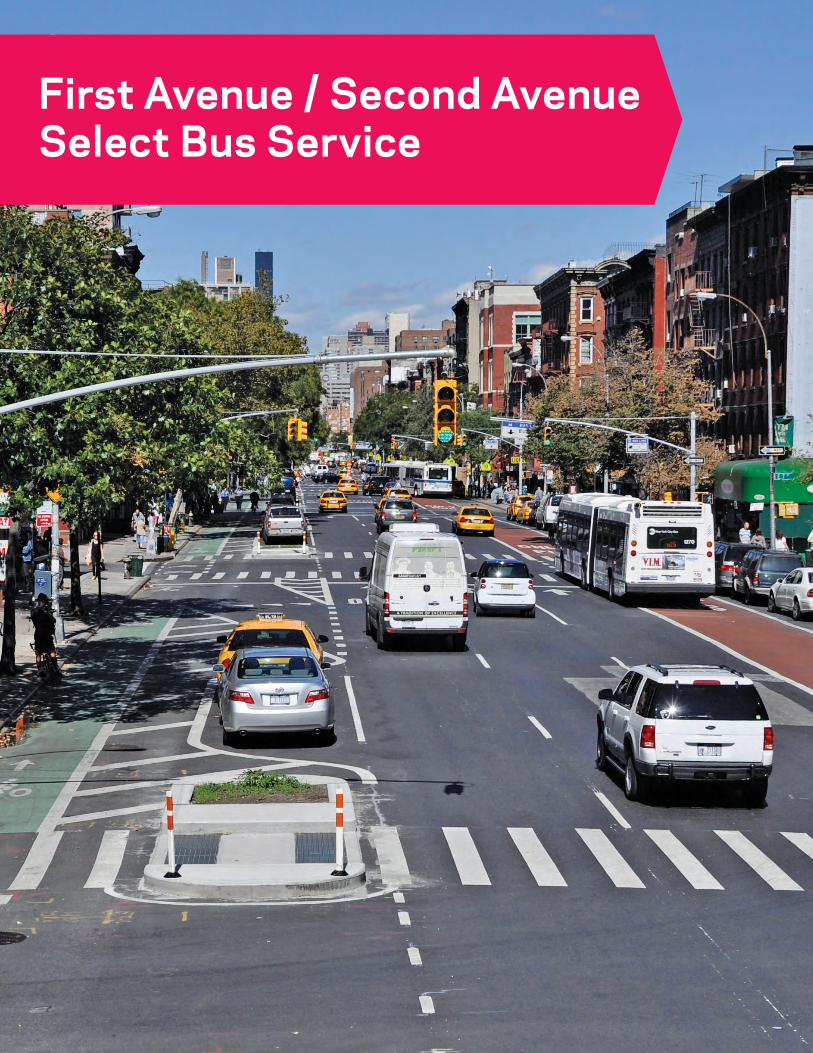
First and Second Avenues are major north-south corridors in Manhattan, several blocks from the nearest subway. There are numerous distinct districts along these avenues from the East Village to East Harlem, including high-density office-retail uses in East Midtown, a major hospital corridor in Kips Bay, and mixed-use retail-residential uses in the East Village, Turtle Bay, the Upper East Side and East Harlem.
Area of detail
Manhattan
1 Mile
52 Sustainable Streets Index 2011
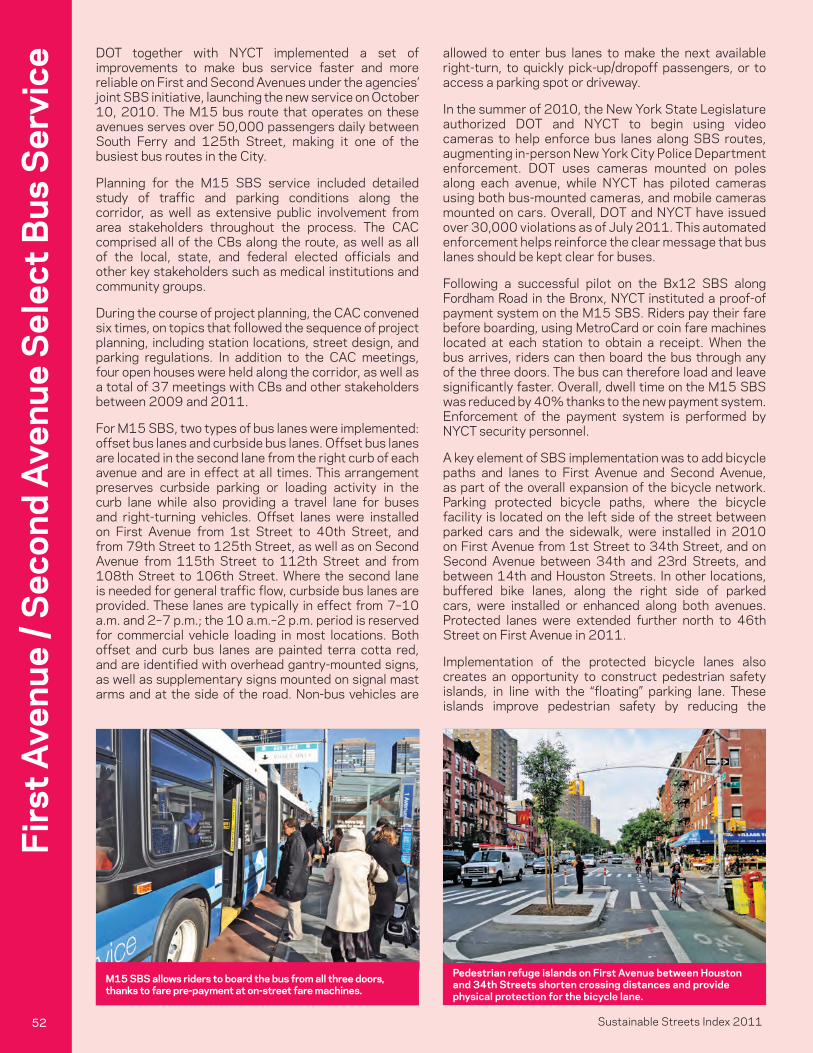
Pedestrian refuge islands on First Avenue between Houston and 34th Streets shorten crossing distances and provide physical protection for the bicycle lane.
Firs
t Ave
nue
/ Sec
ond
Ave
nue
Sel
ect B
us S
ervi
ceDOT together with NYCT implemented a set of improvements to make bus service faster and more reliable on First and Second Avenues under the agencies’ joint SBS initiative, launching the new service on October 10, 2010. The M15 bus route that operates on these avenues serves over 50,000 passengers daily between South Ferry and 125th Street, making it one of the busiest bus routes in the City.
Planning for the M15 SBS service included detailed study of traffic and parking conditions along the corridor, as well as extensive public involvement from area stakeholders throughout the process. The CAC comprised all of the CBs along the route, as well as all of the local, state, and federal elected officials and other key stakeholders such as medical institutions and community groups.
During the course of project planning, the CAC convened six times, on topics that followed the sequence of project planning, including station locations, street design, and parking regulations. In addition to the CAC meetings, four open houses were held along the corridor, as well as a total of 37 meetings with CBs and other stakeholders between 2009 and 2011.
For M15 SBS, two types of bus lanes were implemented: offset bus lanes and curbside bus lanes. Offset bus lanes are located in the second lane from the right curb of each avenue and are in effect at all times. This arrangement preserves curbside parking or loading activity in the curb lane while also providing a travel lane for buses and right-turning vehicles. Offset lanes were installed on First Avenue from 1st Street to 40th Street, and from 79th Street to 125th Street, as well as on Second Avenue from 115th Street to 112th Street and from 108th Street to 106th Street. Where the second lane is needed for general traffic flow, curbside bus lanes are provided. These lanes are typically in effect from 7–10 a.m. and 2–7 p.m.; the 10 a.m.–2 p.m. period is reserved for commercial vehicle loading in most locations. Both offset and curb bus lanes are painted terra cotta red, and are identified with overhead gantry-mounted signs, as well as supplementary signs mounted on signal mast arms and at the side of the road. Non-bus vehicles are
allowed to enter bus lanes to make the next available right-turn, to quickly pick-up/dropoff passengers, or to access a parking spot or driveway.
In the summer of 2010, the New York State Legislature authorized DOT and NYCT to begin using video cameras to help enforce bus lanes along SBS routes, augmenting in-person New York City Police Department enforcement. DOT uses cameras mounted on poles along each avenue, while NYCT has piloted cameras using both bus-mounted cameras, and mobile cameras mounted on cars. Overall, DOT and NYCT have issued over 30,000 violations as of July 2011. This automated enforcement helps reinforce the clear message that bus lanes should be kept clear for buses.
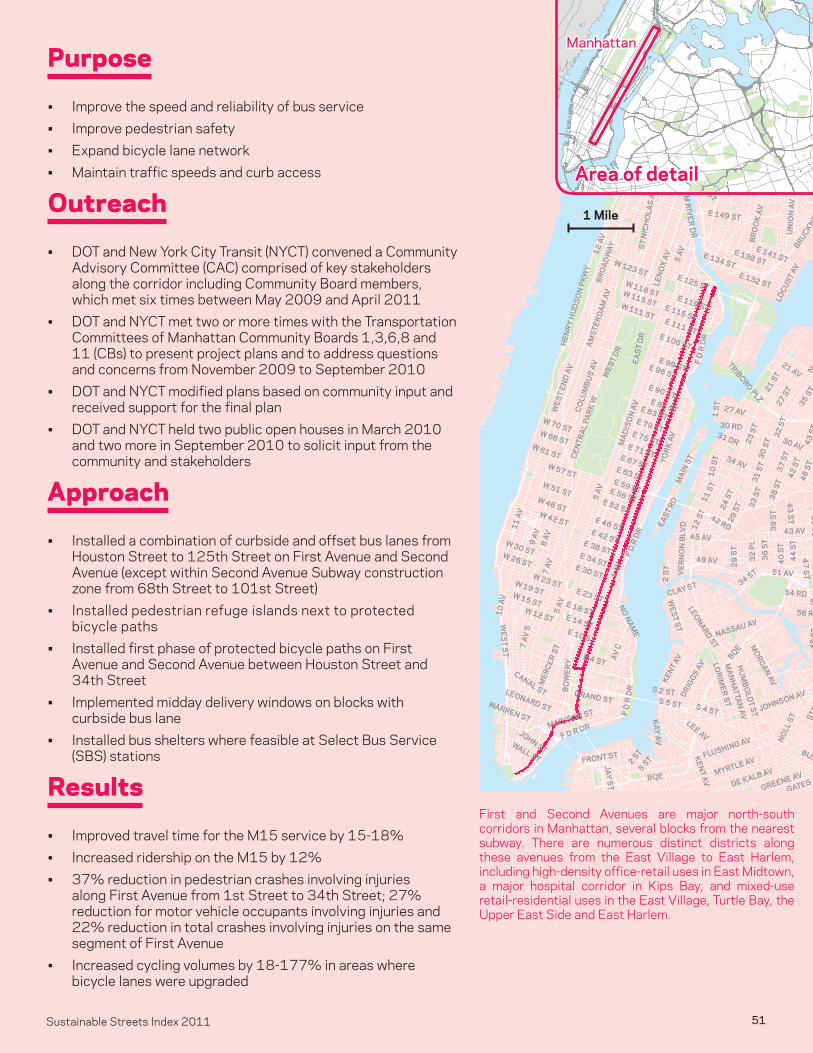
Following a successful pilot on the Bx12 SBS along Fordham Road in the Bronx, NYCT instituted a proof-of payment system on the M15 SBS. Riders pay their fare before boarding, using MetroCard or coin fare machines located at each station to obtain a receipt. When the bus arrives, riders can then board the bus through any of the three doors. The bus can therefore load and leave significantly faster. Overall, dwell time on the M15 SBS was reduced by 40% thanks to the new payment system. Enforcement of the payment system is performed by NYCT security personnel.
A key element of SBS implementation was to add bicycle paths and lanes to First Avenue and Second Avenue, as part of the overall expansion of the bicycle network. Parking protected bicycle paths, where the bicycle facility is located on the left side of the street between parked cars and the sidewalk, were installed in 2010 on First Avenue from 1st Street to 34th Street, and on Second Avenue between 34th and 23rd Streets, and between 14th and Houston Streets. In other locations, buffered bike lanes, along the right side of parked cars, were installed or enhanced along both avenues. Protected lanes were extended further north to 46th Street on First Avenue in 2011.
Implementation of the protected bicycle lanes also creates an opportunity to construct pedestrian safety islands, in line with the “floating” parking lane. These islands improve pedestrian safety by reducing the
M15 SBS allows riders to board the bus from all three doors, thanks to fare pre-payment at on-street fare machines.
53Sustainable Streets Index 2011
crossing distance of these wide avenues, and also create a location to plant trees. Pedestrian islands were constructed at selected intersections on First Avenue from Houston Street to 34th Street, and on Second Avenue from 34th Street to 23rd Street.
Over the first several months of M15 SBS service, ridership steadily increased. Overall M15 ridership was nearly 12% higher in July 2011 compared to July 2010. For March to July 2011, M15 SBS weekday ridership was 42% higher than on the previous Limited service a year previous. By comparison, overall Manhattan bus ridership declined 5-8% in this period.
The SBS service operates 15% faster than the M15 Limited service it replaced, reducing a one-way trip from about 81 minutes on the Limited to about 69 minutes on the SBS (average of northbound and southbound trips). During the peaks, when boardings are heavier and all bus lanes are in effect, the travel time savings are approximately 18%. The improved and extended bus lanes help to reduce in-motion time by nearly five minutes per trip. Likewise, off-board fare collection helps to save almost seven minutes per trip. It is anticipated that the rollout of Transit Signal Priority in 2012 will contribute to reductions in time spent at red lights as well.
Taxi Global Positioning System data from November 2009 and November 2010 showed minimal change in traffic speeds on First and Second Avenues. Traffic counts showed little significant change in traffic levels at most intersections. Traffic flow was maintained due to better traffic organization, including reducing illegal parking, and providing turn lanes in the bus and bike lane designs.
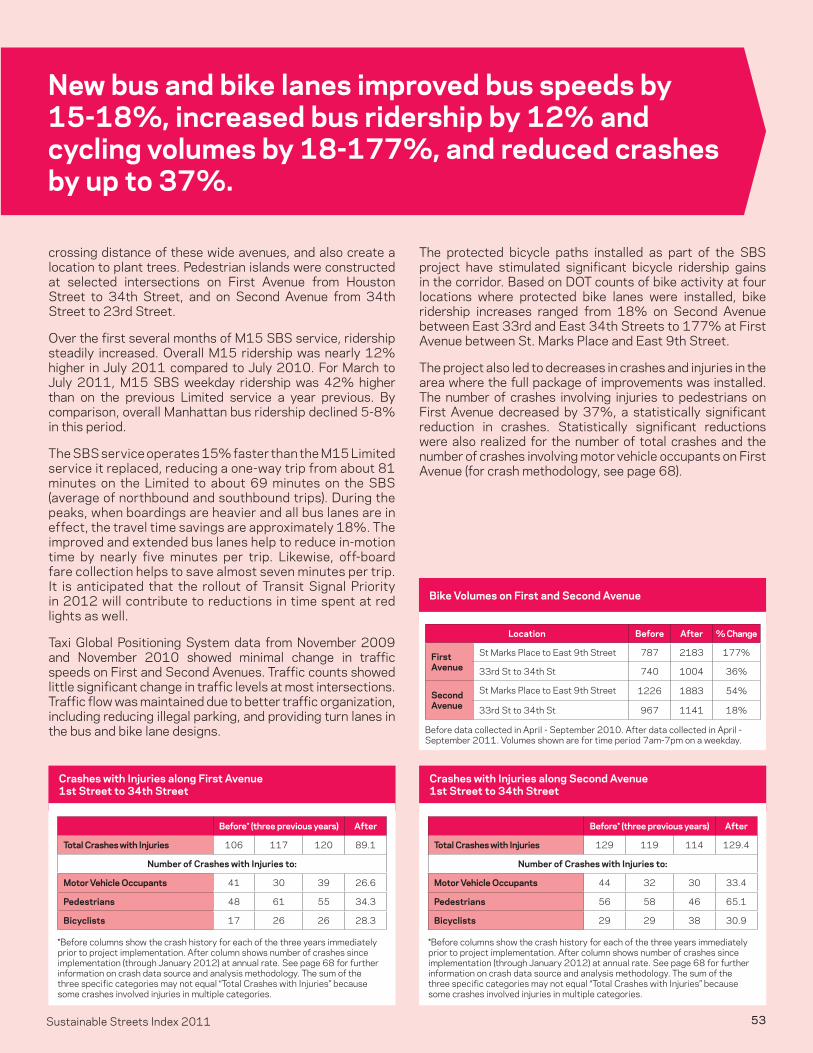
The protected bicycle paths installed as part of the SBS project have stimulated significant bicycle ridership gains in the corridor. Based on DOT counts of bike activity at four locations where protected bike lanes were installed, bike ridership increases ranged from 18% on Second Avenue between East 33rd and East 34th Streets to 177% at First Avenue between St. Marks Place and East 9th Street.
The project also led to decreases in crashes and injuries in the area where the full package of improvements was installed. The number of crashes involving injuries to pedestrians on First Avenue decreased by 37%, a statistically significant reduction in crashes. Statistically significant reductions were also realized for the number of total crashes and the number of crashes involving motor vehicle occupants on First Avenue (for crash methodology, see page 68).
New bus and bike lanes improved bus speeds by 15-18%, increased bus ridership by 12% and cycling volumes by 18-177%, and reduced crashes by up to 37%.
Crashes with Injuries along Second Avenue1st Street to 34th Street
Before* (three previous years) After
Total Crashes with Injuries 129 119 114 129.4
Number of Crashes with Injuries to:
Motor Vehicle Occupants 44 32 30 33.4
Pedestrians 56 58 46 65.1
Bicyclists 29 29 38 30.9
*Before columns show the crash history for each of the three years immediately prior to project implementation. After column shows number of crashes since implementation (through January 2012) at annual rate. See page 68 for further information on crash data source and analysis methodology. The sum of the three specific categories may not equal “Total Crashes with Injuries” because some crashes involved injuries in multiple categories.
Bike Volumes on First and Second Avenue
Location Before After % Change
First Avenue
St Marks Place to East 9th Street 787 2183 177%
33rd St to 34th St 740 1004 36%
Second Avenue
St Marks Place to East 9th Street 1226 1883 54%
33rd St to 34th St 967 1141 18%
Before data collected in April - September 2010. After data collected in April - September 2011. Volumes shown are for time period 7am-7pm on a weekday.
Crashes with Injuries along First Avenue1st Street to 34th Street
Before* (three previous years) After
Total Crashes with Injuries 106 117 120 89.1
Number of Crashes with Injuries to:
Motor Vehicle Occupants 41 30 39 26.6
Pedestrians 48 61 55 34.3
Bicyclists 17 26 26 28.3
*Before columns show the crash history for each of the three years immediately prior to project implementation. After column shows number of crashes since implementation (through January 2012) at annual rate. See page 68 for further information on crash data source and analysis methodology. The sum of the three specific categories may not equal “Total Crashes with Injuries” because some crashes involved injuries in multiple categories.