Embed Size (px)
Citation preview

First Albany CapitalAnnual Growth ConferenceDecember 8, 2004

1
Certain statements contained in this presentation are forward-looking statements. These forward-looking
statements are based upon our current expectations about future events. When used in this presentation, the
words "believe," "anticipate," "intend," "estimate," "expect," “will,” “should,” “may,” and similar expressions, or the
negative of such words and expressions, are intended to identify forward-looking statements, although not all
forward-looking statements contain such words or expressions. These forward-looking statements generally
relate to our plans, objectives and expectations for future operations and are based upon management’s current
estimates and projections of future results or trends. However, these statements are subject to a number of risks
and uncertainties affecting our business. You should read this presentation completely and with the
understanding that actual future results may be materially different from what we expect as a result of these risks
and uncertainties and other factors, which include, but are not limited to: (1) technological, structural and cyclical
changes that could reduce the demand for the services we provide; (2) loss of key customers; (3) the uncertainty
of the outcome of federal energy legislation; (4) the nature of our contracts, particularly our fixed-price contracts;
(5) work hindrance due to inclement weather events; (6) the award of new contracts and the timing of the
performance of those contracts; (7) project delays or cancellations; (8) the failure to meet schedule or
performance requirements of our contracts; (9) the presence of competitors with greater financial resources and
the impact of competitive products, services and pricing; (10) successful integration of the acquisitions into our
business; (11) close out of certain of our projects may or may not occur as anticipated or may be unfavorable to
us; and (12) other factors detailed from time to time in our other reports and filings with the Securities and
Exchange Commission, including the discussion under the heading "Risk Factors" in our Registration Statement
on Form S-1 relating to our initial public offering. Except as required by law, we do not intend to update forward-
looking statements even though our situation may change in the future.
Forward-Looking Statements

2
Introduction to InfraSource
3
Leadership in Infrastructure Services
Vision:
“InfraSource will be the recognized national leader in providing infrastructure services to utility and industrial companies.”
We are leaders in our markets
Favorable trends imply substantial growth opportunities
IFS is well positioned as beneficiary

4
Comprehensive Service Offering
Leading provider of design, engineering and construction services for electric power, natural gas and telecommunications infrastructure
2003 Revenue By End MarketElectric Power
� Transmission lines
� Substations
� Distribution lines
� Industrial services
Natural Gas
� Distribution lines
� Transmission facilities
Telecommunications
� Point-to-point fiber connections in select regional markets
Note: Includes Maslonka in both periods.
Natural Gas28%
Telecom11%
Other3%
Electric Power58%
YTD Sept 2004 Revenue By End Market
Natural Gas31%
Telecom8%
Other3%
Electric Power58%
5
$0
$2,000
$4,000
$6,000
$8,000
$10,000
$12,000
1949 1962 1975 1988 2001
Tran
smis
sion
Con
stru
ctio
n S
pend
ing
(in r
eal 2
003
$'s
in m
illio
ns)
0
200
400
600
800
1,000
1,200
Electricity G
eneration Capacity
(in MW
)
Construction Spending Electricity Generation Capacity
0
500
1,000
1,500
2,000
2,500
1998 1999 2000 2001 2002 2003
Num
ber
of T
LRs
Leve
l 2 o
r H
ighe
r
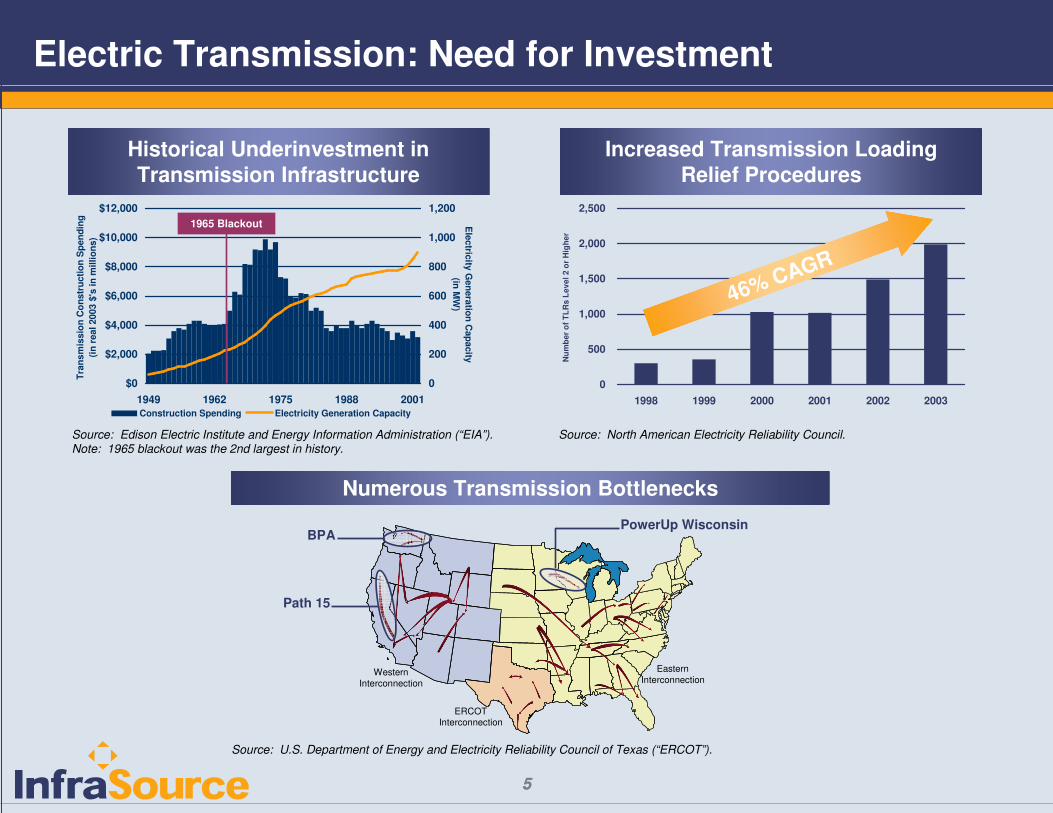
Source: Edison Electric Institute and Energy Information Administration (“EIA”).Note: 1965 blackout was the 2nd largest in history.
Source: North American Electricity Reliability Council.
Source: U.S. Department of Energy and Electricity Reliability Council of Texas (“ERCOT”).
Electric Transmission: Need for Investment
Historical Underinvestment inTransmission Infrastructure
Increased Transmission LoadingRelief Procedures
Numerous Transmission Bottlenecks
1965 Blackout
46% CAGR
5
Path 15
BPAPowerUp Wisconsin
Western Interconnection
ERCOT Interconnection
Eastern Interconnection

6
$3.5
$5.5
$10.0
$0.0
$2.0
$4.0
$6.0
$8.0
$10.0
$12.0
Status Quo Keeping Up Significant Upgrades
An
nu
al T
ran
smis
sio
n S
pen
din
g
Current and Projected Electric Transmission Spending
� Energy Bill not required
� Addressing critical situations
� Backlog of projects is considerable in all regions
� Project planning and approval cycles take time
� Would result in ~ 1% increase in rates
_________________________________________Source: Wall Street research
Materials49%
Internal Labor13%
O utsourced Labor38%
Typical Transmission Spending Breakdown$2 B/yr Increase Likely
($ in billions) Estimates of required incrementalinvestment range from $36B to $100B
Transmission Spending

7
� Utility commissions traditionally regulate rates (bundled)
� Typical ROI 9.5% to 11%
States
� FERC can grant rates for transmission
� Typically less controversial proceedings than with States
� Typical ROI 13%
Federal
� Recently emerging trend:
� Merchant propositions
� Project financing
� Lease-purchase arrangements
Private
Emerging Transmission Funding
� PJM
� NJ utilities expenditure commitments due to reliability issues
� ERCOT (Texas)
� Constraint areas identified
� Multiple relief projects identified in each area
� Rate-making process established
� New England
� 22 near-term projects
� FERC approved regional cost sharing
� $1.4B investment over 5 years
� NU spending of $200m/year on transmission
� Wisconsin
� $2.8B spending over 10 years
� Filed for FERC rate making
� PJM
� Seeking market-based solutions for 30 grid constraints
� Will order utility action if there is no market response
� PMAs
� WAPA, BPA using private financing on recent large projects
Transmission Spending

8
Major Transmission Project Update – 3rd Quarter 2004
Path 15 (WAPA, California):
� Project is complete
� Line turned over to WAPA and testing is in progress
Schultz-Wautoma (BPA, Washington):
� Project is well underway and progressing nicely
Power Up Wisconsin (ATC):
� Work being released in segments
� Substantial mobilization at the end of 3rd quarter on first segment
� Project is progressing; some segments proceeding slowly due to permitting

9
Positioned to Capture Growth in Electric T&D Spending
Electric Transmission/Substation Focus InfraSource Footprint
Focused on specialized, high-margin services for key customers across a broad geographic footprint
Generating Station
InfraSource Primary Focus
InfraSource Capabilities
Substation Step-Up
Transformer
Transmission Line
Transmission Line
Transmission Customer
Substation Step-Down Transformer
Distribution Line
End User
End User
10
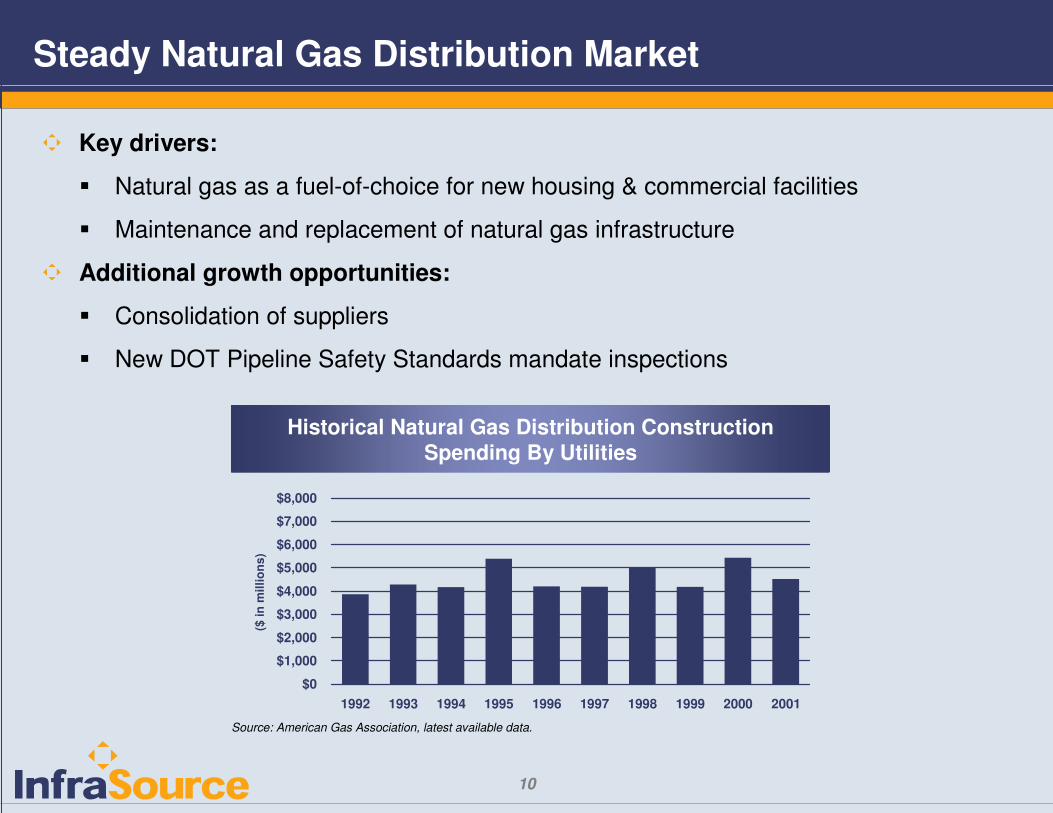
Key drivers:
� Natural gas as a fuel-of-choice for new housing & commercial facilities
� Maintenance and replacement of natural gas infrastructure
Additional growth opportunities:
� Consolidation of suppliers
� New DOT Pipeline Safety Standards mandate inspections
Historical Natural Gas Distribution Construction Spending By Utilities
Source: American Gas Association, latest available data.
Steady Natural Gas Distribution Market
$0
$1,000
$2,000
$3,000
$4,000
$5,000
$6,000
$7,000
$8,000
1992 1993 1994 1995 1996 1997 1998 1999 2000 2001
($ in
mill
ions
)

11
Leader in Natural Gas Distribution Services
Natural Gas Distribution Focus InfraSource Footprint
Leading natural gas distribution contractor with comprehensive capabilities across a broad geographic footprint
InfraSource Capabilities
City Gate
GateStation
Substation
Substation
InfraSource Primary Focus

12
Strategic Acquisitions
Recent acquisitions:� Acquisition of substantially all the assets and certain liabilities of EnStructure and Utili-Trax
EnStructure, construction services business of SEMCO (NYSE:SEN):� Cash purchase price: $21.3 million� Utility, oil & gas customers in Midwest, South and Southeast� $75 million revenues in 2003� Closing: September 3, 2004
Utili-Trax, construction business of Connexus Energy:� Cash purchase price: $5.3 million� Electric and gas cooperative and municipal utility customers throughout the Midwest� $10 million revenues in 2003� Closing: August 18, 2004
Strategic benefits:� Customer base consolidation in Midwest, including SEMCO and Connexus� Additional geographic reach into South and Southeast� Expanded portfolio of service offerings
Expect positive contribution in 4Q04; integration is progressing smoothly

13
Attractive Telecommunications Niche
Profitable business model with strong cash flows
� Engineering, construction and leasing of point-to-point fiber connections
� Long-term lease contracts
� Virtually no maintenance capex requirements
Key customers include:
14
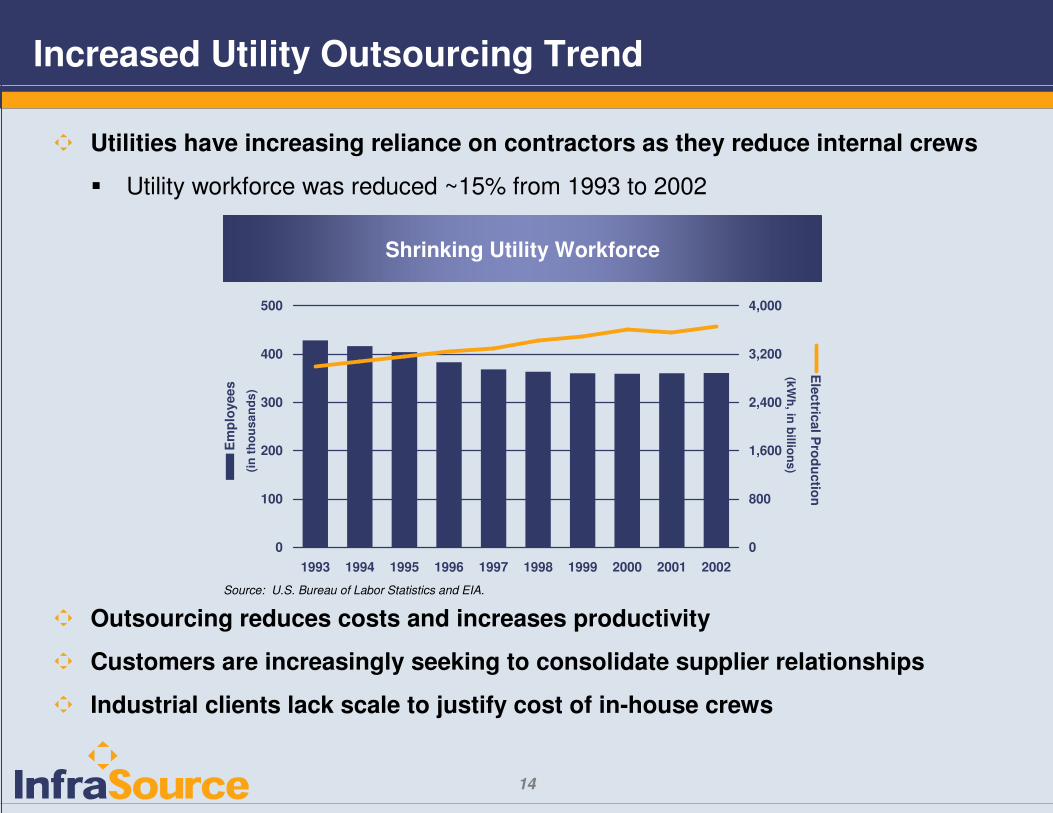
Utilities have increasing reliance on contractors as they reduce internal crews
� Utility workforce was reduced ~15% from 1993 to 2002
Outsourcing reduces costs and increases productivity
Customers are increasingly seeking to consolidate supplier relationships
Industrial clients lack scale to justify cost of in-house crews
Increased Utility Outsourcing Trend
Source: U.S. Bureau of Labor Statistics and EIA.
Shrinking Utility Workforce
0
100
200
300
400
500
1993 1994 1995 1996 1997 1998 1999 2000 2001 2002
(in th
ousa
nds)
0
800
1,600
2,400
3,200
4,000
(kWh, in billions)
Electrical P
roductionE
mpl
oyee
s

15
End Market Update – 3rd Quarter 2004
Electric Power:
� Backlog is up 95% or $188 million in 3Q04 versus 3Q03 and up 30% or $88 million versus 2Q04
� Approximately $28 million of the increase versus 2Q04 is due to recent acquisitions
� Awarded three new transmission orders in 3Q04 totaling $23 million
� Continued opportunities in transmission work with key customers on a regional basis
� Sizable increase in backlog of distribution work with awards of $23 million by strategic customers
� Tracking large transmission project opportunities but do not foresee contribution in 1H 2005
Natural Gas:
� Backlog is up 61% or $167 million in 3Q04 versus 3Q03 and up 8% or $34 million versus 2Q04
� Includes $79 million from EnStructure acquisition and represents addition of multi-year blankets
� Addition of these contracts offset the normal seasonal decline in backlog
Telecommunications:
� Backlog is up 42% or $44 million in 3Q04 versus 3Q03 and flat versus 2Q04
� Business is steady and we continue to evaluate and pursue new market opportunities

16
Martin Maslonka19 Years
Paul Daily16 Years
Steve Reiten30 Years
Henry Jackson33 Years
Larry Coleman15 Years
CFOTerence Montgomery
18 Years
Key Subsidiary Presidents
Talented and experienced management team extending deep into theorganization
Average 24 years of industry experience
Experienced Management Team
CEODavid Helwig
30 Years
Sr. VP – Strategic SalesHomer Purcell
30 Years

17
Financial Overview

18
Attractive Financial Model
Positive revenue and earnings momentum:
� Increased backlog and heightened bidding activity
Focus on value added, high margin work
Strong balance sheet with conservative leverage:
� Substantial bonding capacity
� Good liquidity and modest working capital requirements
Balanced approach to use of cash:
� Working capital for growth
� Debt repayment
� Strategic acquisition opportunities

19
Strong Balance Sheet
Note:1. Approximately $30 million of revolver capacity is expected to be used for letters of credit.
3/31/04(Pre-IPO)
6/30/04(Post-IPO)
9/30/04(Post-IPO)
($ in millions)
Cash 16.1$ 19.3$ 6.7$
Debt:Revolver ($85 million) (1) 5.0 - 4.0 Term Loan 139.4 85.1 84.9 Exelon Note 25.2 - - Other Debt 1.1 1.1 1.1
Total Debt 170.7$ 86.2$ 90.0$
Shareholders Equity 172.5 271.3 276.9
Total Capitalization 343.2$ 357.5$ 366.9$
Debt / Equity 99% 32% 33%

20
Reconciliation of Non-GAAP Financial Measures
Adjustment of GAAP measures is beneficial in understanding operating performance without the effect of unusual items including:
� Changes in accounting principle pursuant to SFAS 142
� Discontinued operations
� Amortization of intangibles pursuant to SFAS 141
� Transaction expenses related to the IPO and purchase from Exelon and acquisitions
� Loss on early extinguishment of debt
� Non-recurring gains
Note: see slide 30 for reconciliation of Net Income to EBITDA and EBITDA as Adjusted
($ in millions) 2001 2002 2003 LTM 9/30/04
Revenue 609.3$ 566.5$ 520.6$ 594.5$
Net Income (loss) - GAAP (6.0)$ (175.4)$ (22.2)$ 5.4$
EBITDA 56.5$ 73.2$ 18.1$ 56.6$
EBITDA as Adjusted 52.3$ 67.6$ 46.7$ 68.5$

21
11.5%
9.0%
11.9%
8.6%
$0
$100
$200
$300
$400
$500
$600
$700
2001 2002 2003 LTM0%
3%
6%
9%
12%
15%
18%
21%
Strong Historical Performance
Historical Revenue and EBITDA As Adjusted Margin
Growing core electric power businessPlanned exit from select natural gas contracts with lower margins$75 million decline in telecommunications E&C revenue; minimal exposure in future2002 margin expansion due to increased mix of higher margin IPP work
Rev
enue
($ in
mill
ions
)
EB
ITDA
As A
djusted Margin
$609$566
$521$595
Electric Power Other Natural Gas Telecom
EBITDA margin from continuing operations, before extraordinary items and cumulative effect of a change in accounting principle, net of tax as adjusted
Please refer to our prospectus filed on May 6, 2004 and Form 10-Q filed on November 15, 2004 with the Securities and Exchange Commission for the Company’s financial statements for the periods indicated above.

22
$129
$166
$0
$50
$100
$150
$200
$250
9/23/2003 9/30/2004
($ in
mill
ions
)
Total Backlog
Backlog includes:� Project Work: Signed contracts with authorization to proceed� Master Service Agreements (“MSAs”): Estimate of work to be performed; often 2-3 year terms� Telecommunications Lease Agreements: Signed contracts; typically 5+ years
Backlog is up 69%
Remaining Fiscal Year Backlog
Note: Includes Maslonka in all periods.
$587
$791
$992
$0
$100
$200
$300
$400
$500
$600
$700
$800
$900
$1,000
9/23/2003 12/31/2003 9/30/2004($
in m
illio
ns)
69% Increase
29% Increase

23
10.9%
7.3%
$0
$50
$100
$150
$200
$250
$300
$350
$400
$450
$500
9 Mos. 2003 9 Mos. 20040%
3%
6%
9%
12%
15%
18%
21%
YTD September 2004 Performance
Historical Revenue and EBITDA As Adjusted Margin
Increase primarily attributable to: � Additional aerial transmission work including the acquisition of Maslonka & Associates� Underground natural gas work� Offset by declines in other electric and telecommunications work
Rev
enue
($ in
mill
ions
)E
BITD
A A
s Adjusted M
argin
$383
$457
Please refer to our Form 10-Q filed on November 15, 2004 with the Securities and Exchange Commission for the Company’s financial statements for the periods indicated above.
Electric Power Other Natural Gas Telecom
EBITDA margin from continuing operations, before extraordinary items and cumulative effect of a change in accounting principle, net of tax as adjusted

24
4th Quarter 2004 Guidance
Revenues will be 5-7% higher due to effect of recent acquisitions, partially offset by the seasonal nature of our business
Gross margin percentage is expected to increase somewhat as a result of contribution from settlement of several open contract claims:
� Timing of settlements is such that we may not be able to recognize this revenue until 2005 which would result in gross margin percentage lower than the 3rd Quarter if that occurs
SG&A expenses will increase slightly due to our 3rd Quarter acquisitions
Depreciation will increase by approximately 15% due to the acquisitions
Amortization of intangibles assets is expected to be approximately $2.1 million, reflecting continued reduction in acquired backlog
Interest expense will be approximately the same as in the 3rd Quarter:
� Additional benefit of ~$1 million in interest forgiveness from early retirement of the Exelon note

25
Sell Side Coverage
Firm Analyst
D.A. Davidson & Co. John Rogers
First Albany Capital Sanjay Shrestha
Friedman, Billings & Ramsay* Alex Rygiel
Lehman Brothers Tom Ford
Merrill Lynch Lorraine Maikis
Sidoti & Co. Rich Wesolowski
Stifel, Nicolaus & Co. Jeffrey Beach
* - Expected December 2004
26
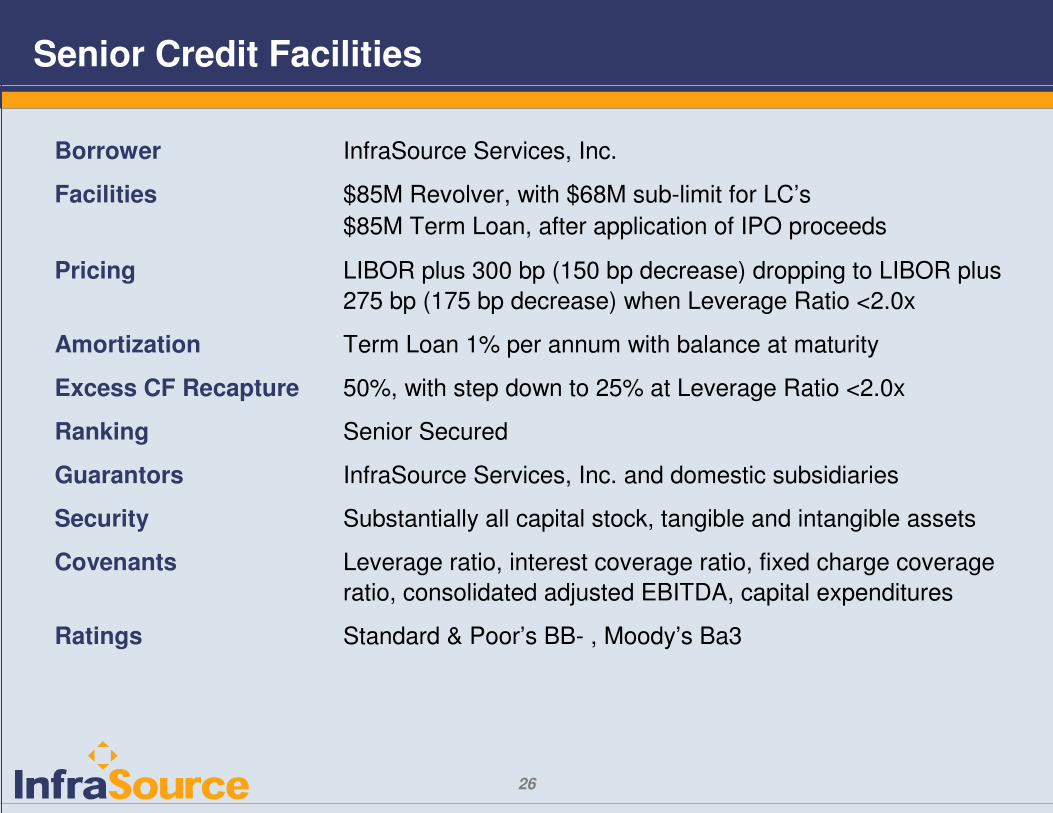
Senior Credit Facilities
Leverage ratio, interest coverage ratio, fixed charge coverage ratio, consolidated adjusted EBITDA, capital expenditures
Covenants
Standard & Poor’s BB- , Moody’s Ba3Ratings
50%, with step down to 25% at Leverage Ratio <2.0xExcess CF Recapture
Term Loan 1% per annum with balance at maturityAmortization
Substantially all capital stock, tangible and intangible assetsSecurity
InfraSource Services, Inc. and domestic subsidiariesGuarantors
Senior SecuredRanking
LIBOR plus 300 bp (150 bp decrease) dropping to LIBOR plus 275 bp (175 bp decrease) when Leverage Ratio <2.0x
Pricing
$85M Revolver, with $68M sub-limit for LC’s$85M Term Loan, after application of IPO proceeds
Facilities
InfraSource Services, Inc.Borrower

27
Leadership in Infrastructure Services
Market leader
� Strong complementary subsidiaries in fragmented markets
� Operational excellence
� Comprehensive capabilities
� Financial strength
� Exceptional safety performance
Growth opportunities
� Upgrade of T&D infrastructure
� Recovery in utility spending
� Trend toward increased outsourcing
� Leverage integrated capabilities to gain market share
� Selective strategic acquisitions

28
Compelling Growth Opportunity
LeadershipPosition
Attractive EndMarkets
Unique GrowthOpportunity

29
Appendices

30
For the For the Period For the PeriodYear Ended January 1 to January 1 to
December 31, September 23, September 23,2001 2002 2003 2003
(in millions)
(Predecessor entity - InfraSource
Incorporated and Subsidiaries)
(Predecessor entity - InfraSource
Incorporated and Subsidiaries)
(Predecessor entity - InfraSource
Incorporated and Subsidiaries)
For the Period May 30 to
December 31, 2003
(Predecessor entity - InfraSource
Incorporated and Subsidiaries)
Nine Months Ended September
30, 2004
Net income (loss) (6.0)$ (175.4)$ (23.5)$ 1.3$ (23.5)$ 4.1$
Cumulative effect of a change in accounting principle, net of tax - 204.1 - - - -
Extraordinary item, net of tax - - - (0.1) - -
Loss (income) on discontinued operations, net of tax 9.4 1.6 12.3 0.3 12.3 (0.4)
Gain on disposition of discontinued operation, net of tax - - - - - (0.6)
Interest expense 1.9 0.4 0.0 4.0 0.0 8.2
Interest income (0.2) (1.4) (1.4) (0.1) (1.4) (0.4)
Income tax expense (benefit) 7.0 14.6 (4.8) 1.1 (5.2) 2.1
Depreciation 28.3 29.5 20.9 5.3 20.9 17.6
Amortization of intangible assets and goodwill 16.0 - - 2.6 - 11.0
EBITDA from continuing operations, before extraordinary items and cumulative effect of a change in accounting principle, net of tax 56.5$ 73.2$ 3.6$ 14.5$ 3.1$ 41.6$
Gain on acquisition purchase price settlement - (5.2) - - - -
Insurance reserve adjustment (4.2) (0.4) 8.6 - 8.7 -
Merger related expenses - - 16.2 - 16.2 (0.3)
Litigation judgment and related costs - - - 3.8 - -
IPO related expenses - - - - - 2.4
Loss on early extinguishment of debt - - - - - 5.5
EnStructure/Utili-Trax severance and personnel expenses - - - - - 0.5
EBITDA from continuing operations, before extraordinary items and cumulative effect of a change in accounting principle, net of tax as adjusted 52.3$ 67.6$ 28.4$ 18.3$ 28.0$ 49.7$
Reconciliation of Non-GAAP Financial Measures
Please refer to our prospectus filed on May 6, 2004 and Form 10-Q filed on November 15, 2004 with the Securities and Exchange Commission for the Company’s financial statements for the periods indicated above.

31
PECo Strategy Review
10/96
PECO/ComEd Merger
Announced
8/99
EXC Merger Closes
10/00
EXC Announces
Intent to Divest
11/01
IFS Agreement
of Sale
6/03
Dashiell Acquisition
6/00
BP/S Acquisition
1/01
Maslonka LOI
8/03
PECo NRCG Pilot
11/96
Underground Acquisition
9/99
MJE Acquisition
12/00
IFS Strategy Review
5/02
IFS Closing
9/03
Maslonka Closing
1/04
PECO T&D GE Nuclear ComEd NGG ComEd NGG ComEd T&D InfraSource
Original InfraSource Acquisitions09/99 – 01/01
EnStructure Utili-Trax
Acquisitions09/04
IFS IPO
5/04
IFS Evolution


![Analyst Day Consolidated Book - RRD.ppt [Read-Only]media.corporate-ir.net/media_files/irol/19/196053/AnalystDay_TDG.pdfCDA InterCorp. Avtech ADS ... Organizational Philosophy Corporate](https://img.dokumen.tips/doc/110x75/5b093fcd7f8b9a51508d07f8/analyst-day-consolidated-book-rrdppt-read-onlymediacorporate-irnetmediafilesirol19196053analystdaytdgpdfcda.jpg)