Embed Size (px)
Citation preview

First 9Months Results
Fiscal Year 2017 9M Results, ending December 31st 2016 February 28th 2017

Disclaimer This presentation is to be read as an introduction to the unaudited consolidated financial statements of the Group and contains key information presented in a concise manner on the Group and its
financial condition. The information contained in this presentations is extracted from the unaudited consolidated financial statements of the Group and is qualified in its entirety by the additional information contained in the unaudited consolidated financial statements of the Group. This presentation should only be read in conjunction with the unaudited consolidated financial statements of the Group. Copies of the unaudited consolidated financial statements of the Group are available under http://www.edreamsodigeo.com/category/investors/quarterly-edreams-odigeo/.
Certain statements included or incorporated by reference within this presentation may constitute “forward-looking statements” in respect of the Group’s operations, performance, prospects and/or financial condition and the industry in which the Group operates. By their nature, forward-looking statements involve a number of risks, uncertainties and assumptions and actual results or events may differ materially from those expressed or implied by those statements. Accordingly, no assurance can be given that any particular expectation will be met and reliance should not be placed on any forward-looking statement. Additionally, forward-looking statements regarding past trends or activities should not be taken as a representation that such trends or activities will continue in the future. Statements in this presentation reflect the knowledge and information available at the time of its preparation. The Group does not undertake any responsibility or obligation to update the information in this presentation, including any forward-looking statement resulting from new information, future events or otherwise. Nothing in this presentation should be construed as a profit forecast.
This presentation does not constitute or form part of, and should not be construed as, an offer or invitation to sell, or a solicitation of any offer to purchase or acquire any securities or related financial instruments of the company, nor shall it or any part of it or the fact of its distribution form the basis of, or be relied on in connection with, any contract or commitment or investment decisions relating thereto, nor does it constitute a recommendation regarding the securities of the company. No Securities of eDreams ODIGEO have been or will be registered under the U.S. Securities Act of 1933, as amended (the “Securities Act”) and may not be offered or sold in the United States absent registration or an exemption from registration under the Securities Act. Past performance cannot be relied upon as a guide to future performance and persons needing advice should consult an independent financial adviser.
This presentation has been sent to you in an electronic form. You are reminded that documents transmitted via this medium may be altered or changed during the process of transmission and, consequently, neither eDreams ODIGEO nor any of its subsidiaries, including Geo Travel Finance S.C.A. and Geo Debt Finance S.C.A., nor any director, officer, employer, employee or agent of theirs, or affiliate of any such person, accepts any liability or responsibility whatsoever in respect of any difference between the presentation distributed to you in electronic format and the hard copy version available to you on request.
In the United Kingdom, this presentation is directed only at persons who (i) fall within Article 43(2) of the Financial Services and Markets Act 2000 (Financial Promotion) Order 2005, as amended (the “Order”), (ii) are persons having professional experience in matters relating to investments who fall within the definition of “investment professionals” in Article 19(5) of the Order, or (iii) are persons who are high net worth entities falling within Article 49(2)(a) to (d) of the Order, and other persons to whom it may lawfully be communicated (together “Relevant Persons”). Under no circumstances should persons who are not Relevant Persons rely or act upon the contents of this presentation. Any investment or investment activity to which this presentation relates in the United Kingdom is available only to, and will be engaged only with, Relevant Persons.
The financial information included in this presentation includes certain non-GAAP measures, including “Bookings”, “Gross Bookings”, “EBITDA”, “Adjusted EBITDA”, “Revenue Margin” and “Variable Costs”, which are not accounting measures as defined by IFRS. We have presented these measures because we believe that they are useful indicators of our financial performance and our ability to incur and service our indebtedness and can assist analysts, investors and other parties to evaluate our business. However, these measures should not be used instead of, or considered as alternatives to, the audited consolidated financial statements for the Group based on IFRS. Further, these measures may not be comparable to similarly titled measures disclosed by other companies.
FY 2017 9M Results Presentation

9 Months Results Highlights • Financial Analysis • New KPIs • Outlook • Appendix

4
RESULTS HIGHLIGHTS
Solid results with growth in bookings, revenue margin & adjusted EBITDA
Raising full year guidance
$ Strategic Initiatives have boosted our performance and they have also set
us the path for longer term growth
Solid cash flow ▪ Cash position stood at €77million, up 18% y-on-y
FY 2017 9M Results Presentation
$ On track to build scale, become more agile, improve business model, and
create better customer experience
Continue to make investments on the business
Strategic Initiatives paying off

5 |
FY 2017 9M Results Presentation
SOLID RESULTS
Source: Consolidated financial statements, audited
In thousands
Bookings Adjusted EBITDA Revenue Margin
In € million In € million
+9% 8,504
7,818
9M
DEC FY17
9M
DEC FY16
+5% 349.7 333.9
9M
DEC FY16
9M
DEC FY17
75.9
64.1
+18%
9M
DEC FY17
9M
DEC FY16

6
STRATEGY DELIVERING GOOD GROWTH IN ADJUSTED EBITDA
Adjusted EBITDA evolution
FY 2017 9M Results Presentation
Note normalised for no bonus payment: In the year ended March 2015 we paid zero bonus to staff while in the year ended March 2016 we accrued at 100% (€5.2 million). If we normalise for the different level of bonus
payment, which has been provisioned and accrued each quarter, our implied adjusted EBITDA growth is higher.
Source: Consolidated financial statements, unaudited
-24%
+6%
+18%
-30%
-25%
-20%
-15%
-10%
-5%
0%
5%
10%
15%
20%
25%
+9% Bookings
+5% Revenue Margin
-10% Variable costs per booking
9M +12%
FY 2015 FY 2016 YTD
FY 2017
Change in
Management
YoY variation
Growth normalised for no bonus payment FY 2015. 100% accrual in FY 2016
%

7
FLIGHT AND NON-FLIGHT BOOKINGS
Flight
▪ Progress in strategic initiatives have boosted our
performance and they have also set us the path for
longer term growth
▪ We continue to make investments on our business to
build scale, become more agile, improve business model,
and create better customer experience
Non-Flight
▪ Non-flight business bookings trend has improved as a
result of our diversification strategy
– Growth driven by dynamic packages (DP), cars, and
hotels
– Partly offset due to the decline in packaged tours
210 245
694 742
3M
December
FY16
3M
December
FY17
9M
December
FY16
9M
December
FY17
2,227 2,433
7,124 7,762
3M
December
FY16
3M
December
FY17
9M
December
FY16
9M
December
FY17
Non Flight - Bookings
+9%
+9% In ‘000 Flight - Bookings
+17%
+7% In ‘000
Source: Consolidated financial statements, unaudited
Solid Growth rates in Flight Business and Non flight Improving
FY 2017 9M Results Presentation

8
Flight
▪ Revenue margin performance driven by:
– Bookings, already explained in previous slide.
– A reduction in revenue margin per booking:
▫ Due to channel mix realignment and price
reorientation, which also produced reduction in cost
per booking and increase in profitability per booking
▫ And foreign exchange impact, in particular the
depreciation of the pound vs the euro
– And the positive impact from our revenue
diversification strategy, which includes flight related
ancillaries, which delivered solid results
Non-Flight
▪ Non-flight revenue margin growth driven by the revenue
diversification strategy:
– Growth in DP, cars and hotels
– Growth of our metasearch business
– Partly offset due to the decline in packaged tours
FLIGHT AND NON-FLIGHT REVENUE MARGIN
Revenue diversification strategy driving growth in non-flight products
20.5 23.4
67.7 75.4
3M
December
FY16
3M
December
FY17
9M
December
FY16
9M
December
FY17
82.6 85.3
266.1 274.3
3M
December
FY16
3M
December
FY17
9M
December
FY16
9M
December
FY17
Non Flight – Revenue Margin
In € million Flight – Revenue Margin
In € million
+3%
+3%
+14%
+11%
Source: Consolidated financial statements, unaudited
FY 2017 9M Results Presentation
9
1,231 1,316
3,864 4,116
3M
December
FY16
3M
December
FY17
9M
December
FY16
9M
December
FY17
1,206 1,361
3,954 4,389
3M
December
FY16
3M
December
FY17
9M
December
FY16
9M
December
FY17
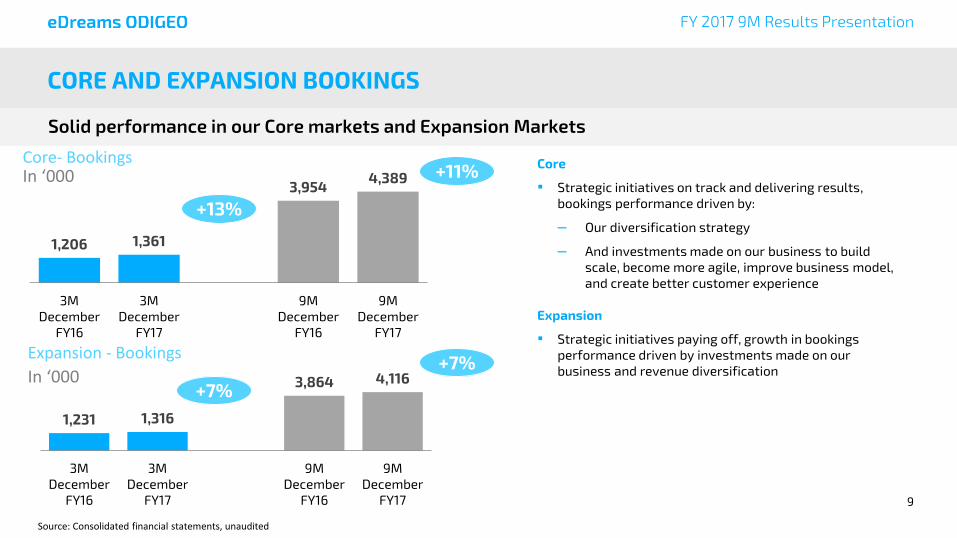
CORE AND EXPANSION BOOKINGS
Solid performance in our Core markets and Expansion Markets
Source: Consolidated financial statements, unaudited
Expansion - Bookings
+13%
+11% In ‘000 Core- Bookings
+7%
+7% In ‘000
Core
▪ Strategic initiatives on track and delivering results,
bookings performance driven by:
– Our diversification strategy
– And investments made on our business to build
scale, become more agile, improve business model,
and create better customer experience
Expansion
▪ Strategic initiatives paying off, growth in bookings
performance driven by investments made on our
business and revenue diversification
FY 2017 9M Results Presentation

10
48.5 48.4
151.7 152.9
3M
December
FY16
3M
December
FY17
9M
December
FY16
9M
December
FY17
54.6 60.3
182.2 196.7
3M
December
FY16
3M
December
FY17
9M
December
FY16
9M
December
FY17
FY 2017 9M Results Presentation
Core
▪ Solid performance in the Core markets revenue margin
in the first nine months of of FY 2017, growth driven by:
– Bookings, already explained in previous slide
– And reductions in revenue margin per booking as
previously explained
Expansion
▪ Revenue margin performance driven by:
– Bookings
– Foreign exchange impact
– Reductions in revenue margin per booking, all of
which have been explained in previous slides
Positive growth in all our Core markets
CORE AND EXPANSION REVENUE MARGIN
FY 2017 9M Results Presentation
Expansion – Revenue Margin
In € million Core – Revenue Margin
In € million
+10%
+8%
0%
+1%
Source: Consolidated financial statements, unaudited

11
Financial Analysis
• 9 Months Results Highlights • New KPIs • Outlook • Appendix

12
INCOME STATEMENT
EBIT
Financial loss
Adjusted net income
Net income
Revenue margin
Variable costs
Fixed costs
Adjusted EBITDA
Non recurring items
EBITDA
D&A incl. impairment & results
on assets disposals
Income tax
Var. 3M Dec
FY17
3M Dec
FY16 (In € million)
Var. 9M Dec
FY17
9M Dec
FY16
Key highlights
Over the third quarter, main YoY evolutions reflect:
▪ Revenue margin increase by 5%
▪ Variable Costs decrease by 1% despite the increase of
bookings. On a per booking basis, variable costs decrease by
10% year-on-year as a result of our strategic initiatives
▪ Higher Fixed Costs mainly due to
– Higher personnel expenses
– Higher external fees
– Offset by lower IT costs
▪ Non recurring items mainly due to LTI expenses and
contract terminations
▪ Financial loss increase mainly due to the refinancing
(impact of €18.2m on the financial result) encompassing:
– Write-off of previous financing costs
– Call premium expenses for repayment of the previous
bonds
FY 2017 9M Results Presentation
Source: Consolidated financial statements, unaudited
103.1 108.7 5%
(65.4) (64.9) (1)%
(18.0) (22.0) 22%
19.7 21.7 10%
(1.6) (2.7) 65%
18.1 19.0 5%
(4.5) (4.4) (2)%
13.5 14.6 8%
(11.6) (30.6) 163%
(0.3) 1.0 n.a.
1.6 (14.9) n.a.
2.5 3.0 19%
333.9 349.7 5%
(218.7) (214.6) (2)%
(51.1) (59.3) 16%
64.1 75.9 18%
(7.1) (6.9) (3)%
57.0 69.0 21%
(14.1) (14.5) 3%
42.9 54.4 27%
(34.7) (51.3) 48%
(1.7) (6.2) 257%
6.5 (3.0) n.a.
10.9 19.4 78%
13
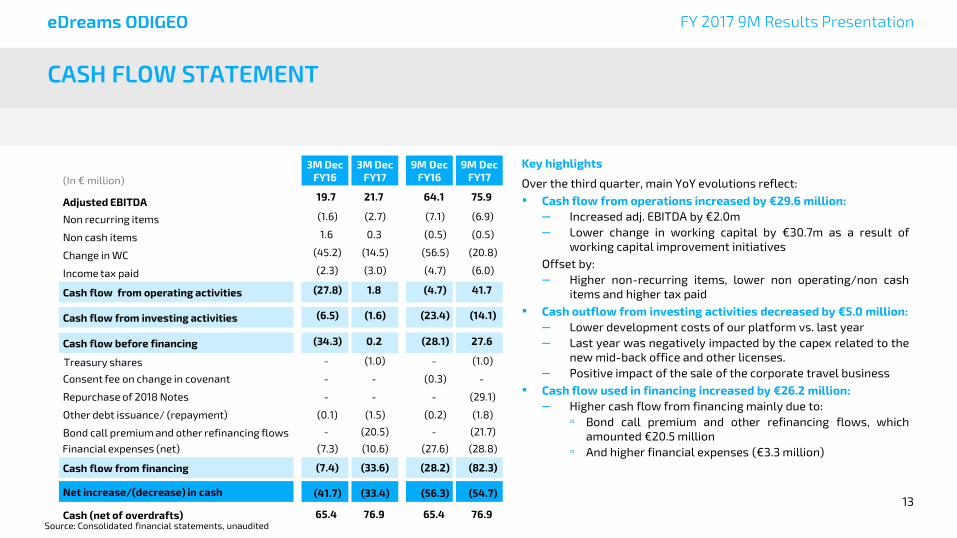
CASH FLOW STATEMENT
Net increase/(decrease) in cash
Income tax paid
Cash flow from operating activities
Cash flow from investing activities
Consent fee on change in covenant
Repurchase of 2018 Notes
Adjusted EBITDA
Non recurring items
(In € million)
Non cash items
Bond call premium and other refinancing flows
Other debt issuance/ (repayment)
3M Dec
FY16
3M Dec
FY17
Cash (net of overdrafts)
9M Dec
FY16
9M Dec
FY17
Change in WC
Cash flow from financing
Key highlights
Over the third quarter, main YoY evolutions reflect:
▪ Cash flow from operations increased by €29.6 million:
– Increased adj. EBITDA by €2.0m
– Lower change in working capital by €30.7m as a result of
working capital improvement initiatives
Offset by:
– Higher non-recurring items, lower non operating/non cash
items and higher tax paid
▪ Cash outflow from investing activities decreased by €5.0 million:
– Lower development costs of our platform vs. last year
– Last year was negatively impacted by the capex related to the
new mid-back office and other licenses.
– Positive impact of the sale of the corporate travel business
▪ Cash flow used in financing increased by €26.2 million:
– Higher cash flow from financing mainly due to:
▫ Bond call premium and other refinancing flows, which
amounted €20.5 million
▫ And higher financial expenses (€3.3 million)
FY 2017 9M Results Presentation
Source: Consolidated financial statements, unaudited
Cash flow before financing
Financial expenses (net)
19.7 21.7
(1.6) (2.7)
1.6 0.3
(45.2) (14.5)
(2.3) (3.0)
(27.8) 1.8
(6.5) (1.6)
(34.3) 0.2
- (1.0)
- -
- -
(0.1) (1.5)
- (20.5)
(7.3) (10.6)
(7.4) (33.6)
(41.7) (33.4)
65.4 76.9
64.1 75.9
(7.1) (6.9)
(0.5) (0.5)
(56.5) (20.8)
(4.7) (6.0)
(4.7) 41.7
(23.4) (14.1)
(28.1) 27.6
- (1.0)
(0.3) -
- (29.1)
(0.2) (1.8)
- (21.7)
(27.6) (28.8)
(28.2) (82.3)
(56.3) (54.7)
65.4 76.9
Treasury shares

14
SUCCESFUL DEBT REFINANCING
(million
euros) Principal Rating Maturity
Corporate
Family
Rating
Moodys:B2
S&P: B
Outlook: Stable
2021 Notes 435 Moodys:B3
S&P: B
01/08/21
Debt Details
Gross Leverage Ratio
(Total Gross Financial Debt1 / LTM Adjusted EBITDA) Refinancing highlights
▪ Gross Leverage ratio down from 5.0x in December 2015 to
4.0x in December 2016.
– Net leverage ratio down from 4.3x in December 2015 to
3.3x in December 2016
▪ Refinancing closed in October 2016
▪ Full repayment of 2018 Notes and 2019 Notes, issuance of
2021 Notes
▪ Increase in SS RCF to €147 million
▪ Single maintenance covenant switched to 6.0x Gross
Leverage Ratio
▪ Terms improved to allow for efficient repurchases of up to
10% of principal per year
NOTES: Covenants figures presented above are unaudited and at eDreams ODIGEO level
1 IFRS gross financial debt is calculated after deducting the financing fees capitalized
FY 2017 9M Results Presentation

15
New KPIs
• 9 Months Results Highlights • Financial Analysis • Outlook • Appendix

16 |
As stated on our investor day, we are committed to sharing five performance indicators to show underlying improvements beyond P&L
New measure
New measure
New measure
New measure
Existing measure
Revenue diversification ratio
Acquisition cost per booking index
Share of mobile bookings
Repeat booking
Product diversification ratio
FY 2017 9M Results Presentation

17 |
Growing share of revenues coming from our diversification strategy
Revenue split; Percent
Note: Please refer to definition as per glossary in the management report/consolidated financial statements
Classic Supplier revenues
Classic customer revenues
Diversification revenues
Advertising & Meta
14%
50%
29%
7%
Q3 ’17
29%
Q3 ’16
25%
FY 2017 9M Results Presentation
Revenue diversification ratio; Percent

18 |
Increasing ability to add value to a customers booking through higher attachments
Product diversification ratio; Percent
44%
Q3 ’17 Q3 ’16
37%
FY 2017 9M Results Presentation
Note: Please refer to definition as per glossary in the management report/consolidated financial statements

19 |
Decreasing acquisition cost v. index of Q4 FY 15 before start of transformation
Acquisition cost per booking Index
7783
100
Q4 ’15 Baseline
Q3 ’16 Q3 ’17
FY 2017 9M Results Presentation
Note: Please refer to definition as per glossary in the management report/consolidated financial statements

20 |
Stable repeat rates with positive YoY
Customer repeat booking rate; Percent, annualised view1
40% 39%
Q3 ’16 Q3 ’17
FY 2017 9M Results Presentation
Note: Please refer to definition as per glossary in the management report/consolidated financial statements
21
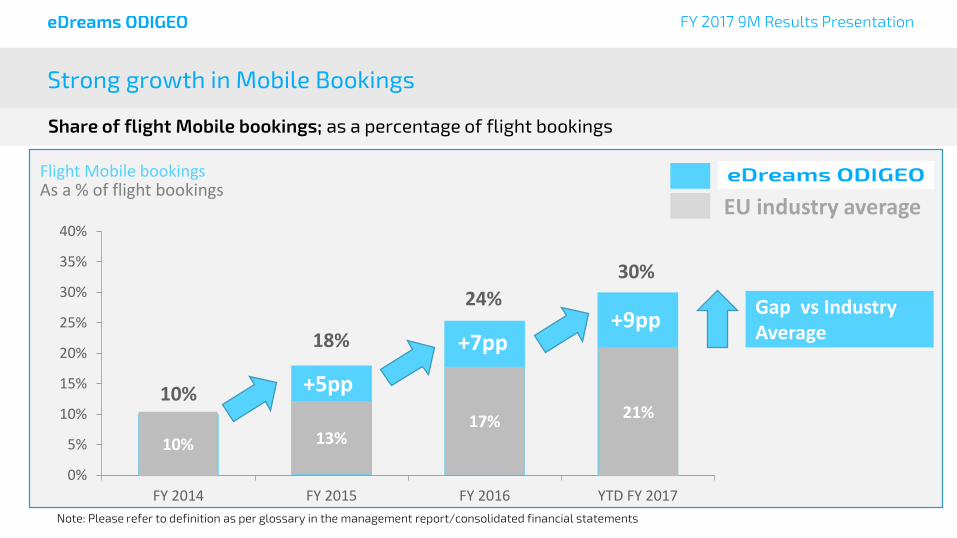
Strong growth in Mobile Bookings
FY 2017 9M Results Presentation
10%
18%
24%
30%
0%
5%
10%
15%
20%
25%
30%
35%
40%
FY 2014 FY 2015 FY 2016 YTD FY 2017
As a % of flight bookings Flight Mobile bookings
EU industry average
10%
+5pp
13% 17%
21%
+7pp
Share of flight Mobile bookings; as a percentage of flight bookings
Note: Please refer to definition as per glossary in the management report/consolidated financial statements
+9pp Gap vs Industry Average

22
Outlook
• 9 Months Results Highlights • Financial Analysis • New KPIs • Appendix

23
Initial
Guidance (June 2016)
Revised
Guidance (February 2017)
Bookings (million)
In excess of
10.7 Mn
11.2-11.5Mn
5-8% growth
y-on-y
Revenue Margin (million euros)
In Excess of
€463 Mn
€465-475 Mn
0-2% growth
y-on-y
Adjusted EBITDA (million euros)
€103-107 Mn
8-12% growth
y-on-y
€105-107 Mn
10-12% growth
y-on-y
RAISING OUTLOOK 2016-17
Revised Targets for 2016-17
FY 2017 9M Results Presentation
Outlook statement
▪ Our focus for the remainder of the year is to
continue investing to reinforce our long term
sustainability and in the best interest of the
customer
▫ Adapting our revenue model to respond
to changing customer needs
▫ And developing off-line advertising,
which we do not expect to generate
revenue straight away
▪ This outlook guidance includes:
– The recently sold corporate travel
business in the Nordics and Germany and
package tours business in France
– And the acquisition of budgetplaces.com

24
OUR VISION
…and fits into our wider strategy of derisking our
financial profile and increasing value to both debt
and equity investors
This is part of a broader investment to ensure our
business is well-positioned and attractive in the
long term…
We expect a period of softer top-line performance
to reflect longer-term investment in customer
value
Select restructuring including divestments of Package and
Corporate businesses
Debt buy-back/successful refinancing
Continue to reduce leverage
We will control the transformation pace to continue
to grow absolute EBITDA
More robust revenue profile
Increased satisfaction
Increased competitiveness as leader in Europe
Prioritizing long-term profitability
Our financial strategy is in line with these choices
Long-term target of EUR 125-140m
EBITDA by 2020

25
Appendix
• 9 Months Results Highlights • Financial Analysis • New KPIs • Outlook

26
KPI HISTORIC EVOLUTION – eDreams ODIGEO
FY 2017 9M Results Presentation
Source: Management accounts, unaudited
NOTE: PF means restated after the change in revenue recognition from departure to booking date for dynapacks, hotels and cars
PF FY
2013/14
PF
Jun-14
PF
Sep-14
PF
Dec-14
PF
Mar-15
FY
2014/15 Jun-15 Sep-15 dec-15 Mar-16
FY
2015/16 Jun-16 Sep-16 dec-16
YTD
Dec-15
YTD
Dec-16
Number of bookings (in '000)
Total 9,834 2,510 2,453 2,133 2,629 9,724 2,618 2,763 2,437 2,857 10,675 2,916 2,910 2,678 7,818 8,504
By product:
Flight 8,859 2,261 2,186 1,917 2,406 8,770 2,380 2,516 2,227 2,626 9,750 2,674 2,655 2,433 7,124 7,762
Non Flight 975 249 267 215 223 954 238 247 210 231 925 243 255 245 694 742
By region:
Core 5,900 1,510 1,356 1,112 1,320 5,297 1,356 1,392 1,206 1,427 5,381 1,517 1,510 1,361 3,954 4,389
Expansion 3,934 1,000 1,097 1,021 1,309 4,427 1,262 1,370 1,231 1,430 5,294 1,399 1,400 1,316 3,864 4,116
P&L per booking
Revenue margin 43.7 42.8 44.9 45.6 46.1 44.8 43.5 42.3 42.3 45.3 43.4 42.6 40.1 40.6 42.7 41.1
Flight 39.3 37.9 39.3 40.5 41.1 39.7 38.2 36.8 37.1 38.5 37.7 36.9 34.1 35.1 37.4 35.3
Non Flight 83.8 86.6 90.8 90.8 99.9 91.8 96.6 98.4 97.7 122.1 103.7 105.7 103.2 95.7 97.6 101.6
Core 45.4 43.8 49.2 49.8 51.2 48.3 47.3 45.6 45.3 51.1 47.4 46.3 43.8 44.3 46.1 44.8
Expansion 41.0 41.1 39.6 41.0 40.9 40.7 39.3 39.0 39.4 39.5 39.3 38.5 36.2 36.7 39.3 37.2
Variable costs (25.7) (27.9) (30.6) (30.0) (30.2) (29.7) (29.0) (28.0) (26.8) (27.6) (27.9) (26.0) (25.3) (24.3) (28.0) (25.2)
Fixed costs (5.9) (6.0) (5.5) (6.9) (5.3) (5.9) (6.0) (6.3) (7.4) (6.6) (6.5) (6.6) (6.2) (8.2) (6.5) (7.0)
Total costs (31.6) (33.9) (36.1) (36.9) (35.5) (35.5) (34.9) (34.3) (34.2) (34.2) (34.4) (32.6) (31.5) (32.5) (34.5) (32.2)
Adjusted EBITDA 12.1 8.8 8.9 8.7 10.6 9.3 8.5 8.0 8.1 11.1 9.0 9.9 8.6 8.1 8.2 8.9
Adjusted EBITDA margin 27.6% 20.7% 19.7% 19.1% 23.1% 20.8% 19.6% 18.9% 19.1% 24.5% 20.7% 23.4% 21.5% 20.0% 19.2% 21.7%

27
First 9 Months Results FY 2017