Embed Size (px)
Citation preview

Working Paper/Document de travail2008-45
Firm Size and Productivity
by Danny Leung, Césaire Meh, and Yaz Terajima
www.bank-banque-canada.ca

Bank of Canada Working Paper 2008-45
November 2008
Firm Size and Productivity
by
Danny Leung, 1 Césaire Meh, 1 and Yaz Terajima 2
1Canadian Economic Analysis DepartmentBank of Canada
Ottawa, Ontario, Canada K1A [email protected]@bankofcanada.ca
2Financial Stability DepartmentBank of Canada
Ottawa, Ontario, Canada K1A [email protected]
Bank of Canada working papers are theoretical or empirical works-in-progress on subjects ineconomics and finance. The views expressed in this paper are those of the authors.
No responsibility for them should be attributed to the Bank of Canada.
ISSN 1701-9397 © 2008 Bank of Canada

ii
Acknowledgements
The authors would like to thank Michelle Alexopoulus, Richard Dion, Walter Engert,
Raphael Solomon and seminar participants at the Bank of Canada and Statistics Canada for their
helpful suggestions.

iii
Abstract
This paper examines the relationship between firm size and productivity. In contrast to previous
studies, this paper offers evidence of the relationship not only from manufacturing firms, but from
non-manufacturing firms as well. Furthermore, the aggregate importance of the firm size-
productivity relationship is gauged by calculating to what extent shifts in the distribution of
employment over firm size categories has affected Canadian aggregate productivity, and whether
differences in the employment distribution over firm size categories between Canada and the
United States can account for the Canada-U.S. labour productivity gap. The importance of large
and small firms to changes in productivity is also examined.
A positive relationship between firm size and both labour productivity and TFP is found in both
the manufacturing and non-manufacturing sectors. Given this relationship, the difference in the
employment distribution over firm sizes between Canada and the United States can account for
half of the Canada-U.S. labour productivity gap in manufacturing.
JEL classification: L11, L25, O47Bank classification: Productivity
Résumé
Les auteurs étudient la relation entre la taille de l’entreprise et la productivité. À la différence des
études antérieures, leur analyse englobe non seulement les entreprises de fabrication mais aussi
les firmes non manufacturières. L’importance globale de la relation entre taille et productivité est
évaluée en calculant dans quelle mesure les variations de la répartition de l’emploi par taille
d’entreprise ont influé la productivité globale des firmes canadiennes et en examinant si les
différences dans cette répartition entre le Canada et les États-Unis permettent d’expliquer l’écart
de productivité du travail entre eux. L’incidence du poids relatif des grandes et des petites
entreprises sur la productivité est aussi analysée.
Les auteurs décèlent une relation positive à la fois dans les secteurs manufacturier et non
manufacturier entre, d’une part, la taille de l’entreprise et, d’autre part, la productivité du travail et
la productivité totale des facteurs. Compte tenu de cette relation, les différences dans la répartition
de l’emploi par taille d’entreprise entre le Canada et les États-Unis parviennent à expliquer la
moitié de l’écart de productivité du travail entre les secteurs manufacturiers des deux pays.
Classification JEL : L11, L25, O47Classification de la Banque : Productivité

1. Introduction
The relationship between �rm size and productivity has many facets. On the one hand,
there is a positive correlation between a country�s level of per capita income and the con-
centration of employment in large �rms.1 This casual observation is likely the source of
the pre-1980s view that economic development went hand in hand with the gradual disap-
pearance of small �rms in the economy. In this paradigm, economic prosperity depends on
the ability of a country to grow its corporations into global giants. On the other hand, the
trend toward increasing concentration of employment in large �rms reversed in a number
of OECD countries in the 1970s2 and small �rms began to be more commonly viewed as
sources of dynamism and productivity growth. This view was substantiated by studies us-
ing longitudinal microdata sets on �rms and establishments that found that underlying the
gradual increase in the number of �rms was a large amount of �rm turnover, and that the
net entry of �rms (entry of new and exit of old) contributed signi�cantly to the aggregate
productivity growth.3 In this world, new, generally smaller �rms continuously enter into the
economy. While many fail in short order, those that survive have productivity growth rates
that are usually higher than those of incumbent �rms. New entrants are also thought to
enter into the economy with the newest technologies, so aggregate productivity growth is
also facilitated by the creative destruction associated with �rm turnover.
This paper explores the importance of both aspects of the relationship between �rm size
and productivity discussed above. Using a Canadian administrative dataset covering the
1984-1997 period, �rm-level measures of labour productivity and total factor productivity
are constructed and used to gauge the magnitude of the �rm size-productivity relationship.
The importance of this relationship is then assessed through a couple of experiments: by
how much was the level of Canadian productivity a¤ected by changes in distribution of
employment across �rm size categories over the 1984-1997 period, and how much of the
1 Snodgrass and Biggs (1995) show that more labour is concentrated in large �rms in high-income countriesthan in low and middle income countries.
2 See Van Ark and Monnikhof (1996).3 See Bartelsman and Doms (2000) and OECD (2001) for the stylized facts established in these studies.
2

Canada-U.S. di¤erence in productivity levels in 1997 can be explained by di¤erences in the
distribution of employment across �rm size categories.
This paper contributes to the literature in a number of ways. While there are many papers
that have examined the heterogeneity of �rm-level productivity and �rm dynamics, few have
focused on the relationship between size and productivity. In this paper, not only is the
relationship between size and productivity documented, the importance of that relationship
to aggregate productivity and productivity changes is examined. Furthermore, much of the
previous Canadian and U.S. research focuses on the experience of manufacturing plants. In
this paper, �rm-level evidence for all corporations with employees in the Canadian economy
is presented.
It is found that there is a signi�cant �rm size-productivity relationship in terms of labour
productivity and TFP. As expected, the labour productivity relationship is stronger in the
manufacturing sector than the non-manufacturing sector. For TFP, a slightly stronger pos-
itive relationship is found for non-manufacturing. Although over 1984-1997 employment
became less concentrated in small �rms in Canada, the magnitude of the size-labour pro-
ductivity relationship is such that aggregate sales per employee was only slightly a¤ected.
Instead, the change in aggregate and manufacturing sales per employee is due to productivity
improvements with each �rm size category. Finally, the much larger Canada-U.S. di¤erences
in the employment distribution across �rm size categories can account for approximately
20 per cent of the Canada-U.S. sales per employee gap at the aggregate level and 48 per
cent in manufacturing. The rest of paper is organized as follows. Section 2 gives a brief
summary of the relevant �ndings in previous research. The third section outlines the data
and the measures of size and productivity used in this paper. The main �ndings of the paper
are presented in Section 4. First, evidence on the cross-sectional relationship between size
and productivity is presented. Next, the implications of such a relationship for changes in
aggregate productivity levels and productivity di¤erences between Canada and the United
States are then examined. Concluding remarks are given in section 5.
3

2. Related Literature
The relationship between �rm size and labour productivity is well documented. Van Ark
and Monnikhof (1996) document this relationship for France, Germany, Japan, the United
Kingdom and the United States, and evidence for less-developed countries, such as India,
the Philippines, Thailand, Korea, Taiwan, Turkey and countries in Africa can be found in
Snodgrass and Biggs (1995) and Van Biesebroeck (2005). These papers, which concentrate
on manufacturing �rms or plants, show that the gap between the largest and smallest �rms
is large. For example, Van Ark and Monnikhof (1996) show that in 1987, the gross output
per employee in U.S. manufacturing plants with 0-9 employees was 62 per cent of that of
all manufacturing plants, while the gross output per employee in plants with 500 or more
employees was 126 per cent of that of all manufacturing plants. Evidence for Canadian
manufacturing suggest a similar or even stronger relationship than in the United States.
Baldwin, Jarmin and Tang (2002) show that shipments per employee in plants with 100 or
fewer employees is 62 per cent of the industry average, while shipments per employee in
plants with more that 500 employees is 165 per cent that of the industry average.
Baldwin, Jarmin and Tang (2002) also make comparisons using value-added per em-
ployee. While the di¤erences between large and small establishments are smaller than when
shipments per employee are used, the di¤erences are not great, especially in the United
States. In Canada, value-added per employee in plants with more than 500 employees is
147 per cent of that of the industry average, while value added per employee in plants with
fewer than 100 employees is 67 per cent of that of industry average. In the United States,
plants with more than 500 employees have labour productivity levels that are 136 per cent
of the average when measured by shipments per worker, and 137 per cent when measured
by value added per worker. For �rms with fewer than 100 employees, the numbers are 67
per cent and 69 per cent for shipments per worker and value added per worker, respectively.
This suggests that in manufacturing, large plants are using intermediate inputs only slightly
more intensively than smaller plants.
Evidence for industries outside manufacturing and for TFP is more scarce. The evidence
4

that does exist shows that there is a positive relationship between �rm size and TFP. Van
Biesebroeck (2005) concludes that the TFP distributions of large and small African manufac-
turing �rms are signi�cantly di¤erent, but he does not indicate by how much large �rms are
more productive. Using data on publicly-traded manufacturing �rms, Lee and Tang (2001)
�nd that �rms with more than 500 employees, and �rms with between 100 and 500 employees
are 17 per cent and 15 per cent more productive than �rms with less than 100 employees
in Canada, respectively. For the United States, Lee and Tang �nd a similar advantage for
�rms in the 500+ (18 per cent) and 100-500 (15 per cent) over �rms in the less than 100
category. Using the same data, Rao and Tang (2000) show that the TFP advantage for large
�rms persists even after controlling for other characteristics such as foreign control, export
intensity, unionization, and age. There are some other papers, such as Baily et al. (1992),
that calculate �rm or plant-level TFP, but the focus is not on the relationship of productivity
and �rm size.
The importance of �rm size for aggregate productivity levels and growth has also not been
widely studied. Research using longitudinal micro data has tended to focus on decomposing
changes in aggregate productivity into parts due to within-�rm growth, reallocation across
surviving �rms and the contributions of entry and exit.4 To emphasize the role of size, each
component of the above decomposition could be further split by �rm size.
A paper that does something similar to what was suggested above is Baldwin and Gu
(2003). In that paper, a distinction is made between single and multi-plant Canadian man-
ufacturing �rms. It is found that the contribution of multi-plant �rms greatly exceeds that
of single-plant �rms in both the within-�rm and net entry components, and that the con-
tribution of multi-plant �rms to productivity growth is much greater than their share of
employment. Based on that evidence, Baldwin and Gu conclude that small single-plant
4 These studies, that once again mostly use data from manufacturing plants, conclude that while thee¤ect of net entry is signi�cant, the within-�rm productivity growth of incumbents accounts for the largestfraction of aggregate labour productivity growth and that �uctuations in aggregate productivity growth aredriven largely by incumbents. (See Bartelsman and Doms (2000) and OECD (2001).) In the case of TFP,the role of within-�rm TFP growth of incumbents lessens and the role of net entry becomes more important.Since entrants are usually smaller than incumbents, the importance of net entry does suggest that small �rmscontribute to aggregate productivity growth. However, the decomposition between entrants and incumbentsis more related to �rm age than �rm size.
5

�rms have little impact on labour productivity growth in manufacturing.
3. Data and Measurement Issues
The T2-LEAP is the �rm-level data used in this study. The T2-LEAP is the result
of the linkage of two sets of administrative �les, the Longitudinal Employment Analysis
Program (LEAP) and Corporate Tax Statistical Universe (T2). It covers the 1983-1997
period and contains close to 9 million �rm-year observations. The LEAP is a record of all
�rms, incorporated or unincorporated, in Canada that have registered a payroll deduction
account with the Canadian Revenue Agency.5 Thus �rms without a payroll, are not included
in the LEAP. In addition to �rm counts, the LEAP can provide the payroll of each �rm
from the sum of their T4 slips issued to workers and a measure of the labour input, an
average labour unit (ALU). The ALU is derived by dividing the payroll of the �rm by the
average annual earnings of workers in the �rm�s detailed industry (3-digit SIC), province and
employment size class, where the calculation of average annual earnings is done using the
Survey of Employment Payroll and Hours. Kanagarajah (2001) notes that the LEAP�s ALU
measure of the level of employment falls between those from the Survey of Employment
Payroll and Hours and the Labour Force Survey, and that the employment trends from
the three sources are similar for the major industry groups. However, the ALU measure
underestimates employment of �rms that are born and exit during the year because the
payroll is for a partial year and the average earnings are for the full year. Also, since the
LEAP �le begins in 1983, the age of �rms that existed in 1983 cannot be determined, but
the age of entrants after 1983 can.
The T2 provides sales, pro�ts, and book-value assets from the �rm�s corporate tax re-
turns. While the LEAP is recorded on a calendar year basis, the year of attribution on the
T2 �les is the end year of the �scal period. However, for the T2-LEAP �le, Statistics Canada
has converted the value of �nancial variables in the T2 �le to calendar year terms. Since
the T2 data only includes corporations, the T2-LEAP covers corporations in Canada with
5See Kanagarajah (2001) for more details on the LEAP.
6

a payroll.6 Figure 1 compares sales from the T2-LEAP and gross output from the Statis-
tics Canada�s KLEMS database for the major industries.7 ;8 The level and growth pattern
of sales and gross output are nearly identical in manufacturing, transportation, warehousing
and storage, and mining, oil and gas. For business services, accommodation and food, and
arts, entertainment and recreation, the level and pattern of growth of sales is similar to that
of gross output, but not as close as for the previous three industries. For agriculture, forestry
and �shing, construction, communication and utilities, wholesale trade, retail trade, health
care and social services (excluding hospitals), and other services there are substantial di¤er-
ences between the level of sales and gross output. However, in many of these cases this is
likely due to the high share of unincorporated businesses or incorporated businesses without
employees in these industries. Furthermore, despite the di¤erence in levels, the patterns of
growth are similar. The sole industry where the pattern of growth and levels are di¤erent
is FIRE. FIRE is therefore excluded from the analysis.9 Consequently, the results in this
paper pertain to non-�nancial corporations in the business sector that have employees.
A �rm-level measure of labour productivity is constructed by taking the ratio of real
output to ALUs, where real output is sales of the �rm de�ated by an industry-spec�c price
index for gross output taken from the KLEMS database. Similar to Lee and Tang (2001) and
Rao and Tang (2000), a �rm-level measure of TFP is obtained by estimating a production
function using ordinary least squares (OLS):
lnYijt = �0jt + �Kjt lnKijt + �Ljt lnLijt + �Mjt lnMijt + eijt; (1)
where i indexes �rms, j indexes industries, t indexes time, Y is real output as de�ned above,
K is book value of assets de�ated by the industry-speci�c price index for capital in KLEMS,
L is ALUs, and M is a nominal measure of intermediate inputs (sales - wage bill - gross
6See Baldwin, Dupuy and Penner (1992) for more details on the construction of T2-LEAP.7See Baldwin and Harchaoui (2002) for more details on the KLEMS data. The T2-LEAP uses the SIC
industrial classi�cation system, so the older SIC-based KLEMS data is used.8It must be noted that while sales does correspond to the concept of gross output for many industries,
there are some industries where it does not. For example, in retail and wholesale trade, gross margins areused to form gross output in the industry accounts.
9Education services (excluding universities) cannot be compared because data from KLEMS is secured.As a result, education services is also excluded in this paper.
7
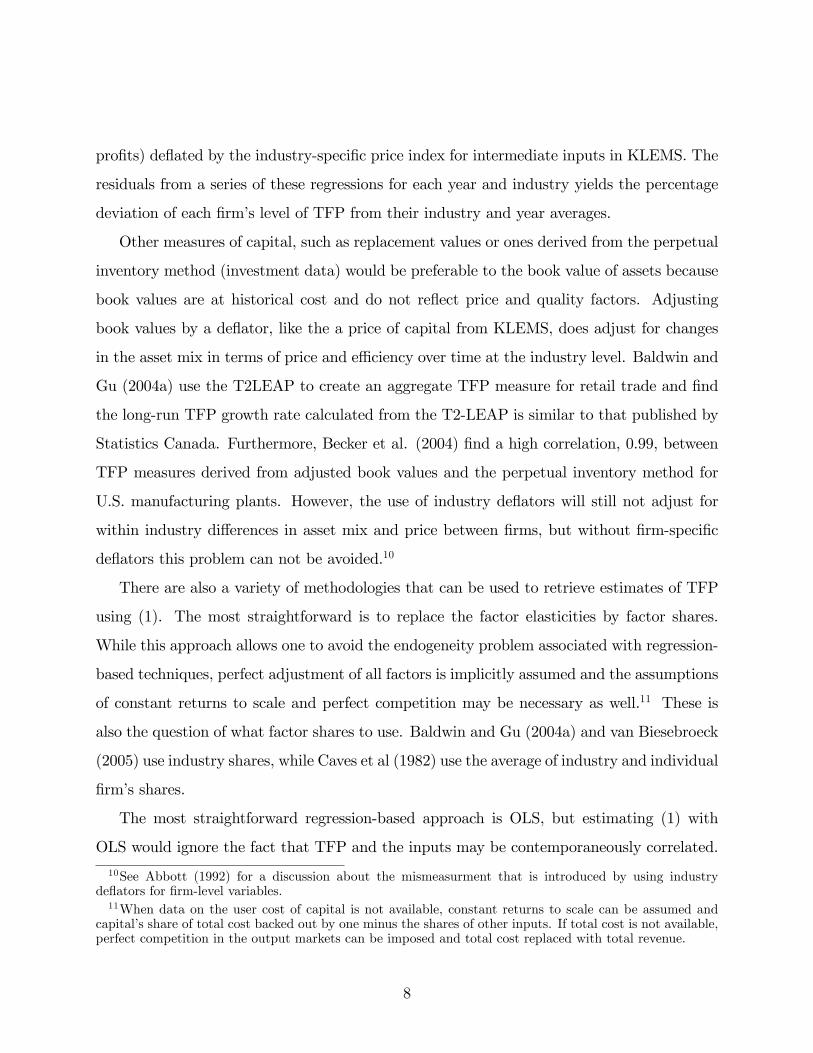
pro�ts) de�ated by the industry-speci�c price index for intermediate inputs in KLEMS. The
residuals from a series of these regressions for each year and industry yields the percentage
deviation of each �rm�s level of TFP from their industry and year averages.
Other measures of capital, such as replacement values or ones derived from the perpetual
inventory method (investment data) would be preferable to the book value of assets because
book values are at historical cost and do not re�ect price and quality factors. Adjusting
book values by a de�ator, like the a price of capital from KLEMS, does adjust for changes
in the asset mix in terms of price and e¢ ciency over time at the industry level. Baldwin and
Gu (2004a) use the T2LEAP to create an aggregate TFP measure for retail trade and �nd
the long-run TFP growth rate calculated from the T2-LEAP is similar to that published by
Statistics Canada. Furthermore, Becker et al. (2004) �nd a high correlation, 0.99, between
TFP measures derived from adjusted book values and the perpetual inventory method for
U.S. manufacturing plants. However, the use of industry de�ators will still not adjust for
within industry di¤erences in asset mix and price between �rms, but without �rm-speci�c
de�ators this problem can not be avoided.10
There are also a variety of methodologies that can be used to retrieve estimates of TFP
using (1). The most straightforward is to replace the factor elasticities by factor shares.
While this approach allows one to avoid the endogeneity problem associated with regression-
based techniques, perfect adjustment of all factors is implicitly assumed and the assumptions
of constant returns to scale and perfect competition may be necessary as well.11 These is
also the question of what factor shares to use. Baldwin and Gu (2004a) and van Biesebroeck
(2005) use industry shares, while Caves et al (1982) use the average of industry and individual
�rm�s shares.
The most straightforward regression-based approach is OLS, but estimating (1) with
OLS would ignore the fact that TFP and the inputs may be contemporaneously correlated.
10See Abbott (1992) for a discussion about the mismeasurment that is introduced by using industryde�ators for �rm-level variables.11When data on the user cost of capital is not available, constant returns to scale can be assumed and
capital�s share of total cost backed out by one minus the shares of other inputs. If total cost is not available,perfect competition in the output markets can be imposed and total cost replaced with total revenue.
8

It might be argued that to some extent the inputs are pre-determined because of high
adjustment costs or contractual obligations, but this argument is less convincing for low
frequency data.
Instrumental variables (IV) estimation could be used to control for endogeneity, but it
is not simple to overcome the weak instrument problem.12 Moreover, lagged inputs, which
are relatively more highly correlated to today�s inputs than some other possible instruments,
are endogenous if �rm-level TFP is serially correlated. Olley and Pakes (1996) address the
endogeneity problem by taking an inverted investment function (assuming monotonicity,
investment as a function of TFP and capital can be solved for TFP) and using it as a
predictor of TFP in (1). This however assumes that investment adjusts to the complete
TFP shock, which may not be the case because of time to build or if investment responds
only to the permanent component of TFP.13 Levinsohn and Petrin (2000) get around the
possible weak relationship between TFP and investment by using intermediate inputs in
place of investment, but this leads to the need to instrument intermediate inputs and possibly
capital later in the procedure.
This paper presents TFP estimates using OLS to estimate (1).14 Estimates using lagged
inputs as instruments were also computed, but the results were similar to the ones pre-
sented. More advanced methodologies were not used because of data limitations: the lack of
investment data and the need to obtain a measure of nominal intermediate inputs indirectly.
Since nominal intermediate inputs are derived from sales minus gross pro�ts and wages, it
is a volatile measure and it is likely not to be as highly correlated with TFP as the one used
by Levinsohn and Petrin (2000).
Regardless of the econometric techniques used, obtaining TFP by estimating (1) does
12For example, Eslava et al. (2005) uses output of downstream producers, regional government expen-ditures and energy and material prices to instrument, but only achieves partial R2s of 0.128 and 0.139 forcapital and labour, respectively. For general discussion of the weak instrument problem, see Staiger andStock (1997).13Furthermore, observations of zero investment by some �rms makes the assumption of monotonicity
problematic.14Haltiwanger (2004) shows that OLS estimates of TFP can be highly correlated to ones where factor
shares are used.
9

not get around the problem associated with choosing which factor shares to use in the
previous approach. Instead of choosing between the continuum of possibilities between �rm-
speci�c and industry factor shares, the decision is now whether to let each �rm have the
same weight in the regression, or put more weight on �rms with a higher share of output.
The �rst approach would give estimates of the �technology�parameters for the average �rm.
Since almost all �rms are small, the estimates would undoubtedly re�ect the technology used
by smaller �rms. By giving more weight to �rms with higher output, the second approach
gives parameter estimates that re�ects the technology e¤ectively used by the industry to
produce its output. Since a large fraction of industry output is produced by larger �rms, the
weighted regression would give estimated parameters more applicable to larger �rms.
Larger �rms use relatively more capital, so the weighted parameter estimate on capital
will be larger than the unweighted estimate, while the weighted parameter estimate on labour
would be smaller than the unweighted estimate. If the weighted parameter estimates were
applied to all �rms then very high levels of TFP might be estimated for small �rms that use
little capital and mostly labour; weighted estimates give large weight to the input small �rms
use the least and little weight to the input they use the most. An implication of the above
is that when the weighted parameter estimates are used, the TFP gap between large and
small �rms will likely be small. Conversely, if unweighted parameter estimates were applied
to all �rms, the input that large �rms use relatively more (less) would be given less (more)
weight than in the case of weighted parameter estimates. The result would be a larger TFP
gap between large and small �rms.
Overall, it is unclear which approach is the most appropriate given the data restrictions.
That is why this paper presents both weighted and unweighted measures. If industry TFP
performance is the focus, as it is in Lee and Tang (2001) and Rao and Tang (2000), then
weighted parameter estimates that re�ect an industry production function are more appro-
priate. On the other hand, if the focus is on �rm-level di¤erences, then one must take into
account that all the di¤erences between �rms which are size-related, but are not incorpo-
rated into the process to estimate TFP, would ultimately a¤ect the magnitude of the �rm
10

size-TFP relationship. Ideally, parameter estimates would be estimated at the �rm level and
would incorporate �rm-speci�c prices using the dual side of the �rm�s pro�t maximization
problem.
4. Results
4.1 The Magnitude of the Firm Size and Productivity Relationship
4.1.1 Labour Productivity
A strong relationship between �rm size and productivity can be observed in the T2-LEAP
data. Table 1 shows the relative sales per employee for each �rm size class. Although the
strength of the relationship does �uctuate over time, the overall pattern is clear; small �rms
are less productive than larger ones. Relative to the �rms with 0-100 employees, �rms with
more than 500 employees are roughly 30 percent more productive and �rms with between
100 and 500 employees are roughly 20 per cent more productive. Over time, large �rms
also appear to become relative more productive than small �rms. This is due to the fact
that productivity in large �rms has risen faster than productivity in small �rms, and not
to shifts in industry structure.15 Furthermore, the increase in steepness of the productivity-
employment size relationship is not the result of larger �rms simply becoming larger. As
shown later, the average number of employees per �rm has decreased in large �rms.
Some of the di¤erence between large and small �rms could be due to a concentration of
small �rms in less productive industries, so Table 2 presents the relative labour productivity
numbers by industry groups. There exists a clear relationship between size and productivity
in most of the industries in the goods sector. Only in agriculture do small �rms clearly have
higher labour productivity than large �rms.This may be due to the fact that there are rela-
tively few �rms with more than 100 employees in agriculture. The positive size-productivity
relationship is particularly strong in manufacturing where �rms with more than 100 em-
ployees are 80.3 per cent more productive than �rms with less than 100 employees. The
15See the appendix for more details.
11

relationship is weaker in non-manufacturing and in the services industry. Although large
�rms are more productive than small �rms in some service industries, such as wholesale
trade, accommodation and food, and arts and recreation, this is o¤set by a negative rela-
tionship in retail trade and other services. The �nding of a negative relationship between size
and productivity in retail trade is surprising given the widely-held impression that big-box
retailers are more productive than smaller retailers. One possible explanation for this dis-
crepancy is that the �rm size-productivity relationship is due mostly to an establishment-size
productivity relationship and that there are many large retailing �rms with mainly small
establishments.
Industry labour productivity is usually highly correlated with industry capital intensity,
but Table 2 shows that capital intensity also appears to be associated with the magnitude of
the relationship between size and productivity. According to the KLEMS data, the industries
with the lowest capital to labour ratios are: business services, other services, construction,
accommodation and food and retail trade. These are also some of the industries where
the relationship between size and productivity is the weakest. A weaker �rm size-labour
productivity relationship in industries that are less capital intensive is consistent with the
notion that the correlation between �rm size and labour productivity works through capital
intensity. The systematically lower capital intensity of small �rms in turn points to the
likelihood that small �rms face greater capital constraints than larger �rms.
To see how much the industry variation in the size of �rms and in the strength of the
�rm size-productivity relationship a¤ects the aggregate numbers, each �rm�s deviation from
the industry-year average sales per employee is calculated.16 These percentage deviations
are then regressed on a indicator variable for �rms with more than 100 employees and a
constant. The results are shown in Table 3. Large �rms are 10.5 per cent more productive
than small �rms controlling for industry-year di¤erences in productivity and size. This is
compared to the raw gap of 27.1 per cent presented in Table 2. In other words, industry
16Speci�cally, a regression (using employment weights) for each year and industry of �rm log sales peremployee on a constant is performed. The predicted error term for each �rm gives their level of productivityas a deviation from the industry-year average.
12

variation in average productivity and average �rm size accounts for roughly 60 per cent of
the raw size-labour productivity relationship.
Despite the fact that there is a strong size-productivity relationship at the aggregate
level even after controlling for industry di¤erences, this relationship is only true on average.
There are many small �rms that are more productive than large �rms in the same industry.
Figure 2 plots the distributions of log of sales per employee for large and small �rms. The
productivity distribution for large �rms dominates the one for small �rms, but there is much
heterogeneity. This underlines the fact that size is only one of the factors that accounts for
productivity di¤erences across �rms.
The T2-LEAP is not rich in variables that represent these other factors, but it does
contain an imperfect measure of �rm age, the year the �rm exits and corporation type.
Bartlesman and Doms (2000) indicate that �rm age plays a role in accounting for some of
the �rm-level heterogeneity in productivity. Griliches and Regev (1995) �nd that in the years
leading up to exit, �rm employment and productivity drop signi�cantly. Rao and Tang (2000)
�nd evidence that suggests foreign-controlled manufacturing �rms are more productive than
ones under Canadian control. Perhaps foreign-controlled and publicly-traded �rms have
greater access to capital markets,17 or perhaps Canadian controlled private corporations
have not adopted the latest management practices or technologies.18 The degree of foreign
control is not available from the T2-LEAP, but the corporate tax data does indicate whether
a �rm is a Canadian controlled private corporation, (CCPC), an other private corporation or
a public corporation. CCPC is a de�nition for tax purposes and to qualify as a CCPC a �rm
cannot be indirectly controlled by foreigners or public corporations. So while CCPCs are not
foreign controlled, the other corporation types are a mix of foreign and Canadian-controlled
�rms.
The remaining row in Table 3 shows how the relationship between size and productivity
17Globerman, Ries and Vertinsky (1994) �nd that the labor productivity level advantage of foreign-controlled establishments in manufacturing is due to di¤erences in capital intensity and �rm size.18Rao and Tang (2000) �nd that Canadian controlled manufacturing �rms have lower MFP than foreign-
controlled �rms even after controlling for di¤erences in labour quality, �rm age, unionisation, export orein-tation, �rm size and industry structure.
13

is impacted when these other variables are introduced into the productivity regression.19
Overall, the magnitude of the relationship between size and productivity drops by another
half, but is still signi�cant. Within manufacturing, allowing for the industry composition
e¤ect reduces the advantage for larger �rms from 80 to 39 per cent, and including �rm
age and organizational type further reduces it to 24 per cent. For non-manufacturing, the
relationship between size and productivity becomes statistically insigni�cant after controlling
for other e¤ects.
4.1.2 Total Factor Productivity
Table 4 presents the TFP gap between �rms with more than 100 employees and less than
100 employees after taking into account di¤erences in industrial structure. Firm-level TFP
is calculated as the estimated residual in equation (1). Since the constant term in (1) is
allowed to vary by year and detailed industry, the resulting measures of �rm-level TFP are
percentage deviations from industry-year averages. Table 4 shows the di¤erence in average
TFP between the two �rm size categories. The �rst column shows the TFP-size relationship
when each �rm is given equal weight in estimating the parameters of the production function.
For the entire 1984-1997 period, a gap of roughly 8.4 per cent between the TFP of �rms
with more than 100 employees and �rms with less than 100 employees is found. There also
appears to be a slight decline in the di¤erence over time. During the �rst �ve years of the
period, the average di¤erence is 10.2 per cent, while over the last �ve years the di¤erence is
5.1 per cent.
The second column in Table 4 presents the TFP gap when the production function
parameters are estimated weighting each �rm by the level of its output. As expected, the
TFP gap is smaller than when weighted parameter estimates are used.20 For the entire
19The regressions in Table 3 are not meant to capture a causal relationship, rather the intent is to seewhether there is a relationship between size and productivity after controlling for other variables related toboth size and productivity.20Alternatively, a TFP gap that allows the technology parameters (ie. the elasticities of output with
respect to the inputs) to di¤er between large and small �rms can also be calculated. In that case, it is foundthat a TFP gap between large and small �rms is zero in every year. Apparently, allowing �rms of di¤erentsizes to operate using di¤erent production technology eliminates the TFP gap between them. This third
14
period, it is found that �rms with more than 100 employees are 5 per cent more productive
than �rms with less than 100 employees. Again, a downward trend in relative TFP is
observed. The average di¤erence in the �rst �ve years is 5.8 per cent, while the average
di¤erence in the last �ve years is 3.4 percent.
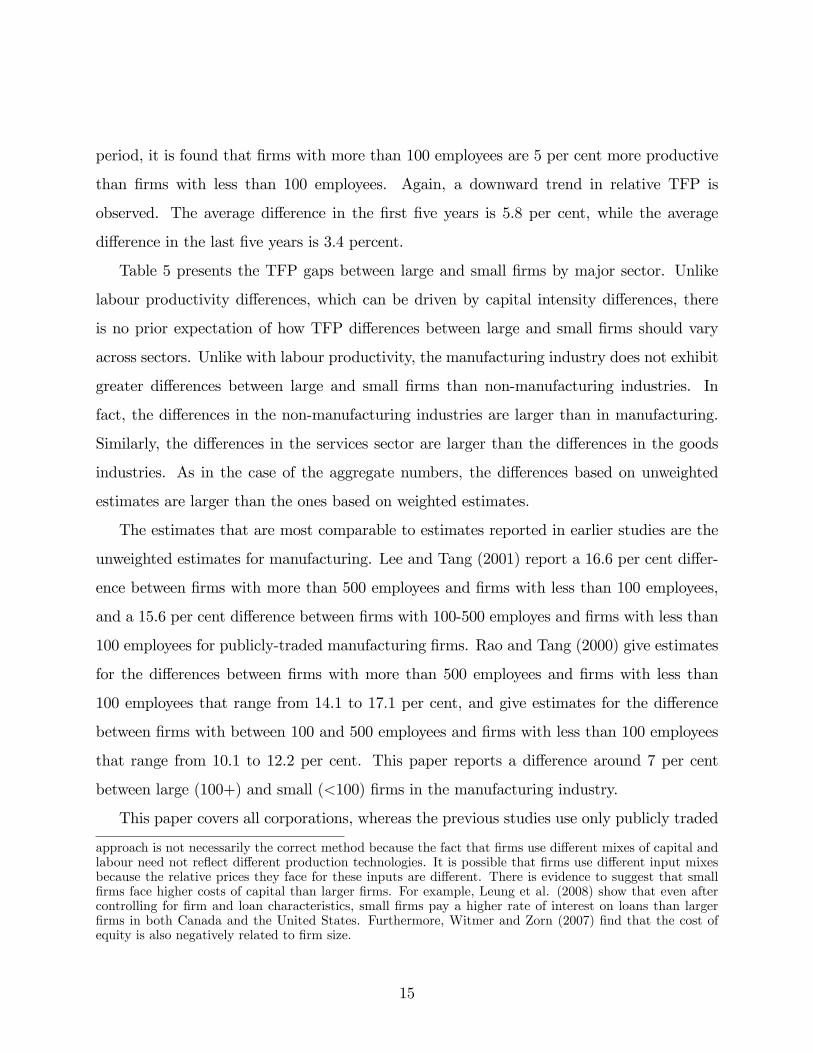
Table 5 presents the TFP gaps between large and small �rms by major sector. Unlike
labour productivity di¤erences, which can be driven by capital intensity di¤erences, there
is no prior expectation of how TFP di¤erences between large and small �rms should vary
across sectors. Unlike with labour productivity, the manufacturing industry does not exhibit
greater di¤erences between large and small �rms than non-manufacturing industries. In
fact, the di¤erences in the non-manufacturing industries are larger than in manufacturing.
Similarly, the di¤erences in the services sector are larger than the di¤erences in the goods
industries. As in the case of the aggregate numbers, the di¤erences based on unweighted
estimates are larger than the ones based on weighted estimates.
The estimates that are most comparable to estimates reported in earlier studies are the
unweighted estimates for manufacturing. Lee and Tang (2001) report a 16.6 per cent di¤er-
ence between �rms with more than 500 employees and �rms with less than 100 employees,
and a 15.6 per cent di¤erence between �rms with 100-500 employes and �rms with less than
100 employees for publicly-traded manufacturing �rms. Rao and Tang (2000) give estimates
for the di¤erences between �rms with more than 500 employees and �rms with less than
100 employees that range from 14.1 to 17.1 per cent, and give estimates for the di¤erence
between �rms with between 100 and 500 employees and �rms with less than 100 employees
that range from 10.1 to 12.2 per cent. This paper reports a di¤erence around 7 per cent
between large (100+) and small (<100) �rms in the manufacturing industry.
This paper covers all corporations, whereas the previous studies use only publicly traded
approach is not necessarily the correct method because the fact that �rms use di¤erent mixes of capital andlabour need not re�ect di¤erent production technologies. It is possible that �rms use di¤erent input mixesbecause the relative prices they face for these inputs are di¤erent. There is evidence to suggest that small�rms face higher costs of capital than larger �rms. For example, Leung et al. (2008) show that even aftercontrolling for �rm and loan characteristics, small �rms pay a higher rate of interest on loans than larger�rms in both Canada and the United States. Furthermore, Witmer and Zorn (2007) �nd that the cost ofequity is also negatively related to �rm size.
15

�rms, so it might be expected that a larger gap would be found in this paper. This is because
the small �rms in the T2-LEAP data should be on average smaller than the small �rms in a
collection of publicly-traded companies. Furthermore, Rao and Tang (2000) control for more
explanatory variables such as labour quality, �rm age, foreign control, export propensity and
unionization. The time periods covered in the studies are shorter than in this paper. Both
Rao and Tang�s (2000) and Lee and Tang�s (2001) data sets cover the 1985-1995 period.
The extra years of data used in this study, 1984, 1996 and 1997, may partly account for our
�ndings relative to theirs because in two of the three years di¤erences in TFP between large
and small �rms are below average. Another possible explanation is that while publicly-traded
�rms in the less-than-100-employees category are larger than small �rms in the T2-LEAP,
publicly traded �rms in the 100-plus category are larger than large �rms in the T2-LEAP.
While di¤erence in the average size between publicly traded and all �rms in the less-than-
100-employees category is bounded, the di¤erence in average size between publicly traded
and all �rms in the 100-plus category is unbounded and potentially larger than the former.
4.2 Aggregate Implications of the Size-Productivity Relationship
4.2.1 Canadian Productivity Levels Over Time
Given the size-productivity relationship, a change in the relative importance of large and
small �rms can have a long-term impact on aggregate labour productivity. Table 6 shows the
evolution of the �rm size distribution between 1984 and 1997. The percentage distribution of
businesses across �rm sizes has changed little over time.21 However, �rm counts themselves
do not reveal changes in the average size of the �rms within each category. Table 7 shows
that the average size of �rms in Canada has fallen from 17.5 employees in 1984 to 15.3
employees in 1997, a 12.6 per cent decline. It also shows that the decline is due mostly to
decreases in the average size of �rms with more than 500 employees. In this category, the
average size fell from 2683 in 1984 to 2261 in 1997, a 15.7 per cent drop.22 This decrease in
21This �nding is consitent with Kanagarajah (2001), who used the 1983-2001 LEAP �le that includesunincorporated �rms as well as corporations.22Again, these �ndings are not sensitive to the inclusion of unincorporated �rms. See Kanagarajah (2001)
16

the average size of large �rms has reduced the fraction of employees that work in this �rm
size category from 42.3 per cent in 1984 to 37.2 per cent in 1997 (Table 8). The reason for the
decline in average size of Canadian �rms and in particular Canada�s largest �rms is unclear.
Shift-share analysis shows that industrial restructuring has little to do with the decline, and
that most of the decline is due to decreases in average size within industries, most notably
mining, oil and gas, manufacturing, transportation and storage, and communication and
utilities.
The impact on labour productivity of the shift away from employment in large �rms can
be assessed by a similar shift-share analysis. The change in aggregate labour productivity
can be decomposed as follows.
LP97 � LP85 =Xk=1
(LPk97 � LPk84)wk84 +Xk=1
(wk97 � wk84)LPk84
+Xk=1
(wk97 � wk84) (LPk97 � LPk84) ; (2)
where LPt is aggregate sales per employee in year t, LPkt is labour productivity for �rm
employment size category k at time t, and wkt is the fraction of total employees working in
employment size category k at time t. Equation (2) decomposes the change in aggregate
labour productivity between 1997 and 1984 into within-�rm-size-category changes in labour
productivity, shifts in the distribution of employees across �rm sizes and the interaction
between the two aforementioned impacts.
Aggregate sales per employee advanced $30,700 between 1984 and 1997.23 Table 9 shows
that shifts in the distribution of employees across �rm sizes caused aggregate sales per em-
ployee to fall $1700, accounting for -5.6 per cent of the aggregate increase. If the employment
distribution had not shifted toward smaller �rms, aggregate sales per employee would have
increased by $33,000, accounting for over 100 per cent of the aggregate increase. Thus while
the decline in �rm size exerts a negative drag on aggregate sales per employee, the magni-
for more details.23The correlation between the industry labour productivity calculated using the T2-LEAP and KLEMS
is examined in the appendix. Despite the large di¤erences in the de�nitions used in putting together themeasures from the two data sets, the correlation between them is strong at 0.77. See the appendix for moredetails.
17

tude of the e¤ect is small. The magnitude of the e¤ect could have been more pronounced in
industries where the decline in �rm size was concentrated (mining, oil and gas, and manu-
facturing), but even here the e¤ect is relatively small. The e¤ect of the decline in �rm size
is -12.8 per cent in mining, oil and gas, and -5.3 per cent in manufacturing.
The contribution of within size category productivity changes can be examined by �rm
size. For all industries, large �rms are found to have contributed disproportionately to
the change in productivity. Firms with more than 500 employees accounted for 42.3 per
cent employment, but 51.5 per cent of the within size category change in productivity. The
contribution of large �rms is even more striking in manufacturing, where �rms with more than
500 employees accounted for 51.9 per cent of employment but 72.1 per cent of the change in
productivity. This is consistent with Baldwin and Gu�s (2003) �nding that the contribution
of multi-plant manufacturing �rms to manufacturing productivity growth exceeds their share
of employment. In contrast, small �rms contribute disproportionately to the total within
size category productivity change in the non-manufacturing sector. However, these results
need to be interpreted with caution. The LEAP data handles the mergers and acquistion
of companies by retroactively combining the records of the companies that merged. For
example, two small companies that merged in the last year of the data set, 1997, would
be combined into a single company for the entire 1984-1997 time period. Therefore, the
contribution of small �rms to productivity changes is likely underestimated.
4.2.2 Canada-U.S. Di¤erence in Productivity Levels
The Canada-U.S. di¤erences in the employment shares across �rm sizes are larger than
the changes over time that occurred within Canada. Table 10 shows that there was a 14
percentage points di¤erence between the employment shares of U.S. and Canadian �rms with
more than 500 employees in 1997.24 It is mainly di¤erences in the smaller size categories
24The U.S. data are from a custom tabulation from the Statistics of U.S. Businesses (SUSB). These datausually contain both unincorporated and incorporated �rms. To match the T2-LEAP, a custom tabulationwas requested to remove unincorporated �rms. The SUSB data also di¤ers from the T2-LEAP in that certainindustries, such as crop and animal farms, are excluded. In this case, the exclusion restrictions were alsoapplied to the T2-LEAP data to allow a comparison. This is why the data in Table 11-13 di¤ers slightlyfrom the numbers already presented in this paper.
18

that balance this gap in the 500+ category, not a di¤erence in the 100-500 employee class.
Canada has 8.1, 4.6 and 1.7 percentage points more employment than the United States in
the less than 20, 20-100 and 100-500 size categories, respectively.
With the exception of the mining, oil and gas industry, the �nding that the United States
has a higher fraction of employment in �rms with more than 500 employees compared to
Canada also holds at the industry level. The di¤erence is greater than 10 percentage points in
agriculture, manufacturing, transportation, wholesale trade, retail trade and other services,
and 5 percentage points in construction.
Before decomposing the Canada-U.S. di¤erence in sales per employee, Canadian real sales
per employee must be converted to U.S. dollars. This is done by taking industry PPPs for
gross output from Rao, Tang and Wang (2004). Rao, Tang and Wang do not report a PPP
for gross output for the entire business sector, but the application of the industry PPPs leads
to an e¤ective PPP of 1.18 for all industries.
Overall, Canada�s level of sales per employee is 82 per cent of that of the United States
in 1997 (Table 11). This is nearly identical to the 83 per cent for value-added labour pro-
ductivity obtained by Rao, Tang, and Wang (2004).25 Unlike Rao, Tang and Wang (2004),
it is possible to see whether there are di¤erences within each �rm size category. It is found
that almost all of the di¤erence is concentrated in the 0-20 and 500+ employment categories.
Canada�s level of sales per employee is 77.4 and 79.6 per cent of that of the United States
in the 0-20 and 500+ categories, respectively. In the other categories, Canadian �rms are
more or as productive as �rms in the United States. Relative to the United States, Canada�s
levels of sales per employee in the 20-100 and 100-500 categories are 96.3 per cent and 106.4
per cent, respectively. Interestingly, these gaps in productivity correspond to the di¤erence
There are also other di¤erences between the T2-LEAP data and the data from the SUSB. The mostimportant one is the concept of employment used.25The smaller gap could be due to the use of gross output based labour productivity in this paper,
compared to value-added labour productivity in Rao, Tang and Wang (2004). This would imply Canada usesintermediate inputs more intensively. The di¤erence could also be due to the omission of the unicorporatedsector. Baldwin and Chowhan (2002) show that the unincorporated sector in Canada performed poorlyrelative to the United States unincorporated sector in terms of labour productivity in the 1988-2000 period.Also, Rao, Tang and Wang (2004) use data based on NAICS, while the industrial classi�cation system usedin this paper is SIC.
19

in average employment per �rm by size category. Table 12 shows that in the size categories
where Canada�s productivity lags that of the United States, it also has on average smaller
�rms. In the less than 20 category, Canadian �rms are roughly 12 per cent smaller than U.S.
�rms, and in the 500+ category, Canadian �rms are one-half the size of U.S.�rms. On the
other hand, in categories where Canada leads the United States in productivity, Canadian
�rms are roughly the same size as U.S. �rms. Together, Table 11 and 12 indicate that it is
in the 500+ category where the Canada-U.S. gap in productivity lies, and it is also where
the di¤erence in average �rm size is the greatest. Canada lacks the extremely large �rms
in the 500+ category that increases the U.S. average �rm size in this category by over 2000
workers per �rm.
Table 11 also shows that Canada lags the United States in sales per employee in a
number of industries including: mining, oil and gas (81.2 percent of that in the United
States), manufacturing (84.8 per cent), transportation, communication and utilities (70.5
per cent), wholesale trade (49.8 per cent), and other services (86.0 per cent). Canada leads
the United States in agricultural services, forestry and �shing (142.9 per cent of that in the
United States), construction (104.4 per cent) and retail trade (103.4 per cent). With the
exception of retail trade, the country that is found to have higher level of sales/employee in
this paper is also found to have a higher level of valued-added labour productivity in Rao,
Tang and Wang (2004).26
The same decomposition to the one in the previous section can be used to ascertain the
contribution of the di¤erence in the employment distribution across �rm size categories to the
Canada-U.S. productivity level gaps in 1997. However, unlike the decomposition across time,
there is no natural country to treat as the �base year.�Therefore, the decomposition is done
26For a number of individual industries, the relative levels of sales/ermployee presented in this paperare similar to the relative labour productivity levels found by Rao, Wang, and Tang (2004). For example,sales/employee in Canadian manufacturing is found to be 84 per cent of that of U.S. manufacturing. This isidentical to the 84 per cent calculated by Rao, Wang and Tang (2004). Other industries where our numbersare similar to those in Rao, Wang and Tang (2004) include: other services (.86 compared to .79 in RWT),and construction (1.04 compared to 1.15 RWT). Industries where the di¤erences are large include: wholesaletrade (.50 compared to .73 in RWT), retail trade (1.03 compared to .85 in RWT), and mining, oil and gas(.81 compared to .99 in RWT). Agricultural services excludes farms, so it cannot be compared to agriculturein Rao, Tang and Wang (2004).
20
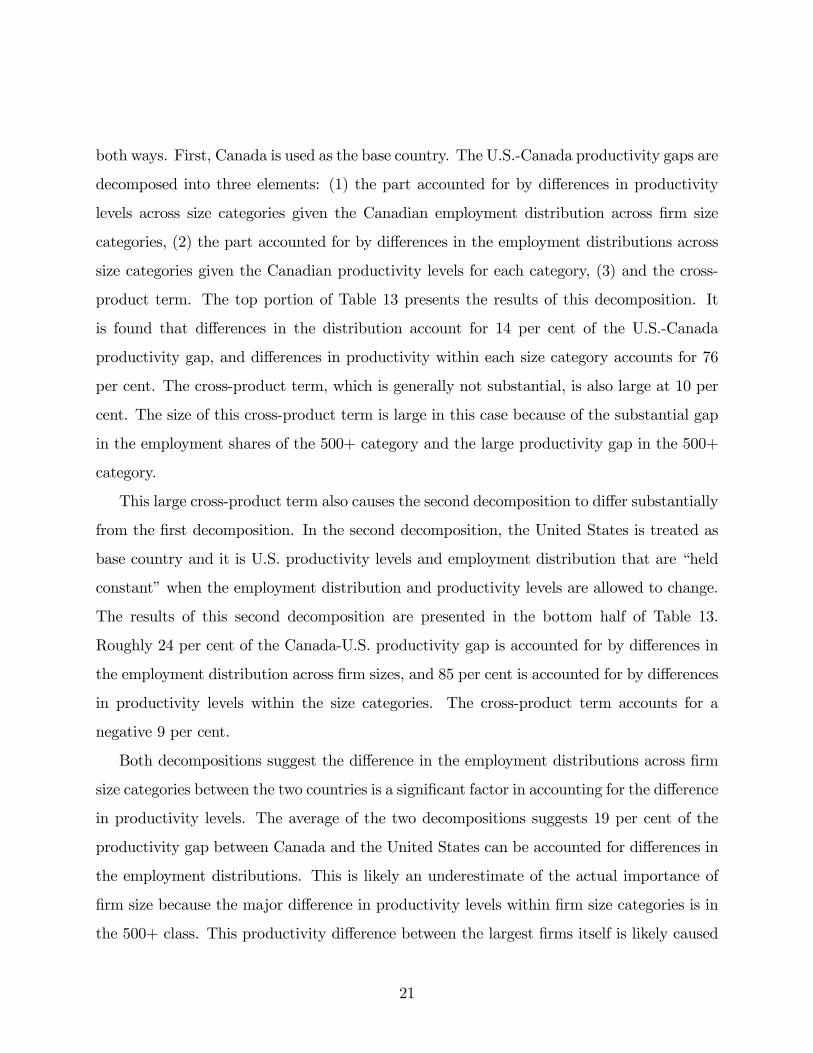
both ways. First, Canada is used as the base country. The U.S.-Canada productivity gaps are
decomposed into three elements: (1) the part accounted for by di¤erences in productivity
levels across size categories given the Canadian employment distribution across �rm size
categories, (2) the part accounted for by di¤erences in the employment distributions across
size categories given the Canadian productivity levels for each category, (3) and the cross-
product term. The top portion of Table 13 presents the results of this decomposition. It
is found that di¤erences in the distribution account for 14 per cent of the U.S.-Canada
productivity gap, and di¤erences in productivity within each size category accounts for 76
per cent. The cross-product term, which is generally not substantial, is also large at 10 per
cent. The size of this cross-product term is large in this case because of the substantial gap
in the employment shares of the 500+ category and the large productivity gap in the 500+
category.
This large cross-product term also causes the second decomposition to di¤er substantially
from the �rst decomposition. In the second decomposition, the United States is treated as
base country and it is U.S. productivity levels and employment distribution that are �held
constant�when the employment distribution and productivity levels are allowed to change.
The results of this second decomposition are presented in the bottom half of Table 13.
Roughly 24 per cent of the Canada-U.S. productivity gap is accounted for by di¤erences in
the employment distribution across �rm sizes, and 85 per cent is accounted for by di¤erences
in productivity levels within the size categories. The cross-product term accounts for a
negative 9 per cent.
Both decompositions suggest the di¤erence in the employment distributions across �rm
size categories between the two countries is a signi�cant factor in accounting for the di¤erence
in productivity levels. The average of the two decompositions suggests 19 per cent of the
productivity gap between Canada and the United States can be accounted for di¤erences in
the employment distributions. This is likely an underestimate of the actual importance of
�rm size because the major di¤erence in productivity levels within �rm size categories is in
the 500+ class. This productivity di¤erence between the largest �rms itself is likely caused
21

partly by the fact that the United States has larger �rms than Canada in this category, a
factor that the decomposition cannot pick up.27
Di¤erences in productivity within employment size categories account for the majority of
most industry-level productivity gaps between Canada and the United States. An important
industry where the factors are more balanced is manufacturing. In manufacturing, within-
size category productivity di¤erences account for 45 to 52 per cent of the productivity gap
between Canada and the United States, while di¤erences in the employment distribution ac-
count of 48 to 54 per cent. The larger proportion accounted for by di¤erences in employment
distribution is due to the fact that �rms with more than 500 employees in manufacturing are
more than twice as productive than �rms in the 0-20 employee category. For all industries
the productivity di¤erential between the 500+ and the 0-20 category is roughly 30 per cent,
smaller than the productivity di¤erentials between the 500+ and the 100-500 category in
manufacturing of 60 per cent in Canada and 80 per cent in the United States. This last
point underlines the importance of having large �rms in manufacturing.
Another industry of note is retail trade. As mentioned above, it is the one industry
where there is a discrepancy between the relative productivity �ndings in this paper and
that of Rao, Tang and Wang (2004). Looking within the employment size categories, it
is found that this paper�s �nding of a more productive retail trade industry in Canada is
driven by a productivity advantage Canada holds in the 20-100 employee category. In this
category, Canadian �rms are 36 per cent more productive than U.S. �rms, but in all other
size categories the productivity of Canadian �rms trail that of U.S. �rms. Whether this
productivity advantage is genuine or is due to measurement issues pertaining to retail trade
needs to be further investigated. For example, Baldwin and Gu (2004a) point out that the
preferable measure for output in retail trade is gross margins - sales minus cost of goods
purchased for resale - and not sales.
27More detailed size categories at the top end would not necessarily allocate more of the Canada-U.S.productivity di¤erence to di¤erences in employment distributions. This is because it is not only the casethat Canada has fewer large �rms in the highest categories, there could also be categories in which Canadahas no �rms. In this case, the decomposition would break down as there would be no Canadian referencepoint.
22

The decomposition of the U.S.-Canada di¤erence in sales/employee for retail trade also
stands out because of the large contribution from the di¤erence in employment distributions
and from the cross-product term. However, this is less of a puzzle because the absolute size
of the gap in retail trade productivity levels between Canadian and U.S. is small; it is by far
the smallest among all industries.
5. Conclusion
This paper examines the relationship between �rm size and productivity. In contrast
to previous studies, this paper o¤ers evidence of the relationship not only from the man-
ufacturing sector, but from non-manufacturing �rms as well. Furthermore, the aggregate
importance of the �rm size-productivity relationship is gauged by calculating to what extent
shifts in the distribution of employment over �rm size categories has a¤ected Canadian ag-
gregate productivity, and whether di¤erences in the employment distribution over �rm size
categories between Canada and the United States can account for the Canada-U.S. labour
productivity gap.
Evidence of a relationship between �rm size and labour productivity (as measured by
sales per employee) is found at the aggregate level and in both manufacturing and non-
manufacturing. The stronger relationship found in manufacturing is hypothesized to be the
result of greater capital intensity in that sector. Next, evidence of a relationship between
�rm size and TFP is presented. The �nding that the relationship is slightly stronger in non-
manufacturing than in manufacturing con�rms that TFP is not driving the stronger size-
labour productivity relationship in manufacturing. Despite the strong relationship between
�rm size and labour productivity, the small changes in the distribution of employment across
�rm size categories in Canada over time have had only a minimal impact on aggregate labour
productivity. Instead, within �rm size category productivity growth accounts for much of
the change in aggregate labour productivity. In contrast, the more substantial di¤erences
in the employment distributions between Canada and the United States accounts for 19 per
cent of the aggregate labour productivity gap and 51 per cent of the labour productivity gap
23

in manufacturing. The latter �nding is driven by the large productivity di¤erential between
large and small �rms in manufacturing in both countries.
There are a number of �ndings in the paper that need further investigation. For example,
the negative size-productivity relationship in retail trade. In these cases, either alternative
measures of output are needed, or plant and �rm-level data need to be compared. Therefore,
these issues are left to future research.
24

References
[1] Abbott, T. 1992. �Price Dispersion in U.S. Manufacturing: Implications for the Aggre-
gation of Products and Firms.�Discussion Papers CES 92-3, Bureau of Census.
[2] Baily, M., C. Hulten, D. Campbell, T. Bresnahan, R. Caves. 1992. �Productivity Dy-
namics in Manufacturing Plants.�Brookings Papers on Economic Activity: Microeco-
nomics 1992: 187-267.
[3] Baldwin, J.R. 1995. The Dynamics of Industrial Competition. Cambridge: Cambridge
University Press.
[4] Baldwin, J.R.., and J. Chowhan. 2003. �The Impact of Self-employment on Labour
Productivity Growth: A Canada-US Comparion.�Economic Analysis Research Paper
Series No. 16, Statistics Canada.
[5] Baldwin, J.R., R. Jarmin and J. Tang. 2002. �The Trend to Smaller Producers in Man-
ufacturing: A Canada/U.S. Comparison.�Economic Analysis Research Paper Series,
No. 3, Statistics Canada.
[6] Baldwin, J.R., R. Dupuy and R. Penner. 1992. �Development of the Longitudinal Panel
Data from Business Registers: Canadian Experience.�Statistical Journal of the United
Nations 9: 1-15.
[7] Baldwin, J.R., and T. Harchaoui. 2002. Productivity Growth in Canada - 2001. Statistics
Canada, Catalogue No. 15-204.
[8] Baldwin, J.R., andW. Gu. 2003. �Plant Turnover and Productivity Growth in Canadian
Manufacturing.�Analytical Studies Research Paper Series No. 193, Statistics Canada.
[9] Baldwin, J.R., and W. Gu. 2004a. �Productivity Growth in the Canadian Retail Trade
Sector: Evidence from Micro Data.� Micro-Economic Analysis Division, Statistics
Canada.
25
[10] Baldwin, J.R., and W. Gu. 2004b. �Industrial Competition, Shifts in Market Share,
and Productivity Growth.�Economic Analysis Research Paper Series No. 21, Statistics
Canada.
[11] Baldwin, J.R., and W. Gu. 2006. �Competition, Firm Turnover and Productivity
Growth.�Economic Analysis Research Paper Series No. 42, Statistics Canada.
[12] Bartlesman, E., and M. Doms. 2000. �Understanding Productivity: Lessons from Lon-
gitudinal Microdata.�Journal of Economic Literature 38(3): 569-594.
[13] Becker, R., J. Haltiwanger, R. Jarmin, S. Klimek, and D. Wilson. 2004. �Micro and
Macro Data Integration: The Case of Capital.�
[14] Cabral, L. and J. Mata. 2003. �On the Evolution of the Firm Size Distribution: Facts
and Theory.�American Economic Review 93(4): 1075-1090.
[15] Caves, D., L. Christensen, and E. Diewert. 1982. �The Economic Theory of Index
Numbers and the Measurement of Input, Output, and Productivity.� Econometrica
50 (November): 1393-1414.
[16] Criscuolo, C., and R. Martin. 2005. �Multinationals and U.S. Productivity Leadership:
Evidence from Great Britain.�CEP Discussion Paper No. 672.
[17] Eslava, M., J. Haltiwanger, A. Kugler, M. Kugler. 2004. �The E¤ects of Structural
Reforms on Productivity and Pro�tability Enhancing Reallocation: Evidence from
Columbia.�Journal of Development Economics 75(2): 333-371.
[18] Foster, L., J. Haltiwanger, C.J. Krizan. 2002. �The Link Between Aggregate and Micro
Productivity Growth: Evidence from Retail Trade.�NBER Working Paper No. 9120.
[19] Globerman, S., J. Ries and I. Vertinshky. 1994. �The Economic Performance of Foreign
A iates in Canada.�Canadian Journal of Economics 27: 141-56.
26

[20] Griliches, Z., and H. Regev. 1995. �Firm Productivity in Israeli Industry, 1979-1988.�
Journal of Econometrics 65(1).
[21] Haltiwanger, J. 2004. �Measuring Micro and Macro Productivity Dynam-
ics.� <http://siteresources.worldbank.org/INTECAREGTOPMACGRO/ Re-
sources/haltiwanger.ppt >
[22] Jovanovic, B. 1982. �Selection and Evolution of Industry.�Econometrica 50(3): 649-70.
[23] Kanagarajah, S. 2001. �Business Dynamics in Canada.�Statstics Canada, Business and
Labour Market Analysis Division, Catalogue no. 61-534-XIE.
[24] Lee, F., and J. Tang. 2001. �Multifactor Productivity Disparity Between Canadian and
U.S. Manufacturing Firms.�Journal of Productivity Analysis 15: 115-128.
[25] Leung, D., C. Meh and Y. Terajima. 2008. �Are There Canada-U.S. Di¤erences in SME
Financing.�Mimeo.
[26] Levinsohn, J., and A. Petrin. 2000. �Estimating Production Functions Using Inputs to
Control for Unobservables.�NBER Working Paper No. 7819.
[27] OECD. 2001. �Productivity and Firm Dynamics: Evidence from Microdata.�OECD
Economic Outlook 69.
[28] Olley, S., and A. Pakes. 1996. �The Dynamics of Productivity in the Telecommunications
Equipment Industry.�Econometrica 64: 1263-97.
[29] Rao, S., and J. Tang. 2000. �Are Canadian-Controlled Manufacturing Firms Less Pro-
ductive Than Their Foreign Controlled Counterparts?�Industry Canada, Working Pa-
per Number 31, (February).
[30] Rao, S., W. Wang and J. Tang. 2004. �Productivity Levels Between Canada and U.S.
Industries.�International Productivity Monitor (9): 3-14.
27

[31] Snodgrass, D.R., and T. Biggs. 1995. Industrialization and Small Firms Patterns and
Policies. San Francisco: International Center for Economic Growth.
[32] Staiger, D., and J. Stock. 1997. �Instrumental Variable Regression with Instruments.�
Econometrica 65(3): 557-86.
[33] Van Ark, B., and E. Monnikhof. 1996. �Size Distribution of Output and Employment:
A Data Set For Manufacturing Industries in Five OECD Countries, 1960s-1990.�OECD
Economics Department Working Paper No. 166.
[34] Van Biesebroeck, J. 2005. �Firm Size Matters: Growth and Productivity Growth in
African Manufacturing.�Economic Development and Cultural Change 53: 546�583.
[35] Witmer, J., and L. Zorn. 2007. �Estimating and Comparing the Implied Cost of Equity
for Canadian and U.S. Firms.�Bank of Canada Working Paper 2007-48.
28
Appendix
Productivity in KLEMS and T2-LEAP
T2-LEAP contains information for most �rms operating within Canada. Theoretically,
only unincorporated �rms (restriction of the T2 �le) and nonemployers (restriction of LEAP)
are omitted. So despite the fact T2-LEAP is not used in putting together the KLEMS
data (which forms the basis of Statistics Canada o¢ cial labour and multifactor productiv-
ity numbers), the industry productivity numbers from T2-LEAP and from KLEMS should
be correlated. The correlation should not be perfect because the T2-LEAP excludes the
unincorporated self-employment sector, which Baldwin and Chowhan (2003) show has a sig-
ni�cant impact on the business sector labour productivity (value-added output) over the
1987-1998 period. Also, the de�nition of output, labour and capital di¤ers between the data
sets. Gross output is sales in the T2-LEAP. For some industries, sales is used as a measure
of output in KLEMS, but in others, such as FIRE, retail trade and wholesale trade, a margin
concept is used. For example, in retail trade, output is sales less the cost of goods purchased
for resale. While capital in T2-LEAP is book value of assets, KLEMS�measure of capital
is based on a perpetual inventory method and is quality adjusted to re�ect di¤erent rates
of service per dollar of capital for di¤erent types of capital. In addition, while labour in
T2-LEAP is similar to job counts (employment in the Survey of Employment Payroll and
Hours), KLEMS�measure of labour is hours worked. Together, these di¤erences between
KLEMS and T2-LEAP should will drive a signi�cant wedge between the productivity esti-
mates. However, it would be surprising if the productivity estimates from the two sources are
uncorrelated. The industry annual average labour productivity growth rates for 1984-1997
from the T2-LEAP and KLEMS are positive correlated at 0.77. Furthermore, the rates from
the T2-LEAP do not appear to be systematically underpredicting over overpredicting the
labour productivity numbers from the KLEMS.
29

Statistics of U.S. Business and the T2-LEAP
Data for the �rm counts, employment and sales comes from the Statistics of U.S. Small
Business (SUSB) and Statistics Canada�s T2-LEAP. In both countries, �rms are enterprises
that can own or control more than one establishment, �rm counts are obtained from business
registers, employment counts are derived from payroll data, and there is no distinction
made between part and full-time employees. In addition, only �rm with paid employees are
included. Self-employed individuals who do not have employees working for them are not
included. The U.S. omits crop and animal production, rail transportation, postal service,
pension, health and vacation funds, trusts, estates, agency accounts, private households,
and public administration. Industry codes in the T2-LEAP allow the removal of most of
the these data from the Canadian data. The T2-LEAP only contain corporations while the
SUSB is for all employer businesses, but a custom tabulation from the SUSB was obtained
to remove the unincorporated �rms in the U.S. data.
There are some methodological di¤erences in the way the employment counts are ob-
tained. In the U.S., payroll data in pay period including March 12 is used to determine
employment counts. In Canada, the annual earnings on all T4s (issued by the �rm to each
employee detailing annual earnings of each employee of the �rm for tax purposes) of the �rm
are summed to obtain the �rm�s payroll. The payroll is then divided by the average annual
earnings of a typical worker (from the Survey of Employment Payroll and Hours (SEPH)
- an establishment survey generating numbers similar to that of the Current Employment
Statistics in the United States) in the �rm�s industry, province and employment size class.
The resulting average labour unit is conceptually identical to the employment measure in
SEPH.
In the U.S. data, there are instances where a �rm has zero employees. In the United
States, �rms might have an annual payroll and thus be included in the counts, but no
employees around March 12. These �rms include those that exited before that period or
entered after that period. These �rms are omitted in the calculation of sales per employee.
This implicitly assumes that this subset of entrants and exiters have the same average labour
30

productivity as incumbents in the size class they enter into or exit from. The sales of these
�rms is less than one per cent of the total, and should not signi�cantly a¤ect the conclusions
presented in the paper.
31
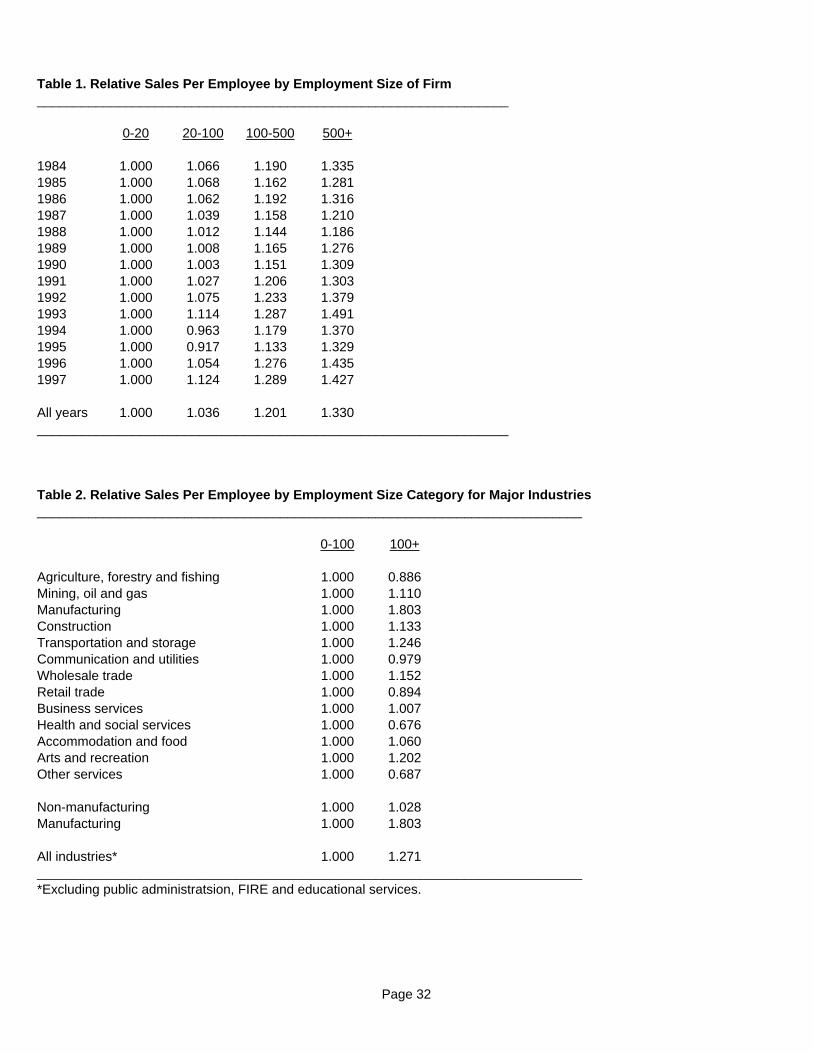
Table 1. Relative Sales Per Employee by Employment Size of Firm________________________________________________________________
0-20 20-100 100-500 500+
1984 1.000 1.066 1.190 1.3351985 1.000 1.068 1.162 1.2811986 1.000 1.062 1.192 1.3161987 1.000 1.039 1.158 1.2101988 1.000 1.012 1.144 1.1861989 1.000 1.008 1.165 1.2761990 1.000 1.003 1.151 1.3091991 1.000 1.027 1.206 1.3031992 1.000 1.075 1.233 1.3791993 1.000 1.114 1.287 1.4911994 1.000 0.963 1.179 1.3701995 1.000 0.917 1.133 1.3291996 1.000 1.054 1.276 1.4351997 1.000 1.124 1.289 1.427
All years 1.000 1.036 1.201 1.330________________________________________________________________
Table 2. Relative Sales Per Employee by Employment Size Category for Major Industries__________________________________________________________________________
0-100 100+
Agriculture, forestry and fishing 1.000 0.886Mining, oil and gas 1.000 1.110Manufacturing 1.000 1.803Construction 1.000 1.133Transportation and storage 1.000 1.246Communication and utilities 1.000 0.979Wholesale trade 1.000 1.152Retail trade 1.000 0.894Business services 1.000 1.007Health and social services 1.000 0.676Accommodation and food 1.000 1.060Arts and recreation 1.000 1.202Other services 1.000 0.687
Non-manufacturing 1.000 1.028Manufacturing 1.000 1.803
All industries* 1.000 1.271__________________________________________________________________________*Excluding public administratsion, FIRE and educational services.
Page 32

Table 3. Size-Productivity Relationship Controlling for Industry Composition, Firm Age and Organizational Type___________________________________________________________________________________________
All industries* Manufacturing Non-manufacturing
Raw gap 0.271 0.803 0.028
With controls for:
Industry composition 0.1045 0.3943 0.0264(0.0117) (0.0130) (0.0160)
Industry composition, 0.0521 0.2404 -0.0081 firm age and type (0.0116) (0.0097) (0.0157)___________________________________________________________________________________________Standard errors in parentheses.*Excluding public administratsion, FIRE and educational services.
Table 4. Deviation of TFP from Industry-Year Means, Gap Between Large (100+) and Small (<100) Firms___________________________________________________________________________________________________
Unweighted Output weighted
1984 0.102 0.0621985 0.104 0.0761986 0.105 0.0351987 0.101 0.0631988 0.097 0.0541989 0.103 0.0641990 0.108 0.0411991 0.117 0.0791992 0.118 0.0671993 0.056 0.0441994 0.065 0.0401995 0.034 0.0331996 0.039 0.0331997 0.063 0.018
All years 0.084 0.052___________________________________________________________________________________________________
Page 33

Table 5. Deviation of TFP from Industry-Year Means, Gap Between Large (100+) and Small (<100) Firms, by Major Sector___________________________________________________________________________________________________
Unweighted Output weighted
Non-manufacturing 0.096 0.064Manufacturing 0.066 0.036___________________________________________________________________________________________________
Table 6. Firm Size Distribution (%)______________________________________________
0-20 20-100 100-500 500+
1984 89.0 9.3 1.4 0.31985 88.8 9.5 1.4 0.31986 88.6 9.7 1.4 0.31987 88.2 10.1 1.4 0.31988 88.1 10.2 1.5 0.31989 88.0 10.3 1.5 0.31990 88.6 9.8 1.4 0.31991 89.2 9.3 1.3 0.31992 89.5 9.0 1.2 0.21993 90.0 8.6 1.2 0.21994 89.8 8.6 1.3 0.21995 89.7 8.7 1.4 0.31996 89.5 8.9 1.3 0.31997 89.5 8.9 1.3 0.3______________________________________________
Page 34

Table 7. Average Number of Employees Per Firm_______________________________________________________
0-20 20-100 100-500 500+ Total
1984 4.4 38.5 191.6 2683.2 17.51985 4.4 38.6 192.0 2680.5 17.51986 4.4 38.6 190.9 2637.2 17.41987 4.5 38.8 191.1 2561.7 17.61988 4.5 39.0 190.9 2492.2 17.81989 4.5 38.9 191.8 2525.7 17.61990 4.5 39.0 191.4 2534.6 16.91991 4.4 39.1 192.7 2558.0 16.31992 4.2 39.0 191.8 2536.3 15.51993 4.2 38.7 190.0 2461.1 15.01994 3.9 39.8 187.7 2335.3 15.11995 3.9 40.3 188.4 2327.8 15.41996 4.1 39.3 189.2 2296.6 15.31997 4.1 39.1 188.6 2261.2 15.3_______________________________________________________
Table 8. Distribution of Employment Across Firm Size Categories (%)_______________________________________________________________
0-20 20-100 100-500 500+
1984 22.3 20.6 14.8 42.31985 22.4 21.0 15.2 41.41986 22.6 21.6 15.3 40.51987 22.6 22.1 15.5 39.81988 22.5 22.3 15.8 39.41989 22.5 22.7 15.8 39.01990 23.5 22.7 15.5 38.31991 23.8 22.3 15.3 38.61992 24.4 22.6 14.7 38.21993 25.0 22.2 15.1 37.81994 23.5 22.7 16.4 37.41995 22.7 22.8 17.0 37.51996 23.9 22.9 15.9 37.31997 24.2 22.9 15.7 37.2_______________________________________________________________
Page 35

Table 9. Decomposition of Change in Sales per Employee Between 1997 and 1985____________________________________________________________________________________________________
Within size Shift in distribution Crosscategory Product
All industries* 1.077 -0.056 -0.021
Agriculture, forestry and fishing 1.042 0.001 -0.043Mining, oil and gas 1.022 -0.128 0.106Manufacturing 1.091 -0.053 -0.037Construction 1.015 -0.068 0.053Transportation and storage 1.221 -0.012 -0.210Communication and utilities 1.002 -0.035 0.033Wholesale trade 0.973 -0.009 0.036Retail trade 0.790 0.102 0.108Business services 0.988 0.037 -0.025Accommodation and food 0.952 0.034 0.014Arts and recreation 0.739 0.592 -0.331Other services 1.016 -0.005 -0.010
Non-manufacturing 0.972 0.007 0.021Manufacturing 1.091 -0.053 -0.037____________________________________________________________________________________________________*Excluding public administratsion, FIRE and educational services.
Page 36

Table 10. Distribution of Employment Across Firm Size, Canada and the United States, 1997___________________________________________________________________________________________
0-20 20-100 100-500 500+Canada
All industries* 23.9 23.2 16.0 36.9Agricultural services, foresty and fishing** 55.8 29.8 14.4 -----Mining, oil and gas 10.0 11.7 15.5 62.9Manufacturing 9.8 20.1 21.4 48.7Construction 52.5 29.3 11.4 6.8Transportation, communication and utilities 15.7 15.4 12.8 56.1Wholesale trade 28.8 31.1 19.5 20.7Retail trade 27.5 22.6 9.7 40.3Other serivces 28.4 25.2 16.1 30.3
United States
All industries* 15.8 18.6 14.3 51.2Agricultural services, foresty and fishing** 45.4 27.9 26.7 -----Mining, oil and gas 11.6 15 11.9 61.4Manufacturing 6.7 15.4 15.6 62.3Construction 35.9 35.4 16.8 11.9Transportation, communication and utilities 10 12.2 10.2 67.5Wholesale trade 23.1 25.4 15.7 35.9Retail trade 16 19.9 10 54.1Other serivces 17 16.5 16.8 49.7___________________________________________________________________________________________*Excluding public administration, FIRE, and crop and animal production.**The 100-500 and 500+ categories are combined for this industry.
Page 37

Table 11. Sales per Employee (Thousands of U.S. Dollars), Canada and the United States, 1997 ___________________________________________________________________________________________
0-20 20-100 100-500 500+ TotalCanada
All industries* 121.5 133.7 148.4 160.3 142.9Agricultural services, foresty and fishing** 102.6 102.2 102.3 ----- 101.9Mining, oil and gas 211.2 251.5 232.9 246.1 241.2Manufacturing 103.1 108.7 154.2 242.4 183.0Construction 153.6 178.7 183.1 157.2 164.5Transportation, communication and utilities 124.8 128.3 118.8 161.2 145.0Wholesale trade 276.4 304.0 387.8 301.4 311.9Retail trade 116.6 181.3 143.9 101.3 127.7Other serivces 72.8 54.2 58.8 61.7 62.5
United States
All industries* 157.0 138.9 139.5 201.5 173.9Agricultural services, foresty and fishing** 82.1 64.9 59.8 ----- 71.3Mining, oil and gas 185.2 183.1 204.9 363.8 296.9Manufacturing 125.2 121.9 148.8 265.3 215.7Construction 151.9 144.7 162.3 206.8 157.6Transportation, communication and utilities 114.5 104.8 131.8 248.7 205.6Wholesale trade 492.4 393.4 450.0 955.7 626.8Retail trade 119.4 133.1 153.9 115.6 123.5Other serivces 93.9 67.7 57.6 72.3 72.7
Canada/United States
All industries* 0.774 0.963 1.064 0.796 0.822Agricultural services, foresty and fishing** 1.250 1.575 1.711 ----- 1.429Mining, oil and gas 1.140 1.374 1.137 0.676 0.812Manufacturing 0.823 0.892 1.036 0.914 0.848Construction 1.011 1.235 1.128 0.760 1.044Transportation, communication and utilities 1.090 1.224 0.901 0.648 0.705Wholesale trade 0.561 0.773 0.862 0.315 0.498Retail trade 0.977 1.362 0.935 0.876 1.034Other serivces 0.775 0.801 1.021 0.853 0.860___________________________________________________________________________________________*Excluding public administration, FIRE, and crop and animal production.**The 100-500 and 500+ categories are combined for this industry.
Page 38

Table 12. Average Firm Size, Canada and the United States, 1997 ___________________________________________________________________________________________
0-20 20-100 100-500 500+ TotalCanada
All industries* 4.2 39.2 188.8 2160.3 15.6Agricultural services, foresty and fishing** 3.6 33.9 194.8 ----- 6.0Mining, oil and gas 3.3 40.5 204.8 1639.6 29.2Manufacturing 5.3 41.7 193.2 1948.4 40.4Construction 3.4 35.3 181.1 998.0 6.1Transportation, communication and utilities 3.4 38.5 196.1 3200.1 19.5Wholesale trade 4.5 38.2 182.9 145.0 13.7Retail trade 4.7 40.0 168.8 4225.0 15.5Other serivces 4.1 38.9 193.5 1824.1 13.1
United States
All industries* 4.8 39.4 194.8 4235.1 25.8Agricultural services, foresty and fishing** 4.6 34.4 283.6 ----- 9.2Mining, oil and gas 4.4 37.1 131.9 894.8 31.3Manufacturing 6.3 41.3 177.6 2456.5 64.7Construction 4.7 37.4 164.7 850.4 11.4Transportation, communication and utilities 4.4 38.3 160.2 2480.4 37.4Wholesale trade 4.9 36.1 127.3 711.3 17.8Retail trade 5.3 37.8 162.7 3682.2 27.9Other serivces 4.3 38.8 180.9 2010 22.1
Canada/United States
All industries* 0.875 0.995 0.969 0.510 0.605Agricultural services, foresty and fishing** 0.783 0.985 0.687 ----- 0.652Mining, oil and gas 0.750 1.092 1.553 1.832 0.933Manufacturing 0.841 1.010 1.088 0.793 0.624Construction 0.723 0.944 1.100 1.174 0.535Transportation, communication and utilities 0.773 1.005 1.224 1.290 0.521Wholesale trade 0.918 1.058 1.437 0.204 0.770Retail trade 0.887 1.058 1.037 1.147 0.556Other serivces 0.953 1.003 1.070 0.908 0.593___________________________________________________________________________________________*Excluding public administration, FIRE, and crop and animal production.**The 100-500 and 500+ categories are combined for this industry.
Page 39

Table 13. Decomposition of U.S.-Canada Difference in Sales per Employee (%), 1997____________________________________________________________________________________________
Within Size Difference in CrossCategory Distribution Product
Canada as base country
All industries* 75.7 14.2 10.1Agricultural services, foresty and fishing 93.7 0.1 6.2Mining, oil and gas 106.0 -0.3 -5.7Manufacturing 45.4 48.0 6.7Construction 142.4 -47.9 5.6Transportation, communication and utilities 75.2 6.7 18.1Wholesale trade 75.3 -0.5 25.2Retail trade 80.4 89.7 -70.1Other serivces 121.6 -6.2 -15.4
United States as base country
All industries* 85.2 23.7 -8.9Agricultural services, foresty and fishing 101.5 7.9 -9.4Mining, oil and gas 99.9 -6.4 6.4Manufacturing 51.8 54.4 -6.2Construction 148.4 -41.9 -6.4Transportation, communication and utilities 93.2 24.8 -18.0Wholesale trade 100.8 24.9 -25.6Retail trade 9.7 19.0 71.3Other serivces 106.7 -21.1 14.4____________________________________________________________________________________________*Excluding public administration, FIRE, and crop and animal production.
Page 40

41
Figure 1. Gross output from KLEMS and Sales from T2-LEAP
Agriculture, forestry and fishing
32000
37000
42000
47000
52000
57000
1984
1985
1986
1987
1988
1989
1990
1991
1992
1993
1994
1995
1996
1997
mill
ion
8000
13000
18000
23000
28000
mill
ion
Gross output Sales
Mining, oil and gas
20000
30000
40000
50000
60000
70000
1984
1985
1986
1987
1988
1989
1990
1991
1992
1993
1994
1995
1996
1997
mill
ion
Gross output Sales
Manufacturing
0100000200000300000400000500000600000
1984
1985
1986
1987
1988
1989
1990
1991
1992
1993
1994
1995
1996
1997
mill
ion
Gross output Sales
Construction
60000
70000
8000090000
100000
110000
1984
1986
1988
1990
1992
1994
1996
mill
ion
38000
48000
5800068000
78000
88000
mill
ion
Gross output Sales
Transportation, warehousing and storage
20000300004000050000600007000080000
1984
1985
1986
1987
1988
1989
1990
1991
1992
1993
1994
1995
1996
1997
mill
ion
Gross output Sales
Communication and utilities
32000
42000
52000
62000
72000
1984
1985
1986
1987
1988
1989
1990
1991
1992
1993
1994
1995
1996
1997
mill
ion
2000025000300003500040000450005000055000
mill
ion
Gross output Sales

42
Figure 1. Gross output from KLEMS and Sales from T2-LEAP, continued
Wholesale trade
250003500045000
550006500075000
1984
1985
1986
1987
1988
1989
1990
1991
1992
1993
1994
1995
1996
1997
mill
ion
120000
170000
220000
270000
mill
ion
Gross output Sales
Retail trade
36000
46000
56000
66000
76000
1984
1985
1986
1987
1988
1989
1990
1991
1992
1993
1994
1995
1996
1997
mill
ion
110000130000150000170000190000210000230000
mill
ion
Gross output Sales
FIRE
500007000090000
110000130000150000170000
1984
1985
1986
1987
1988
1989
1990
1991
1992
1993
1994
1995
1996
1997
mill
ion
100000120000140000160000180000200000220000
mill
ion
Gross output Sales
Business services
020000400006000080000
100000
1984
1985
1986
1987
1988
1989
1990
1991
1992
1993
1994
1995
1996
1997
mill
ion
Gross output Sales
Health care and social services
10000
15000
20000
25000
30000
1984
1985
1986
1987
1988
1989
1990
1991
1992
1993
1994
1995
1996
1997
mill
ion
25004500650085001050012500
mill
ion
Gross output Sales
Accommodation and food
1000015000200002500030000350004000045000
1984
1985
1986
1987
1988
1989
1990
1991
1992
1993
1994
1995
1996
1997
mill
ion
Gross output Sales

43
Figure 1. Gross output from KLEMS and Sales from T2-LEAP, continued
Arts, entertainment and recreation
0
5000
10000
15000
20000
1984
1985
1986
1987
1988
1989
1990
1991
1992
1993
1994
1995
1996
1997
mill
ion
Gross output Sales
Other services
150000200000250000
300000350000
1984
1985
1986
1987
1988
1989
1990
1991
1992
1993
1994
1995
1996
1997
mill
ion
100001500020000250003000035000
mill
ion
Gross output Sales
Figure 2. Distribution of Log Sales Per Employee
0.00000.05000.10000.15000.20000.25000.30000.35000.40000.45000.5000
1.0 1.4 1.8 2.2 2.6 3.0 3.4 3.8 4.2 4.6 5.0 5.4 5.8 6.2 6.6 7.0 7.4 7.8
>= 100 employees <100 employees