Embed Size (px)
Citation preview

Firm Behavior, market Deregulation anD ProDuctivity in SPain
César Alonso-Borrego
Documentos de trabajo n.º 1035
2010

FIRM BEHAVIOR, MARKET DEREGULATION AND PRODUCTIVITY IN SPAIN

FIRM BEHAVIOR, MARKET DEREGULATION AND PRODUCTIVITY
IN SPAIN
César Alonso-Borrego (*)
UNIVERSIDAD CARLOS III DE MADRID
(*) I gratefuly acknowledge the Bank of Spain for providing the financing and material support for this research. I thank Juan F. Jimeno and the staff of the Research Division for helpful comments, as well as the help of Ana Esteban and the staff of the Bank of Spain Balance Sheet Office in providing the raw data. Research funding from DGI, Spanish Ministry of Education, Grant No. ECO2009-11165, is also acknowledged.
Documentos de Trabajo. N.º 1035
2010

The Working Paper Series seeks to disseminate original research in economics and fi nance. All papers have been anonymously refereed. By publishing these papers, the Banco de España aims to contribute to economic analysis and, in particular, to knowledge of the Spanish economy and its international environment.
The opinions and analyses in the Working Paper Series are the responsibility of the authors and, therefore, do not necessarily coincide with those of the Banco de España or the Eurosystem.
The Banco de España disseminates its main reports and most of its publications via the INTERNET at the following website: http://www.bde.es.
Reproduction for educational and non-commercial purposes is permitted provided that the source is acknowledged.
© BANCO DE ESPAÑA, Madrid, 2010
ISSN: 0213-2710 (print)ISSN: 1579-8666 (on line)Depósito legal: M. 50369-2010Unidad de Publicaciones, Banco de España

Abstract
The aim of this paper is to analyze the evolution of productivity and how fi rm behavior and
institutional conditions affects productivity. For that purpose, we use a longitudinal sample
of Spanish manufacturing and services companies between 1983 and 2006, as well as
OECD indicators on product market regulations. The productivity measurement is based on
the control function approach, to overcome the endogeneity bias. Both for manufacturing
and services fi rms, we have found that the share of temporary employment tends to reduce
productivity, the effect being stronger for services fi rms, which make a more intensive
use of this employment type. Our results also show that increases in competition lead to
productivity improvements. Besides, those manufacturing fi rms who keep undertaking in-
house production of services tend to be more productive. The lack of competition in the
services sector may be preventing fi rms to increase specialization while outsourcing non-
manufacturing activities.
Keywords: TFP, Competition, Employment composition, Endogeneity.
JEL classifi cation: L10, L11, L22, L23, C23.

BANCO DE ESPAÑA 9 DOCUMENTO DE TRABAJO N.º 1035
1 Introduction
There is an increasing concern about measurement of productivity and the study of
the factors underlying productivity growth. Bartelsman and Doms (2000) underline
the importance of microdata studies to address this issue. Among the factors un-
der study, we can mention the effect of skill mix, technology adoption (Brynjolfsson
and Hitt, 1996; Jorgenson and Stiroh, 1999), foreign capital (Javorcik, 2004) and
competition conditions on productivity. Nevertheless, even though the services sec-
tor exhibits the largest and increasing share in OECD countries, most of empirical
analysis has focused on manufacturing industries. Among the exceptions, we should
mention Mairesse and Kremp (1993) and Girma and Kneller (2005), who showed the
leading role of the services sector in IT (Information Technology) investment in recent
years.
The aim of this paper is to analyze the evolution of total factor productivity
(TFP) and how it is affected by firm behavior and institutional conditions. For that
purpose, we use a longitudinal sample of Spanish manufacturing and services compa-
nies between 1983 and 2006, with information about production, intermediate inputs,
physical capital, employment and other complementary information. We also exploit
OECD complementary information providing indicators on product market regula-
tions, which measure the degree to which policies inhibit or promote competition.
Regarding firm behavior, among other things, we account for employment com-
position —in particular, the share of temporary employment—, as well as the different
business activities undertaken within the firm. Our concern with the services sector,
in addition to manufacturing, is justified by the increasing share of the services in-
dustries in the last decades in developed countries, together with a sharp drop in the
primary sector, and a smaller but persistent decrease in the share of manufacturing
industries. This latter fact is partly explained by the tendency of manufacturing

BANCO DE ESPAÑA 10 DOCUMENTO DE TRABAJO N.º 1035
to outsource many services activities that had been undertaken by them in the past.
Among the activities undertaken by the firm, we observe a significant fraction of man-
ufacturing firms that report services activities among them, even though a majority
of them report only manufacturing activities. We will analyze how this differential
behavior affects productivity.
Regarding the effect of economic regulations, the situation is very different for
manufacturing and services industries. Manufacturing firms have been faced to in-
creasing international competition. However, competition faced by services firms is
more local, and the non-tradable nature of many services goods allows local firms
to deter competition through other sources of market power and through formal or
informal collusive arrangements between local firms (Oulton, 1998). In fact, whereas
most regulations in manufacturing industries have been lifted in Spain during the last
two decades, there remains a long way for deregulating the services sector. Accord-
ing with the OECD indices of market regulation, and despite the advances towards
deregulation, Spain remains ranked as the fourth OECD country with the high levels
of regulation (Maravall, 2007). However, the effects of anti-competition regulation in
the services sector exceed the firms within this sector. Since output of services indus-
tries provides intermediate inputs to other economic sectors, the effect of restrictive
product market regulation in services may substantially affect other non-services in-
dustries. Namely, it may affect non-service firms in several extents: their propensity
to contract out services, their organization of work and production, the resource al-
location between firms, and their potential productivity improvements (Conway and
Nicoletti, 2006).
The approach to measure TFP at the firm level is based on estimating a technol-
ogy of production using an output measure and information on the amount of all the
observable inputs, and computing TFP as the residual from estimation. The major
problem in technology estimation is the endogeneity bias due to unobserved firm-

BANCO DE ESPAÑA 11 DOCUMENTO DE TRABAJO N.º 1035
specific productivity shocks correlated with the observed inputs (see Griliches and
Mairesse, 1995). For such a reason, OLS estimation renders inconsistent estimates of
the technological parameters. The two alternative approaches to treat the endogene-
ity problem are the fixed effects approach and the control function approach. The key
assumption behind the fixed effects approach is that unobserved firm-specific produc-
tivity shocks are invariant over time, and therefore any fixed effects transformation,
such as first-differences, allows to recover the parameter estimates by means of GMM
estimation while removing the unobserved input term. The main caveat of this ap-
proach is the potential weakness of the instruments, which can jeopardize parameter
identification. The control function approach, proposed by Olley and Pakes (1996),
tackles the endogeneity problem in a more general way. Essentially, the firm-specific
productivity shocks, which are assumed to follow a Markov process, can be recovered
by means of a variable which keeps a monotonic relationship with the firm-specific
shock, such as capital investment or intermediate inputs.
After computing TFP per firm and per year, the longitudinal variation can be
exploited to enquire how firm behavior, measured through workforce composition,
organizational structure, and capital and technological decisions, affects productivity
differences (see Heshmati, 2003). When controlling for input endogeneity, we achieve
estimates of technological parameters that reduce the downward bias of the capital
coefficient for most manufacturing and services sector. The descriptive analysis of
productivity based on our measures points out that the sign and the degree of corre-
lation between changes in productivity and output growth differs very much across
industries. The distribution of TFP reveals a substantial firm persistence in the rela-
tive TFP ranking both for manufacturing and services firms, although the latter ones
exhibit a larger mobility.
The main results regarding productivity determinants, which are analyzed sepa-
rately for manufacturing and services firms, can be summarized as follows. In the

BANCO DE ESPAÑA 12 DOCUMENTO DE TRABAJO N.º 1035
case of manufacturing firms, we find a strongly negative effect of anti-competitive
regulations in the services sector. At the same time, manufacturing firms that keep
in-house production of services tend to exhibit higher productivity. These two esti-
mates suggest that lack of competition in local services may hamper the productivity
gains associated with increasing specialization and outsourcing of complementary
non-manufacturing activities. We find that the share of temporary employment and
the market share, as an inverse measure of market competition, has a negative effect
on productivity, both for manufacturing and services firms. However, such effects are
significantly larger for services firms, which make a more intensive use of temporary
employment, and operate in less deregulated markets.
The rest of the paper is organized as follows. In Section 2, we explain our strat-
egy to estimate production technology. In Section 3, we produce our productivity
measures and undertake a descriptive analysis, The determinants of productivity are
assessed in Section 4, and Section 5 summarizes the main results and concludes.
2 The measurement of productivity
To characterize technology, we posit a double logarithmic specification on grosss out-
put and inputs, which is supported by a Cobb-Douglas technology,
yit = β0 + βLlit + βMmit + βKkit + vit,
where, for each firm i in year t, yit denotes the log of gross real output, and lit, mit,
denote the logarithms of the variable inputs, labor and intermediate inputs, kit is the
log of fixed capital stock, and vit is an unobserved term containing any unobserved
factors affecting production. Estimation of the technology of production is affected by
the endogeneity bias due to the correlation between production inputs and unobserved
productivity shocks (cf. Griliches and Mairesse, 1995). Formally, this problem can

BANCO DE ESPAÑA 13 DOCUMENTO DE TRABAJO N.º 1035
be written, in terms of the unobserved term, as
vit = ωit + uit.
The random variable ωit represents firm-specific further factors, unobserved to the
econometrician, which affect productivity, such as managerial ability, firm specific
human capital, efficiency in the use of technology and inputs, which are known to
the firm when deciding the amounts of capital, labor and intermediate inputs. The
random variable uit is an idiosyncratic term, which includes measurement error in
output or shocks affecting output that are unknown when the firm decided the amount
of inputs. The random variable ωit is usually referred as unobserved productivity,
productivity shock, or total factor productivity (TFP), and it is expected to be related
with input decisions. On the other hand, uit is the usual ‘noise’ term, assumed to be
independent of inputs and of the productivity shock.
The endogeneity problem arises from the fact that ωit is known to the firm when
deciding the amounts of inputs, so that ωit is a state variable in the firm’s deci-
sion problem, which affects input choices. As a consequence, input choices will be
correlated with total factor productivity, and therefore OLS estimation will yield in-
consistent estimates of the technological parameters. I will discuss the approaches
that have been proposed in the empirical literature to overcome this endogeneity
problem due to the simultaneity between unobserved productivity shocks and input
choices. A complete discussion of this issue can be followed in Ackerberg, Benkard,
Perry and Pakes (2007) and Aguirregabiria (2009), among others.
There are two traditional solutions: Instrumental variables and fixed effects. The
instrumental variables approach has relied on the use of appropriate external instru-
ments for the production inputs. As usual, such instruments must fulfill two con-
ditions: being uncorrelated with the unobservables, what includes the productivity
shock, yet correlated with the production inputs. The natural candidates are, then,
the prices of inputs, assuming that we can observe them at the firm level. The first

BANCO DE ESPAÑA 14 DOCUMENTO DE TRABAJO N.º 1035
condition is very likely to hold if firms operate in perfectly competitive markets for
inputs. For the second condition to hold, we need, in line with input choices by firms,
to find enough cross-sectional variation in input prices. This requirement is hard to
hold if firms use homogeneous inputs and buy them in competitive markets. On the
contrary, it is more likely to observe variation in input prices across firms if inputs
are firm-specific, but then the exogeneity of such variation (i.e., no correlation with
firm’s productivity) is dubious. Besides, input prices are very often non reported by
firms, and they are mostly observed with some level of aggregation.
The second one is the fixed effects approach, for which panel data is required. Ac-
tually, fixed effect estimators where primarily introduced to deal with the estimation
of production functions (Mundlak, 1961; Hoch, 1962). The key assumption behind
the fixed effects approach is that unobserved firm-specific productivity shocks are
invariant over time, so that the unobserved term can be written as
vit = ωi + uit,
so the firm-specific productivity shock might be removed by means of a within-firm
or a first-differences transformation (also denoted as fixed-effects transformation).
Assuming that the idiosyncratic term uit is serially uncorrelated, and uncorrelated
with current and future input choices, technological parameters can be consistently
estimated applying OLS to the fixed-effects transformation of the model. It must be
noticed that lack of correlation of uit with current and future input choices requires
strict exogeneity of the production inputs, so that shocks affecting output after input
choices have been done do not affect future input choices either. The failure of the re-
quired assumptions is behind the usual result that the fixed-effects estimates obtained
for the technological parameters are usually very small. An additional problem is that
the downward bias induced by measurement error in the explanatory variables can
be amplified by the fixed-effects transformation (see Griliches and Hausman, 1986).
The requirement of the classical fixed effects approach that the explanatory vari-
BANCO DE ESPAÑA 15 DOCUMENTO DE TRABAJO N.º 1035
ables —in our context, production inputs— must be strictly exogenous is very unreal-
istic. However, such requirement can be substituted by the weaker assumption that
input choices are predetermined with respect to the idiosyncratic term uit. In other
words, uit is uncorrelated with current and past input choices (so that productivity
‘surprises’ can only affect future input choices). Such assumption generates moment
conditions by which lagged levels of the production inputs are uncorrelated with the
fixed effect transformation of the idiosyncratic term. In other words, lagged inputs
can be used as instruments for the production function in first differences. (see Arel-
lano and Bond, 1991). In addition to the predeterminedness of inputs and the lack
of serial correlation in the idiosyncratic term, the validity of lagged inputs as instru-
ments relies heavily on the serial correlation of production inputs. The main caveat
of this approach is the potential weakness of the instruments, which can jeopardize
parameter identification. Typically, lagged levels of the production inputs are used as
instruments for the production function in first-differences. In practice, instruments
are poorly correlated with endogenous regressors when the serial correlation of the
regressors in first differences is weak. Besides, as it happened with the classical fixed
effects approach, the fixed effects transformation is subject to the problem of mea-
surement error in inputs. As a consequence, estimates are typically imprecise and
subject to large finite-sample biases.
To deal with this ‘weak instruments’ problem, Arellano and Bover (1995) and
Blundell and Bond (1998) have proposed adding further conditions to the standard
GMM estimator (Arellano and Bond, 1991) that can improve parameter identifica-
tion. Assuming that input and output changes are uncorrelated with the unobserved
firm-specific productivity shock ωi, we can exploit additional moment conditions by
which twice lagged first differences of inputs are valid instruments for the production
function in levels. Blundell and Bond (2000) provide evidence based on Monte Carlo
experiments and on production function estimates for UK data, by which the esti-

BANCO DE ESPAÑA 16 DOCUMENTO DE TRABAJO N.º 1035
mator exploiting these further conditions, denoted as system-GMM largely improves
the estimation precision with regard to the standard GMM estimator.
In any case, the fixed effect approach, even in their most promising proposals,
is flawed by the strong assumption that the firm-specific productivity shock ωi is
constant over time. As Ackerberg et al. (2007) posed, this assumption is more
questionable the longer the time length for which panel data are available. In fact,
the estimation of production functions is often linked to periods of data containing
major changes affecting firms, such as deregulation, changes in trade policies, etc.
Such changes are expected to have differential effects on the productivities of different
firms, and therefore assuming ωi is time-invariant is very unrealistic.
Olley and Pakes (1996) proposed a different approach to undertake the endogene-
ity problem in the estimation of technology of production. Olley and Pakes do not
require the firm-specific productivity shock ωit, to be time-invariant: they assume ωit
to follow a first order Markov process, without requiring any parametric assumption.
Since they use series expansions, they actually consider a nonlinear AR(1),
ωit = ρ1 ωi,t−1 + ρ2 ω2i,t−1 + ...+ εit.
In essence, the Olley-Pakes method is a control function approach (Heckman and
Robb, 1985). Instead of instrumenting the endogenous regressors, they include exter-
nal variables to approximate the productivity shock, which is the endogenous part of
the error term. We require such variables to keep a monotonic relationship with the
productivity shock, so an increase in such variable unambiguously indicates a positive
productivity shock.
Olley and Pakes consider fixed capital as a quasi-fixed input, and take the usual
assumption that capital is accumulated by firms through a deterministic dynamic
investment process,
kit = (1− δ) ki,t−1 + ii,t−1

BANCO DE ESPAÑA 17 DOCUMENTO DE TRABAJO N.º 1035
where iit denotes the investment expenditure at period t. It is assumed that there is
time-to-build, so that it takes time to install the new capital that the firm acquired
at t − 1, not being productive until period t. Investment demand can be defined bymeans of an unknown function
iit = i (kit,ωit) .
Since investment depends on fixed capital stock and firm unobserved productivity, we
can invert the “investment function”, and therefore, express the unobserved produc-
tivity as a non parametric function of investment and capital. The only limitation
when using investment as proxy is that estimation must be restricted to the sub-
sample of observations with positive investment in order to fulfill the monotonicity
condition.1 Since the form of the “investment function” is unknown, the technolog-
ical coefficient of capital cannot be identified when we introduce the approximation
to the productivity shock in terms of investment and capital. Hence, in a first stage
we can only identify the technological coefficients for labor and intermediate inputs.
Inverting the optimal decision rule for investment, we can get:
ωit = ht(kit, iit)
and therefore we can write the production function equation as follows:
yit = β0 + βLlit + βMmit + βKkit + ht(kit, iit) + vit,
yit = βLlit + βMmit + φt(kit, iit) + vit.
where φt(kit, iit) = β0 + βKkit + ht(kit, iit). This is the equation that is estimated in
the first stage, using a non parametric estimation of φt(kit, iit) or, similarly, a second
or third order polynomial approximation in kit and iit.
1This can result in an efficiency loss, depending on the proportion of observations which must beleft out for estimation. This fact led Levinsohn and Petrin (2003) to propose intermediate inputsinstead of investment as a proxy, for which the monotonicity condition is more likely to be held forthe whole sample.

BANCO DE ESPAÑA 18 DOCUMENTO DE TRABAJO N.º 1035
In the first stage we have then identified the technological parameters of labour
and intermediate inputs, but not the capital parameter. For the sake of exposition,
assume that ωit follows a linear AR(1) process,
ωit = ρωi,t−1 + εit
To see how to identify the capital coefficient in the second stage, we first define
yit ≡ yit − βLlit − βMmit. Taking into account that ωi,t−1 = ht−1(ki,t−1, ii,t−1), it is
clear that E(yit | kit,ωi,t−1) = E(yit | kit, ki,t−1, ii,t−1), and we can write:
E(yit | kit, ki,t−1, ii,t−1) = β0 + βK kit + ρ ht−1(ki,t−1, ii,t−1)= β0 + βK kit + ρ φt−1(ki,t−1, ii,t−1)− β0 − βK ki,t−1
so that,
yit = β∗0 + βK kit + ρ φt−1(xi,t−1)− βK ki,t−1 + εit + vit
This is the equation that we estimate in the second stage, using the predicted values
for yit and φt−1(ki,t−1, ii,t−1) obtained in the first stage, so βK and ρ can be prop-
erly estimated in the second stage. Since we substitute yit and φt−1(ki,t−1, ii,t−1) by
predictions based on the estimates of the technological coefficients of labor and inter-
mediate inputs, and by a non parametric estimation of φt−1 (.), the standard errors of
the estimated coefficients of βK and ρ must be corrected. Alternatively, appropriate
standard errors can be computed by bootstrap methods.
3 Productivity estimates
3.1 The Data
The main data source is the Balance Sheets of the Bank of Spain (CB hereinafter),
which contains firm-level annual information on the balance sheets and other comple-
mentary information on economic variables, such as employment by contract duration
(fixed-term or indefinite), output, intermediate inputs, physical capital and the total
wage bill. The sample consists on an unbalanced panel of firms in manufacturing and

BANCO DE ESPAÑA 19 DOCUMENTO DE TRABAJO N.º 1035
non-financial services industries, with a public share below 50 percent, from 1983 to
2006. To obtain the final sample, we have eliminated those for which some of the
following variables were negative or took implausible values: book value of capital
stock, sales, gross output, total labor costs, permanent employment, and temporary
employment. Due to the fact that response is completely voluntary, largest firms are
over-represented in the sample. The details are presented in Appendix 1.
The data set also provides information about each firm activity, in accordance
with the 2-digit NACE classification. The industry code and its share in total firm
output, up to four different industry affiliations, is reported. The sample distribution
of firms by its main industry is provided in Table A1. In a few number of cases, we
have grouped those related industries for which the number of firms available in the
sample was too small to provide precise estimates of the technological coefficients.
3.2 Production function estimates
To allow for differences across industries, we estimate a production function for each
industry separately. We have used three alternative procedures: OLS, system-GMM
(non reported here) and Olley-Pakes, using fixed capital investment as a proxy for
firm-specific productivity shock ωit. For our Olley-Pakes estimates, we have approxi-
mated the aforementioned function φt(kit, iit) = β0+βKkit+ht(kit, iit) by means of a
third-order polynomial in kit and iit, where the slopes have been assumed to be con-
stant across time, but we have allowed for differences in the constant term across time
by means of binary year dummies. Furthermore, we have assumed a linear AR(1)
structure for the firm-specific productivity shock.
In Table 1 we report the OLS estimation results of the technological parameters for
each industry, whereas the Olley-Pakes estimates are reported in Table 2. In general,
we observe that the Olley-Pakes estimates of technological coefficients for labor and
intermediate inputs are generally lower than the corresponding OLS estimates, and
BANCO DE ESPAÑA 20 DOCUMENTO DE TRABAJO N.º 1035
the opposite occurs for the estimates of the technological coefficient of the capital
stock. The same pattern appears when we consider the system-GMM estimator of
the technological parameters (non reported here), though the moment conditions
which exploits are rejected in the case of several industries.
The evidence reported is coherent with the successful bias correction provided
by the control function approach. The magnitude of the estimated technological
coefficients and the qualitative results are in accordance with the ones obtained by
Javorcik (2004). Nevertheless, the magnitude of the capital coefficients in Table 2
seems to be too low in an important number of industries. In addition, the estimates
of ρ, the coefficient of the AR(1) process characterizing the total productivity shock,
is, in the case of many sectors, too close to unity. Our estimate for the capital
coefficient is in line with a recent work by Van Beveren (2010).
Interestingly, the estimates of the technological parameters for service industries
are not much different from those for manufacturing industries. This evidence re-
sembles Mairesse and Kremp (1993), which is one of the few contributions regarding
production function estimates for non-financial services industries.
3.3 Descriptive analysis of productivity
Once that we have estimated the technological parameters at the industry level, our
measure of TFP is obtained from the residual of the estimation of the technologies of
production. In other words, we then recover our estimate of total factor productiv-
ity (TFP) by plugging in the estimated technological parameters in the production
function,
ωit ≡ lnTFP it = yit − βLlit + βMmit + βKkit,
where we have substituted the estimated technological parameters for the industry
to which firm i belongs.
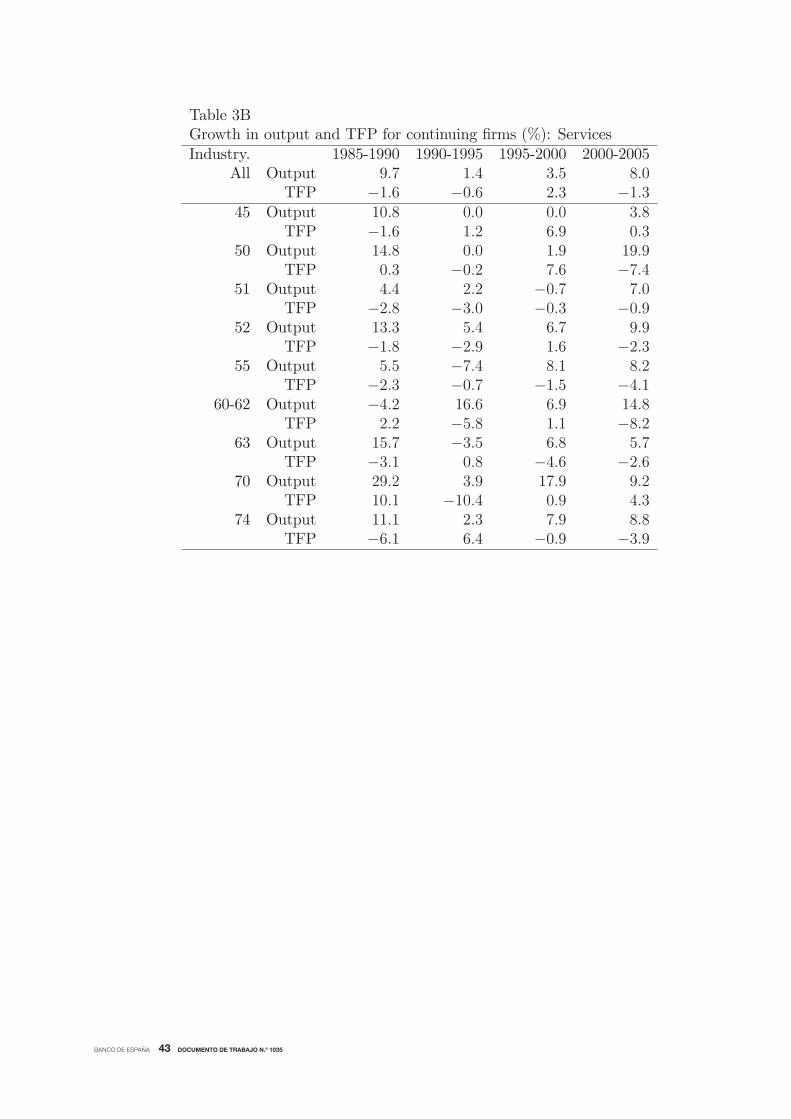
In Table 3A and 3B, we have calculated for each industry the annual rates of

BANCO DE ESPAÑA 21 DOCUMENTO DE TRABAJO N.º 1035
change of aggregate output growth and aggregate TFP in 5-year periods, using each
firm’s share in output as weights. In general, we find that output growth exhibits
much larger magnitudes, in absolute value, than TFP growth, particularly since 1990.
The simple correlation coefficients between output and productivity are negative both
at the aggregate level and for most of the 2-digit industries in manufacturing and
services.
Looking at aggregate manufacturing and services, we find that productivity is
countercyclical, this pattern being much stronger for manufacturing. This evidence
is in line with the aggregate analysis done by Núñez and Pérez (2000), who find
negative correlations between output and productivity, very specially in the case of
manufacturing. Besides, the countercyclical pattern is atenuated after 1990. There
are, though, remarkable differences across industries and over time. Textile and
Clothing industries exhibit the strongest countercyclical pattern, and with a sharp
fall in productivity since 2000. On the other hand, the Chemical industry exhibits a
procyclical pattern, which is nevertheless atenuated in the most recent years. Among
the manufacturing industries that experience a productivity increase, we must em-
phasize Chemical, Non metallic materials, and Machinery industries. In the case of
services, most industries have experienced a productivity slowdown since 2000. The
exceptions are Construction and Real estate.
We have examined the mobility across the productivity distribution of our sam-
ple of firms. For this purpose, following Foster, Haltiwanger and Krizan (2006), we
have ranked firms into quintiles of the TFP distribution, and compute the transition
matrices in a ten-year period. It must be noted that in our data set we cannot sepa-
rately identify firm exits due to liquidation from firm exits due to non participating
in the survey in a given year, and firm entries due to a firm birth from firm entries
due to inclusion in survey of a existing firm. The transition matrices from 1985 to
1995 and from 1995 to 2005 for manufacturing and services are reported in Tables 4A

BANCO DE ESPAÑA 22 DOCUMENTO DE TRABAJO N.º 1035
and 4B, respectively. In any case, the major patterns resemble those found in Foster,
Haltiwanger and Krizan (2006) for the US retail sector.
We observe that entry is the most likely origin, and takes place uniformly for
every quintile in the TFP distribution, and exit is the most likely outcome. This
pattern is stronger in the case of services firms; particularly, exit has a higher relative
importance. However, as mentioned earlier, and unlike Foster et al. (2001) for the
US, and Gómez-García, Puente and Gómez (2007) for Spain, we cannot attribute
entry and exit to creation and liquidation of firms.
If we concentrate on continuing firms, we find, even after ten years, a substantial
persistence in relative TFP ranking. Manufacturing firms in the top quintile have
a probability of staying there above 25%, whereas the probability of moving to the
two lowest quintiles is below 9%. About a third of manufacturing firms in the lowest
quintile stay in it after ten years, and the probability that firms in the lowest quintile
will move to the two highest quintiles is below 7%. We observe a similar but stronger
pattern for the most productive services firms: those in the top quintile have a 30%
probability of staying in the top quintile, and a probability below 7% of moving to
the two lowest quintiles. The pattern for continuing services firms with the lowest
productivity is qualitatively similar to the corresponding manufacturing firms, but the
relative mobility to other quintiles is larger. In general, we find significant frequencies
of movements across quintiles, both for manufacturing and services firms. Our results
resemble the qualitative findings in Gómez-García et al. (2007). However, we find a
lower persistence, both in manufacturing and services. These differences arise from
two facts: Gómez-García et al. (2007) used a more representative sample of Spanish
companies, and consider a shorter time period when analyzing transitions..
We can conclude that there exist large TFP differences across firms, and move-
ments across the TFP distribution are quite frequent. In the next section, we will go
into the role of firm behavior and regulatory aspects on total factor productivity.

BANCO DE ESPAÑA 23 DOCUMENTO DE TRABAJO N.º 1035
4 The determinants of productivity
We now concentrate on the impact firm behavior and market regulations on pro-
ductivity. The most important restrictions to competition are circumscribed to non-
manufacturing industries, which, because of the characteristics of their products, are
much less faced to international competition. But the effect of product market reg-
ulations in these non-manufacturing industries are not confined to these industries
themselves (Conway and Nicoletti, 2006), because all firms in the remaining indus-
tries use the output of non-manufacturing industries as intermediate inputs. Indeed,
about 80% of the output of the business services sector was used as an intermediate
input in the production processes of non-manufacturing industries in the countries
for which harmonized input-output data exist. As Conway and Nicoletti (2006) illus-
trate, under more restrictive regulations in the non-manufacturing sector that supply,
among others, manufacturing firms, the price of the supplied intermediate goods will
tend to be higher, and their quality will tend to be lower. In turn, this will affect the
own development of all industries that use non-manufacturing intermediate goods, in
many extents: costs of firm entry, resource allocation between firms, potential pro-
ductivity improvements, and work and production organization. For this purpose,
we use complementary industry-level data on impact indicators of regulation in the
services sector industries. Local firms within these industries are suppliers of interme-
diate inputs of firms in other industries. The OECD indicators of regulation impact
(RI), constructed by Conway and Nicoletti (2006) are industry-specific indicators that
measure the effects of regulation and competition conditions in non-manufacturing
sectors on each industry. The impact indicators weight the effect of restrictive reg-
ulations in services sectors with the importance of services sectors as suppliers of
intermediate inputs to the industry. The indicators cover information in four main
areas: state control, barriers to entry, involvement in business operations, and market
structure. The information summarised by the indicators is “objective”, as opposed

BANCO DE ESPAÑA 24 DOCUMENTO DE TRABAJO N.º 1035
to survey information based on subjective assessments of markets participants, and
consists of rules, regulations, and market conditions. The resulting indicators of
non-manufacturing regulation comprise energy, transport and communication, retail
distribution, and professional services. In order to measure the effective impact of
regulation on competition, data on actual market and industry structure is used so as
to proxy for the impact of policy enforcement. The indicators are calculated using a
bottom-up approach in which the regulatory data are quantified using an appropriate
scoring algorithm and then aggregated into summary indicators by sector of activity
in each of the four areas or across them. Further details can be found in Conway and
Nicoletti (2006).
Regarding firm organization of work and production, we take into account two
different aspects: qualitative information related with the outsourcing of services by
manufacturing firms, and the composition of the firm workforce. The lack of well-
developed non-manufacturing industries may affect the incentives of manufacturing
firm to specialize in manufacturing activities, thus gradually outsourcing an increas-
ing proportion of non-manufacturing tasks that had been fully undertaken by the
same manufacturing firms in the past. In fact, there is evidence that the deregula-
tion of non-manufacturing industries towards higher competition has increasingly led
manufacturing firms (Fixler and Siegel, 1999) to contract out services so as to benefit
from smoothening production cycles, specialisation and labor cost savings (Abraham
and Taylor, 1996; Siegel and Griliches, 1992). The propensity of the firm to outsource
will depend on the price of the external service product, relative to the opportunity
cost of in-house production (Heshmati, 2003).
In our data set, we observe the four main activities in which the firm is involved,
as well as the share in total sales of each activity. For each manufacturing firm, we can
observe whether it is undertaking the in-house production of services activities, which
will depend on firm organization and on the degree of deregulation of the services
BANCO DE ESPAÑA 25 DOCUMENTO DE TRABAJO N.º 1035
industries that supply services to manufacturing firms. The decision of the firm to
undertake or outsource services will depend on the difference between the price of the
external service and the opportunity cost of in-house production. And the opportu-
nity cost of in-house production will be very much affected by the price and quality of
the external service products. For manufacturing firms, we define the binary variable
InHouse, indicating whether the manufacturing firm keeps undertaking services activ-
ities or not. Indeed, for our sample of manufacturing firms, the correlation coefficient
between our indicator of regulation impact (RI) and the qualitative variable InHouse
is positive and significant, but its magnitude is small (0.036), and does not change
when we account for firm-specific unobserved heterogeneity (amounting to 0.038).
Work organization is another important aspect that may affect productivity. To
control for differences in work organization across firms and over time, we consider
the composition of employment. In particular, we exploit the distinction between
temporary employees (those with fixed-term contracts) and permanent employees
(those with indefinite-duration or permanent contracts), which is particularly relevant
for Spain. Currently, temporary employees currently amount to 30% of the total
workforce, with a larger share in non-manufacturing. The removal on the restrictions
to use temporary contracts in 1984 led to a widespread use of them. Although
there have been several partial reforms since 1997, mostly aimed at limiting the
widespread use of temporary contracts and favoring the use of permanent contracts,
they have proved fairly ineffective, to the extent that the proportion of temporary
workers have remained stable around 30% for the total economy (with a slightly lower
incidence in manufacturing). The regulatory framework has shaped a strongly dual
labor market by which 30% of the working people, those with temporary contracts,
bear most of employment rotation, to the extent that all the flexibility of the labor
market is provided by them. Aguirregabiria and Alonso-Borrego (2009) find that the
introduction of temporary contracts led to an increase in the employment level, but

BANCO DE ESPAÑA 26 DOCUMENTO DE TRABAJO N.º 1035
at the expense of a lower productivity per worker. The current regulations of the
Spanish labor market seems to fail in providing incentives for firm-specific human
capital investment.
In addition, we must control for other sources that may affect productivity, so as
to ensure that the potential determinants of productivity are properly isolated. We
consider qualitative information on the participation of foreign capital and the public
sector in the social capital of the firm. For this purpose, we define the variables Foreign
and Public, which are binary variables indicating whether there is at least a 10% share
of foreign capital and of the public sector, respectively. We have also qualitative
information about whether the firm is quoted in the stock market (Quoted), and
whether the firm belongs to a company group (Group). Regarding firm activity, we
introduce the ratio of exports (sales abroad) to total firm sales, Exports/Sales, and
the qualitative variable Multi, which indicates whether the firm operates in two or
more two-digit industries.
Finally, following Nickell (1996), we use the firm market share, MShare, defined
as the lagged ratio of firms sales to total sales in the main industry in which the firm
operates. We consider the lagged market share in order to avoid reverse causality, by
which firms with high TFP growth may achieve higher market shares. As argued by
Nickell (1996) and Sutton (1996), although this measure of market share is not ex-
pected to provide a reliable competition measure at the cross-section level because of
differences among industries, it can provide a proper measure of competition pressure
over time.
It must be noted that, given the lack of a theoretical model to justify the set of
explanatory variables, our estimates are capturing partial correlations, which cannot
be given a causal interpretation. The evidence provided can help to understand
what variables are susceptible to affect productivity, but further research is needed
to support a causal interpretation of the estimated effects.

BANCO DE ESPAÑA 27 DOCUMENTO DE TRABAJO N.º 1035
In Tables 5A and 5B, we report the estimates of different productivity specifica-
tions for manufacturing and services, respectively. In each specification, the model,
which establishes the logarithm of TFP as a function of the aforementioned covariates,
is transformed in first differences in order to control for firm-specific time-invariant
effects. In addition, we have included time dummies in all estimations. All the
columns include the regulation indicators (RI) variable as regressor. The inclusion of
additional variables, which has variation by industry and over time, does not change
either the magnitude or the significance level of this variable, being significant at the
5 percent level. We thus find that productivity of manufacturing firms is hampered by
stricter regulation in non-manufacturing sectors. Interestingly, and in relation with
this fact, we find that those manufacturing firms which have kept a certain in-house
production of services needed to undertake their main activity tend to be more pro-
ductive that those which have contracted out all relevant services. The coefficient of
in-house production of services is positive and statistically different than zero at the
2 percent level. Its estimated value is robust to the inclusion of additional variables,
which do not alter the magnitude and significance level.
With regard to the employment composition effects, we find that productivity
tends to decrease with the share of temporary employment. The coefficient of this
variable is negative, and it is estimated with high precision. This result is consis-
tent with the findings in Dolado and Stucchi (2008) and Aguirregabiria and Alonso-
Borrego (2009), and the fact that the firm incentives to invest in firm-specific human
capital are lower the higher the share of temporary employment. In addition, the
exports to sales ratio has a positive and significant effect, suggesting that a higher
exposure to international competition tends to make firms more productive.
Another interesting aspect related with market competition is concerned with
the market share variable, which may be interpreted as an inverse measure of the
competition conditions in the industry in which the firm operates. The estimated

BANCO DE ESPAÑA 28 DOCUMENTO DE TRABAJO N.º 1035
coefficient suggests that a fall in market share would tend to increase productivity,
this effect being highly significant. This result resembles the findings by Nickell
(1996) and Disney et al (2003). The remaining variables that have been considered
were clearly insignificant.
We reproduce the same sort of estimates for the services industries in Table 5B,
except for the regulation indicator variable. We find that the regulation indicator
(RI), which measure the knock-on effects of other services in each industry, is small
and clearly non significant. Also, export activity does not have a significant effect.
It must be noted that in the case of non-manufacturing industries, the industry own
output contributes in a large extent to the corresponding regulation indicator, so it
essentially measures the own industry indicator of anti-competitive regulation.
The variables that exhibit a significant effect on productivity are the share of
temporary employment and the market share, both with the expected signs. Inter-
estingly, the magnitudes of the corresponding coefficients are much higher in absolute
value for services than for manufacturing firms. We thus observe that the negative
effect of temporary employment on productivity is much more important for services
firms, which, in addition, tend to use a higher proportion of temporary workers.
5 Conclusions
In this paper, we have analyzed the features of total factor productivity (TFP) using
longitudinal data on Spanish firms in manufacturing and non-financial services. In
line with the most recent literature, we have addressed the measurement of TFP tak-
ing into account the endogeneity of inputs through a control function approach in the
estimation of tecnological parameters. Our preferred estimates, which are obtained
separately by two-digit industry, seem to correct the endogeneity biases as expected,
so that we get a higher capital coefficient. Nevertheless, it apparently keeps being too
low for several industries. The descriptive analysis of our firm-level productivity mea-

BANCO DE ESPAÑA 29 DOCUMENTO DE TRABAJO N.º 1035
sures shows that the aggregate productivity figures on manufacturing and services,
which exhibit a high positive correlation with output growth, mask strong differences
among industries. Besides, we also find strong persistence along the ranking of the
TFP distribution, even considering a long ten-year period, but with a significant
mobility across the quintile of the TFP distribution. Besides, the mobility between
quintiles appears to be much frequent in services than in manufacturing firms.
We have exploited our longitudinal measures of TFP to analyze the effects of
market regulation, competition conditions, and firm behavior regarding work organi-
zation. In the case of manufacturing firms, we have also accounted for the in-house
production of services activities, exploiting the information on whether the manufac-
turing firm is still undertaking services activities.
One important result, in the case of manufacturing firms, is that the regulation
indicators of the impact in manufacturing industries of restrictions to competition
on non-services industries is strongly negative, and robust to the specification choice.
In relation to this, we have considered the qualitative information on whether the
manufacturing firm undertakes in-house production of services, which otherwise had
been outsourced to external services firms. Manufacturing firms undertaking in-
house service production tend to enjoy a better productivity performance. This result
suggest that the under-development in the services sector towards more competition
may be preventing firms to increase their levels of specialization while outsourcing
non-manufacturing activities.
Both for manufacturing and services firms, we have found that the share of tem-
porary employment tends to reduce productivity. Behind this result, it lies the lower
incentives of firms to invest in firm-specific human, the higher the proportion of fixed-
term employment. The duality of Spanish labor market, by which most employment
creation is done through temporary contracts, seems to hamper firms productivity.
The negative effect of temporary employment is much higher in the case of services

BANCO DE ESPAÑA 30 DOCUMENTO DE TRABAJO N.º 1035
firms, which also resort to a larger extent to temporary employment.
Our measure of lagged market share, as an inverse measure of competition con-
ditions has, as expected, a negative effect on productivity. The result suggests that
increases in industry competition boost firms to improve their performance. Inter-
estingly, the effects of our competition measure appear to be much more important
for services firms. This result is not surprising. Many national regulations to prevent
competition in manufacturing firms have been removed in the years that followed the
joining of EEC by in 1986, and the remaining ones are quite ineffective in protecting
national firms, given the nature of manufactured goods. On the contrary, the level
of regulation in the Spanish services sector is still very high, and the non-tradable
nature of the produced goods makes restrictions to international competition very
effective.
This paper has provided evidence about productivity, and its relation with firm
behavior and regulatory conditions, with firm level data. Use of longitudinal dis-
aggregated data at the firm or, even better, at the establishment level, is essential
to understand many features of productivity growth that have consequences at the
aggregate level. Nevertheless, a primary problem with our analysis is that the esti-
mates only capture partial correlations, which do not have further interpretation due
to the lack of a model that might allow us to interpret the estimated coefficients of
the variables susceptible to affect productivity as causal effects. Notwithstanding,
much more research is needed to get a more complete understanding of the dynamics
of productivity and its determinants.
Many of the potential extensions are constrained by data availability. Specifically,
we lack data on occupational or human capital composition of the firm workforce, as
well as measures of innovation and IT technologies, to assess their effects on produc-
tivity. Besides, our data does not allow to identify firm exits and entries due to births
and deaths of firms from the event of starting of ending firm collaboration in the sur-

BANCO DE ESPAÑA 31 DOCUMENTO DE TRABAJO N.º 1035
vey. A further line of research that is worth to be addressed is the analysis of the
dynamics of productivity. There is scarce evidence, particularly for Spain, for which
we can cite Fariñas and Ruano (2004). Specifically, it would be interesting to address
the determinants of the movements across the quantiles of the TFP distribution, for
which a dynamic discrete choice model could be considered.

BANCO DE ESPAÑA 32 DOCUMENTO DE TRABAJO N.º 1035
References
[1] ABRAHAM, K., and T. TAYLOR (1996). “Firms’ Use of Outside Contractors:
Theory and Evidence”, Journal of Labor Economics, 14, pp. 394-424.
[2] ACKERBERG, D., L. BENKARD, S. BERRY and A. PAKES (2007). “Econo-
metric Tools for Analyzing market Outcomes”, in J. Heckman and E. Leamer
(eds.), Handbook of Econometrics ,Vol. 6.
[3] AGUIRREGABIRIA, V. (2009). Econometric Issues and Methods in the Es-
timation of Production Functions, MPRA Paper 15973, University Library of
Munich, Germany.
[4] AGUIRREGABIRIA, V., and C. ALONSO-BORREGO (2001). “Occupational
Structure, Technological Innovation, and Reorganization of Production”, Labour
Economics, 8, pp. 43-73.
[5] – (2009). Labor Contracts and Flexibility: Evidence from a Labor Market Reform
in Spain, Universidad Carlos III Working Paper 09-18.
[6] ARELLANO, M., and O. BOVER (1995). “Another look at the instrumental-
variable estimation of error-components models”, Journal of Econometrics, 68,
pp. 29-52.
[7] BAILY, M. N. (1993). “Competition, Regulation, and Efficiency in Service Indus-
tries”, Brookings Papers on Economic Activity, Microeconomics, 2, pp. 71-158.
[8] BARTELSMAN, E. J., and M. DOMS (2000). “Understanding Productivity:
Lessons from Longitudinal Microdata”, Journal of Economic Literature, 38, pp.
569-594.

BANCO DE ESPAÑA 33 DOCUMENTO DE TRABAJO N.º 1035
[9] BLUNDELL, R., and S. R. BOND (1998). “Initial conditions and moment re-
strictions in dynamic panel data models”, Journal of Econometrics, 87, pp. 115-
143.
[10] BRYNJOLFSSON, E., and L. HITT (1996). “Paradox lost? Firm-level informa-
tion on the returns to information systems spending”, Management Science, 42,
pp. 541-558.
[11] CONWAY, P., and G. NICOLETTI (2006). Product Market Regulation in the
Non Manufacturing Sectors of OECD Countries: Measurement and Highlights,
OECD Economics Department Working Papers, No. 530, OECD Publishing.
[12] DAVIS, S. J., J. HALTIWANGER and S. SCHUH (1996). Job Creation and
Destruction, MIT Press.
[13] DISNEY, R., J. HASKEL and Y. HEDEN (2003). “Redtructuring and Produc-
tivity Growth in UK Manufacturing”, The Economic Journal, 113, pp. 666-694.
[14] DOLADO, J., and R. STUCCHI (2008).Do temporary contracts affect Total Fac-
tor Productivity? Evidence from Spanish manufacturing firms, IZA Discussion
Paper No. 3832.
[15] FARIÑAS, J. C., and S. Ruano (2004). “The Dynamics of Productivity: A
Decomposition Approach Using Distribution Functions”, Small Business Eco-
nomics, 22, pp. 237-251.
[16] FIXLER, D. J., and D. SIEGEL (1999). “Outsourcing and Productivity Growth
in Services”, Structural Change and Economic Dynamics, 10, pp. 177-194.
[17] FOSTER, L., J. HALTIWANGER and C. J. KRIZAN (2006). “Market Selection,
Reallocation, and Restructuring in the U.S. Retail Trade Sector in the 1990s”,
The Review of Economics and Statistics, 88 (4), pp. 748-758.

BANCO DE ESPAÑA 34 DOCUMENTO DE TRABAJO N.º 1035
[18] GÓMEZ-GARCÍA, P., S. PUENTE and A. L. LÓPEZ (2007). Firm productivity
dynamics in Spain, Documentos de Trabajo, No. 0739, Banco de España.
[19] GONZÁLEZ PASCUAL, L. I., and A. SÁNCHEZ SERRANO (2006). Análisis de
la productividad. Cálculo con datos de Central de Balances, Documento interno
ES/2006/09, Dirección General de Servicio de Estudios, Banco de España.
[20] GRILICHES, Z. (1992). “Introduction”, in Z. Griliches (ed.), Output Measure-
ment in the Services Sectors (NBER Conference on Research in Income and
Wealth), The University of Chicago Press.
[21] GRILICHES, Z., and J. HAUSMAN (1986). “Errors in Variables in Panel Data”,
Journal of Econometrics, 31 (1), pp. 93-118.
[22] GRILICHES, Z., and J. MAIRESSE (1995). Production Functions: The Search
for Identification, National Bureau of economic Research Working Paper No.
5067.
[23] HECKMAN, J., and R. ROBB (1985). “Alternative methods for evaluating the
impact of interventions: An overview”, Journal of Econometrics, 30 (1-2), pp.
239-267.
[24] HESHMATI, A. (2003). “Productivity Growth, Efficiency and Outsourcing in
Manufacturing and Service Industries”, Journal of Economic Surveys, 17, pp.
79-112.
[25] HOCH, I. (1962). “Estimation of Production parameters Combining Time-Series
and Cross-Section Data”, Econometrica, 30 (1), pp. 34-53.
[26] JAVORCIK, B. S. (2004). “Does Foreign Direct Investment Increase the Produc-
tivity of Domestic Firms? In Search of Spillovers Through Backward Linkages”,
The American Economic Review, 94 (3), pp. 605-627.

BANCO DE ESPAÑA 35 DOCUMENTO DE TRABAJO N.º 1035
[27] JORGENSON, D., and K. STIROH (1999). “Information technology and
Growth”, The American Economic Review, pp. 109-115.
[28] LEVINSOHN, J., and A. PETRIN (2003). “Estimating Production Functions
Using Inputs to Control for Unobservables”, The Review of Economic Studies,
70, pp. 317-342.
[29] MAIRESSE, J., and E. KREMP (1993). “A Look at the Productivity at the Firm
Level in Eight French Service Industries”, The Journal of Productivity Analysis,
4, pp. 211-234.
[30] MARAVALL, C. (2007). ¿Se Puede Dinamizar el Sector Servicios? Un Análisis
del Sector y Posibles Vías de Reforma. Laboratorio de Alternativas, Documento
de Trabajo No. 117/2007, Fundación Alternativas.
[31] MORRISON PAUL, C. J., and D. S. SIEGEL (2001). “The Impacts of Technol-
ogy, Trade and Outsourcing on Employment and Labor Composition”, Scandi-
navian Journal of Economics, 103 (2), pp. 241-264.
[32] MUNDLAK, Y. (1961). “Empirical Production Function Free of Management
Bias”, Journal of Farm Economics, 43 (1), pp. 44-56.
[33] NICOLETTI, G., and S. SCARPETTA (2005). Regulation and Economic Per-
formance: Product Market Reforms and Productivity in the OECD, OECD Eco-
nomics Department Working Papers, No. 460, OECD Publishing.
[34] NÚÑEZ, S., and M. PÉREZ (2000). La Rama de Servicios en España: Un Análi-
sis Comparado, Documentos de Trabajo, No. 0007, Banco de España.
[35] OLLEY, G. S., and A. PAKES (1996). “The Dynamics of Productivity in the
Telecommunications Equipment Industry”, Econometrica, 64, pp. 1263-1297.

BANCO DE ESPAÑA 36 DOCUMENTO DE TRABAJO N.º 1035
[36] OULTON, N. (1998). “Competition and the Dispersion of Labour Productivity
amongst UK Companies”, Oxford Economic Papers, 50, pp. 23-38.
[37] SIEGEL, D., and Z. GRILICHES (1992). “Purchased Services, Outsourcing,
Computers, and Productivity in Manufacturing”, in Z. Griliches (ed.), Output
Measurement in Service Sector, University of Chicago Press.
[38] VAN BEVEREN, I. (2010). “Total Factor Productivity Estimation: A
Practical Review”, Journal of Economic Surveys, No. doi: 10.1111/j.1467-
6419.2010.00631.x.

BANCO DE ESPAÑA 37 DOCUMENTO DE TRABAJO N.º 1035
Appendix. Data Description
The CB data set is an unbalanced panel of Spanish of manufacturing and non-financial services companies, with a public share below 50 percent, recorded in thedatabase of the Bank of Spain’s Central Balance Sheet Office. This dataset wasstarted in 1982 collecting firm data about balance sheets, employment, and othercomplementary information. The firms included in the database are of large relativesize (and hence oversampling larger firms). However, the tendency in subsequentyears has been characterized by the addition of firms of smaller relative size.We have dropped from the sample those firms with non-positive values for net
worth, capital stock, accumulated and accounting depreciation, labor costs, employ-ment, sales, output, or whose book value of capital stock jumped by a factor greaterthan 3 from one year to the next, were dropped from the sample. Table A1 presentsthe distribution of firms by size (measured as the time average of firm’s employees)and by 2-digit industry.
VARIABLE CONSTRUCTION
Employment. Number of employees is disaggregated by contract type, in permanentemployees (those with an indefinite or permanent contract) and temporary employees(those with a fixed-term or temporary contract). To maintain measurement consis-tency, the number of temporary employees is calculated in annual terms by multiply-ing the number of temporary employees along the year times the average number ofweeks worked by temporary employees and divided by 52.
Output. Gross output at retail prices is calculated as total sales, plus the changein finished product inventories and other income from the production process, minustaxes derived on the production (net of subsidies).
Intermediate inputs. Intermediate inputs output at retail prices are directly reportedby firms in the questionaire.
Investment. The CB does not have independent estimates of investment available.Gross nominal investment Iit must be imputed from changes in the book value ofphysical capital with a correction for depreciation, that is, Iit = KNBit−KNBi,t−1+Depit+Revit where, KNBit = KGBit−ADepit is the book value of the net stock ofphysical (book value of the gross stock of physical capital KGBit minus accumulateddepreciation ADepit); Depit is the accounting depreciation during the year; and Revitis the net variation in the book value of physical capital and in its accumulateddepreciation due to positive and/or negative revaluations.

BANCO DE ESPAÑA 38 DOCUMENTO DE TRABAJO N.º 1035
Physical capital. Physical capital is recorded at book value. However, the CBBE hasconstructed, for each firm, the market replacement value of capital. Essentially, thisvariable is constructed as q1Ki1 = (q1/q1−AAi) × KGBit(1 − δi)
AAi where qt is theprice deflator of the stock of physical capital at year t; δi is the average depreciationrate of the stock of physical capital; and AAi is the average age of the stock ofphysical capital, which is approximated by the ratio ADepi1/Depi1 for the first yearin which data for the firm are available. Furthermore, the average depreciation rateis computed at the industry level as the ratio of accounting depreciation to averageaccumulated depreciation. As regards price indices, the corresponding GDP implicitdeflator of investment goods is used (Source: INE). The recursive method to computethe replacement value of the stock of physical capital from the second year that datais available is qtKit = (qt/qt−1) ×Ki,t−1(1 − δi) + Iit,which assumes that investmentoccurs at the end of the year.
Regulation indicators. We use the OECD Indicators of Regulation Impact. Theseindicators measure the potential costs of anti-competitive regulation in selected non-manufacturing sectors on sectors of the economy that use the output of non-manufacturingsectors as intermediate inputs in the production process. These indicators have beencalculated for 41 ISIC rev3 sectors in 21 OECD countries over the period 1975 to2006. They are described in detail in:Conway, P. and G. Nicoletti (2006), "Product Market Regulation in the Non-
Manufacturing Sectors of OECD Countries: Measurement and Highlights", OECDEconomics Department Working Paper, No 530

BANCO DE ESPAÑA 39 DOCUMENTO DE TRABAJO N.º 1035
Table A1Distribution of observations by industry
Total15 Food and drink 869617 Textiles 303018 Wearing apparel, dressing and dying of fur 187519 Leather and footwear 133420 Wood and lumber 162121 Pulp and paper 145422 Printing and publishing 244424 Chemicals 537325 Rubber and plastics 232626 Non-metallic mineral products 375927 Basic metals 140828 Fabricated metal products 407529 Machinery and equipment 4013
30+31 Manufacture of office and electrical ma-chinery
1892
32+33 Electronic material + Precision, scientific,and optical instruments
1175
34+35 Motor vehicles + Other transport material 234636+ 37 Furniture and other manufacturing + Re-
cycling2703
45 Construction 732550 Sale, maintenance, and repair of motor ve-
hicles3519
51 Wholesale trades 1759552 Retail trade 340855 Hotels and catering 2958
60+61+62 Transport (Inland + Water + Air) 200863 Supporting transport services, travel
agencies2014
64 Communications 25570 Real estate 314272 Computer services and related activity 71674 Professional business services and other
business activities4460

BANCO DE ESPAÑA 40 DOCUMENTO DE TRABAJO N.º 1035
Table 1Estimates of technological coefficients (OLS)
MANUFACTURINGIndustry βL βM βK N Ng15 0.14 (0.01) 0.81 (0.01) 0.06 (0.01) 8655 102317 0.26 (0.01) 0.73 (0.01) 0.02 (0.05) 4875 58219 0.23 (0.03) 0.72 (0.04) 0.05 (0.01) 1043 15720 0.20 (0.02) 0.78 (0.02) 0.03 (0.01) 1601 18521 0.27 (0.02) 0.75 (0.02) 0.01 (0.01) 3850 46724 0.17 (0.01) 0.81 (0.01) 0.03 (0.01) 5313 59325 0.25 (0.03) 0.75 (0.02) 0.02 (0.01) 2275 27426 0.23 (0.02) 0.74 (0.02) 0.07 (0.01) 3710 42527 0.22 (0.01) 0.73 (0.01) 0.04 (0.01) 5355 68329 0.28 (0.02) 0.72 (0.01) 0.01 (0.003) 3922 44830 0.27 (0.02) 0.75 (0.01) 0.004 (0.01) 2978 35834 0.28 (0.04) 0.71 (0.03) 0.02 (0.01) 2284 27236 0.26 (0.03) 0.73 (0.03) 0.03 (0.01) 2657 314
SERVICESIndustry βL βM βK N Ng45 0.28 (0.02) 0.69 (0.01) 0.03 (0.01) 7160 106350 0.36 (0.03) 0.58 (0.03) 0.06 (0.02) 3476 47951 0.31 (0.01) 0.64 (0.01) 0.04 (0.01) 17100 230252 0.37 (0.02) 0.55 (0.02) 0.07 (0.01) 3299 48155 0.31 (0.02) 0.62 (0.02) 0.09 (0.01) 2916 41060 0.23 (0.04) 0.68 (0.02) 0.11 (0.03) 1974 28263 0.32 (0.02) 0.61 (0.01) 0.15 (0.01) 1962 27770 0.28 (0.03) 0.59 (0.02) 0.10 (0.01) 2909 53074 0.42 (0.01) 0.59 (0.02) 0.03 (0.01) 4295 692
Standard errors in parentheses.

BANCO DE ESPAÑA 41 DOCUMENTO DE TRABAJO N.º 1035
Table 2Estimates of technological coefficients (Olley-Pakes)
MANUFACTURINGIndustry βL βM βK ρ N Ng15 0.12 (0.01) 0.80 (0.01) 0.08 (0.01) 0.97 (0.05) 7434 101817 0.19 (0.03) 0.79 (0.05) 0.02 (0.01) 0.91 (0.03) 3994 57419 0.15 (0.02) 0.79 (0.02) 0.04 (0.01) 0.86 (0.03) 1043 15720 0.24 (0.07) 0.71 (0.04) 0.05 (0.01) 0.94 (0.07) 1340 18521 0.31 (0.03) 0.71 (0.03) 0.02 (0.01) 0.99 (0.12) 3237 46424 0.20 (0.02) 0.76 (0.02) 0.05 (0.01) 0.92 (0.08) 4614 59025 0.20 (0.03) 0.74 (0.02) 0.05 (0.01) 0.98 (0.10) 1946 27226 0.18 (0.03) 0.72 (0.02) 0.12 (0.01) 0.94 (0.08) 3205 42527 0.28 (0.02) 0.69 (0.02) 0.05 (0.01) 0.97 (0.04) 4496 68329 0.31 (0.03) 0.71 (0.02) 0.01 (0.00) 0.90 (0.06) 3357 44630 0.26 (0.03) 0.76 (0.02) 0.002 (0.01) 0.96 (0.21) 2557 35734 0.39 (0.12) 0.65 (0.05) −0.01 (0.01) 0.90 (0.09) 1974 27236 0.18 (0.03) 0.74 (0.02) 0.06 (0.01) 0.99 (0.09) 2228 311
SERVICESIndustry βL βM βK ρ N Ng45 0.24 (0.02) 0.68 (0.02) 0.06 (0.01) 0.99 (0.04) 5767 105250 0.36 (0.04) 0.43 (0.02) 0.16 (0.01) 0.96 (0.03) 2796 47551 0.38 (0.02) 0.53 (0.02) 0.07 (0.01) 0.94 (0.04) 13539 227652 0.45 (0.04) 0.37 (0.04) 0.15 (0.01) 0.92 (0.05) 2553 47555 0.36 (0.04) 0.49 (0.07) 0.12 (0.01) 0.93 (0.07) 2444 40860 0.19 (0.03) 0.59 (0.03) 0.20 (0.01) 0.98 (0.06) 1628 27663 0.31 (0.06) 0.57 (0.02) 0.17 (0.01) 0.96 (0.06) 1543 27470 0.19 (0.05) 0.48 (0.02) 0.14 (0.01) 0.98 (0.05) 2152 51974 0.34 (0.02) 0.53 (0.03) 0.10 (0.01) 0.96 (0.03) 3368 684
Bootstrap standard errors in parentheses.

BANCO DE ESPAÑA 42 DOCUMENTO DE TRABAJO N.º 1035
Table 3AGrowth in output and TFP for continuing firms (%): ManufacturingIndustry. 1985-1990 1990-1995 1995-2000 2000-2005
All Output 6.2 3.1 6.1 0.4TFP −1.7 0.4 0.6 0.6
15 Output 8.6 2.6 2.5 −1.7TFP −2.5 0.3 1.7 1.7
17+18 Output 4.8 −1.7 −0.4 13.7TFP −1.2 1.9 1.9 −6.8
19 Output 1.5 −6.6 −4.6 −3.4TFP −4.3 3.6 2.4 −2.3
20 Output 5.4 1.3 10.1 4.3TFP −2.4 0.7 0.5 −0.2
21+22 Output 1.8 −0.6 0.7 3.2TFP −2.4 0.5 2.6 −1.9
24 Output 1.4 2.0 4.9 1.2TFP −0.4 2.4 1.0 1.1
25 Output 1.6 1.7 1.3 5.3TFP −2.8 0.8 3.6 −1.7
26 Output 10.0 0.6 1.5 5.3TFP −1.9 1.2 3.4 −0.3
27+28 Output 2.4 −0.6 14.3 2.1TFP −0.4 3.9 −4.7 0.5
29 Output 9.4 −1.3 4.0 −3.1TFP −1.1 4.3 2.3 2.3
30-33 Output 14.5 6.1 6.9 3.6TFP −2.2 1.8 1.9 −0.1
34+35 Output 8.5 7.2 8.6 −3.0TFP −1.8 −3.3 −0.2 0.9
36+37 Output 10.6 1.9 −1.7 2.3TFP −2.4 1.2 2.6 1.0
BANCO DE ESPAÑA 43 DOCUMENTO DE TRABAJO N.º 1035
Table 3BGrowth in output and TFP for continuing firms (%): ServicesIndustry. 1985-1990 1990-1995 1995-2000 2000-2005
All Output 9.7 1.4 3.5 8.0TFP −1.6 −0.6 2.3 −1.3
45 Output 10.8 0.0 0.0 3.8TFP −1.6 1.2 6.9 0.3
50 Output 14.8 0.0 1.9 19.9TFP 0.3 −0.2 7.6 −7.4
51 Output 4.4 2.2 −0.7 7.0TFP −2.8 −3.0 −0.3 −0.9
52 Output 13.3 5.4 6.7 9.9TFP −1.8 −2.9 1.6 −2.3
55 Output 5.5 −7.4 8.1 8.2TFP −2.3 −0.7 −1.5 −4.1
60-62 Output −4.2 16.6 6.9 14.8TFP 2.2 −5.8 1.1 −8.2
63 Output 15.7 −3.5 6.8 5.7TFP −3.1 0.8 −4.6 −2.6
70 Output 29.2 3.9 17.9 9.2TFP 10.1 −10.4 0.9 4.3
74 Output 11.1 2.3 7.9 8.8TFP −6.1 6.4 −0.9 −3.9

BANCO DE ESPAÑA 44 DOCUMENTO DE TRABAJO N.º 1035
Table 4ATransitions between TFP quantiles (%): Manufacturing1985-1995 Q.1 Q.2 Q.3 Q.4 Q.5 Exits Row
(1995) (1995) (1995) (1995) (1995) totalQ.1 (1985) 30.5 9.5 7.0 3.5 1.5 48.0 7.4
13 .4 4 .2 3 .1 1 .6 0 .7 21 .1Q.2 (1985) 23.8 18.4 9.4 4.5 4.5 39.5 8.3
11 .7 9 .1 4 .7 2 .2 2 .3 19 .3Q.3 (1985) 9.7 19.9 16.8 8.4 4.9 40.3 8.4
4 .9 10 .0 8 .4 4 .2 2 .5 20 .0Q.4 (1985) 6.8 4.9 14.6 18.1 8.3 47.3 7.6
3 .1 2 .2 6 .7 8 .2 3 .8 21 .3Q.5 (1985) 1.5 7.1 8.7 13.8 26.0 42.9 7.3
0 .7 3 .1 3 .8 6 .0 11 .5 18 .4Entrants 18.2 19.4 20.0 21.2 21.3 61.2
66 .3 71 .3 73 .3 77 .8 79 .3Column total 16.8 16.6 16.6 16.6 16.4 16.9
1995-2005 Q.1 Q.2 Q.3 Q.4 Q.5 Exits Row(2005) (2005) (2005) (2005) (2005) total
Q.1 (1995) 32.9 12.9 7.1 6.3 0.4 40.4 10.922 .0 8 .8 4 .8 4 .3 0 .3 22 .4
Q.2 (1995) 12.1 14.5 19.8 11.3 4.0 38.3 10.67 .9 9 .6 13 .0 7 .5 2 .7 20 .7
Q.3 (1995) 8.2 19.7 17.6 16.4 5.3 32.8 10.45 .2 12 .8 11 .4 10 .6 3 .5 17 .4
Q.4 (1995) 6.3 12.1 15.5 18.8 11.7 35.6 10.23 .9 7 .7 9 .8 12 .0 7 .5 18 .5
Q.5 (1995) 2.8 3.2 6.1 17.8 31.2 38.9 10.61 .8 2 .1 4 .0 11 .7 20 .7 20 .9
Entrants 20.4 20.0 19.3 18.3 21.9 47.359 .2 59 .0 56 .9 54 .0 65 .3
Column total 16.3 16.1 16.1 16.1 15.9 19.6Notes to Table 4A: Q1 is the lowest TFP quintile, and Q5 is the highest.The top number in each cell row is the % of firms in Q.j that end up inend up in Q.k ten years after.The botton number in each cell (in italics) is the % of firms in Q.k thatcame from Q.j ten years earlier.

BANCO DE ESPAÑA 45 DOCUMENTO DE TRABAJO N.º 1035
Table 4BTransitions between TFP quantiles (%): Services1985-1995 Q.1 Q.2 Q.3 Q.4 Q.5 Exits Row
(1995) (1995) (1995) (1995) (1995) totalQ.1 (1985) 12.2 15.9 9.8 3.7 1.2 57.3 3.5
2 .4 3 .1 1 .9 0 .7 0 .2 22 .6Q.2 (1985) 9.4 14.1 14.1 15.3 5.9 41.2 3.7
1 .9 2 .8 2 .9 3 .1 1 .2 16 .8Q.3 (1985) 7.3 3.7 13.4 19.5 6.1 50.0 3.5
1 .4 0 .7 2 .6 3 .8 1 .2 19 .7Q.4 (1985) 2.4 3.6 6.0 16.7 15.5 56.0 3.6
0 .5 0 .7 1 .2 3 .3 3 .1 22 .6Q.5 (1985) 4.0 1.3 1.3 13.3 29.3 50.7 3.2
0 .7 0 .2 0 .2 2 .4 5 .3 18 .3Entrants 20.8 20.5 20.1 19.2 19.5 82.4
93 .2 92 .4 91 .2 86 .7 89 .0Column total 18.4 18.2 18.2 18.2 18.0 9.0
1995-2005 Q.1 Q.2 Q.3 Q.4 Q.5 Exits Row(2005) (2005) (2005) (2005) (2005) total
Q.1 (1995) 23.2 11.8 6.4 3.9 1.0 53.7 6.58 .7 4 .5 2 .4 1 .5 0 .4 24 .4
Q.2 (1995) 13.8 16.6 17.1 6.9 2.8 42.9 6.95 .5 6 .7 6 .9 2 .8 1 .1 20 .8
Q.3 (1995) 3.3 13.3 17.1 20.0 7.1 39.1 6.71 .3 5 .2 6 .7 7 .8 2 .8 18 .3
Q.4 (1995) 4.1 5.9 19.9 16.3 15.8 38.0 7.11 .7 2 .4 8 .2 6 .7 6 .6 18 .8
Q.5 (1995) 3.0 4.0 4.5 13.4 36.1 39.1 6.41 .1 1 .5 1 .7 5 .0 13 .7 17 .7
Entrants 21.3 20.6 19.1 19.7 19.3 66.481 .7 79 .7 74 .1 76 .2 75 .4
Column total 17.3 17.2 17.1 17.2 17.0 14.3See Notes to Table 4A.

BANCO DE ESPAÑA 46 DOCUMENTO DE TRABAJO N.º 1035
Table 5ATFP determinants: Manufacturing firms
RI −1.3431 −1.3334 −1.3684 −1.3735 −1.6020(0.6849) (0.6849) (0.6842) (0.6842) (0.7109)
InHouse 0.0115 0.0132 0.0152(0.0047) (0.0057) (0.0060)
Share Temp −0.0614 −0.0613 −0.0634(0.0058) (0.0058) (0.0063)
Export/Sales 0.0117 0.0117 0.0137(0.0064) (0.0064) (0.0068)
Foreign −0.0005 −0.0005 −0.0019(0.0035) (0.0035) (0.0037)
Public −0.0087 −0.0086 −0.0002(0.0125) (0.0125) (0.0143)
Quoted −0.0172 −0.0173 −0.0167(0.0081) (0.0081) (0.0083)
Group 0.0066 0.0069 0.0038(0.0267) (0.0267) (0.0317)
Multi 0.0030 −0.0021 −0.0046(0.0033) (0.0040) (0.0042)
MShare −0.4059(0.1618)
Notes to Table 5A: Variables are transformed in first differences.All regressions include time dummies. Standard errors in parentheses.

BANCO DE ESPAÑA 47 DOCUMENTO DE TRABAJO N.º 1035
Table 5BTFP determinants: Services firms
RI −0.0352 −0.0324 0.0082(0.1536) (0.1533) (0.1618)
Share Temp −0.1020 −0.0903(0.0118) (0.0130)
Export/Sales 0.0382 0.0207(0.0201) (0.0220)
Foreign −0.0061 −0.0150(0.0103) (0.0114)
Public 0.0065 0.0028(0.0321) (0.0343)
Quoted 0.0599 0.0382(0.0300) (0.0331)
Group 0.0641 0.0574(0.0579) (0.0654)
Multi −0.0193 −0.0183(0.0068) (0.0074)
MShare −0.7068(0.2216)
See Notes to Table 5A.

BANCO DE ESPAÑA PUBLICATIONS
WORKING PAPERS1
0922 GALO NUÑO: Technology, convergence and business cycles.
0923 FRANCISCO DE CASTRO AND JOSÉ LUIS FERNÁNDEZ: The relationship between public and private saving in
Spain: does Ricardian equivalence hold?
0924 GONZALO FERNÁNDEZ-DE-CÓRDOBA, JAVIER J. PÉREZ AND JOSÉ L. TORRES: Public and private sector wages
interactions in a general equilibrium model.
0925 ÁNGEL ESTRADA AND JOSÉ MANUEL MONTERO: R&D investment and endogenous growth: a SVAR approach.
0926 JUANA ALEDO, FERNANDO GARCÍA-MARTÍNEZ AND JUAN M. MARÍN DIAZARAQUE: Firm-specific factors
influencing the selection of accounting options provided by the IFRS: Empirical evidence from Spanish market.
0927 JAVIER ANDRÉS, SAMUEL HURTADO, EVA ORTEGA AND CARLOS THOMAS: Spain in the euro: a general
equilibrium analysis.
0928 MAX GILLMAN AND ANTON NAKOV: Monetary effects on nominal oil prices.
0929
0930
0931
JAVIER MENCÍA AND ENRIQUE SENTANA: Distributional tests in multivariate dynamic models with Normal and
Student t innovations.
JOAN PAREDES, PABLO BURRIEL, FRANCISCO DE CASTRO, DANIEL GARROTE, ESTHER GORDO AND JAVIER
J. PÉREZ: Fiscal policy shocks in the euro area and the US: an empirical assessment.
TERESA LEAL, DIEGO J. PEDREGAL AND JAVIER J. PÉREZ: Short-term monitoring of the Spanish Government
balance with mixed-frequencies models.
0932 ANTON NAKOV AND GALO NUÑO: Oilgopoly: a general equilibrium model of the oil-macroeconomy nexus.
0933 TERESA LEAL AND JAVIER J. PÉREZ: Análisis de las desviaciones presupuestarias aplicado al caso del presupuesto
del Estado.
0934 JAVIER J. PÉREZ AND A. JESÚS SÁNCHEZ: Is there a signalling role for public wages? Evidence for the euro area
based on macro data.
0935
1001
JOAN PAREDES, DIEGO J. PEDREGAL AND JAVIER J. PÉREZ: A quarterly fiscal database for the euro area based
on intra-annual fiscal information.
JAVIER ANDRÉS, ÓSCAR ARCE AND CARLOS THOMAS: Banking competition, collateral constraints and optimal
monetary policy.
1002 CRISTINA BARCELÓ AND ERNESTO VILLANUEVA: The response of household wealth to the risk of losing the job:
evidence from differences in firing costs.
1003
1004
ALEXANDER KARAIVANOV, SONIA RUANO, JESÚS SAURINA AND ROBERT TOWNSEND: No bank, one bank,
several banks: does it matter for investment?
GABRIEL PEREZ-QUIROS AND HUGO RODRÍGUEZ MENDIZÁBAL: Asymmetric standing facilities: an unexploited
monetary policy tool.
1005
1006
1007
1008
GABRIEL JIMÉNEZ, JOSE A. LOPEZ AND JESÚS SAURINA: How does competition impact bank
risk-taking?
GIUSEPPE BERTOLA, AURELIJUS DABUSINSKAS, MARCO HOEBERICHTS, MARIO IZQUIERDO, CLAUDIA
KWAPIL, JEREMI MONTORNÈS AND DANIEL RADOWSKI: Price, wage and employment response to shocks:
evidence from the WDN Survey.
JAVIER MENCÍA: Testing non-linear dependence in the Hedge Fund industry.
ALFREDO MARTÍN-OLIVER: From proximity to distant banking: Spanish banks in the EMU.
1009 GALO NUÑO: Optimal research and development expenditure: a general equilibrium approach.
1010
1011
1012
1013
1014
1015
LUIS J. ÁLVAREZ AND PABLO BURRIEL: Is a Calvo price setting model consistent with micro price data?
JENS HAGENDORFF, IGNACIO HERNANDO, MARÍA J. NIETO AND LARRY D. WALL: What do premiums paid for
bank M&As reflect? The case of the European Union.
DAVID DE ANTONIO LIEDO: General equilibrium restrictions for dynamic factor models.
JAMES COSTAIN, JUAN F. JIMENO AND CARLOS THOMAS: Employment fluctuations in a dual labor market.
LUIS M. VICEIRA AND RICARDO GIMENO: The euro as a reserve currency for global investors.
PALOMA LÓPEZ-GARCÍA AND JOSÉ MANUEL MONTERO: Understanding the Spanish business innovation gap:
The role of spillovers and firms' absorptive capacity.
1. Previously published Working Papers are listed in the Banco de España publications catalogue.

1016
1017
1018
1019
1020
1021
1022
1023
1024
1025
1026
1027
1028
1029
1030
1031
1032
1033
1034
1035
AITOR LACUESTA AND SERGIO PUENTE: El efecto del ciclo económico en las entradas y salidas de inmigrantes
en España.
REBEKKA CHRISTOPOULOU, JUAN F. JIMENO AND ANA LAMO: Changes in the wage structure in EU countries.
THOMAS BREUER, MARTIN JANDAČKA, JAVIER MENCÍA AND MARTIN SUMMER: A systematic approach to
multi-period stress testing of portfolio credit risk.
LUIS J. ÁLVAREZ AND PABLO BURRIEL: Micro-based estimates of heterogeneous pricing rules: The United States
vs. the euro area.
ALFREDO MARTÍN-OLIVER AND VICENTE SALAS-FUMÁS: I.T. investment and intangibles: Evidence from banks.
LUISA LAMBERTINI, CATERINA MENDICINO AND MARIA TERESA PUNZI: Expectations-driven cycles
in the housing market.
JULIÁN MESSINA, PHILIP DU CAJU, CLÁUDIA FILIPA DUARTE, NIELS LYNGGÅRD HANSEN AND MARIO
IZQUIERDO: The incidence of nominal and real wage rigidity: an individual-based sectoral approach.
ALESSIO MORO: Development, growth and volatility.
LUIS J. ÁLVAREZ AND ALBERTO CABRERO: Does housing really lead the business cycle?
JUAN S. MORA-SANGUINETTI: Is judicial inefficiency increasing the house property market weight in Spain?
Evidence at the local level.
MAXIMO CAMACHO, GABRIEL PEREZ-QUIROS AND PILAR PONCELA: Green shoots in the Euro area. A real
time measure.
AITOR ERCE AND JAVIER DÍAZ-CASSOU: Creditor discrimination during sovereign debt restructurings.
RAFAEL REPULLO, JESÚS SAURINA AND CARLOS TRUCHARTE: Mitigating the pro-cyclicality of Basel II.
ISABEL ARGIMÓN AND JENIFER RUIZ: The effects of national discretions on banks.
GABRIEL JIMÉNEZ, STEVEN ONGENA, JOSÉ-LUIS PEYDRÓ AND JESÚS SAURINA: Credit supply: identifying
balance-sheet channels with loan applications and granted loans.
ENRIQUE MORAL-BENITO: Determinants of economic growth: A Bayesian panel data approach.
GABE J. DE BONDT, TUOMAS A. PELTONEN AND DANIEL SANTABÁRBARA: Booms and busts in China's stock
market: Estimates based on fundamentals.
CARMEN MARTÍNEZ-CARRASCAL AND JULIAN VON LANDESBERGER: Explaining the demand for money by non-
financial corporations in the euro area: A macro and a micro view.
CARMEN MARTÍNEZ-CARRASCAL: Cash holdings, firm size and access to external finance. Evidence for
the euro area.
CÉSAR ALONSO-BORREGO: Firm behavior, market deregulation and productivity in Spain.
Unidad de Publicaciones Alcalá, 522; 28027 Madrid
Telephone +34 91 338 6363. Fax +34 91 338 6488 E-mail: [email protected]
www.bde.es