Embed Size (px)
Citation preview

Draft
Prior wildfires influence burn severity of subsequent large
fires
Journal: Canadian Journal of Forest Research
Manuscript ID cjfr-2016-0185.R2
Manuscript Type: Article
Date Submitted by the Author: 08-Aug-2016
Complete List of Authors: Stevens-Rumann, Camille; University of Idaho, Prichard, Susan; University of Washington Strand, Eva; University of Idaho Morgan, Penelope; University of Idaho
Keyword: fire weather, reburn, repeated wildfires, self-regulation, sequential autoregression
https://mc06.manuscriptcentral.com/cjfr-pubs
Canadian Journal of Forest Research

Draft
Prior wildfires influence burn severity of subsequent large fires 1
Camille S. Stevens-Rumann, Susan J. Prichard, Eva K. Strand, Penelope Morgan 2
3
4
C.S. Stevens-Rumann (Corresponding author), E.K. Strand, P. Morgan 5
University of Idaho 6
Department of Forest, Rangeland, and Fire Sciences 7
875 Perimeter Drive MS 1133 8
Moscow, ID 83844 9
Email: [email protected] 10
Phone: 602-509-5077 11
Fax: 208-885-6564 12
13
S.J. Prichard 14
University of Washington 15
School of Environmental and Forest Sciences 16
University of Washington 17
Seattle, WA 98195-2100 18
Page 1 of 41
https://mc06.manuscriptcentral.com/cjfr-pubs
Canadian Journal of Forest Research

Draft
Abstract 19
With longer and more severe fire seasons predicted, incidence and extent of fires is 20
expected to increase in western North America. As more area is burned, past wildfires may 21
influence the spread and burn severity of subsequent fires, with implications for ecosystem 22
resilience and fire management. We examined how previous burn severity, topography, 23
vegetation, and weather influenced burn severity on four wildfires, two in Idaho, one in 24
Washington, and one in British Columbia. These were large fire events, together burning 25
330,000 ha and cost $165 million USD in fire suppression expenditures. Collectively, these 26
four study fires reburned over 50,000 ha previously burned between 1984 and 2006. We used 27
sequential autoregression to analyze how past fires, topography, vegetation, and weather 28
influenced burn severity. We found that areas burned in the last three decades, at any 29
severity, had significantly lower severity in the subsequent fire. Final models included 30
maximum temperature, vegetation cover type, slope, and elevation as common predictors. 31
Across all study fires and burning conditions within them, burn severity was reduced in 32
previously burned areas, suggesting that burned landscapes mitigate subsequent fire effects 33
even with the extreme fire weather under which these fires burned. 34
Key words: fire weather; reburn; repeated wildfires; sequential autoregression; self-35
regulation 36
37
38
Page 2 of 41
https://mc06.manuscriptcentral.com/cjfr-pubs
Canadian Journal of Forest Research

Draft
Introduction 39
As a self-regulating process, the pattern of previous fires may limit the progression and burn 40
severity of subsequent wildfires for some time due to limited burnable fuels and changes in 41
forest structure (Agee 1999; Peterson 2002; Parks et al. 2014, 2015; Coop et al. 2016). Over 42
the past century, the legacy of past land use changes and fire exclusion have influenced forest 43
landscapes over much of the western United States (Hessburg et al. 2015). After nearly a 44
century of fire exclusion, many dry forests of the western United States have altered stand 45
structures and landscape patterns that can contribute to larger and more severe wildfire 46
events (Hessburg et al. 2015; Parks et al. 2015). With the onset of warmer, drier summers 47
and warm springs, the number and size of wildfires is increasing in the western US and other 48
fire-prone ecosystems throughout the world (Littell et al. 2009; Jolly et al. 2015). Burn 49
severity, defined as the magnitude of ecological effects of fires (Prichard and Kennedy 50
2014), has been less studied than area burned. With the growing number of large wildfires 51
and costly wildfire seasons, a better understanding of fire on fire interactions and their 52
implications for ecological effects is needed to inform science and management of fires. 53
Previous researchers have found that burn severity of wildfires was influenced by the 54
burn severity of prior fire. To date, many of these studies were in large wilderness areas in 55
which wildfires have had limited fire suppression and were managed and monitored (e.g. 56
Collins et al. 2009; van Wagtendonk et al. 2012; Parks et al. 2014). In studies of past fire 57
interactions in the Sierra Nevada Range, Collins et al. (2009) and van Wagtendonk et al. 58
(2012) found that areas previously burned with low to moderate severity within the past 30-59
years tended to burn at similar severity in a subsequent fire. However, if an area had 60
previously burned in a high severity fire, a high proportion of the area burned at high severity 61
in a subsequent fire. They attributed this to the fire-induced shift in vegetation from forests to 62
highly flammable shrublands rather than simply a function of post-fire fuel accumulation 63
Page 3 of 41
https://mc06.manuscriptcentral.com/cjfr-pubs
Canadian Journal of Forest Research

Draft
(van Wagtendonk et al. 2012). Similarly, Holden et al. (2010) found that in wildfires 3 to 14 64
years prior there was a threshold for burn severity above which burn severity is likely to 65
increase in the subsequent fire. Based on inferences from satellite imagery combined with 66
field data, low severity fires often resulted in subsequent low severity fires, but high severity 67
fires resulted in subsequent high severity fires (Holden et al. 2010; Parks et al. 2014a). In this 68
study we focus on non-wilderness areas. Fires outside of wilderness areas are often in drier 69
forest types (Haire et al. 2013), tend to have the highest fire suppression costs, and these 70
areas have high public interest and use. 71
Topography, vegetation, and fire weather influence burn severity of wildfires 72
(Schoennagel et al. 2004; Lentile et al. 2007; Prichard and Kennedy 2014; Birch et al. 2015), 73
but whether these variables supersede or compound the influence of prior fires is not well 74
understood. Previous studies have reported mixed findings on the relative importance of top-75
down drivers of fire, such as maximum temperature, relative humidity, and wind speeds, and 76
bottom-up drivers, such as vegetation and topography. Bessie and Johnson (1995) and 77
Gedalof et al. (2005) demonstrated that extreme weather conditions can override bottom-up 78
factors, resulting in larger wildfires regardless of fuels and forest types. In contrast, Birch et 79
al. (2015) found that bottom-up factors, including vegetation and site potential, influenced 80
burn severity more than climate and weather. Though multiple researchers have examined 81
bottom-up versus top-down drivers of burn severity, few have analyzed the influence of these 82
factors in previously burned areas over multiple large fires. Some research has found that 83
wildfires burning under very hot, dry, and windy conditions are more likely to overcome fuel 84
breaks even those created by previous wildfires (Pollet and Omi 2002). To better understand 85
the capacity of burn mosaics to be self-regulating, we must understand when and why past 86
wildfires alter subsequent burn severity and when environmental factors or day of burning 87
conditions override the legacy effects of prior fires. 88
Page 4 of 41
https://mc06.manuscriptcentral.com/cjfr-pubs
Canadian Journal of Forest Research

Draft
Here we focus on the legacy of previous wildfires by examining the drivers of burn 89
severity within reburned areas in non-wilderness forests of the interior northwestern US. We 90
studied the Tripod Complex Fire (central Washington, USA), the East Zone Complex 91
(central Idaho, USA), Cascade Complex Fires (central Idaho, USA), and Kootenay Fire 92
(central British Columbia, Canada); each of which were unusually large, severe, and 93
expensive relative to those of the prior century, and each burned through areas burned by 94
numerous past fires. We used sequential autoregression (SAR) analysis to evaluate the 95
influence of past wildfires, weather and topography on burn severity. SAR has been used in 96
recent studies of burn severity to take advantage of the inherent spatial autocorrelation in 97
burn severity datasets (Wimberly et al. 2009, Prichard and Kennedy 2013). The effectiveness 98
of fuels treatments, including prescribed fires, have been previously studied on two of these 99
wildfires (Hudak et al. 2011; Prichard and Kennedy 2014), but neither included previous 100
wildfires that may have also modified burn severity. Our study was guided by two key 101
questions: (1) How was burn severity of subsequent wildfires influenced by previous 102
wildfires? and (2) What role does weather, vegetation and topographic conditions have on 103
burn severity? These questions are critical for forecasting the implications for future 104
resilience and vulnerability, as well as understanding how post-fire fuel conditions will 105
influence subsequent burn severity and when and where the legacy of these past burns can be 106
used in wildfire management to achieve vegetation management or restoration goals. 107
Additionally, we address how weather, topography, vegetation, and past wildfires to 108
influence subsequent burn severity and how relationships differ between the four events. 109
Methods 110
Study areas 111
We focused our study on four recent, large wildfires in Idaho, Washington, and British 112
Columbia (Figure 1). These wildfires were chosen due to their large size, high fire 113
Page 5 of 41
https://mc06.manuscriptcentral.com/cjfr-pubs
Canadian Journal of Forest Research

Draft
suppression costs, and large areas of interactions with previous wildfires. Combined, these 114
four fire complexes burned a total of 330,000 ha and cost over $165.5 million USD in fire 115
suppression (Filmon 2003; Hudak et al. 2011; Prichard and Kennedy 2015). Our four study 116
fires occurred in years of widespread fires across their respective regions (Filmon 2003; 117
Hudak et al. 2011). In three of the four cases these wildfires were complexes started from 118
multiple ignitions that burned into one another and were managed as a single fire. 119
The 2006 Tripod Complex on the Okanogan-Wenatchee NF in Washington was, at 120
the time, the largest (70,894 ha) fire event in Washington State and cost $82 million USD in 121
fire suppression costs (Prichard and Kennedy 2014). Over 65% of the area burned at 122
moderate to high burn severity with stand replacement. The wildfires in this complex ignited 123
from lightning in high elevation forests of lodgepole pine (Pinus contorta) and Engelmann 124
spruce (Picea engelmannii). The wildfires then spread into surrounding mixed-conifer forests 125
of Douglas-fir (Pseudotsuga menziesii), ponderosa pine (Pinus ponderosa) and western larch 126
(Larix occidentalis). As the Tripod Complex spread northeast with prevailing winds, it 127
burned portions of three 2003 burns, three 2001 burns, and burned a small portion of one 128
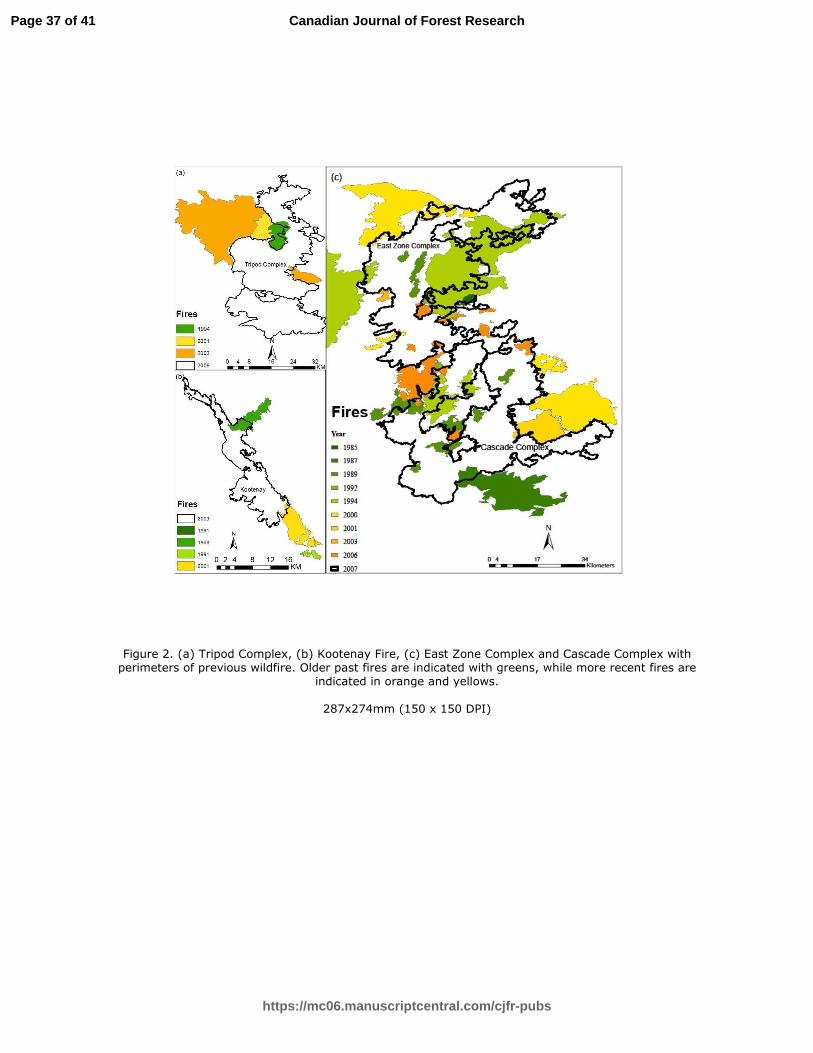
1994 burn (Figure 2a). 129
The 2003 Kootenay Fire Complex (Kootenay National Park, British Columbia) was 130
one of the largest fire events to have occurred in the Canadian Rockies in park history, 131
burning 17,400 ha and costing $10.3 million USD for fire suppression. Over 75% of the area 132
burned at moderate to high severity. Pre-fire fuel complexes were comprised of mature 133
mixed-conifer forests of lodgepole pine, Engelmann spruce, and subalpine fir (Abies 134
lasiocarpa). This wildfire was mostly stand replacing and burned into a wildfire from 2001 135
(Figure 2b). This fire occurred within a Canadian national park, but full suppression of all 136
wildfires was the standard operating procedure before 2004, thus this fire and those points of 137
interaction were similar to the national forest study areas within the US (Day et al. 1990). 138
Page 6 of 41
https://mc06.manuscriptcentral.com/cjfr-pubs
Canadian Journal of Forest Research

Draft
In 2007, the East Zone and Cascade Complex fires each burned over 128,000 ha on 139
the Boise and Payette National Forests in Idaho (Hudak et al. 2011) and cost $32.5 and $40.7 140
million USD respectively in fire suppression. The East Zone and Cascade Complexes burned 141
with mixed burn severity, with 21 to 30% of each wildfire classified as high severity 142
(Stevens-Rumann and Morgan in press). These two complexes burned through a wide range 143
of forest types and elevations from subalpine forests and meadows at high elevation to lower 144
tree line dominated by ponderosa pine woodlands. These two wildfires interacted with 31 145
previous wildfires that burned between 1984 and 2006 (Figure 2c). Although the 2007 146
Cascade and East Zone Complexes shared borders, we analyzed these fires separately given 147
their large size and the computational resources required to analyze these large landscapes. 148
Datasets 149
We used data from multiple sources to examine drivers of burn severity (Table 1). 150
We assessed the impact of previous wildfires by evaluating burn severity using a continuous 151
Relative Differenced Normalized Burn Ratio (RdNBR; Miller et al. 2009) for the three US 152
fires which was obtained from the Monitoring Trends in Burn Severity (MTBS) project 153
(Eidenshink et al. 2007). We chose RdNBR over other metrics of burn severity because it is 154
generally a reliable predictor of field-validated burn severity (Miller et al. 2009; Prichard and 155
Kennedy 2014) and is especially suitable for heterogeneous vegetation (Parks et al. 2015). 156
Additionally, field-based composite burn index (CBI) values on the Tripod Complex Fire 157
were highly correlated with RdNBR (R2 = 0.71; Prichard and Kennedy 2014). For the 158
Kootenay Fire, we used Differenced Normalized Burn Ratio (dNBR) which was post-159
processed by Kootenay National Park. Due to the largely homogenous cover type on this fire 160
dNBR was considered to be an appropriate proxy (Miller and Thode 2007). 161
We used the MTBS data for the prior fires for three potential predictor variables. 162
First, we converted continuous RdNBR and dNBR values for past fires into categorical 163
Page 7 of 41
https://mc06.manuscriptcentral.com/cjfr-pubs
Canadian Journal of Forest Research

Draft
variables of “unchanged/unburned”, “low”, “moderate”, and “high” using metric specific 164
thresholds established by Miller and Thode (2007) to apply consistent classifications between 165
study areas. For our analysis, categorical variables were required to have a base contrast for 166
regression comparisons, thus we used unburned/unchanged as the base contrast. Second, time 167
since fire was assigned for each pixel that experienced 2 or more fires since 1984. For pixels 168
not previously burned we assigned “100” as time since previous fire. We categorized these as 169
“100” years since fire because burn severity data inferred from Landsat satellite imagery is 170
only available after 1984 and most of these forests are known to be dominated by 80-120 171
year old trees (Schellhaas et al. 2001). For pixels that were reburned more than once (i.e., 172
burned in three or more wildfires between 1984 and 2007), the most recent fire year was used 173
to calculate time since previous fire. This did not occur on the Kootenay Fire and occurred on 174
two percent of the reburned area of the Tripod Fire. On the Cascade Complex Fire this 175
occurred on three percent of reburned pixels and on the East Zone Complex Fires on four 176
percent. Third, to understand possible edge effects, such as fire suppression and changes in 177
fire behavior along a fires perimeter, we used a distance-to-edge metric calculated as the 178
distance of each pixel to the nearest burn perimeter. Although fire management actions 179
during wildfires likely altered fire extent and burn severity, we did not account for them 180
directly as the records of management actions were incomplete. 181
We were able to partially evaluate RdNBR accuracy in reburned areas by examining 182
relationships between field-based Composite Burn Index values and RdNBR values in reburn 183
areas of the 2006 Tripod Complex fires. Field validation plots were established in prescribed 184
burn areas that reburned in the Tripod Complex, and most were classified as low burn 185
severity areas as a result of the treatment effect (Prichard and Kennedy 2014). On these sites, 186
producer’s accuracy was around 40%, however 95% of the misclassification occurred when 187
RdNBR values were close to the burn severity cut-off between unchanged and low or low 188
Page 8 of 41
https://mc06.manuscriptcentral.com/cjfr-pubs
Canadian Journal of Forest Research

Draft
and moderate severity established by Miller and Thode (2007). Field validation did not differ 189
from that inferred from satellite imagery by more than one category (e.g., low severity 190
classification when field validation was moderate severity). 191
To examine the impact of weather on the day of burning, we acquired fire progression 192
interval layers from the Okanogan-Wenatchee, Boise, and Payette National Forests, and from 193
Kootenay National Park. These progression layers allow us to narrow the time frame within 194
which each pixel burned to a 10-96 hour window depending on the frequency progression 195
intervals were sampled from infrared imagery. We then assigned weather characteristics 196
during each progression interval based on the date each pixel burned. We assigned maximum 197
and average wind taken at 6.1 m above ground, maximum and average air temperature, and 198
minimum relative humidity (RH). These data were acquired from nearby Remote Area 199
Weather Stations (RAWS): the First Butte station for the Tripod, the Tea Pot Idaho station 200
for the Cascade and East Zone (Western Regional Climate Center, http://www.raws.dri.edu/, 201
last accessed January 13, 2015), and Vermillion Weather Station (courtesy of Parks Canada, 202
Kootenay National Park). All stations were within 5 km of the nearest burned edge. From the 203
Vermillion weather station, we could only acquire daily mean temperatures, relative 204
humidity, and average wind speed; therefore maximum and minimum values were not 205
available and excluded from the analysis. 206
Vegetation and fuels information was derived from LANDFIRE products (30m 207
resolution; Ryan and Opperman 2013). We used 2001 data to reflect the best data for 208
conditions prior to the three study wildfires. We acquired crown bulk density (CBD), fire 209
regime group (FRG) and canopy cover (CC). We also converted the 40 existing vegetation 210
type (EVT) to seven “cover type” categories, to group similar vegetation types. These cover 211
types were “lodgepole pine”, “ponderosa pine”, “subalpine forest”, “riparian”, “dry-mesic 212
mixed-conifer”, “Douglas-fir/western hemlock”, “grassland/shrubland”. Grasslands and 213
Page 9 of 41
https://mc06.manuscriptcentral.com/cjfr-pubs
Canadian Journal of Forest Research
Draft
shrublands comprised a relatively small portion of the total study area landscapes with 8% on 214
the Tripod, 15% on the East Zone, and 18% on the Cascade thus we grouped all grasslands 215
and shrublands together for the analysis, even though conditions of these various grassland 216
and shrubland covertypes are known to be highly variable: from subalpine grasslands to low 217
elevation shrublands and grasslands. We used “dry mesic mixed-conifer” as the base contrast 218
for burn severity comparison. Vegetation type and stand origin maps are available from 219
Kootenay National Park, but due to the fairly uniform vegetation types and stand structures 220
we did not include vegetation characteristics for this model. 221
Topographic and landscape indices were evaluated, including potential incoming 222
solar radiation summarized over one calendar year period (Fu and Rich 1999), elevation (m), 223
slope (degrees; ESRI 2011), and steady state topographic wetness index (TWI). TWI was 224
derived using Evans’ (2003) script. Three topographic position indices including topographic 225
position index (TPI), ridge/ridge-like position, and valley/valley-like position, were 226
calculated within a 100-m neighborhood of each pixel using methods developed by Weiss 227
(2001). The basic TPI calculation compares the elevation of each cell in a DEM to the mean 228
elevation within the nearest-neighborhood of each pixel. Ridgetop or ridge-like positions are 229
defined as positive TPI values (0-2.0), representing locations that are higher than the average 230
of their surroundings, and valley or valley-like positions defined as negative TPI values (-2 to 231
0). 232
Data Analysis 233
We used Sequential Autoregression (SAR) analysis (Wimberly et al. 2009) to 234
evaluate how previous burn severity, topography, vegetation, and weather, influenced burn 235
severity. Our response variable was burn severity on each of our four study fires represented 236
by continuous RdNBR or dNBR values. Candidate predictor variables included: weather 237
variables, burn severity classification of past wildfire events (e.g., unchanged/unburned, low, 238
Page 10 of 41
https://mc06.manuscriptcentral.com/cjfr-pubs
Canadian Journal of Forest Research
Draft
moderate, and high), time since previous fire, topographic variables, vegetation types, and 239
fuel characteristics (Table 1). We examined colinearity between possible predictor variables 240
with simple pairwise correlations and excluded correlated variables (r >0.85; Nash and 241
Bradford 2001) from the same model. The SAR models were constructed in R programming 242
language (R Development Core Team 2011) and methods were published by Wimberly et al. 243
(2009) and Prichard and Kennedy (2014). We compared individual variable models using 244
Akaike’s Information Criterion (AIC; Akaike 1974), and selected the final multivariate 245
models based on lowest AIC values. We tested multiple models and removed variables when 246
the AIC value was not reduced by more than 50 (Supplementary Table 1). 247
Prichard and Kennedy (2014) demonstrated that using a 30m nearest neighborhood 248
distance minimized both AIC and Moran’s I, and we confirmed with Moran’s I that our final 249
models did not have autocorrelation of the residuals at this neighborhood distance. Although 250
SAR analyses define the SAR neighborhood weighted matrix by subsampling to reduce 251
computational resources and time (Kissling and Carl 2008), we assigned point data 252
information to each 30-m pixel across the entirety of each of our four study fires, including 253
areas previously unburned. In the Cascade and East Zone Complex, a spatially continuous 254
dataset was impossible due to a failure of the Landsat 7 EMT+ scan line correction 255
mechanism (known as SLC off condition; Howard and Lacasse 2004; Supplementary Figure 256
1). In these two wildfires, we used all available points, skipping the 150-m scan line areas 257
and treating pixels surrounding the scan lines as true neighbors. To address the possibility 258
that missing data skewed results of our SAR analysis, we performed a test of bias by 259
examining the distribution of cover type and topographic variables within these scan lines 260
versus areas with RdNBR data. Our examination of pixels within and outside the scan lines 261
showed that the distribution of canopy cover, elevation, slope, solar radiation and 262
topographic wetness index were nearly identical for both the Cascade and East Zone 263
Page 11 of 41
https://mc06.manuscriptcentral.com/cjfr-pubs
Canadian Journal of Forest Research

Draft
Complex fires (Figure 3), and therefore that there was no bias due to scan line errors. 264
In addition to examining these fires as continuous study sites, across all cover types 265
we did two additional SAR analyses within each study fire to determine how past fires 266
influenced burn severity within different forest types, we refer to these as “cover type 267
models”. To extract data for these analyses we grouped our previous cover types into “low 268
elevation forest type” (Douglas-fir/hemlock, ponderosa pine, dry-mesic mixed-conifer) and a 269
“high elevation forest type” (lodgepole pine, subalpine fir), and ran the SAR analysis on only 270
points that fell within each of these broad forest type classifications. Only two factors were 271
considered in this model: time since previous fire and past burn severity. 272
Results 273
Final SAR models of burn severity, based on lowest AIC values, varied between 274
study areas, but past burn severity was a strong predictor on all sites. The Tripod, Cascade 275
and East Zone SAR models included distance to edge, valley bottom, maximum temperature, 276
and cover type (Table 2 and 3). In addition to these common five variables, the final model 277
for Tripod included canopy cover, elevation, and slope. The East Zone final model also 278
included elevation, TWI, and maximum wind gusts on day of burning and the Cascade final 279
model included slope, time since fire, maximum wind gusts on day of burning, and canopy 280
cover. The Kootenay fire did not have vegetation variables; the final model included distance 281
to edge, hill, elevation, average temperature and past burn severity. Many other predictor 282
variables were significant predictors of RdNBR or dNBR but were not included in the final 283
models, based on lowest AIC values. 284
Past wildfires 285
Past burn severity had a negative relationship on subsequent burn severity on all four 286
study fires. Compared to areas unburned/unchanged in previous fires, previously burned 287
pixels had reduced burn severity (Table 3, Figure 4). Areas that burned at high severity in the 288
Page 12 of 41
https://mc06.manuscriptcentral.com/cjfr-pubs
Canadian Journal of Forest Research

Draft
Tripod and Kootenay fires contributed to the largest reduction in burn severity in the 289
subsequent fire, while low burn severity areas had the smallest reduction or did not differ 290
significantly from previously unburned/unchanged points. Conversely, on the East Zone and 291
Cascade fires, areas that previously burned at low severity had the largest reduction in reburn 292
severity compared to unburned areas. 293
Slightly different results were observed in the cover type models. The relationship to 294
past burn severity was maintained within both low elevation and high elevation forest types 295
on the Tripod, but the estimates on East Zone and Cascade fires varied from the full models. 296
On the East Zone, high elevation forest types had the largest decreases in burn severity on 297
sites previously burned at high severity, while low elevation forest types experienced the 298
lowest burn severity after previously experiencing a low severity fire. On the Cascade fire the 299
pattern was the same in both forest types: the lowest burn severity was observed after 300
previously experiencing a low severity fire, while areas that experienced a high severity fire 301
had significantly higher burn severity than unburned areas. (Table 4) 302
Distance to edge was a significant predictor and had a positive relationship on burn 303
severity, reflecting that regardless of whether sites were previously burned, interior regions 304
of these large fires had higher burn severity than the perimeters. This applied to all four fires 305
we studied. 306
Time since past fire had mixed effects in the various models. On the Cascade fire 307
burn severity was lower the longer time since fire, and though significant it was not included 308
in the East Zone or Cascade models due to only small decreases in the best model AIC 309
values. However, in the cover type models when forest types were analyzed individually, 310
time since past fire proved to have a positive relationship on all three study areas (Table 4). 311
Fire weather, vegetation, and topography 312
Of the weather variables analyzed, the most important predictors of burn severity 313
Page 13 of 41
https://mc06.manuscriptcentral.com/cjfr-pubs
Canadian Journal of Forest Research

Draft
were maximum temperature and minimum RH on the Tripod, average temperature and 314
average RH on the Kootenay, and maximum temperature and maximum wind speed on the 315
East Zone and Cascade fires. Because temperature and relative humidity were highly and 316
inversely correlated, only maximum temperature, the stronger of the two predictors based on 317
lower AIC values, was included in the final model for the Tripod. Maximum temperature and 318
maximum wind speed were included in the final model for the East Zone and Cascade. Burn 319
severity was positively correlated with maximum temperature, but the relationship to 320
maximum wind gust was mixed on the different study areas. On the East Zone Complex 321
higher burn severity was correlated with higher maximum wind speeds, but a negative 322
correlation was observed with burn severity on the Cascade Complex. 323
Of the LANDFIRE variables, vegetation canopy cover and cover type were the most 324
important predictors of burn severity (Table 3). Forest canopy bulk density was also a 325
significant predictor. However, because of the high correlation between canopy cover and 326
canopy bulk density, only canopy cover was included in the final models. Valley bottom, 327
ridge top, and TPI metrics were significant predictors of burn severity. Valley bottom, which 328
was inversely correlated to ridge top, was included in final model for the Tripod, East Zone, 329
and Cascade study areas because it was a better predictor. Valley bottom was inversely 330
related to burn severity; valley bottoms burned less severely than ridges and steep slopes. TPI 331
was highly correlated with both of these metrics and was therefore excluded in the final 332
model on these three fires. On the Kootenay Fire, TPI was significant and the best predictor 333
but was excluded from the final model because it only minimally reduced the model AIC 334
value. 335
Elevation was a significant predictor of burn severity on the Tripod, East Zone, and 336
Kootenay fires. Burn severity was positively correlated with elevation on these three fires, 337
with increasing burn severity at higher elevations up to 2150 m on the Tripod, 2450 m on the 338
Page 14 of 41
https://mc06.manuscriptcentral.com/cjfr-pubs
Canadian Journal of Forest Research

Draft
Cascade, 2550 m on the East Zone, and 2075m on the Kootenay. Above these elevations, 339
burn severity decreased across the highest elevations of each fire area (Figure 5). 340
As slope and TWI were highly correlated, and slope was a slightly stronger predictor 341
than TWI for the Tripod and Cascade (Table 3). Slope was positively related to burn severity 342
on the Tripod and negatively related to burn severity in the Cascade and Kootenay. For East 343
Zone, TWI was the stronger predictor and was inversely related to burn severity. 344
Discussion 345
Within each study area, top-down drivers such as weather (high temperatures, high 346
windspeeds and low relative humidity) influenced fire effects as did bottom-up factors 347
including topography, vegetation type and past wildfire effects (Parisien et al. 2011; Birch et 348
al. 2015). Over the coming decades, the ecological footprint of heterogeneous burn severity 349
patterns will contribute to the mosaic of vegetation response and will likely influence future 350
landscape dynamics. 351
Evidence of self-regulation in past burns 352
The drivers of burn severity were remarkably similar across these four large and 353
different landscapes, each with different land uses and fire history legacy. As these large fires 354
burned across diverse topography and vegetation, burn severity generally was reduced by 355
previous wildfires (Figure 4). Surface fuels and tree density, critical to fire behavior, were 356
likely reduced on these previously burned areas (Stevens-Rumann and Morgan in press). 357
Lower fuel connectivity may have led to associated reductions in subsequent fire behavior 358
and effects (Alexander and Cruz 2012). While the reduction in fuel may be beneficial from a 359
fire suppression stand point, these changes in fuel may indicate large changes in vegetation 360
type (e.g. Stevens-Rumann and Morgan in press; Harvey et al. 2016) 361
Although lower burn severity was observed in previously burned areas on all four 362
study sites, the impact of prior burn severity varied by study site (Figure 4a and b). The 363
Page 15 of 41
https://mc06.manuscriptcentral.com/cjfr-pubs
Canadian Journal of Forest Research

Draft
results from Tripod and Kootenay directly contrasts with recent studies in which low to 364
moderate previous burn severity resulted in a reduction in subsequent burn severity but high 365
severity fires were often followed by high severity fires (Collins et al. 2009; Holden et al. 366
2010; Parks et al. 2014a; Harvey et al. 2016). Differences may be explained by slow 367
vegetation response in the Tripod and Kootenay compared to other study locations, such as 368
Yosemite National Park, where flammable shrub fields can regenerate rapidly following high 369
burn severity fire (Collins et al. 2009; van Wagtendonk et al. 2012). Another potential reason 370
for this difference may be that our study areas are outside of wilderness and experienced 371
different fire suppression actions and prior land uses. Fire suppression on the edge of the past 372
fires, including containment lines and burnout operations, may have effectively reduced fire 373
spread and/or decreasing subsequent burn severity, especially within older wildfires. We 374
could not account for this except with our distance to edge metric due to the lack of 375
geospatial data of fire suppression activities. 376
In forested cover types, burn severity increased as the time since fire increased on all 377
study fires, and this relationship was generally strongest in dry forest types (Table 4), as was 378
reported by others (Holden et al. 2010; Haire et al. 2013; Parks et al. 2014). In these 379
ecosystems with shorter fire return intervals, previously burned areas only act as barriers or 380
mitigate burn severity for short periods of time due to rapid accumulations of grasses, other 381
herbs, shrubs and fine wood (e.g. Peterson 2002; Parks et al. 2015). 382
Patches of stand-replacing fire or areas maintained by frequent surface fires create 383
fuel heterogeneity that may reduce subsequent fire spread or burn severity (Hessburg et al. 384
2015). The marked decrease in burn severity across most previously burned areas supports 385
this concept. In both high elevation, moist forests and low elevation, dry forests on the East 386
Zone, Tripod, and Kootenay Fires, high burn severity in an initial fire resulted in lower burn 387
severity in subsequent fires, with the exception of forested cover types on the Cascade. 388
Page 16 of 41
https://mc06.manuscriptcentral.com/cjfr-pubs
Canadian Journal of Forest Research

Draft
Although other variables were also important to our predictive models of burn severity, large 389
decreases in burn severity associated with previous severity indicates that these altered 390
landscapes are less likely to burn severely again within the first two decades following a fire 391
(Hudak et al. 2010; Prichard and Kennedy 2014; Harvey et al. 2016). 392
The capacity of past burn mosaics to self-regulate is not well understood given the 393
deficit of fire in many dry forest landscapes over the past century (Hessburg et al. 2007; 394
Marlon et al. 2012). Fire on fire interactions are still relatively uncommon across dry forest 395
landscapes but will become more prevalent in the coming decades as wildfires continue with 396
warmer, drier summers predicted for much of the western United States (Littell et al. 2009; 397
Cansler and McKenzie 2014). The amount of area reburned in our study landscapes was 398
small (roughly 3% of the total fire area), but proportion of areas reburned will likely increase 399
with climate change. Fire activity has already dramatically increased in the past decade, with 400
3.7 million ha burned nationally in 2015, 45% more than the previous 10-year average 401
(http://www.nifc.gov). 402
Because previous wildfires mitigated burn severity under extreme conditions, we 403
expect past wildfires to be particularly effective at shaping landscapes when subsequent fires 404
burn under less extreme fire weather (Pollet and Omi 2002). Past wildfires can alter burn 405
severity and even fire spread, acting as temporary fuel breaks (Teske et al. 2012; Haire et al. 406
2013; Parks et al. 2014, 2015), and a single fire may be sufficient to initiate self-regulation. 407
However, large stand-replacing wildfires also may result in a large, homogenous area of 408
similar fuels that, in the absence of subsequent finer-scale disturbances, could predispose 409
landscapes to subsequently large fire events that further homogenize landscapes (Peterson 410
2002). Smaller fires, in particular, may be critical to creating landscape patterns that would 411
be less conducive to burning in subsequent large, stand-replacing events (Hessburg et al. 412
2015) and prevent large vegetation type conversions (Harvey et al. 2016; Stevens-Rumann 413
Page 17 of 41
https://mc06.manuscriptcentral.com/cjfr-pubs
Canadian Journal of Forest Research

Draft
and Morgan in press). Currently, a common fire management strategy is to suppress all 414
wildfires. However, fires that burn under mild or average weather conditions may provide 415
critical heterogeneity in vegetation cover and structure that mitigates area burned and 416
patterns of burn severity in subsequent wildfires (Hessburg et al. 2015, Kemp et al. 2015). 417
Fire weather 418
In general, higher temperatures, lower relative humidity and in some cases stronger 419
winds were related to higher burn severity (Table 3). Our results suggest that on more 420
extreme weather days, fires burn more severely, fueled by reduced thresholds to burning and 421
the influence of wind on fire spread and intensity (Birch et al. 2015; Cansler and McKenzie 422
2014). The weather variables, broadly summarized from nearby weather stations, in the final 423
models suggests that nearby weather stations may be a decent proxy for finer-scale, fire-424
weather relationships (Prichard and Kennedy 2014). However, we found some inconsistent 425
relationships: on the East Zone fire burn severity increased with higher winds, while the 426
opposite relationship was observed on the Cascade. Fine-scale variability in weather patterns 427
were undetectable using coarse-scale data and may be the reason for this inconsistent 428
relationship (Taylor et al. 2004). Although progression maps allowed us to relate burn 429
severity at a pixel to the weather at the general time of burning, progression intervals varied 430
from < 24 hours to four days of burning, and the weather conditions at the time a given pixel 431
burned could be poorly represented by summarized weather over the progression interval. 432
Vegetation 433
Denser, closed-canopy forests burned at higher severity than open canopy forests, as 434
would be expected from past studies (Schoennagel et al. 2004). Severity was highest in the 435
high elevation forest types (Table 3 and 4). Multi-layered, conifer forests dominated by thin-436
barked trees burn with a higher proportion of high severity, stand-replacing fires and are 437
characterized by either mixed or high-severity fire regimes (Bigler et al. 2005; Prichard and 438
Page 18 of 41
https://mc06.manuscriptcentral.com/cjfr-pubs
Canadian Journal of Forest Research

Draft
Kennedy et al. 2014). In contrast, dry, low elevation forest types (i.e., dry-mesic mixed-439
conifer, ponderosa pine, Douglas-fir cover types) generally burned at lower burn severity on 440
the Tripod, Cascade, and East Zone fires. 441
Burn severity in grasslands and shrublands was more severe than dry-mesic mixed 442
conifer forests. Given the variation among and within these grouped vegetation types from 443
alpine meadows to low elevation grasslands/shrublands interpretation may be difficult and 444
skew relationships with burn severity. Additionally, burn severity is known to be difficult to 445
infer from satellite imagery one-year post-fire in many of these grass and shrub cover types 446
given the rapid vegetation recovery within one year (van Wagtendonk et al. 2012). 447
Topography 448
Across study sites, we found that burn severity was related to topographic variables 449
including slope gradient, elevation and TWI (Table 3). Across all sites, burn severity 450
increased as slope gradient increased, which is corroborated by other studies (e.g. Birch et al. 451
2015). Burn severity decreased as TWI increased, similar to other studies (Holden et al. 452
2009). These relationships may be related to changes in fire behavior across topographical 453
and moisture gradients. As wildfires spread up steep, drier slopes, fire intensity generally 454
increases, transition from surface to crown fire is more possible, and rate of spread and flame 455
lengths increase (Scott and Reinhardt 2001). Airflow in valley bottoms is also sometimes 456
restricted and may be related to generally lower burn severity in valley-like settings (Finney 457
and McAllister 2011). 458
The positive correlation between burn severity and elevation is likely a result of fuel 459
moisture gradients and differences in vegetation types. Low elevation areas of the Cascade, 460
East Zone and Tripod fires were dominated by relatively fire-resistant, thick-barked species 461
such as ponderosa pine and mature Douglas-fir. Conversely, mid- to high elevation areas 462
were dominated by higher density mixed conifer forests dominated by thin-barked species 463
Page 19 of 41
https://mc06.manuscriptcentral.com/cjfr-pubs
Canadian Journal of Forest Research

Draft
such as lodgepole pine and subalpine fir that are more readily killed by even low intensity 464
fires (Agee 1999). Across forested areas of the western US, as elevation increases so do fire 465
return intervals and the proportion of high burn severity when fires occur (Schoennagel et al 466
2004). 467
The highest elevations in our study areas generally had low burn severities that were 468
comparable to the burn severity of low elevation sites (Figure 5). Subalpine and alpine areas 469
often have higher fuel moisture, lower temperature, higher relative humidity, and less 470
burnable vegetation at or above tree line (Schoennagel et al. 2004). Reduced burn severity at 471
the highest elevations was especially demonstrated in the Kootenay and Tripod study areas. 472
On the Kootenay fire, burn severity declined above approximately 2100 m elevation. On the 473
Tripod Complex, post-burn imagery indicated that subalpine meadows did not burn; the 474
subsequent fires burned around subalpine meadows or only consumed tree islands within 475
them. 476
Conclusions 477
Our study provides strong evidence that the landscape patterns created by past 478
wildfires influenced subsequent wildfire burn severity, creating a landscape legacy of burn 479
mosaics. While many factors influence burn severity, previous wildfires reduced burn 480
severity on all four subsequent large fires. Considering the extreme fire weather under which 481
these fires burned, it is important to note that the bottom-up factors of past fires, vegetation, 482
and topography influenced burn severity. Our research supports the consideration of 483
managing wildfires to burn into previously burned landscapes as these may continue to 484
reduce burn severity under most fire weather conditions and allow fire to return to fire-prone 485
landscapes (Hessburg et al. 2015). 486
Because we studied wildfires in non-wilderness areas, the study areas provide some 487
insights into the influence of past wildfires during operational management of on-going, 488
Page 20 of 41
https://mc06.manuscriptcentral.com/cjfr-pubs
Canadian Journal of Forest Research

Draft
large wildfires. For example, during the 2003 Kootenay Fires, the 1968 Vermillion Fire was 489
effectively used in a burnout operation to halt the eastward spread of Kootenay Complex into 490
old-growth Engelmann spruce and subalpine fir forests of the Bow Valley and Banff 491
National Park (Rick Kubian, Parks Canada, personal communication). Fires in Idaho in 492
recent decades have been extensive, with over 46% of the Boise National Forest burned since 493
1984. In response, some incident management teams are making strategic decisions to take 494
advantage of where previous fires may limit the spread of subsequent fires (Bob Schindelar, 495
Boise National Forest, personal communication). Likewise, even during large fire spread 496
days, the 2006 Tripod Complex fire was corralled by several recent wildfires that occurred 497
from 1994-2003 and even the 1970 Forks fire which was composed of young, regenerating 498
lodgepole pine with sparse surface fuels (Gray and Prichard 2015). Following the 2006 499
Tripod fire, two subsequent wildfires, including the 2014 Carlton Complex and the 2015 500
Okanogan Complex, shared borders with the Tripod perimeter and these were the only parts 501
of the fire complexes that were not actively suppressed. Incident command communicated to 502
the public that there were insufficient fuels to carry active fire spread within the Tripod burn 503
area, and while the wildfires burned to the edge of the Tripod burn area, they did not advance 504
into the recently burned landscapes. 505
Previously burned areas are considered in both active fire management 506
(http://wfdss.usgs.gov/wfdss/WFDSS_Home.shtml last accessed 28 June 28, 2016) and in 507
achieving land management goals. Given the rising cost of fire suppression (Calkin et al. 508
2015), knowing when and where areas are expected to burn less severely can help to reduce 509
the costs of future large wildfire events while assisting land managers in making the fire 510
management decisions consistent with land management plans and restoration priorities 511
(Hessburg et al. 2015). Wildfires, even the large fire events studied here, possess some 512
attributes of self-regulation, and managing for the interaction of these events can contribute 513
Page 21 of 41
https://mc06.manuscriptcentral.com/cjfr-pubs
Canadian Journal of Forest Research

Draft
to restoring the resilience of fire-prone landscapes. Allowing more wildfires to burn, 514
especially in dry forest types, may not only serve land management by potentially mitigating 515
future burn severity, but also promote more fire resilient landscapes that can withstand the 516
impacts of repeated disturbances that will become ever more present with climate change. 517
518
Page 22 of 41
https://mc06.manuscriptcentral.com/cjfr-pubs
Canadian Journal of Forest Research
Draft
Acknowledgements 519
We thank A. Arnold, T. Zalesky, and J. Romain for assistance with field data 520
collection and the Okanogan-Wenatchee, Payette, and Boise National Forests and National 521
Parks Canada personnel, including M. Pillers and S. Kovach, for local information and data 522
layers. We thank B. Salter, K. Konis, and R.Gray for assistance with data acquisition, and C. 523
Hoffman, P. Hessburg, J. Hicke and anonymous reviewers for their helpful reviews. Funding 524
was provided by Joint Fire Science Program (Project # 14-1-02-33 and the USDA Forest 525
Service Rocky Mountain Research Station under agreements RJVA # 14-JV-11261987-047 526
and 12-JV-11221637-136, Modification #1. 527
528
Page 23 of 41
https://mc06.manuscriptcentral.com/cjfr-pubs
Canadian Journal of Forest Research

Draft
References 529
Agee, J. K. 1999. Fire effects on landscape fragmentation in interior west forests. In Forest 530
fragmentation: Wildlife and management implications. Edited by J. A. Rochelle, L. 531
A. Lehmann, and J. Wisniewski. Koninklijke Brill NV, Leiden, The Netherlands. 532
pp.323. 533
Akaike, H. 1974. A new look at the statistical model identification. IEEE Transactions on 534
Automatic Control 19:716–723. 535
Alexander, M.E. and Cruz, M.G. 2012. Interdependencies between flame length and fireline 536
intensity in predicting crown fire initiation and crown scorch height. Int. J. Wildland 537
Fire. 21: 95-113. 538
Bessie, W.C. and Johnson, E.A. 1995. The relative importance of fuels and weather on fire 539
behavior in subalpine forests. Ecology 76(3): 747-762. 540
Bigler, C., Kulakowski, D., and Veblen, T.T. 2005. Multiple disturbance interactions and 541
drought influence on fire severity in Rocky Mountain subalpine forests. Ecology 86: 542
3018–3029. 543
Birch, D.S., Morgan, P., Kolden, C.A., Abatzoglou, J.T., Dillon, G.K., Hudak, A.T., and 544
Smith, A.M.S. 2015. Vegetation, topography and daily weather influenced burn 545
severity in central Idaho and western Montana forests. Ecosphere 546
6:art17. http://dx.doi.org/10.1890/ES14-00213.1 547
Calkin, D.E., Thompson, M.P. and Finney, M.A. 2015. Negative consequences of positive 548
feedbacks in US wildfire management. Forest Ecosystems 2: 9. 549
Cansler, C.A., and McKenzie, D. 2014. Climate, fire size, and biophysical settings control 550
fire severity and spatial pattern in the northern Cascade Range, USA. Ecol. Appl. 24: 551
Page 24 of 41
https://mc06.manuscriptcentral.com/cjfr-pubs
Canadian Journal of Forest Research

Draft
1037-1056. 552
Collins, B.M., Miller, J.D., Thode, A.E., Kelly, M., van Wagtendonk, J.W., Stephens, S.L. 553
2009. Interactions among wildland fires in a long established Sierra Nevada natural 554
fire area. Ecosystems 12: 114–128. 555
Coop, J.D., Parks, S.A., McClernan, S.R., Holsinger, L.M. 2016. Influences of prior wildfires 556
on vegetation response to subsequent fire in a reburned southwestern landscape. Ecol. 557
Appl. 26: 346-354. 558
Day, D., White C.A., and Lopoukhine, N. 1990. Keeping the flame: fire management in the 559
Canadian Park Service. Ill: Proc. Interior West Fire Council Annual Meeting. 560
Kananaskis Village, Alberta. 561
Eidenshink, J., Schwind, B., Brewer, K., Zhu, Z., Quayle, B., Howard, S. 2007. A project for 562
monitoring trends in fire severity. Fire Ecology. 3: 3–21. 563
ESRI. 2011. ArcGIS Help 10.0, Hillshade and Slope (Spatial Analyst). 564
Evans, J. 2003. Compound topographic index script. http://arcscripts.esri.com. 565
Filmon, G. 2003. Firestorm 2003 Provincial review. Last accessed 24 September, 2015 566
http://bcwildfire.ca/History/ReportsandReviews/2003/FirestormReport.pdf. 567
Finney, M.A. and McAllister, S.S. 2011. A review of fire interactions and mass fires. Journal 568
of Combustion 2011:548328. 569
Gedalof, Z.M., Peterson, D.L., Mantua, N.J. 2005. Atmospheric, climatic, and ecological 570
controls on extreme wildfire years in the northwestern United States. Ecol. Appl. 15: 571
154–174. 572
Gray, R.W., and Prichard, S.J. 2015. A tale of two fires: The relative effectiveness of past 573
wildfires in mitigating wildfire behavior and effects. USDA, Forest Service, Rocky 574
Page 25 of 41
https://mc06.manuscriptcentral.com/cjfr-pubs
Canadian Journal of Forest Research

Draft
Mountain Research Station, Proc. RMRS-P-73, Fort Collins, CO. 575
Haire, S.L., McGarigal, K., and Miller, C. 2013. Wilderness shapes contemporary fire size 576
distributions across landscapes of the western United States. Ecosphere 4(1): 15 577
http://dx.doi.org/10.1890/ES12-00257.1. 578
Harvey, B. J., D. C. Donato, and M. G. Turner. 2016. Burn me twice, shame on who? 579
Interactions between successive forest fires across a temperate mountain region. 580
Ecology: in press. 581
Hessburg, P.F., Salter, R.B., James, K.M. 2007. Re-examining fire severity relations in pre-582
management era mixed-conifer inferences from landscape patterns of forest structure. 583
Landscape Ecol. 22: 5-24. 584
Hessburg, P.F., Churchill, D.J., Larson, A.J., Haugo, R.D., Miller, C., Spies, T.A., North, 585
M.P., Povak, N.A., Belote, T., Singleton, P.H., Gaines, W.L., Keane, R.E., Aplet, 586
G.H., Stephens, S.L., Morgan, P., Bisson, P.A., Rieman, E., Salter, R.B., Reeves, 587
G.H. 2015. Restoring fire-prone Inland Pacific landscapes: seven core principles. 588
Landscape Ecol. 30: 1805-1835. 589
Holden, Z.A., Morgan, P., and Evans, J.S. 2009. A predictive model of burn severity based 590
on 20-year satellite-inferred burn severity data in a large southwestern US wilderness 591
area. Forest. Ecol. Mang. 258: 2399-2406. 592
Holden, Z.A., Morgan, P., Hudak, A.T. 2010. Fire severity of areas reburned by wildfires in 593
the Gila National Forest, New Mexico, USA. Fire Ecology 6: 77–85. 594
Howard, S.M., and Lacasse, J.M. 2004. An evaluation of gap-filled Landsat SLC-Off 595
imagery for wildfire burn severity mapping. Photogramm. Eng. Rem. S. 70: 877-880. 596
Hudak, A.T., Rickert, I., Morgan, P., Strand, E., Lewis, S.A., Robichaud, P.R., Hoffman, C., 597
Page 26 of 41
https://mc06.manuscriptcentral.com/cjfr-pubs
Canadian Journal of Forest Research
Draft
and Holden, Z.A. 2011. Review of fuel treatment effectiveness in forests and 598
rangelands and a case study from the 2007 megafires in central Idaho, USDA, Forest 599
Service Rocky Mountain Research Station, Gen. Tech. Rep. RMRS-GTR-252 Fort 600
Collins, CO. 601
Jolly, W.M., Cochrane, M.A., Freeborn, P.H., Holden, Z.A., Brown, T.J., Williamson, G.J., 602
and Bowman, D.M. 2015. Climate-induced variations in global wildfire danger from 603
1979 to 2013. Nature Comm. 6. 604
Kissling, W., and Carl, G. 2008. Spatial autocorrelation and the selection of simultaneous 605
autoregressive models. Global Ecol. Biogeogr. 17: 59–71. 606
Lentile, L.B., Morgan, P., Hudak, A.T., Bobbitt, M.J., Lewis, S.A., Smith, A.M.S., and 607
Robichaud, P.R. 2007. Post-fire burn severity and vegetation response following eight 608
large wildfires across the western United States. Fire Ecology. 3(1): 91-101. 609
Littell, J.S., McKenzie, D., Peterson, D.L., and Westerling, A.L. 2009. Climate and wildfire 610
area burned in western U.S. ecoprovinces, 1916–2003. Ecol. Appl. 19: 1003–1021. 611
Marlon, J.R., Bartlein, P.J., Gavin, D.G., Long, C.J., Anderson, R.S., Briles, C.E., Brown, 612
K.J., Colombaroli, D., Hallett, D.J., Power, M.J., Scharf, E.A., and Walsh, M.K. 613
2012. Long-term perspective on wildfires in the western USA. P. Natl. Acad. Sci. 614
USA. 109 (9): E535-E543. 615
Miller, J.D., Knapp, E.E., Key, C.H., Skinner, C.N., Isbell, C.J., Creasy, R.M., and Sherlock, 616
J.W. 2009. Calibration and validation of the relative differenced Normalized Burn 617
Ratio (RdNBR) to three measures of fire severity in the Sierra Nevada and Klamath 618
Mountains, California, USA. Remote Sens. Environ. 113: 645–656. 619
Miller, J.D., and Thode, A.E. 2007. Quantifying fire severity in a heterogeneous landscape 620
Page 27 of 41
https://mc06.manuscriptcentral.com/cjfr-pubs
Canadian Journal of Forest Research
Draft
with a relative version of the delta Normalized Burn Ratio (dNBR). Remote Sens. 621
Environ. 109: 66–80. 622
Parisien, M.A., Parks, S.A., Miller, C., Krawchuck, M.A., Heathcott, M., and Moritz, M. 623
2011. Contributions of ignitions, fuels, and weather to the spatial patterns of burn 624
probability of a boreal landscape. Ecosystems. 14: 1141-1155. 625
Parks, S.A., Holsinger, L.M., Miller, C., and Nelson, C.R. 2015. Wildland fire as a self-626
regulating mechanism: the role of previous burns and weather in limiting fire 627
progression. Ecol. Appl. 25(6): 1478-1492. 628
Parks, S.A., Miller, C., Nelson, C.R., and Holden, Z.A. 2014. Previous fires moderate fire 629
severity of subsequent wildland fires in two large western US wilderness areas. 630
Ecosystems 17: 29-42. 631
Peterson, G.D. 2002. Contagious disturbances, ecological memory, and the emergence of 632
landscape pattern. Ecosystems 5: 329-338. 633
Pollet, J., and Omi, P.N. 2002. Effect of thinning and prescribed burning on crown fire 634
severity in ponderosa pine forests. Int. J. Wildland Fire 11: 1-10. 635
Prichard, S.J., and Kennedy, M.C. 2014. Fuel treatments and landform modify landscape 636
patterns of burn severity in an extreme fire event. Ecol. Appl. 24(3):571-590. 637
R Development Core Team. 2011. R: a language and environment for statistical computing. 638
R Foundation for Statistical Computing, Vienna, Austria. www.r-project.org. 639
Ryan, K.C., and Opperman, T.S. 2013. LANDFIRE-A national vegetation/fuels data base for 640
use in fuels treatment, restoration, and suppression planning. Forest. Ecol. Mang. 294: 641
208-216. 642
Schellhaas, R., Spurbeck, D., Ohlson, P., Keenum, D. and Riesterer, H. 2001. Fire 643
Page 28 of 41
https://mc06.manuscriptcentral.com/cjfr-pubs
Canadian Journal of Forest Research

Draft
disturbance effects in subalpine forests of north central Washington. Internal Report. 644
USDA Forest Service Region 6 Report. pp. 32. 645
Schoennagel, T., Veblen, T.T., and Romme, W.H. 2004. The interaction of fire, fuels, and 646
climate across Rocky Mountain forests. BioScience 54:661–676. 647
Scott, J.H., and Reinhardt, E.D. 2001. Assessing crown fire potential by linking models of 648
surface and crown fire behavior. USDA, Forest Service, Rocky Mountain Research 649
Station Research Paper RMRS-RP-29, Fort Collins, CO. 650
Stevens-Rumann, C.S., and Morgan, P. In press. Wildfire as a tool: ecosystem impact of 651
repeated wildfires. Ecol. Appl. 652
Taylor, S.W., Wotton, B.M., Alexander, M.E., and Dairymple, G.N. 2004. Variation in wind 653
and crown fire behaviors in a northern jack pine black spruce forest. Can. J. Forest. 654
Res. 34(8):1561-1576. 655
Teske, C.C., Seielstad, C.A., and Queen, L.P. 2012. Characterizing fire-on-fire interactions in 656
three wilderness areas. Fire Ecol. 8: 82-106. 657
Van Wagtendonk, J.W., Van Wagtendonk, K.A., and Thode, A.E. 2012. Factors associated 658
with the severity of intersecting fires in Yosemite National Park, California, USA. 659
Fire Ecol. 8: 11–31. 660
Weiss, A. 2001. Topographic position and landform analysis. ESRI Users Conference. San 661
Diego, California, USA 662
Wimberly, M.C., Cochrane, M.A., Baer, A.D., and Pabst, K. 2009. Assessing fuel treatment 663
effectiveness using satellite imagery and spatial statistics. Ecol. Appl. 19: 1377–1384. 664
665
Page 29 of 41
https://mc06.manuscriptcentral.com/cjfr-pubs
Canadian Journal of Forest Research

Draft
TABLES 1
Table 1. Candidate predictor variables for sequential autoregression (SAR) modeling for the 2
four study areas (Tripod, Cascade, East Zone, and Kootenay*). 3
Variable Definition
Wildfire data
PastSev-Past burn severity
Categorical RdNBR (unburned/unchanged, low,
moderate, high)
Edge-Distance to edge (m) Distance from study fire perimeter
TSF-Time since previous fire Number of years since each pixel burned
Fire weather
MaxTemp-Maximum temperature
(°C)
Maximum temperature over progression interval
AvgTemp-Average temperature
(°C)
Average temperature over progression interval
MaxGust-Maximum wind speed
(kph)
Maximum recorded wind over progression interval
AvgGust-Average wind speed
(kph)
Average wind speed over progression interval
MinRH-Minimum RH (%) Minimum relative humidity over progression interval
Vegetation
CBD-Canopy bulk density (kg
m3)
Bulk density of available canopy fuel
CovType-Cover Type Derived from existing vegetation type
CC-Canopy Cover (%) Canopy cover of vegetation
Topography
Elev-Elevation (m)
National elevation dataset
Slope (degrees) Slope gradient
Solar radiation (WH m-2) Potential incoming solar radiation (no cloud cover)
TWI- Topographic wetness Topographic Wetness Index
TPI-Topographic position index Discrete classified TPI raster
Valley Fuzzy valley bottom or ‘valley-like’ position
Ridgetop Fuzzy ridgetop or ‘ridge-like’ position
4
* Due to the fairly uniform vegetation types and stand structures on the Kootenay we did not 5
include vegetation characteristics for this model. 6
7
Page 30 of 41
https://mc06.manuscriptcentral.com/cjfr-pubs
Canadian Journal of Forest Research

Draft
Table 2. Final sequential autoregression full models of relative differenced Normalized Burn
Ratio (RdNBR) for the Tripod, Cascade, East Zone, and differenced Normalized Burn Ratio
(dNBR) for the Kootenay study areas. N is the number of points analyzed.
Model Predictor variables N R2
AIC
Tripod CC, CovType, Edge, Elev,
MaxTemp, PastSev, Slope, Valley
326,541 0.92 4,884,497
East Zone CovType, Edge, Elev, MaxGust,
MaxTemp, PastSev, TWI, Valley
905,805 0.73 12,705,742
Cascade CC, CovType, Edge, MaxGust,
MaxTemp, PastSev, Slope, TSF,
Valley
975,414 0.77
13,736,440
Kootenay AvgTemp, Edge, Elev, Slope,
PastSev
88,272 0.90 1,080,976
Page 31 of 41
https://mc06.manuscriptcentral.com/cjfr-pubs
Canadian Journal of Forest Research

Draft
Table 3. Outputs for final SAR model for each variable. Past burn severity (PastSev) was categorized into unburned/unchanged (as
the baseline), low, moderate, and high according to thresholds in Miller and Thode (2007). Cover type (CovType) was categorized
into dry-mesic mixed conifer (DMC; as the baseline), douglas-fir/hemlock (DFHE), grassland/shrubland (GRASS/SHRUB),
lodgepole pine dominated (LP), ponderosa pine dominated (PP), riparian areas (RIP), and subalpine fir dominate (SUBALP).
Relationship to burn severity is distinguished by the “estimate,” with the standard error (SE) and p-value (P), indicated for each
variable.
Tripod East Zone Cascade Kootenay
Variables Estimate SE P Estimate SE P Estimate SE P Estimate SE P
Intercept -428.00 29.40 <0.0001 -71.43 7.37 <0.0001 704.00 31.60 <0.0001 129.60 36.78 0.0004
Edge 0.13 0.01 <0.0001 0.03 0.01 <0.0001 0.04 0.01 <0.0001 0.18 0.008 <0.0001
Valley -0.12 0.02 <0.0001 -0.52 0.02 <0.0001 -0.67 0.25 <0.0001 - - -
MaxTemp 1.57 0.09 <0.0001 3.42 0.13 <0.0001 7.30 0.20 <0.0001 - - -
AvgTemp - - - - - - - - - 8.23 0.79 <0.0001
Past Sev – Low -16.60 2.12 <0.0001 -16.85 1.29 <0.0001 -284.00 27.50 <0.0001 0.42 7.84 0.96
Past Sev – Moderate -28.90 2.71 <0.0001 -17.00 1.76 <0.0001 -266.00 27.40 <0.0001 -19.68 8.83 0.03
Past Sev – High -42.10 3.18 <0.0001 -25.50 2.40 <0.0001 -246.00 27.50 <0.0001 -54.16 13.58 <0.0001
Slope 1.38 0.13 <0.0001 - - - -0.48 0.11 <0.0001 -0.18 0.04 0.03
TWI - - - -5.15 0.18 <0.0001 - - - - - -
CovType DFHE 4.44 8.16 0.59 7.08 1.45 <0.0001 0.34 2.69 0.90 - - -
CovType GRASS/SHRUB 3.48 1.42 0.014 13.90 1.74 <0.0001 8.10 2.91 0.005 - - -
CovType LP 2.45 0.91 0.0070 7.72 1.86 <0.0001 8.84 2.84 0.002 - - -
Page 32 of 41
https://mc06.manuscriptcentral.com/cjfr-pubs
Canadian Journal of Forest Research

Draft
CovType PP -6.01 2.81 0.033 3.09 2.08 0.13 -2.41 4.40 0.58 - - -
CovType RIP -44.60 3.02 <0.0001 -1.58 2.85 0.58 -8.36 3.53 0.02 - - -
CovType SUBALP 2.93 0.89 0.0010 10.20 1.66 <0.0001 10.90 2.79 <0.0001 - - -
Elev 0.47 0.02 <0.0001 0.31 0.01 <0.0001 - - - 0.094 0.019 <0.0001
CC 0.70 0.03 <0.0001 - - - 6.44 0.027 <0.0001 - - -
MaxGust - - - 1.26 0.23 <0.0001 -3.55 0.20 <0.0001 - - -
TSF - - - - - - -3.30 0.31 <0.0001 - - -
Page 33 of 41
https://mc06.manuscriptcentral.com/cjfr-pubs
Canadian Journal of Forest Research

Draft
Page 34 of 41
https://mc06.manuscriptcentral.com/cjfr-pubs
Canadian Journal of Forest Research

Draft
Table 4. Results of cover type SAR analysis, performed on points identified as a “low elevation
forest type” (Douglas-fir/hemlock, ponderosa pine, dry-mesic mixed-conifer) and a “high
elevation forest type” (lodgepole pine, subalpine fir). Values are the regression estimate of time
since fire and past burn severity (low moderate, high) in comparison to previously
unburned/unchanged points. Asterisks indicate significance at α=0.05 level.
Area Elevation
(Forest
type)
time since
fire
Past severity-
low
Past
severity-
moderate
Past severity-
high
Cascade High 0.09* -15.88* -1.71 22.01*
low 0.23* -29.20* -14.91* 17.08*
East Zone high 0.63* -49.92* -64.01* -71.58*
low 0.41* -36.30* -37.07* -29.61*
Tripod high 1.30* -100.08* -188.58* -281.46*
low 5.28* -378.03* -465.61* -520.36*
Page 35 of 41
https://mc06.manuscriptcentral.com/cjfr-pubs
Canadian Journal of Forest Research

Draft
British Columbia
Alberta
Idaho
Washington
Oregon
Montana
±0 30 60 90 12015
Kilometers
Tripod Complex
Cascade Complex
East Zone Complex
Kootenay Fire
Page 36 of 41
https://mc06.manuscriptcentral.com/cjfr-pubs
Canadian Journal of Forest Research
Draft
Figure 2. (a) Tripod Complex, (b) Kootenay Fire, (c) East Zone Complex and Cascade Complex with perimeters of previous wildfire. Older past fires are indicated with greens, while more recent fires are
indicated in orange and yellows.
287x274mm (150 x 150 DPI)
Page 37 of 41
https://mc06.manuscriptcentral.com/cjfr-pubs
Canadian Journal of Forest Research

Draft
Figure 3. Distribution of topographic (solar radiation and topographic wetness index) and vegetation (canopy cover) variables using our East Zone dataset which excluded the scan lines compared to a dataset of the
pixels within the scan lines which we were unable to use due to lack of burn severity information. Distributions are very similar for both, reducing the possibility of bias with the missing data.
304x139mm (150 x 150 DPI)
Page 38 of 41
https://mc06.manuscriptcentral.com/cjfr-pubs
Canadian Journal of Forest Research

Draft
Figure 4. RdNBR or dNBR response by past fire burn severity on each fire. The left axis is a continuous RdNBR/dNBR metric, while the right axis identifies the burn severity thresholds we used based on Miller and Thode (2007) of unchanged/unburned, low, moderate, and high severity. (a) is the RdNBR response to burn
severity on the Tripod (black), East Zone (light gray), and Cascade (dark gray) Fires across all cover types. (b) is the dNBR response to past burn severity on the Kootenay Fire. (c) is the RdNBR response to past burn severity in “high elevation” forest types. (d) is the RdNBR response to past burn severity in “low elevation”
forest types.
225x150mm (150 x 150 DPI)
Page 39 of 41
https://mc06.manuscriptcentral.com/cjfr-pubs
Canadian Journal of Forest Research

Draft
Figure 5. Box and whisker plots of RdNBR and dNBR response by elevation. Tripod is in the top left, East Zone in the top right, Cascade on the bottom left, and Kootenay in the bottom right.
282x277mm (150 x 150 DPI)
Page 40 of 41
https://mc06.manuscriptcentral.com/cjfr-pubs
Canadian Journal of Forest Research

Draft
Supplemental Figure 1: Example of scan line errors in the Landsat satellite data on the East Zone Complex Fire. White lines indicate missing data; lines are 150 m wide.
187x190mm (150 x 150 DPI)
Page 41 of 41
https://mc06.manuscriptcentral.com/cjfr-pubs
Canadian Journal of Forest Research