Embed Size (px)
Citation preview

NIST NCSTAR 1-5C
i
Federal Building and Fire Safety Investigation of the World Trade Center Disaster
Fire Tests of Single Office Workstations
Thomas J. Ohlemiller George W. Mulholland Alexander Maranghides James J. Filliben Richard G. Gann


NIST NCSTAR 1-5C
i
Federal Building and Fire Safety Investigation of the World Trade Center Disaster
Fire Tests of Single Office Workstations
Thomas J. Ohlemiller George W. Mulholland Alexander Maranghides Building and Fire Research Laboratory National Institute of Standards and Technology James J. Filliben Information Technology Laboratory National Institute of Standards and Technology Richard G. Gann Building and Fire Research Laboratory National Institute of Standards and Technology September 2005
U.S. Department of Commerce Carlos M. Gutierrez, Secretary Technology Administration Michelle O’Neill, Acting Under Secretary for Technology National Institute of Standards and Technology William Jeffrey, Director
Disclaimer No. 1
Certain commercial entities, equipment, products, or materials are identified in this document in order to describe a procedure or concept adequately or to trace the history of the procedures and practices used. Such identification is not intended to imply recommendation, endorsement, or implication that the entities, products, materials, or equipment are necessarily the best available for the purpose. Nor does such identification imply a finding of fault or negligence by the National Institute of Standards and Technology.
Disclaimer No. 2
The policy of NIST is to use the International System of Units (metric units) in all publications. In this document, however, units are presented in metric units or the inch-pound system, whichever is prevalent in the discipline.
Disclaimer No. 3
Pursuant to section 7 of the National Construction Safety Team Act, the NIST Director has determined that certain evidence received by NIST in the course of this Investigation is “voluntarily provided safety-related information” that is “not directly related to the building failure being investigated” and that “disclosure of that information would inhibit the voluntary provision of that type of information” (15 USC 7306c).
In addition, a substantial portion of the evidence collected by NIST in the course of the Investigation has been provided to NIST under nondisclosure agreements.
Disclaimer No. 4
NIST takes no position as to whether the design or construction of a WTC building was compliant with any code since, due to the destruction of the WTC buildings, NIST could not verify the actual (or as-built) construction, the properties and condition of the materials used, or changes to the original construction made over the life of the buildings. In addition, NIST could not verify the interpretations of codes used by applicable authorities in determining compliance when implementing building codes. Where an Investigation report states whether a system was designed or installed as required by a code provision, NIST has documentary or anecdotal evidence indicating whether the requirement was met, or NIST has independently conducted tests or analyses indicating whether the requirement was met.
Use in Legal Proceedings
No part of any report resulting from a NIST investigation into a structural failure or from an investigation under the National Construction Safety Team Act may be used in any suit or action for damages arising out of any matter mentioned in such report (15 USC 281a; as amended by P.L. 107-231).
National Institute of Standards and Technology National Construction Safety Team Act Report 1-5C Natl. Inst. Stand. Technol. Natl. Constr. Sfty. Tm. Act Rpt. 1-5C, 130 pages (September 2005) CODEN: NSPUE2
U.S. GOVERNMENT PRINTING OFFICE WASHINGTON: 2005 _________________________________________ For sale by the Superintendent of Documents, U.S. Government Printing Office Internet: bookstore.gpo.gov — Phone: (202) 512-1800 — Fax: (202) 512-2250 Mail: Stop SSOP, Washington, DC 20402-0001
NIST NCSTAR 1-5C, WTC Investigation iii
ABSTRACT
Reconstruction of the fires that occurred in the World Trade Center (WTC) 1, 2, and 7 on September 11, 2001, relied heavily on computer simulations because examination of the post-fire premises was not possible and the information from eyewitness accounts was severely limited in nature. These simulations were performed using the National Institute of Standards and Technology (NIST) Fire Dynamics Simulator (FDS). This report describes a series of six fire tests of single workstations (i.e., office cubicles), the dominant combustibles in the WTC buildings. The purpose was to understand how the office workstations may have burned and to provide data for improvements in the FDS combustion algorithm and its inputs needed to approximate the burning of combustibles as complex as those that comprise an office workstation. The variables in the tests were the type of workstation, the presence of jet fuel on combustible surfaces, and the presence of inert material covering part of the combustible surfaces. The outcome was a pragmatic, empirical approach to modeling the burning behavior that led to satisfactory replication of the heat release rate from the workstations and the dependence of that rate on the test variables.
Keywords: Fire, Fire Dynamics Simulator, fire modeling, full-scale fire tests, workstations, World Trade Center.

Abstract
iv NIST NCSTAR 1-5C, WTC Investigation
This page intentionally left blank.

NIST NCSTAR 1-5C, WTC Investigation v
TABLE OF CONTENTS
Abstract ........................................................................................................................................................ iii List of Figures .............................................................................................................................................vii List of Tables ............................................................................................................................................... ix List of Acronyms and Abbreviations ........................................................................................................... xi Metric Conversion Table ...........................................................................................................................xiii Preface ......................................................................................................................................................xvii Acknowledgments...................................................................................................................................xxvii Executive Summary ................................................................................................................................. xxix
Chapter 1 Introduction ................................................................................................................................. 1
1.1 Context of Tests ............................................................................................................................... 1 1.2 References........................................................................................................................................ 2
Chapter 2 Description of Experiments ....................................................................................................... 3
2.1 Workstations .................................................................................................................................... 3 2.1.1 Generic Workstations ........................................................................................................... 3 2.1.2 WTC Workstation ................................................................................................................ 7
2.2 Test Assembly.................................................................................................................................. 9 2.3 Instrumentation ................................................................................................................................ 9 2.4 Test Parameters.............................................................................................................................. 12 2.5 Ignition Scenario............................................................................................................................ 13 2.6 Experimental Design...................................................................................................................... 13 2.7 Test Procedure ............................................................................................................................... 14 2.8 References...................................................................................................................................... 15
Chapter 3 Test Results and Interpretation ............................................................................................... 17
3.1 Data Reduction .............................................................................................................................. 17 3.1.1 Burning Time and Ignition Time........................................................................................ 17 3.1.2 Heat Release Rate............................................................................................................... 27 3.1.3 Net Heat Release Rate ........................................................................................................ 28 3.1.4 Net Heat Released .............................................................................................................. 31

Table of Contents
vi NIST NCSTAR 1-5C, WTC Investigation
3.1.5 Mass Loss and Mass Loss Rate .......................................................................................... 31 3.1.6 Effective Heat of Combustion ............................................................................................ 39
3.2 Fire Growth Behavior .................................................................................................................... 39 3.2.1 Role of the Ignition Burner................................................................................................. 40 3.2.2 Growth to the HRR Peak without Jet Fuel Present............................................................. 40 3.2.3 Effect of Jet Fuel on the Growth to the HRR Peak ............................................................ 42 3.2.4 Post-Peak Behavior ............................................................................................................ 43
3.3 Peak HRR Values and Times to Peak Values................................................................................ 44 3.4 Significance of Test Variables ....................................................................................................... 47
3.4.1 Effects of Surface Coverage and Jet Fuel........................................................................... 47 3.4.2 Sensitivity to Loading of Jet Fuel....................................................................................... 49 3.4.3 Sensitivity to Fractional Coverage of Surfaces by Inert Material ...................................... 50 3.4.4 Sensitivity to Mass of Paper Products ................................................................................ 51 3.4.5 Sensitivity to Workstation Type......................................................................................... 51
3.5 Uncertainty Analysis...................................................................................................................... 52 3.5.1 Total Heat Release Rate ..................................................................................................... 52 3.5.2 Net Heat Release Rate ........................................................................................................ 55 3.5.3 Net Heat Released .............................................................................................................. 55 3.5.4 Total Mass Loss.................................................................................................................. 55 3.5.5 Peak Mass Loss Rate .......................................................................................................... 56 3.5.6 Effective Heat of Combustion ............................................................................................ 56 3.5.7 Time to Peak Heat Release Rate and Peak Mass Loss Rate............................................... 56 3.5.8 Burning Time and Ignition Time........................................................................................ 57
3.6 References...................................................................................................................................... 58
Chapter 4 Simulations of Workstation Fire Tests ................................................................................... 61
4.1 Fire Dynamics Simulator Combustion Modeling .......................................................................... 61 4.2 FDS Simulations ............................................................................................................................ 62 4.3 Number of Workstations Burning.................................................................................................. 65 4.4 References...................................................................................................................................... 66
Chapter 5 Summary of Results ................................................................................................................. 69
Appendix A Determination of Flammability Properties of Office Workstation Materials........................ 71

NIST NCSTAR 1-5C, WTC Investigation vii
LIST OF FIGURES
Figure P–1. The eight projects in the federal building and fire safety investigation of the WTC disaster............................................................................................................................... xix
Figure 2–1. View of the north and east sides of the generic work station. .............................................. 3 Figure 2–2. View from above of the west side of the generic workstation. The horizontal
insulated pipe above the west wall is the feed line to the four nozzles of the spray igniter.................................................................................................................................... 4
Figure 2–3. Location of video cameras.................................................................................................. 11 Figure 2–4. View from the south of the generic work station with calcium silicate “tiles” in
place on exposed, upward facing surfaces (floor, desk, chair seat).................................... 12
Figure 3–1a. Complete heat release rate curve, Test 1, one half of generic workstation, no Jet A, no tiles. ............................................................................................................................... 18
Figure 3–1b. Annotated partial heat release rate curve, Test 1, one half of generic workstation, no Jet A, no tiles. ..................................................................................................................... 18
Figure 3–2a. Complete HRR curve, Test 2, complete generic workstation, no Jet A, no tiles............... 19 Figure 3–2b. Annotated partial HRR curve, Test 2, complete generic workstation, no Jet A, no
tiles. .................................................................................................................................... 19 Figure 3–3a. Complete HRR curve, Test 3, generic workstation, no Jet A, 30 percent tile
coverage on exposed, upward-facing surfaces. .................................................................. 20 Figure 3–3b. Annotated partial HRR curve, Test 3, complete generic workstation, no Jet A, 30
percent tile coverage on exposed, upward-facing surfaces. ............................................... 20 Figure 3–4a. Complete HRR curve, Test 5, generic workstation, 4 L Jet A, no tiles.............................. 21 Figure 3–4b. Annotated partial HRR curve, Test 5, complete generic workstation, 4 L Jet A, no
tiles. .................................................................................................................................... 21 Figure 3–5a. Complete HRR curve, Test 6, generic workstation, 4 L Jet A, 30 percent tile
coverage on exposed, upward facing surfaces.................................................................... 22 Figure 3–5b. Annotated partial HRR curve, Test 6, complete generic workstation, 4 L Jet A, 30
percent tile coverage on exposed, upward facing surfaces................................................. 22 Figure 3–6a. Complete HRR curve, Test 4, WTC workstation, no Jet A, no tiles. ................................. 23 Figure 3–6b. Annotated partial HRR curve, Test 4, WTC workstation, no Jet A, no tiles...................... 23 Figure 3–7a. 2 MW igniter flame at time zero. ....................................................................................... 24 Figure 3–7b. First ignited object within cubicle, paper stack on desk, at approximately 60 s after
start of 2 MW igniter flame. ............................................................................................... 24 Figure 3–7c. Top of chair back ignited at about 165 s; computer already burning. ................................ 25

List of Figures
viii NIST NCSTAR 1-5C, WTC Investigation
Figure 3–7d. Collapsing chair fire near its peak at 512 s......................................................................... 25 Figure 3–7e. Work station fire near peak HRR at 533 s.......................................................................... 26 Figure 3–7f. Fire well past peak, with rear desk surfaces collapsed, at 965 s......................................... 26 Figure 3–8. Effect of workstation on net heat release rate; Test 1 (half generic workstation),
Test 2 (full generic workstation), Test 4 (WTC workstation). ........................................... 29 Figure 3–9. Effect of jet fuel and inert tiles on net heat release rate from a generic workstation;
Test 2 (no tiles, no jet fuel), Test 3 (tiles, no jet fuel), Test 5 (no tiles, jet fuel), Test 6 (tiles, jet fuel)................................................................................................................... 30
Figure 3–10. Effect of workstation on mass loss; Test 1 (half generic workstation), Test 2 (full generic workstation), Test 4 (WTC workstation). .............................................................. 32
Figure 3–11. Effect of jet fuel and inert tiles on mass loss; Test 2 (no tiles, no jet fuel), Test 3 (tiles, no jet fuel), Test 5 (no tiles, jet fuel), Test 6 (tiles, jet fuel). .............................................. 33
Figure 3–12. Effect of workstation fraction on net heat release and MLRs; Test 1 (half generic workstation, Test 2 (full generic workstation).................................................................... 34
Figure 3–13. Effect of inert tiles on net heat release and MLRs; Test 2 (no tiles, no jet fuel), Test 3 (tiles, no jet fuel).............................................................................................................. 35
Figure 3–14. Effect of workstation style on net heat release and MLRs; Test 2 (generic workstation), Test 4 (WTC workstation)............................................................................ 36
Figure 3–15. Effect of jet fuel on net heat release and MLRs; Test 2 (no tiles, no jet fuel), Test 5 (no tiles, jet fuel)................................................................................................................. 37
Figure 3–16. Effect of both jet fuel and inert tiles on net heat release and mass loss rates; Test 2 (no tiles, no jet fuel), Test 6 (tiles, jet fuel). ....................................................................... 38
Figure 3–17. Heat of combustion vs. time for Test 2 (no jet A, no tiles). ............................................... 39 Figure 3–18. A comparison of five measures of fire intensity................................................................. 46 Figure 3–19. Interaction of test variables in determining peak HRR. ..................................................... 48
Figure 4–1. Comparison of measured and computed HRR in Test 2 (generic workstation, no tiles, no Jet A)..................................................................................................................... 63
Figure 4–2. Comparison of measured and computed HRR in Test 3 (generic workstation, with tiles, no Jet A)..................................................................................................................... 64
Figure 4–3. Comparison of measured and computed HRR in Test 5 (generic workstation, no tiles, with Jet A).................................................................................................................. 64
Figure 4–4. Comparison of measured and computed HRR in Test 6 (generic workstation, with tiles, with Jet A).................................................................................................................. 65
NIST NCSTAR 1-5C, WTC Investigation ix
LIST OF TABLES
Table P–1. Federal building and fire safety investigation of the WTC disaster..................................xviii Table P–2. Public meetings and briefings of the WTC Investigation. ..................................................xxi
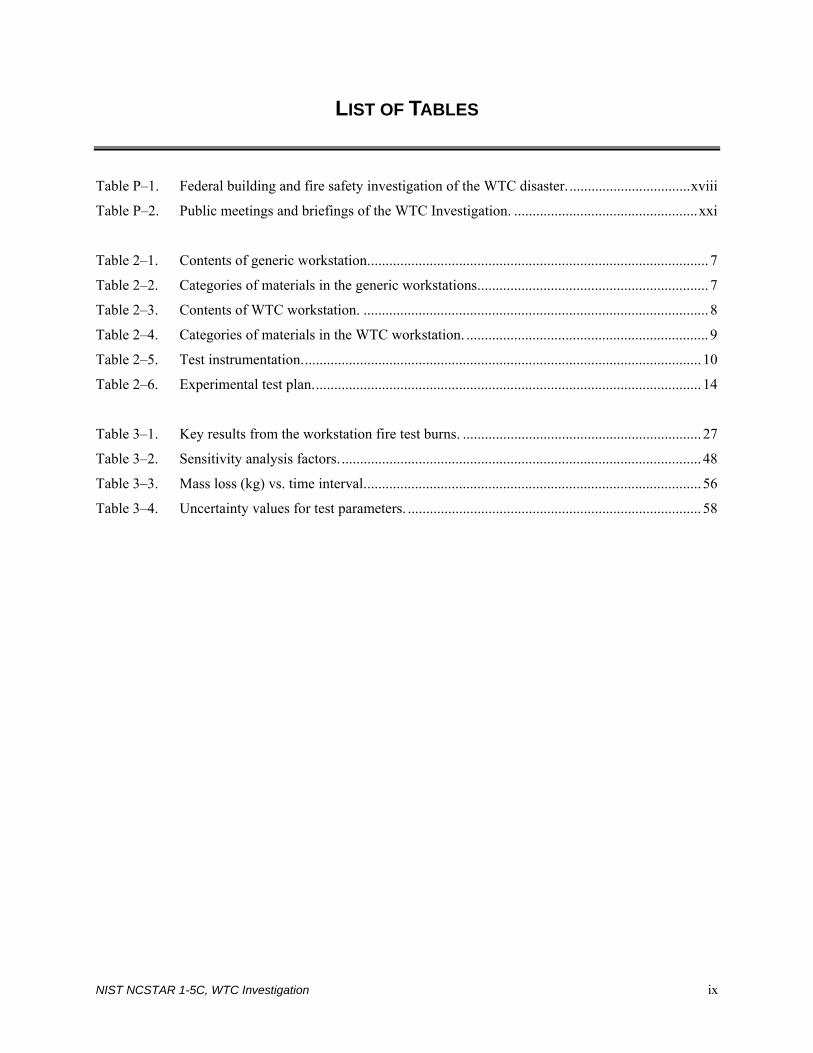
Table 2–1. Contents of generic workstation............................................................................................. 7 Table 2–2. Categories of materials in the generic workstations............................................................... 7 Table 2–3. Contents of WTC workstation. .............................................................................................. 8 Table 2–4. Categories of materials in the WTC workstation. .................................................................. 9 Table 2–5. Test instrumentation............................................................................................................. 10 Table 2–6. Experimental test plan.......................................................................................................... 14
Table 3–1. Key results from the workstation fire test burns. ................................................................. 27 Table 3–2. Sensitivity analysis factors. .................................................................................................. 48 Table 3–3. Mass loss (kg) vs. time interval............................................................................................ 56 Table 3–4. Uncertainty values for test parameters. ................................................................................ 58

List of Tables
x NIST NCSTAR 1-5C, WTC Investigation
This page intentionally left blank.

NIST NCSTAR 1-5C, WTC Investigation xi
LIST OF ACRONYMS AND ABBREVIATIONS
Acronyms
CFD computational fluid dynamics
CRT cathode ray tube
DTAP dissemination and technical assistance program
FEMA Federal Emergency Management Agency
FDS Fire Dynamics Simulator
FWHH full width at the half height of the net heat release rate
HRR heat release rate
MLR mass loss rate
NIST National Institute of Standards and Technology
R&D research & development
WTC World Trade Center
WTC 1 World Trade Center 1 (North Tower)
WTC 2 World Trade Center 2 (South Tower)
WTC 7 World Trade Center 7
Abbreviations
°C degrees Celsius
cm centimeter
CO carbon monoxide
CO2 carbon dioxide
ft foot
GJ gigajoule
GW gigawatt
in. inch
K Kelvin
kg kilogram
kW kilowatt
L liter

List of Acronyms and Abbreviations
xii NIST NCSTAR 1-5C, WTC Investigation
lb pound
m meter
min minute
MJ megajoule
mm millimeter
MW megawatt
O2 oxygen
s second
NIST NCSTAR 1-5C, WTC Investigation xiii
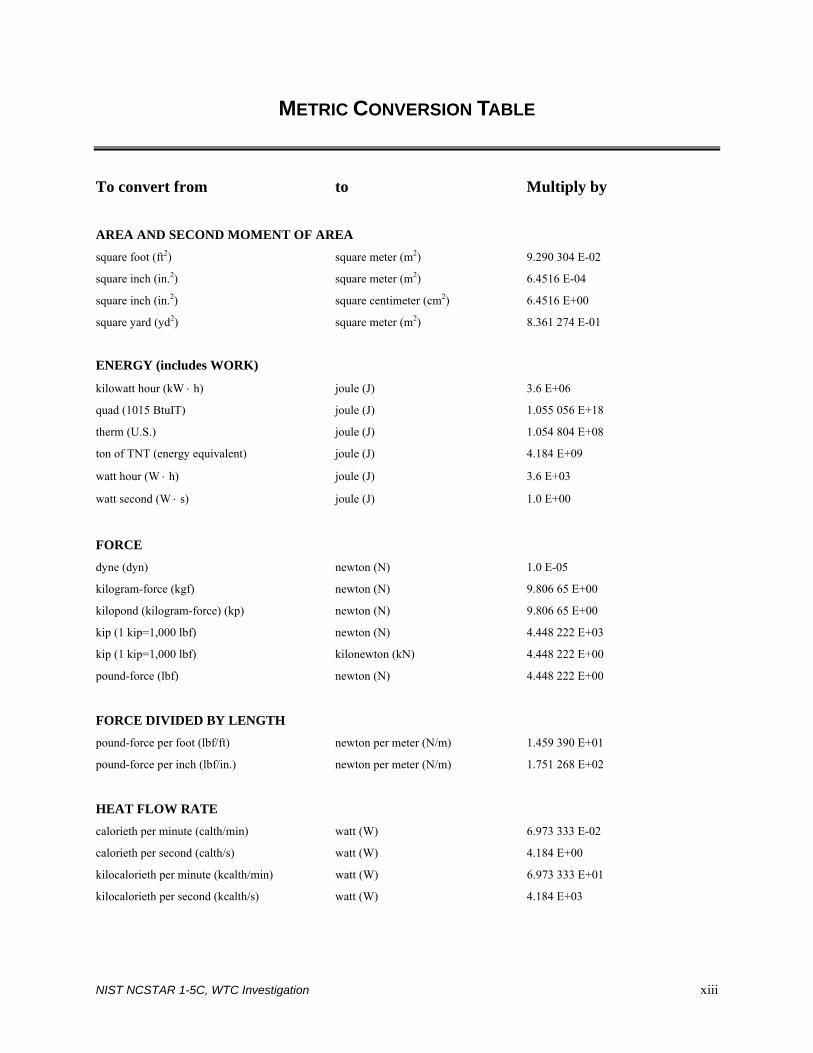
METRIC CONVERSION TABLE
To convert from to Multiply by
AREA AND SECOND MOMENT OF AREA square foot (ft2) square meter (m2) 9.290 304 E-02
square inch (in.2) square meter (m2) 6.4516 E-04
square inch (in.2) square centimeter (cm2) 6.4516 E+00
square yard (yd2) square meter (m2) 8.361 274 E-01
ENERGY (includes WORK)
kilowatt hour (kW ⋅ h) joule (J) 3.6 E+06
quad (1015 BtuIT) joule (J) 1.055 056 E+18
therm (U.S.) joule (J) 1.054 804 E+08
ton of TNT (energy equivalent) joule (J) 4.184 E+09
watt hour (W ⋅ h) joule (J) 3.6 E+03
watt second (W ⋅ s) joule (J) 1.0 E+00
FORCE dyne (dyn) newton (N) 1.0 E-05
kilogram-force (kgf) newton (N) 9.806 65 E+00
kilopond (kilogram-force) (kp) newton (N) 9.806 65 E+00
kip (1 kip=1,000 lbf) newton (N) 4.448 222 E+03
kip (1 kip=1,000 lbf) kilonewton (kN) 4.448 222 E+00
pound-force (lbf) newton (N) 4.448 222 E+00
FORCE DIVIDED BY LENGTH pound-force per foot (lbf/ft) newton per meter (N/m) 1.459 390 E+01
pound-force per inch (lbf/in.) newton per meter (N/m) 1.751 268 E+02
HEAT FLOW RATE calorieth per minute (calth/min) watt (W) 6.973 333 E-02
calorieth per second (calth/s) watt (W) 4.184 E+00
kilocalorieth per minute (kcalth/min) watt (W) 6.973 333 E+01
kilocalorieth per second (kcalth/s) watt (W) 4.184 E+03

Metric Conversion Table
xiv NIST NCSTAR 1-5C, WTC Investigation
To convert from to Multiply by
LENGTH foot (ft) meter (m) 3.048 E-01
inch (in) meter (m) 2.54 E-02
inch (in.) centimeter (cm) 2.54 E+00
micron (m) meter (m) 1.0 E-06
yard (yd) meter (m) 9.144 E-01
MASS and MOMENT OF INERTIA kilogram-force second squared
per meter (kgf ⋅ s2/m) kilogram (kg) 9.806 65 E+00
pound foot squared (lb ⋅ ft2) kilogram meter squared (kg ⋅ m2) 4.214 011 E-02
pound inch squared (lb ⋅ in.2) kilogram meter squared (kg ⋅ m2) 2.926 397 E-04
ton, metric (t) kilogram (kg) 1.0 E+03
ton, short (2,000 lb) kilogram (kg) 9.071 847 E+02
MASS DIVIDED BY AREA pound per square foot (lb/ft2) kilogram per square meter (kg/m2) 4.882 428 E+00
pound per square inch (not pound force) (lb/in.2) kilogram per square meter (kg/m2) 7.030 696 E+02
MASS DIVIDED BY LENGTH pound per foot (lb/ft) kilogram per meter (kg/m) 1.488 164 E+00
pound per inch (lb/in.) kilogram per meter (kg/m) 1.785 797 E+01
pound per yard (lb/yd) kilogram per meter (kg/m) 4.960 546 E-01
PRESSURE or STRESS (FORCE DIVIDED BY AREA) kilogram-force per square centimeter (kgf/cm2) pascal (Pa) 9.806 65 E+04
kilogram-force per square meter (kgf/m2) pascal (Pa) 9.806 65 E+00
kilogram-force per square millimeter (kgf/mm2) pascal (Pa) 9.806 65 E+06
kip per square inch (ksi) (kip/in.2) pascal (Pa) 6.894 757 E+06
kip per square inch (ksi) (kip/in.2) kilopascal (kPa) 6.894 757 E+03
pound-force per square foot (lbf/ft2) pascal (Pa) 4.788 026 E+01
pound-force per square inch (psi) (lbf/in.2) pascal (Pa) 6.894 757 E+03
pound-force per square inch (psi) (lbf/in.2) kilopascal (kPa) 6.894 757 E+00
psi (pound-force per square inch) (lbf/in.2) pascal (Pa) 6.894 757 E+03
psi (pound-force per square inch) (lbf/in.2) kilopascal (kPa) 6.894 757 E+00

Metric Conversion Table
NIST NCSTAR 1-5C, WTC Investigation xv
To convert from to Multiply by
TEMPERATURE
degree Celsius (°C) kelvin (K) T/K = t/°C + 273.15
degree centigrade degree Celsius (°C) t/°C ≈ t /deg. cent.
degree Fahrenheit (°F) degree Celsius (°C) t/°C = (t/°F - 32)/1.8
degree Fahrenheit (°F) kelvin (K) T/K = (t/°F + 459.67)/1.8
kelvin (K) degree Celsius (°C) t/°C = T/K 2 273.15
TEMPERATURE INTERVAL
degree Celsius (°C) kelvin (K) 1.0 E+00
degree centigrade degree Celsius (°C) 1.0 E+00
degree Fahrenheit (°F) degree Celsius (°C) 5.555 556 E-01
degree Fahrenheit (°F) kelvin (K) 5.555 556 E-01
degree Rankine (°R) kelvin (K) 5.555 556 E-01
VELOCITY (includes SPEED) foot per second (ft/s) meter per second (m/s) 3.048 E-01
inch per second (in./s) meter per second (m/s) 2.54 E-02
kilometer per hour (km/h) meter per second (m/s) 2.777 778 E-01
mile per hour (mi/h) kilometer per hour (km/h) 1.609 344 E+00
mile per minute (mi/min) meter per second (m/s) 2.682 24 E+01
VOLUME (includes CAPACITY) cubic foot (ft3) cubic meter (m3) 2.831 685 E-02
cubic inch (in.3 ) cubic meter (m3) 1.638 706 E-05
cubic yard (yd3) cubic meter (m3) 7.645 549 E-01
gallon (U.S.) (gal) cubic meter (m3) 3.785 412 E-03
gallon (U.S.) (gal) liter (L) 3.785 412 E+00
liter (L) cubic meter (m3) 1.0 E-03
ounce (U.S. fluid) (fl oz) cubic meter (m3) 2.957 353 E-05
ounce (U.S. fluid) (fl oz) milliliter (mL) 2.957 353 E+01

Metric Conversion Table
xvi NIST NCSTAR 1-5C, WTC Investigation
This page intentionally left blank

NIST NCSTAR 1-5C, WTC Investigation xvii
PREFACE
Genesis of This Investigation
Immediately following the terrorist attack on the World Trade Center (WTC) on September 11, 2001, the Federal Emergency Management Agency (FEMA) and the American Society of Civil Engineers began planning a building performance study of the disaster. The week of October 7, as soon as the rescue and search efforts ceased, the Building Performance Study Team went to the site and began its assessment. This was to be a brief effort, as the study team consisted of experts who largely volunteered their time away from their other professional commitments. The Building Performance Study Team issued its report in May 2002, fulfilling its goal “to determine probable failure mechanisms and to identify areas of future investigation that could lead to practical measures for improving the damage resistance of buildings against such unforeseen events.”
On August 21, 2002, with funding from the U.S. Congress through FEMA, the National Institute of Standards and Technology (NIST) announced its building and fire safety investigation of the WTC disaster. On October 1, 2002, the National Construction Safety Team Act (Public Law 107-231), was signed into law. The NIST WTC Investigation was conducted under the authority of the National Construction Safety Team Act.
The goals of the investigation of the WTC disaster were:
• To investigate the building construction, the materials used, and the technical conditions that contributed to the outcome of the WTC disaster.
• To serve as the basis for:
− Improvements in the way buildings are designed, constructed, maintained, and used;
− Improved tools and guidance for industry and safety officials;
− Recommended revisions to current codes, standards, and practices; and
− Improved public safety.
The specific objectives were:
• Determine why and how WTC 1 and WTC 2 collapsed following the initial impacts of the aircraft and why and how WTC 7 collapsed;
• Determine why the injuries and fatalities were so high or low depending on location, including all technical aspects of fire protection, occupant behavior, evacuation, and emergency response;
• Determine what procedures and practices were used in the design, construction, operation, and maintenance of WTC 1, 2, and 7; and
• Identify, as specifically as possible, areas in current building and fire codes, standards, and practices that warrant revision.

Preface
xviii NIST NCSTAR 1-5C, WTC Investigation
NIST is a nonregulatory agency of the U.S. Department of Commerce’s Technology Administration. The purpose of NIST investigations is to improve the safety and structural integrity of buildings in the United States, and the focus is on fact finding. NIST investigative teams are authorized to assess building performance and emergency response and evacuation procedures in the wake of any building failure that has resulted in substantial loss of life or that posed significant potential of substantial loss of life. NIST does not have the statutory authority to make findings of fault nor negligence by individuals or organizations. Further, no part of any report resulting from a NIST investigation into a building failure or from an investigation under the National Construction Safety Team Act may be used in any suit or action for damages arising out of any matter mentioned in such report (15 USC 281a, as amended by Public Law 107-231).
Organization of the Investigation
The National Construction Safety Team for this Investigation, appointed by the then NIST Director, Dr. Arden L. Bement, Jr., was led by Dr. S. Shyam Sunder. Dr. William L. Grosshandler served as Associate Lead Investigator, Mr. Stephen A. Cauffman served as Program Manager for Administration, and Mr. Harold E. Nelson served on the team as a private sector expert. The Investigation included eight interdependent projects whose leaders comprised the remainder of the team. A detailed description of each of these eight projects is available at http://wtc.nist.gov. The purpose of each project is summarized in Table P–1, and the key interdependencies among the projects are illustrated in Fig. P–1.
Table P–1. Federal building and fire safety investigation of the WTC disaster. Technical Area and Project Leader Project Purpose
Analysis of Building and Fire Codes and Practices; Project Leaders: Dr. H. S. Lew and Mr. Richard W. Bukowski
Document and analyze the code provisions, procedures, and practices used in the design, construction, operation, and maintenance of the structural, passive fire protection, and emergency access and evacuation systems of WTC 1, 2, and 7.
Baseline Structural Performance and Aircraft Impact Damage Analysis; Project Leader: Dr. Fahim H. Sadek
Analyze the baseline performance of WTC 1 and WTC 2 under design, service, and abnormal loads, and aircraft impact damage on the structural, fire protection, and egress systems.
Mechanical and Metallurgical Analysis of Structural Steel; Project Leader: Dr. Frank W. Gayle
Determine and analyze the mechanical and metallurgical properties and quality of steel, weldments, and connections from steel recovered from WTC 1, 2, and 7.
Investigation of Active Fire Protection Systems; Project Leader: Dr. David D. Evans; Dr. William Grosshandler
Investigate the performance of the active fire protection systems in WTC 1, 2, and 7 and their role in fire control, emergency response, and fate of occupants and responders.
Reconstruction of Thermal and Tenability Environment; Project Leader: Dr. Richard G. Gann
Reconstruct the time-evolving temperature, thermal environment, and smoke movement in WTC 1, 2, and 7 for use in evaluating the structural performance of the buildings and behavior and fate of occupants and responders.
Structural Fire Response and Collapse Analysis; Project Leaders: Dr. John L. Gross and Dr. Therese P. McAllister
Analyze the response of the WTC towers to fires with and without aircraft damage, the response of WTC 7 in fires, the performance of composite steel-trussed floor systems, and determine the most probable structural collapse sequence for WTC 1, 2, and 7.
Occupant Behavior, Egress, and Emergency Communications; Project Leader: Mr. Jason D. Averill
Analyze the behavior and fate of occupants and responders, both those who survived and those who did not, and the performance of the evacuation system.
Emergency Response Technologies and Guidelines; Project Leader: Mr. J. Randall Lawson
Document the activities of the emergency responders from the time of the terrorist attacks on WTC 1 and WTC 2 until the collapse of WTC 7, including practices followed and technologies used.

Preface
NIST NCSTAR 1-5C, WTC Investigation xix
NIST WTC Investigation ProjectsNIST WTC Investigation Projects
Analysis of Steel
Structural Collapse
Evacuation
Baseline Performance
& Impact Damage
Analysis of Codes and Practices
Emergency Response
Active Fire Protection
Thermal and Tenability
Environment
Video/Photographic Records
Oral History Data
Emergency Response Records
Recovered Structural Steel
WTC Building Performance StudyRecommendations
Government, Industry, Professional, Academic Inputs
Public Inputs
Figure P–1. The eight projects in the federal building and fire safety
investigation of the WTC disaster.
National Construction Safety Team Advisory Committee
The NIST Director also established an advisory committee as mandated under the National Construction Safety Team Act. The initial members of the committee were appointed following a public solicitation. These were:
• Paul Fitzgerald, Executive Vice President (retired) FM Global, National Construction Safety Team Advisory Committee Chair
• John Barsom, President, Barsom Consulting, Ltd.
• John Bryan, Professor Emeritus, University of Maryland
• David Collins, President, The Preview Group, Inc.
• Glenn Corbett, Professor, John Jay College of Criminal Justice
• Philip DiNenno, President, Hughes Associates, Inc.

Preface
xx NIST NCSTAR 1-5C, WTC Investigation
• Robert Hanson, Professor Emeritus, University of Michigan
• Charles Thornton, Co-Chairman and Managing Principal, The Thornton-Tomasetti Group, Inc.
• Kathleen Tierney, Director, Natural Hazards Research and Applications Information Center, University of Colorado at Boulder
• Forman Williams, Director, Center for Energy Research, University of California at San Diego
This National Construction Safety Team Advisory Committee provided technical advice during the Investigation and commentary on drafts of the Investigation reports prior to their public release. NIST has benefited from the work of many people in the preparation of these reports, including the National Construction Safety Team Advisory Committee. The content of the reports and recommendations, however, are solely the responsibility of NIST.
Public Outreach
During the course of this Investigation, NIST held public briefings and meetings (listed in Table P–2) to solicit input from the public, present preliminary findings, and obtain comments on the direction and progress of the Investigation from the public and the Advisory Committee.
NIST maintained a publicly accessible Web site during this Investigation at http://wtc.nist.gov. The site contained extensive information on the background and progress of the Investigation.
NIST’s WTC Public-Private Response Plan
The collapse of the WTC buildings has led to broad reexamination of how tall buildings are designed, constructed, maintained, and used, especially with regard to major events such as fires, natural disasters, and terrorist attacks. Reflecting the enhanced interest in effecting necessary change, NIST, with support from Congress and the Administration, has put in place a program, the goal of which is to develop and implement the standards, technology, and practices needed for cost-effective improvements to the safety and security of buildings and building occupants, including evacuation, emergency response procedures, and threat mitigation.
The strategy to meet this goal is a three-part NIST-led public-private response program that includes:
• A federal building and fire safety investigation to study the most probable factors that contributed to post-aircraft impact collapse of the WTC towers and the 47-story WTC 7 building, and the associated evacuation and emergency response experience.
• A research and development (R&D) program to (a) facilitate the implementation of recommendations resulting from the WTC Investigation, and (b) provide the technical basis for cost-effective improvements to national building and fire codes, standards, and practices that enhance the safety of buildings, their occupants, and emergency responders.

Preface
NIST NCSTAR 1-5C, WTC Investigation xxi
Table P–2. Public meetings and briefings of the WTC Investigation. Date Location Principal Agenda
June 24, 2002 New York City, NY Public meeting: Public comments on the Draft Plan for the pending WTC Investigation.
August 21, 2002 Gaithersburg, MD Media briefing announcing the formal start of the Investigation. December 9, 2002 Washington, DC Media briefing on release of the Public Update and NIST request
for photographs and videos. April 8, 2003
New York City, NY Joint public forum with Columbia University on first-person interviews.
April 29–30, 2003 Gaithersburg, MD NCST Advisory Committee meeting on plan for and progress on WTC Investigation with a public comment session.
May 7, 2003 New York City, NY Media briefing on release of May 2003 Progress Report. August 26–27, 2003 Gaithersburg, MD NCST Advisory Committee meeting on status of the WTC
investigation with a public comment session. September 17, 2003 New York City, NY Media and public briefing on initiation of first-person data
collection projects. December 2–3, 2003 Gaithersburg, MD NCST Advisory Committee meeting on status and initial results
and release of the Public Update with a public comment session. February 12, 2004 New York City, NY Public meeting on progress and preliminary findings with public
comments on issues to be considered in formulating final recommendations.
June 18, 2004 New York City, NY Media/public briefing on release of June 2004 Progress Report. June 22–23, 2004 Gaithersburg, MD NCST Advisory Committee meeting on the status of and
preliminary findings from the WTC Investigation with a public comment session.
August 24, 2004 Northbrook, IL Public viewing of standard fire resistance test of WTC floor system at Underwriters Laboratories, Inc.
October 19–20, 2004 Gaithersburg, MD NCST Advisory Committee meeting on status and near complete set of preliminary findings with a public comment session.
November 22, 2004 Gaithersburg, MD NCST Advisory Committee discussion on draft annual report to Congress, a public comment session, and a closed session to discuss pre-draft recommendations for WTC Investigation.
April 5, 2005 New York City, NY Media and public briefing on release of the probable collapse sequence for the WTC towers and draft reports for the projects on codes and practices, evacuation, and emergency response.
June 23, 2005 New York City, NY Media and public briefing on release of all draft reports for the WTC towers and draft recommendations for public comment.
September 12–13, 2005
Gaithersburg, MD NCST Advisory Committee meeting on disposition of public comments and update to draft reports for the WTC towers.
September 13–15, 2005
Gaithersburg, MD WTC Technical Conference for stakeholders and technical community for dissemination of findings and recommendations and opportunity for public to make technical comments.
• A dissemination and technical assistance program (DTAP) to (a) engage leaders of the construction and building community in ensuring timely adoption and widespread use of proposed changes to practices, standards, and codes resulting from the WTC Investigation and the R&D program, and (b) provide practical guidance and tools to better prepare facility owners, contractors, architects, engineers, emergency responders, and regulatory authorities to respond to future disasters.
The desired outcomes are to make buildings, occupants, and first responders safer in future disaster events.
Preface
xxii NIST NCSTAR 1-5C, WTC Investigation
National Construction Safety Team Reports on the WTC Investigation
A final report on the collapse of the WTC towers is being issued as NIST NCSTAR 1. A companion report on the collapse of WTC 7 is being issued as NIST NCSTAR 1A. The present report is one of a set that provides more detailed documentation of the Investigation findings and the means by which these technical results were achieved. As such, it is part of the archival record of this Investigation. The titles of the full set of Investigation publications are:
NIST (National Institute of Standards and Technology). 2005. Federal Building and Fire Safety Investigation of the World Trade Center Disaster: Final Report on the Collapse of the World Trade Center Towers. NIST NCSTAR 1. Gaithersburg, MD, September.
NIST (National Institute of Standards and Technology). 2006. Federal Building and Fire Safety Investigation of the World Trade Center Disaster: Final Report on the Collapse of World Trade Center 7. NIST NCSTAR 1A. Gaithersburg, MD.
Lew, H. S., R. W. Bukowski, and N. J. Carino. 2005. Federal Building and Fire Safety Investigation of the World Trade Center Disaster: Design, Construction, and Maintenance of Structural and Life Safety Systems. NIST NCSTAR 1-1. National Institute of Standards and Technology. Gaithersburg, MD, September.
Fanella, D. A., A. T. Derecho, and S. K. Ghosh. 2005. Federal Building and Fire Safety Investigation of the World Trade Center Disaster: Design and Construction of Structural Systems. NIST NCSTAR 1-1A. National Institute of Standards and Technology. Gaithersburg, MD, September.
Ghosh, S. K., and X. Liang. 2005. Federal Building and Fire Safety Investigation of the World Trade Center Disaster: Comparison of Building Code Structural Requirements. NIST NCSTAR 1-1B. National Institute of Standards and Technology. Gaithersburg, MD, September.
Fanella, D. A., A. T. Derecho, and S. K. Ghosh. 2005. Federal Building and Fire Safety Investigation of the World Trade Center Disaster: Maintenance and Modifications to Structural Systems. NIST NCSTAR 1-1C. National Institute of Standards and Technology. Gaithersburg, MD, September.
Grill, R. A., and D. A. Johnson. 2005. Federal Building and Fire Safety Investigation of the World Trade Center Disaster: Fire Protection and Life Safety Provisions Applied to the Design and Construction of World Trade Center 1, 2, and 7 and Post-Construction Provisions Applied after Occupancy. NIST NCSTAR 1-1D. National Institute of Standards and Technology. Gaithersburg, MD, September.
Razza, J. C., and R. A. Grill. 2005. Federal Building and Fire Safety Investigation of the World Trade Center Disaster: Comparison of Codes, Standards, and Practices in Use at the Time of the Design and Construction of World Trade Center 1, 2, and 7. NIST NCSTAR 1-1E. National Institute of Standards and Technology. Gaithersburg, MD, September.
Grill, R. A., D. A. Johnson, and D. A. Fanella. 2005. Federal Building and Fire Safety Investigation of the World Trade Center Disaster: Comparison of the 1968 and Current (2003) New

Preface
NIST NCSTAR 1-5C, WTC Investigation xxiii
York City Building Code Provisions. NIST NCSTAR 1-1F. National Institute of Standards and Technology. Gaithersburg, MD, September.
Grill, R. A., and D. A. Johnson. 2005. Federal Building and Fire Safety Investigation of the World Trade Center Disaster: Amendments to the Fire Protection and Life Safety Provisions of the New York City Building Code by Local Laws Adopted While World Trade Center 1, 2, and 7 Were in Use. NIST NCSTAR 1-1G. National Institute of Standards and Technology. Gaithersburg, MD, September.
Grill, R. A., and D. A. Johnson. 2005. Federal Building and Fire Safety Investigation of the World Trade Center Disaster: Post-Construction Modifications to Fire Protection and Life Safety Systems of World Trade Center 1 and 2. NIST NCSTAR 1-1H. National Institute of Standards and Technology. Gaithersburg, MD, September.
Grill, R. A., D. A. Johnson, and D. A. Fanella. 2005. Federal Building and Fire Safety Investigation of the World Trade Center Disaster: Post-Construction Modifications to Fire Protection, Life Safety, and Structural Systems of World Trade Center 7. NIST NCSTAR 1-1I. National Institute of Standards and Technology. Gaithersburg, MD, September.
Grill, R. A., and D. A. Johnson. 2005. Federal Building and Fire Safety Investigation of the World Trade Center Disaster: Design, Installation, and Operation of Fuel System for Emergency Power in World Trade Center 7. NIST NCSTAR 1-1J. National Institute of Standards and Technology. Gaithersburg, MD, September.
Sadek, F. 2005. Federal Building and Fire Safety Investigation of the World Trade Center Disaster: Baseline Structural Performance and Aircraft Impact Damage Analysis of the World Trade Center Towers. NIST NCSTAR 1-2. National Institute of Standards and Technology. Gaithersburg, MD, September.
Faschan, W. J., and R. B. Garlock. 2005. Federal Building and Fire Safety Investigation of the World Trade Center Disaster: Reference Structural Models and Baseline Performance Analysis of the World Trade Center Towers. NIST NCSTAR 1-2A. National Institute of Standards and Technology. Gaithersburg, MD, September.
Kirkpatrick, S. W., R. T. Bocchieri, F. Sadek, R. A. MacNeill, S. Holmes, B. D. Peterson, R. W. Cilke, C. Navarro. 2005. Federal Building and Fire Safety Investigation of the World Trade Center Disaster: Analysis of Aircraft Impacts into the World Trade Center Towers, NIST NCSTAR 1-2B. National Institute of Standards and Technology. Gaithersburg, MD, September.
Gayle, F. W., R. J. Fields, W. E. Luecke, S. W. Banovic, T. Foecke, C. N. McCowan, T. A. Siewert, and J. D. McColskey. 2005. Federal Building and Fire Safety Investigation of the World Trade Center Disaster: Mechanical and Metallurgical Analysis of Structural Steel. NIST NCSTAR 1-3. National Institute of Standards and Technology. Gaithersburg, MD, September.
Luecke, W. E., T. A. Siewert, and F. W. Gayle. 2005. Federal Building and Fire Safety Investigation of the World Trade Center Disaster: Contemporaneous Structural Steel Specifications. NIST Special Publication 1-3A. National Institute of Standards and Technology. Gaithersburg, MD, September.
Preface
xxiv NIST NCSTAR 1-5C, WTC Investigation
Banovic, S. W. 2005. Federal Building and Fire Safety Investigation of the World Trade Center Disaster: Steel Inventory and Identification. NIST NCSTAR 1-3B. National Institute of Standards and Technology. Gaithersburg, MD, September.
Banovic, S. W., and T. Foecke. 2005. Federal Building and Fire Safety Investigation of the World Trade Center Disaster: Damage and Failure Modes of Structural Steel Components. NIST NCSTAR 1-3C. National Institute of Standards and Technology. Gaithersburg, MD, September.
Luecke, W. E., J. D. McColskey, C. N. McCowan, S. W. Banovic, R. J. Fields, T. Foecke, T. A. Siewert, and F. W. Gayle. 2005. Federal Building and Fire Safety Investigation of the World Trade Center Disaster: Mechanical Properties of Structural Steels. NIST NCSTAR 1-3D. National Institute of Standards and Technology. Gaithersburg, MD, September.
Banovic, S. W., C. N. McCowan, and W. E. Luecke. 2005. Federal Building and Fire Safety Investigation of the World Trade Center Disaster: Physical Properties of Structural Steels. NIST NCSTAR 1-3E. National Institute of Standards and Technology. Gaithersburg, MD, September.
Evans, D. D., R. D. Peacock, E. D. Kuligowski, W. S. Dols, and W. L. Grosshandler. 2005. Federal Building and Fire Safety Investigation of the World Trade Center Disaster: Active Fire Protection Systems. NIST NCSTAR 1-4. National Institute of Standards and Technology. Gaithersburg, MD, September.
Kuligowski, E. D., D. D. Evans, and R. D. Peacock. 2005. Federal Building and Fire Safety Investigation of the World Trade Center Disaster: Post-Construction Fires Prior to September 11, 2001. NIST NCSTAR 1-4A. National Institute of Standards and Technology. Gaithersburg, MD, September.
Hopkins, M., J. Schoenrock, and E. Budnick. 2005. Federal Building and Fire Safety Investigation of the World Trade Center Disaster: Fire Suppression Systems. NIST NCSTAR 1-4B. National Institute of Standards and Technology. Gaithersburg, MD, September.
Keough, R. J., and R. A. Grill. 2005. Federal Building and Fire Safety Investigation of the World Trade Center Disaster: Fire Alarm Systems. NIST NCSTAR 1-4C. National Institute of Standards and Technology. Gaithersburg, MD, September.
Ferreira, M. J., and S. M. Strege. 2005. Federal Building and Fire Safety Investigation of the World Trade Center Disaster: Smoke Management Systems. NIST NCSTAR 1-4D. National Institute of Standards and Technology. Gaithersburg, MD, September.
Gann, R. G., A. Hamins, K. B. McGrattan, G. W. Mulholland, H. E. Nelson, T. J. Ohlemiller, W. M. Pitts, and K. R. Prasad. 2005. Federal Building and Fire Safety Investigation of the World Trade Center Disaster: Reconstruction of the Fires in the World Trade Center Towers. NIST NCSTAR 1-5. National Institute of Standards and Technology. Gaithersburg, MD, September.
Pitts, W. M., K. M. Butler, and V. Junker. 2005. Federal Building and Fire Safety Investigation of the World Trade Center Disaster: Visual Evidence, Damage Estimates, and Timeline Analysis. NIST NCSTAR 1-5A. National Institute of Standards and Technology. Gaithersburg, MD, September.
Preface
NIST NCSTAR 1-5C, WTC Investigation xxv
Hamins, A., A. Maranghides, K. B. McGrattan, E. Johnsson, T. J. Ohlemiller, M. Donnelly, J. Yang, G. Mulholland, K. R. Prasad, S. Kukuck, R. Anleitner and T. McAllister. 2005. Federal Building and Fire Safety Investigation of the World Trade Center Disaster: Experiments and Modeling of Structural Steel Elements Exposed to Fire. NIST NCSTAR 1-5B. National Institute of Standards and Technology. Gaithersburg, MD, September.
Ohlemiller, T. J., G. W. Mulholland, A. Maranghides, J. J. Filliben, and R. G. Gann. 2005. Federal Building and Fire Safety Investigation of the World Trade Center Disaster: Fire Tests of Single Office Workstations. NIST NCSTAR 1-5C. National Institute of Standards and Technology. Gaithersburg, MD, September.
Gann, R. G., M. A. Riley, J. M. Repp, A. S. Whittaker, A. M. Reinhorn, and P. A. Hough. 2005. Federal Building and Fire Safety Investigation of the World Trade Center Disaster: Reaction of Ceiling Tile Systems to Shocks. NIST NCSTAR 1-5D. National Institute of Standards and Technology. Gaithersburg, MD, September.
Hamins, A., A. Maranghides, K. B. McGrattan, T. J. Ohlemiller, and R. Anleitner. 2005. Federal Building and Fire Safety Investigation of the World Trade Center Disaster: Experiments and Modeling of Multiple Workstations Burning in a Compartment. NIST NCSTAR 1-5E. National Institute of Standards and Technology. Gaithersburg, MD, September.
McGrattan, K. B., C. Bouldin, and G. Forney. 2005. Federal Building and Fire Safety Investigation of the World Trade Center Disaster: Computer Simulation of the Fires in the World Trade Center Towers. NIST NCSTAR 1-5F. National Institute of Standards and Technology. Gaithersburg, MD, September.
Prasad, K. R., and H. R. Baum. 2005. Federal Building and Fire Safety Investigation of the World Trade Center Disaster: Fire Structure Interface and Thermal Response of the World Trade Center Towers. NIST NCSTAR 1-5G. National Institute of Standards and Technology. Gaithersburg, MD, September.
Gross, J. L., and T. McAllister. 2005. Federal Building and Fire Safety Investigation of the World Trade Center Disaster: Structural Fire Response and Probable Collapse Sequence of the World Trade Center Towers. NIST NCSTAR 1-6. National Institute of Standards and Technology. Gaithersburg, MD, September.
Carino, N. J., M. A. Starnes, J. L. Gross, J. C. Yang, S. Kukuck, K. R. Prasad, and R. W. Bukowski. 2005. Federal Building and Fire Safety Investigation of the World Trade Center Disaster: Passive Fire Protection. NIST NCSTAR 1-6A. National Institute of Standards and Technology. Gaithersburg, MD, September.
Gross, J., F. Hervey, M. Izydorek, J. Mammoser, and J. Treadway. 2005. Federal Building and Fire Safety Investigation of the World Trade Center Disaster: Fire Resistance Tests of Floor Truss Systems. NIST NCSTAR 1-6B. National Institute of Standards and Technology. Gaithersburg, MD, September.
Zarghamee, M. S., S. Bolourchi, D. W. Eggers, Ö. O. Erbay, F. W. Kan, Y. Kitane, A. A. Liepins, M. Mudlock, W. I. Naguib, R. P. Ojdrovic, A. T. Sarawit, P. R Barrett, J. L. Gross, and

Preface
xxvi NIST NCSTAR 1-5C, WTC Investigation
T. P. McAllister. 2005. Federal Building and Fire Safety Investigation of the World Trade Center Disaster: Component, Connection, and Subsystem Structural Analysis. NIST NCSTAR 1-6C. National Institute of Standards and Technology. Gaithersburg, MD, September.
Zarghamee, M. S., Y. Kitane, Ö. O. Erbay, T. P. McAllister, and J. L. Gross. 2005. Federal Building and Fire Safety Investigation of the World Trade Center Disaster: Global Structural Analysis of the Response of the World Trade Center Towers to Impact Damage and Fire. NIST NCSTAR 1-6D. National Institute of Standards and Technology. Gaithersburg, MD, September.
McAllister, T., R. W. Bukowski, R. G. Gann, J. L. Gross, K. B. McGrattan, H. E. Nelson, L. Phan, W. M. Pitts, K. R. Prasad, F. Sadek. 2006. Federal Building and Fire Safety Investigation of the World Trade Center Disaster: Structural Fire Response and Probable Collapse Sequence of World Trade Center 7. (Provisional). NIST NCSTAR 1-6E. National Institute of Standards and Technology. Gaithersburg, MD.
Gilsanz, R., V. Arbitrio, C. Anders, D. Chlebus, K. Ezzeldin, W. Guo, P. Moloney, A. Montalva, J. Oh, K. Rubenacker. 2006. Federal Building and Fire Safety Investigation of the World Trade Center Disaster: Structural Analysis of the Response of World Trade Center 7 to Debris Damage and Fire. (Provisional). NIST NCSTAR 1-6F. National Institute of Standards and Technology. Gaithersburg, MD.
Kim, W. 2006. Federal Building and Fire Safety Investigation of the World Trade Center Disaster: Analysis of September 11, 2001, Seismogram Data. (Provisional). NIST NCSTAR 1-6G. National Institute of Standards and Technology. Gaithersburg, MD.
Nelson, K. 2006. Federal Building and Fire Safety Investigation of the World Trade Center Disaster: The Con Ed Substation in World Trade Center 7. (Provisional). NIST NCSTAR 1-6H. National Institute of Standards and Technology. Gaithersburg, MD.
Averill, J. D., D. S. Mileti, R. D. Peacock, E. D. Kuligowski, N. Groner, G. Proulx, P. A. Reneke, and H. E. Nelson. 2005. Federal Building and Fire Safety Investigation of the World Trade Center Disaster: Occupant Behavior, Egress, and Emergency Communication. NIST NCSTAR 1-7. National Institute of Standards and Technology. Gaithersburg, MD, September.
Fahy, R., and G. Proulx. 2005. Federal Building and Fire Safety Investigation of the World Trade Center Disaster: Analysis of Published Accounts of the World Trade Center Evacuation. NIST NCSTAR 1-7A. National Institute of Standards and Technology. Gaithersburg, MD, September.
Zmud, J. 2005. Federal Building and Fire Safety Investigation of the World Trade Center Disaster: Technical Documentation for Survey Administration. NIST NCSTAR 1-7B. National Institute of Standards and Technology. Gaithersburg, MD, September.
Lawson, J. R., and R. L. Vettori. 2005. Federal Building and Fire Safety Investigation of the World Trade Center Disaster: The Emergency Response Operations. NIST NCSTAR 1-8. National Institute of Standards and Technology. Gaithersburg, MD, September.

NIST NCSTAR 1-5C, WTC Investigation xxvii
ACKNOWLEDGMENTS
Ed Hnetkovsky, Laurean DeLauter, and Jack Lee of the National Institute of Standards and Technology (NIST) were instrumental in setting up and conducting the workstation fire tests. Michelle Donnelly and Rik Johnsson, also of NIST, ran the data acquisition system for this test series. Michael Smith (NIST) performed all of the cone calorimeter testing of the workstation materials.
Harold Nelson, a consultant, and Kevin McGrattan and Anthony Hamins of NIST provided helpful advice regarding the test series.
Marlene Tracy and Len Gerstel of Gerstel Office Furnishings, Gaithersburg, Maryland, were helpful in finding workstation materials that were analogous to those in the World Trade Center (WTC). Dave Fleck at Arenson Office Furnishings, New York, New York, provided valuable data on the typical layout of the workstations in the WTC and assisted with the procurement of a workstation essentially identical to those in WTC 1. Lisa Bickel, Knoll Furnishings, New York, New York, provided information on actual workstation set-ups in the WTC.

Acknowledgments
xxviii NIST NCSTAR 1-5C, WTC Investigation
This page intentionally left blank.
NIST NCSTAR 1-5C, WTC Investigation xxix
EXECUTIVE SUMMARY
E.1 INTRODUCTION
Reconstruction of the fires that occurred in the World Trade Center (WTC) buildings on September 11, 2001, relied heavily on computer simulations since examination of the post-fire premises was not possible and the information from eyewitness accounts was severely limited in nature. These simulations were performed using the National Institute of Standards and Technology (NIST) Fire Dynamics Simulator (FDS), version 4. FDS, a computational fluid dynamics (CFD) model, solves numerically a form of the Navier-Stokes equations with subgrid-scale modeling appropriate for the low-speed, thermally driven flows prevalent in fires. The prevalent combustion model in FDS assumed that the generation of fuel vapors was determined by a heat of gasification and that the combustion rate was determined by the rate of mixing of these vapors and air.
To prepare FDS for use in reconstructing the WTC fires, it was necessary to establish its accuracy in simulating the burning of the principal combustibles in the WTC buildings. The most common floor layout was an open space populated by a large array of workstations or cubicles. These approximately 2.4 m (8 ft) square units were geometrically complex, containing a desktop, file storage, bookshelves, carpeting, computer, chair, and a variety of amounts and locations of paper. Each cubicle was bounded on all four sides by privacy panels.
E.2 DESCRIPTION OF FIRE TESTS
This report describes a series of six fire tests of individual cubicles. The purpose was to understand how the office workstations may have burned and to provide data for improvements in the FDS combustion algorithm and its inputs needed to approximate the burning of combustibles as complex as those that comprise an office workstation. The tests involved:
• Instrumentation to measure the heat release rate (HRR) and the mass loss rate. The entire cubicle was placed on a load cell under the NIST 9 m by 12 m, 10 MW collector hood. The hood was instrumented to measure HRR by oxygen consumption calorimetry.
• A skirted ceiling placed over the workstation, enabling the fire effluent to form a hot ceiling layer such as would have occurred in a room fire.
• Placement of four video cameras to enable following the progress of the fires. Strategically placed heat flux gauges and thermocouples provided indicators of the intensity of the fire and its growth pattern.
• Ignition by a 2 MW spray burner, directed downward over a 2 m square pan simulating an adjacent burning workstation.

Executive Summary
xxx NIST NCSTAR 1-5C, WTC Investigation
• Two different workstations designs: a generic workstation analogous to those used in the WTC and a workstation identical to one used on floors 93 to 100 of WTC 1. The visible differences between the two were in the nature of the privacy panels, the file cabinets, and the chair. The former had a combustible mass of 250 kg; the latter contained about 15 kg less wood laminate desk surface but was otherwise similar.
• Inclusion of the effects of inert debris from fallen ceiling tiles or fractured walls and jet fuel (Jet A) similar to that from the incident aircraft in the disaster.
For input to the FDS modeling, the thermophysical properties of the cubicle materials were determined using a cone calorimeter. Values of HRR and ignition delay time were obtained for piloted ignition at heat fluxes of 20 kW/m2, 25 kW/m2 (for the desk surface only), 45 kW/m2, and 70 kW/m2. None of the materials yielded a constant HRR. However, for modeling purposes, the samples were treated as if they were exhibiting a square-wave HRR. The data were fit to a linear variation of HRR with incident flux. The ignition data, supplemented by the heat flux values at which the ignition delay time exceeded 1200 s (taken as non-ignition), were used to infer an ignition temperature and effective thermal inertia for each material.
E.3 FIRE TEST RESULTS
An initial test with a half workstation gauged the behavior of what was an unknown system. The results confirmed that the chosen ignition source would provide an orderly and rapid progression of fire growth and that the peak fire size would stay within the capacity of the calorimeter hood.
The properties determined in each test included the time of ignition of the first item; the total mass lost and the mass loss rate over the duration of the test; the total heat released by the burning workstation, the HRR over the duration of the test, and the net HRR (the total HRR minus the HRR of the burner); the burning time; and the effective heat of combustion. A detailed description of the progress of each fire was also prepared. The numerical results and their uncertainties are shown in Table ES–1. These data were usable in modeling the open burning of the types of workstations prevalent in the WTC buildings.
The following observations characterize the phenomena that controlled the spread of flame on workstation components and the spread from component to component:
• In Tests 1 through Test 4 (no Jet A), the workstation combustion began with paper on the desktop autoigniting from thermal radiation from the burner flames. The flames on the paper stacks then piloted the ignition of the computer monitor shell, the desktop, and the top of the chair back. The chair ignited the carpet by dropping flaming material on it and ignited the underside of the desk surface by direct flame impingement. The desk surfaces tended to be slow to ignite but provided most of the heat release in the latter parts of the tests. The peak HRR corresponded to all accessible combustible surfaces burning simultaneously.

NIS
T NC
STA
R 1-5C
, WTC
Investigation xxxi
E
xecutive Sum
mary
Table ES–1. Key results from the workstation fire tests. Test
Quantity 1 2 3 4 5 6 Uncertainty
Workstation ½ Generic Generic Generic WTC Generic Generic Tiles N N Y N N Y Jet fuel N N N N Y Y Peak HRRa (MW) 5.92/5.77 8.70/8.48 7.56/7.30 9.89/9.66 9.12/8.91 7.960/7.60 14.6 %/13.2 % Time to peakg (s) 490 530 590 510 160 200 4.4 %/7.2 % Net peak HRRa (MW) 3.82/3.67 6.95/6.73 5.53/5.27 7.72/7.46 7.38/7.17 6.17/5.95 15.0 %/13.6 % Peak MLR (kg/s) 0.197 0.308 0.263 0.420 0.336 0.293 12.8 % Time to peakg (s) 480 530 560 490 160 180 4.4 %/7.2 % Net heat released (GJ) 1.20 4.05 4.13 2.93 3.60 3.74 14.9 % Time intervalb (s) 150 to 1265 50 to 3200 160 to 3600 30 to
2100 0 to 2500 20 to 2520
Total mass loss (kg) 69.1 205.0 213.6 173.6 200.2 205.3 4.4 % Effective heat of combustion (MJ/kg )
17.4 19.8 19.3 16.9c 18.0 18.2 15.0 %
FWHHd (s) 244 445 318 451 11.6 %, 43.6 %,10.8 %,12.8 % t(75 %)e 1311 1453 833 1009 4.6 %, 5.5 % tig
f (s ) (item ignited) 39 (paper)
67 (paper)
56 (paper)
50 (paper)
90 (Jet A)
114 (paper)
62 %, 36 % 43 %, 48 %, 27 %, 21 %
a. The first HRR number is the calorimeter output; the second is a 10 s average about the absolute peak; the first uncertainty number is for the instantaneous peak and the second is the 10 s average about the peak.
b. The time interval applies to both the net heat released and to the total mass loss. c. There was some spillage of smoke in Test 4, which may partly account for the lower heat of combustion. d. Full width half height of net HRR curve; the four uncertainty values are for Tests 2, 3, 5, and 6. e. Time at which 75 percent heat had been released and 75 percent of mass had been lost; the first uncertainty value is for Tests 2 and 3 and the second is for Tests 5
and 6. f. Time of ignition of first object within workstation; the six values of uncertainties are for Test 1 through Test 6. g. The first uncertainty number is without Jet A and the second number is with Jet A.

Executive Summary
xxxii NIST NCSTAR 1-5C, WTC Investigation
• The jet fuel considerably shortened the time to the peak HRR value. In Test 5, the radiant flux from the flames vaporized the Jet A until it was ignited by a random piece of flaming material from the privacy panel adjacent to the burner. In Test 6, the initial event was autoignition of the paper on the desktop, followed by ignition of the Jet A. Both fires proceeded rapidly toward involvement of all the combustibles. Here again, the peak HRR corresponded to all accessible combustible surfaces burning simultaneously.
• In all tests, the post-peak behavior included both the burning out of the various combustibles and the collapsing of three-dimensional components into more compact piles that decreased their burning rates.
A sensitivity analysis of the test results provided the following:
• Approximately 75 percent of the heat release and mass loss occurred over a period of approximately 20 min, insensitive to all the test variables.
• The peak HRR of the workstation was diminished in rough proportion to the fraction of total combustible surface area covered by inert materials. It was estimated that a moderate increase in the surface coverage would decrease the peak HRR proportionately and that a very large increase in coverage would have a more than proportionate effect but the latter would have occurred only in areas that were highly rubblized.
• The presence of jet fuel had only a small effect on the total mass loss (approximately 200 kg), the total heat released (approximately 4 GJ) and the peak HRR (approximately 7 MW) from the burning workstation. The peak HRR value was estimated to be insensitive to a lesser amount of jet fuel present, but sensitive to a larger amount. [The Jet A in the tests was consumed shortly after speeding the ignition of the cubicle. More Jet A would have resulted in a large pool of a highly volatile combustible.]
• The presence of 4 L of Jet A dramatically decreased the times to peak HRR, from approximately 10 min to approximately 3 min. Increasing the quantity of jet fuel was not expected to affect further the time to full involvement of the cubicle.
• The tiles and Jet A were nearly independent factors: the effect of the tiles on the burning rate of the cubicle was almost independent of the presence or absence of the Jet A.
• The overall burning behavior was not sensitive to workstation design, with the only (small) effect being due to the difference in mass and the exposed flammable area.
• Variation in the mass of paper on the cubicle surfaces would not have affected the ignition of the heavier workstation components. However, the total absence of exposed paper would have delayed the workstation ignition until the next most susceptible component autoignited or random flaming debris from adjacent fire areas served as a pilot. Additional paper in the file cabinets would have prolonged the burning time of the workstation, but would not likely have affected the peak HRR due to the poor air supply within the cabinets.

Executive Summary
NIST NCSTAR 1-5C, WTC Investigation xxxiii
The five measures of fire intensity (HRR, mass loss rate, carbon dioxide volume fraction in the exhaust gases, temperature of the exhaust gases and radiant flux seen by the gage viewing the entire fire from the south side of the cubicle) presented a consistent representation of the progress of the fire, given their individual measurement characteristics.
E.4 SIMULATION OF FIRE TESTS
Preliminary simulations indicated that the traditional representation of materials combustion was not sufficient to replicate the experimental results with sufficient accuracy. This was not surprising since during the fire tests some important phenomena had been identified as not being capable of inclusion in a computational model of current sophistication. These included: changes in the shape (e.g., by collapse) and surface area of combustibles that affected their burning rate; three-dimensional burning behavior, especially of the chair; fabric peeling on the privacy panels; and anticipation of whether a combustible would ignite from direct flame impingement or by radiation-driven autoignition.
A pragmatic, empirical approach was taken to the representation of the various combustibles.
• The carpet, desk, and privacy panel data from the cone calorimeter were used directly. The carpet and privacy panel were modeled assuming a burning rate proportional to the heat flux from the surrounding environment. The desk was modeled as a charring solid, in which a pyrolysis front propagates through the material leaving a layer of char behind that insulates the material and reduces the burning rate.
• All the other items within the workstation were modeled as a single entity by lumping their masses together into three homogeneous “boxes” and distributing these throughout the workstation. The combustion properties were adjusted to match the results of the experiments. Thus, the results from the single workstation burns served to calibrate the model. The properties of each box were:
− Dimensions (length, width, height): 0.5 m by 0.5 m by 1.0 m (20 in. by 20 in. by 39 in.)
− Ignition temperature: 370 °C
− HRR: 2.25 MW after a 100 s, linear ramp from the point of ignition. The heat release then decreased in time resulting from a decrease in surface area as the boxes burned.
Simulations of Tests 2, 3, 5, and 6 were then performed to determine how well the above approximations led to agreement between the measured and computed HRR profiles. The magnitudes and shapes of the HRR versus time curves were similar in form and magnitude, with the following notes:
• For Tests 2 and 3 (no Jet A), the simulations underestimated the times to the HRR peak by about 2 min. This was due to the strong influence of the melting of the chair plastic onto the carpet, a feature not captured in the model.
• The predicted decrease in the HRR peak resulting from tiles and the increase in the peak from the Jet A were similar in magnitude to the measured results.

Executive Summary
xxxiv NIST NCSTAR 1-5C, WTC Investigation
• The simulations correctly predicted the small increase in the time to the peak with the addition of the tiles, but they did not predict the more than a factor of three reduction in the time to the peak for the addition of Jet A. FDS consumed the Jet A immediately with relatively small effect on the growth of the overall HRR. For the actual fire, the ignition of the Jet A occurred a bit later, but then quickly caused the entire cubicle to become fully involved. The error in the time to the HRR peak was less than 2 min.
These effects were small enough to be averaged out when multiple workstations were burning simultaneously at various stages of their burning. It was estimated that on the order of 40 workstations were burning on a given floor at the height of the fires in WTC 1. Thus, the chosen set of parameters and approximated component burning descriptions gave a reasonable description of the actual workstation heat release rate behavior and its dependence on the factors varied in the tests (inert tile coverage and presence of Jet A).

NIST NCSTAR 1-5C, WTC Investigation 1
Chapter 1 INTRODUCTION
1.1 CONTEXT OF TESTS
Reconstruction of the fires that occurred in World Trade Center (WTC) 1, 2, and 7 on September 11, 2001, relies heavily on computer simulations since examination of the post-fire premises was not possible due to the collapse of the buildings, and the information from eyewitness accounts is severely limited in nature. These simulations were to be performed using the National Institute of Standards and Technology (NIST) Fire Dynamics Simulator (FDS), version 4 (NIST NCSTAR 1-5F1). FDS, a computational fluid dynamics (CFD) model, solves numerically a form of the Navier-Stokes equations with a subgrid-scale modeling appropriate for the low-speed, thermally driven flows prevalent in fires.
The traditional combustion model in FDS is relatively simple. Enthalpy input (from an ignition source or an existing fire) pyrolyzes the exposed combustibles or fuels. The rate of gasification and the ignition condition for a combustible are determined by its thermophysical properties and ignition temperature. The air space in the compartment is divided into rectilinear volume elements. Each of these elements is characterized by its mixture fraction, a conserved scalar quantity defined as the mass fraction of the contained gas that originated as fuel. If an element is bounded by elements with mixture fractions that are rich (fuel-air equivalence ratio greater than unity) and lean (fuel-air equivalence ratio less than unity), then combustion is deemed to occur within that element. FDS assumes that the combustion rate is mixing-controlled, and that the reaction of fuel and oxygen is infinitely fast. The heat released by the combustion is dispersed according to the calculated fluid dynamics, the radiant flux to the surfaces of combustibles are recalculated, and the process is repeated until all the combustibles have been consumed. The “flames” spread as successive volume elements reach combustible mixture fractions. The mass fractions of the major combustion products are derived from the mixture fraction by means of “state relations,” empirical expressions arrived at by a combination of simplified analysis and measurement.
To prepare FDS for use in reconstructing the WTC fires, it was necessary to establish its accuracy in simulating the combustion of the principal combustibles in the three buildings. Conversations with building occupants and managers indicated some variety of furnishings and arrangements in the various tenant areas (NIST NCSTAR 1-5). The most common floor layout was a continuous open space populated by a large array of workstations or cubicles. These units were geometrically complex and contained a mixture of combustible materials. Each approximately 2.44 m (8 ft) square cubicle typically was bounded on all four sides by privacy panels, with an entrance opening in one side only. Within the area defined by the panels was a self-contained workspace: desktop, file storage, bookshelves, carpeting, chair, etc. Presumably, there were a variety of amounts and locations of paper, both exposed on the work surfaces and contained within the file cabinets and bookshelves. These cubicles were grouped in clusters
1 This reference is to one of the companion documents from this Investigation. A list of these documents appears in the Preface
to this report.

Chapter 1
2 NIST NCSTAR 1-5C, WTC Investigation
or rows, with up to 210 units on a given floor. On a mass basis, the workstations were generally the dominant combustibles on the floors where extensive fires were observed.
This report describes a series of six fire tests of individual cubicles performed during July and August 2003. The most important characteristic of the combustion is the heat release rate (HRR) of the fire. It dominates the growth of the fire and the concomitant hazards. The mass loss rate (MLR), also measured, provides parallel information, since for a constant heat of combustion, the MLR and HRR are proportional. Madrzykowski (1996, 1998) had measured the heat release rate behavior of workstations that were somewhat different from those studied here. He found the peak heat release rate values varied with such details as the number of privacy panels and the failure of a thermoplastic shelf support leading to a shelf collapse which spewed loose papers onto the fire, immediately enhancing it substantially. Here, two different cubicle designs were combusted. As a result of the airplane impacts into the two towers, workstations in some locales would have been showered with inert debris from the ceiling tile system or fractured walls and also may have been sprayed with Jet A (jet fuel). Thus, these two effects were also included in the test series. The tests are documented in Chapter 2. The results are presented and discussed in Chapter 3.
The thermophysical properties of the cubicle materials (carpet, desk [wood], computer monitor, chair, privacy panel, and stacked paper) were determined using the cone calorimeter (ASTM E 1354) for input to the FDS simulations. The results of these measurements are included in Appendix A.
Preliminary simulations indicated that the traditional representation of materials combustion was not sufficient to replicate the experimental results with sufficient accuracy. An empirically derived revision was incorporated and is described in Chapter 4, along with the resulting successful simulations.
1.2 REFERENCES
Madrzykowski, D. 1996. Office Work Station Heat Release Rate Study: Full Scale vs. Bench Scale, Proceedings of Interflam ’96, Interscience Communications, Ltd., London, pp. 47-55.
Madrzykowski, D. 1998. Office Building Fire Research Program: An Engineering Based Approach to Fire Safety Design, Proceedings of the 5th Fire and Materials Conference, San Antonio, Texas, Interscience Communications, Ltd., London, pp. 23-33.
McGrattan, K., ed. 2004. Fire Dynamics Simulator (Version 4), Technical Reference Guide, NIST Special Publication 1018. National Institute of Standards and Technology. Gaithersburg, MD.

NIST NCSTAR 1-5C, WTC Investigation 3
Chapter 2 DESCRIPTION OF EXPERIMENTS
2.1 WORKSTATIONS
2.1.1 Generic Workstations
The number of different types of workstations in the World Trade Center (WTC) buildings is unknown and probably large. Marsh & McLennan, the tenant in floors 93 to 100 of WTC 1, had at least four different workstation layouts (Fleck 2003). While there were likely to have been some differences in fire behavior among these, their general complexity and variety of combustible materials make any one of them a reasonable subject for examination of the Fire Dynamics Simulator (FDS) predictive capability.
Five of the six experiments focused on the burning behavior of a type of single workstation that was a generic analog (not a replica) of one type of station used on floors 93 to 100 of WTC 1. Figures 2–1 and 2–2 show the generic workstation layout, as tested.
Source: NIST.
Figure 2–1. View of the north and east sides of the generic work station.

Chapter 2
4 NIST NCSTAR 1-5C, WTC Investigation
Source: NIST.
Figure 2–2. View from above of the west side of the generic workstation. The horizontal insulated pipe above the west wall is the feed line to the four
nozzles of the spray igniter.
Figure 2–1 is a view through the cubicle opening at the right hand (east) side of the layout, showing the bookshelf on the rear (north) wall, and the two-drawer file cabinets beneath the east desk surface. Figure 2–2 is an elevated view looking down at the left hand (west) side of the cubicle. The computer processor and the wastebasket, both beneath the desk surface, are visible on the right. The insulated feed line containing the four fuel spray nozzles is visible above the top of the west cubicle wall; the fire these produce is actually on the outer side of the west cubicle wall. Note the positioning of the chair, immediately adjacent to the west desk surface and with a portion of its seat below the desk surface section on which the keyboard rests. Note also that paper, in various sheet counts, is distributed around the three closed sides of the cubicle with the largest concentration being in the bookcase.
The layout, including the placement of the various non-stationary items, was suggested by personnel from the company that supplied office furnishings to the occupants of the noted floors of WTC 1 (Fleck 2003). The mass and distribution of papers and other office clutter is based on information also provided by this source, who was a frequent visitor to these offices.

Description of Experiments
NIST NCSTAR 1-5C, WTC Investigation 5
The workstation was a nominally 2.44 m by 2.44 m (8 ft by 8 ft) cubicle with privacy wall panels 1.22 m (4 ft) high, except for one 1.52 m (5 ft) tall panel section supporting the bookcase. The entry opening was 1.22 m (4 ft) wide.
• The panels were covered on both sides with a thermoplastic fabric. Their interior structure was composed of layers of fiberglass and perforated steel. Each panel section had a 38 mm (1.50 in.) softwood frame around its periphery that was covered in part by fabric and in part by a steel outer frame.
• The work surfaces were formed from four unequal sections of laminated medium density fiberboard supported by brackets from the wall panels. The tops of the surfaces were 0.75 m (29.5 in.) above the floor. In the assemblies used for all but one of the tests, the brackets supplied were composed of an aluminum alloy which could be expected to melt relatively early in the fire. Since the actual WTC stations had steel support brackets, steel brackets were added here as well to prevent premature collapse of the work surface. The tops of the panel sections were wired together for the same reason; aluminum clips, not present in the actual WTC work stations, were the normal link holding the panels together in the generic work stations.
• The “bulldog” office chair was upholstered with a non-thermoplastic fabric over polyurethane foam (seat and seat back) supported by a one-piece thermoplastic shell. Its five-legged base was also thermoplastic with steel framing and support elements.
• The bookcase was 1.22 m (48 in.) long and had a steel shelf and top. These were supported on their ends by combustible end panels. The steel front closure panel was fabric-covered steel, and it was open (on top of the bookcase).
• The carpet tiles were nylon fiber-faced over a dense foam rubber backing. A square area 2.74 m by 2.74 m (9 ft by 9 ft) was covered with 36 carpet tiles.
• The computer monitor was a nominally 17 in. CRT-based unit. Its front face was taped with fiberglass tape, and it was pointed toward the wall panel opposite the cubicle opening for safety in the event of an implosion. The keyboard was placed in its normal location, parallel to the angled segment of the work surface. The computer processor (tower-type container with plastic only on the front face of the container) was placed on the floor next to a waste paper basket (both on the north side of the cubicle, opposite the opening).
• The wastebasket was thermoplastic and it contained one ream of copier paper atop five balled-up paper ream wrappers.
• Copier paper was chosen to substitute for all types of paper-based products expected in a work station (loose leaf, catalogs, books, etc.) since it is reproducible and similar in general fire behavior to all such products. The paper was 20 lb, 84 brightness. Besides being in the wastebasket, copier paper was distributed elsewhere as indicated in Figs. 2–1 and 2–2. It was used both in horizontal and in vertical arrays, arrangements that potentially might have behaved quite differently, but did not appear to do so in any of the tests here. The paper in the bookcase and the paper in the southwest corner (to the left of the cubicle opening as

Chapter 2
6 NIST NCSTAR 1-5C, WTC Investigation
indicated in Fig. 2–2) were placed vertically in open, thin cardboard “document boxes,” each with an 89 mm (3.5 in.) wide interior dimension. These boxes had a sloped top edge such that they equaled the long dimension of the paper in the rear but were only 100 mm (4 in.) tall in front. In the bookcase, each document box contained 1.33 reams of copier paper (a rather loose degree of packing). The 10 boxes were grouped in sets of two with equal, approximately 3 cm (1.2 in.) spacing between each pair. The four boxes on the desk surface contained one ream each of copier paper (an even looser degree of packing) and were grouped as a set of four units in a line, in contact with each other. Other paper was laid as open horizontal stacks on the desk surface at locations seen in Figs. 2–1 and 2–2. A few sheets were tacked (as groups of three to five sheets) to the cubicle walls on three sides.
• The three lateral file cabinets were 0.91 m wide, 0.51 m deep, and 0.68 m high (36 in. by 20 in. by 27 in.). Each had two painted steel drawers and rested directly on the carpet tiles. Each cabinet was capable of holding up to about 150 kg (330 lb) of paper. [Such paper content is normally included in the fire load estimates of an office occupancy but, when enclosed in steel, it is, in effect, partially discounted (AISI 1981; NFPA 2003).] Here, two of the cabinets contained a very limited amount of copier paper as a rough means of assessing the extent to which paper in file drawers might contribute to a fire. It was anticipated that this contribution would be small and occur well past the fire peak, thus having no significant influence on important portions of the HRR curves.
Two piles were laid horizontally in two file drawers. Each pile consisted of one ream laid in the drawer corner with the long dimension of the paper aligned with the depth dimension of the drawer topped by a second ream aligned at 90 degrees to the lower ream. Both placements were in the position most vulnerable to heat exposure, i.e., they were against the north wall of the file cabinets and thus immediately adjacent to an area subject to intense burning, the open area under the desk surface.
Table 2–1 lists the mass of each type of workstation component and an estimate of the combustible mass that each represented. In Table 2–2, the materials are grouped into four categories. Wood-based materials accounted for nearly half of the combustible mass; paper, one quarter; and synthetic materials, the remainder. The heats of combustion of these materials, based on the cone calorimeter results reported in Appendix A, varied over a range of nearly a factor of three.

Description of Experiments
NIST NCSTAR 1-5C, WTC Investigation 7
Table 2–1. Contents of generic workstation.
Component Mass (kg) Combustible
Fraction Combustible
Mass (kg) Work surface – melamine laminate over medium density fiber-board 4 pieces, 6.1 m total length × 0.61 m wide × 28 mm thick
82.8 1.0 82.8
27 reams of paper and 14 document boxes 63.7 1.0 63.7 Plastic kick plates and trim (base of walls, inside and outside)
7.1 1.0 7.1
Computer keyboard 1.2 1.0 1.2 Plastic waste basket 0.7 1.0 0.7 36 nylon carpet tiles with rubber backing 38.0 0.9 34.2 Shelf ends – particle board or dense foam 3.8 0.9 3.4a
Bulldog chair – fabric, foam, thermoplastic shell and base 19.4 0.8 15.5 Computer monitor - ABS 17.6 0.3 5.3 Computer processor 12.3 0.3 3.7 9 wall panels with aluminum angle, wood frames, fiberglass, and metal mesh, 3 sizes
168.2 0.18 30.3 25.3 kg wood 5.0 kg fabric
Book shelf 8.3 0.1 0.8
3 two-drawer steel filing cabinets, 0.91 m long × 0.51 m deep × 0.76 m high
142.5 0.0 0.0
Total 557.1 0.45 248.7 a. Table 2–2 assumes that the 3.4 kg is plastic.
Table 2–2. Categories of materials in the generic workstations.
Material Mass (kg) Fraction of Total Mass Effective Heat of
Combustion (MJ/kg) Wood/laminate 111.5 0.45 14 Paper 63.7 0.25 14 Plasticsa 39.3 0.16 16 to 38 Carpet 34.2 0.14 22
a. Includes computer monitor shell (16 MJ/kg), wall fabric (30 MJ/kg), and chair composite (38 MJ/kg).
2.1.2 WTC Workstation
One of the six tests was of a workstation that was identical in design to one of those on floors 93 to 100 of WTC 1. The principal differences between it and the generic workstations used in the other five tests were as follows:
• The wall panel had a 3 mm (0.125 in.) layer of flame-retarded polyester fiber beneath the outer fabric, a more open steel panel beneath this, a central fiberboard layer (3 mm thick) and an all steel (i.e., no wood) peripheral frame. The fiberboard roughly cut to one half the amount of woody fuel within the wall panels of the enclosure. This decrease in woody fuel

Chapter 2
8 NIST NCSTAR 1-5C, WTC Investigation
was only about 5 percent of the total available in the desk surfaces. Also, its enclosure deep within the wall panels delayed its burning.
• The four file cabinets had a total face length of 2.67 m (105 in.), rather than three with a total face length of 2.73 m (107 in.). They had a flammable, charring plastic surface on the drawer fronts that added about 10 percent to the exposed flammable area.
• The chair was constructed somewhat differently. Its seat and back were separate pieces, it had an additional 3 kg (6.6 lb) of mass, and it behaved as if its upholstered surfaces were flame-retarded. The chair was certified to pass California Technical Bulletin 117, which usually requires somewhat flame-retarded polyurethane foam.
Table 2–3 summarizes the mass of the components and their estimated combustible mass content for the WTC workstation; Table 2–4 groups the materials into the same categories as in Table 2–2. Items in bold type differed from the generic workstation summarized in Table 2–1. Note that the WTC workstation had a slightly lower total combustible mass, but the plastic fronts on the file cabinets meant there was more exposed area of flammable material and the total mass of plastic was greater.
Table 2–3. Contents of WTC workstation.
Component Mass (kg) Combustible
Fraction Combustible
Mass (kg)
Work surface—melamine laminate over medium density fiberboard, 4 pieces, 6.1 m total length × 0.61 m wide × 30 mm thick
79.4 1.0 79.4
27 reams of paper and 14 document boxes 63.7 1.0 63.7 Computer keyboard 1.2 1.0 1.2 Plastic waste basket 0.7 1.0 0.7 36 nylon carpet tiles with rubber backing 38.0 0.9 34.2 Plastic doors for 2 cm to 76 cm wide shelves 4.4 (est.) 1.0 4.4 High-end bulldog chair—fabric, polyurethane foam, thermoplastic shell and base
22.4 0.8 17.9
Computer terminal, ABS 17.6 0.3 5.3 Computer processor 12.3 0.3 3.7 6 wall panels of steel construction with an 0.32 cm thick hardboard septum, fiberglass insulation, and fabric
89.2 0.23 20.5 15.4 kg wood 5.1 kg fabric
Three 2-door filing cabinets similar to those above plus a smaller portable filing cabinet
136.9 0.02 (est.) 2.7 (est.)
Total 465.8 0.50 233.7 Note: Bold items have values different from those in the generic workstation.
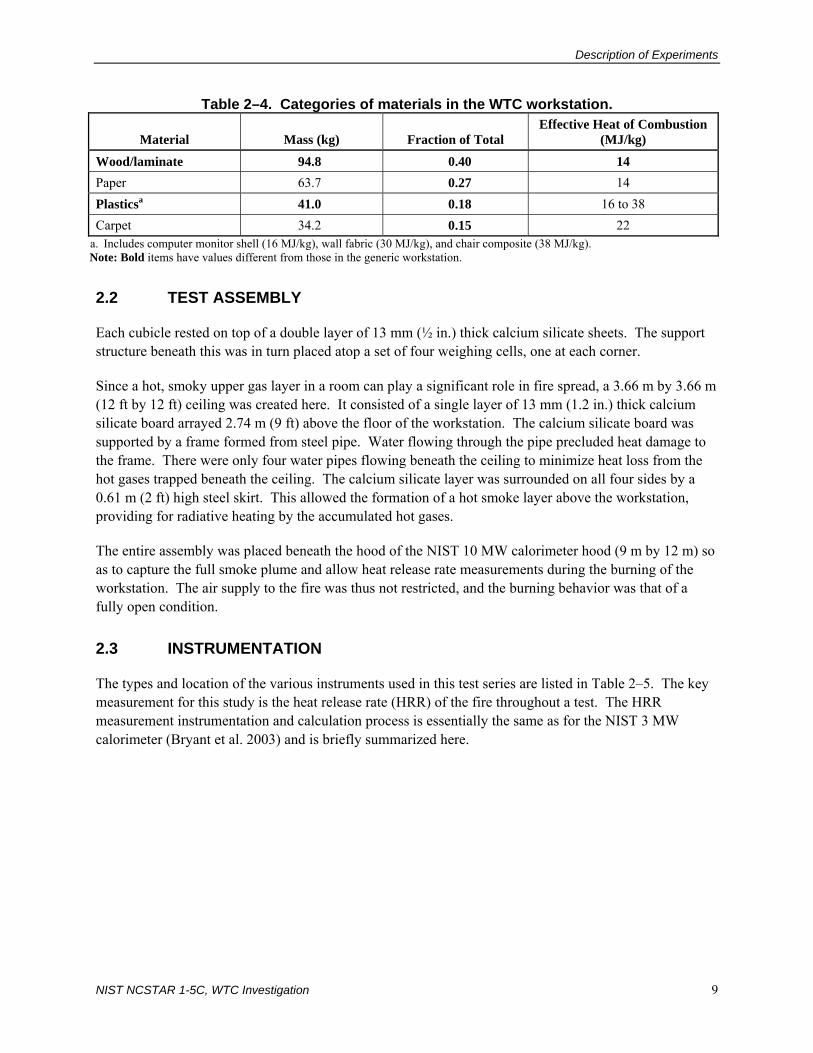
Description of Experiments
NIST NCSTAR 1-5C, WTC Investigation 9
Table 2–4. Categories of materials in the WTC workstation.
Material Mass (kg) Fraction of Total Effective Heat of Combustion
(MJ/kg)
Wood/laminate 94.8 0.40 14 Paper 63.7 0.27 14 Plasticsa 41.0 0.18 16 to 38 Carpet 34.2 0.15 22
a. Includes computer monitor shell (16 MJ/kg), wall fabric (30 MJ/kg), and chair composite (38 MJ/kg). Note: Bold items have values different from those in the generic workstation.
2.2 TEST ASSEMBLY
Each cubicle rested on top of a double layer of 13 mm (½ in.) thick calcium silicate sheets. The support structure beneath this was in turn placed atop a set of four weighing cells, one at each corner.
Since a hot, smoky upper gas layer in a room can play a significant role in fire spread, a 3.66 m by 3.66 m (12 ft by 12 ft) ceiling was created here. It consisted of a single layer of 13 mm (1.2 in.) thick calcium silicate board arrayed 2.74 m (9 ft) above the floor of the workstation. The calcium silicate board was supported by a frame formed from steel pipe. Water flowing through the pipe precluded heat damage to the frame. There were only four water pipes flowing beneath the ceiling to minimize heat loss from the hot gases trapped beneath the ceiling. The calcium silicate layer was surrounded on all four sides by a 0.61 m (2 ft) high steel skirt. This allowed the formation of a hot smoke layer above the workstation, providing for radiative heating by the accumulated hot gases.
The entire assembly was placed beneath the hood of the NIST 10 MW calorimeter hood (9 m by 12 m) so as to capture the full smoke plume and allow heat release rate measurements during the burning of the workstation. The air supply to the fire was thus not restricted, and the burning behavior was that of a fully open condition.
2.3 INSTRUMENTATION
The types and location of the various instruments used in this test series are listed in Table 2–5. The key measurement for this study is the heat release rate (HRR) of the fire throughout a test. The HRR measurement instrumentation and calculation process is essentially the same as for the NIST 3 MW calorimeter (Bryant et al. 2003) and is briefly summarized here.
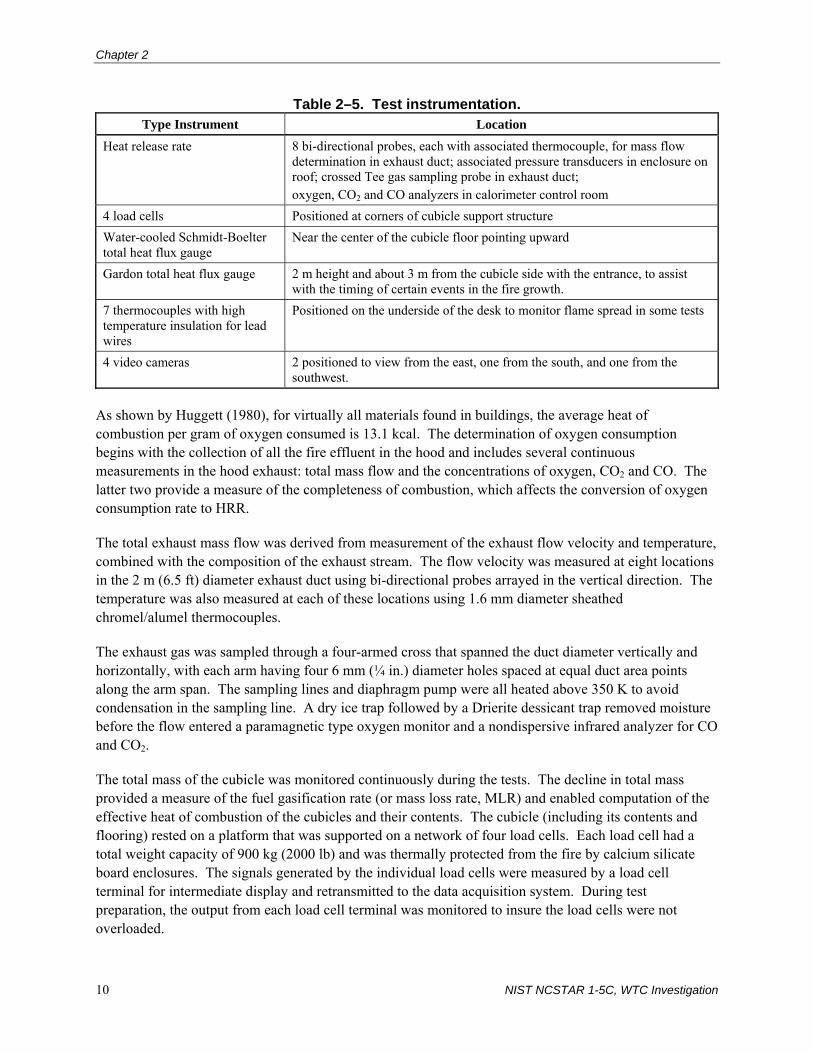
Chapter 2
10 NIST NCSTAR 1-5C, WTC Investigation
Table 2–5. Test instrumentation. Type Instrument Location
Heat release rate 8 bi-directional probes, each with associated thermocouple, for mass flow determination in exhaust duct; associated pressure transducers in enclosure on roof; crossed Tee gas sampling probe in exhaust duct; oxygen, CO2 and CO analyzers in calorimeter control room
4 load cells Positioned at corners of cubicle support structure Water-cooled Schmidt-Boelter total heat flux gauge
Near the center of the cubicle floor pointing upward
Gardon total heat flux gauge 2 m height and about 3 m from the cubicle side with the entrance, to assist with the timing of certain events in the fire growth.
7 thermocouples with high temperature insulation for lead wires
Positioned on the underside of the desk to monitor flame spread in some tests
4 video cameras 2 positioned to view from the east, one from the south, and one from the southwest.
As shown by Huggett (1980), for virtually all materials found in buildings, the average heat of combustion per gram of oxygen consumed is 13.1 kcal. The determination of oxygen consumption begins with the collection of all the fire effluent in the hood and includes several continuous measurements in the hood exhaust: total mass flow and the concentrations of oxygen, CO2 and CO. The latter two provide a measure of the completeness of combustion, which affects the conversion of oxygen consumption rate to HRR.
The total exhaust mass flow was derived from measurement of the exhaust flow velocity and temperature, combined with the composition of the exhaust stream. The flow velocity was measured at eight locations in the 2 m (6.5 ft) diameter exhaust duct using bi-directional probes arrayed in the vertical direction. The temperature was also measured at each of these locations using 1.6 mm diameter sheathed chromel/alumel thermocouples.
The exhaust gas was sampled through a four-armed cross that spanned the duct diameter vertically and horizontally, with each arm having four 6 mm (¼ in.) diameter holes spaced at equal duct area points along the arm span. The sampling lines and diaphragm pump were all heated above 350 K to avoid condensation in the sampling line. A dry ice trap followed by a Drierite dessicant trap removed moisture before the flow entered a paramagnetic type oxygen monitor and a nondispersive infrared analyzer for CO and CO2.
The total mass of the cubicle was monitored continuously during the tests. The decline in total mass provided a measure of the fuel gasification rate (or mass loss rate, MLR) and enabled computation of the effective heat of combustion of the cubicles and their contents. The cubicle (including its contents and flooring) rested on a platform that was supported on a network of four load cells. Each load cell had a total weight capacity of 900 kg (2000 lb) and was thermally protected from the fire by calcium silicate board enclosures. The signals generated by the individual load cells were measured by a load cell terminal for intermediate display and retransmitted to the data acquisition system. During test preparation, the output from each load cell terminal was monitored to insure the load cells were not overloaded.

Description of Experiments
NIST NCSTAR 1-5C, WTC Investigation 11
In Tests 1, 2, and 3, a Schmidt-Boelter total heat flux gage was placed on the cubicle floor on its east-west centerline and 0.8 m from the cubicle opening. The sensor face was 127 mm (5 in.) above the carpet and it measured the local heat flux to the carpet. The gage was cooled by hot (68 °C to 78 °C) water to preclude condensation of water vapor on the gage surface. An external Gardon-type total heat flux gage was also mounted externally approximately 1.2 m (4 ft) from the cubicle and approximately 1 m (3 ft) above the cubicle floor level so as to view the entire fire from the cubicle opening side. This provided a signal that was roughly proportional to the instantaneous HRR of the fire, useful for checking the timing of fire events and assessing whether the calorimeter properly estimated the peak HRR.
In Tests 2, 3, and 4, thermocouples were placed on the underside of the desk surface in an attempt to follow the progress of the fire in that important location. However, despite the use of high temperature glass fiber insulation, the thermocouple leads short circuited, and no usable data were obtained.
The signals from all the measurement devices were collected by a high speed data acquisition system. The signal from each device was recorded every 1 s. During this recording cycle, each data point was averaged over a period of 1/200 s.
Each test was also monitored by four video cameras located as shown in Fig. 2–3. These enabled observation of the progression of flame spread over the various surfaces in the workstation assembly. This was useful in explaining the nature of the measured HRR curve over time and any differences from the predicted HRR behavior. A complete documentation of the fire growth was not possible due to blockage of the view by the cubicle partitions and interference by the flames themselves as the fire grew in intensity. An observer narrated the fire growth to one of the cameras to supplement what the cameras recorded directly.
Figure 2–3. Location of video cameras.

Chapter 2
12 NIST NCSTAR 1-5C, WTC Investigation
2.4 TEST PARAMETERS
After extensive discussion, two factors were identified that might affect the fire behavior in the tests in a manner that would be a good test of the FDS simulation capability and that at the same time were germane to fire behavior in the WTC buildings:
• Presence and Quantity of Aviation Fuel (Jet A). The impact of the airplanes could be expected to leave varying amounts of Jet A deposited on various surfaces, with some areas being heavily engulfed and others, further from the impact zone, being dry. Because of its high volatility and heat of combustion, even a limited amount of Jet A has the potential to alter the burning and spread rates of the fire. The quantity chosen, 4 L per workstation, was sufficient to form a continuous layer on the major horizontal surfaces and thus was sufficient to alter the fire growth process substantially.
• Presence and Quantity of Inert Rubble on Surfaces. Survivors of the WTC disaster reported significant falling of ceiling tiles, even on floors some distance from the airplane impacts. These tiles are both low in flammability (up to 15 percent by mass combustible content) and good thermal insulators. As such, they are capable of retarding or even preventing the fire involvement of surfaces onto which they fall. In two of the tests, the tiles were simulated by 40 13 mm (1/2 in.) thick slabs of calcium silicate board cut into 15 cm by 30 cm (6 in. by 12 in.) rectangles. These were distributed on the desk, chair and floor surfaces as shown in Fig. 2–4. The tiles were placed only on areas open to the ceiling (including part of the chair seat and part of the tops of some of the paper piles), but not under the desk or chair. To obtain a measurable but not overwhelming effect, the tiles covered approximately 30 percent of this upward-facing area.
Source: NIST.
Figure 2–4. View from the south of the generic work station with calcium silicate “tiles” in place on exposed, upward
facing surfaces (floor, desk, chair seat).

Description of Experiments
NIST NCSTAR 1-5C, WTC Investigation 13
2.5 IGNITION SCENARIO
As with any complex assemblage of fuels, the heat release rate history for a workstation subsequent to ignition can be expected to depend significantly on the mode and location of that ignition event. In the WTC towers, the photographic evidence shows an overwhelming ignition event in the area of impact. This fire receded, then returned and spread to other, less disrupted areas, providing a continuing series of large ignition sources. This, combined with the rationale that only the larger fires could heat enough structural members sufficiently to influence the eventual building collapse, suggested that a high intensity ignition source for these tests would be a proper choice.
The ignition source chosen was a 2 MW, four-nozzle spray burner. The nozzles were directed downward over a 1 m by 2 m pan, creating a fire that simulated the burning of an adjacent workstation. As shown in Fig. 2–2, the burner and pan were located immediately adjacent to the exterior of the west panel of the test station, with the pan bottom being 0.81 m (2 ft 8 in.) above the floor. The fuel spray was somewhat coarse, and some droplets made it to the pan, although there was no significant liquid accumulation there. The size and placement of this ignition source were guided by preliminary FDS predictions. While a real workstation would yield a transient HRR and thus a time-varying heat input to its neighbor, this complexity was deemed undesirable for the task at hand.
The igniter fire was supported by a flow of commercial-grade liquid heptanes (mixed isomers, but referred to as “heptane” for the remainder of this report) sprayed at a nominally steady rate from the four nozzles. The heptane was supplied from a reservoir by a variable-speed pump. The desired flow was preset before the test and measured in triplicate by catching the flow from each nozzle in a volumetric cylinder for a period, typically, of 20 s. The nominally 2 MW fire plume supported by the heptane flow typically impinged almost continually on the ceiling above the igniter. There was thus a near-continuous wall of flames radiating toward the workstation along the central three-fourths of the length of one wall panel. In addition, the workstation was subject to radiation from the hot ceiling and the hot smoke captured below the ceiling. Typically (with one exception) the spray burner was kept on until late in the fire.
2.6 EXPERIMENTAL DESIGN
Since the test series was to examine the effects of two factors, with two values of each, the basic test series utilized a full factorial design. These four tests are depicted in Table 2–6 as Tests 2, 3, 5, and 6. This is the minimum number of tests required to provide a first order statistical assessment of the impact of two parameters. These tests were preceded by a test that utilized nominally one half of a generic workstation, though it included both a full chair and full computer. This was done to gage the behavior of what was an unknown system. A sixth test compared the results of Test 2 with the behavior of a different style of workstation.

Chapter 2
14 NIST NCSTAR 1-5C, WTC Investigation
Table 2–6. Experimental test plan. Test Specimen Tiles Jet Fuel
1 Half generic workstation None None 2 Generic workstation None None 3 Generic workstation 40 None 4 WTC workstation None None 5 Generic workstation None 4 L 6 Generic workstation 40 4 L
The results of Test 1, using the half workstation, confirmed that the chosen ignition source would provide an orderly and rapid progression of fire growth over the various fuel surfaces in the workstation. It also demonstrated that the peak fire size, while large, would most likely stay within the capacity of the calorimeter hood.
2.7 TEST PROCEDURE
The following was the sequence followed in performing each of the tests:
• The workstation was typically assembled shortly before a test. The humidity in the Large Fire Laboratory at the time of the testing was approximately 70 percent for most of the tests. Cellulosic materials are hygroscopic, and significantly increased moisture content could slow the ignition process compared to a more normal relative humidity of 50 percent. Thus, the most susceptible such material, the copier paper, was covered with plastic sheeting if it were to be exposed for more than 2 h. This probably did not preclude significant moisture pick-up in the outer portions of paper piles.
• A 22.7 kg (50 lb) weight was added to the platform (and then removed) to verify the proper differential output of the load cell electronics.
• The data channels to be scanned were verified, the appropriate delay times for the hood measurements were selected, span values (mainly calibration gas cylinder volume fractions) were entered, as were the calorimetry settings for the combustion products expansion factor and the generic heat of combustion per mass of oxygen.
• The gas analysis instruments in the calorimeter were zeroed and spanned before each test, using known gas mixtures with oxygen, nitrogen, CO2 and CO. Procedures generally followed those described by Bryant et al. (2003).
• The background heat release rate was measured for a few minutes immediately before the test was to start in order to establish the calorimeter baseline. Similarly, the baseline values of the thermocouples and heat flux gages were checked.
• The heptane flow was measured in triplicate during the zero/spanning process.
• In Tests 4 and 6, the panels representing the fallen tiles were laid in place.

Description of Experiments
NIST NCSTAR 1-5C, WTC Investigation 15
• In Tests 5 and 6, the jet fuel was placed on the horizontal surfaces immediately prior to the start of the test. A sprinkling can was used in two separate operations, each involving 2 L of the liquid fuel. First the liquid was sprinkled on the horizontal desk surfaces and the objects on them (i.e., the various paper stacks or document boxes, the computer monitor, and the keyboard) using a timed movement that attempted to allot an equal amount of liquid to each one-third of the total surface. The desk surface had been leveled after installation so that the liquid would not run preferentially in one direction. Next, an equal amount of the liquid was sprinkled, in a similar timed manner, on the central open section of the carpet (not under the desk surfaces). Since the chair occupied a portion of this space, the allotment for that portion went onto the chair seat and back surfaces. For the objects on or in contact with the desk surface, there was some tendency for the Jet A to wick into them if they were porous. This was true of the paper, the inert tiles, and the wall panel fabric just above the desk surface.
• With all lights and cameras on, the test was initiated by starting the heptane flow and immediately igniting it with a torch. This defined time zero.
• The heptane flow to the igniter was left on until well past the peak in heat release unless there was an indication that the fire was going to exceed the 10 MW calorimeter capacity. This happened only in Test 5. In that case, the flow was turned off approximately 575 s into the test.
• The background HRR was measured for a few minutes immediately after the test in order to determine the degree, if any, of calorimeter baseline shift.
• The residual weights of the paper piles in the two file drawers and of the paper piles on the desk were obtained as a measure of the participation of this paper in the overall fire.
2.8 REFERENCES
AISI (American Iron and Steel Institute). 1981. Fire Protection Through Modern Building Codes, 5th Edition, pp 56-58.
Bryant, R.A., T.J. Ohlemiller, E.L. Johnsson, A. Hamins, B.S. Grove, W.F. Guthrie, A. Maranghides, and G.W. Mulholland. 2003. The NIST 3 Megawatt Quantitative Heat Release Rate Facility, NIST Special Publication 1007. National Institute of Standards and Technology, Gaithersburg, MD, December.
Fleck, D. 2003. Arenson Office Furnishings, NY, personal communication to George Mulholland, National Institute of Standards and Technology, Gaithersburg, MD.
Huggett, C. 1980. Estimation of rate of heat release by means of oxygen- consumption measurements. Fire and Materials, vol. 4, 61-65.
McAllister, T., ed. 2002. World Trade Center Building Performance Study: Data Collection, Preliminary Observations, and Recommendations. FEMA 403. Federal Emergency Management Agency. Washington, DC, May.

Chapter 2
16 NIST NCSTAR 1-5C, WTC Investigation
Mudan, K. and P. Croce. 1995. SFPE Handbook of Fire Protection Engineering, Second Edition, National Fire Protection Association, Quincy, MA, Section 3, Chapter 11.
NFPA International. 2003. Fire Protection Handbook, Nineteenth Edition, Vol. II, Quincy, MA, pp. 12-95, 12-96.

NIST NCSTAR 1-5C, WTC Investigation 17
Chapter 3 TEST RESULTS AND INTERPRETATION
3.1 DATA REDUCTION
The standard data analysis program used in these tests computed the heat release rate (HRR) as a function of time during the tests. These results allowed the preparation of the HRR plots (Figs. 3–1 through 3–6) using a standard plotting package. Each graph shows both the full heat release rate curves of a fire test and an annotated portion that omits most of the tail-off of the fire. Figure 3–7 is a sequence of photographs taken during Test 2.
Additional analysis was required for computing the net heat release rate, the total heat released by the workstation, the mass burning rate, and the heat of combustion. The methods for doing these supplemental calculations are given in succeeding sections. A comprehensive discussion of the derivation of the heat release equation, the basis for the selection of the constant parameters, and the data analysis program, including the real time output corrected for the flow time delay and the instrument response time, can be found in Bryant et al. (2003).
The results of both these calculations and observations of the video tapes are included in Table 3–1.
3.1.1 Burning Time and Ignition Time
Two measures were used for the burning time. The full-width at the half-height of the net heat release rate (FWHH) was used as a measure of the intense period of burning. The time at which the mass loss of the workstation including Jet A decreased by 75 percent the total mass loss, t(75 %), was also used as a measure of the time interval for intense burning. These two quantities were obtained from the recorded mass loss data and from the reduced heat release rate data. The net heat release data had pronounced oscillations past the peak and there were two or more times corresponding to the half-height of the net heat release weight. The average of the shortest and longest times was used in computing the FWHH.
The ignition time of the first item, tig, was determined from analyzing the video from the tests.

Chapter 3
18 NIST NCSTAR 1-5C, WTC Investigation
0
1
2
3
4
5
6
0 200 400 600 800 1000 1200 1400
Hea
t Rel
ease
Rat
e (M
W)
Time from Ignition (s)Ig
nite
r Off
Wat
er A
pplie
d
Figure 3–1a. Complete heat release rate curve, Test 1, one half of generic workstation,
no Jet A, no tiles.
0
1
2
3
4
5
6
0 100 200 300 400 500 600 700
Hea
t Rel
ease
Rat
e (M
W)
Time from Ignition (s)
Firs
t pap
er ig
nitio
n
Top
of c
hair
back
igni
tes
Des
k to
p su
rface
igni
ting
Com
pute
r mon
itor i
gnite
sC
hair
seat
igni
tes
Eve
ryth
ing
bbov
e de
sk to
p bu
rnin
g
Cha
ir fir
e ne
ar
peak
Are
a un
der d
esk
fully
in
volv
ed
Des
k co
llaps
e be
gins Ig
nite
r Off
Figure 3–1b. Annotated partial heat release rate curve, Test 1, one half of generic
workstation, no Jet A, no tiles.
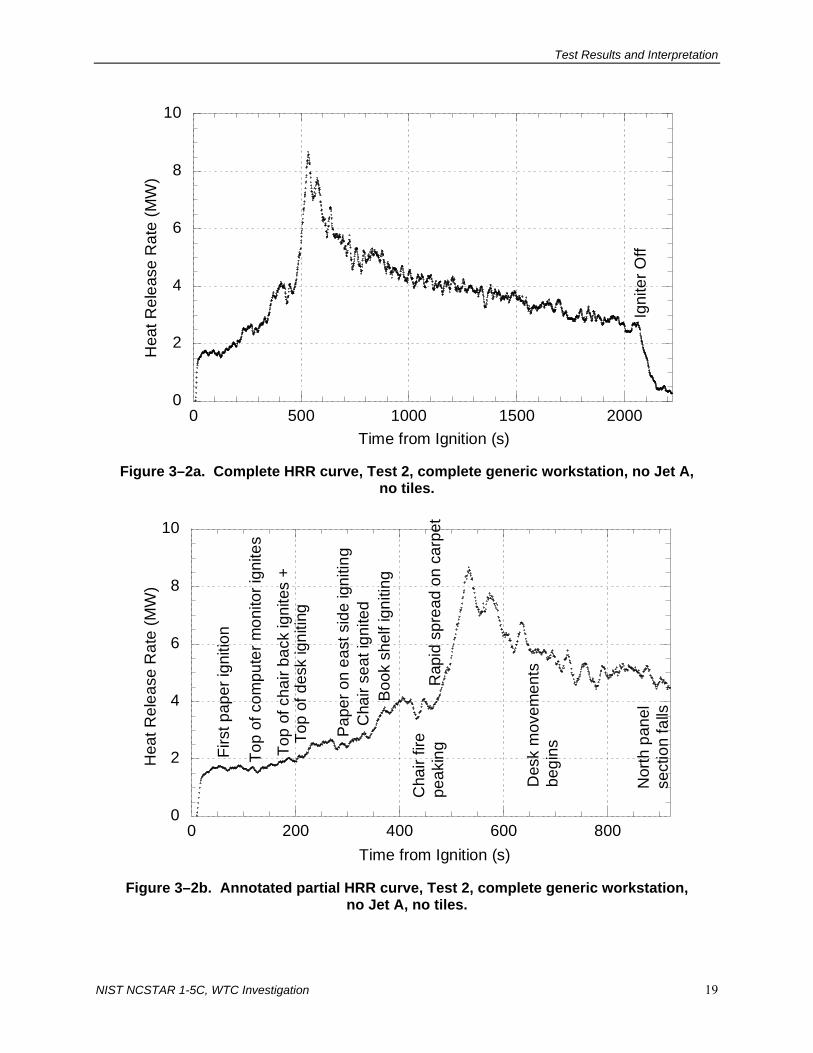
Test Results and Interpretation
NIST NCSTAR 1-5C, WTC Investigation 19
0
2
4
6
8
10
0 500 1000 1500 2000
Hea
t Rel
ease
Rat
e (M
W)
Time from Ignition (s)
Igni
ter O
ff
Figure 3–2a. Complete HRR curve, Test 2, complete generic workstation, no Jet A,
no tiles.
0
2
4
6
8
10
0 200 400 600 800
Hea
t Rel
ease
Rat
e (M
W)
Time from Ignition (s)
Firs
t pap
er ig
nitio
n
Top
of c
ompu
ter m
onito
r ign
ites
Top
of c
hair
back
igni
tes
+To
p of
des
k ig
nitin
g
Cha
ir se
at ig
nite
dB
ook
shel
f ign
iting
Pape
r on
east
sid
e ig
nitin
g
Rap
id s
prea
d on
car
pet
Des
k m
ovem
ents
be
gins
Nor
th p
anel
sect
ion
falls
Cha
ir fir
e pe
akin
g
Figure 3–2b. Annotated partial HRR curve, Test 2, complete generic workstation,
no Jet A, no tiles.

Chapter 3
20 NIST NCSTAR 1-5C, WTC Investigation
0
1
2
3
4
5
6
7
8
0 500 1000 1500 2000 2500 3000
Hea
t Rel
ease
Rat
e (M
W)
Time from Ignition (s)
Igni
ter O
ff
Figure 3–3a. Complete HRR curve, Test 3, generic workstation, no Jet A, 30 percent tile
coverage on exposed, upward-facing surfaces.
0
1
2
3
4
5
6
7
8
0 200 400 600 800 1000
Hea
t Rel
ease
Rat
e (M
W)
Time from Ignition (s)
Firs
t pap
er ig
nitio
n
Top
of c
hair
igni
tes
Th
en c
ompu
ter m
onito
r
Cha
ir fir
e ne
ar p
eak
Pap
er o
n ea
st s
ide
igni
ting
Des
k m
ovem
ent b
egin
s
Figure 3–3b. Annotated partial HRR curve, Test 3, complete generic workstation,
no Jet A, 30 percent tile coverage on exposed, upward-facing surfaces.

Test Results and Interpretation
NIST NCSTAR 1-5C, WTC Investigation 21
0
2
4
6
8
10
0 500 1000 1500 2000
Hea
t Rel
ease
Rat
e (M
W)
Time from Ignition (s)
Igni
ter O
ff
NE
wal
l pan
el fa
lls o
utw
ard
NW
pan
el fa
lls in
war
d
Figure 3–4a. Complete HRR curve, Test 5, generic workstation, 4 L Jet A, no tiles.
0
2
4
6
8
10
0 100 200 300 400 500 600 700 800
Hea
t Rel
ease
Rat
e (M
W)
Time from Ignition (s)
Jet A
on
desk
top
igni
tes
Car
pet i
gnite
d by
drip
from
cha
ir
Des
k m
ovem
ent
begi
ns
Boo
kcas
e fa
lls
Figure 3–4b. Annotated partial HRR curve, Test 5, complete generic workstation,
4 L Jet A, no tiles.

Chapter 3
22 NIST NCSTAR 1-5C, WTC Investigation
0
2
4
6
8
10
0 500 1000 1500 2000 2500
Hea
t Rel
ease
Rat
e (M
W)
Time from Ignition (s)
Igni
ter O
ff
NE
wal
l pan
el fa
lls o
utw
ard
Figure 3–5a. Complete HRR curve, Test 6, generic workstation, 4 L Jet A, 30 percent
tile coverage on exposed, upward facing surfaces.
0
2
4
6
8
10
0 100 200 300 400 500 600 700 800
Hea
t Rel
ease
Rat
e (M
W)
Time from Ignition (s)
Jet A
igni
ted
by p
aper
igni
tion
Car
pet i
gnite
d by
drip
from
cha
ir
Boo
kcas
e fa
lls
NW
sec
tion
of d
esk
c
olla
pses
NE
sec
tion
of d
esk
colla
pses
Figure 3–5b. Annotated partial HRR curve, Test 6, complete generic workstation,
4 L Jet A, 30 percent tile coverage on exposed, upward facing surfaces.

Test Results and Interpretation
NIST NCSTAR 1-5C, WTC Investigation 23
0
2
4
6
8
10
0 500 1000 1500 2000 2500 3000
Hea
t Rel
ease
Rat
e ( M
W)
Time from Ignition (s)
Igniter Off
Figure 3–6a. Complete HRR curve, Test 4, WTC workstation, no Jet A, no tiles.
0
2
4
6
8
10
0 100 200 300 400 500 600 700 800
Hea
t Rel
ease
Rat
e (M
W)
Time from Ignition (s)
Firs
t pap
er ig
nitio
n
Com
pute
r mon
itor i
gnite
sC
hair
& d
esk
surfa
ce ig
nitin
g
Pap
er o
n ea
st s
ide
igni
ting
Cha
ir fir
e ne
ar p
eak
HR
R
Burn
er s
hut o
ff
Figure 3–6b. Annotated partial HRR curve, Test 4, WTC workstation, no Jet A, no tiles.
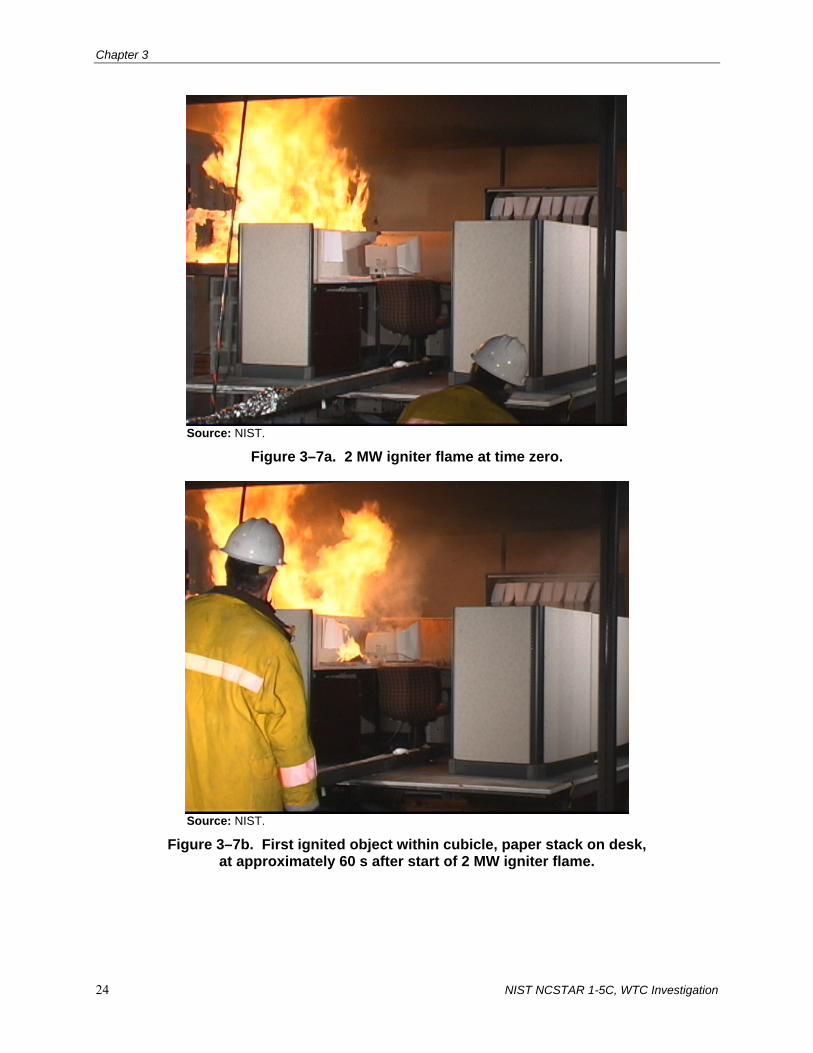
Chapter 3
24 NIST NCSTAR 1-5C, WTC Investigation
Source: NIST.
Figure 3–7a. 2 MW igniter flame at time zero.
Source: NIST.
Figure 3–7b. First ignited object within cubicle, paper stack on desk, at approximately 60 s after start of 2 MW igniter flame.

Test Results and Interpretation
NIST NCSTAR 1-5C, WTC Investigation 25
Source: NIST.
Figure 3–7c. Top of chair back ignited at about 165 s; computer already burning.
Source: NIST.
Figure 3–7d. Collapsing chair fire near its peak at 512 s.

Chapter 3
26 NIST NCSTAR 1-5C, WTC Investigation
Source: NIST.
Figure 3–7e. Work station fire near peak HRR at 533 s.
Source: NIST.
Figure 3–7f. Fire well past peak, with rear desk surfaces collapsed, at 965 s.

Test Results and Interpretation
NIST NCSTAR 1-5C, WTC Investigation 27
Table 3–1. Key results from the workstation fire test burns. Test
Quantity 1 2 3 4 5 6 Workstation ½ Generic Generic Generic WTC Generic Generic Tiles N N Y N N Y Jet fuel N N N N Y Y Peak HRRa (MW) 5.92/5.77 8.70/8.48 7.56/7.30 9.89/9.66 9.12/8.91 7.960/7.60 Time to peak (s) 490 530 590 510 160 200 Net peak HRRa (MW) 3.82/3.67 6.95/6.73 5.53/5.27 7.72/7.46 7.38/7.17 6.17/5.95 Peak MLR (kg/s) 0.197 0.308 0.263 0.420 0.336 0.293 Time to peak (s) 480 530 560 490 160 180 Net heat released (GJ) 1.20 4.05 4.13 2.93 3.60 3.74 Time intervalb (s) 150 to 265 50 to 3200 160 to 600 30 to 2100 0 to 2500 20 to 2520 Total mass loss (kg) 69.1 205.0 213.6 173.6 200.2 205.3 Effective heat of combustion (MJ/kg )
17.4 19.8 19.3 16.9c 18.0 18.2
FWHHd (s) 244 445 318 451 t(75 %)e 1311 1453 833 1009 tig
f (s ) (item ignited) 39 (paper)
67 (paper)
56 (paper)
50 (paper)
90 (Jet A)
114 (paper)
a. The first number is the calorimeter output; the second is a 10 s average about the absolute peak. b. The time interval applies to both the net heat released and to the total mass loss. c. There was some spillage of smoke in Test 4, which may partly account for the lower heat of combustion. d. Full width half height of net HRR curve. e. Time at which 75 percent heat had been released and 75 percent of mass had been lost. f. Time of ignition of first object within workstation.
3.1.2 Heat Release Rate
The HRR was computed from the measured species concentrations and flow measurements using the following equation:
air
OoO
oOH
e
O
COHCOMassc
COOMassc
HCOMassc
MM
XXm
XX
HHHq
2
22
2
222
)1()1(1
]2
1))()(()[( ___
−−+
−−−=
αφ
φ∆∆φ∆
&
&
(3–1)
The oxygen depletion factor,φ , was expressed in terms of the volume fractions of the species in the stack and the volume fraction in the ambient air (indicated by a superscript o) as follows:
oOCOCOO
oCOOCOCO
oO
XXXXXXXXX
222
2222
)1()1()1(
−−−
−−−−=φ (3–2)

Chapter 3
28 NIST NCSTAR 1-5C, WTC Investigation
The terms in the equation are defined below. For the constant parameters, the numerical values used in the calculations were:
HCOMasscH
2_)(∆ = heat of combustion of hydrocarbon fuel, MJ/kg O2 (13.1 MJ/kg)
COOMasscH
2_)(∆ = heat of combustion of carbon monoxide, MJ/kg O2 (17.6 MJ/kg)
em& = mass flow rate in exhaust duct, kg/s
α = combustion products expansion factor (1.10)
Mi = molecular weight of gas i, g/mole (28.967 for air)
3.1.3 Net Heat Release Rate
Comparison of the HRR curves with the direct igniter contribution subtracted allowed more appropriate comparison of the various test conditions. This net HRR, nH& , was computed using the formula:
)()()( tHtHtH ln &&& −= , t < tex
)()()( tHtHtH bgn &&& −= , t ≥ tex
(3–3)
where )(tH& is the total heat release measured by the calorimeter, )(tH l& is the heat released by the liquid
spray burner, and )(tH bg& , the background heat release rate, and tex is the time the spray burner is turned
off. The middle two terms are explained as follows:
• The liquid burner had a approximately 2 MW HRR while operating. The HRR of the burner varied by as much as 20 percent by the time the burner was shut off. The expression for )(tH l
& varied linearly in time from the initial burner HRR value to the final value.
• The HRR is proportional to the change in the O2 volume fraction in the stack. A drift in the oxygen analyzer will appear as a HRR even though there is no fire. Such drifts were small and were represented by a function for )(tH bg
& that varied linearly in time from the apparent heat release before the test, which was very small, to the value at the end of the test when the fire was out.
Figures 3–8 and 3–9 show the plots of net HRR versus time.
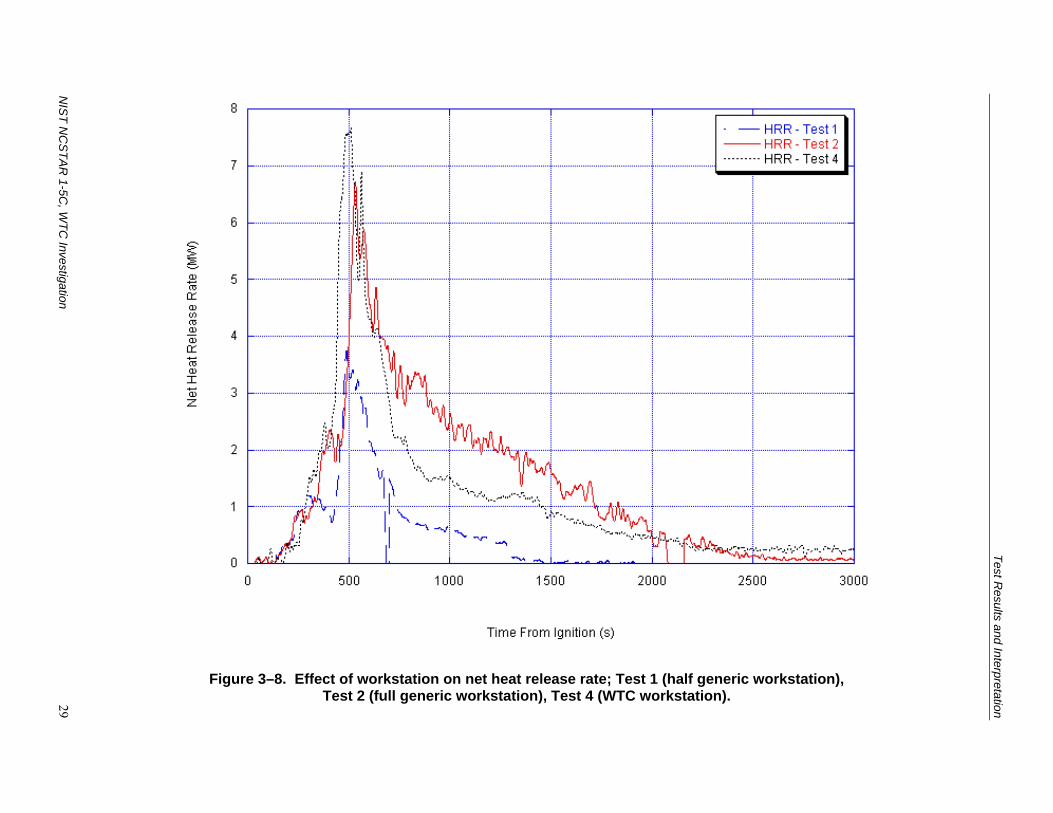
NIS
T NC
STA
R 1-5C
, WTC
Investigation 29
Test R
esults and Interpretation
Figure 3–8. Effect of workstation on net heat release rate; Test 1 (half generic workstation), Test 2 (full generic workstation), Test 4 (WTC workstation).

30 N
IST N
CS
TAR
1-5C, W
TC Investigation
Chapter 3
Figure 3–9. Effect of jet fuel and inert tiles on net heat release rate from a generic workstation; Test 2
(no tiles, no jet fuel), Test 3 (tiles, no jet fuel), Test 5 (no tiles, jet fuel), Test 6 (tiles, jet fuel).

Test Results and Interpretation
NIST NCSTAR 1-5C, WTC Investigation 31
3.1.4 Net Heat Released
The net heat released by the workstation, H, is obtained by integrating the net HRR over the time of the burn.
( ) ( ) dttHtHdttHtHH
f
ex
ex t
tbg
t
tl ∫∫ −+−= )()()()(
0
&&&& (3–4)
where tex is the time the spray burner is turned off and tf is the end of the test.
3.1.5 Mass Loss and Mass Loss Rate
Using a standard plotting routine, the mass loss during each test was plotted as shown in Figs. 3–10 and 3–11. The smooth S-shaped curves are occasionally interrupted by abrupt steps up or down, the result of something falling off the weighing platform (usually one of the privacy panels) and perhaps being replaced.
The mass loss rate (MLR) at time t, Ml(t), was computed as the slope from the best linear fit to the data based on a fixed number of points on each side of the datum point of interest. The best balance between noise suppression and degraded time response was obtained for a linear fit of 15 points on each side of the datum points. Using 5 points or even 10 points would produce significant noise artifacts. The use of 15 points rather than a smaller number of points had less than a 2 percent effect on the peak height or the time of the peak MLR. Other methods for computing MLR, including the direct calculation of ∆m/∆t for time intervals of 10 s, 20 s, and 30 s and the use of a numerical differentiation algorithm, were tried, but they produced a slightly noisier fit for the same averaging interval.
The MLR histories were then compared with the net heat release rate curves, as indicated in Figs. 3–12 through 3–16. The abrupt steps in the mass loss arising from objects falling off the load cell appear as large discontinuities in the MLR in these figures. For ease of viewing these have been removed from all but Fig. 3–12, where they have been left for demonstration purposes.
For a single, homogeneous material, the MLR would follow the HRR, with the proportionality being the heat of combustion. Here the workstation includes a mix of materials with differing heats of combustion and differing, time-dependent, individual MLR s that sum to the whole and the correlation between the two need not be rigidly fixed. Nonetheless, the agreement is surprisingly good, reflecting the concurrent burning of multiple cubicle components after the initial buildup.

32 N
IST N
CS
TAR
1-5C, W
TC Investigation
Chapter 3
Figure 3–10. Effect of workstation on mass loss; Test 1 (half generic workstation), Test 2
(full generic workstation), Test 4 (WTC workstation).
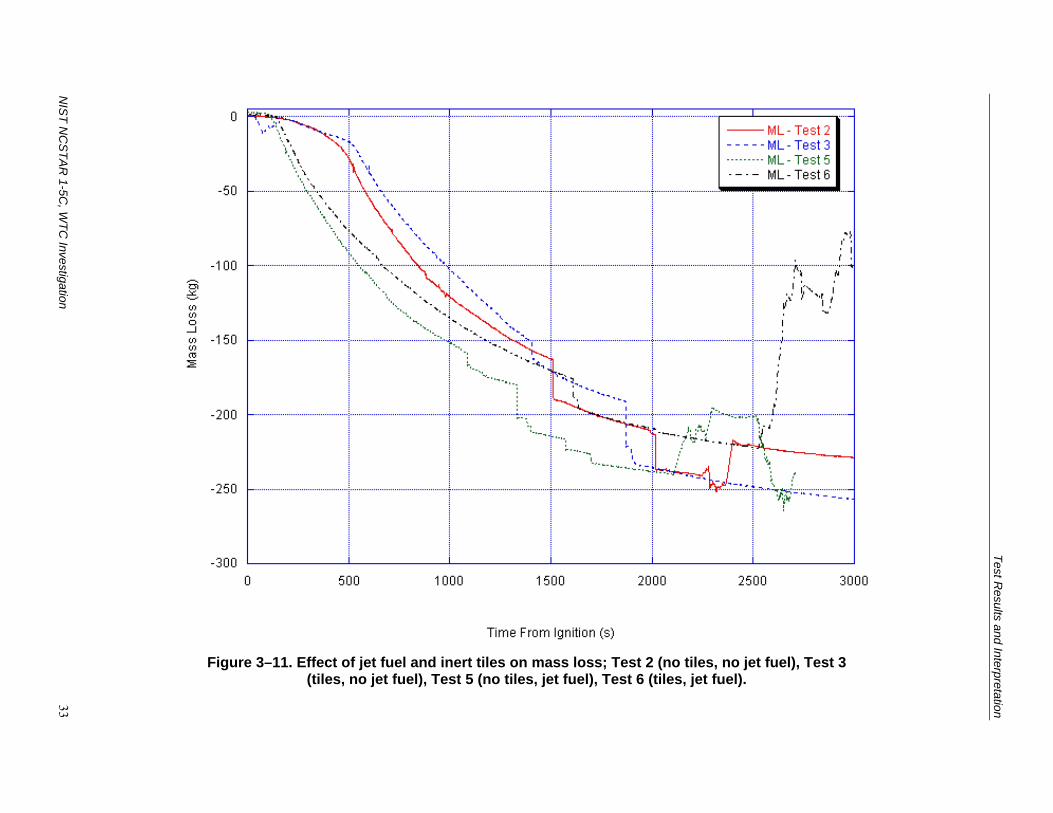
NIS
T NC
STA
R 1-5C
, WTC
Investigation 33
Test R
esults and Interpretation
Figure 3–11. Effect of jet fuel and inert tiles on mass loss; Test 2 (no tiles, no jet fuel), Test 3
(tiles, no jet fuel), Test 5 (no tiles, jet fuel), Test 6 (tiles, jet fuel).
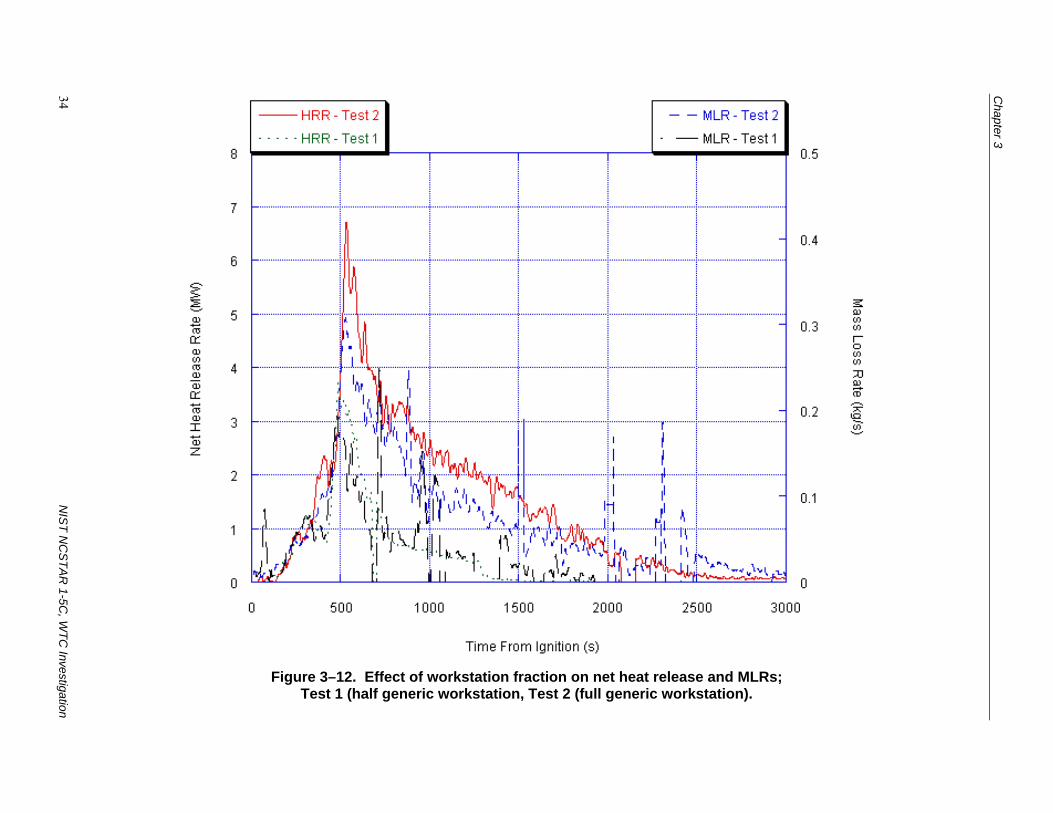
34 N
IST N
CS
TAR
1-5C, W
TC Investigation
Chapter 3
Figure 3–12. Effect of workstation fraction on net heat release and MLRs;
Test 1 (half generic workstation, Test 2 (full generic workstation).

NIS
T NC
STA
R 1-5C
, WTC
Investigation 35
Test R
esults and Interpretation
Figure 3–13. Effect of inert tiles on net heat release and MLRs;
Test 2 (no tiles, no jet fuel), Test 3 (tiles, no jet fuel).

36 N
IST N
CS
TAR
1-5C, W
TC Investigation
Chapter 3
Figure 3–14. Effect of workstation style on net heat release and MLRs;
Test 2 (generic workstation), Test 4 (WTC workstation).

NIS
T NC
STA
R 1-5C
, WTC
Investigation 37
Test R
esults and Interpretation
Figure 3–15. Effect of jet fuel on net heat release and MLRs; Test 2
(no tiles, no jet fuel), Test 5 (no tiles, jet fuel).

38 N
IST N
CS
TAR
1-5C, W
TC Investigation
Chapter 3
Figure 3–16. Effect of both jet fuel and inert tiles on net heat release and mass
loss rates; Test 2 (no tiles, no jet fuel), Test 6 (tiles, jet fuel).

Test Results and Interpretation
NIST NCSTAR 1-5C, WTC Investigation 39
3.1.6 Effective Heat of Combustion
Two methods were used for determining the effective heat of combustion. The first was to compute the total heat release and the total mass loss over an interval of time and then take the ratio. These results are included in Table 3–1. The second method was to compute the ratio of the net HRR to the MLR at each second of time. Before computing the ratio, a 10 s smoothing of the data was applied. For each datum, the five points prior and the five points after were averaged with the datum. As expected, this differential approach varied widely with time but did provide insight on the time dependence of the heat of combustion.
Figure 3–17 shows the results are noisy due to taking the ratio of two quantities, each with appreciable noise. It also shows some time variation, starting somewhat below 20 MJ/kg and increasing gradually to roughly 25 MJ/kg. The discontinuity around 1500 s is the result of a panel falling off the weighing platform. The heat of combustion was separately computed based on the net heat released during the intervals over which the mass decreased 0 kg to 50 kg and 100 kg to 150 kg. The heat of combustion increased from 18.4 MJ/kg to 22.6 MJ/kg over these intervals. Part of the reason for the low initial value for the plotted heat of combustion is a slight offset between the MLR and HRR. Early in the fire development there may be pyrolysis gases leaving the workstation without combusting. Late in the fire, when the effective heat of combustion has risen, the only things burning are charred cellulosic materials (wood and paper). Such a rise is seen only at the end of the cone calorimeter tests with these materials.
0
10
20
30
40
400 800 1200 1600
Hea
t of C
ombu
stio
n (M
J/kg
)
Time from ignition (s)
Figure 3–17. Heat of combustion vs. time for Test 2 (no jet A, no tiles).
3.2 FIRE GROWTH BEHAVIOR
The following text presents observations of the progress of the fires in the set of tests. The purpose is to characterize the phenomena that controlled the spread of flame on workstation components and the spread

Chapter 3
40 NIST NCSTAR 1-5C, WTC Investigation
from component to component. Some of these phenomena are not included, or even capable of being included, in a computational model of current sophistication. In those cases, an effort was made to estimate whether the phenomenon was likely to be a significant contributor to the shape or magnitude of the HRR curve over time. These estimates were then considered when evaluating the viability of FDS for simulating the thermal environment from the combustion of fuel packages such as those tested here.
3.2.1 Role of the Ignition Burner
The HRR curves all began with an abrupt step up to approximately 2 MW when the heptane burner was ignited. There was an immediate bathing of the cubicle surfaces with radiant energy from this flame, as indicated by a floor flux gage reading of 5 kW/m2 in Test 1. This irradiance reaching workstation surfaces from this source was greatest early in the test, before the workstation reached its peak burning rate. The later falloff was due to (a) the workstation surfaces eventually collapsing downward away from the igniter flames and (b) the workstation flames being nearly optically thick (and thus opaque to the igniter radiation) near the peak burning stage.
Generally, the ignition burner was turned off well past the peak HRR was reached. By then, the combustion of the collapsed pile of burning debris was minimally dependent on the extra radiation. In Test 4, the burner was turned off near the peak HRR because the hood capacity could be exceeded. Some insight into the effect of turning off the igniter early can be gained from examining the net HRR curves from Test 2 (generic workstation) and Test 4 (WTC workstation) (Fig. 3–14). In Test 2, the burner was kept on for at least 2000 s; in Test 4, the burner was turned off at approximately 575 s, just after the HRR peak. The burner did not actually turn off abruptly, and a sharp decrease in the Test 4 HRR can be seen in the 2 min following the act of turning off the fuel. The HRR curve for Test 4 drops significantly below the curve for Test 2. This difference in area between the two curves was larger than can be explained by the small differences in combustible mass and material composition between the two workstations. It more likely reflected the loss of the boosting radiation from the burner.
3.2.2 Growth to the HRR Peak without Jet Fuel Present
In Tests 1 through 4, there was a fairly reproducible progression of ignition events leading up to the HRR peak. These are typified by the sequence of photos from Test 2, starting with the source fire at time zero (Fig. 3–7a), through the first ignition of an item within the cubicle (Fig. 3–7b), some secondary ignitions (Fig. 3–7c), reaching the peak HRR of the collapsing chair (Fig. 3–7d), then the fire peak itself (Fig. 3–7e) and, finally, a late stage with some of the surfaces collapsed (Fig. 3–7f).
The igniter flame bathed the entire workstation in radiant heat. FDS simulations suggest that the peak fluxes on the side of the desk top toward the igniter were of the order of 30 kW/m2 or more. This was well above the minimum flux for piloted ignition2 of the various exposed surfaces there (Table A–2). However, the visual evidence indicated that the igniter flame, despite its size, was not able to function as a pilot for any of the workstation components. The igniter was too removed from the irradiated fuels to be effective. Rather, non-piloted ignition, or autoignition, or pyrolysis vapors appeared to be the initiating event. This is despite the fact that the minimum radiant flux for autoignition of solid materials
2 Piloted ignition means that there is, in the gas phase very near the igniting object, some heat source sufficient to initiate a flame
in the gases evolving from a fuel surface as soon as those gases form a flammable mixture with ambient air.

Test Results and Interpretation
NIST NCSTAR 1-5C, WTC Investigation 41
tends to be much higher than that for piloted ignition. Boonmee and Quintiere (2001), for example, found that a bare wood surface required a radiant flux of about 40 kW/m2 for non-piloted ignition. Other materials would be more susceptible and within the range of the irradiances imposed by the spray burner.
• While the fabric might be expected to ignite first since a portion of it was initially within approximately 5 cm (2 in.) of the igniter, it melted and curled downward toward the rear edge of the desk top, igniting only later.
• The top of the computer monitor shell, which gasified extensively only 20 cm (8 in.) from the spray burner flames, did not appear to ever have been directly ignited by those flames.
• Instead, the progression of flaming was initiated by the top sheets on the paper stacks, mid-length along the side nearest the spray burner. These sheets are able to autoignite by charring, curling upward to escape the heat sinking and oxygen blocking effects of the lower sheets, glowing, and then transitioning into flaming combustion. The paper was the only material present in the workstations that exhibited such an autoignition process. Because the paper was present in many places, it was highly instrumental in spreading the flames over the area at and above the desktop.
The flames on the paper stacks then piloted the ignition of the computer monitor shell, the desktop, and the top of the chair back. Later, paper ignition brought flames to the two other sides of the desk area in the workstation. Once ignited by the paper, the chair fire spread from the top of the back to the arms and seat. The fabric on the chairs used in the basic workstation was a char former, possibly cotton-based. Such a fabric might autoignite via a glowing char oxidation reaction. However, the paper seemed to pilot the chair top ignition in cases where that process could be observed. Invariably, some flaming material would then fall from the burning arm or seat onto the carpet, providing a local pilot there. The subsequent spread on the carpet was delayed until the chair was fully involved, along with the remainder of the upward-facing surfaces of the desktop.
The inward-facing surfaces of the wall panels were not important here since the only combustible external component on the panels of the generic workstation was the thermoplastic fabric. This fabric consistently melted and rolled downward into a mass having much less surface area than the original fabric prior to igniting. While it undoubtedly was burning at the HRR peak, its drastically reduced surface area would make its contribution negligible. The fabric on the actual WTC workstation behaved similarly. This type of behavior is not captured in cone calorimeter tests.
The behavior of the chair was critical to the rapid engulfment of the lower compartment in flames. As noted previously, the chair was largely composed of thermoplastic materials. When only the upholstered surfaces of its seat and back were burning it retained its original shape and little of its heat reached the lower compartment area. One corner of the seat was deliberately placed approximately 15 cm (6 in.) under the desk surface, under the area on which the computer keyboard rested. This was to promote some heat reaching this space early in the fire; however, the flames contacted the relatively ignition resistant underside of the desk. Only as the support shell of the chair began to melt and flow to the floor did the flaming chair approach its peak burning rate. Because the chair had a partial steel skeleton, the burning process, at its maximum, was three dimensional, extending from desk level to floor level and involving the carpet under the chair, as well. It radiated strongly into the space beneath the desk as well as directing an increased portion of its fire plume into this space. This quickly ignited the carpet and underside of the

Chapter 3
42 NIST NCSTAR 1-5C, WTC Investigation
desk (plus the wastebasket and the combustible face of the computer processor enclosure) leading directly to the rapid upward step in HRR immediately prior to the peak seen in Figs. 3–1, 3–2, 3–3, and 3–6. This burning behavior of the chair cannot be inferred from the cone calorimeter data obtained on the chair materials (Appendix A). Empirical treatment of its HRR process is necessary.
The progress of the ignited workstation toward the peak HRR behaved as if composed of two zones. The first was the entire volume at and above the top of the desk surface, capped on top by the false ceiling above the workstation. Typically, this zone became fully involved first in the sense that all combustible surfaces ignited. The second zone was that volume at and below the underside surface of the desk. It reached a point of local flashover when subjected to the radiant heat flux from the upper zone and hot ceiling layer but especially the heat from the burning chair. When all flammable surfaces in both zones were ignited, the HRR quickly peaked.
Madrzykowski (1996, 1998) also noted this correspondence of the peak HRR and the simultaneous burning of all the accessible combustible surfaces in the workstation interior. He attempted to combine this type of observation with cone calorimeter HRR measurements and the known areas of the different fuels that were burning to predict the peak HRR value with limited success. The difficulty in doing this was that these various surfaces saw a range of heat fluxes and thus there was no firm basis for applying the cone calorimeter HRR data, which are sensitive to the irradiance.
3.2.3 Effect of Jet Fuel on the Growth to the HRR Peak
The presence of Jet A might be expected to short circuit this whole sequence and lead to an almost explosive engulfment of the entire workstation. Indeed, the time to the peak HRR was shortened considerably. However, there was a delay in the ignition of the cubicle combustibles.
The flash point of Jet A is in the range of 43° C to 66° C; thus, there was no flammable mixture of vapor above it at the beginning of the test when the cubicle was at ambient temperature. As the test proceeded, the strong radiant flux from the spray burner quickly overcame this deficit in temperature, in spite of the cooling effect that the vaporization process provided, and the videos showed an increasingly dense aerosol rising from the various wetted surfaces near the spray burner. However, this aerosol did not ignite; evidently turbulent mixing of the vapor plume above the surfaces quickly diluted it to below the flammable limit. Rather, in Test 5, a random piece of flaming material rose from the burner area and drifted down on top of the desk, immediately igniting the Jet A. A flaming piece of debris also arose from the burner in Test 6, but it landed on top of the bookcase where there was no Jet A, and it had no effect. In Test 6, the tops of the paper stacks mid-length along the side next to the spray burner finally dried out and began to char and then transitioned into flaming, igniting the Jet A. Thus, in this case, the presence of Jet A and the evaporative cooling effect it provided pushed this paper auto-ignition mechanism back from the 40 s to 70 s seen in “dry” tests to 150 s. Presumably, more Jet A could have delayed this mechanism longer. Of course, the presence of any other type of pilot flame close to the wetted surfaces could have greatly shortened the ignition delay.
This was a strong indication of the difficulty of predicting ignition in many room fire growth situations. Even a fuel as volatile as Jet A yielded only a relatively small spatial zone in which a flammable vapor mixture existed, and it was difficult for nearby flames to reach that zone and ignite that mixture before air turbulence diluted it. In the absence of a char that got much hotter than the fuel surface and thereby

Test Results and Interpretation
NIST NCSTAR 1-5C, WTC Investigation 43
autoignited the fuel, ignition of the fuel vapor might be delayed indefinitely. Use of the cone calorimeter to obtain ignition delay time data for use in a fire growth model could thus be seriously misleading in some cases since the pilot is placed directly in the pyrolyzate plume in order to produce ignition at the earliest possible time.
Once the Jet A ignited locally, the flames spread rapidly but not continuously along the desktop. Presumably, the initial evaporation period left some dry spots that interrupted the spread. The same turbulent vapor plume dilution process discussed above prevented flames from jumping downward to the carpet from the flaming desk surface, even though the carpet was emitting a visible aerosol. The carpet ignited when, as in the “dry” tests, the chair fire dropped a flaming pilot to the floor. Here, however, the subsequent flame spread on the carpet was rapid. None of these steps was distinguishable in the HRR curves of Figs. 3–5 and 3–6; the HRR curves jumped rapidly to their peak values soon after the Jet A ignited since the time span over which the separate steps occurred was compressed. Here again, the peak corresponded to all accessible combustible surfaces burning simultaneously.
3.2.4 Post-Peak Behavior
The rather rapid decay in HRR after all of the peaks reflects several factors.
• The chair fire rapidly collapsed to a pool fire on the floor, and the reduced burning surface area meant a reduced HRR.
• The various paper piles developed a thick ash layer that drove down their burning rate.
• Similarly, char formation on the desk surfaces drove down their burning rates.
• The carpet began to burn out.
As the various cubicle components became physically weakened by the fire, their geometric arrangement changed. The computer monitor shell was the first item to change shape, with the top of the shell melted and draped down over the CRT even before ignition. However, its peak HRR was probably less than 200 kW. Next came the chair melt down, as mentioned above. The front of the bookcase, resting on top of that unit, typically fell next. The fates of the bookcase itself and its 13 reams of paper were much more difficult to discern through the flames. It sometimes appeared to come down at the same time as the bookcase front panel and sometimes it came down distinctly later. The desk surface bowed progressively as it charred through and then it collapsed, with separate sections doing so at differing times. The initial desk collapse did little to change the available burning surface area and thus probably did not greatly affect its burning rate. However, ultimately what was left was a complex rubble pile. Similarly, the wall panels collapsed at random times, both inward and outward, typically rather late in the fire.
These changes led to departures from the burning rates based on the original surface areas coupled with cone calorimeter data. The further past the peak of the HRR curve, the less the burning rate was predictable by an FDS calculation that retained the original cubicle geometry. Fortunately, the most serious disagreements (other than the complex chair collapse) should not begin until well after the desk surfaces collapse.

Chapter 3
44 NIST NCSTAR 1-5C, WTC Investigation
In all tests, the paper stacks both in the file cabinets and on the desktop above the file cabinets were comparatively undisturbed by the collapse of the workstation. The paper was one of the longer flaming items, since it formed a thick layer of insulating residue that slowed the involvement of the deeper layers. The paper stacks on the desktop appeared to roughly double in thickness as a result of this residue formation. In cases noted below, measurements were made of the residual mass of these stacks after the bulk of the fire had been extinguished. Often these paper stacks continued to smolder right up to the time they were weighed (i.e., they were continuing to lose weight slowly).
An implication of this behavior is that the tail of the fire would be expected to be more intense and continue for a longer time in a workstation having more paper than that used here. In particular, these same workstations might have had a longer fire tail had their file cabinets been full of paper. The greater mass combined with the more restricted air supply in a filled file cabinet could be expected to slow the burning process. Relative to the generic workstation, the WTC workstation had a file cabinet design that allowed more air access to the filled file drawers, once the drawer facing burned off. This could possibly have supported more extensive burning of paper.
The consumed mass fractions of paper were as follows (averaged from replicate measurements in Tests 2, 3, and 4, none of which involved Jet A).
Paper on desk: mass fraction burned = 0.52, 0.68
Paper in file cabinets: mass fraction burned = 0.31, 0.44, 0.30
The higher mass fraction of file drawer paper consumption occurred with the WTC workstation. The paper stacks on the desk were those in the southwest corner of the cubicle and involved three side-by-side horizontal layers, each one ream thick. In all cases there was some uncharred paper in the center of the stacks. Since paper is a thermally thin material with a large surface to volume ratio, it has the potential to burn very rapidly if it is dispersed so as to expose this large surface. However, no such dispersal happened here. Instead, the compactness of the paper stacks led to an opposite extreme of behavior and incomplete combustion.
3.3 PEAK HRR VALUES AND TIMES TO PEAK VALUES
Table 3–1 lists the peak HRR values and the times at which they were reached. The HRR peak is given in two ways: (1) as the absolute highest single reading recorded (for a 1 s interval) and (2) as the average of the value at this peak plus values up to 5 s to either side of this peak (total of 11 data points). The latter compensated for both noise in the calorimeter system and in the fire itself. Use of these damped values was appropriate since the principal combustibles in a serious fire have thermal inertias that cannot respond to small HRR fluctuations that are under 10 s in duration. The damped values were all lower than the absolute peak values (by approximately 2 percent to 4 percent) due to the sharpness of the peaks.

Test Results and Interpretation
NIST NCSTAR 1-5C, WTC Investigation 45
A few points emerged from Table 3–1 when the various numbers were compared.
• The half workstation yielded a peak fire intensity that was about two-thirds that of the full workstation. This was primarily the result of two factors:
− The same chair was present in both cases; this chair had an estimated HRR peak of ½ MW by itself.
− Twice as much of the carpet in the second “half” of the workstation was covered by inert steel file cabinets, precluding its participation in the HRR peak. This lowered the HRR contribution from the second half of the workstation.
The computer was also totally within the half workstation, though this was a substantially lesser heat source than was the chair.
• Coverage of 30 percent of the upward facing horizontal surfaces by inert tiles slightly increased the time to the HRR peak and decreased the peak HRR value by only approximately 14 percent. These tiles effectively prevented direct burning of the surfaces on which they lay. As described above, the overall HRR peak occurred when all accessible flammable surfaces were burning. The tiles did not cover any fraction of such surfaces as the underside of the desk, the carpeting below the desk, or the underside and back of the chair. Their percent reduction in HRR was, in fact, roughly comparable to their percent coverage of the total accessible combustible surface area of the workstation (approximately 20 percent). Thus, their effect on the peak fire size was roughly linear in fractional area coverage. Exact linearity was not expected since differing materials have differing HRR per unit area contributions. The response might have become strongly non-linear (in the direction of greater suppressive effect) in a more extreme case where nearly all of the upward facing horizontal surfaces were covered, since this could preclude the progressive flame spread that gets all accessible surfaces involved.
• The presence of 4 L of Jet A led to a dramatic decrease in the times to peak HRR, from approximately10 min to approximately 3 min. This was the result of the Jet A shortening the time to involvement of all accessible combustible surfaces. The peak itself was boosted upward by only approximately 5 percent, presumably because the Jet A helped boost the overall fuel gasification rate somewhat while adding its high heat of combustion. For comparison, a pool of pure Jet A having an area equal to that of the plan view area of the cubicle (5.9 m2, 64 ft2) would have yielded a steady heat release rate of 13.1 MW (Mudan and Croce 1995). Though Jet A covered a comparable area here, it was a very thin layer, either on the high-heat-sink desk surface or soaked into the carpet; this kept its burning rate down. When the inert tiles were also present, the Jet A was poured across their top surfaces, temporarily rendering these surfaces flammable. Because the tiles were porous, the Jet A burning rate on them was reduced, however, and the tiles still managed to produce an approximately 15 percent reduction in the peak HRR relative to the case with Jet A and no tiles.

Chapter 3
46 NIST NCSTAR 1-5C, WTC Investigation
Figure 3–18 shows the temporal alignment at the peak of various measures of fire intensity in Test 5. Each of the measures has been normalized by its maximum value. The five measures are: HRR, MLR, carbon dioxide volume fraction in the exhaust gases, temperature of the exhaust gases, and radiant flux seen by the gage viewing the entire fire from the south side of the cubicle. The radiometer was the fastest responding instrument with a 1 s time constant.
0
0.2
0.4
0.6
0.8
1
100 120 140 160 180 200 220 240
Qua
ntity
/Pea
k va
lue
Time from ignition (s)
Mass loss rate
Duct temperature
Heat release rate (black)Vol. fraction CO
2 (green)
Radiometer output
Figure 3–18. A comparison of five measures of fire intensity.
The five measures presented a consistent representation of the progress of the fire, given their individual measurement characteristics as noted in the following bullets:
• HRR and CO2 concentration rose together and remained close throughout the test. This is reasonable since CO2 was the major carbon-containing product of combustion. The slight dip in the post-peak HRR curve relative to the CO2 concentration curve is within the uncertainty of the measurements. However, if it were real, it probably resulted from the higher H:C ratio of the wood-based fuels that dominated the later burning compared to the wood and plastics that shared the earlier burning. The combustion of the hydrogen atoms to form water contributed to the HRR without generating CO2.
• These two peaks lagged the radiant flux signal peak by roughly 5 s, though the noise in the latter made this somewhat ambiguous. The time response of the radiometer was about 0.2 s compared to about a 10 s response time of the calorimeter. A 10 s smoothing of the peak radiometer data (5 data points before and after the point being smoothed) was used to simulate the time response of the calorimeter. The ratio of the smoothed value to the peak was 0.94 based on Tests 4, 5, and 6 and a value of 0.97 for the calorimeter. This result implied that the calorimeter, due to its 10 s time response, underestimated the peak by about 3 percent. In principle, if the radiant flux perfectly reflected the total HRR of the fire and the

Test Results and Interpretation
NIST NCSTAR 1-5C, WTC Investigation 47
calorimeter system time lags were fully accounted for, the HRR peak and radiant flux peak should have coincided. However, perfect coincidence would have required an optically thin fire in full view of the radiometer. Here, the fire was approaching optically thick, and parts of the flames were blocked from radiometer view by components of the workstation. Thus, in practice, there is no guarantee that with a fire of this size and spatial complexity the radiant flux to an external point completely reflects the instantaneous total HRR in the volume it views. It was also possible that calorimeter time response (in addition to the compensated system flow time lag) was partly responsible for the apparent time lag between the radiometer and HRR peaks. In the case of the exhaust gas temperature, thermal lags in the duct, due to heat loss to the duct walls, were the source of the slowed response.
• The rise in the MLR curve preceded the HRR curve by about 25 s and the radiant flux curve by about 15 s. This was likely a result of mass loss by evaporation of the Jet A (and other pyrolysis processes) that yielded a net mass loss in excess of what was actually burning.
3.4 SIGNIFICANCE OF TEST VARIABLES
3.4.1 Effects of Surface Coverage and Jet Fuel
Because this set of tests included a full factorial design for the effects of tile coverage and Jet A, it was possible to perform a sensitivity analysis of how the various burning characteristics of the workstation depend on these two factors (Box, Hunter, and Hunter 1978). The factorial design is illustrated in Fig. 3–19 with a box for which the lower left corner corresponds to the parameter set with no tiles or Jet A (T−J−), the lower right to tiles and no Jet A (T+J−), etc. To obtain the sensitivity of the workstation fire behavior to the 30 percent tile coverage (of upward facing, exposed surfaces), one computes the horizontal differences between the response values for the left and right hand sides. The response difference values shown below are for the peak HRR. The least square estimate for the sensitivity factor response for the tile coverage, βT, is identically the average (-1.15) of these two differences (-1.14 and -1.16) normalized by the average (8.34) of the data; this value is equal to -13.8 percent. A similar analysis for Jet A leads to βJ = 4.9 percent. The interaction sensitivity response, βI, is equal to the difference between the average of the right diagonal terms and the average of the left diagonal terms divided by the four corner average and is equal to a value of -0.1 percent. This relatively small value of the interaction sensitivity indicates that the tiles and Jet A are nearly independent factors. That is, the effect of the tiles on the burning rate of the cubicle is almost independent of the presence or absence of the Jet A. Note that the sensitivity factor responses calculated here are for the specific levels of change in the tile coverage or Jet A factors in these tests.

Chapter 3
48 NIST NCSTAR 1-5C, WTC Investigation
Figure 3–19. Interaction of test variables in determining peak HRR.
Table 3–2 provides a complete listing of the sensitivity factors for the various measured quantities. These are the percentage changes in the indicated fire quantities resulting from either a 30 percent coverage of upward facing horizontal surfaces with inert tiles or from adding 4 L of Jet A to horizontal surfaces of the generic work station. The interaction sensitivity measures the additional effect of making both changes at the same time.
Table 3–2. Sensitivity analysis factors.
Quantity Mean Value
βT, Sensitivity Factor Response
for Tile (%)
βJ, Sensitivity Factor Response
for Jet A (%)
βI, Interaction Sensitivity Factor
Response (%)
Instantaneous peak HRR (MW) 8.34 -13.9 5.0 -0.1 10 s average peak HRR (MW) 8.11 -14.4 5.5 0.2 Time to instantaneous peak HRR (s)
370 13.5 102.7 -2.7
Net instantaneous peak HRR (MW) 6.51 -20.2 8.2 1.6 Net 10 s average peak HRR (MW) 6.28 -21.3 8.9 1.9 Peak MLR (kg/s) 0.30 -14.7 9.7 0.3 Time to peak MLR (s) 357 7.0 -104.9 -1.4 Net heat released (GJ) 3.88 2.8 -10.8 0.8 Total mass loss (kg) 206 3.4 -3.4 -1.0 Heat of combustion (MJ/kg) 18.8 -0.8 -7.7 1.9
It is seen from this table that for the time to instantaneous peak HRR response and for the time to peak MLR response, the Jet A factor had the largest effect (both in excess of 100 percent ). For the net instantaneous peak HRR and the net 10 s average peak HRR, the tile factor had the largest effect (-20.2 percent and -21.3 percent, respectively). Also it is noteworthy that there was less than a 5 percent
T+J−
T+J++
T−J−
T−J+
-1.14
0.40
8.338.34
0.42 Jet A
Tiles

Test Results and Interpretation
NIST NCSTAR 1-5C, WTC Investigation 49
sensitivity of the total mass loss to either Jet A or tiles. The importance of this result will be explained in the next section.
The sensitivity factors were based on experiments with 30 percent tile coverage of upward facing surfaces and 4 L of Jet A. The effect of smaller coverage and a smaller amount of Jet A can be estimated using a linear interpolation, that is, a 15 percent tile coverage would result in sensitivity factors equal to half the values of those listed in Table 3–2. This can only be extrapolated to larger tile coverage or Jet A quantity with caution because it is empirical, not physical, in basis. Furthermore, it applies only to the specific arrangement and materials used here.
Another important observation is that the interaction sensitivity is in all cases less than 3 percent for all 10 parameters. This indicated that the effect of the coverage factor and the Jet A were independent factors in determining the full complement of flammability parameters in Table 3–2. This finding was exploited in assessing the uncertainty regarding the repeatability of the tests.
3.4.2 Sensitivity to Loading of Jet Fuel
In the fires in the twin towers, the distribution of jet fuel was likely to have been uneven. It is also likely that the burning behavior of a workstation would be affected by the initial presence of differing amounts of jet fuel. This study examined only the effect of the addition of one amount of jet fuel on the burning behavior of the workstation. This level was comparable to the uniform coverage of the five affected floors with Jet A from about half of the fuel in the aircraft. The following discussion offers some insight into the effects of underestimating or overestimating the volume of jet fuel present when modeling the WTC fires.
• The presence of a lower volume of jet fuel would be likely to have had a less than linear effect on the peak HRR value. In Test 5, the addition of 4 L (1.06 gal) of Jet A uniformly to the surfaces of the generic workstation resulted in a 6 percent increase in the peak HRR over the value from Test 2. The addition of, for example, half that amount would have resulted in an increase of less than 3 percent in the peak HRR value because some amount of fuel would have been consumed before the peak intensity was reached and that amount would make no contribution to the peak itself. Since the effect of 4 L of Jet A on the peak HRR was small, the HRR results would not have been likely to have been sensitive to lower volumes of added jet fuel.
• The presence of a larger volume of jet fuel would be likely to have a greater than linear effect on the peak HRR value. This is because the quantity of fuel consumed during the build-up to the peak HRR would become a smaller fraction of the total volume added and the volume of fuel remaining for pool-like burning at the peak would be disproportionately higher. An upper bound to the sensitivity, in the context of a doubled amount of Jet A, was estimated as follows:
− The overall HRR was approximated as the sum of the jet fuel “pool” HRR and the HRR from the burning of the areas not covered with jet fuel (carpet under work surface, underside of work surface, vertical section of chair, and bookshelf). It was assumed that the wetted and unwetted surfaces were equal.
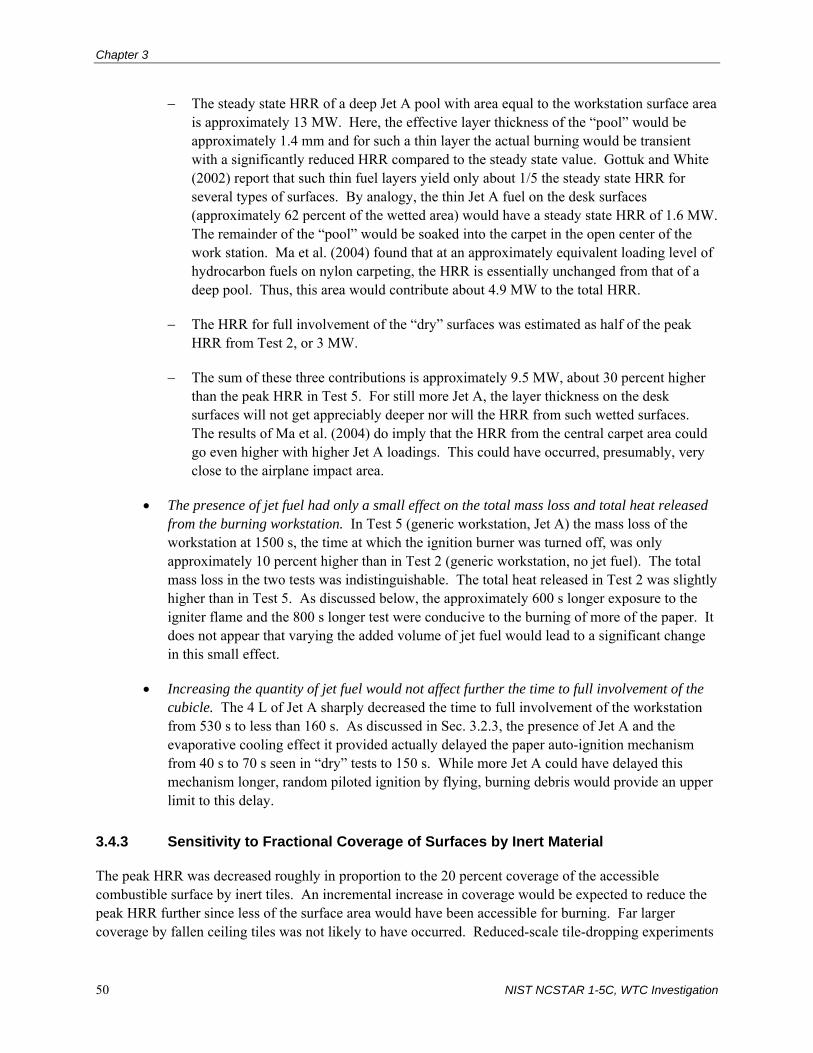
Chapter 3
50 NIST NCSTAR 1-5C, WTC Investigation
− The steady state HRR of a deep Jet A pool with area equal to the workstation surface area is approximately 13 MW. Here, the effective layer thickness of the “pool” would be approximately 1.4 mm and for such a thin layer the actual burning would be transient with a significantly reduced HRR compared to the steady state value. Gottuk and White (2002) report that such thin fuel layers yield only about 1/5 the steady state HRR for several types of surfaces. By analogy, the thin Jet A fuel on the desk surfaces (approximately 62 percent of the wetted area) would have a steady state HRR of 1.6 MW. The remainder of the “pool” would be soaked into the carpet in the open center of the work station. Ma et al. (2004) found that at an approximately equivalent loading level of hydrocarbon fuels on nylon carpeting, the HRR is essentially unchanged from that of a deep pool. Thus, this area would contribute about 4.9 MW to the total HRR.
− The HRR for full involvement of the “dry” surfaces was estimated as half of the peak HRR from Test 2, or 3 MW.
− The sum of these three contributions is approximately 9.5 MW, about 30 percent higher than the peak HRR in Test 5. For still more Jet A, the layer thickness on the desk surfaces will not get appreciably deeper nor will the HRR from such wetted surfaces. The results of Ma et al. (2004) do imply that the HRR from the central carpet area could go even higher with higher Jet A loadings. This could have occurred, presumably, very close to the airplane impact area.
• The presence of jet fuel had only a small effect on the total mass loss and total heat released from the burning workstation. In Test 5 (generic workstation, Jet A) the mass loss of the workstation at 1500 s, the time at which the ignition burner was turned off, was only approximately 10 percent higher than in Test 2 (generic workstation, no jet fuel). The total mass loss in the two tests was indistinguishable. The total heat released in Test 2 was slightly higher than in Test 5. As discussed below, the approximately 600 s longer exposure to the igniter flame and the 800 s longer test were conducive to the burning of more of the paper. It does not appear that varying the added volume of jet fuel would lead to a significant change in this small effect.
• Increasing the quantity of jet fuel would not affect further the time to full involvement of the cubicle. The 4 L of Jet A sharply decreased the time to full involvement of the workstation from 530 s to less than 160 s. As discussed in Sec. 3.2.3, the presence of Jet A and the evaporative cooling effect it provided actually delayed the paper auto-ignition mechanism from 40 s to 70 s seen in “dry” tests to 150 s. While more Jet A could have delayed this mechanism longer, random piloted ignition by flying, burning debris would provide an upper limit to this delay.
3.4.3 Sensitivity to Fractional Coverage of Surfaces by Inert Material
The peak HRR was decreased roughly in proportion to the 20 percent coverage of the accessible combustible surface by inert tiles. An incremental increase in coverage would be expected to reduce the peak HRR further since less of the surface area would have been accessible for burning. Far larger coverage by fallen ceiling tiles was not likely to have occurred. Reduced-scale tile-dropping experiments

Test Results and Interpretation
NIST NCSTAR 1-5C, WTC Investigation 51
pointed to a tendency for ceiling tiles to accumulate preferentially on the open central area of the carpet on the cubicle floor, covering roughly two thirds of this area. Only about one-third of the desk surface became covered (Ohlemiller 2004). Vertical and underside combustible surfaces of the workstations remained uncovered.
Comparison of the total heat released in the tests showed no effect of this degree of coverage by inert material. The fire, aided by thermal radiation from the hot ceiling layer, was able to sustain the burning albeit at a slower rate.
Blanketing of the cubicles by small fragments of fallen ceiling tiles and shattered wallboard panels could have precluded the progressive flame spread that led to flame involvement of all accessible surfaces. However, there were clearly locations in the towers where intense fires existed and grew, and these were the most likely regions in which the thermal environment would have had the best opportunity to weaken the local structural components.
3.4.4 Sensitivity to Mass of Paper Products
The presence of paper on the cubicle surfaces was instrumental in the ignition of the heavier workstation components. Variation in the mass of paper is not likely to have had a substantial effect on this role. However, the total absence of exposed paper would have delayed the workstation ignition until the next most susceptible component autoignited or random flaming debris from adjacent fire areas served as a pilot.
By contrast, incorrect estimation of the mass of paper would affect the total heat released. Filling the filing cabinets in the cubicle could have added 150 kg of paper and increased the total heat released from 3.9 GJ to 4.8 GJ (based on an upper bound estimate of 30 percent of the mass of this additional paper being consumed). There would not likely be a significant increase in the peak HRR due to the poor air supply to the paper in the file cabinets. However, the additional heat released over a longer period of time could have provided a longer exposure at high temperature for the structural components of the building.
3.4.5 Sensitivity to Workstation Type
The overall burning behavior of the two types of workstations was quite similar. This is reasonable, given the general similarity in layout, combustible mass, and composition (Tables 2–1 through 2–4). The following two factors in the workstation composition both explain the modest differences in burning behavior and could lead to differences from or similarities to other workstation types.
• The net heat peak HRR for the WTC workstation was about 10 percent larger than that for the generic workstation (7.46 MW versus 6.73 MW, Table 3–1). This is thought to result from the flammable, charring plastic surface on the drawer fronts that increased the exposed flammable area by about 10 percent. It was apparent from the video that the plastic surface of the WTC workstation filing cabinets was burning during the test. The larger mass of the chair for the WTC workstation may have also contributed to the increased HRR. For a typical HRR of 30 MJ/kg for these particular plastic materials, the burning of 1 kg over 30 s would be equivalent to an additional 1 MW of heat. So, a relatively small additional mass of these materials could have had a significant effect on the HRR.

Chapter 3
52 NIST NCSTAR 1-5C, WTC Investigation
• The WTC workstation had a file cabinet design that allowed more air access to the top area of filled file drawers after the drawer facing burned off. This could possibly have supported more extensive burning of paper in a filled file cabinet than would be allowed by the generic file cabinets. As discussed in Sec. 4.2, a higher mass fraction of file drawer paper consumption occurred with the WTC workstation.
3.5 UNCERTAINTY ANALYSIS
3.5.1 Total Heat Release Rate
The HRR expressed in equation (3–1) is a function of gas concentrations, the duct flow rate, and a number of constant parameters related to the combustion properties of the fuel. Bryant et al. (2003) expressed all of the gas analyzer outputs and sensor outputs in terms of their measured voltages to eliminate correlations. One example of correlated measurements is that of the ambient oxygen measurement (made before a test) and the oxygen measurement during the test, both of which are made by the same instrument. The following equation indicates that a single concentration measurement requires 5 voltages and one span gas concentration:
⎟⎟⎠
⎞⎜⎜⎝
⎛−
−
−=
pressO
ZeropressOZeroOSpanO
ZeroOSpanO
ZeroOOO V
VXX
VVVV
X,
,,,,
,,
,
2
2
22
22
22
2)( (3–5)
where:
2OV = voltage measured by oxygen sensor at time, t
ZeroOV ,2= voltage measured by oxygen sensor for the zero gas
SpanOV ,2= voltage measured by oxygen sensor for the span gas
SpanOX ,2= oxygen volume fraction of the span gas, bottled air (0.2095)
ZeroOX ,2= oxygen volume fraction of the zero gas, nitrogen
2OX = oxygen volume fraction computed with respect to voltage measurement at time, t
pressOV ,2= voltage measured by absolute manometer to monitor pressure in the oxygen analyzer at
time, t
ZeropressOV ,,2= voltage measured by absolute manometer to monitor pressure in the oxygen
analyzer during the zeroing of the instrument.
The modified version of equation 3–1 included 78 input voltages/parameters. About 28 of these were gas analyzer voltages/calibration constants, and 30 were related to measurement of the velocity profile at eight locations using pressure transducers to record the pressure difference in the bidirectional probes. The remainder mainly involved the various constants appearing in the HRR calculation. The equation for q& is written symbolically as:
Test Results and Interpretation
NIST NCSTAR 1-5C, WTC Investigation 53
),.....,,,( 78321 xxxxqq && = (3–6)
By using voltages, the input quantities are uncorrelated, and the relative total type B standard uncertainty, uB, is given by:
( )∑
=
=N
ijiB xusu
1
22 )( (3–7)
In equation (3–7), u(xi) is the relative standard uncertainty for each input, and si is the associated dimensionless sensitivity coefficient given by:
yxys
ii
1∂∂
= (3–8)
From the complete analysis based on the uncertainties for the 78 quantities, the resulting value of uB is 0.061.
Section 3.3 reported that, based on fast response measurements with a radiometer, the calorimeter underestimated the instantaneous peak heat release rate by about 3 percent. Per the discussion in that section, the radiometer output was not directly proportional to heat release, so this correction term itself had a large uncertainty. For this reason, this effect was treated as a Type B uncertainty with u(pk) = ± 0.03 rather than correcting the readings by 3 percent. Including this term in the total Type B uncertainty resulted in uB = 0.068.
A simplified approximate analysis was made for these large heat release rates, because the uncertainty associated with the gas measurements was minor compared to the three major sources. The dominant relative standard uncertainties were the bi-directional velocity probe constant, u(C), the HRR per kg of oxygen consumed, u(EHC), and the cross sectional area of the duct, u(A); the corresponding values were 0.050, 0.027, and 0.010. The HRR was approximately proportional to the product of these three quantities:
⋅⋅⋅⋅⋅⋅≈ ))()(( ACEHCq& (3–9)
The product (C)(A) is part of the expression for the mass flow in the exhaust, em& . There is a correction term to the product (EHC)φ in equation (3–9) with a value typically less than 1 percent of (EHC)φ for the conditions of these workstation burns. The value of uB was computed from equation (3–6) with sensitivity factors equal to 1.
[ ] 058.0))())())(( 2/1222 =++= EHCuAuCuuB(3–10)
Adding in quadrature the value for u(pk) gave uB = 0.065. This simplified analysis accounted for most of the type B uncertainty.
The Type A relative standard uncertainty for the calorimeter, uA (Cal.), was obtained by performing repeat measurements with the calorimeter of a validation gas burner. The measured value was 0.017. This

Chapter 3
54 NIST NCSTAR 1-5C, WTC Investigation
repeatability included both that of the calorimeter and that of the burner. The relative combined uncertainty was obtained by taking the root-sum-of-squares for the Type A and Type B uncertainties with a result of 0.063 for the smoothed peak and a value of 0.070 for the instantaneous peak.
There were two issues regarding fire measurement repeatability. One was the repeatability of the calorimeter. This quantity was computed above. The second was the repeatability of the workstation burns, for which there were no repeat measurements. This precluded the ideal direct assessment of repeatability. However, there was an indirect method of estimating the repeatability that entailed a plausible assumption and some equivalence calculations.
The rationale was as follows: The repeatability quantity of interest to estimate was σrepeat = the (population) standard deviation--a value which reflects the natural spread of repeated measurements. If there were n such repeated measurements, it would be natural to estimate σrepeat by
2/12
)1/((⎥⎥⎦
⎤
⎢⎢⎣
⎡−⎟
⎠
⎞⎜⎝
⎛−= ∑ nyy
iirepeatσ (3–11)
In the absence of repeats, however, consider the following: The data analysis in Table 3–2 shows that an estimated interaction effect βI (for any of the responses) was quite small, of the order of .02 at its worst. If it is assumed that the population interaction effect βI was in fact zero, one could then pose the question as to why the sample estimate βI of the interaction effect was not also identically zero. The answer to this question was that random variation caused the estimates of βI to differ from effect “truth” βI.
Such variation in βI was characterized and related to σrepeat as follows:
)y(Var)y(Var)yy(Var)(Var LRLRII+=−== βσ β
2 222 repeat)y(Var/)y(Var/)y(Var σ==+=
(3–12)
Thus, at the population level with this zero interaction assumption, σrepeat was identically Iβσ . Further discussion of this approach can be found in Box et al. (1978).
Since with two factors, there is only a single two-term interaction, the estimate of Iβσ becomes simply
( ) 02010
212
./ I
/
iII
≈=⎥⎦
⎤⎢⎣
⎡⎟⎠⎞⎜
⎝⎛∑ −= ββσ β (3–13)
Thus, the estimate of σrepeat = 0.02.
In summary, this estimate of repeatability was an indirect surrogate of the preferred replicate-based estimate; on the other hand, in the absence of replication, this served as a rigorous estimate of repeatability, contingent on the assumption of the population interaction being identically zero, and the existence of only a single interaction on which to base our estimate.
The relative combined uncertainty of the calorimeter for the workstation tests was computed as the quadrature sum of the relative combined uncertainty of the calorimeter, 0.063, and the relative type A

Test Results and Interpretation
NIST NCSTAR 1-5C, WTC Investigation 55
uncertainty, which is the same as σrepeat, 0.02, with a result of 0.066. This was the result for the smoothed peak. For the instantaneous peak, the value increased to 0.073.
Finally, the relative expanded uncertainty was determined from the combined uncertainty by multiplying by a coverage factor of 2 giving Ur = ± 0.132 for the smoothed peak and U = ± 0.146 for the instantaneous peak.
3.5.2 Net Heat Release Rate
Following the same calculation path, the relative repeatability standard uncertainty for the net HRR is 0.02. The expanded uncertainty, U, is slightly increased to ± 0.136 for the smoothed peak and ± 0.150 for the instantaneous peak because the difference of total HRR and the burner release rate is computed.
3.5.3 Net Heat Released
Two additional Type B uncertainties for the total HRR are the uncertainty of the spray burner (igniter) output and the uncertainty in the drift of the baseline resulting from a drift in the oxygen meter. The burner Type B relative standard uncertainty, 0.035, is estimated as 1/3 of the variation of the burner output during its operation times the time operating divided by the total heat released. The baseline drift Type B standard uncertainty, 0.017, is estimated as the rate of drift over the last 400 s of operation times the length of the burn after the liquid burner is extinguished divided by the total HRR. The total Type B relative uncertainty is computed as a quadrature sum of the spray burner, baseline drift, and the Type B contribution from the calorimeter (0.061) with a result of 0.072. The calorimeter is able to integrate peaks too narrow to be quantified so that the uncertainty associated with the peak height is not included in the analysis. The relative expanded uncertainty of 0.149 is obtained from the quadrature sum of the total Type B relative uncertainty and the relative repeatability uncertainty, 0.02, multiplied by the coverage factor of two.
3.5.4 Total Mass Loss
A calibration weight of 22.7 kg (50 lb) was added to the load cell before each test, and the relative standard uncertainty for calibration, ucal, is estimated as 0.005. This result included the effects of both repeatability and the calibration uncertainty of the 22.7 kg calibration mass. The finest increment in the output for a single load cell was 0.045 kg. For the combined system of four load cells, it was observed that the background reading changed in discrete increments of about 0.1 kg. This limited resolution was a major contributor to the value of ucal. An additional source of uncertainty during the fire tests was objects falling off the load cell. These were discrete events as is apparent in Fig. 3–9 at 1500 s and 2000 s. There was an uncertainty in measuring this step change in mass that resulted in an estimated relative standard uncertainty of approximately 0.030 for the total mass change, which was typically about 40 kg relative to a total mass loss of approximately 200 kg. The relative standard uncertainty for falling objects, ufall, expressed as a fraction of the total weight was 0.006. The relative combined uncertainty was obtained by adding ucal and the relative repeatability uncertainty, 0.02 in quadrature with a result of 0.022. The relative expanded uncertainty, U, with a coverage factor of 2 was 0.044.
There is another issue in terms of repeatability related to the test protocol. The time the ignition burner operated and the total time of the test were shorter for the tests with Jet A because the time to the peak

Chapter 3
56 NIST NCSTAR 1-5C, WTC Investigation
HRR was about 350 s shorter. This confounded the factor analysis, since, in effect, two additional parameters, the operation time of the ignition burner and the burn time of the workstation, were inadvertently changed. In Table 3–3, the mass loss values for the four tests of the generic workstation are given for four time intervals. The shortest, 1500 s, corresponds to the one case where all four tests have the same environment—igniter burner on for that entire time. In this case, the mass loss is larger with the presence of Jet A. On the other hand, if one compares the results at the end of the burn, then there is more mass loss without Jet A. This is likely a result of the longer burn time and longer exposure to the ignition flame, causing additional mass loss from the paper and wood. Also there is a reversal in the effect of the tile addition from reducing the total heat release over 1500 s and increasing it by the end of the burn. The results for 2100 s and 2500 s are intermediate between the shortest and longest times.
Table 3–3. Mass loss (kg) vs. time interval. Time Interval
Test 0 to 1500 0 to 2100 0 to 2500 0 to 3200
2 163.5 186.8 195.7 205.0
3 160.3 188.2 197.7 213.1
5 181.3 193.0 200.2 200.2
6 172.2 196.3 205.3 205.3
3.5.5 Peak Mass Loss Rate
The MLR ranged from a peak value of 0.25 to 0.4 kg/s and then decreased to a value as small as 0.01 kg/s at long times. The relative uncertainty in the peak for 1 s resolution was on the order of 0.025 or larger because of the typical 0.1 kg discretization limit of the load cell. The MLR was smoothed by computing a linear fit through 30 points. This reduced this Type B relative uncertainty by roughly the square root of the number of points to a value of 0.046. The rate of rise of the MLR near its peak was less steep than that of the radiometer output and calorimeter (Fig. 3–16), and the uncertainty from this effect was treated in a similar fashion to that of uncertainty for the peak HRR. This second Type B uncertainty was estimated as 0.04 compared to the value of 0.03 for the calorimeter. The combined relative uncertainty was obtained by combining the two type B uncertainties plus the 0.02 repeatability in quadrature, with a resulting value of 0.064. The relative expanded uncertainty was obtained as twice this value, 0.128.
3.5.6 Effective Heat of Combustion
The uncertainty in the effective heat of combustion was computed as the quadrature sum of the relative combined uncertainty of the net heat released and the mass loss. The resulting value was multiplied by a coverage factor of two resulting in an expanded relative uncertainty equal to ± 0.150.
3.5.7 Time to Peak Heat Release Rate and Peak Mass Loss Rate
The relative standard uncertainty for repeatability was 0.020, as it is for the other quantities. The major Type B component for the peak heat release rate was the estimated 5 s standard uncertainty associated with correcting the nominal 30 s time delay in the calorimeter for the time for the gas to flow from the duct to the gas analyzers and the time response of the analyzers. The 5 s corresponded to a relative

Test Results and Interpretation
NIST NCSTAR 1-5C, WTC Investigation 57
standard uncertainty of 0.010 for the peak times for tests not involving Jet A and a value of 0.03 tests involving Jet A. Combining the two uncertainties in quadrature and multiplying by a coverage factor of 2 gave relative expanded uncertainties for the time to peak of 0.022 for the tests without Jet A and 0.036 for the tests with Jet A.
3.5.8 Burning Time and Ignition Time
The major source of uncertainty in the FWHH for the net HRR was determining t1/2+, the time after the peak at which the net heat release has decreased by a factor of two. The net HRR had oscillatory behavior in this region, and there were two or more times corresponding to the half-height of the net heat release weight. The average of the shortest and longest times was used in computing a smoothed estimate of t1/2+ and is denoted t1/2+ (avg). The actual value of t1/2+ was within the interval defined by the shortest and longest times. Assuming the values in this interval were equally probable, the standard deviation about t1/2+ was equal to half the interval divided by √3. This value was divided by the FWHH and multiplied by a coverage factor of two to obtain the expanded uncertainty. The much larger uncertainty for Test 3 compared to the others was a result of the nearly flat net heat release versus time for an extended period.
The uncertainty in the total mass loss was one of the two major sources of uncertainty in the time, t(75 %), at which 75 percent of the total mass loss occurs. This uncertainty was estimated as one-half the time interval determined by 75 percent of the total mass loss plus or minus the mass loss combined uncertainty. For example, for a total mass loss of 205 kg, the time interval would be from the time at which the mass was 152.5 kg to the time it was 155.0 kg. For Tests 2 and 3, the average relative standard uncertainty was 0.011, and for Tests 5 and 6 it was 0.019. Combining these values in quadrature with the relative standard uncertainty for repeatability of 0.02 and multiplying by a coverage factor of 2 leads to an expanded uncertainty for t(75 %) equal to 0.046 for Tests 2 and 3 and 0.055 for Tests 5 and 6.
One source of uncertainty in tig was estimating the ignition time from the video. This standard uncertainty was estimated as ± 1 s. The standard uncertainty associated with repeatability was computed as the standard deviation of the four tests without Jet A (Tests 1 through 4) and was equal to ± 12 s. The expanded uncertainty based on a coverage factor of 2 was ± 24 s. The uncertainty is expressed in terms of relative expanded uncertainty in Table 3–4.

Chapter 3
58 NIST NCSTAR 1-5C, WTC Investigation
Table 3–4. Uncertainty values for test parameters. Parameter Uncertainty (k=2)
Peak heat release ratea 14.6 %/13.2 % Time to peak for both HRR and MLR b 4.4 %/7.2 % Net peak HRRc 15.0 %/13.6 % Peak MLR 12.8 % Net heat released by the workstation 14.9 % Total mass loss 4.4 % Effective heat of combustion 15.0 % FWHH for net HRRd 11.6 %, 43.6 %, 10.8 %, 12.8 % t(75 %)e 4.6 %, 5.5 % tig
f 62 %, 36 %, 43 %, 48 %, 27 %, 21 % a. The first number is the uncertainty for the instantaneous peak and the second is the 10 s average about the peak. b. The first number is the uncertainty without Jet A and the second number is with Jet A. c. The first number is the uncertainty for the instantaneous peak and the second is the 10 s average about the peak. d. The four values are the uncertainties for Tests 2, 3, 5, and 6. e. The first value is the uncertainty for Tests 2 and 3, and the second is for Tests 5 and 6. f. The six values of uncertainties are for Test 1 through Test 6.
3.6 REFERENCES
Boonmee, N., and J. Quintiere. 2001. Glowing and Flaming Auto-Ignition of Wood, Paper presented at the 2001 Technical Meeting of the Eastern States Section of the Combustion Institute, Hilton Head, SC, December.
Box, G., W. Hunter, and J. Hunter. 1978. Statistics for Experimenters, John Wiley & Sons, New York, NY, Chapter 10.
Bryant, R.A., T.J. Ohlemiller, E.L. Johnsson, A.P. Hamins, B.S. Grove, W.F. Guthrie, A. Maranghides, and G.W. Mulholland. 2003. The NIST 3 Megawatt Quantitative Heat Release Rate Facility. NIST Special Publication 1007. National Institute of Standards and Technology. Gaithersburg, MD, December.
Gottuk, D., and D. White. 2002, Liquid Pool Fires, Section 2, Chapter 15, The SFPE Handbook of Fire Protection Engineering, Third Edition, National Fire Protection Association, Quincy, MA.
Ma, T., S. Olenick, M. Klassen, R. Roby, and J. Torero. 2004. Burning of Liquid Fuel on Carpet (Porous Media), Fire Technology, 40, pp. 227-246.
Madrzykowski, D. 1996. Office Work Station Heat Release Rate Study: Full Scale vs. Bench Scale, Proceedings of Interflam ’96. Interscience Communications, Ltd., London, pp. 47-55.
Madrzykowski, D. 1998. Office Building Fire Research Program: An Engineering Based Approach to Fire Safety Design, Proceedings of the 5th Fire and Materials Conference, San Antonio, Texas, Interscience Communications, Ltd., London, pp. 23-33.

Test Results and Interpretation
NIST NCSTAR 1-5C, WTC Investigation 59
Mudan, K., and P. Croce. 1995. SFPE Handbook of Fire Protection Engineering, Second Edition, National Fire Protection Association, Quincy, MA, Section 3, Chapter 11.
Ohlemiller, T. 2004. Unpublished results of scale model experiments involving the spatial distribution of falling tiles, National Institute of Standards and Technology, Gaithersburg, MD.

Chapter 3
60 NIST NCSTAR 1-5C, WTC Investigation
This page intentionally left blank.

NIST NCSTAR 1-5C, WTC Investigation 61
Chapter 4 SIMULATIONS OF WORKSTATION FIRE TESTS
4.1 FIRE DYNAMICS SIMULATOR COMBUSTION MODELING
The purposes of these experiments were to obtain understanding of how the office workstations may have burned in a fire and to provide data for use any improvements in the Fire Dynamics Simulator (FDS) combustion algorithm and its inputs needed to provide a sufficient approximation of the burning of combustibles as complex as those that comprise an office workstation. A general description of the implementation is presented here. A more detailed version is presented in NIST NCSTAR 1-5F.
The existent version of FDS computed the radiant flux to the surfaces of the workstation. Given the thermophysical properties of each combustible material, including the ignition temperature, heat of vaporization/pyrolysis, and the thermal conductivity, FDS computed when each ignited and its subsequent burning rate. The effluent was added to the thermal and radiative environment, and the computation proceeded with successive iterations until the fuel was fully consumed.
Section 2.1 describes in detail the various materials making up the workstations and Appendix A describes the cone calorimeter measurements of the properties needed for the FDS calculations. The measurements to characterize the burning characteristics were made at three fluxes for the carpet, desk (wood), computer monitor, chair, privacy panel, and stacked paper. Additional piloted ignition time measurements at other heat fluxes were made on these six materials to infer their ignitability parameters.
Direct use of all of these data did not result in acceptable simulation of the workstation fire growth behavior. One significant contributor to this disagreement was that only piloted ignition had been measured, and as noted in Sec. 3.2.2, the paper throughout the cubicle appeared to have been ignited from irradiance alone (i.e., it exhibited non-piloted or spontaneous ignition). In addition, the chair fire, whose complex behavior was a key determinant of the timing and, to a lesser extent, the magnitude of the heat release peak from the work station, could not be predicted from the cone calorimeter results alone.
Thus, only the carpet, desk, and privacy panel data from the cone calorimeter were used directly.
• The carpet and privacy panel were modeled as thermoplastics, that is, the burning rate was assumed to be proportional to the heat flux from the surrounding environment.
• The desk was modeled as a charring solid, in which a pyrolysis front propagated through the material, leaving a layer of char behind that insulated the material and reduced the burning rate. Details of the pyrolysis models can be found in the FDS Technical Reference Guide (McGrattan 2004). More details on the specific FDS model inputs used are given in Appendix A.
• The chair, computer, paper, and other miscellaneous items within the workstation were modeled as a single item by lumping their masses together into large, homogeneous “boxes” and distributing these throughout the workstation.

Chapter 4
62 NIST NCSTAR 1-5C, WTC Investigation
• Paper cartons containing various amounts of plastic have been used as surrogates for a wide range of retail commodities in other fire analyses and simulations. A particular distribution of plastic in a carton termed “Group A Plastic” has been shown to be fairly representative of fires fueled by a mixture of cellulosic and thermoplastic materials. Because the Group A Plastic had been used in numerous FDS simulations, the contents of the office workstations was modeled with a fuel similar to Group A Plastic.
• Blind predictions of the single open workstation burns were made using material properties obtained previously during a sprinkler/roof vent study of large-scale rack storage fires (McGrattan, Hamins, and Forney 2000). These properties were then adjusted to match the results of the current experiments. Thus, the results from the single workstation burns served to calibrate the model.
• The nature of the boxes that provided a reasonable simulation of the cubicle fires was as follows:
− Three boxes, each 0.5 m (20 in.) square by 1.0 m (39 in.) high.
− The ignition temperature was 370 °C, and the heat release rate (HRR) per unit area was 450 kW/m2.
− The HRR of each box underwent a 100 s, linear ramp from the point of ignition.
− The heat release of the boxes decreased in time resulting from a decrease in surface area as the boxes burned.
− Unlike the desk, partition, and carpet, the boxes were simply given a burning rate rather than a heat of vaporization, meaning that the boxes would burn at the given rate regardless of the heat flux upon them. The reason is that the complex details of the ignition and fire spread on a chair, followed by the ignition of the carpet via flaming drips from the chair were not sufficiently understood to be incorporated into FDS.
The obstructions (tiles) were modeled by placing inert objects on the desk and floor, covering roughly 30 percent of the surface area.
The addition of Jet A was modeled as a single nozzle spraying liquid fuel droplets. Four liters of fuel are released in 2 s and combust immediately.
4.2 FDS SIMULATIONS
Figures 4–1 through 4–4 compare the predicted HRR over the duration of four of the tests with the measured equivalent. Since Test 1 was used only for scoping the experiments, no simulation was performed. The FDS simulation for Test 2 applies implicitly to Test 4, since the only (small) difference in the input data was the combustible mass.
The workstation burns served to check that the assumptions made in modeling the workstation with the simplified fuel packages would produce reasonable results. Shown in Fig. 4–1 is a comparison of the

Simulations of Workstation Fire Tests
NIST NCSTAR 1-5C, WTC Investigation 63
HRR from Test 2 (no jet A, no tiles) and that from the FDS simulation. The initial small peak near t=0 in the simulation was from the ignition of the fabric of the workstation panels, an event that did not occur in the test. The peak heat release occurred at full involvement of everything except one of the boxes and perhaps a portion of the underside of the desk. The value of the HRR peak is slightly larger (10 percent ) than the experimental value. Also the peak structure includes a double peak. The decrease in the heat release past the peak is a result of the decreasing surface area of the boxes and of the formation of a char layer on the work surface. The peak HRR in the simulation occurred sooner than in the experiment. In the experiment, the time to peak HRR was strongly influenced by the melting of the chair plastic onto the carpet. This level of detail was not captured in the numerical model, especially given the fact that the chair had been lumped together with various other combustible items.
Figure 4–1. Comparison of measured and computed HRR in Test 2
(generic workstation, no tiles, no Jet A).

Chapter 4
64 NIST NCSTAR 1-5C, WTC Investigation
Figure 4–2. Comparison of measured and computed HRR in Test 3
(generic workstation, with tiles, no Jet A).
Figure 4–3. Comparison of measured and computed HRR in Test 5
(generic workstation, no tiles, with Jet A).

Simulations of Workstation Fire Tests
NIST NCSTAR 1-5C, WTC Investigation 65
Figure 4–4. Comparison of measured and computed HRR in Test 6
(generic workstation, with tiles, with Jet A).
The predicted decrease in the peak heat release rate resulting from tiles (Figs. 4–2 and 4–4) and the increase in the peak from the Jet A (Figs. 4–3 and 4–4) are similar in magnitude to the experimentally measured results. The simulations did predict a relatively small increase in the time to the peak with the addition of the tile, but they did not predict the more than a factor of three reduction in the time to the peak for the addition of Jet A. FDS consumed the Jet A immediately with relatively small effect on the growth of the heat release rate. For the actual fire, the ignition of the Jet A did not occur until about 120 s. Then the ignition and rapid burning of the Jet A caused the entire cubicle quickly to become fully involved, first above the desk surface and then below via dripping from the chair to the carpet.
One qualitative difference between experiment and simulation is that the predicted peak structure is similar to a square wave, while the measured HRR decreases in a more nearly linear fashion at longer times. The overall burning time is similar for the experiments and the simulations.
4.3 NUMBER OF WORKSTATIONS BURNING
To put into context the importance of the deviations of these simulations from the experimental results, it was useful to have an estimate of the number of workstations involved in the actual World Trade Center (WTC) fires.
The estimated peak HRR of the fires in WTC 1 was of the order of 1 GW to 1.5 GW (NIST NCSTAR 1-5F), with fires being observed on the 92nd through 100th floors (NIST NCSTAR 1-5A). The peak HRR of the WTC workstation identical in design to those used in the primary impact floors of WTC 1 was approximately 7 MW. These numbers suggest that the WTC 1 peak HRR was the equivalent

Chapter 4
66 NIST NCSTAR 1-5C, WTC Investigation
of about 200 workstations at their peak HRR values. However, it was likely that at any moment, many of these workstations were not generating their peak heat output because:
• Not all would have been at the same point in their combustion history simultaneously,
• Many were at least partially covered with debris from fallen ceiling tiles and wall fragments, and
• Not all would have free access to an unrestricted supply of air.
Thus, a greater number of workstations were burning as the overall fire peaked. Assuming that the number was doubled and that they were spread evenly over the nine floors, of the order of 40 workstations would have been at some stage of burning on any given floor. There were on the order of 200 workstations or equivalents on each floor (NIST NCSTAR 1-7), so about one-fifth of the workstations on each floor would have been burning during the most intense stages of the fire. The fire intensity on each floor (and thus the number of work stations burning) would not be expected to be equal but the argument still holds that, in general, numerous work stations were burning on each floor as the fires reached peak intensity.
With a large number of workstations burning simultaneously, with each workstation burning for approximately 20 min, and with the uncertainties in the burning conditions in the interior of the buildings, it is unlikely that the differences in the predicted HRR curves and ignition delay times would have a dominant effect on the prediction of the overall fire growth and magnitude.
Two further factors help alleviate any concern about the timing differences between the experimental and simulated HRR curves seen here. The next stage of the experimental program involved the burning of three workstations within a large enclosure (NIST NCSTAR 1-5E). The ignition of the first workstation was by the same means as here (2 MW spray burner), but the involvement of the other two workstations was the result of a fire spread process after the first station ignited. FDS, using the approach inferred from the tests described in this report, successfully described the overall HRR behavior of the three stations. For the three stations and also for the full WTC floor simulations (NIST NCSTAR 1-5F), the limiting factor in determining the overall HRR evolution over time was found to be the rate of air supply to the fire. Therefore, the results were relatively insensitive to the types of timing discrepancies seen in the open burns here.
Thus, overall, the chosen set of parameters and approximated component burning descriptions gave an adequate description of the actual workstation heat release rate behavior and its dependence on the factors varied in the tests described here (inert tile coverage and presence of Jet A). That description was found to be robust when applied to the larger, air-supply limited fires most pertinent to the WTC.
4.4 REFERENCES
Hamins, A., A. Maranghides, and G. Mulholland. 2003. The Global Combustion Behavior of 1 MW to 3 MW Hydrocarbon Spray Fires Burning in an Open Environment. NISTIR 7013. National Institute of Standards and Technology. Gaithersburg, MD, June.

Simulations of Workstation Fire Tests
NIST NCSTAR 1-5C, WTC Investigation 67
McAllister, T., ed. 2002. World Trade Center Building Performance Study: Data Collection, Preliminary Observations, and Recommendations. FEMA 403. Federal Emergency Management Agency. Washington, DC, May.
McGrattan, K., A. Hamins, and G. Forney. 2000. Modeling of Sprinkler, Vent and Draft Curtain Interaction, Proceedings of the Sixth International Symposium on Fire Safety Science, International Association of Fire Safety Science, Boston, MA, pp. 505-516.
McGrattan, K., ed. 2004. Fire Dynamics Simulator (Version 4), Technical Reference Guide. NIST Special Publication 1018. National Institute of Standards and Technology. Gaithersburg, MD.

Chapter 4
68 NIST NCSTAR 1-5C, WTC Investigation
This page intentionally left blank.

NIST NCSTAR 1-5C, WTC Investigation 69
Chapter 5 SUMMARY OF RESULTS
To prepare the National Institute of Standards and Technology (NIST) Fire Dynamics Simulator (FDS) for use in reconstructing the World Trade Center (WTC) fires, it was necessary to establish its accuracy in simulating the combustion of workstations, the principal combustibles in the WTC buildings. A series of six fire tests of individual cubicles was conducted to provide data for use in developing an FDS combustion algorithm capable of replicating the burning of such complex combustibles. The tests examined the effect of varying the type of workstation and inclusion of the effects of inert debris from fallen ceiling tiles or fractured walls and Jet A from the airplane. The principal measurements were of the heat release and mass loss rates, the total heat release and mass loss, and the ignition delay time, as well as the uncertainty in each. A detailed description of the progress of each fire was also prepared. The test results showed the following:
• Five measures of fire intensity (heat release rate [HRR], mass loss rate, carbon dioxide volume fraction in the exhaust gases, temperature of the exhaust gases and radiant flux seen by the gage viewing the entire fire from the south side of the cubicle) all presented a consistent representation of the progress of the fire, given their individual measurement characteristics.
• The peak HRR for a workstation similar to those in the WTC was approximately 7.0 MW with a relative expanded uncertainty of ± 15 percent and with the Type A (repeatability) relative standard uncertainty of ± 2 percent. The time to the peak HRR was approximately 540 s with an expanded relative uncertainty of 4 percent.
• In all tests, the peak HRR corresponded to all accessible combustible surfaces burning simultaneously.
• Approximately 75 percent of the heat release and mass loss occurred over a period of approximately 20 min, insensitive to all the test variables.
• In all tests, the post-peak behavior included both the burning out of the various combustibles and the collapsing of three-dimensional components into more compact piles that decreased their burning rates.
• The overall burning behavior was not sensitive to workstation design, with the only (small) effect being due to the difference in mass and the exposed flammable area.
• The peak HRR of the workstation was diminished in rough proportion to the fraction of combustible surface covered by inert materials. It was estimated that a moderate increase in the surface coverage would have decreased the peak HRR proportionately and that a very large increase in coverage (possible in heavily rubbled areas) would have had a more than proportionate effect.

Chapter 5
70 NIST NCSTAR 1-5C, WTC Investigation
• The presence of 4 L of Jet A dramatically decreased the times to peak HRR, from approximately 10 min to approximately 3 min. Increasing the quantity of jet fuel was not expected to affect further the time to full involvement of the cubicle. The presence of jet fuel had only a small effect on the total mass loss, the total heat released, and the peak HRR from the burning workstation. The peak HRR value was estimated to be insensitive to a lesser amount of jet fuel present, but sensitive to a larger amount.
• The tiles and Jet A were nearly independent factors: the effect of the tiles on the burning rate of the cubicle was almost independent of the presence or absence of the Jet A.
• Varying the mass of paper in the cubicle would have affected the duration of the tailing off of the workstation fires.
FDS simulations of the fire tests in which all the combustibles were volatilized using thermophysical properties derived using a cone calorimeter were unsatisfactory. This was due to fire phenomena that could not be replicated in any apparatus that used a small test specimen: changes in the shape (e.g., by collapse) and surface area of combustibles during the fire test, three-dimensional burning behavior, especially of the chair; fabric peeling on the privacy panels; and anticipation of whether a combustible would ignite from direct flame impingement or by radiation-driven autoignition.
In a modified FDS representation of the workstation combustion, the carpet, desk, and privacy panel data from the cone calorimeter were used directly. All the other items within the workstation were modeled as a single entity by lumping their masses together into three homogeneous “boxes” and distributing these throughout the workstation. The combustion properties were adjusted to match the results of the experiments. Thus, the results from the single workstation burns served to calibrate the model.
The modified FDS then computed HRR versus time curves whose shapes and magnitudes were similar in form and magnitude to the tests. The predicted decrease in the HRR peak and time to that peak resulting from the presence of inert tiles and the increase in the peak from the Jet A were similar in magnitude to the measured results. There were differences in the predicted times to the HRR peaks. It was anticipated that these effects could be averaged when multiple workstations were at various stages of their burning. An estimate was that of the order of 40 workstations were burning on each floor at the height of the fires in WTC 1. In fact, the workstation description derived here was successful in describing the overall HRR from the spread of fire over three workstations in a single compartment (tests conducted in another part of this study). There, as well as in simulations of full WTC floor burning, the factor controlling the overall HRR from the fire was the rate of air supply, not timing of the HRR peak from a single workstation.
Thus, the chosen set of parameters and approximated component burning descriptions gave a reasonable description of the actual workstation heat release rate behavior for application to compartment fires involving multiple workstations.
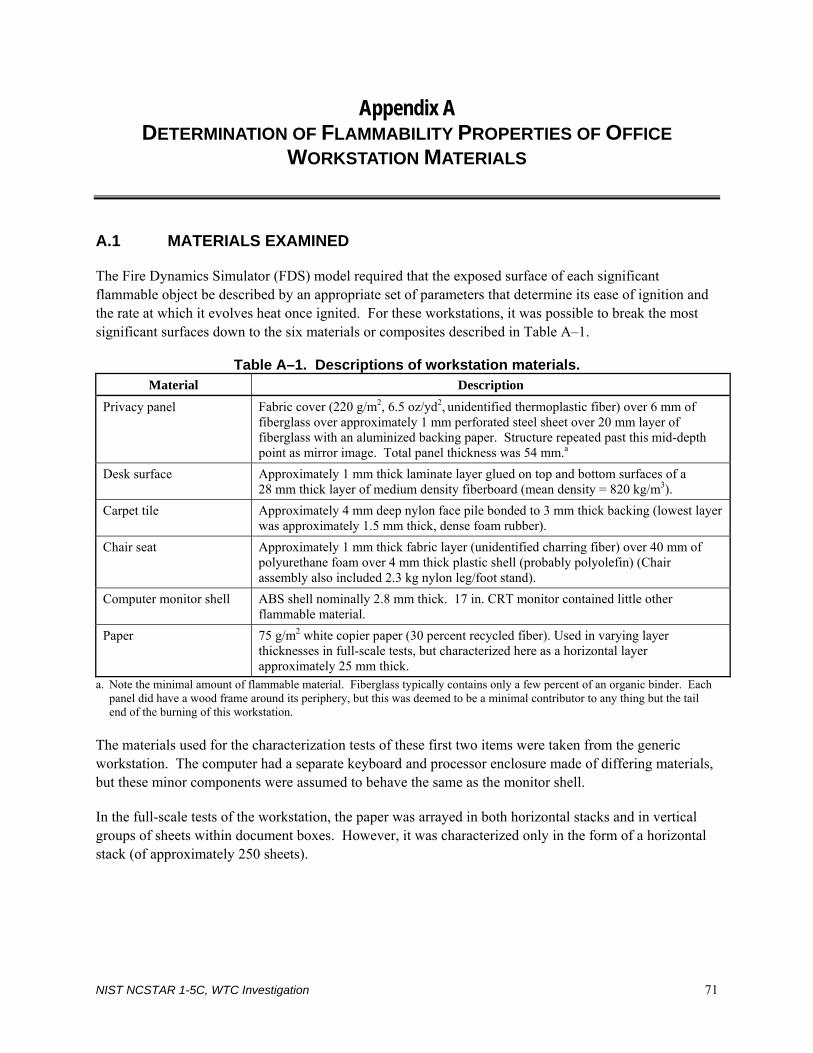
NIST NCSTAR 1-5C, WTC Investigation 71
Appendix A DETERMINATION OF FLAMMABILITY PROPERTIES OF OFFICE
WORKSTATION MATERIALS
A.1 MATERIALS EXAMINED
The Fire Dynamics Simulator (FDS) model required that the exposed surface of each significant flammable object be described by an appropriate set of parameters that determine its ease of ignition and the rate at which it evolves heat once ignited. For these workstations, it was possible to break the most significant surfaces down to the six materials or composites described in Table A–1.
Table A–1. Descriptions of workstation materials. Material Description
Privacy panel Fabric cover (220 g/m2, 6.5 oz/yd2, unidentified thermoplastic fiber) over 6 mm of fiberglass over approximately 1 mm perforated steel sheet over 20 mm layer of fiberglass with an aluminized backing paper. Structure repeated past this mid-depth point as mirror image. Total panel thickness was 54 mm.a
Desk surface Approximately 1 mm thick laminate layer glued on top and bottom surfaces of a 28 mm thick layer of medium density fiberboard (mean density = 820 kg/m3).
Carpet tile Approximately 4 mm deep nylon face pile bonded to 3 mm thick backing (lowest layer was approximately 1.5 mm thick, dense foam rubber).
Chair seat Approximately 1 mm thick fabric layer (unidentified charring fiber) over 40 mm of polyurethane foam over 4 mm thick plastic shell (probably polyolefin) (Chair assembly also included 2.3 kg nylon leg/foot stand).
Computer monitor shell ABS shell nominally 2.8 mm thick. 17 in. CRT monitor contained little other flammable material.
Paper 75 g/m2 white copier paper (30 percent recycled fiber). Used in varying layer thicknesses in full-scale tests, but characterized here as a horizontal layer approximately 25 mm thick.
a. Note the minimal amount of flammable material. Fiberglass typically contains only a few percent of an organic binder. Each panel did have a wood frame around its periphery, but this was deemed to be a minimal contributor to any thing but the tail end of the burning of this workstation.
The materials used for the characterization tests of these first two items were taken from the generic workstation. The computer had a separate keyboard and processor enclosure made of differing materials, but these minor components were assumed to behave the same as the monitor shell.
In the full-scale tests of the workstation, the paper was arrayed in both horizontal stacks and in vertical groups of sheets within document boxes. However, it was characterized only in the form of a horizontal stack (of approximately 250 sheets).

Appendix A
72 NIST NCSTAR 1-5C, WTC Investigation
A.2 TEST PROTOCOL
Square specimens, 10 cm (4 in.) square, of the workstation materials were cut from spare parts. A spare chair seat was similarly cut into the same size pieces, being careful to select flat portions. The computer monitor shell was able to supply sufficient samples only by restricting the size to 75 cm squares, so the heat release rate (HRR) per unit area data for these was adjusted to compensate for this smaller size.
All samples were tested in a cone calorimeter (ASTM E 1354) in a horizontal orientation for both ignition delay time and HRR as a function of incident radiant heat flux. An electrical spark was used as an igniter for the evolved gases (piloted ignition). Triplicate tests were conducted at heat fluxes of 20 kW/m2, 45 kW/m2, and 70 kW/m2. In the case of the desk surface, which would not ignite at 20 kW/m2, the lower flux tests were conducted at 25 kW/m2. The results of the exposures at these three fluxes were used in fitting a linear (least squares) variation of HRR with incident flux. Rather than use the peak HRR value, however, the line was fitted to points derived from some average of the HRR data versus time at a given flux, as discussed later in this appendix. The ignition data at these fluxes were supplemented by further duplicate tests in which the flux was lowered until the ignition delay time exceeded 1200 s (taken as non-ignition). The borderline between ignition and non-ignition was determined to within approximately ± 1.5 kW/m2. The ignition delay time versus flux was then used to infer an ignition temperature and effective thermal inertia for each material by matching the experimental curves against the predictions of a one-dimensional, numerical heat conduction model.
The resulting data are compiled in Table A–2.

NIS
T NC
STA
R 1-5C
, WTC
Investigation 73
D
etermination of Flam
mability P
roperties
Table A–2. Effective burning properties of WTC workstation materials.
Material
Ignition Temperature
(°C)a Thermal Inertia
(MKS)b
Heat of Combustion
(kJ/g)
Heat of Gasification
(kJ/g)
Incident Heat Flux
(kW/m2) Total Available Heat (MJ/m2) Burning Time (s)
Desk surface 407 0.41 14.0 ± 0.88 4.8 70 269 ± 4.0 1101 ± 114 (thickness = 2.8 cm) 8.6 “ “ 1947 ± 72 45 212 ± 4.3 968 ±78 “ “ 1739 ± 49 25 113 ± 71 614 ± 397 “ “ 1153 ± 728 Computer monitor 402 0.24 15.8 ± 2.7 1.7 70 46.9 ± 1.1 64.4 ± 11 (thickness = 0.28 cm)
2.1 “ “ 80.9 ± 6.8
45 48.9 ± 1.7 65.2 ± 8.2 “ “ 79.6 ± 12.1 20 57.6 ± 2.8 116 ± 16.1 “ “ 132 ± 20.5 Chair composite 369 0.32 38.2 ± 2.7 5.1 70 273 ± 4.4 397 ± 23 (fabric thickness = 0.10 cm; assumed adiabatic rear surface)
6.8 “ “ 522 ± 22
(treated as thick) 45 289 ± 4.5 573 ± 20 “ “ 776 ± 21 20 276 ± 2.9 764 ± 108 “ “ 1048 ± 132 Privacy panel 380 0.73 30 ± 5 17 70 7.3 ± 0.7 50 ± 8

74 N
IST N
CS
TAR
1-5C, W
TC Investigation
Appendix A
Material
Ignition Temperature
(°C)a Thermal Inertia
(MKS)b
Heat of Combustion
(kJ/g)
Heat of Gasification
(kJ/g)
Incident Heat Flux
(kW/m2) Total Available Heat (MJ/m2) Burning Time (s)
(fabric thickness = 0.05 cm; assumed adiabatic rear surface)
(thk)ρC (kJ/m2K)
(treated as thin) 45 6.2 ± 0.5 “
20 4.7 ± 0.1 “
Carpet 290 0.56 22.3 ± 0.6 3.0 70 63.1 ± 0.3 98.5 ± 5.3 (thickness = 0.6 cm) 45 61.8 ± 1.1 104 ± 12.4 20 59.8 ± 1.0 162 ± 4.4 Stacked paper 369 0.044 14.2 ± 2.0 4.5 70 218 ± 30 807 ± 141 (Horizontal) 7.0 “ “ 1246 ± 223 (thickness = 2.5 cm) 45 125 ± 5 553 ± 34 “ 850 ± 36 20 111 ± 3.7 569 ± 50 “ 952 ± 31
a. Estimated uncertainty is ± 10 °C. All surface absorptivity and emissivity values set at 0.95. b. Thermal inertia chosen to give a close match to ignition delay time near 20 kW/m2 (22 kW/m2 to 25 kW/m2 for desk surface). Units are (kJ/m2K)2 (1/s).

Determination of Flammability Properties
NIST NCSTAR 1-5C, WTC Investigation 75
A.3 HEAT RELEASE RATE BEHAVIOR
The measured HRR behavior of the six material combinations at the tested fluxes are shown in Figs. A–1 through A–6. None of the materials yielded a simple constant HRR.
Neither the desk surface nor the paper was as simple as pure wood in physical behavior. Each gave a strong initial release of heat followed by a rapid decay as the char layer built up and insulated the virgin material below. The top layer of material on the desk surface (decorative laminate) separated and fractured irregularly, forming a somewhat erratic radiation shield. The horizontal stack of copier paper was even more irregular as successive sheets curled and charred, forming a thick insulative layer. The bulk of the subsequent burning was on the sample periphery.
The chair seat sample behavior was complex because the sample itself was complex (three material layers). The initial peak was due to the fabric burning, which left a char layer in place over the melting foam. As the foam melt burned out it ignited the more massive plastic support layer beneath it, which burned vigorously, yielding the second, larger heat release rate peak.3
The carpet sample consisted of initially distinct layers of nylon fibers over a rubber base. The nylon melted and then burned, igniting the lower rubber layer in a continuum that yielded only a single HRR peak.
The ABS polymer of the computer monitor shell consistently gave a late HRR peak that is normally associated with a boiling polymer melt layer. No such melt layer was evident here, and the overall behavior was suggestive of a material which burns more vigorously after its flame retardant content has been driven off. (Its calculated heat of combustion went up strongly as the heat release rate peaked.)
3 This thermoplastic layer collapsed toward the floor when the full-scale chair was burned, causing difficult-to-predict changes
in HRR. This collapse ignited the nylon base of the chair (and surrounding carpet), resulting in a pool fire on the floor.

Appendix A
76 NIST NCSTAR 1-5C, WTC Investigation
Figure A–1. Workstation desk surface heat release rate vs. time.

Determination of Flammability Properties
NIST NCSTAR 1-5C, WTC Investigation 77
Figure A–2. Workstation chair seat/back heat release vs. time.

Appendix A
78 NIST NCSTAR 1-5C, WTC Investigation
Figure A–3. Workstation carpet heat release rate vs. time.
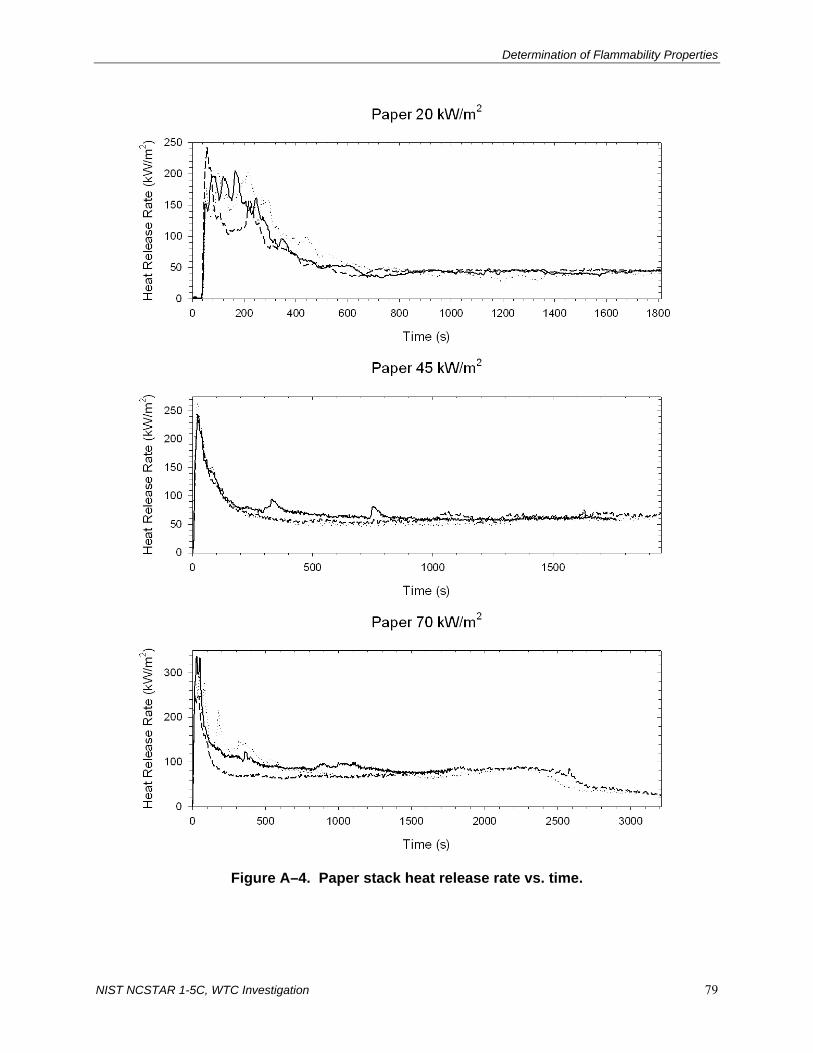
Determination of Flammability Properties
NIST NCSTAR 1-5C, WTC Investigation 79
Figure A–4. Paper stack heat release rate vs. time.

Appendix A
80 NIST NCSTAR 1-5C, WTC Investigation
Figure A–5. Computer monitor shell heat release rate vs. time.

Determination of Flammability Properties
NIST NCSTAR 1-5C, WTC Investigation 81
Figure A–6. Workstation privacy panel heat release rate vs. time.

Appendix A
82 NIST NCSTAR 1-5C, WTC Investigation
In spite of these complex behaviors, the samples were treated, for modeling purposes, as if they were exhibiting a simple square-wave heat release rate behavior, i.e., the heat release rate is taken to jump at ignition to some constant value and remain at that value until the material burns out. This was a usual approach to complex materials and has been used with reasonable success in describing fire growth (Dillon, Kim, and Quintiere 1998). It was not feasible to model the complexities of most real material composites, not least because each new composite exhibits unique behavior.4 However, by replacing a strong initial HRR spike, for example, with a flat plateau at some lower (for example, overall test average) heat release rate, one impacted any prediction for how flames will spread on a material, particularly in an upward direction. There was thus an incentive to develop more than one description for some of the materials and choose between them depending on how that material is involved in the fire growth process. Note that since the available total energy per unit area in a material was fixed, there was a trade-off between the chosen magnitude of the constant HRR and the burning duration.
Here, for some materials, calculated two types of square wave description were calculated: one which emphasized the initial spike in HRR and a second which emphasized either the overall test average HRR or some compromise between these two extremes. In principle, a fire growth model could switch from the first to the second of these two descriptions at some pre-determined extent of burning (fractional weight loss or fractional release of the total available heat), if this were deemed desirable to more closely capture the true time-dependence. The calculated values are presented below.
Once an average HRR is defined, the available nine values from the cone calorimeter tests (three replicate tests at three heat fluxes) can be used to define a least squares straight line fit to predict the HRR (as approximated by a square wave) at any external radiant heat flux (but see discussion below). The slope of this line is a measure of the effective heat of gasification of the material. In principle, the heat of gasification is the amount of heat required to convert unit mass of a material at room temperature into flammable gases during steady burning. Thus, from a steady-state heat balance at the burning surface of the material:
Lmqnet && = (A–1) where:
m& is the flux of gases from the surface of a burning material and L is the heat of gasification5 . It can be shown from Equation A–4 below that
)(/ extradc qvsHRRofSlopeHL &∆= (A–2)
4 The desk surface heat release rate behavior happens to closely follow the predictions of a published model for wood behavior
(Ritchie et al. 1997), in spite of the detaching top laminate layer. This model thus may be used to give a more complete picture of the time-dependent heat release rate.
5 In steady burning the heat of gasification is the sum of the sensible heat required to heat unit mass of a material from room temperature to its burning surface temperature plus the amount of heat required to convert that mass into gases at the burning surface temperature.

Determination of Flammability Properties
NIST NCSTAR 1-5C, WTC Investigation 83
where:
cH∆ is the heat of combustion of the sample, and the slope referred to is that of a plot of some appropriate measure of heat release rate versus the external flux absorbed by the sample.
Also, by definition,
reradextradflamenet qqqq &&&& −+≡ (A–3)
and flameq& is the heat flux to the surface from the flame, extradq& is the absorbed amount of external radiation (from the cone calorimeter heater)6, and reradq& is the radiation lost from the hot surface to the surroundings. Equation (A–1) says that the net heat flux into the condensed phase goes into generating the gaseous mass flux m& at a cost of L kJ/g of gasified material. When applied here, this heat balance glossed over non-steady behavior that is inherently present in complex, real materials due to such things as char accumulation, an external heat flux that changes on a time scale faster than the condensed phase thermal wave equilibration time, a layered composition, or a finite sample thickness. Those effects (except for a time-varying external flux) were present in the cone calorimeter tests but they were being averaged into the apparent value of L. Thus, as used here, L was the apparent or effective amount of heat required to sustain the gasification process over a duration of burning that corresponds to the defined average HRR (and total heat available)7. This would carry over to a full-scale fire with reasonable accuracy if the factors affecting the averaged transient effects were essentially the same on both scales. Here this meant that the physical behavior of the sample had to be the same on both scales, and the rear surface boundary conditions also had to be nominally the same. There was a reasonable expectation that the physical behavior would be the same on both scales – up to a point. That point corresponded to physical collapse of the various workstation structures, the chair, the computer housing, etc. These various collapses would occur at differing times in the course of a full-scale workstation fire. The rear surface boundary conditions were essentially adiabatic in the cone calorimeter tests. They were not so far from adiabatic in the full-scale as to lead one to expect appreciable deviations here. An exception might have occurred when the underside of the desk surface began to burn and did so long enough for its associated thermal wave to interact with the thermal wave associated with the top surface (roughly 1000 s after local ignition of the second side).
The FDS model actually required the rate of mass loss from the local surface of a burning object resulting from a given total incident heat flux, plus the heat of combustion of the evolved gases. The model calculated this total incident flux, used it to obtain the mass evolution rate from the surface, then distributed the combustion heat from that mass in the gas phase in accord with the buoyant, turbulent flow field the model calculates.8 In calculating the total incident heat flux, FDS did not distinguish between “external radiation” and “flame heat flux” in the manner shown in Equation (A–3). Thus, the FDS model could not directly use plots of average heat release rate versus external radiant flux since the abscissa there was the external radiant heat flux from the cone heater, not total incident heat flux to the surface.
6 The external radiant flux is assumed to pass undiminished through the flame since this layer is thin. 7 The burning duration is (Total Available Heat/Average HRR). 8 The model assumes infinitely fast gas phase oxidation kinetics so that the combustion takes place on the surface where fuel
vapors and oxygen meet in stoichiometric proportions. That surface location and shape is constantly changing due to the turbulence.

Appendix A
84 NIST NCSTAR 1-5C, WTC Investigation
The cone samples respond to the combined external radiant flux and the flame feedback flux so their total incident heat flux is greater than the indicated abscissa values on such plots.
Heat release rate is simply the product of mass loss rate and heat of combustion of the evolved gases. Using this fact plus Equations (A–1) and (A–3), it can be shown that, in principle, the zero flux intercept on a plot of average HRR versus external flux is a measure of the flame feedback flux which the samples in the cone calorimeter see. Thus:
extradcreradflamec qLHqqLHHRR &&& )/()()/( ∆∆ +−= (A–4)
Here, the first term on the right is the intercept of such a plot; if the other quantities in this term were known from other measurements or estimates9 then flameq& can be calculated. In practice, given the scatter in the data points that define a fitted straight line, plus the approximations that this model encompasses, use of this intercept is a very poor way in which to infer the flame feedback flux. It is much better to rely on measured values of heat fluxes from flames to surfaces in bench scale experiments such as this (Quintiere and Rhodes 1994; Ohlemiller 1999; Kashiwagi 2003). These values tend to be in the range from 25 kW/m2 to 40 kW/m2. In the present work a value of 33 kW/m2 was assumed to be an adequate estimate for all of the materials. This imposed an added point through which a straight line fit to the cone data had to pass (since that line was governed by Equation (A–4). The slope of the least squares line was thus altered to force it through this intercept value. Since the heat of gasification, L , appears in both terms of equation 3 above, NIST proceeded iteratively to get a value for it when fitting a line to the combination of the nine measured HRR data points plus the forced point at an external flux of zero.
The plots in Figs. A–7 through A–12 are a result of the above process. The lowest point on the left in each plot corresponds to the imposed flame flux of 33 kW/m2. The fitted line was forced through this point but gave a least squares fit to the remaining points which were averaged HRR values from the cone calorimeter experiments. The abscissa is not the external flux measured in the cone calorimeter tests but rather an estimate of the total flux seen by the sample surface. Thus the abscissa is simply the sum of the cone calorimeter flux plus the estimated 33 kW/m2 flame flux. This is more in keeping with the heat flux the FDS model would use, though, in fact, the model used the gasification heat (not the fitted line in the Figures) to get mass loss rate from total incident heat flux via Equation (A–1), as described above, letting the model distribute the resulting heat release in the gas phase. In effect, however, the model followed the HRR values predicted by the fitted lines in the Figures. Thus, it predicted heat release rates in accord with the cone calorimeter experiments.
9 The other significant estimate here is that the surface re-radiation loss is the same for all of the materials at a value of
10 kW/m2. This correspond to a surface temperature of 375 °C.

Determination of Flammability Properties
NIST NCSTAR 1-5C, WTC Investigation 85
Figure A–7a. Heat flux dependence of averaged HRR; workstation
desk surface; HRR averaged within 80 percent of peak HRR.
Figure A–7b. Heat flux dependence of averaged HRR; workstation
desk surface; HRR averaged over entire burn duration.
.

Appendix A
86 NIST NCSTAR 1-5C, WTC Investigation
Figure A–8a. Heat flux dependence of averaged HRR; chair seat
assembly; HRR averaged within 80 percent of peak HRR.
Figure A–8b. Heat flux dependence of averaged HRR; chair seat
assembly; HRR averaged over entire burn duration.

Determination of Flammability Properties
NIST NCSTAR 1-5C, WTC Investigation 87
Figure A–9. Heat flux dependence of averaged HRR; HRR averaged
within 80 percent of peak HRR
Figure A–10. Heat flux dependence of averaged HRR; workstation
privacy panel; HRR averaged within 80 percent or peak HRR.

Appendix A
88 NIST NCSTAR 1-5C, WTC Investigation
Figure A–11a. Heat flux dependence of averaged HRR; paper stack;
HRR averaged within 80 percent of peak HRR.
Figure A–11b. Heat flux dependence of averaged HRR; paper stack;
HRR averaged within 60 percent of peak HRR.

Determination of Flammability Properties
NIST NCSTAR 1-5C, WTC Investigation 89
Figure A–12a. Heat flux dependence of averaged HRR; computer monitor shell; HRR
averaged within 80 percent of peak HRR.
Figure A–12b. Heat flux dependence of averaged HRR; computer monitor shell; HRR
averaged within 50 percent of peak HRR.

Appendix A
90 NIST NCSTAR 1-5C, WTC Investigation
The values of the heats of gasification in Table A–2 were sometimes calculated in two ways to emphasize either early or overall behavior (as described above) for the six material combinations characterized here. The first two parameters pertain to ignitability and are discussed below. The heat of combustion was, as noted above, obtained from the cone calorimeter tests as the ratio of the HRR to the mass loss rate from the sample. These are both instantaneous values, and the heat of combustion may vary with time. Only the sample mass was actually measured as a function of time. The mass loss rate was obtained by differentiating mass versus time, which could yield quite a noisy result. Thus, the heat of combustion data from the cone calorimeter were filtered and then averaged, typically over a range from 10 percent to 90 percent weight loss from the sample. Each heat of gasification was obtained from the slope of a fitted line in Figs. A–7 through A–12 and the average heat of combustion. The total available heat per unit sample area, which can vary with heat flux, is the time integral of the HRR curve and is reported out by the cone calorimeter software. The burning times reported in the Table are derived from the total available heat and the average HRR, as described above. They were not used directly by the FDS model and are shown just to indicate their magnitude (and their variation among the six materials). Note that the fabric cover on the privacy panels had a burn time of less than 1 min while the desk surface had a burn time that approached 30 min.10 For the upper values of heat of gasification and of burning time in the Table, the HRR curves were averaged around the peak values; typically the averaged values were those within 80 percent of the absolute peak value, a technique used with some success in (Dillon, Kim, and Quintiere 1998). This averaging helped smooth some of the noise inherent in a peak, particularly from a physically complex composite. The lower values were typically close to the overall test average HRR.
As discussed in Sec. 3.2.2, some of the materials, notably the fabric on the privacy panels and the overall chair, behaved in a substantially different way than in the above cone calorimeter tests. This was a result of their thermoplastic nature. As a result, it was ultimately necessary to treat the burning of these in a more heuristic manner.
A.4 IGNITION BEHAVIOR
Piloted ignition delay time was measured at several incident radiant heat fluxes, as described above. The two ignition parameters reported in Table A–2 were derived by matching the experimental ignition time data with a one-dimensional numerical model of heat conduction in a homogeneous solid of finite thickness with constant thermal properties. The front boundary condition includes an incident radiant flux (here taken to be absorbed at the surface), a natural convective loss, and a gray-body re-radiative loss. The rear boundary condition was taken to be adiabatic since the cone calorimeter samples were insulated on their back side. The front surface convective loss was estimated for a horizontal cone calorimeter sample using a standard heat transfer correlation.
The ignition temperature was first estimated by repeated runs of the model near the minimum flux for ignition. The thermal inertia was then estimated by matching the measured ignition delay time at 20 kW/m2 (somewhat higher for the desk surface). This low flux matching was chosen to enhance the likelihood that the FDS model would correctly predict the early fire growth on the workstation. The thermal inertia thus obtained was an effective value that absorbs any deviations between the inert heat conduction model and the actual behavior of the sample. Thus, for example, the endothermic heat of melting of the nylon fibers on the face of the carpet was implicit in the inferred value of thermal inertia 10 These are square wave burn times. The real materials tend to tail off gradually and thus to burn weakly for a longer time.

Determination of Flammability Properties
NIST NCSTAR 1-5C, WTC Investigation 91
for the carpet. Typically, thermal inertia values inferred in this manner were appreciably larger than the product of handbook values for thermal conductivity, density and heat capacity. Nevertheless, they were quite capable of reproducing the observed ignition behavior. Figures A–13 through A–18 show both the experimental ignition behavior measured in the cone calorimeter and the calculated behavior based on the ignition temperature and effective thermal inertia given in Table A–2.
The ignition behavior shown in these figures is all based on the use of a pilot (in this case an electric spark) in the gas phase just a few centimeters above the gasifying surface. Thus, as soon as an ignitable mixture was present in this space immediately above the sample surface, it did ignite. The full-scale experiments on actual workstations had no such guarantee of immediate ignition. As discussed in the above section on the workstation fire tests, this led to behavior that was dependent on the appearance of pilot flames, which were often provided by paper piles that could auto-ignite.
Figure A–13. Workstation desk surface; ignition delay time vs. incident heat flux.
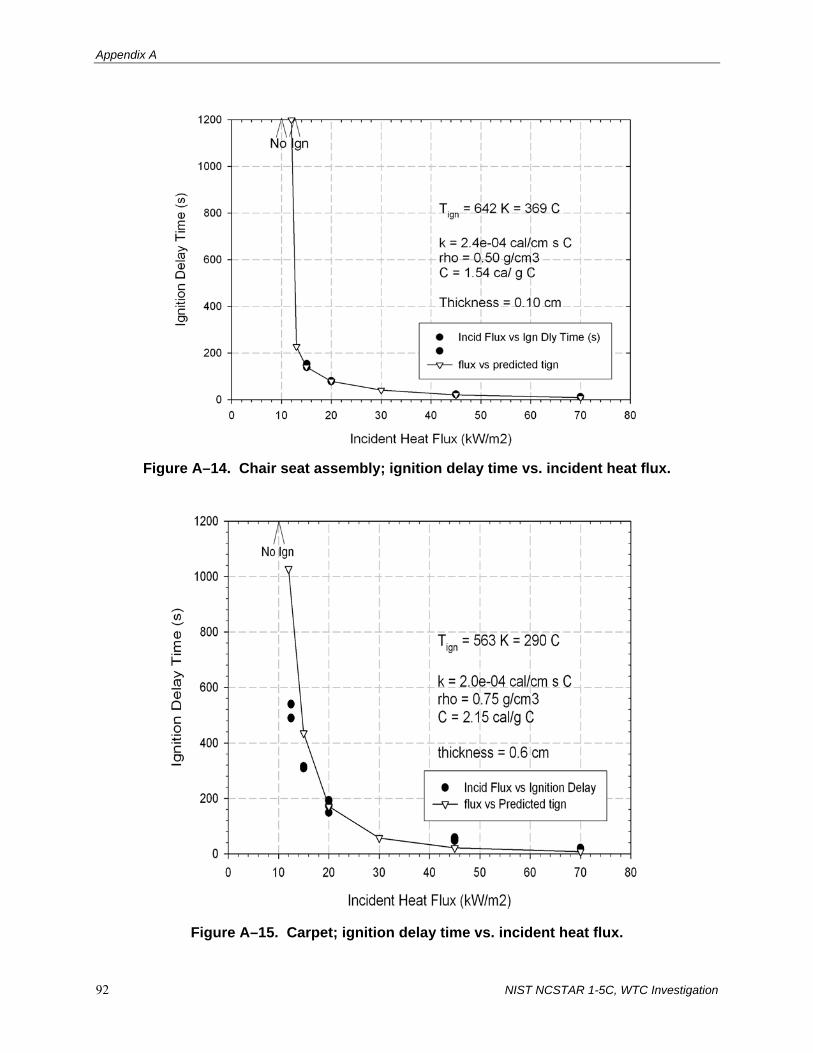
Appendix A
92 NIST NCSTAR 1-5C, WTC Investigation
Figure A–14. Chair seat assembly; ignition delay time vs. incident heat flux.
Figure A–15. Carpet; ignition delay time vs. incident heat flux.
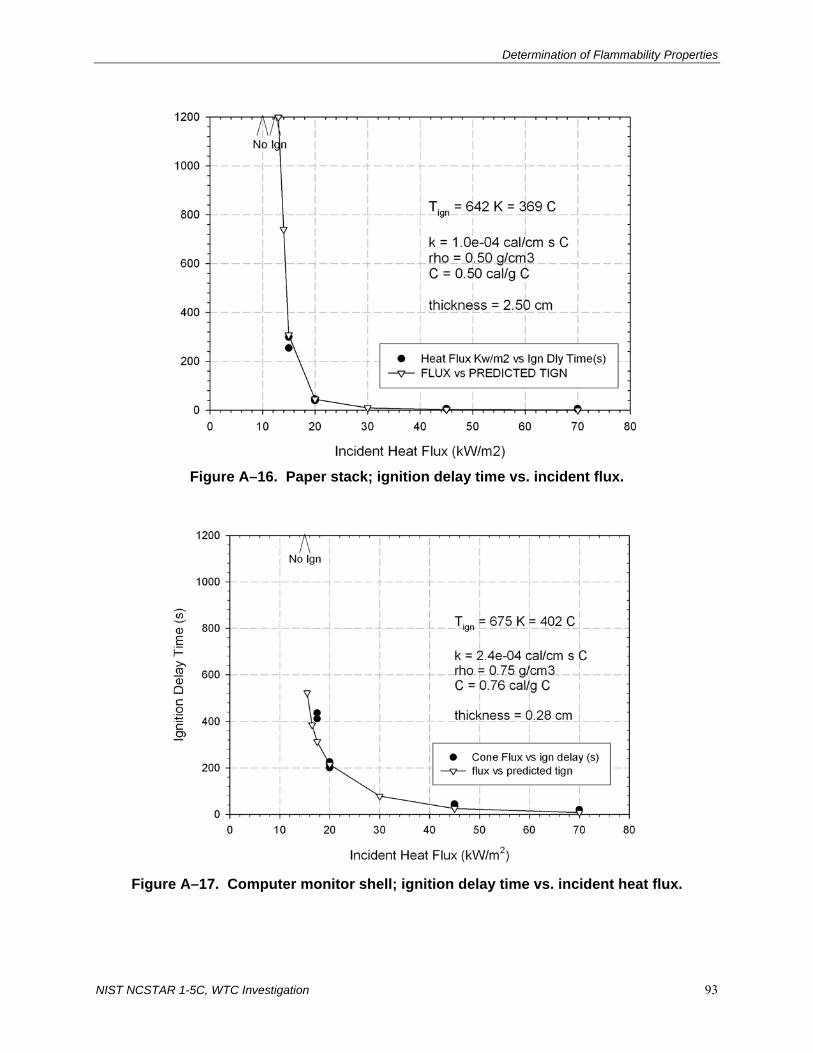
Determination of Flammability Properties
NIST NCSTAR 1-5C, WTC Investigation 93
Figure A–16. Paper stack; ignition delay time vs. incident flux.
Figure A–17. Computer monitor shell; ignition delay time vs. incident heat flux.

Appendix A
94 NIST NCSTAR 1-5C, WTC Investigation
Figure A–18. Workstation privacy panel; ignition delay time vs. incident heat flux.
A.5 REFERENCES
Dillon, S., W. Kim, and J. Quintiere. 1998. Determination of Properties and the Prediction of the Energy Release Rate of Materials in the ISO 9705 Room-Corner Test, National Institute of Standards and Technology Report NIST-GCR-98-753, July.
Kashiwagi, T. 2003. Personal Communication to T.J. Ohlemiller, National Institute of Standards and Technology, Gaithersburg, MD.
Ohlemiller, T. 1999. Fire Safety Journal, 32, p. 159.
Quintiere, J., and B. Rhodes. 1994. Fire Growth Models for Materials, Final Report to the National Institute of Standards and Technology on Grant Number 60NANB2D166, January.
Ritchie, S., K. Steckler, A. Hamins, T. Cleary, J. Yang, and T. Kashiwagi. 1997. Effect of Sample Size on Heat Release Rate of Charring Materials, Proceedings of the Fifth International Symposium on Fire Safety Science, IAFSS, Boston, MA, pp 177-188.