Embed Size (px)
Citation preview
Hydrogen BondsDOI: 10.1002/ange.200802630
Finite Size Effects on Hydrogen Bonds in Confined Water**Raluca Musat, Jean Philippe Renault,* Marco Candelaresi, D. Jason Palmer, Sophie Le Ca�r,Roberto Righini, and Stanislas Pommeret
Bulk water has unique properties deriving from its ability toform a labile hydrogen-bond network.[1,2] However, water isoften not present in its bulk form but rather trapped in smallcavities (e.g., water in concrete, clays, zeolites, and nano-channels). Consequently, many efforts have been devoted todescribing the confinement effects on the structure anddynamics of water.[3–7] The present understanding is thatnanoconfinement induces a freezing of the molecular motionsnear the confining surface on a layer with a thickness of 0.4–0.8 nm.[8–11] Herein we clearly demonstrate that even largepores (up to 50 nm diameter), in which interfacial effects arenegligible, can alter the properties of water. The hydrogen-bond network properties in confined media have been tracedin real time by transient absorption infrared spectroscopy ofthe OH vibration.
We performed IR pump–probe experiments on nano-confined water in fully hydrated controlled-pore glasses(CPG) of 1, 13, and 50 nm pore diameters, on surface waterin low-hydration CPG (1 nm), and on bulk water.[12] Wedecided to work with dilute HOD in D2O to suppress energytransfer between neighboring OH vibrators and to tune theoptical density of the sample.
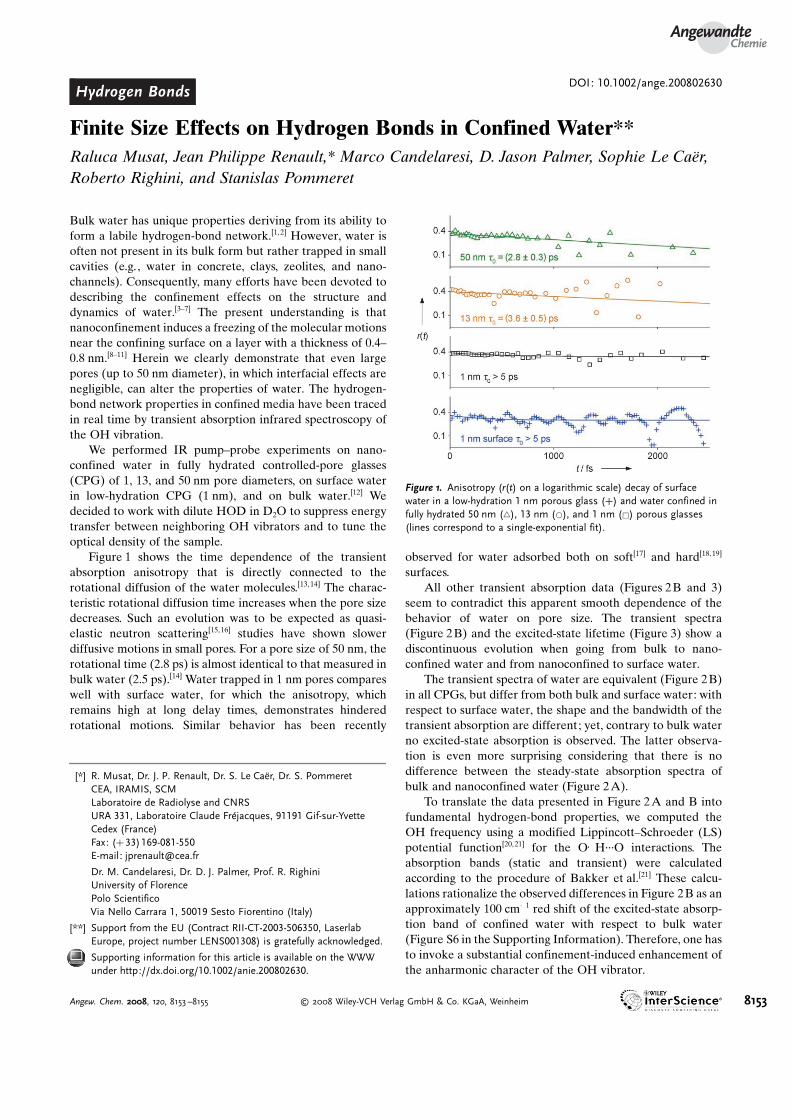
Figure 1 shows the time dependence of the transientabsorption anisotropy that is directly connected to therotational diffusion of the water molecules.[13,14] The charac-teristic rotational diffusion time increases when the pore sizedecreases. Such an evolution was to be expected as quasi-elastic neutron scattering[15,16] studies have shown slowerdiffusive motions in small pores. For a pore size of 50 nm, therotational time (2.8 ps) is almost identical to that measured inbulk water (2.5 ps).[14] Water trapped in 1 nm pores compareswell with surface water, for which the anisotropy, whichremains high at long delay times, demonstrates hinderedrotational motions. Similar behavior has been recently
observed for water adsorbed both on soft[17] and hard[18,19]
surfaces.All other transient absorption data (Figures 2B and 3)
seem to contradict this apparent smooth dependence of thebehavior of water on pore size. The transient spectra(Figure 2B) and the excited-state lifetime (Figure 3) show adiscontinuous evolution when going from bulk to nano-confined water and from nanoconfined to surface water.
The transient spectra of water are equivalent (Figure 2B)in all CPGs, but differ from both bulk and surface water: withrespect to surface water, the shape and the bandwidth of thetransient absorption are different; yet, contrary to bulk waterno excited-state absorption is observed. The latter observa-tion is even more surprising considering that there is nodifference between the steady-state absorption spectra ofbulk and nanoconfined water (Figure 2A).
To translate the data presented in Figure 2A and B intofundamental hydrogen-bond properties, we computed theOH frequency using a modified Lippincott–Schroeder (LS)potential function[20,21] for the O�H···O interactions. Theabsorption bands (static and transient) were calculatedaccording to the procedure of Bakker et al.[21] These calcu-lations rationalize the observed differences in Figure 2B as anapproximately 100 cm�1 red shift of the excited-state absorp-tion band of confined water with respect to bulk water(Figure S6 in the Supporting Information). Therefore, one hasto invoke a substantial confinement-induced enhancement ofthe anharmonic character of the OH vibrator.
Figure 1. Anisotropy (r(t) on a logarithmic scale) decay of surfacewater in a low-hydration 1 nm porous glass (+) and water confined infully hydrated 50 nm (~), 13 nm (*), and 1 nm (&) porous glasses(lines correspond to a single-exponential fit).
[*] R. Musat, Dr. J. P. Renault, Dr. S. Le Ca1r, Dr. S. PommeretCEA, IRAMIS, SCMLaboratoire de Radiolyse and CNRSURA 331, Laboratoire Claude Fr7jacques, 91191 Gif-sur-YvetteCedex (France)Fax: (+33)169-081-550E-mail: [email protected]
Dr. M. Candelaresi, Dr. D. J. Palmer, Prof. R. RighiniUniversity of FlorencePolo ScientificoVia Nello Carrara 1, 50019 Sesto Fiorentino (Italy)
[**] Support from the EU (Contract RII-CT-2003-506350, LaserlabEurope, project number LENS001308) is gratefully acknowledged.
Supporting information for this article is available on the WWWunder http://dx.doi.org/10.1002/anie.200802630.
AngewandteChemie
8153Angew. Chem. 2008, 120, 8153 –8155 � 2008 Wiley-VCH Verlag GmbH & Co. KGaA, Weinheim
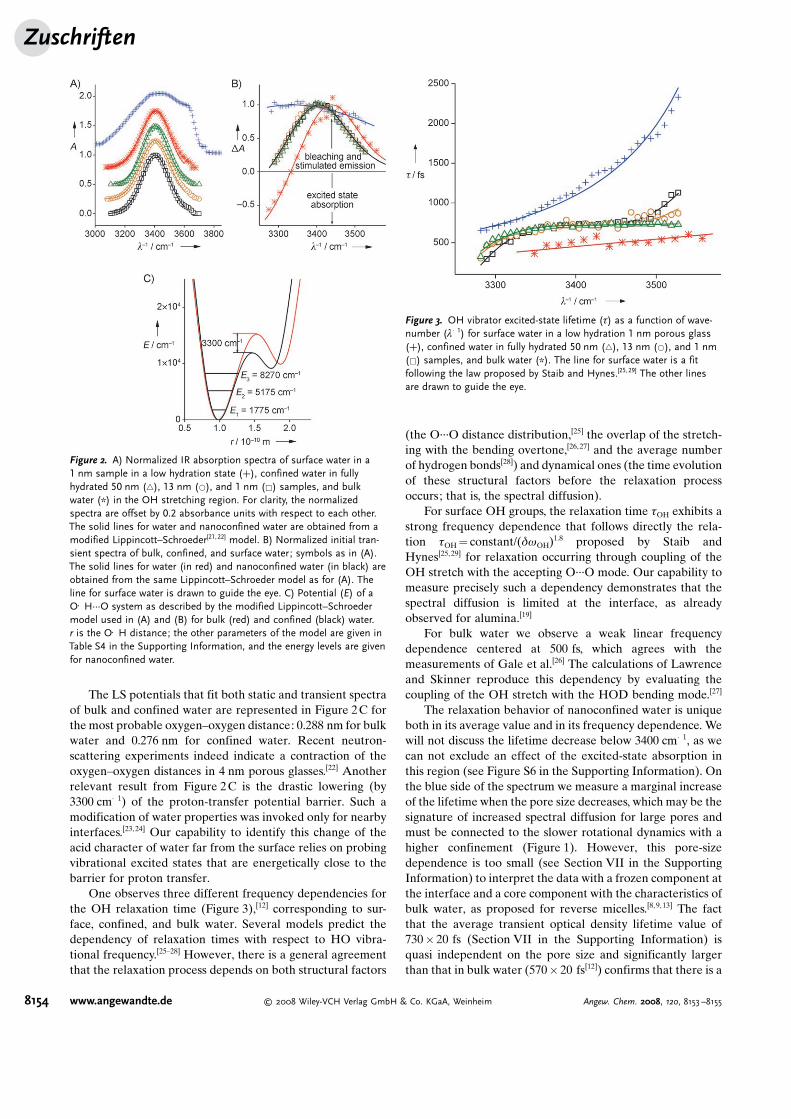
The LS potentials that fit both static and transient spectraof bulk and confined water are represented in Figure 2C forthe most probable oxygen–oxygen distance: 0.288 nm for bulkwater and 0.276 nm for confined water. Recent neutron-scattering experiments indeed indicate a contraction of theoxygen–oxygen distances in 4 nm porous glasses.[22] Anotherrelevant result from Figure 2C is the drastic lowering (by3300 cm�1) of the proton-transfer potential barrier. Such amodification of water properties was invoked only for nearbyinterfaces.[23,24] Our capability to identify this change of theacid character of water far from the surface relies on probingvibrational excited states that are energetically close to thebarrier for proton transfer.
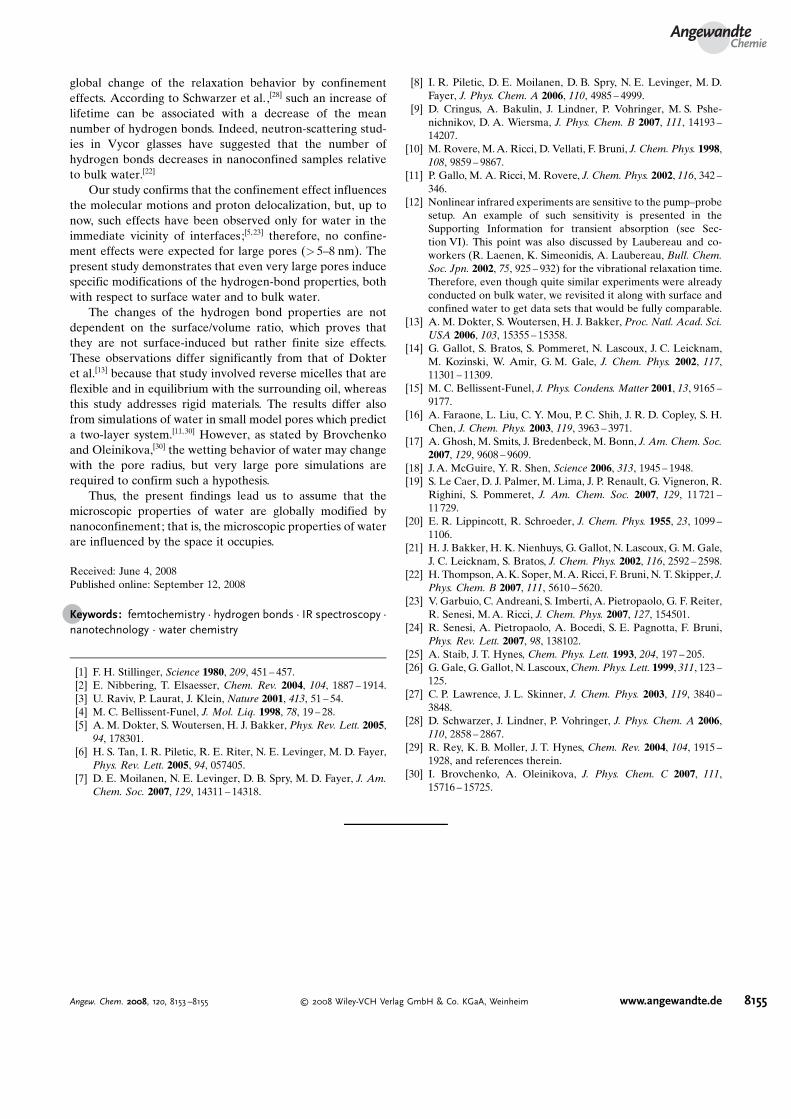
One observes three different frequency dependencies forthe OH relaxation time (Figure 3),[12] corresponding to sur-face, confined, and bulk water. Several models predict thedependency of relaxation times with respect to HO vibra-tional frequency.[25–28] However, there is a general agreementthat the relaxation process depends on both structural factors
(the O···O distance distribution,[25] the overlap of the stretch-ing with the bending overtone,[26,27] and the average numberof hydrogen bonds[28]) and dynamical ones (the time evolutionof these structural factors before the relaxation processoccurs; that is, the spectral diffusion).
For surface OH groups, the relaxation time tOH exhibits astrong frequency dependence that follows directly the rela-tion tOH = constant/(dwOH)
1.8 proposed by Staib andHynes[25,29] for relaxation occurring through coupling of theOH stretch with the accepting O···O mode. Our capability tomeasure precisely such a dependency demonstrates that thespectral diffusion is limited at the interface, as alreadyobserved for alumina.[19]
For bulk water we observe a weak linear frequencydependence centered at 500 fs, which agrees with themeasurements of Gale et al.[26] The calculations of Lawrenceand Skinner reproduce this dependency by evaluating thecoupling of the OH stretch with the HOD bending mode.[27]
The relaxation behavior of nanoconfined water is uniqueboth in its average value and in its frequency dependence. Wewill not discuss the lifetime decrease below 3400 cm�1, as wecan not exclude an effect of the excited-state absorption inthis region (see Figure S6 in the Supporting Information). Onthe blue side of the spectrum we measure a marginal increaseof the lifetime when the pore size decreases, which may be thesignature of increased spectral diffusion for large pores andmust be connected to the slower rotational dynamics with ahigher confinement (Figure 1). However, this pore-sizedependence is too small (see Section VII in the SupportingInformation) to interpret the data with a frozen component atthe interface and a core component with the characteristics ofbulk water, as proposed for reverse micelles.[8,9, 13] The factthat the average transient optical density lifetime value of730� 20 fs (Section VII in the Supporting Information) isquasi independent on the pore size and significantly largerthan that in bulk water (570� 20 fs[12]) confirms that there is a
Figure 2. A) Normalized IR absorption spectra of surface water in a1 nm sample in a low hydration state (+), confined water in fullyhydrated 50 nm (~), 13 nm (*), and 1 nm (&) samples, and bulkwater (*) in the OH stretching region. For clarity, the normalizedspectra are offset by 0.2 absorbance units with respect to each other.The solid lines for water and nanoconfined water are obtained from amodified Lippincott–Schroeder[21,22] model. B) Normalized initial tran-sient spectra of bulk, confined, and surface water; symbols as in (A).The solid lines for water (in red) and nanoconfined water (in black) areobtained from the same Lippincott–Schroeder model as for (A). Theline for surface water is drawn to guide the eye. C) Potential (E) of aO�H···O system as described by the modified Lippincott–Schroedermodel used in (A) and (B) for bulk (red) and confined (black) water.r is the O�H distance; the other parameters of the model are given inTable S4 in the Supporting Information, and the energy levels are givenfor nanoconfined water.
Figure 3. OH vibrator excited-state lifetime (t) as a function of wave-number (l�1) for surface water in a low hydration 1 nm porous glass(+), confined water in fully hydrated 50 nm (~), 13 nm (*), and 1 nm(&) samples, and bulk water (*). The line for surface water is a fitfollowing the law proposed by Staib and Hynes.[25,29] The other linesare drawn to guide the eye.
Zuschriften
8154 www.angewandte.de � 2008 Wiley-VCH Verlag GmbH & Co. KGaA, Weinheim Angew. Chem. 2008, 120, 8153 –8155
global change of the relaxation behavior by confinementeffects. According to Schwarzer et al.,[28] such an increase oflifetime can be associated with a decrease of the meannumber of hydrogen bonds. Indeed, neutron-scattering stud-ies in Vycor glasses have suggested that the number ofhydrogen bonds decreases in nanoconfined samples relativeto bulk water.[22]
Our study confirms that the confinement effect influencesthe molecular motions and proton delocalization, but, up tonow, such effects have been observed only for water in theimmediate vicinity of interfaces;[5,23] therefore, no confine-ment effects were expected for large pores (> 5–8 nm). Thepresent study demonstrates that even very large pores inducespecific modifications of the hydrogen-bond properties, bothwith respect to surface water and to bulk water.
The changes of the hydrogen bond properties are notdependent on the surface/volume ratio, which proves thatthey are not surface-induced but rather finite size effects.These observations differ significantly from that of Dokteret al.[13] because that study involved reverse micelles that areflexible and in equilibrium with the surrounding oil, whereasthis study addresses rigid materials. The results differ alsofrom simulations of water in small model pores which predicta two-layer system.[11,30] However, as stated by Brovchenkoand Oleinikova,[30] the wetting behavior of water may changewith the pore radius, but very large pore simulations arerequired to confirm such a hypothesis.
Thus, the present findings lead us to assume that themicroscopic properties of water are globally modified bynanoconfinement; that is, the microscopic properties of waterare influenced by the space it occupies.
Received: June 4, 2008Published online: September 12, 2008
.Keywords: femtochemistry · hydrogen bonds · IR spectroscopy ·nanotechnology · water chemistry
[1] F. H. Stillinger, Science 1980, 209, 451 – 457.[2] E. Nibbering, T. Elsaesser, Chem. Rev. 2004, 104, 1887 – 1914.[3] U. Raviv, P. Laurat, J. Klein, Nature 2001, 413, 51 – 54.[4] M. C. Bellissent-Funel, J. Mol. Liq. 1998, 78, 19 – 28.[5] A. M. Dokter, S. Woutersen, H. J. Bakker, Phys. Rev. Lett. 2005,
94, 178301.[6] H. S. Tan, I. R. Piletic, R. E. Riter, N. E. Levinger, M. D. Fayer,
Phys. Rev. Lett. 2005, 94, 057405.[7] D. E. Moilanen, N. E. Levinger, D. B. Spry, M. D. Fayer, J. Am.
Chem. Soc. 2007, 129, 14311 – 14318.
[8] I. R. Piletic, D. E. Moilanen, D. B. Spry, N. E. Levinger, M. D.Fayer, J. Phys. Chem. A 2006, 110, 4985 – 4999.
[9] D. Cringus, A. Bakulin, J. Lindner, P. Vohringer, M. S. Pshe-nichnikov, D. A. Wiersma, J. Phys. Chem. B 2007, 111, 14193 –14207.
[10] M. Rovere, M.A. Ricci, D. Vellati, F. Bruni, J. Chem. Phys. 1998,108, 9859 – 9867.
[11] P. Gallo, M. A. Ricci, M. Rovere, J. Chem. Phys. 2002, 116, 342 –346.
[12] Nonlinear infrared experiments are sensitive to the pump–probesetup. An example of such sensitivity is presented in theSupporting Information for transient absorption (see Sec-tion VI). This point was also discussed by Laubereau and co-workers (R. Laenen, K. Simeonidis, A. Laubereau, Bull. Chem.Soc. Jpn. 2002, 75, 925 – 932) for the vibrational relaxation time.Therefore, even though quite similar experiments were alreadyconducted on bulk water, we revisited it along with surface andconfined water to get data sets that would be fully comparable.
[13] A. M. Dokter, S. Woutersen, H. J. Bakker, Proc. Natl. Acad. Sci.USA 2006, 103, 15355 – 15358.
[14] G. Gallot, S. Bratos, S. Pommeret, N. Lascoux, J. C. Leicknam,M. Kozinski, W. Amir, G. M. Gale, J. Chem. Phys. 2002, 117,11301 – 11309.
[15] M. C. Bellissent-Funel, J. Phys. Condens. Matter 2001, 13, 9165 –9177.
[16] A. Faraone, L. Liu, C. Y. Mou, P. C. Shih, J. R. D. Copley, S. H.Chen, J. Chem. Phys. 2003, 119, 3963 – 3971.
[17] A. Ghosh, M. Smits, J. Bredenbeck, M. Bonn, J. Am. Chem. Soc.2007, 129, 9608 – 9609.
[18] J.A. McGuire, Y. R. Shen, Science 2006, 313, 1945 – 1948.[19] S. Le Caer, D. J. Palmer, M. Lima, J. P. Renault, G. Vigneron, R.
Righini, S. Pommeret, J. Am. Chem. Soc. 2007, 129, 11721 –11729.
[20] E. R. Lippincott, R. Schroeder, J. Chem. Phys. 1955, 23, 1099 –1106.
[21] H. J. Bakker, H. K. Nienhuys, G. Gallot, N. Lascoux, G. M. Gale,J. C. Leicknam, S. Bratos, J. Chem. Phys. 2002, 116, 2592 – 2598.
[22] H. Thompson, A.K. Soper, M.A. Ricci, F. Bruni, N. T. Skipper, J.Phys. Chem. B 2007, 111, 5610 – 5620.
[23] V. Garbuio, C. Andreani, S. Imberti, A. Pietropaolo, G. F. Reiter,R. Senesi, M.A. Ricci, J. Chem. Phys. 2007, 127, 154501.
[24] R. Senesi, A. Pietropaolo, A. Bocedi, S. E. Pagnotta, F. Bruni,Phys. Rev. Lett. 2007, 98, 138102.
[25] A. Staib, J. T. Hynes, Chem. Phys. Lett. 1993, 204, 197 – 205.[26] G. Gale, G. Gallot, N. Lascoux,Chem. Phys. Lett. 1999, 311, 123 –
125.[27] C. P. Lawrence, J. L. Skinner, J. Chem. Phys. 2003, 119, 3840 –
3848.[28] D. Schwarzer, J. Lindner, P. Vohringer, J. Phys. Chem. A 2006,
110, 2858 – 2867.[29] R. Rey, K. B. Moller, J. T. Hynes, Chem. Rev. 2004, 104, 1915 –
1928, and references therein.[30] I. Brovchenko, A. Oleinikova, J. Phys. Chem. C 2007, 111,
15716 – 15725.
AngewandteChemie
8155Angew. Chem. 2008, 120, 8153 –8155 � 2008 Wiley-VCH Verlag GmbH & Co. KGaA, Weinheim www.angewandte.de


![How do hydrogen bonds influence thermophoresis? · Hydrogen bonds: temperature effect [Kishikawa, Y., SW, and R. Kita, Biomacromolecules, 11 (2010) 740] Many, but not all aqueous](https://img.dokumen.tips/doc/110x75/5ed6a3c9f8f40e7c16721f76/how-do-hydrogen-bonds-influence-thermophoresis-hydrogen-bonds-temperature-effect.jpg)