Embed Size (px)
Citation preview

ARCHIVES OF CIVIL ENGINEERING, LVI, 1, 2010
DOI: 10.2478/v.10169-010-0002-0
FINITE ELEMENT MODELLING OF THE BEHAVIOUR OF A CERTAIN CLASSOF COMPOSITE STEEL-CONCRETE BEAM-TO-COLUMN JOINTS
M. A. GIŻEJOWSKI1, W. BARCEWICZ2, W. SALAH3
Beam-to-column end-plate joints can be classified as rigid (fully restrained), semi-rigid (partiallyrestrained) or pinned, depending on their type, configuration and the connector arrangement. Fullyrestrained joints are needed for rigid frames in which there is assumed that the frame joints havesufficient rigidity to maintain – under the service state – the angles between the intersecting mem-bers, ensuring the full moment transfer. In contrast in semi-continuous frames, partially restrainedjoints are characterized by relative rotations occurring between the intersecting members so thatthe bending moment can only be transferred partially. In recent years, the idea of using partiallyrestrained, unstiffened joints in building structures has gained momentum since this idea appearsto be more practical and economical. Semi-continuous frames can resist actions by the bendingmoment transfer in partially restrained joints, allowing in the same time for a certain degree ofrotation that enhances the overall ductile performance of these structures. One of the effective waysthat affects ductility of end-plate beam-to-column joints is to use thinner end-plates than those usednowadays in practical applications. In the current study, a certain class of steel-concrete compositejoints is examined in which the thickness of end-plates is to be equivalent to approximately 40-60%of the bolt diameter used in all the composite joints investigated in the considered joint class. Thispaper is an extension of the authors’ earlier investigation on numerical modelling of the behaviourof steel frame joints. The aim of current investigations is to develop as simple as possible andyet reliable three-dimensional (3D) FE model of the composite joint behaviour that is capable ofcapturing the important factors controlling the performance of steel-concrete end-plate joints inwhich the end-plate thickness is chosen to be lesser than that used nowadays in conventional jointdetailing. A 3D FE model constructed for composite joints of the considered joint class is reportedin this paper and numerical simulations using the ABAQUS computer code are validated againstexperimental investigations conducted at the Warsaw University of Technology. Comparison betwe-en the nonlinear FE analysis and full scale experimental results of the considered class of compositejoints is presented which conclusively allows for the accuracy assessment of the modelling tech-nique developed. Comparison between the FE results and test data shows a reasonable agreementbetween the numerical FE model developed and physical model of experimentally examined jointspecimens. Finally, practical conclusions for engineering applications are drawn.
1 PhD. DSc., Faculty of Civil Engineering, Warsaw University of Technology, Poland, e-mail:[email protected]
2 PhD Student, Faculty of Civil Engineering, Warsaw University of Technology, Poland, e-mail:[email protected]
3 PhD, Civil Engineering Department, Al-Azhar University, Cairo, Egypt, e-mail: [email protected]; formerly PhD Student, Faculty of Civil Engineering, Warsaw University of Technology,Poland

20 M. A. G, W. B, W. S
Key words: joint, composite, steel-concrete, end-plate, finite element model, nonlinear analysis, inelasticbehaviour.
1. I
Composite structures, exploring advantages of concrete and structural steel, have beenincreasingly applied in commercial and parking buildings. The effective applicationof steel and concrete leads to the increased strength and stiffness if compared withtraditional solutions such as bare steel or reinforced concrete structural elements. Dueto advantages of composite construction, the scope of application of composite actionsin steel frameworks have been widened, finally involving not only the composite actionbetween the structural floor beams and the reinforced concrete slab, but also takingadvantage of composite joints. Design rules for composite joints were developed on thebasis of worldwide research efforts since there had been rather limited guidance andlack of expertise in this field, e.g. S S et al. [1]. Existing design rules ofEurocode 4 [2] are not however general since they do not cover all possible solutions,especially in design of composite joints.
Investigations into understanding of the beam-to-column joint behaviour have com-menced at the beginning of the last century, see B and K [3], amongothers. Originally, most of the studies were dedicated to steel structures and focused onestimation of the load carrying capacity and prediction of the structural behaviour interms of load–deflection curves and failure mechanisms. Recent steelwork Eurocode 3[4] includes the practical aspects of the steel joint behaviour prediction in terms of stif-fness, strength and rotation capacity. More recently, research has been directed towardsthe behaviour of composite joints (refer to K [5], B and K [6]).The nonlinear analysis of composite structures, carried out up to the failure limit, israther difficult due to the complexity of physical phenomena accompanying the struc-ture deterioration process under increasing actions, bond interaction between concreteand steel parts, stress redistribution between the concrete and steel reinforcement aftercracking, interaction of the behaviour of steel beam shear studs and concrete, thepresence of any profiled metal decking, occurrence of slip between the steel parts andreinforced concrete slab, and due to a variety of all other possible local effects existingin the structure composed of such different materials like steel and concrete, with re-gard to the overall ductility behaviour. Modelling of composite steel-concrete end-platejoints can be conveniently carried out after the detailed investigations of the bare steelend-plate joint behaviour and full understanding of the composite steel-concrete beambehaviour. The results for end-plate joints are greatly influenced by the behaviour ofend-plates and bolts. In end-plate beam-to-column joints where the thickness of theend-plate is smaller than that used nowadays in steel frame systems, the bolt failure ispurposefully prevented and the joint behaviour is to be controlled by the ductility ofend-plate and their weld connectors, see G at al. [7] – for flush end-plates

F . . . 21
and [8] – extended end-plates. Results of these investigations are considered hereintogether with modelling techniques developed for composite beams.
Composite steel-concrete beams are formed typically from rolled sections andreinforced concrete slab of a constant thickness or a variable thickness when slab iscast in-situ on profiled sheeting, see J [9], U and L [10], K andL [11]. In case of profiled sheeting used for in-situ casting, it is treated as a lostdecking or it is assumed to play the role of an additional reinforcement of the compositebeam subjected to service loads. During the past two decades, different FE softwarepackages were used to study the nonlinear behaviour of composite structures. O etal. [12] developed a two dimensional nonlinear FE model for the analysis of compositebeams with partial interaction. This model is based on a plane frame nonlinear finiteelement analysis implemented to the computer code program INSTAF, originally de-veloped for steel frames. A numerical model that allows for a reliable analysis of thecomposite steel-concrete beams was proposed by F et al. [13]. This proposedmodel was able to describe the main mechanical phenomenon of the composite beamsunder sagging bending. In addition, a generalized relationship of the moment-curvaturecharacteristic was proposed. B and S [14] developed 3D FE modelusing ABAQUS code to analyse four simply supported composite plate girders. Theflanges, web and stiffener plates of the steel girder were modelled by 8-node doublycurved thin shell elements and the concrete deck slab by thick shell elements. Reinfor-cement was modelled with the REBAR LAYER option available in the ABAQUS code.L et al. [15] developed a 3D FE model to consider the geometric and materialnonlinear behaviour of continuous composite beams. The FE program ABAQUS wasutilized to investigate the strength of continuous composite beams under the combinedeffects of bending and shear. The four-node doubly curved general shell elements withreduced integration were employed to model the concrete slab, the flanges and the webof the steel beam. The stud shear connectors were modelled using 3D beam elements.Huber-von-Mises yield criterion was employed in the nonlinear analysis treating thematerial plasticity with five integration points through the element thickness. B etal. [16] carried out a numerical study using the ABAQUS code to predict the ultimatebehaviour of composite steel-concrete beams under negative moment and shear loading.Various combinations of material models and finite element types were investigated toidentify a suitable modelling technique for prediction of the ultimate load behaviour ofcomposite plate girders. Web, flanges and stiffeners were idealized using the elementS8R5 that is the 8-node doubly curved thin shell element, with reduced integrationpoints, using five degrees of freedom (DOFs) per node. The steel-concrete interactionwas modelled by two different approaches: (1) surface interaction technique, and (2)modelling with 3D beam elements. Concrete slab was modelled with the finite ele-ment C3D20 that is the 20-node quadratic brick element, and reinforcing bars wererepresented with using an ABAQUS option of REBAR LAYER. Bond strength at thesteel-concrete interface and shear studs were combined and modelled as horizontalfriction shear between the two interaction surfaces. 3D refined FE modelling technique

22 M. A. G, W. B, W. S
for simply supported composite beams using the ABAQUS code was described indetail by B and W [17]. A four-node general purpose shell elements S4R withreduced integration were used to model the steel girder, concrete slab and stiffeners.The steel reinforcement in concrete was modelled by means of REBAR LAYER thatis an available option in ABAQUS enabling to account for the effect of reinforcedconcrete. Full composite action between the concrete slab and the top flange of thesteel girder was considered using beam type multi-point constraints (MPCs). C
and S [18] investigated element compatibility and geometric error for the 3DFE modelling technique of composite steel-concrete girder bridges. Five 3D compositebridge models were analyzed using the general purpose FE software package ABA-QUS. Q et al. [19] conducted a numerical study on simply supported compositebeams considering the full and partial shear connection using ANSYS software. Theshell element SHELL43 defined by four nodes and having six DOFs at each nodewas used to model the steel section. The used shell element allowed for plasticity,creep, stress stiffening, large deformation and large strain capability. The solid elementSOLID65 with eight nodes and three translation DOFs at each node was assignedto represent the concrete slab. The nonlinear spring element COMBIN39, defined bytwo-node points, was adopted to simulate the shear connectors. Both longitudinal andtransversal reinforcing bars were modelled as smeared throughout the solid elements.F el al. [20] used the continuum elements available in the ABAQUS code to modelsemi-rigid composite joints with precast hollow core slabs. 3D continuum elementswere used to model all parts of the composite joints and the contact was applied expli-citly between all the joint components. G et al. [21] developed a modellingtechnique using the ABAQUS code and spring elements to represent the contributionof the shear stud behaviour to account for the different degree of composite action.G and S [22] discussed various aspects of this modelling technique for thediscretized composite beams, and used the outcomes from a number of simulations foran adequate modelling of composite beams. Numerical simulations were carried out tomodel the composite joint with the use of different element types. The authors pointedout some crucial modelling parameters that can significantly influence the modellingof composite joints, such as mesh size of the concrete slab, type of the element tobe used for modelling of the steel-concrete interaction and parameters affecting theconstitutive model of concrete.
This paper presents an initial study for modelling of composite steel-concretebeam-to-column joints. The class of joints considered is based on their steel counter-parts that were tested and numerically modelled by the authors in the earlier studies[7, 8]. Design of these joints varies widely, so that it is impossible to develop a generalanalytical model for the prediction of joint response. Instead, beam-to-column joint te-sts were conducted in order to determine the relationship describing the way in whichthe moment is transferred through the joint components. Practical behavioural jointmodels usually include a limited number of parameters taken into account from testdata. Thus, there is a need to numerically generate a reliable moment-rotation response

F . . . 23
of semi-rigid composite joints that can be used for calibration of an analytical expres-sion for the spring moment-rotation characteristic applied in engineering practice foranalysis and design, refer to G et al. [23]. The FE analysis conducted hereinemploys the ABAQUS code (see ABAQUS manuals [24], [25]) in order to preciselysimulate the various configurations of tested composite joints. The configuration ofcomposite joints is the same as for bare steel flush end-plate beam-to-column jointsanalyzed by the authors in [7] and for bare steel extended end-plate joints analyzedin [8]. The only difference is that composite joints are additionally equipped with theconcrete slab cast on the steel decking made of profiled sheeting and with steel shearstud connectors ensuring the composite action between the reinforced concrete slaband the steel rolled I-section beam.
2. B FE
Within the current research project, conducted in the Department of Building Structuresof the Warsaw University of Technology, laboratory tests were designed in order toinvestigate the behaviour of steel and steel-concrete composite joints under bendingconditions. The results of eight tests on composite beam-to-column joints are repor-ted. The steelwork part of the connection uses an end-plate welded to the beam andbolted to the column flange. The influence of detailing of end-plate connections withrespect to thickness and height of the end-plate and also a number and position of thebolts, depending on the height of the end-plate, as well as the influence of differentreinforcement ratio of the slab, is described. Two types of end-plates are used in thetests: flush and extended. Applied end-plates were relatively thin, i.e. the thickness ofabout 40-60% of the bolt diameter used in the end-plate-to-column-flange connection.For the purpose of comparing, the bare steel specimens were also tested with thesame arrangement as the steelwork part of composite steel-concrete joints. The generalarrangement of composite joint specimens is presented in Fig. 1. The joints detailingis given in Table 1.
Beam elements of all the specimens were made of IPE 300 and the columns ofHEB 200. All the steel elements (beams, columns and end-plates) were made of steelgrade S235JR. The bolt connectors were M20 of class 10.9. The concrete slab wascast on the dip-profiled sheeting, using the Cofraplus 60 composite flooring. The ribsof the sheeting were arranged in the transverse direction to the supporting beams. Thecomposite action was partially provided by the sheeting and the headed studs (SD φ19× 100 mm) that were friction welded to the upper flange of the beam. The concreteclass was of C25/30 (B30). The main slab reinforcing bars were made of steel gradeBSt500S. Tested composite specimens were divided into two groups, depending on thereinforcement ratio. An amount of the reinforcing bars was constant in both groups.The only difference was the diameter of the bars. In the first series, the diameter

24 M. A. G, W. B, W. S
Fig. 1. Summary of tested specimens.Rys. 1. Zestawienie elementów próbnych
was 8 mm, giving the reinforcement ratio of about 0.60% and in the second one –12 mm, giving this ratio of about 1.35% with respect to the total depth of the slababove the ribs. The effective width of the slab of 800 mm was used. The transversereinforcement consisted of bars of the diameter 6 mm. Under the position of loadapplication, additional embedded beam-like strips reinforced with 4 bars of 12 mm indiameter were designed to prevent concrete crushing on edges of the slab.
All the tests were conducted for the static loading increasing monotonically tillfailure. Two independent jacks were used to apply the same loads on each cantilevertip, at 1540 mm from the column face. The symmetrical arrangement was used tocontrol the specimen behaviour and any effect of imperfections that can cause thecolumn drift. A general view of setup of the test rig is shown in Fig. 2. The testingprocedure and the load history were designed using the moment resistance of jointspecimens calculated according to the component method of Eurocodes EN 1993-1-8[4] and EN 1994-1-1 [2].
The measurements taken for bare steel specimens were described in details in [7].The same positions and techniques of recording the measured readings were adopted

F . . . 25
Table 1Summary of tested specimens.
Zestawienie elementów próbnych
Specimen groups(concrete slab reinforcing bars)
End-plate thicknesstp (mm) Symbol used for joint Type of end-plate
Group #0Bare steel joints
10 ES1Flush
12 ES410 ES2
Extended8 ES3
Group #1Composite joints(6 φ 8 mm)
10 EZ1Flush
12 EZ410 EZ2
Extended8 EZ3
Group #2Composite joints(6 φ 12 mm)
10 EZ5Flush
12 EZ810 EZ6
Extended8 EZ7
in case of all the composite specimens tested. Moreover, for composite specimensadditional measurements were taken such as: deflection of the column by means ofinductive transducers positioned outside of the column flanges, above the slab; strainsin the longitudinal reinforcement bars by strain gauges; slip between the slab andbeam by means of inductive transducers located on the top surface of the beam flangenear the ribs of the slab at two points of each cantilever; strains in the concreteslab by the adaptive gauge and crack width by a microscope. An arrangement of theinstrumentation for tested specimens is shown in Fig. 1 as well as in Fig. 2.
By comparing the experimental results of the composite joints and those obtainedfor the corresponding bare steel joints, one could conclude that adding the concreteslab to the bare steel joint enhances the performance of such a joint in terms of both theinitial stiffness and the ultimate moment. Regarding the increase of the initial stiffness,there are factors of 2.1 for EZ1 and 2.5 for EZ5, indicating the ratio of the stiffnessof composite joints to the stiffness of their steel counterpart ES1, the joint with flushend-plate of 10 mm in thickness. For the composite joints with the flush end-plate of12 mm in thickness, namely EZ4 and EZ8, the initial stiffness increased by factors1.7 and 2.2, respectively, if compared with the stiffness of bare steel specimen ES4.The higher value of stiffness belongs to the group with the higher reinforcement ratio.There is a similar situation when the joint ultimate moment is taken into account. Forspecimens with the rebars of 8 mm in diameter, the ratio of the specimen EZ1 ultimatemoment to that of specimen ES1 is equal to 1.7 and for the specimens EZ4 comparedto ES4 this factor is equal to 1.6. For the specimens with the reinforcement of 12 mmin diameter, the ratio of the specimen EZ5 ultimate moment to that of specimen ES1is equal to 2.3 and for the specimens EZ8 compared to ES4 this factor is equal to 2.2.

26 M. A. G, W. B, W. S
Fig. 2. General setup of the test rig.Rys. 2. Widok ogólny stanowiska badawczego
The results for the bare steel joint with extended end-plate proved that the existenceof the concrete slab had a positive influence on the joint initial stiffness and theultimate moment capacity. The ratios depicting the increase of the initial stiffness foreach composite joint with extended end-plate in relation to its bare steel counterpartare following: for the group of specimens with the lower diameter of reinforcing bars(8 mm) – 1.5 for specimen EZ2 in relation to ES2, 1.4 for specimen EZ3 in relationto ES3, and for the group with the bigger diameter (12 mm) of the rebars – 1.8 forspecimen EZ6 in relation to ES2, 1.7 for specimen EZ7 in relation to ES3. The similarcomparisons are made for the evaluation of the increase of the ultimate moment andthey are presented below: for the first group 1.3 for specimen EZ2 with referenceto ES2, 1.4 for specimen EZ3 with reference to ES3 and for the second group 1.5for specimen EZ6 with reference to ES2, 1.8 for specimen EZ7 with reference toES3. These increased values of the initial stiffness as well as the ultimate momentof composite joints if compared with their steel counterparts proved that taking intoaccount a composite action of the joint results in visible economical profits.
The only disadvantage of the composite joints behaviour is a lower ductility at theultimate strength if compared with that observed for their steel counterparts (withoutthe concrete slab, decking and shear connectors).
As to the assessment of the mode of failure, the experimental investigations provedthat the brittle fracture of reinforcement is achieved at the ultimate strength for joints

F . . . 27
with the lower reinforcement ratio while for the joint with a higher value of this ratio– the ductile mode governed that was associated with the excessive yielding of thecolumn web panel, regardless the end-plate form (flush or extended) and the platethickness.
3. D
As it has been stated in the introduction, FE models developed and numerical simula-tions performed for the purpose of this paper are based on the FE package ABAQUS.The 3D refined FE modelling technique is used to investigate numerically the behaviourof composite steel-concrete beam-to-column joints tested experimentally. Nonlinearityresulting from the behaviour of materials employed for composite joint componentsand geometric nonlinearity are considered for all the load-displacement FE simulations.A general 3D view of modelled steel-concrete composite joints is depicted in Fig. 3.All the modelling details of steel beam-to-column joint components are the same asconsidered in the shell FE modelling technique described by the authors in [7, 8].
Fig. 3. 3D FE mesh for one of the analyzed composite joints.Rys. 3. Przestrzenna siatka elementów skończonych przykładowego węzła zespolonego
3.1. M
In the hogging moment regions, the concrete slab is mainly under tension. Modellingof concrete in negative bending regions is more complex than that in sagging zonessince subjected to tension. Since the concrete is weak in tension, it behaves in a

28 M. A. G, W. B, W. S
softening manner after reaching a certain strain value at the low level of load appli-cation. In FE analysis, Smeared Crack (SC) model available in ABAQUS is used tomodel the concrete material. In the SC model, cracking is assumed to occur when thestress reaches a failure surface that is called ”the crack detection surface”. This failuresurface represents a linear relationship between the equivalent pressure stress, p, andthe Huber-von-Mises equivalent deviatoric stress, q. When a crack has been detected,its orientation is stored for the subsequent calculations. Further cracking at the samepoint is restricted to being orthogonal to this direction since the stress components inconcrete with an open crack are not included in the direction of the failure surfaceused for the detection of additional cracks.
The CONCRETE option available in ABAQUS is used to define the stress-strainbehaviour of plain concrete not only in uniaxal tension but also in uniaxial compressionoutside the elastic range. Idealized concrete stress-strain relationship is diagrammati-cally shown in Fig. 4. In tension it is considered that concrete is a linear elasticmaterial up to the uniaxial tensile strength, and then a certain degradation model, e.g.the linear model as shown in Fig. 4, has to represent the concrete post-limit behaviourin tension. The post-limit behaviour for direct straining across cracks is modelled witha TENSION STIFFENING option in ABAQUS. This option allows for modelling ofthe behaviour of cracked reinforced concrete, since it allows for the bonding effectsand shear interaction between the reinforcing bars and concrete.
Fig. 4. Idealized uniaxial stress-strain relationship for concrete.Rys. 4. Idealizowana zaleznosc naprezenie-odksztalcenie dla betonu
Average values of the strength and stiffness properties of concrete obtained frommaterial tests for concrete of composite joints investigated experimentally are given in

F . . . 29
Table 2. The zero stress post-limit tensile strain factor used in the numerical simulationsis taken as 0.1.
Table 2Average values of concrete properties.
Uśrednione wartości właściwości betonu
Specimen groupsConcrete
classE
(MPa) f ′c (MPa) ε∗)u f ut (MPa) ε∗)0
Group #1 C25/30 36515 45.7 0.003 3.2 0.1
Group #2 C25/30 36314 50.5 0.003 3.6 0.1∗) Recommended default values
Concrete slab is modelled using thick 4-node general shell elements S4. Only thetop flat part of the concrete slab with thickness of 62 mm (see Fig. 1) is consideredin FE analysis and the shell elements representing the concrete slab are placed inthe middle thickness of the concrete flat part. The scheme with coarse mesh size ofapproximately ten times the steel parts mesh size – as suggested by G andS [22] – is used to discretize the concrete slab.
3.2. M
The steel reinforcement in the concrete slab is provided by means of REBAR LAYERthat is an available option in ABAQUS for modelling of reinforcing bars in the rein-forced concrete section. As it is described before, only the top flat part of the concreteslab is modelled and the effect of the concrete ribs is ignored for modelling simplicity.As a result, the actual reinforcement ratio referred to a concrete constant thickness ofthe concrete slab section of tested specimens is considered in numerical simulations.
The classical bilinear steel plasticity model of an elastic-plastic type with strainhardening is used for the inelastic material effects occurring in the reinforcement. Thisidealized stress-strain curve is shown in Fig. 5 and used hereafter to represent thematerial nonlinearity in the REBAR LAYER.
Average numerical values of steel reinforcement properties evaluated from materialtests for joint specimens tested in the laboratory are given in Table 3.
Table 3Average values of steel reinforcement properties used for concrete slab.
Uśrednione wartości właściwości stali zbrojeniowej płyty stropowej
Diameter Steel grade E∗) (MPa) fy (MPa) fu (MPa) εu
8 BSt500S200000
668.9 751.2 0.17512 BSt500S 638.1 728.9 0.177
∗) Characteristic value used

30 M. A. G, W. B, W. S
Fig. 5. Idealized bilinear stress-strain relationship for steel reinforcing bars and shear connectors.Rys. 5. Idealizowana dwuliniowa zależność naprężenie-odkształcenie dla prętów zbrojenia i łączników
zespalających
3.3. M
Beam element type B31, based on Timoshenko beam theory allowing for shear straindeformations, is used to model the stud shear connectors. A circular cross section isused for studs. The idealized stress-stain relationship presented in Fig. 5 is used tomodel not only the reinforcement but also to represent the material nonlinearity of theshear stud connectors.
Average numerical values of stud properties evaluated from material tests for jointspecimens are given in Table 4.
Table 4Average values of shear stud steel properties.
Uśrednione wartości właściwości stali łączników zespalających
Diameter x height Steel grade E∗) (MPa) fy (MPa) fu (MPa) εu
19 x 100 S235J2G3+C450 210000 502 537 0.19∗) Characteristic value used
3.4. M
Thin four-node shell elements with reduced integration and with five DOFs per nodeS4R5 are used to model all components of the steel beam, column and end-plate.Classical trilinear plasticity models of elastic-plastic type with strain hardening areused for the nonlinear material effects occurring in all the components of beams,columns and end-plates. This idealized stress-strain curve is shown in Fig. 6 and usedhereafter to represent the material nonlinearity for the finite elements of structural

F . . . 31
steel components. Bolt material is modelled with use of the bilinear characteristic asfor reinforcing bars of the concrete slab (see subsection 3.2).
Average numerical values of structural steel and bolt properties, evaluated frommaterial tests for joint specimens tested in the laboratory are given in Table 5.
Fig. 6. Idealized trilinear stress-strain relationship for steel structural components.Rys. 6. Idealizowana trójliniowa zależność naprężenie-odkształcenie dla stali konstrukcyjnej
Table 5Average values of steel properties for the structural steel used for joint components.
Uśrednione wartości właściwości stali konstrukcyjnej składników węzła
Specimen component Steel gradeE∗)
(MPa)fy
(MPa)fu
(MPa) εst εu
Column section HEB S235JR
210000
300.6 424.1 0.014 0.372Beam section IPE S235JR 321.3 434.9 0.015 0.333End-plates 12 mm S235JR 352.1 465.8 0.017 0.205End-plates 10 mm S235JR 318.0 454.4 0.015 0.307End-plates 8 mm S235JR 284.7 397.6 0.014 0.392
Bolts∗) 10.9 940 1040 – 0.09∗) Characteristic values used
4. R FE
The main aim of this study is to trace numerically the behaviour of bolted beam-to--column composite joints with various end-plate thicknesses, different size of end-platesand various ratios of concrete slab reinforcement. According to what has previouslybeen described, eight composite specimens belonging to two groups were tested up

32 M. A. G, W. B, W. S
to failure. The former is related to four specimens with the slab reinforcing bars of8 mm in the diameter while the latter – to four specimens with the same number ofreinforcing bars but with the diameter of 12 mm. Eight FE models are therefore created,four for each group, to simulate the tested composite joints with use of the ABAQUScode. The incrementally increased loads were applied to the tested specimens throughtwo hydraulic jacks. They are represented in the numerical analysis via vertical displa-cements at the free beam ends that are increasing incrementally and proportionally intime to a single parameter. The Modified Riks analysis is adopted for all the numericalsimulations.
The results of the FE analysis are presented in terms of load-deflection curvescorresponding to the end-beam displacement and the applied load, and in terms of thecharacteristics corresponding to the joint rotation and the bending moment. Resultsof the FE analysis are compared to those obtained experimentally. Because of thesymmetrical arrangement of the tested specimens and generally similar responses ofjoints on each side of the specimen column, the curves obtained experimentally comefrom the average values of measurements recorded for the joints placed on both sidesof the column.
Moreover, the results of the bare steel beam-to-column joints presented by theauthors in [7, 8] are recalled also hereafter in order to compare them with these ofcomposite joints. The aim of such a comparison is to predict the increase in stiffnessand strength of steel joints when their performance is enhanced by adding the concreteslab cast in situ on profiled sheeting formwork, and when ensuring its composite actionthrough shear studs welded to steel beams. It is proven by experiments that compositebeam-to-column joints are stronger from their steel counterparts even though the addedconcrete slab is cracked when exposed to tension due to the negative bending moment.
4.1. F -
Figures 7-14 show comparison between the test data and the FE results for flushbeam-to-column joints. Figure 7 shows the end beam load-displacement curves forthe specimens EZ1 and ES1 while the joint M-φ curves are presented in Fig. 8. Theconducted comparison indicates that the FE model is able to predict with high accuracyof both the initial stiffness and the ultimate moment of the tested composite joint(difference between the ultimate moment results of the FE analysis and the laboratorytests does not exceed 10% for EZ1). The test observations indicated that the failure ofthe tested specimen EZ1 was reached by developing fracture in the concrete reinforcingbars. The FE analysis is not able to detect such failure since the reinforcement barsare defined in the FE model not as individually discretized structural elements butthrough the ABAQUS REBAR LAYER option in which the reinforcement is treated as aproperty in the concrete material. Thus the FE analysis goes beyond the experimentallyobtained ultimate load. Numerical analysis can trace the load-deflection behaviour evenin the range of large displacements. This range of specimen deformations could not

F . . . 33
have been reached in the experimental investigations since the laboratory setup was loadcontrolled and the results could be recorded only up to the ultimate load. Attainmentof the ultimate state was recognized as the end of reliable data obtained from the test.
Fig. 7. Load-displacement curves for ES1 and EZ1 specimens; flush end-plate of 10 mm in thickness.Rys. 7. Krzywe siła-przemieszczenie dla elementów próbnych ES1 i EZ1; blacha zlicowana, tp=10 mm
Fig. 8. Moment-rotation curves for ES1 and EZ1 specimens; flush end-plate of 10 mm in thickness.Rys. 8. Krzywe moment-obrót dla elementów próbnych ES1 i EZ1; blacha zlicowana, tp=10 mm
The same situation is visible in Fig. 9 and Fig. 10, where load – displacementcurves and M-φ joint characteristics are presented for specimen EZ4 – the second flushend-plate joint from the group with the smaller reinforcement ratio. Comparison of the

34 M. A. G, W. B, W. S
Fig. 9. Load-displacement curves for ES4 and EZ4 specimens; flush end-plate of 12 mm in thickness.Rys. 9. Krzywe siła-przemieszczenie dla elementów próbnych ES4 i EZ4; blacha zlicowana, tp=12 mm
Fig. 10. Moment-rotation curves for ES4 and EZ4 specimens; flush end-plate of 12 mm in thickness.Rys. 10. Krzywe moment-obrót dla elementów próbnych ES4 i EZ4; blacha zlicowana, tp=12 mm
maximum value of applied load and the ultimate moment obtained from the tests andFE models, indicates that they are almost the same (the difference between the ultimatemoments does not exceed 2%). The only discrepancy is that these ultimate values arereached at a different angle of the joint rotation for the M-φ curve and at a differentdisplacement for the load-displacement curve. The ultimate moment for EZ4 FE modelis achieved at a smaller value of the joint rotation than that for the steel joint ES4.
Comparing the shapes of the M-φ curves for the flush end-plate joints from thefirst group of composite specimens, namely EZ1 (Fig. 8) and EZ4 (Fig. 10), one canconclude that the best fitting of FE results and test data is noticeable in the elastic rangeof up to approximately 70% of the ultimate moment. Then a drop in stiffness of the

F . . . 35
joints tested experimentally is visible. Beyond that point, the joint stiffness obtainedfrom experimental M-φ curves tends to degrade monotonically up to the joint ultimatestrength. In curves obtained numerically, a lesser degradation effect is observed, andcurves obtained for both specimens are placed above the experimental ones. In M-φcurves obtained numerically, a peak point of these curves is reached but it is not relatedto the failure mode observed in the laboratory tests, namely rupture of reinforcing bars.After reaching the pick point, each of these FE curves descends and finally approachesor crosses the moment capacity level corresponding to that from the laboratory testing.
The comparison of the results obtained for the second group of the compositespecimens, consisting of flush end-plate joints EZ5 and EZ8, indicates a certain dif-ference in the shape of FE curves. The failure mode of this group of specimens wasrelated to excessive deformations and local plastic instability of the column web ofcomposite joints, see curves presented in Fig. 11 and Fig. 12 for the specimen EZ5,and in Fig. 13 and Fig. 14 for the specimen EZ8. Shape of the FE and experimentalcurves, representing the specimen load – displacement characteristics (Fig. 11 and Fig.13) and the joint moment – rotation characteristics (Fig. 12 and Fig. 14) are closelyplaced to each other for both types of joint arrangements. It is noticeable not only inthe elastic range but also beyond the elastic range, up to the ultimate moment obtainedfrom the FE analysis. Beyond the elastic range, the curves representing the equilibriumpath acquired experimentally increase monotonically up to their limit points. Moreover,the experimental ultimate moments associated with limit points are very close to thoseobtained from the computer simulations (the differences do not exceed 3% for EZ5and 0% for EZ8). When the FE curves reach their peak value, they start to decreasewhereas the experimental ultimate values have to be regarded as the end of test. Thisresults from the limitations of experimental setup which could produce only the forcecontrolled loading history process.
Fig. 11. Load-displacement curves for ES1 and EZ5 specimens; flush end-plate of 10 mm in thickness.Rys. 11. Krzywe siła-przemieszczenie dla elementów próbnych ES1 i EZ5; blacha zlicowana, tp=10 mm

36 M. A. G, W. B, W. S
Fig. 12. Moment-rotation curves for ES1 and EZ5 specimens; flush end-plate of 10 mm in thickness.Rys. 12. Krzywe moment-obrót dla elementów próbnych ES1 i EZ5; blacha zlicowana, tp=10 mm
Fig. 13. Load-displacement curves for ES4 and EZ8 specimens; flush end-plate of 12 mm in thickness.Rys. 13. Krzywe siła-przemieszczenie dla elementów próbnych ES4 i EZ8; blacha zlicowana, tp=12 mm
4.2. E -
The load-displacement and moment-rotation curves predicted numerically and thoseresulted from laboratory tests, for all the composite joints with extended end-plates,are shown in Figs. 15-22. The comparison of the load-displacement characteristics

F . . . 37
Fig. 14. Moment-rotation curves for ES4 and EZ8 specimens; flush end-plate of 12 mm in thickness.Rys. 14. Krzywe moment-obrót dla elementów próbnych ES4 i EZ8; blacha zlicowana, tp=12 mm
obtained for composite joints with extended end-plates, namely EZ3, EZ2, EZ7 andEZ6, are shown in Figs. 15, 17, 19 and 21 while the similar comparison of M-φ curvesfor the same joints is shown in Figs. 16, 18, 20 and 22. With regard to the jointultimate load, the specimens were examined first separately in two groups, namely thefirst group of specimens EZ2 and EZ3 with a lower reinforcement ratio, and the secondgroup – specimens EZ6 and EZ7 with a higher reinforcement ratio (see Table 1).
Analysing the first group of specimens (Figs. 15-18), it is noticeable that curvesobtained from the FE model are progressing beyond those from experiments. As it hasbeen already mentioned for comparisons made for flush end-plate joints, the loadingprogramme was force controlled, thus the capturing of the post-limit range of the spe-cimen behaviour was not possible in the laboratory testing. Moreover, the actual failuremode observed to occur in the laboratory tests at the limit point of the equilibriumpath, resulting from a rapture of reinforcement, could not be reproduced in numericalanalysis because of the simplified assumptions associated with the ABAQUS REBARLAYER option used, as it has been explained previously. It precludes the evaluationof the joint rotational capacity, but it does not hinder one to discuss the main jointproperties associated with the joint characteristic, like the ultimate moment and initialstiffness. Comparing the shape of the curves obtained from the tests with the onesfrom the FE data, one can indicate that the best fitting of these curves is visible inthe elastic range. So, the initial stiffness of the specimen EZ2 and EZ3 is modelledproperly. Beyond the elastic range, it is noticeable that in the experimental curvesthere is a faster degradation of the stiffness than that observed for the FE curves. TheFE analysis predicts a higher value of the ultimate load and the ultimate moment ifcompared with that obtained experimentally for composite joints with the low rein-

38 M. A. G, W. B, W. S
forcement ratio as it can be observed in Figs. 15-18. For the purpose of comparisonwith test data, the values assumed to be the numerical ultimate moments are taken atthe same level of the joint rotation as that corresponding to the experimental values ofultimate moments. The difference between these values does not however exceed 16%for specimen EZ2 and 23% for specimen EZ3. Moreover, the FE curves run almostparallel to the experimental curves in the plastic range.
Fig. 15. Load-displacement curves for ES3 and EZ3 specimens; extended end-plate of 8 mm in thickness.Rys. 15. Krzywe siła-przemieszczenie dla elementów próbnych ES3 i EZ3; blacha wystająca, tp=8 mm
Fig. 16. Moment-rotation curves for ES3 and EZ3 specimens; extended end-plate of 8 mm in thickness.Rys. 16. Krzywe moment-obrót dla elementów próbnych ES3 i EZ3; blacha wystajaca, tp=8 mm

F . . . 39
Fig. 17. Load-displacement curves for ES2 and EZ2 specimens; extended end-plate of 10 mm inthickness.
Rys. 17. Krzywe siła-przemieszczenie dla elementów próbnych ES2 i EZ2; blacha wystajaca, tp=10 mm
Fig. 18. Moment-rotation curves for ES2 and EZ2 specimens; extended end-plate of 10 mm in thickness.Rys. 18. Krzywe moment-obrót dla elementów próbnych ES2 i EZ2; blacha wystajaca, tp=10 mm

40 M. A. G, W. B, W. S
On the other hand, the ultimate load obtained numerically is very close to thatobtained experimentally for composite joints with the high reinforcement as depictedin Figs. 19-22. This refers not only to the values of ultimate moment but also to theoverall behaviour of the considered joints EZ6 and EZ7. The maximum differencebetween the FE results comparing to the experimental ultimate moment is 6% forEZ6 and -3% for EZ7. Based on the differences between the behaviour simulated withuse of FE models and observed for their experimental counterparts for two groups ofspecimens with extended end-plate joints, one can conclude that the created FE modelis more suitable for the group with higher reinforcement ratio, where yielding of thejoint compression zone is the governing mode of failure, instead of the rupture ofreinforcing bars.
Fig. 19. Load-displacement curves for ES3 and EZ7 specimens; extended end-plate of 8 mm in thickness.Rys. 19. Krzywe siła-przemieszczenie dla elementów próbnych ES3 i EZ7; blacha wystająca, tp=8 mm
4.3. D FE
Many parameters can affect significantly the global behaviour of steel-concrete com-posite beam-to-column end-plate joints such as the end-plate size, its thickness, theconcrete slab reinforcement ratio and the arrangement of shear studs. To investigatethe effects of such parameters on the composite joint behaviour, some essential com-parisons are carried out in this section. These comparisons are conducted concerningonly the M-φ relationship for each joint type since this relationship represents the mainpredictor of the structural frame behaviour.
The first conducted comparison concerns the effect of the end-plate type andits thickness on the behaviour of composite joints. For the same ratio of concretereinforcement but the different type of end-plates, namely flush and extended, and

F . . . 41
Fig. 20. Moment-rotation curves for ES3 and EZ7 specimens; extended end-plate of 8 mm in thickness.Rys. 20. Krzywe moment-obrót dla elementów próbnych ES3 i EZ7; blacha wystająca, tp=8 mm
Fig. 21. Load-displacement curves for ES2 and EZ6 specimens; extended end-plate of 10 mm inthickness.
Rys. 21. Krzywe siła-przemieszczenie dla elementów próbnych ES2 i EZ6; blacha wystająca, tp=10 mm

42 M. A. G, W. B, W. S
Fig. 22. Moment-rotation curves for ES2 and EZ6 specimens; extended end-plate of 10 mm in thickness.Rys. 22. Krzywe moment-obrót dla elementów próbnych ES2 i EZ6; blacha wystajaca, tp=10 mm
the different end-plate thicknesses, namely 8 mm, 10 mm and 12 mm, their M-φcharacteristics are compared. The FE results obtained for the specimens EZ1 andEZ4, representing flush end-plate joints with the thickness of 10 mm and 12 mm,respectively, and the specimens EZ3 and EZ2, representing extended end-plate jointswith the thickness of 8 mm and 10 mm, respectively, are compared in Fig. 23. Thiscomparison indicates that for the same type of end-plates, the end-plate thicknesschanging within the range of 40%-60% of the bolt diameter has no great influence onthe behaviour of the composite joint. On the other hand, extended end-plate joints havea higher moment capacity if compared with that of flush end-plate joints. Also whatcan be seen from this comparison is that all the composite joints of a different typeof the end-plate and a different end-plate thickness ranging from 40% to 60% of thebolt diameter have practically the same initial stiffness. It can be concluded that thepresence of concrete is the major factor responsible for the increase of initial stiffnessif compared with bare steel joints and the height of end-plate has a noticeable effecton the moment capacity of a certain joint type.
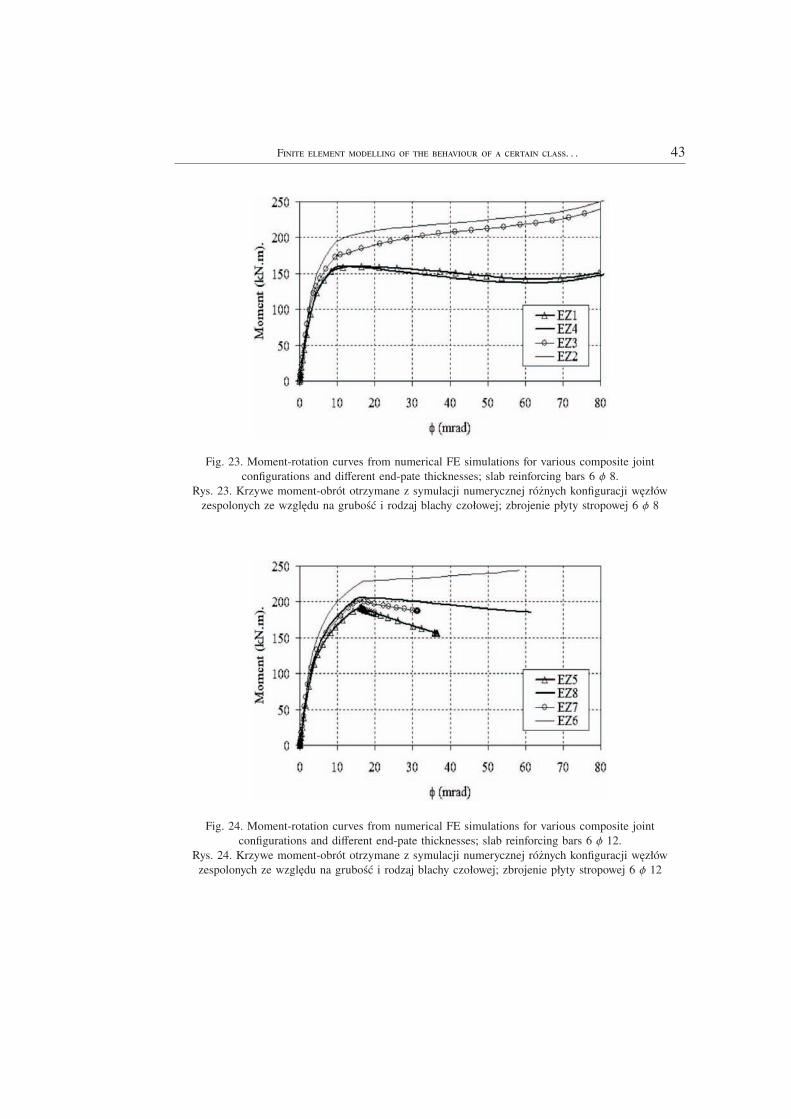
For the second group of specimens used in experiments, the diameter of the con-crete reinforcing bars is increased from 8 mm to 12 mm. FE results for specimensEZ5, EZ6, EZ7 and EZ8, i.e. the joints with a relatively high reinforcement ratio, arepresented in Fig. 24. Almost the same initial stiffness is observed for the four specimenswith different end-plate types and thicknesses. The differences between the ultimatemoments obtained numerically are smaller in this case than for specimens with thelower reinforcement ratio. In both groups, however, composite joints with the extendedend-plate of 10 mm in thickness, EZ2 and EZ6, have the highest values if comparedwith all the other specimens included in this comparison exercise.
F . . . 43
Fig. 23. Moment-rotation curves from numerical FE simulations for various composite jointconfigurations and different end-pate thicknesses; slab reinforcing bars 6 φ 8.
Rys. 23. Krzywe moment-obrót otrzymane z symulacji numerycznej różnych konfiguracji węzłówzespolonych ze względu na grubość i rodzaj blachy czołowej; zbrojenie płyty stropowej 6 φ 8
Fig. 24. Moment-rotation curves from numerical FE simulations for various composite jointconfigurations and different end-pate thicknesses; slab reinforcing bars 6 φ 12.
Rys. 24. Krzywe moment-obrót otrzymane z symulacji numerycznej różnych konfiguracji węzłówzespolonych ze względu na grubość i rodzaj blachy czołowej; zbrojenie płyty stropowej 6 φ 12

44 M. A. G, W. B, W. S
In order to investigate the effect of reinforcement ratio on the behaviour of compo-site joints, two other comparisons are conducted. In the first comparison, the results forjoints with the same type of end-plate are compared with respect to different values ofthe reinforcement ratio. Figure 25 shows M-φ curves for composite joints with the flushend-plate while Fig. 26 presents the FE results for joints with the extended end-plate.Based on these two figures, one can conclude that by adding more reinforcement tothe concrete slab, the joint initial stiffness is not significantly affected in case of allthe analyzed joints. When the diameter of reinforcing bars is increased but the numberof reinforcing bars kept constant, a higher joint moment capacity may be achieved. Atthe same time, the lesser value of rotation is associated with attainment of the ulti-mate strength of joints with a higher reinforcement ratio, and this rotation is generallydependent on the amount of reinforcement used.
Fig. 25. Moment-rotation curves from numerical FE simulations for flush end-plate composite joints ofdifferent end-plate thicknesses and different slab reinforcement ratios.
Rys. 25. Krzywe moment-obrót otrzymane z symulacji numerycznej węzłów zespolonych z blachamiczołowymi zlicowanymi, różnicowanych ze względu na grubość blachy i stopień zbrojenia
4.4. E
One of the focuses of this study is to investigate the distribution of stresses through thecomponents of tested joints. A precise mapping of the stress distribution is not an easytask in the laboratory therefore the FE analysis is employed herein to capture the stressdistribution for all the tested beam-to-column joints. In order to distinguish between thestresses distribution for different arrangements of composite beam-to-column joints, themaps of Huber-von-Mises stresses for all the analyzed joints are captured at an angleof rotation equal to 0.03 radians. Figures 27 and 28 picture the stress distribution for

F . . . 45
Fig. 26. Moment-rotation curves from numerical FE simulations for extended end-plate composite jointsof different end-plate thicknesses and different slab reinforcement ratios.
Rys. 26. Krzywe moment-obrót otrzymane z symulacji numerycznej węzłów zespolonych z blachamiczołowymi wystającymi, różnicowanych ze względu na grubość blachy i stopień zbrojenia
twelve tested joints. In case of composite joints EZ1 – EZ8, the steel part of the jointbelow the deck slab is shown. It is obvious from the presented maps of stresses that forthe same end-plate configuration and steel parts arrangement, the stress intensities inbare steel joints are more pronounced than those of composite joints. Also it is noticedthat for the various reinforcement ratios of the considered reinforced concrete slab, thestress distribution through the joint steel components do not vary significantly. It isvisible however, in all presented maps of Huber-von-Mises stresses, that the high stressconcentrations are located at the top and the bottom part of the beam and the adjacentparts of the end-plate and the column. On the other hand, the low exertion is placedin the column panel somewhere about the middle of the beam cross-section depth.
Figures 29-32 show the comparison between the deformed shape of end-platesobtained experimentally and numerically. Since the force controlled loading historyis applied in experimental investigations, FE load-displacement characteristics extendbeyond the ones obtained experimentally. The deformed shape obtained numericallyfor each conducted comparison is captured therefore at the same joint rotation, equalto that recoded at the ultimate load, and is compared with the end-plate deformationrecorded experimentally.
In Fig. 29, the comparison between the actual failure mode of the joint specimensES1, EZ1 and EZ5 (the flush end-plate joints of 10 mm in thickness) and their deformedshapes from the FE simulation is presented. It is noticeable that the deformation ofthe end-plate at the ultimate strength is the most intensive in the bare steel specimenES1 and the amount of deformation decreases when the reinforcement ratio increases.

46 M. A. G, W. B, W. S
Fig. 27. Huber-von-Mises stress maps for joints with flush end-plates; joint rotation of 30 mrad.Rys. 27. Mapy naprężeń Hubera-von-Misesa dla węzłów z blachami zlicowanymi; kąt obrotu 30 mrad

F . . . 47
Fig. 28. Huber-von-Mises stress maps for joints with extended end-plates; joint rotation of 30 mrad.Rys. 28. Mapy naprężeń Hubera-von-Misesa dla węzłów z blachami wystającymi; kąt obrotu 30 mrad

48 M. A. G, W. B, W. S
Fig. 29. Deformed shape of joints with 10 mm flush end-plates.Rys. 29. Odkształcona postać węzłów z blachami czołowymi zlicowanymi o grubości 10 mm

F . . . 49
Fig. 30. Deformed shape of joints with 12 mm flush end-plates.Rys. 30. Odkształcona postać węzłów z blachami czołowymi zlicowanymi o grubości 12 mm

50 M. A. G, W. B, W. S
Fig. 31. Deformed shape of joints with 8 mm extended end-plates.Rys. 31. Odkształcona postać węzłów z blachami czołowymi wystającymi o grubości 8 mm

F . . . 51
Fig. 32. Deformed shape of joints with 10 mm extended end-plates.Rys. 32. Odkształcona postać węzłów z blachami czołowymi wystającymi o grubości 10 mm

52 M. A. G, W. B, W. S
The shape of flush end-plates is such that the most deformed part is placed above thetop bolt row of the joint, i.e. the upper part of the end-plate, in the neighbourhood ofits welded connection to the top flange of the beam. The similar observations can bemade in case of the comparison presented in Fig. 30 for joints with the flush end-plateof 12 mm in thickness. This figure refers to the specimens ES4, EZ4 and EZ8, andindicates the end-plate deformations similar to those presented in Fig. 29.
For extended end-plates joints, the deformed shapes are depicted in Figs. 31 and32. For all the joints, a large local deformation appears at the top of the end-plate,above and below the beam top flange subjected to tension. Based on these figures, onecan indicate that more ductile behaviour of the extended end-plate joints is achievedfor smaller end-plate thicknesses. Also in this case, a lower reinforcement ratio (rebarsof 8 mm in diameter) allows for greater end-plate deformability at the ultimate load.For the group of the joints with the reinforcement bars of 12 mm in diameter, thedistortion of end-plates is less significant because the failure mode is related in thiscase to inelastic out-of- plane deformations of the yielded column web panel.
The presented deformed shapes imply a good agreement between the FE and thetest results. In all cases, there is lack of substantial elongations of bolts, including thoseexposed to the highest tensile stresses.
5. C
Numerical FE simulations are carried out to study the behaviour of composite steel--concrete end-plate joints. A validation exercise is carried out by comparing the resultsobtained numerically with those recorded in experimental investigations. Comparisonis made in terms of the load-displacement characteristics for the point of load ap-plication of all the tested joint specimens and the moment-rotation characteristics ofthese joints. General purpose FE software ABAQUS is used for numerical simulations.The specimen geometric nonlinearity and material inelastic behaviour of all the jointcomponents are considered. Simulation results are compared with experimental data.Obtained FE results show a good agreement between the predicted and measuredresponses, better in the elastic range and less accurate but seem to be acceptable fromthe engineering point of view in the inelastic range. This gives a confidence that theFE technique developed is capable of predicting the composite joint responses with anacceptable degree of accuracy from the engineering practice point of view.
An idea of the FE model creation for the considered class of composite joints isbased on simply the extension of the modelling technique developed by the authors in[7, 8] for bare steel joints, by adding shear stud elements and the discretized reinforcedconcrete slab elements modelled with options available in ABAQUS, to the FE modelpreviously developed for bare steel joints. Comparison of the composite joint behaviourwith the behaviour of its bare steel counterpart allows, for example, for the evaluationof benefits related to the performance of composite joints with reference to their steel

F . . . 53
counterparts with the same configuration and detailing of steelwork. Properly calibratedFE model can be used to further investigate the joint behaviour without a necessity ofexpensive and time-consuming laboratory tests.
The conducted comparison between the results of the analyzed composite jointsimplies that the thickness of the end-plate within the range of 40% to 60% of thebolt diameter in composite steel-concrete joints has no significant influence on thejoint initial stiffness and only a noticeable influence on the joint ultimate momentis observed. Composite joints with extended end-plates can sustain a higher ultimatemoment if compared with those of flush end-plates. Moreover, the joint initial stiffnessremains almost the same regardless of the reinforcement ratio. Finally, adding morereinforcement to the concrete slab may lead to a higher moment capacity but to a lowerrotation at the ultimate moment.
In an optimally shaped composite joint, it is necessary to ensure a balance betwe-en the strength of the joint and the joint deformability. It is expected that for a givenjoint configuration, there is a possibility of such a joint detailing that the deforma-tion capacities of reinforcing bars and steelwork parts of the joint are accomplishedsimultaneously. From the conducted experimental tests of composite joints, one canconclude that changing the reinforcement ratio from the low value (for specimens ofthe first group) to the high value (for specimens of the second group), and keeping theconstant values of the other parameters for the same joint detailing, the mode of failurechanges from the brittle one (rupture of reinforcing bars) to a ductile one (excessivein-plane plastic deformations of the column web panel in compression followed by itssubsequent out-of-plane local instability).
Taking benefits from the ductile behaviour of steel in the end-plate componentof steel parts of the composite joint and the reinforcement component of its concretepart, one may prevent the joint from sudden failure, therefore it may allow for theredistribution process of internal forces to take place in the whole structure and toenhance the safety requirements.
In order to achieve a ductile behaviour of the composite end-plate joints, it isnecessary to ensure the stress redistribution process to take place among the jointcomponents. Based on the observation from the conducted numerical analysis vali-dated by the performed experimental tests, one can conclude that the use of thinnerend-plates and properly balanced ductility through an adequate reinforcement sizingcan provide beneficial conditions for inelastic redistribution process to take place. Inthe application rules proposed in Eurocode 4 [2], it is assumed that when the mo-ment increases the reinforcing bars reach their design resistance before the top row ofbolts. In case of ductile rebars possessing reasonable deformation capacity in tension,redistribution of the internal forces can take place and the supplementary bendingmoments may be applied to the joint in order to be carried by steelwork parts thatin turn may subsequently reach their design resistances. From investigations carriedout by the authors, the recommendation is to oversize the bolt connectors and allowfor the application of thinner end-plates for larger end-plate deformations to appear

54 M. A. G, W. B, W. S
before significant stresses may occur in the connectors of the outer bolt rows subjectedto tension. Considering the steelwork part of the composite joint and according tothe concept of component method introduced in Eurocode 3 [4], the failure mode isductile, if there is the column web panel failure in yielding due to tension/compressionor shear, or the end-plate/column flange yield line mode of failure in bending. It ispossible by using thinner end-plates and bolt rows arranged away from the weldedconnection between the end-plate and the beam section flanges.
The class of end-plate joints considered herein uses end-plates of the thicknessbeing smaller that that used nowadays in practical application and ranging from 40% to60% of the diameter of bolted end-plate-to-column-flange connectors. The applicationof such innovative joints in engineering practice may enhance the ductility behaviourof steel frame structures with composite steel-concrete floor systems.
6. A
This paper constitutes a part of the PhD study of the second author and is concernedwith the development and validation of the numerical modelling technique used forthe evaluation of strength, stiffness and deformability of a certain class of compositesteel-concrete beam-to-column joints. The financial support for the PhD study providedby the Ministry of Science and Higher Education in Poland (grant No. N 506 0507 33)is highly appreciated. Numerical work that has been carried out through the ComputingCentre of the Warsaw University of Technology is kindly acknowledged.
R
1. L. S S, R.D. S, P.J.S. C, Experimental behaviour of end-plate beam-to-columncomposite joints under monotonical loading, Engineering Structures, 23, 11, 1383-1409, 2001.
2. Eurocode 4: EN 1994-1-1: Design of composite steel and concrete structures, Part 1.1: General rulesand rules for buildings, CEN, Brussels 2005.
3. J. B, A. K, Stiffness and strength of semi-rigid joints [in Polish], Oficyna WydawniczaPolitechniki Rzeszowskiej, Białystok-Rzeszów, 1996.
4. Eurocode 3: EN 1993-1-8: Design of steel structures – Part 1-8: Design of joints, CEN, Brussels2005.
5. A. K, Shaping of the steel and composite skeletal structures with semi-rigid joints [in Polish],Oficyna Wydawnicza Politechniki Rzeszowskiej, Rzeszów, 2000.
6. J. B, A. K, Steel skeletal buildings [in Polish], Oficyna Wydawnicza PolitechnikiRzeszowskiej, Rzeszów, 2003.
7. M.A. G, W. S, W. B, Experimental and numerical modelling of steel flushend-plate beam-to-column joints. [In:] The scientific research problems of building. Monograph pu-blication (Eds. M. Broniewicz, J.A. Prusiel), Wydawnictwo Politechniki Białostockiej, 2, 225-232,Białystok, 2007.
8. M.A G, W. S, W. B, Finite element modelling of the behaviour of steel end-platebeam-to-column joints, Archives of Civil Engineering, LIV, 4, 693-733, 2008.

F . . . 55
9. R.P. J, Composite Structures of Steel and Concrete. Volume I: Beams, Slabs, Columns andFrames for Buildings, Blackwell Scientific Publications, 1994.
10. B. U, J.Y.R. L, Composite Steel-Concrete Structures. [In:] The Civil Engineering Handbook(Eds. W.F. Chen, J.Y.R. Liew). CRC Press, Boca Raton 2003.
11. W. K, S. L, Composite Steel-Concrete Structures of Buildings [in Polish], Arkady,Warszawa, 2007.
12. V.A. O, I.W. B, R.J. P, A.A. A W, An analytical model for the analysis ofcomposite beams with partial interaction, Computer & Structures, 62, 3, 493-504, 1997.
13. G. F, G. M, E. C, Non-linear analysis of composite beams under positivebending, Computer & Structures, 70, 77-89, 1999.
14. K. B, N.E. S, Steel-concrete composite plate girders subject to combined shear andbending. Journal of Constructional Steel Research, 59, 531-557, 2003.
15. Q.Q. L, B. U, M.A. B, H.R. R, Ultimate strength of continuous composite beamsin combined bending and shear, Journal of Constructional Steel Research, 60, 1109-1128, 2004.
16. K. B, N.E. S, V. T, Finite-element analysis of steel-concrete compositeplate girder, Journal of Structural Engineering, 128, 9, 1158-1168, 2002.
17. K.E. B, H. W, Efficient nonlinear finite element modelling of slab on steel stringer bridges,Finite Elements in Analysis and Design, 42, 1304-1313, 2006.
18. W. C, E.D. S, Three-dimensional finite element modelling of composite girder bridges,Engineering Structures, 28, 63-71, 2006.
19. F.D. Q, P.C.G.S. W, D.A. N, Finite element modelling of composite beamswith full and partial shear connection, Journal of Constructional Steel Research, 63, 505-521, 2007.
20. F. F, D. L, J. Y, Modelling semi-rigid composite joints with precast hollowcore slabs in hoggingmoment region, Journal of Constructional Steel Research, 64, 1408-1419, 2008.
21. M. G, W. B, W. S, Experimental and numerical modelling of composite steel--concrete flush end-plate beam-to-column joints. [In:] Research and design issues in construction.Monograph publication (Eds. A. Łapko, M. Broniewicz, J.A. Prusiel) Wydawnictwo PolitechnikiBiałostockiej, Wydawnictwo Politechniki Białostockiej, VI, 41-50, Białystok, 2008.
22. M. G, W. S, Solving behavioural issues of composite joints by appropriate finite ele-ment modelling, [In:] Budownictwo i inżynieria środowiska, z. 50, Oficyna Wydawnicza PolitechnikiRzeszowskiej, 63-72, 2008.
23. M. G, A. B, A. K, L. Ś, Current practice and future development inmodelling, analysis and design of steel semi-continuous frames. Archives of Civil Engineering, LIV,1, 73-128, 2008.
24. ABAQUS/Standard, User’s Manual I-III, version 6.6, Hibbit, Karlsson and Sorenson Inc., Providence,RI, 2006.
25. ABAQUS, Theory Manual, version 6.6, Hibbit, Karlsson and Sorenson Inc., Providence, RI, 2006.
SKOŃCZENIE-ELEMENTOWE MODELOWANIE ZACHOWANIA SIĘ PEWNEJ KLASY WĘZŁÓWZESPOLONYCH STALOWO-BETONOWYCH W POŁĄCZENIACH RYGLI ZE SŁUPAMI
S t r e s z c z e n i e
Węzły w konstrukcjach ramowych można sklasyfikować jako sztywne (o pełnej nośności), podatne(o niepełnej nośności) lub nominalnie przegubowe, w zależności od ich typu, konfiguracji i rozmieszcze-

56 M. A. G, W. B, W. S
nia łączników. Węzły o pełnej nośności są wymagane dla ram sztywnych, w których założono, że węzłyzapewniają pełne przeniesienie momentów zginających z rygli na słupy. Natomiast w ramach z węzłamipodatnymi o niepełnej nośności, węzły są charakteryzowane przez względne obroty pojawiające się pomię-dzy łączonymi elementami tak, że moment zginający może być przeniesiony tylko częściowo. W ostatnichlatach, idea wykorzystania bezżebrowych węzłów podatnych zyskuje coraz większe zastosowanie w prakty-ce inżynierskiej. Ramy niepełnociągłe mogą przeciwstawiać się oddziaływaniom dzięki węzłom podatnymo niepełnej nośności, które przenoszą momenty zginające przy jednoczesnym pojawieniu się lokalnegoobrotu elementów przerwanych w węźle. Jednym z efektywnych sposobów zwiększających ciągliwośćwęzłów typu rygiel – słup z blachami czołowymi jest zastosowanie blach o grubości mniejszej niż stoso-wana obecnie w praktyce inżynierskiej. W niniejszej pracy, poddano analizie grupę węzłów zespolonychstalowo-betonowych, w których grubość blachy czołowej stanowi około 40-60% średnicy śrub. Pracastanowi rozwinięcie zagadnień opracowanych przez autorów w powoływanych pracach wcześniejszychi dotyczących numerycznego modelowania zachowania się węzłów stalowych w konstrukcjach ramowych.
Celem rozważań jest znalezienie prostego i jednocześnie wystarczająco dokładnego modelu 3D za-chowania się węzła zespolonego, uwzględniającego najistotniejsze czynniki wpływające na zachowaniesię stalowo-betonowych węzłów doczołowych z blachami o grubościach mniejszych niż stosowane w roz-wiązaniach konwencjonalnych. Przedstawiono model 3D skonstruowany dla rozważanego typu węzłówzespolonych, przy wykorzystaniu systemu ABAQUS oraz porównano wyniki symulacji numerycznychz wynikami badań doświadczalnych przeprowadzonych w Politechnice Warszawskiej. Porównanie wy-ników nieliniowego modelu skończenie – elementowego z wynikami badań doświadczalnych węzłówzespolonych w skali technicznej, świadczy o poprawności przyjętej techniki modelowania, jak równieżo zadowalającej zgodności modelu numerycznego z modelem fizycznym elementów badanych doświad-czalnie. Na zakończenie podano praktyczne uwagi dotyczące innowacyjnego kształtowania i projektowaniarozpatrywanej klasy węzłów zespolonych.
Remarks on the paper should be Received December 01, 2009sent to the Editorial Officeno later than June 30, 2010
revised versionMarch 15, 2010