Embed Size (px)
Citation preview

Journal of Constructional Steel Research 64 (2008) 190–201www.elsevier.com/locate/jcsr
Finite element analysis of precast hybrid-steel concrete connections undercyclic loading
Sudhakar A. Kulkarni∗, Bing Li, Woon Kwong Yip
School of Civil and Environmental Engineering, Nanyang Technological University, Singapore
Received 24 November 2006; accepted 7 May 2007
Abstract
In this paper, a nonlinear finite element (FE) analysis of hybrid-steel concrete connections is presented. The detailed experimental results ofthe four full-scale hybrid-steel concrete connections with limited seismic detailing have been discussed in a different paper. However, due tothe inherent complexity of beam–column joints and the unique features of the tested specimens, the experimental study was not comprehensiveenough. Therefore, in this paper, an analytical investigation based on the FE models and using the DIANA software is presented. The FE modelswere validated using the experimental results of the hybrid-steel concrete connections tested in Nanyang Technological University, Singapore.The critical parameters influencing the joint’s behaviour, such as the axial load on column, the connection plate thickness, and the continuation ofbeam bottom reinforcement, are varied, and their effects, especially implications on code specifications, are studied.c© 2007 Elsevier Ltd. All rights reserved.
Keywords: Finite element; Hybrid-steel concrete; Plane stress element; Cyclic loading; Geometric nonlinearity; Hysteresis loops
1. Introduction
In the last two decades, a lot of research has been devotedto the nonlinear analysis of reinforced concrete structuressubjected to seismic forces. Reinforced concrete structuresbeing the most commonly used structures need proper designand utmost care in the joint construction. During cyclic loadingof a structure, the joint should be ductile enough and capable ofdissipating large amounts of energy. A recent trend suggeststhat regions of low-to-moderate seismicity like Singapore,Eastern and Central parts of United States, Malaysia, etc.have witnessed a rise in construction activity with precastelements. It is already an established fact that precast structuresare advantageous in terms of productivity, economy andquality control. However, the catastrophic failure of structures,particularly the joints during earthquakes, showed a possibledrawback in the system. The information available on theseismic behaviour of the hybrid-steel concrete structures inthe inelastic range is limited, thus necessitating the need for
∗ Corresponding address: Division of Structures and Mechanics, Schoolof Civil and Environmental Engineering, Nanyang Technological University,639798 Singapore, Singapore. Tel.: +65 6790 5077.
E-mail address: [email protected] (S.A. Kulkarni).
0143-974X/$ - see front matter c© 2007 Elsevier Ltd. All rights reserved.doi:10.1016/j.jcsr.2007.05.002
standard guidelines of seismic design of precast structures[1–3].
A beam normally rests on the column edges, thus coincidingwith the inherent plastic hinging location. This makes the jointmost vulnerable under seismic actions if the connections arenot properly designed for the required strength and ductility.Vertical bearing failure may occur if the concrete of the columnlocated above and below the beam is crushed, eventuallyleading to a rigid body rotation of the beam that takes placewithin the reinforced concrete column [4]. BS8110 [5], whichis the major code of practice used in Singapore, does not fullycover the specification for precast elements. To supplement thiscode, some other technical references on precast technologysuch as the PCI manuals and handbooks [6–8], which containsome research findings since the 1970s, have been used.
To augment the ongoing research in precast technologyconstruction, particularly the behaviour of connections in theinelastic range, some hybrid-steel concrete joints have beeninvestigated in Nanyang Technological University, Singapore.These innovative hybrid-steel concrete connections make use ofsteel sections into the beam–column joint region to facilitate theconnection of precast elements. In the experimental study, onecast-in-place and three hybrid specimens, whose connectionconfigurations slightly differed from each other, were tested.

S.A. Kulkarni et al. / Journal of Constructional Steel Research 64 (2008) 190–201 191
Nomenclature
Ag Gross area of sectionc CohesionB Overall width of cross-section (smaller dimen-
sion)D Overall depth of cross-section (larger dimension)Eo Initial Young’s modulusfc′ Compressive stressft Concrete tensile stressfc
(ε
puniaxial
)Hardening or softening parameter as a
function of the plastic strain in the direction ofthe uniaxial compression stress
fy Yield strength of reinforcement barsG F Fracture energy of concreteN∗ Axial compressive loadt Thickness of steel sectionwu Ultimate crack openingσ0.2 Static 0.2% proof stressσu Static tensile strengthεcr
u Ultimate strain in concreteεu Elongation after fractureε
puniaxial Plastic strain in uniaxial stress direction
φ Angle of internal frictionρmin Minimum longitudinal reinforcement in beams
However, due to unique features of the tested specimensand material heterogeneity, it was difficult to understandthe complex seismic behaviour of beam–column connections.Furthermore, the effect of several influencing parameters suchas plate thickness, axial load and continuity of beam bottommain reinforcement cannot be varied in a limited number ofexperiments. In order to quantify and decide the influenceof critical design parameters, a robust numerical model isnecessary. Therefore, this paper is aimed at developing andcalibrating a nonlinear FE model, and further use it toinvestigate the behaviour of hybrid-steel concrete joints byvarying the main control parameters.
2. Test program
A total of four specimens tested are briefly summarizedin this section. One full-scale interior cast-in-place reinforcedconcrete beam–column joint M1 and three other full-scaleinterior precast beam–column joints M2, M3, and M4 wereconstructed and tested. The dimensions and reinforcementdetails of the reinforced concrete Specimen M1 are shown inFig. 1. This unit was a replica of the critical joint regions ina moment-resisting frame. The specimen was designed andconstructed according to BS 8110 [1]. The beam section was250 mm by 500 mm, and the ratio of top beam bar to bottombeam bar was 4 to 3. The column cross section was 400 mm ×
400 mm, and eight T20 reinforcements were used as the mainreinforcement. The beam span was 4.0 m and the height of thecolumn was 2.725 m. Fig. 2 shows the connection details ofSpecimen M2, M3 and M4. Precast Specimen M2 had the same
geometrical dimensions as Specimen M1. The reinforcementdetails of the beams and the upper columns were identical tothose of Specimen M1. However, a designed steel angle andplate connection was used to assemble the two precast beamsto the joint core, while steel I-section to I-section connectionwas used to connect the upper and lower parts of the column(Fig. 2). Unequal angles of size 200 × 100 × 12 and partiallyembedded vertical and bottom steel plates of size 800 mm ×
330 mm×10 mm and 800 mm×170 mm×10 mm respectivelywere used to connect the beam and joint core. Vertical plateswere connected the angle sections using four M24 size bolts,while two M16 bolts were applied to fasten the horizontalplate and angel section. The arrangement of the plates andangles with bolt hole positions are illustrated in Fig. 2(a). Thecolumn-to-column connection of Specimen M2 was obtainedby connecting two steel sections UC 254 × 254 × 73 whichwere embedded in the upper and lower columns. Splice plateof size 560 mm × 254 mm × 10 mm and twelve M24 sizebolts were applied to connect the flanges, while splice platesof size 230 mm × 200 mm × 8 mm with six M24 boltswere used to connect the web. For precast Specimen M3, thedimensions, the reinforcement details of the beams and theupper column were identical to Specimens M1 and M2. Similarto Specimen M2, a connection consisting of steel angles andplates was used to join the precast beams and columns. Onthe other hand, steel square hollow sections (SHS) of size300 × 300 × 10 mm were used to combine the upper and thelower columns. The SHS were properly connected using spliceplates of size 390 mm × 240 mm × 10 mm and eight M24size bolts, thereby ensuring the transfer of moment and shearbetween the two parts of the column (Fig. 2(b)). For SpecimenM4, the beam column connection was kept as those used inSpecimens M2 and M3, while UC 254×254×73 sections withplates and bolts were used to assemble the columns. The platesof size 260 mm × 260 mm × 10 mm were initially welded toUC sections and then joined by six M24 bolts (Fig. 2(b)).
3. Analytical model
3.1. Material properties
The longitudinal reinforcement of the beam and columnwas deformed bars of Grade 460, while the beam stirrups andcolumn transverse ties were applied with Grade 250 bars. Theconcrete used for all specimens was of Grade 30. The slumpvalue of the concrete mix was 75 ± 25 mm. The averagecompressive strength of concrete calculated using the cubesamples was found to be 28.9 MPa. Steel SHS, I-sections,and angle sections used in the construction of the specimenswere confirmed to Grade E43. Average values of steel sectionproperties were obtained from the samples of tensile coupontests. The measured properties were the static 0.2% proofstress (σ0.2), the static tensile strength (σu), the initial Young’smodulus (Eo) and the elongation after fracture (εu), which arepresented in Table 1. Since the thickness of two splice plates orsupport plates used in the connection was greater than the mainconnected components such as flanges, web, etc., the properties

192 S.A. Kulkarni et al. / Journal of Constructional Steel Research 64 (2008) 190–201
Fig. 1. Beam–column joint with cross section details.
Fig. 2. Typical connection details (a) Isoperimetric view showing the joint assembly; and (b) column to column connection details.
of the later were accounted in the FE analysis. The steel sectionswere connected using the high strength bolts of size M24 andM16 of Grades 8.8 or 10.8, respectively. The properties of theembedded plate were considered for the FE analysis becausethe thickness of two angle sections used in the connections wasmore than the plate.
3.2. Finite element modelling
It is possible to more thoroughly evaluate the stresses anddeformations in a structure using the FE analysis than can bedone experimentally. The nonlinear analysis results in a betterunderstanding of the mechanical behaviour of a structure during

S.A. Kulkarni et al. / Journal of Constructional Steel Research 64 (2008) 190–201 193
Table 1Summery of tensile coupon test results
Section Size D × B × t(mm)
Eo(GPa)
σ0.2(MPa)
σu(MPa)
εu(%)
SHS 300 × 300× 10 202 330 688 48Plate 800 × 330× 10 195 320 615 53UC254 × 254× 73Web 254 × 254 × 8.6 197 379 705 39Flange 254 × 254 × 14.2 201 366 679 41
its loading to fracture. In the present study, the specimens wereanalysed using the DIANA software [9]. Two-dimensional (2D)plane stress elements were applied to simulate the concreteand steel plates, while reinforcing bars were modelled astruss elements. In material modelling, the concrete modelswere based on nonlinear fracture mechanisms to account forcracking, and plasticity models were used for the concrete incompression and steel reinforcement.
3.3. Modelling of concrete
The analysis uses a constant stress cut-off criterion forcracking of the concrete. According to this model, a crack isassumed to be initiated perpendicular to the major principalstress if its value exceeds the tensile strength, independent ofother principal stresses. The orientation of the crack is thenstored and the material response perpendicular to the crackis determined by a stress–strain relationship for the crackedmaterial volume. Additional cracks may appear at the samelocation, but their formation to the existing cracks is greaterthan 15 deg. However, if the angle is less than that, thesecondary cracks are assumed not to be generated even whenthe tensile stress has reached the fracture envelope [10].
The fracture energy G F and the tensile strength ft wereused to calculate the value of ultimate crack opening wu . Thefracture energy G F of the concrete was calculated using a three-point bending test based upon the recommendations of RILEM50-FMC [11]. To simulate the softening effect of the concretein tension after cracking, a bilinear tension stress–strain curvewas used as shown in Fig. 3(a) in which εcr
u is taken as 0.001.The value was based on the assumption that the strain softeningafter failure reduces the stress linearly to zero at a total strain ofabout 10 times the strain at failure of concrete in tension, whichis typically 0.0001. The uniaxial tensile strength of concreteft used in the analysis was determined from the compressivestrength f ′
c according to the CEB-FIP Model code [12]:
ft = 0.30(
f ′c
)2/3. (1)
When the cracked concrete is unloaded in tension, the secantmodulus is used to evaluate the stiffness owing to the factthat the strain across the crack is linearly reduced to zero asthe stress approaches to zero (Fig. 3(b)). However, when theconcrete in compression is unloaded, the initial stiffness isadopted for the stiffness calculations (Fig. 3(a)).
The response of the concrete in compression was takeninto account by an elastic–plastic model. The elastic state
(a) In compression.
(b) In tension.
(c) Reinforcement.
Fig. 3. Material modelling.
of stress was limited by a Drucker–Prager yield surface.Isotropic hardening with an associated flow rule was used after

194 S.A. Kulkarni et al. / Journal of Constructional Steel Research 64 (2008) 190–201
yielding of the surface had occurred. The DIANA softwareevaluates the yield surface using the current state of stress,the angle of internal friction φ, and the cohesion c. As perthe recommendations of the DIANA software manual [9], theangle of internal friction in concrete can be approximated to be30◦. The cohesion c used in the analysis is given by formula asfollows:
c = fc(ε
puniaxial
) 1 − sin φ
2 cos φ(2)
where fc(ε
puniaxial
)is the hardening or softening parameter
as a function of the plastic strain in the direction of theuniaxial compression stress. Standard uniaxial tests on concretecylinders were used to define the stress–strain relations up tothe peak stress. CEB-FIP recommendations can be used toevaluate the postpeak behaviour of the concrete using cylindercompression strength tests [12]. A Poisson’s ratio of 0.15 wasused in the analysis.
3.4. Modelling of reinforcement and steel plates
The von Mises yield criterion with isotropic strain hardeningand an associated flow rule were used to describe theconstitutive behaviour of the reinforcement. The bars weremodelled with the DIANA options of either embeddedreinforcements or according to the recommendations ofseparate truss elements. In the case of embedded reinforcement,the reinforcement does not have separate degrees of freedom.The strength and stiffness of the concrete elements wereincreased in the direction of the embedded reinforcement; theoption assumes perfect bonding between the reinforcement andthe surrounding concrete. However, in case of the reinforcingbars modelled as separate truss elements in combination withinterface elements, the interaction between the reinforcementand the concrete was accounted for. Fig. 3(c) defines thestress–strain relationship for the reinforcing steel, which wasmodelled with an elasto-plastic curve.
The steel plates were modelled with 2D plane stresselements and were assigned the material properties of steel. Theconstitutive behaviour of plate elements were modelled with thevon Mises yield criterion with isotropic strain hardening and anassociated flow rule. Perfect bonding between the concrete andsteel plates was assumed in the analysis.
3.5. Solution algorithm
The Newton–Raphson method was initially applied to solvethe nonlinear equations. After a gradual increase in load, thesteps were followed by the arc-length technique combined withthe line search method. The number of load steps requiredto minimise the work done by the unbalanced forces can bedetermined by adopting the line search method. Using the arclength method, it is possible to locate the descending part of thepost-peak behaviour and snap-back phenomenon as illustratedin Fig. 4. It is necessary to decide a suitable convergence ordivergence criterion when the equilibrium position is acceptedas a converged state or needs to be modified due to divergence.
Fig. 4. Snap through buckling phenomenon.
Fig. 5. Cyclic lateral loading and displacement history used in the tests.
A maximum limit of 40 iterations was used for the convergenceand the tolerance was taken as 0.001. From the analyses it wasobserved that the convergence generally occurred in less than 5iterations.
The analysis assumed the total Langrangian approach withsmall strains and large displacements. Initial investigations onsome specimens showed the effect of geometric nonlinearitydid not much vary the results since extremely largedisplacements did not occur. Hence, the geometric nonlinearitywas neglected later in the analysis. All the specimens wereapplied with quasi-static simulated seismic loading as shownin Fig. 5. The first two cycles were load controlled and theremainder were displacement controlled.
4. Verification of finite element model
4.1. Specimens modelling
To verify the finite element model, the analytical resultswere compared with the experimental results. The specimenswere modelled (Fig. 6) with a total of 512 elements: 320truss elements and the remaining plane stress 2D elements.Concrete was modelled using 2D plane stress elements whichwere four-node isoparametric elements. On the other hand,

S.A. Kulkarni et al. / Journal of Constructional Steel Research 64 (2008) 190–201 195
Fig. 6. Enlarged view of FE model at joint region with element details.
the reinforcing steel bars were modelled as two-node trusselements. Fig. 6 shows an enlarged joint core view withplate and truss elements. At the joint core region the areaof truss elements close to the boundary such as 7, 8, 9,10, 11, 12 etc. were increased appropriately to simulate theircorresponding steel area contributions. The beam bottom barswere discontinued at the face of the column. Steel plates,which were used for the connection at the joint, extendedinside the beam at one side and abutted with the column faceon the other side. These plates were simulated as 2D planestress elements. Elements 515–522, located in the left partof the beam adjacent to joint (Fig. 6), and their counterpartson the right part of beam were modelled as plate elements.These elements were assigned with steel plate thickness and itsmaterial properties. The concrete on the front and rear side ofthese elements was neglected in the analysis as it was filled upafter the connections were fastened. Four rows of 2D elements(i.e., elements 463, 464, 465, 466 etc.) at the bottom of the jointwere treated as being connected by the steel plates and theirequivalent area was transferred to the column main bars andtransverse links. The area of truss elements of the region wasappropriately increased to account for the effect of the flange ofthe steel I-section embedded inside the column for SpecimensM2 and M4, and the wall of box-section for Specimen M3.The proportionate enhancement of these parts was necessaryas they were perpendicular to the 2D analysis direction. Theenhanced areas were approximately equal to the web area ofsteel I-section (UC 254 × 254 × 73) and wall area of SHS(300×300×10 mm), respectively. During the FE investigations,the thickness of the beam connection steel plate was varied tostudy its influence on the energy dissipation and strength of thejoints. Although the 2D model assumption of treating the platearea equivalent to the truss element is approximate, it has fairlyvalidated the behaviour of the joints. Further improvements inthe modelling can be tried with the options of solid, plane stressand truss elements, respectively, for concrete, steel plates andreinforcing bars.
4.2. Load–displacement responses of specimens
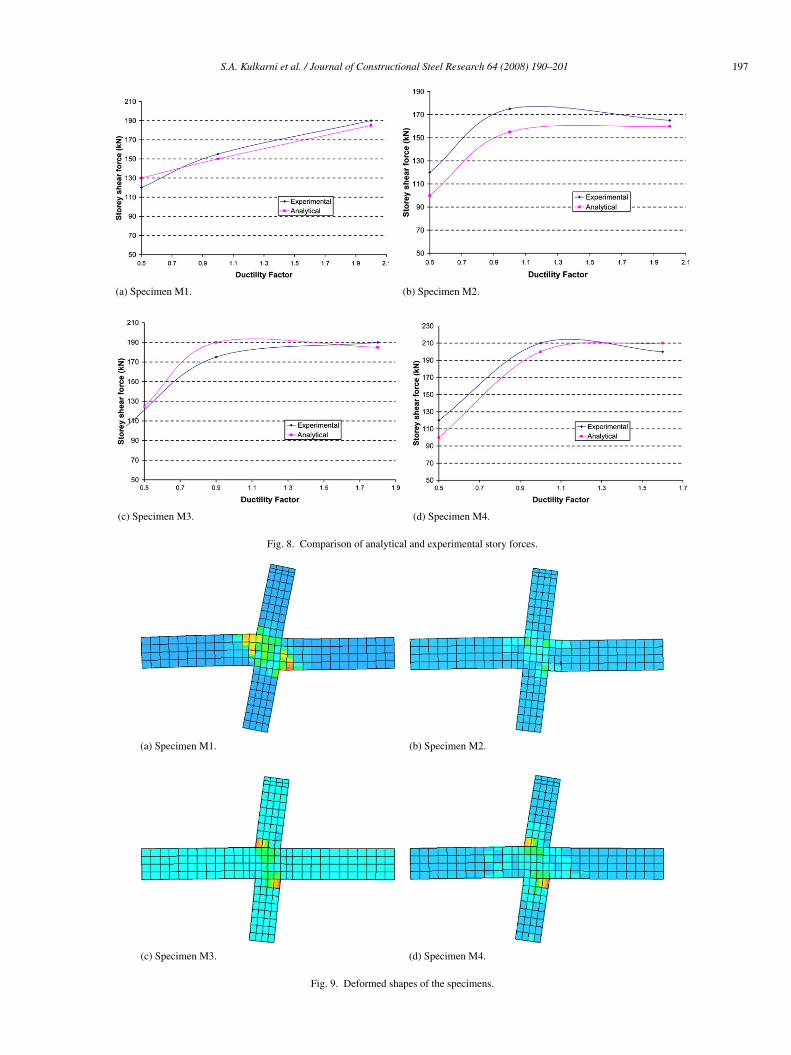
The predicted and observed responses of the specimens arepresented in Fig. 7. From Fig. 8(a) of Specimen M1 it canbe seen that the analytical model seemed to have predicted agood response with respect to the experimental observations.Although the displacements of the analytical model for a fewinitial cycles were slightly higher, the later cycles’ resultspredicted were in good agreement with the experimentalcounterparts. Specimen M1 achieved a displacement ductilityfactor (DF) of about 3.2 and pinching was observed inthe loops. The loops were thin and quite similar to theexperimental results. Global deformation of the specimen’sjoint core corresponding to a DF of 1.5 is given in Fig. 9(a).A large deformation of the joint core was observed atthis stage. Fig. 7(b) shows the analytical and experimentalresults comparison for Specimen M2. From the experimentalresults it was seen that the specimen noticed a large initialdisplacement for many cycles. The specimen achieved goodenergy dissipation till a DF of approximately of 3.6. Theglobal deformed shape of the specimen corresponding to aDF of 1.5 is given in Fig. 9(b). A moderate deformationof the joint core, and upper and lower parts of the columnwas seen from the figure. Specimen M3 reached a DFof approximately 3.0, slightly lesser when compared to itsexperimental values. Although the experimental loops showedlarge initial displacements their analytical counterparts alwaysdepicted steady displacements throughout. This may be dueto the fact that the connections might have had some initialgaps in the plates, where the nuts and bolts were fastened,which might have slipped after the application of load leadingto large initial displacements. The highest story shear carriedby different loops in the experimental and the analytical resultsshowed a good agreement. Similar to Specimen M2, a moderatedeformation of the joint core was noticed when a DF value of1.5 was reached, as shown in Fig. 9(c). Specimen M4 absorbedless energy showing a less number of cycles before failure(Fig. 7(d)). Its initial loops were similar to other specimens,

196 S.A. Kulkarni et al. / Journal of Constructional Steel Research 64 (2008) 190–201
(a) Specimen M1. (b) Specimen M2.
(c) Specimen M3. (d) Specimen M4.
Fig. 7. Predicted story shear forces versus horizontal displacements.
but the last two loops were slightly fatter showing a higherlevel of energy dissipation compared with other specimens. Butthe highest horizontal displacement noticed was around 60 mmwhich was smaller when compared to other specimens. Thespecimen showed a good energy dissipation and strength. FromFig. 7(d) it can be seen that the finite element model seemedto have predicted well the experimental observations. Fig. 9(d)shows the global deformation of the specimen at a DF of 1.5.Comparison of predicted story shear forces versus the ductilityfactors for different specimens is presented in Fig. 8. A goodcorrelation was also observed between the analytical and theexperimental story shears.
Fig. 10 shows the major principal strain distribution forSpecimen M2 at different ductility factors. It was observed thatthe maximum strains were concentred at the joint core and theconnection plates. Although the intensity of the strain and itsdistribution varied for different DFs, it always spread from thecorners thereby showing a large deformation of the joint inshear. As the DF was increased from 1.5 to 3.0, the elementsacross the diagonal of the joint and the adjacent plate regions
witnessed a high strain leading to large deformations. It wasalso observed that the specimen witnessed extensive crackingwithin the joint core near the compression and tension facesof the columns and beams, beginning from an early stage.This was followed by widening of the cracks as the horizontaldisplacement was increased. Similar trends were observed inother specimens.
4.3. Discussion of results
Comparison of the analytical and experimental results ofall the specimens showed that the lateral load–displacementhysteresis loops obtained from the FE analyses were quitesimilar to the experimental observations. Besides, the failuremodes and the ultimate ductility capacities correlated well withthe experimental results. The FE analyses also showed thatresults of the deformations and cracking patterns matched wellwith the experimental observations. From the aforementionedobservations and predictions of both the global and localbehaviours using the FE analysis, the use of FE modelling
S.A. Kulkarni et al. / Journal of Constructional Steel Research 64 (2008) 190–201 197
(a) Specimen M1. (b) Specimen M2.
(c) Specimen M3. (d) Specimen M4.
Fig. 8. Comparison of analytical and experimental story forces.
(a) Specimen M1. (b) Specimen M2.
(c) Specimen M3. (d) Specimen M4.
Fig. 9. Deformed shapes of the specimens.
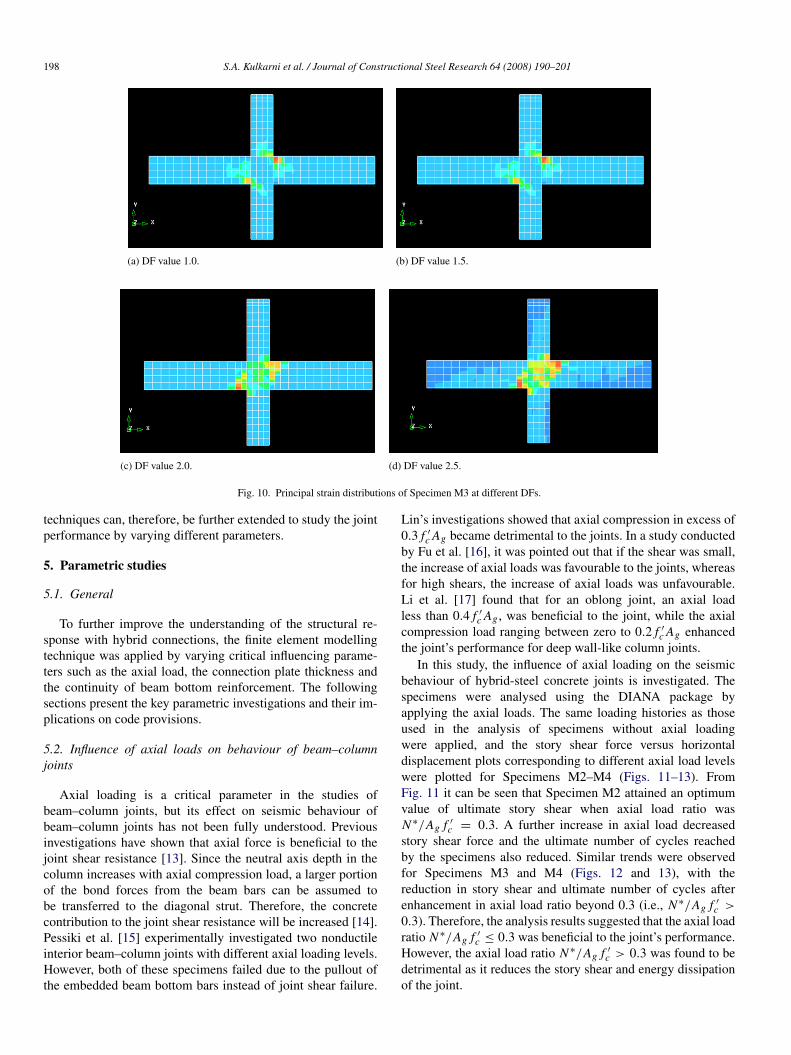
198 S.A. Kulkarni et al. / Journal of Constructional Steel Research 64 (2008) 190–201
(a) DF value 1.0. (b) DF value 1.5.
(c) DF value 2.0. (d) DF value 2.5.
Fig. 10. Principal strain distributions of Specimen M3 at different DFs.
techniques can, therefore, be further extended to study the jointperformance by varying different parameters.
5. Parametric studies
5.1. General
To further improve the understanding of the structural re-sponse with hybrid connections, the finite element modellingtechnique was applied by varying critical influencing parame-ters such as the axial load, the connection plate thickness andthe continuity of beam bottom reinforcement. The followingsections present the key parametric investigations and their im-plications on code provisions.
5.2. Influence of axial loads on behaviour of beam–columnjoints
Axial loading is a critical parameter in the studies ofbeam–column joints, but its effect on seismic behaviour ofbeam–column joints has not been fully understood. Previousinvestigations have shown that axial force is beneficial to thejoint shear resistance [13]. Since the neutral axis depth in thecolumn increases with axial compression load, a larger portionof the bond forces from the beam bars can be assumed tobe transferred to the diagonal strut. Therefore, the concretecontribution to the joint shear resistance will be increased [14].Pessiki et al. [15] experimentally investigated two nonductileinterior beam–column joints with different axial loading levels.However, both of these specimens failed due to the pullout ofthe embedded beam bottom bars instead of joint shear failure.
Lin’s investigations showed that axial compression in excess of0.3 f ′
c Ag became detrimental to the joints. In a study conductedby Fu et al. [16], it was pointed out that if the shear was small,the increase of axial loads was favourable to the joints, whereasfor high shears, the increase of axial loads was unfavourable.Li et al. [17] found that for an oblong joint, an axial loadless than 0.4 f ′
c Ag , was beneficial to the joint, while the axialcompression load ranging between zero to 0.2 f ′
c Ag enhancedthe joint’s performance for deep wall-like column joints.
In this study, the influence of axial loading on the seismicbehaviour of hybrid-steel concrete joints is investigated. Thespecimens were analysed using the DIANA package byapplying the axial loads. The same loading histories as thoseused in the analysis of specimens without axial loadingwere applied, and the story shear force versus horizontaldisplacement plots corresponding to different axial load levelswere plotted for Specimens M2–M4 (Figs. 11–13). FromFig. 11 it can be seen that Specimen M2 attained an optimumvalue of ultimate story shear when axial load ratio wasN∗/Ag f ′
c = 0.3. A further increase in axial load decreasedstory shear force and the ultimate number of cycles reachedby the specimens also reduced. Similar trends were observedfor Specimens M3 and M4 (Figs. 12 and 13), with thereduction in story shear and ultimate number of cycles afterenhancement in axial load ratio beyond 0.3 (i.e., N∗/Ag f ′
c >
0.3). Therefore, the analysis results suggested that the axial loadratio N∗/Ag f ′
c ≤ 0.3 was beneficial to the joint’s performance.However, the axial load ratio N∗/Ag f ′
c > 0.3 was found to bedetrimental as it reduces the story shear and energy dissipationof the joint.

S.A. Kulkarni et al. / Journal of Constructional Steel Research 64 (2008) 190–201 199
Fig. 11. Load–displacement predictions under different axial loading levels forSpecimen M2.
Fig. 12. Load–displacement predictions under different axial loading levels forSpecimen M3.
Fig. 13. Load–displacement predictions under different axial loading levels forSpecimen M4.
5.3. Influence of connection plate thickness
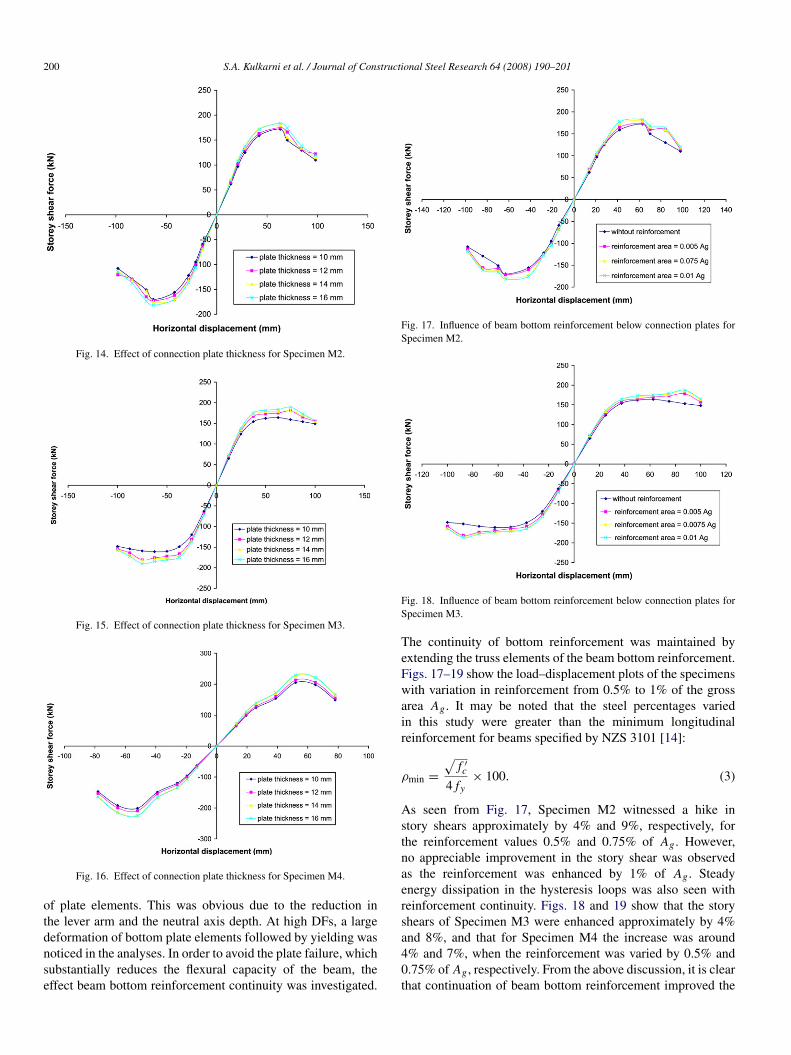
Connection plates adjacent to the joint play a key role intransferring the moment and shear between the column andbeams and hence, its successful design is very important.In the experimental investigations 10 mm thick plate wasused for the connections. In this study, the connection platethickness was varied and its effect on energy dissipation wasstudied. Figs. 14–16 show the predictions of story shears ofthe specimens for different thickness of connection plates. Asseen from Fig. 14, Specimen M2 showed an increase in storyshears by 4%, 7% and 11% when the plate thicknesses arechanged to 12 mm, 14 mm and 16 mm plates, respectively. TheSpecimen also achieved an improvement in energy dissipationup to 14 mm of plate thicknesses. However, when the platethickness was enhanced to 16 mm, though the specimeninitially carried a higher value of story shears, the ultimatenumber of cycles was reduced. One of the reasons for thereduction in number of cycles attained was the due to thespecimen failure at other parts. Despite the fact that theconcrete in the front and back regions of connection platewas neglected in the analysis, satisfactory energy dissipationwas observed. This clearly indicates that the concrete whichwas filled after connecting the joint plates was not effectivein resisting the stresses. Moreover, the bond between theconnection plates and precast elements may not have beenperfect, and/or might have further reduced during the initialfew cycles of loading. Replacement of the top corner plateelements adjacent to the joint region by truss elements for thereinforcements and 2D elements for concrete was also foundto be satisfactory in energy dissipation. It was observed thatenhancement of plate thickness not only increased the energydissipation, it also helped in smooth distribution and reductionof the maximum principal stresses. Specimen M3 also showedsimilar trends when the plate thickness was varied (Fig. 15).The increase in story shears by 3%, 8% and 11% was noticedwhen the plate thickness was enhanced to 12 mm, 14 mmand 16 mm, respectively. There was no substantial increasein energy dissipation with the enhancement of plate thicknessbeyond 16 mm, though a few initial cycles showed higher storyshears. Similar trend was also seen Specimen M4 (Fig. 16)with the exceptions that the effect of energy dissipation andstrength enhancement almost ceased at 14 mm plate thickness.From the aforementioned comparison, it is clear that with theductility level of the joint remaining the same, a better energydissipation and higher ultimate strength was observed in thespecimens with the increase in connection plate thickness. Thespecimens showed an optimum benefit of around 11% strengthenhancement when the plate thickness was 14 mm.
5.4. Influence of beam bottom reinforcement continuity
In the experimental study of hybrid-steel concrete beam–column connections, the precast beams and the columnswere connected by plates, while the reinforcement at thebeam bottom remained discontinued. Because of reinforcementdiscontinuity, higher stress levels were seen at the lower part
200 S.A. Kulkarni et al. / Journal of Constructional Steel Research 64 (2008) 190–201
Fig. 14. Effect of connection plate thickness for Specimen M2.
Fig. 15. Effect of connection plate thickness for Specimen M3.
Fig. 16. Effect of connection plate thickness for Specimen M4.
of plate elements. This was obvious due to the reduction inthe lever arm and the neutral axis depth. At high DFs, a largedeformation of bottom plate elements followed by yielding wasnoticed in the analyses. In order to avoid the plate failure, whichsubstantially reduces the flexural capacity of the beam, theeffect beam bottom reinforcement continuity was investigated.
Fig. 17. Influence of beam bottom reinforcement below connection plates forSpecimen M2.
Fig. 18. Influence of beam bottom reinforcement below connection plates forSpecimen M3.
The continuity of bottom reinforcement was maintained byextending the truss elements of the beam bottom reinforcement.Figs. 17–19 show the load–displacement plots of the specimenswith variation in reinforcement from 0.5% to 1% of the grossarea Ag . It may be noted that the steel percentages variedin this study were greater than the minimum longitudinalreinforcement for beams specified by NZS 3101 [14]:
ρmin =
√f ′c
4 fy× 100. (3)
As seen from Fig. 17, Specimen M2 witnessed a hike instory shears approximately by 4% and 9%, respectively, forthe reinforcement values 0.5% and 0.75% of Ag . However,no appreciable improvement in the story shear was observedas the reinforcement was enhanced by 1% of Ag . Steadyenergy dissipation in the hysteresis loops was also seen withreinforcement continuity. Figs. 18 and 19 show that the storyshears of Specimen M3 were enhanced approximately by 4%and 8%, and that for Specimen M4 the increase was around4% and 7%, when the reinforcement was varied by 0.5% and0.75% of Ag , respectively. From the above discussion, it is clearthat continuation of beam bottom reinforcement improved the

S.A. Kulkarni et al. / Journal of Constructional Steel Research 64 (2008) 190–201 201
Fig. 19. Influence of beam bottom reinforcement below connection plates forSpecimen M4.
performance of the joints with strength reaching an optimumvalue of approximately 8%, when the reinforcement value was0.75% of Ag . Besides, a smooth stress distribution adjacent tothe joint region and higher energy dissipation were observed.
6. Conclusions
The hybrid-steel concrete connection for seismic behaviourwas studied using the numerical models. Finite elementanalysis was employed as a numerical tool to investigatethe behaviour of joints. Concrete was modelled using 2Delements, whereas truss elements are employed for steel bars.The connection plates are modelled as 2D elements with steelproperties and the DIANA software was used as the modellingtool. Comparisons with the experimental results indicated thatthe finite element models used in this study were suitable,and the corresponding investigation results were reliable.The predicted results matched well with the experimentalobservations. The connection plate modelled using 2D plateelements and neglecting the concrete on either side of it showeda satisfactory performance in the structural analysis. Based onthe parametric study results, the following conclusions can bedrawn:
(1) The FE results showed that axial load was beneficial to thejoint’s performance. Axial load ratios N∗/Ag f ′
c = 0 to0.3, influenced energy dissipation and story shears of thejoints adding in a better behaviour. However, an axial loadratio beyond N∗/Ag f ′
c > 0.3 was detrimental to the joint’sperformance.
(2) Connecting plate thickness at joint influenced the energydissipation and deflections during the cyclic loading. Theincrease in plate thickness gradually increased the energydissipation and strength of the joint. With ductility ofthe joint remaining the same, the specimens showed anoptimum benefit of around 11% enhancement in strengthfollowed by better energy dissipation when plate thicknesswas 14 mm. However, any increase in thickness beyond14 mm, showed no marked improvement in energy
dissipation, and it also reduced the ultimate number of loadcycles attained.
(3) Continuation of beam bottom reinforcement increased theultimate strength of the specimens and reached an optimumvalue of approximately 8% when the reinforcement was0.75% of Ag . The specimens also showed good energydistribution and smooth stress distribution. It was observedform the FE analysis that beyond 1% of Ag , the advantagealmost ceased with no further enhancement in strength.
Acknowledgments
The experimental work was performed at Nanyang Tech-nological University, Singapore. Support by the Building andConstruction Authority, Singapore is gratefully acknowledged.Any opinions, findings, and conclusions expressed in this paperare those of the writers and do not necessarily reflect the viewsof Building and Construction Authority, Singapore.
References
[1] Hawkins N, Englekirk R. US–Japan seminar on precast concreteconstruction in seismic zones. PCI Journal 1987;32(2):75–85.
[2] Englekirk R. Overview of ATC seminar of prefabricated concretebuildings for earthquake loads. PCI Journal 1982;27(1):80–97.
[3] Dolan C, Stanton J, Anderson R. Moment resistant connections andsimple connections. PCI Journal 1987;32(2):62–74.
[4] Sheikh TM, Deierlein GG, Yura JA, Jirsa JO. Beam–column momentconnections for composite frames: Part 1. Journal of StructuralEngineering, ASCE 1989;115(11):2858–76.
[5] BS 8110. Structural use of concrete, Part 1. Code of practice for designand construction. British Standard; 1997.
[6] PCI Manual 1973. Design of connections for pre-cast prestressedconcrete. Ist ed. Chicago (Illinois): Prestressed Concrete Institute; 1973.
[7] PCI Design Handbook 1971. Precast and prestressed concrete. Ist ed.Chicago (Illinois): Prestressed Concrete Institute; 1971.
[8] PCI Design Handbook 1985. Precast and prestressed concrete. 3rd ed.Chicago (Illinois): Prestressed Concrete Institute; 1985.
[9] DIANA user’s manual-version 7. Finite element analysis user’s manual-nonlinear analysis. TNO building and construction research. Delft (TheNetherlands); 2000.
[10] Hajime O, Kohichi M. Nonlinear analysis and constitutive models ofreinforced concrete. Tokyo: Gihodo; 1991.
[11] RILEM 50-FMC Committee. Determination of the fracture energy ofmortar and concrete by means of three-point bend tests on notched beams.Materials and Structures 1985;18(4):287–90.
[12] CEB-FIP Model code 1990: Design code. Lausanne (Switzerland):Thomas Telford; 1993.
[13] Paulay T. Equilibrium criteria for reinforced concrete beam–columnjoints. ACI Structural Journal 1989;86(6):635–43.
[14] New Zealand Standard 3101. Concrete structures standard (1995): PartI—The design of concrete structures. 1995.
[15] Pessiki SP, Conley CH, Gregely P, White RN. Seismic behaviourof lightly reinforced concrete column and beam–column joint details.NCEER technical report no 90-0014. State University of New York atBuffalo.
[16] Fu J, Chen T, Wang Z, Bai S. Effect of axial load ratio on seismicbehaviour of interior beam–column joints. In: 12th world conference onearthquake engineering. 2000. Paper no 2707.
[17] Li B, Wu Y, Pan TC. Seismic behaviour of nonsensically detailed interiorbeam–wide column joints-Part II: Theoretical comparisons and analyticalstudies. ACI Journal 2003;100–S07:56–65.