Embed Size (px)
Citation preview
RIVISTA ITALIANA DI GEOTECNICA 2/2008
Finite element analysis of model piles axially loaded in sands
Vincenzo De Gennaro,* Roger Frank,* Imen Said**
1. Introduction
When considering the interaction of two mediain contact with highly-distinct deformability charac-teristics failure is often accompanied by the forma-tion within the more deformable medium of arather thin zone oriented in the direction of thecontact surface. This zone, called the soil-structure in-terface, or simply interface, experiences intense strainlocalization and plays the role of a kinematic discon-tinuity characterized by extremely high strain gradi-ents.
Quite a large number of civil engineering struc-tures lie in contact with soils. Such is the case, for ex-ample, in soil-retaining walls, soil-anchorage rods,soil-piles or micropiles, or soil-reinforcements (e.g.“terre armée”, nailed soils). Failure in these struc-tures occurs mainly due to progressive shearing andis often observed at the interface, in the softer me-dium (i.e. the soil mass), where stresses and strainsare transmitted. The description of the mechanicalbehaviour, mainly in terms of mobilized friction be-tween the structural element and the soil, must con-sequently entail constitutive modelling of this heav-ily loaded region.
In this work emphasis is given on the behaviourof deep foundations and, more particularly, of thecontact between a granular soil and a pile. In thistypical soil-structure interaction problem availableanalyses of the mechanical behaviour of single pilessubmitted to axial loads have shown that the soil-pile interface exerts significant influence in defin-ing structural stability conditions.
The paper will focus first on the general frame-work of the soil-pile interaction modelling using thefinite element method (FEM); a description will beprovided of how contact problems have been tack-led using FEM. The constitutive modelling of theinterface and the soils mass will be then presented.The main features of the interface model MEPI-2D[DE GENNARO and FRANK, 2002], formulated on pur-pose for describing the behaviour of the interface
between a granular soil and a rigid structure withinthe framework of hardening plasticity in two-di-mensional or axisymmetric conditions, will bebriefly described. The role of the surrounding soilmass will also be investigated; elasticity, ideal plas-ticity and strain hardening plasticity will be used tomodel the sand mass.
Finally, comparative analyses of pile tests usingFEM will be provided by means of the CESAR-LCPC finite element code [HUMBERT, 1989]. Notethat one important issue in the case of piles is thedefinition of the initial state, following installationand prior to loading, both in the soil and at the in-terface. In the majority of the numerical applica-tions piles are “wished in place”, assuming that in-stallation effects, if any, have only a limited impacton their mechanical behaviour. Given the obstaclesin generating accurate simulations of pile installa-tion via FEM (e.g. simulation of driving, boring,etc.) this problem is still far from being resolved. Anew numerical strategy is outlined to tackle this is-sue.
The proposed numerical investigations will bevalidated against the experimental results obtainedduring model pile loading tests using a calibrationchamber [DE GENNARO, 1999; DE GENNARO andFRANK, 2005] and on a real site [CHOW, 1997; JARDINE
et al., 1998 and 2005].
2. Axisymmetric FEM modelling of soil-pile interface
When solving problems with boundary condi-tions that integrate interfaces, the use of FEM formodelling contact with standard elements is oftencumbersome, since the relative movement of solidsin contact is not, at first inspection, compatible withthe displacement continuity condition required atthe nodes of adjacent elements (e.g. POTTS andZDRAVKOVIC, 2001).
The soil-pile interaction provides a typicalexample of an interface problem. So-called"conventional methods" for piles computing arebased on empirical correlations that lead to deter-mining the limit load-bearing capacity. Somewhatless attention is usually paid to determining thedeformation characteristics corresponding with the
* Université Paris-Est, Navier (ENPC- CERMES), Paris, France** Université Paris-Est, Navier (ENPC- CERMES), Paris, France,
ENIT, Tunis, formerly URIG
45FINITE ELEMENT ANALYSIS OF MODEL PILES AXIALLY LOADED IN SANDS
APRILE - GIUGNO 2008
service state of a pile, although design guidelinesoften suggest the computation of settlements andhorizontal displacements, since excessive values inthese parameters may affect structural functions(e.g. FRANK et al., 2004). Among the set of analyticalor numerical methods that enable assessing pilebehaviour and that incorporate soil strain behav-iour, three methods have undergone major devel-opments: (i) the finite element method, (ii) theboundary element method and (iii) the load transferfunction method (t-z or p-y). This work is concernedwith the finite element method.
Thin layer element
The basic principles of the finite elementmethod and its application to solving problems suchas pile behaviour numerical analyses have been setforth by a number of authors over the past thirtyyears (e.g. MAQTADIR and DESAI, 1986; MABSOUT et al.,1995; BRANSBY and SPRINGMAN, 1996; MOHAMEDZEIN
et al., 1999; WAKAI et al., 1999; DE GENNARO andFRANK, 2005; COMODROMOS et al., 2003; WEHNERT andVERMEER, 2004). Several methods for modelling dis-continuous behaviour at the soil-structure interfacehave been proposed:
- the use of "zero-thickness" special elementswith two nodes, where only the connection betweenopposite nodes is considered active (e.g. GOODMAN etal., 1968; DAY and POTTS, 1994);
- the use of two-dimensional or, rarely, three-di-mensional limited thickness standard finite ele-ments, also called "thin-layer" elements, by ascribingthe constitutive laws derived from elastoplasticitytheory to these elements (e.g. DESAI et al. 1984);
- the definition of "hybrid" methods, in whichsoil and structure are modelled separately and thenrelated by different types of compatibility equationsfor forces and displacements (e.g. KATONA, 1983;SHENG et al., 2007).
With "zero-thickness" elements, displacementcontinuity at the interface is ensured by either appli-cation of a penalization method or adaptation of thestiffness. Typically the relative sliding condition iscontrolled by the Mohr-Coulomb criterion.
In the case of 2D "thin layer" elements the con-tact problem is modelled by means of rectangularisoparametric finite elements characterized by a rel-atively high aspect ratio (ratio of the largest elementdimension to its smallest dimension) and constitu-tive laws adapted to the mechanical behaviour of thecontact zone. The advantage of this method is thatstandard (rectangular) finite elements are used, sothat no further element implementation is needed.However, a parametric study of the influence of theaspect ratio on the numerical results is necessary to
ensure numerical stability of calculations [PANDE andSHARMA, 1979; HOHBERG and SCHWEIGER, 1992].
In this study eight-node isoparametric elementshave been employed for modelling the soil-pile con-tact. In order to successfully adapt two-dimensionalisoparametric finite elements to the description ofinterface behaviour, two conditions are necessary:first, the element must enable simple shearingmechanism by solely considering the normal andshear stresses acting upon the interface; second, theconstitutive law associated with the element must al-low connecting these stresses at the interface withthe associated relative displacements.
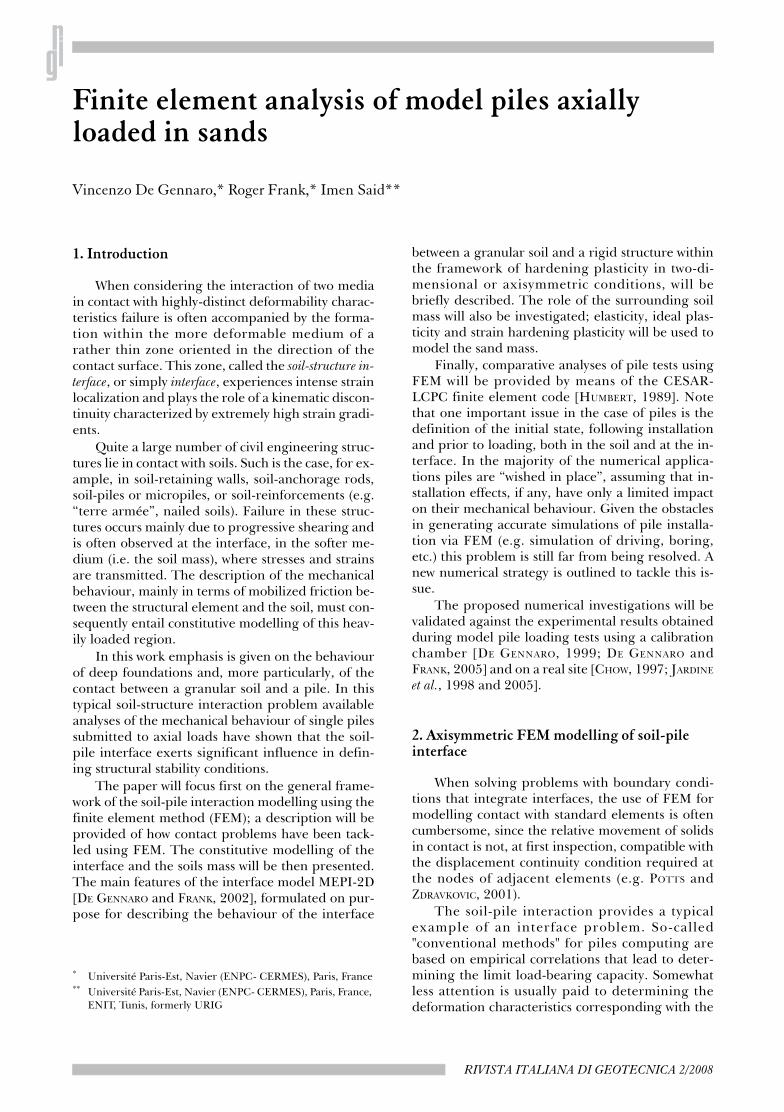
The first condition can be easily fulfilled consid-ering the specific geometry of the thin layer element(Fig. 1) and defining an optimal aspect ratio for thesame element (i.e. the ratio L/t). For concision's sakethe theoretical developments are not presented inthis paper. One can refer to DE GENNARO and FRANK
[2005] or HOHBERG and SCHWEIGER [1992] for furtherdetails. With standard rectangular finite elements itis typically advised to consider L/t aspect ratios lowerthan 10, whereas for a "thin layer" element anaccurate description of the interface kinematics isobtained with aspect ratio varying from 10 to 100,depending on the constitutive law adopted at theinterface. This condition implies a specific mappingof stresses and strains over the element. Considerthe representation of the interface by 8-nodesquadrangular elements (Fig. 1). In the local (m, n)coordinate system, the largest element dimension Lis parallel to the direction of axis m, while itssmallest dimension (thickness) is equal to t. Theelement axis m forms an angle α with respect to thedirection of x1 axis in the global coordinate system.Local stresses σn (normal) and τ (tangential) exertedon a facet parallel to the direction of axis m may becomputed based on knowledge of the stresscomponents expressed within the global coordinate
Fig. 1 – Thin layer element.Fig. 1 – Elemento tipo “thin layer”.

46 DE GENNARO - FRANK - SAID
RIVISTA ITALIANA DI GEOTECNICA
system. Let {σ11, σ22, τ12}T be the pseudo-vectorcontaining the stress tensor components of stressesin the global coordinate system and {σn, τ}T thepseudo-vector of stresses in the local coordinatesystem, the relation between local and globalstresses can then be given as follows:
(1)
Analogously, if {ε11, ε22, γ12}T represents thepseudo-vector of strains in the global coordinatesystem and {εn, γ}T the pseudo-vector of strains inthe local coordinate system, the relation between lo-cal and global strains is given by:
(2)
Relations (1) and (2) can be used for describingthe behaviour of a medium with an "oriented plas-ticity criterion", as suggested by FRANK et al., [1982].Without any specific hypothesis on the ratio L/t ofthe element (i.e. for standard L/t ratios) this crite-rion corresponds more with the representation of asoil medium with a high density of discontinuitiesequally oriented and requires an adaptation in or-der to model an isolated thin soil layer such as theinterface.
Following the standard finite element proce-dures for the element shown in Figure 1, strains maybe expressed as a function of nodal displacements inthe following matrix form:
(3)
where L is the derivation operator, N contains theshape (or interpolation) functions Ni = Ni(ξ,η) atthe element nodes, and ui and vi (for i = 1,8) repre-sent nodal displacements of the element, in direc-tions x1 and x2, respectively. Since the Ni functionsare defined in the coordinate system (ξ, η) of the ref-erence element, the derivation matrix B in (3) is ob-tained introducing the Jacobian matrix J of the geo-metrical transformation between the actual elementand the reference rectangular element of length Land thickness t (see Fig. 1). After making substitu-tions in relation (3), element strains will depend up-on nodal displacements, Ni interpolation functionsand element dimensions (t and L). If the element
thickness is decreased (t → 0), the terms of matrix Bin (3), which contain the t/L ratio (i.e. the inverse ofthe element aspect ratio), become negligible. It canbe easily demonstrated that for the element shownin Figure 1, assuming α = 0 for the sake of simplifi-cation, the average strains in the element are writ-ten as follows:
(4)
where u•+ and u•
- are the displacements of the ele-
ment nodes on the opposite sides along direction ηand [un] and [um] are the relative displacements inboth the normal (n) and tangential (m) directions ofthe opposite sides of the interface element along di-rection η. In other words the relative displacementsof the interface element depend upon the set of el-ement displacements computed on the two sidesperpendicular to direction η (Fig. 1). Consequently,for elements with a high aspect ratio value, thestrains computed at element nodes indicate thestrain mode in simple shear characteristic of the in-terface. The presence of parameter t in Equation (4)is essential to relate interface stresses with their cor-responding relative displacements, in accordancewith the kinematic hypotheses introduced in orderto describe the mechanical behaviour of the soil-structure interface. The behaviour of the interface isthen described by considering the relative tangen-tial displacement [um] and relative normal displace-ment [un] as state variables and the shear stress τand normal stress σn mobilized at the interface as as-sociated variables. The local behaviour (whetherelastic or elastoplastic) may thus be written as fol-lows:
(5)
where elements Kij are local stiffness. Note that thelocal constitutive law for the interface element canstill be expressed by means of a stress-strain rela-tionship (matrix KL in Eq. (5)). As already men-tioned, the approach proposed by FRANK et al.[1982] introduced in CESAR-LCPC code (called"oriented criterion") uses linear elasticity and theMohr-Coulomb plasticity criterion with either an as-sociated or non-associated flow rule in order to re-produce contact. However, based on Equation (5) itis clear that in the absence of any hypothesis on theinterface element dimension (L/t ratio) and its con-
47FINITE ELEMENT ANALYSIS OF MODEL PILES AXIALLY LOADED IN SANDS
APRILE - GIUGNO 2008
stitutive law, the element may be considered as ca-pable of reproducing the behaviour of a mediumexhibiting a significant number of discontinuitiesequally oriented. The interface zone is thereforeportrayed more like a remoulded zone. The basis ofthe oriented criterion formulation has been reem-ployed here and modified in order to adapt to inter-face problems involving an elastoplastic behaviour.
Basics for the constitutive modelling of the soil-structure interface
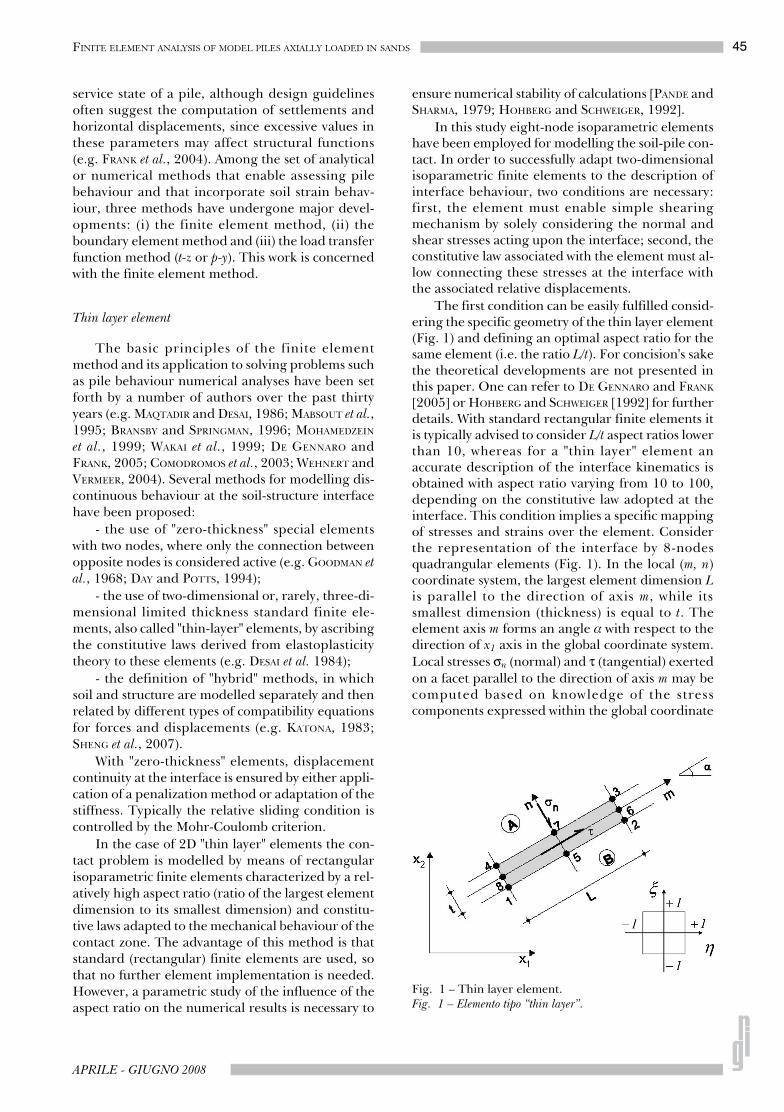
The striking analogy existing between therough interface behaviour and that of granular soilstested in triaxial conditions has been for many au-thors the tenet of an accurate constitutive modellingof interfaces (e.g. BOULON and NOVA, 1990). Typicalresults of a constant normal stress interface test con-sidering the interaction of a granular medium anda rough interface are presented in Figure 2. Results
are expressed in terms of mobilized friction
and relative normal displacement [un] at the inter-face vs. relative tangential displacement [ut] (being τthe shear stress mobilized at the interface and σn thenormal stress at the interface).
As it can be observed mobilized friction μ in-creases until reaching the failure condition μp. Thisoccurs progressively in loose interfaces and the mo-bilized friction at failure coincides with the residualvalue μr. Conversely, peak shear strength is usuallyobserved at high densities or at low normal stresslevels, in both cases associated with interface dila-tancy. In this latter situation strain softening on themobilised friction curve is also observed. During in-terface tests at constant normal stress, the relativenormal displacement initially decreases (contrac-tion phase) and then increases at rather constantrate corresponding to the dilatancy phase (i.e. con-
stant slope , being D the dilatancy). The
threshold from contraction to dilatancy defines thephase transformation state, at this state μ = μc and
, hence D = 0. Finally, at large relative tan-gential displacements, μ = μr (r stands for residual)and no volume changes are observed (D = 0). Thelatter situation reflects the well established findingson the critical state of soils. Note that in interfacetests at constant volume or constant normal stiff-ness, contraction is manifested by a decrease in nor-mal stress whereas dilatancy at large relative tan-gential displacements will be reflected by an in-crease in normal stress (constrained dilatancy).
It is worth noting that two different states of theinterface are characterised by the condition D = 0(i.e. zero volume changes), namely phase transfor-mation and critical or, more properly, ultimatestate. Recent experimental results have shown thatboth phase transformation state and ultimate statefor interfaces are encountered at the same mobi-lised friction μ (in other words μc = μr), suggestingthat dilatancy D is a unique function of the stresslevel μ (e.g. LINGS and DIETZ, 2005). Other experi-mental findings seem to corroborate the idea thattransformation state and critical state are distin-guishable (e.g. DE GENNARO, 1999; DE GENNARO andFRANK, 2002; GHIONNA and MORTARA, 2002). Theuniqueness of the condition D = 0 as a function ofμ, which means a solely stress-dependent dilatancyfor interfaces, is then still debated, although it isgenerally recognized that dilatancy in sand tested intriaxial conditions show not only stress-dependencybut also state-dependency (e.g. LI and DAFALIAS,2000). Based on the results of LINGS and DIETZ
[2005] and DIETZ and LINGS [2006] it might be ar-gued that apparatuses compliances could be at theorigin of these discrepancies.
Fig. 2 – Characteristic behaviour of a granular soil-structure interface.Fig. 2 – Comportamento tipico dell’interfaccia terreno granulare-struttura.
48 DE GENNARO - FRANK - SAID
RIVISTA ITALIANA DI GEOTECNICA
The MEPI-2D model
Moving from these preliminary considerationsabout interface behaviour, the elastoplastic inter-face model MEPI-2D [DE GENNARO and FRANK, 2002]is now briefly presented and its capability in repro-ducing experimental data of interface tests is veri-fied. This model will be used to describe the contactbetween the piles and the soils during the FEM cal-culations presented in this paper.
Let dσ = {dσn, dτ}T the vector of stress incre-ments and d{ue} = {d[ue
n], d[uet]}T the vector of rel-
ative elastic displacements increments. The elasticbehaviour of the interface is given by the followinglinear relation:
(6)
Matrix Ke is composed of the elastic interfacestiffness in both the normal (Kn) and tangential (Kt)directions. Elastic behaviour does not take into ac-count any coupling between the normal and tangen-tial phenomena occurring at the interface. In orderto express the evolution of the stiffness vs. the nor-mal stress and density state of the material, the fol-lowing definition is provided:
(7)
where kn, kt and N are three model parameters andσni is the initial normal stress. Both Kn and Kt in-crease when the initial normal stress increases fol-lowing a power law.
During shear, the coefficient μ rises graduallyand at failure reaches the maximum value μp (peakvalue for dense sands, threshold value μr for loosesands; see Fig. 2a). This is reflected in the plane(σn, τ) by the rotation of the line τ = μσn (Fig. 2b),assuming that the linear failure envelope of Mohr-Coulomb keeps unchanged. Experimental resultsalso indicate that for a rough surface the failure con-dition is still well approximated by the Mohr-Cou-lomb criterion. The yield function of MEPI-2Dmodel is a generalization of the Mohr-Coulomb fail-ure criterion neglecting cohesion and is written:
(8)
where is the hardening function and the rel-ative tangential plastic displacement [up
t] the corre-sponding hardening variable. Based on experimen-tal evidences the hardening function is assumed hy-perbolical and is given by the following relation:
(9)
Again, μp is the friction coefficient at failure,μ0=tanδ0 is the initial friction coefficient delimitingthe elastic domain, t is the interface layer thickness,a (dimensionless) is a model parameter which con-trols the shape of the hardening law (9), σni is the in-itial normal stress acting on the interface layer andp0 = 1 kPa is a reference pressure.
Equations (8) and (9) define a mobilized frictionhardening mechanism of the yield surface F that en-larges the initial elastic domain until reaching thepeak (failure) condition given by the Mohr-Cou-lomb failure criterion, as defined by the friction an-gle δp=tan-1(μp) (see Fig. 2b). The softening behav-iour, often observed during interface tests on densesands (Fig. 2a), may be introduced by replacing therelation in (9) and adopting the following softeninglaw:
(10)
where is the hardening parameter value at fail-ure, which enables defining the position of the cur-rent peak shear strength, as an alternative to morerigorous approaches (e.g. MUIR WOOD et al., 1994;DE GENNARO et al., 2002). Parameter μf is the currentfriction coefficient at failure (μf < μp), μr is the resid-ual friction coefficient and b is a model parameterthat controls the softening rate. An increase of b val-ues accelerates softening and stabilization at the re-sidual friction value μr.
The closure condition for MEPI-2D model for-mulation is the definition of the plastic flow ena-bling to relate plastic relative normal and tangentialdisplacements with the corresponding stress com-
ponents σn and τ. Dilatancy ratio has been
used to define the plastic flow rule of the model. Asdiscussed in the previous section there are still notconverging opinions about the type of flow rule as-sociated to the stress-dilatancy interface behaviour.As already discussed earlier it is still a matter of dis-cussion if the flow rule for interface is simple (i.e. di-latancy is a unique function of μ) or double. Onemain argument valid for sands (e.g. LI and DAFALIAS,2000) potentially supports double flow rule for theinterface: assuming a simple flow rule the stress ra-tio μc at phase transformation state would coincidewith the value of μr at ultimate state. Being the latterintrinsic (although evolving with the mean effective

49FINITE ELEMENT ANALYSIS OF MODEL PILES AXIALLY LOADED IN SANDS
APRILE - GIUGNO 2008
stress), μc would be intrinsic too. This is not verifiedin sands where μc is a variable quantity of relativedensity.
Contraction at the interface corresponds to the
condition: μ ≤ μc (D= / >0), whereas dila-
tancy is generated if: μ ≤ μc(D= / <0). Thephase transformation state is obtained when μ = μc,for this condition D = 0. The latter situation also oc-curs at large tangential displacements at the ulti-mate state. The phenomenological interpretation ofthis trend given in DE GENNARO [1999] and DE GEN-NARO and FRANK [2002] was that yield of dense inter-face layers due to shearing causes plastic dilation,resulting in an increase of the void ratio (shrinkageof the dilation region). On the other hand, shearingon loose interface layers causes an opposite effect,leading to an overall compaction of the interfaceand a reduction of the void ratio (shrinkage of thecompaction region). Whatever compaction or dila-tancy, the void ratio will tend towards the final valuedefined at ultimate state and the initial value of μc
will then tend during shear towards its ultimatevalue given by the residual friction coefficient μr.
Void ratio, like in critical state theory [SCHOFIELD
and WROTH, 1968], may serve as an appropriatestate variable for representing volumetric behaviourof the interface (e.g. DE GENNARO, 1999; DE GENNARO
and FRANK 2003). However one can simplify the for-mulation, while maintaining the same basic philos-ophy, assuming that dilatancy evolution law is afunction of the hardening parameter and adoptingthe following stress dilatancy relationship:
(11)
where μc0 is the stress ratio at phase transformationstate, μ is the mobilised friction coefficient and
is given by:
(12)
A typical evolution of function in (12)is showed in Figure 3. Parameter c defines the rateof dilatancy stabilization at the interface. When c in-creases dilatancy stabilization at the zero value (i.e.ultimate state) is reached faster. Note that althoughfunction is not directly correlated withany state parameter of the sand, plastic strain de-pendency in (11) allows to account for the evolutionof the compaction domain and hence the phenom-enon of dilatancy stabilization at larger relative dis-placements. NOVA [1977] and afterwards CUBRINOSKI
and HISHIHARA [1998] proposed a similar approachfor modelling phase transition in sands. Note that ifin Equation (11) the single flow rule of the originalCam clay model is recovered [SCHOFIELD and WROTH,1968].
MEPI-2D model has 11 parameters: kn, kt, N, μo,μp, μc0, μr, a, b, c, that can be reduced to 8 if the in-fluence of the initial normal stress on the elasticstiffness and softening behaviour are not consid-ered. Parameters t, σni and p0 are defined from ini-tial conditions and the physical properties of thesand (t ≅ 10 D50). Model reliability has been verifiedby simulating various soil-structure shear tests fol-lowing various loading paths: constant normalstress, constant volume and constant normal stiff-ness tests (e.g. DE GENNARO and FRANK 2002). Resultsof simulations, not presented here for the sake ofbrevity, are available in DE GENNARO [1999], DE GEN-NARO and FRANK [2002] and SAID [2006].
3. Presentation of axially loaded model piles in sands
In the following section we describe the twocases of axially loaded models piles in sands ana-lysed using the FEM code CESAR-LCPC. The firstexample refers to the loading tests of a model pilewhished in place in a calibration chamber [DE GEN-NARO, 1999]. The second one concerns the pile testconducted in Dunkerque (France) using the Impe-rial College model pile [CHOW 1997].
Type 1 pile test: model pile in calibration chamber
The calibration chamber test set-up enables re-constituting a cylindrically-shaped soil mass (diam-eter: 524 mm, height: 680 mm). DE GENNARO et al.[1999] used Fontainebleau sand, the reconstitution
Fig. 3 – Typical evolution of the dilatancy function of ME-PI-2D model.Fig. 3 – Evoluzione tipica della dilatanza del modello MEPI-2D.
50 DE GENNARO - FRANK - SAID
RIVISTA ITALIANA DI GEOTECNICA
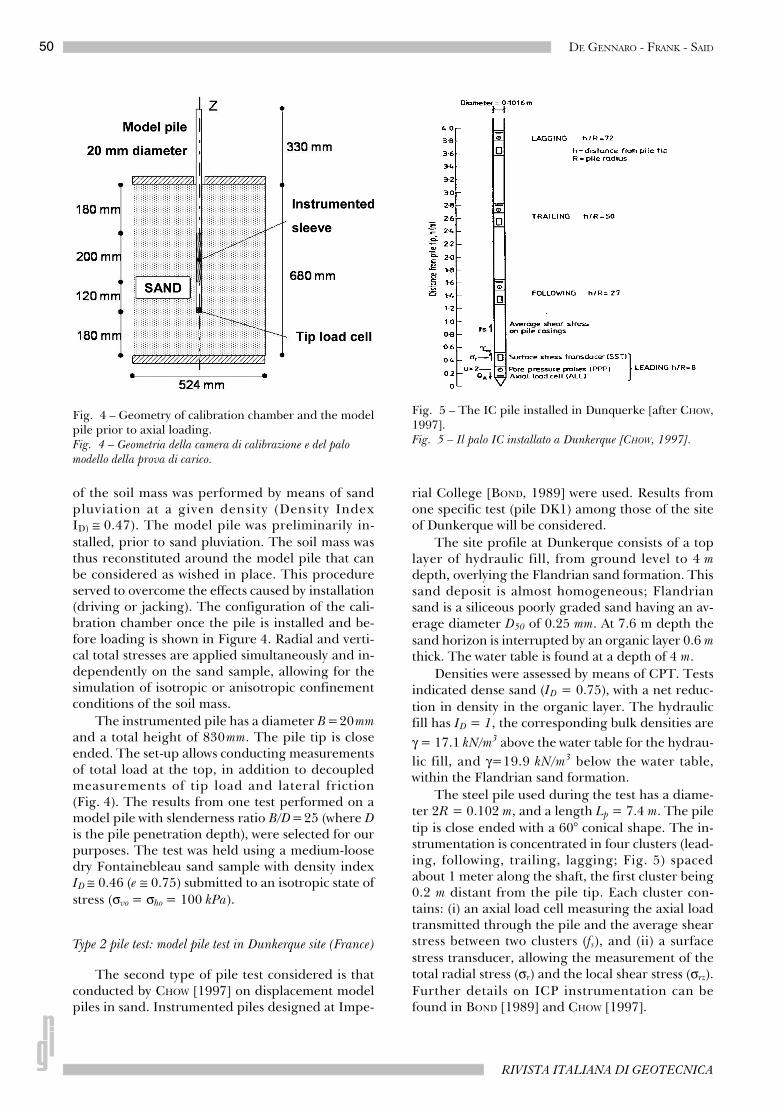
of the soil mass was performed by means of sandpluviation at a given density (Density IndexID) ≅ 0.47). The model pile was preliminarily in-stalled, prior to sand pluviation. The soil mass wasthus reconstituted around the model pile that canbe considered as wished in place. This procedureserved to overcome the effects caused by installation(driving or jacking). The configuration of the cali-bration chamber once the pile is installed and be-fore loading is shown in Figure 4. Radial and verti-cal total stresses are applied simultaneously and in-dependently on the sand sample, allowing for thesimulation of isotropic or anisotropic confinementconditions of the soil mass.
The instrumented pile has a diameter B=20mmand a total height of 830mm. The pile tip is closeended. The set-up allows conducting measurementsof total load at the top, in addition to decoupledmeasurements of tip load and lateral friction(Fig. 4). The results from one test performed on amodel pile with slenderness ratio B/D=25 (where Dis the pile penetration depth), were selected for ourpurposes. The test was held using a medium-loosedry Fontainebleau sand sample with density indexID ≅ 0.46 (e ≅ 0.75) submitted to an isotropic state ofstress (σvo = σho = 100 kPa).
Type 2 pile test: model pile test in Dunkerque site (France)
The second type of pile test considered is thatconducted by CHOW [1997] on displacement modelpiles in sand. Instrumented piles designed at Impe-
rial College [BOND, 1989] were used. Results fromone specific test (pile DK1) among those of the siteof Dunkerque will be considered.
The site profile at Dunkerque consists of a toplayer of hydraulic fill, from ground level to 4 mdepth, overlying the Flandrian sand formation. Thissand deposit is almost homogeneous; Flandriansand is a siliceous poorly graded sand having an av-erage diameter D50 of 0.25 mm. At 7.6 m depth thesand horizon is interrupted by an organic layer 0.6 mthick. The water table is found at a depth of 4 m.
Densities were assessed by means of CPT. Testsindicated dense sand (ID = 0.75), with a net reduc-tion in density in the organic layer. The hydraulicfill has ID = 1, the corresponding bulk densities areγ = 17.1 kN/m3 above the water table for the hydrau-lic fill, and γ=19.9 kN/m3 below the water table,within the Flandrian sand formation.
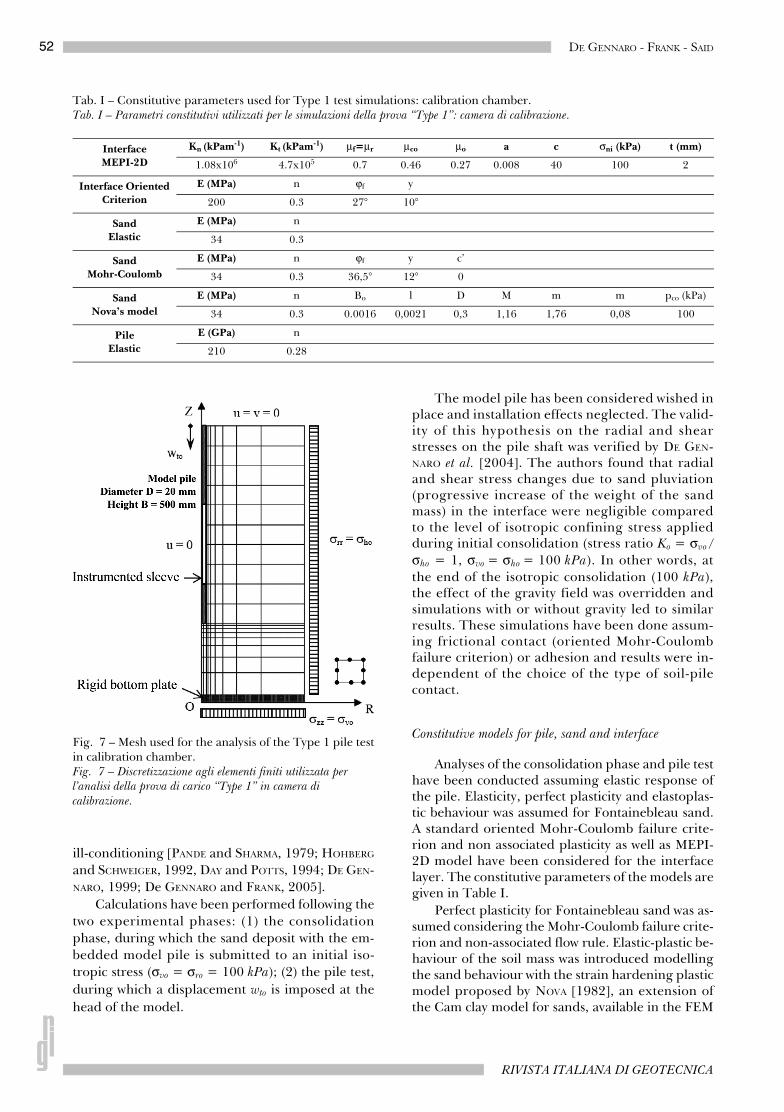
The steel pile used during the test has a diame-ter 2R = 0.102 m, and a length Lp = 7.4 m. The piletip is close ended with a 60° conical shape. The in-strumentation is concentrated in four clusters (lead-ing, following, trailing, lagging; Fig. 5) spacedabout 1 meter along the shaft, the first cluster being0.2 m distant from the pile tip. Each cluster con-tains: (i) an axial load cell measuring the axial loadtransmitted through the pile and the average shearstress between two clusters (fs), and (ii) a surfacestress transducer, allowing the measurement of thetotal radial stress (σr) and the local shear stress (σrz).Further details on ICP instrumentation can befound in BOND [1989] and CHOW [1997].
Fig. 4 – Geometry of calibration chamber and the modelpile prior to axial loading.Fig. 4 – Geometria della camera di calibrazione e del palo modello della prova di carico.
Fig. 5 – The IC pile installed in Dunquerke [after CHOW,1997].Fig. 5 – Il palo IC installato a Dunkerque [CHOW, 1997].

51FINITE ELEMENT ANALYSIS OF MODEL PILES AXIALLY LOADED IN SANDS
APRILE - GIUGNO 2008
The installation of the pile was performed usinga hydraulic jack, with consecutives jacking strokes al-lowing for a constant pile head displacement rate of600 mm/min. At the end of the installation an equali-sation period of about 15 hours was considered,based on the time necessary to stabilise the values ofthe measured radial effective stress. An overall in-crease of the radial effective stress σ’rc was found inthe four clusters at the end of the equalisation pe-riod. The following empirical formula [CHOW, 1997;JARDINE et al., 1998], gives the final value after equal-isation of radial stress along the pile shaft :
(13)
where h is the vertical distance from the pile tip, Rthe pile radius, σ’vo the effective vertical stress, pa theatmospheric pressure, σ’rc the radial effective stressat the end of installation and qp the net cone resist-ance from CPT. The profile of σ’r obtained in Dun-kerque site is shown in Figure 6a.
It is observed that the use of Equation (13) is for-mally equivalent to the application of a lateral (ra-dial) pressure σ’r = K σ’v on the pile shaft with K val-ues defined as a function of net cone resistance,state of stress and geometry. In particular, relation(13) allows to define explicitly the condition of lat-eral pressure following installation via a direct cor-relation with the CPT profile as given by the evolu-tion of the net cone resistance qp.
The four clusters also allowed measurements ofthe residual shear stress on the pile shaft and theresidual tip load after installation. The distributionof the residual shear stress τres available from theseclusters (Fig.6b) was found in good agreement withthe theoretical distribution proposed by ALAWNEH
et MALKAWI [2000] for a long flexible pile. The re-sidual tip load Qp-res is obtained from the measure-ment of the axial load cell placed on the pile tip(Leading cluster) after 15 hours of equalization, itwas found Qp(res) ≅ 51 kN. Both τres and qp-res = Qp(res)/Sp , where Sp is the model pile tip surface, were ap-plied numerically together with the distribution ofσ ’r given in (13).
Compression loads on the model pile were ap-plied following a variant of the LCPC procedure(e.g. BUSTAMANTE, 1982). Loads were applied by suc-cessive increments of 5% to 10% of the expectedmaximum load, and maintained for 10 to 20 min-utes. Failure was reached when the rate of pilemovement increased significantly with time. Thefailure axial load, was 309 kN, which corresponds toa pile head displacement of 4.2 mm.
4. Analysis of Type 1 pile test: model pile in calibration chamber
The problem considered and the finite elementmesh is shown in Figure 7. Mesh consists of 230 ax-isymmetric isoparametric 8-node solid elements(621 nodes), including 20 pile elements and 10 in-terface thin-layer elements with an aspect ratio L/t =25. This value was found appropriate in reproduc-ing the interface behaviour and avoiding numerical
Fig. 6 – Distribution of the radial (a) and shear stress (b)on the shaft of the IC pile after installation and equaliza-tion [after CHOW, 1997].Fig. 6 – Distribuzione della tensione radiale (a) ed della tensione di taglio (b) sulla superficie laterale del palo IC alla fine dell’installazione e del periodo di equalizzazione [CHOW, 1997].
52 DE GENNARO - FRANK - SAID
RIVISTA ITALIANA DI GEOTECNICA
ill-conditioning [PANDE and SHARMA, 1979; HOHBERG
and SCHWEIGER, 1992, DAY and POTTS, 1994; DE GEN-NARO, 1999; De GENNARO and FRANK, 2005].
Calculations have been performed following thetwo experimental phases: (1) the consolidationphase, during which the sand deposit with the em-bedded model pile is submitted to an initial iso-tropic stress (σvo = σro = 100 kPa); (2) the pile test,during which a displacement wto is imposed at thehead of the model.
The model pile has been considered wished inplace and installation effects neglected. The valid-ity of this hypothesis on the radial and shearstresses on the pile shaft was verified by DE GEN-NARO et al. [2004]. The authors found that radialand shear stress changes due to sand pluviation(progressive increase of the weight of the sandmass) in the interface were negligible comparedto the level of isotropic confining stress appliedduring initial consolidation (stress ratio Ko = σvo /σho = 1, σvo = σho = 100 kPa). In other words, atthe end of the isotropic consolidation (100 kPa),the effect of the gravity field was overridden andsimulations with or without gravity led to similarresults. These simulations have been done assum-ing frictional contact (oriented Mohr-Coulombfailure criterion) or adhesion and results were in-dependent of the choice of the type of soil-pilecontact.
Constitutive models for pile, sand and interface
Analyses of the consolidation phase and pile testhave been conducted assuming elastic response ofthe pile. Elasticity, perfect plasticity and elastoplas-tic behaviour was assumed for Fontainebleau sand.A standard oriented Mohr-Coulomb failure crite-rion and non associated plasticity as well as MEPI-2D model have been considered for the interfacelayer. The constitutive parameters of the models aregiven in Table I.
Perfect plasticity for Fontainebleau sand was as-sumed considering the Mohr-Coulomb failure crite-rion and non-associated flow rule. Elastic-plastic be-haviour of the soil mass was introduced modellingthe sand behaviour with the strain hardening plasticmodel proposed by NOVA [1982], an extension ofthe Cam clay model for sands, available in the FEM
Fig. 7 – Mesh used for the analysis of the Type 1 pile testin calibration chamber.Fig. 7 – Discretizzazione agli elementi finiti utilizzata per l’analisi della prova di carico “Type 1” in camera di calibrazione.
Tab. I – Constitutive parameters used for Type 1 test simulations: calibration chamber.Tab. I – Parametri constitutivi utilizzati per le simulazioni della prova “Type 1”: camera di calibrazione.
InterfaceMEPI-2D
Kn (kPam-1) Kt (kPam-1) μf=μr μco μo a c σni (kPa) t (mm)
1.08x10⁶ 4.7x10⁵ 0.7 0.46 0.27 0.008 40 100 2
Interface Oriented Criterion
E (MPa) n ϕf y
200 0.3 27° 10°
SandElastic
E (MPa) n
34 0.3
SandMohr-Coulomb
E (MPa) n ϕf y c’
34 0.3 36,5° 12° 0
SandNova’s model
E (MPa) n Bo l D M m m pco (kPa)
34 0.3 0.0016 0,0021 0,3 1,16 1,76 0,08 100
PileElastic
E (GPa) n
210 0.28
53FINITE ELEMENT ANALYSIS OF MODEL PILES AXIALLY LOADED IN SANDS
APRILE - GIUGNO 2008
code CESAR-LCPC. The details of Nova model for-mulation are here omitted for the sake of brevity.Note that in CESAR-LCPC code linear elasticity isconsidered instead of non linear elastic behaviour asgiven in the original formulation by Nova. In addi-tion to the quoted reference the description of theimplemented model, including procedures for pa-rameter determination are available in DE GENNARO
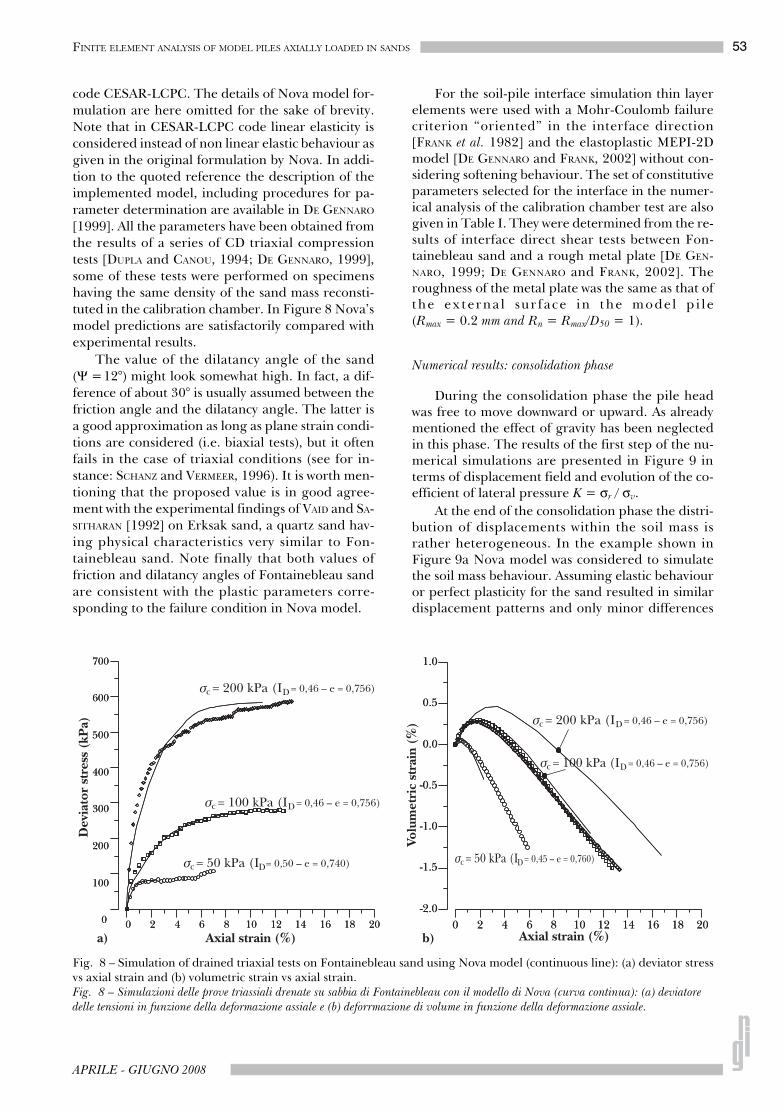
[1999]. All the parameters have been obtained fromthe results of a series of CD triaxial compressiontests [DUPLA and CANOU, 1994; DE GENNARO, 1999],some of these tests were performed on specimenshaving the same density of the sand mass reconsti-tuted in the calibration chamber. In Figure 8 Nova’smodel predictions are satisfactorily compared withexperimental results.
The value of the dilatancy angle of the sand(Ψ =12°) might look somewhat high. In fact, a dif-ference of about 30° is usually assumed between thefriction angle and the dilatancy angle. The latter isa good approximation as long as plane strain condi-tions are considered (i.e. biaxial tests), but it oftenfails in the case of triaxial conditions (see for in-stance: SCHANZ and VERMEER, 1996). It is worth men-tioning that the proposed value is in good agree-ment with the experimental findings of VAID and SA-SITHARAN [1992] on Erksak sand, a quartz sand hav-ing physical characteristics very similar to Fon-tainebleau sand. Note finally that both values offriction and dilatancy angles of Fontainebleau sandare consistent with the plastic parameters corre-sponding to the failure condition in Nova model.
For the soil-pile interface simulation thin layerelements were used with a Mohr-Coulomb failurecriterion “oriented” in the interface direction[FRANK et al. 1982] and the elastoplastic MEPI-2Dmodel [DE GENNARO and FRANK, 2002] without con-sidering softening behaviour. The set of constitutiveparameters selected for the interface in the numer-ical analysis of the calibration chamber test are alsogiven in Table I. They were determined from the re-sults of interface direct shear tests between Fon-tainebleau sand and a rough metal plate [DE GEN-NARO, 1999; DE GENNARO and FRANK, 2002]. Theroughness of the metal plate was the same as that ofthe ex terna l sur face in the mode l p i l e(Rmax = 0.2 mm and Rn = Rmax/D50 = 1).
Numerical results: consolidation phase
During the consolidation phase the pile headwas free to move downward or upward. As alreadymentioned the effect of gravity has been neglectedin this phase. The results of the first step of the nu-merical simulations are presented in Figure 9 interms of displacement field and evolution of the co-efficient of lateral pressure K = σr / σv.
At the end of the consolidation phase the distri-bution of displacements within the soil mass israther heterogeneous. In the example shown inFigure 9a Nova model was considered to simulatethe soil mass behaviour. Assuming elastic behaviouror perfect plasticity for the sand resulted in similardisplacement patterns and only minor differences
Fig. 8 – Simulation of drained triaxial tests on Fontainebleau sand using Nova model (continuous line): (a) deviator stressvs axial strain and (b) volumetric strain vs axial strain.Fig. 8 – Simulazioni delle prove triassiali drenate su sabbia di Fontainebleau con il modello di Nova (curva continua): (a) deviatore delle tensioni in funzione della deformazione assiale e (b) deforrmazione di volume in funzione della deformazione assiale.

54 DE GENNARO - FRANK - SAID
RIVISTA ITALIANA DI GEOTECNICA
in terms of vertical displacements values. The radialdisplacement u decreases progressively movingfrom the external boundary to the surface of themodel pile. The pattern shows a pronounced sym-metry with respect to the middle horizontal plane ofthe calibration chamber (sec. B at z = 400 mm,
Fig. 9b). The vertical displacements v decreasemoving from the bottom to the top of the sand de-posit; it is worth noting that at the end of the consol-idation phase the model pile has been lifted byabout 0.16 mm assuming a sand obeying to Novamodel. This causes the mobilisation of an initial fric-tion at the interface between the pile and the sandand the mobilisation of a residual shear stress ofabout 16 kPa along the pile shaft in the zone of theinstrumented sleeve. The non-uniformity of thestress field within the sand deposit is well repre-sented by the evolution of the coefficient of lateralpressure K (Fig. 9b). Results are presented assumingthe soil mass elastoplastic (Nova model). CoefficientK is given for the three specific sections of the cali-bration chamber (A, B, C). On the pile shaft thevalue of K is greater than one, as expected. It isworth noting that at the end of the consolidationstep plastic zones appear at the extremities of thepile interface when the soil is elastic (Fig. 10a).These zones extend in the vicinity of the soil massassuming Mohr-Coulomb failure criterion for thesand (Fig. 10b) and spread within the soil mass upto the model boundaries assuming elastoplastic be-haviour for Fontainebleau sand using Nova model(Fig. 10c).
Numerical results: pile loading test
A series of numerical simulations have been per-formed in order to assess the influence of variousfactors on the overall behaviour of the model pileduring tests in calibration chamber. We will focus orattention on two specific points: the influence of theconstitutive laws of sand and interface.
Fig. 9 – Predicted distributions of the radial and vertical dis-placements in the sand mass after installation of the modelpile (a) and evolution of the coefficient of lateral pressure Kalong three sections of the calibration chamber (b).Fig. 9 – Distribuzione ottenuta via analisi numerica agli elementi finiti degli spostamenti radiali e verticali nel terreno alla fine dell’installazione del palo modello (a), evoluzione radiale del coefficiente di spinta laterale K in tre sezioni della camera di calibrazione (b).
Fig. 10 – Plastic points and plastic zones in the interfaceand the soil mass after consolidation.Fig. 10 – Punti plastici e zone di plasticizzazione all’interfaccia e nel terreno alla fine della consolidazione.
55FINITE ELEMENT ANALYSIS OF MODEL PILES AXIALLY LOADED IN SANDS
APRILE - GIUGNO 2008
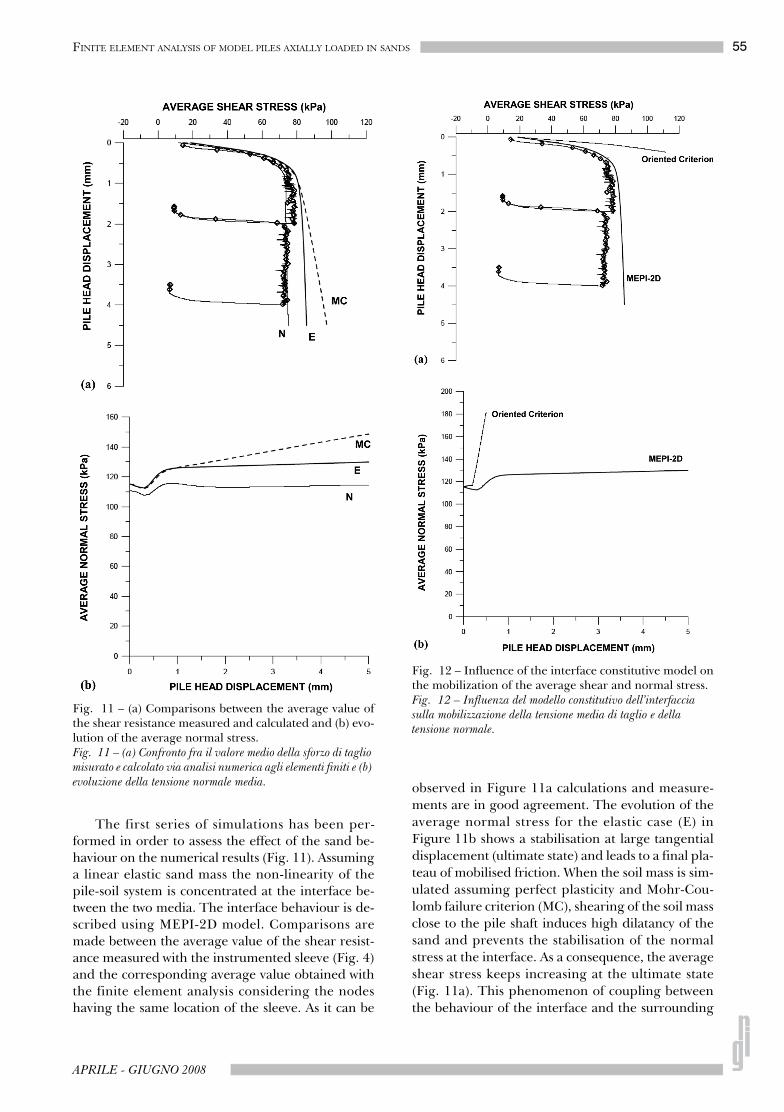
The first series of simulations has been per-formed in order to assess the effect of the sand be-haviour on the numerical results (Fig. 11). Assuminga linear elastic sand mass the non-linearity of thepile-soil system is concentrated at the interface be-tween the two media. The interface behaviour is de-scribed using MEPI-2D model. Comparisons aremade between the average value of the shear resist-ance measured with the instrumented sleeve (Fig. 4)and the corresponding average value obtained withthe finite element analysis considering the nodeshaving the same location of the sleeve. As it can be
observed in Figure 11a calculations and measure-ments are in good agreement. The evolution of theaverage normal stress for the elastic case (E) inFigure 11b shows a stabilisation at large tangentialdisplacement (ultimate state) and leads to a final pla-teau of mobilised friction. When the soil mass is sim-ulated assuming perfect plasticity and Mohr-Cou-lomb failure criterion (MC), shearing of the soil massclose to the pile shaft induces high dilatancy of thesand and prevents the stabilisation of the normalstress at the interface. As a consequence, the averageshear stress keeps increasing at the ultimate state(Fig. 11a). This phenomenon of coupling betweenthe behaviour of the interface and the surrounding
Fig. 11 – (a) Comparisons between the average value ofthe shear resistance measured and calculated and (b) evo-lution of the average normal stress.Fig. 11 – (a) Confronto fra il valore medio della sforzo di taglio misurato e calcolato via analisi numerica agli elementi finiti e (b) evoluzione della tensione normale media.
Fig. 12 – Influence of the interface constitutive model onthe mobilization of the average shear and normal stress.Fig. 12 – Influenza del modello constitutivo dell’interfaccia sulla mobilizzazione della tensione media di taglio e della tensione normale.
56 DE GENNARO - FRANK - SAID
RIVISTA ITALIANA DI GEOTECNICA
sand mass has been seldom analysed during FEManalyses of pile tests. In contrast to the high con-strained dilatancy imposed by perfectly plastic sand,a more realistic response during loading is obtainedassuming elastoplastic behaviour for the sand usingNova model (N). In this case the stabilization of dila-tancy imposed by the interface model MEPI-2D isless affected by the surrounding soil behaviour, al-though some fluctuations of the normal stress arestill observed (Fig. 11b). As already observed plasticzones appears during the consolidation phase usingNova model (Fig. 10c). These plastic zones are notassociated with failure, like in the case of perfectplasticity and Mohr-Coulomb failure criterion, butonly with plastic hardening. This corresponds to alocal volumetric compaction of the sand. Conse-quently the value of the normal stress on the pileshaft at the end of consolidation using Nova modelis also slightly lower than that obtained assumingelastic and elastic perfectly plastic behaviour. It isworth noting that since on the pile shaft at the endof consolidation no plastic zones are generated usingMohr-Coulomb failure criterion for the sand massthe value of σn is the same obtained assuming elasticbehaviour of the sand.
The influence of the interface model is consid-ered comparing the responses of the two dilatant in-terface layers when the sand mass behaves as anelastic medium (Fig. 12). This is obtained using al-ternatively the Mohr-Coulomb “oriented failure cri-terion” and MEPI-2D to model the interface behav-iour. The essential feature of the behaviour of theinterface is related to the restrained dilatancy devel-oping during shear, allowing for an increase of theshaft resistance. Results in Figure 12 show clearlythat an overestimation of the dilatancy of the inter-face, as in the case of the Mohr-Coulomb orientedfailure criterion leads to an unrealistic prediction ofthe evolution of the normal stress at the interfaceand an overestimation of the mobilised shear on thepile shaft. The essential role played by an adequateconstitutive modelling from initial yield to the ulti-mate state condition is again emphasised.
Finally, the comparison with total experimentalload values at the pile head (Qt) and tip (Qp) is shownin Figure 13. Results refer to calculation performedusing MEPI-2D for the interface and assuming elas-tic, elastic perfectly plastic and elastoplastic behav-iour of the sand mass (Figs. 13a, b, c). Although theproblem of pile failure under the tip could be bettersimulated assuming a large strain formulation, simu-lation results in terms of total load Qps including plas-tic behaviour in the soil mass indicate qualitatively agood agreement with the experimental data (curveQp). The deviation between measured and computedvalues is probably due to the pile installation proce-dure, at the origin of the underestimation of the piletip resistance Qp. This is probably due to a screen ef-
fect of the model pile during sand pluviation reflect-ing a drop in density over the zone beneath the tip.Note that for all calculations the total shaft resistancemobilization curve Qls obtained integrating the stressdistribution τ along the lateral surface of the modelpile lies close to the experimental total load curve Qt.As a consequence, the finite element computationprediction of total shaft friction Qls is in close agree-ment with the measured values whereas the load atpile tip Qps has been overestimated.
5. Analysis of Type 2 pile test: model pile test in Dunkerque site (france)
The full scale test on an instrumented modelpile jacked in sand and subjected to axial compres-sion load [CHOW, 1997] is now analysed. The prob-lem has been presented in section 2. The finite ele-ment mesh used for the simulations of the pile testis shown in Figure 14. Axisymmetric conditions areconsidered (Z being the axis of symmetry, coincid-ing with the pile axis). The limits of the domain in-vestigated are fixed at 30 m in the vertical direction(i.e. more than 3 times the pile length, Lp) and 3times the pile length in the radial (horizontal) direc-tion. The horizontal (radial) displacements are setequal to zero on the vertical boundary and the ver-tical displacements are not allowed on the bottomboundary. The mesh consists of 1402 axisymmetricisoparametric 8-node solid elements, including 100pile elements and 50 interface elements. The inter-face layer is t = 3 mm in width (12 times D50 of thesand) and its behaviour is simulated by means ofeight-node thin-layer elements. The aspect ratio L/tof the interface elements (L/t=48) was chosen againin order to better reproduce the interface behaviourand avoid numerical ill-conditioning [PANDE andSHARMA, 1979; HOHBERG and SCHWEIGER, 1992; DE
GENNARO, 1999].During numerical analyses conducted on the
pile test using the calibration chamber the modelpile has been considered “wished in place” as a con-sequence of the reconstitution procedure of the soilmass. This situation is quite unusual in real practiceand is no longer valid for the pile test of Dunkerquepresented in this section. In the case of piles or pilesgroup installation effects have a major impact onthe overall behaviour after construction. This is animportant issue which is still seldom considered infinite element analyses.
Indeed the installation of a single pile remouldsthe soil and thus plays an important role on its be-haviour. Remoulding occurs in the immediate vicin-ity of the pile shaft (influence on the interface zone)and within the soil mass. In both cases it cannot beassumed anymore that the soil characteristics are in-

57FINITE ELEMENT ANALYSIS OF MODEL PILES AXIALLY LOADED IN SANDS
APRILE - GIUGNO 2008
tact, as often assumed in numerical modelling of soilmasses. Note that this remoulding can sometimesbe beneficial. Driven piles in loose sands, for in-stance, lead to a densification of the neighbouringsoil and an increase of the bearing capacity of thefoundation.
The various installation techniques for piles canbe cut down to two broad methods, as far as numeri-cal modelling is concerned. These methods are ei-ther driving a prefabricated pile, or by boring a holein the ground and by “pouring” concrete inside it.Each of these two methods should clearly be treated
differently in terms of numerical modelling. Moreo-ver, since the bearing capacity depends on both shaftand tip resistances, modifications of both due to theinstallation effects need to be carefully assessed priorto any finite element analysis of the mechanical be-
Fig. 13 – Comparisons between measured and predicted total loads during Type 1 pile test in calibration chamber: (a)elastic soil mass, (b) elastic perfectly plastic soil mass (Mohr-Coulomb) and (c) elastoplastic soil mass (Nova model).Fig. 13 – Confronto fra i valori dei carichi misurati durante la prova di carico “Type 1” in camera di calibrazione e calcolati via analisi numerica agli elementi finiti: (a) terreno elastico, (b) terreno elastico perfettamente plastico (Mohr-Coulomb) e (c) terreno elastoplastico (modello di Nova).
Fig. 14 – Mesh adopted for the numerical analysis of type2 pile test in Dunkerque.Fig. 14 – Discretizzazione agli elementi finiti utilizzata per l’analisi della prova di carico “Type 2”a Dunkerque.
Fig. 15 – Measured and predicted distribution of the ra-dial stress on the shaft of the IC pile assuming elastic per-fectly plastic soil mass (Mohr-Coulomb). Experimentaldata after CHOW [1997].Fig. 15 – Confronto fra i valori della tensioni radiali misurati sulla superficie laterale del palo IC e calcolati via analisi agli elementi finiti assumendo il comportameto del terreno elastico perfettamente plastico (Mohr-Coulomb). Dati sperimentali di CHOW [1997].
58 DE GENNARO - FRANK - SAID
RIVISTA ITALIANA DI GEOTECNICA
haviour under service loading and/or at failure. Mod-elling of driven piles needs either the use of sophisti-cated numerical techniques (e.g. large strains analy-sis, conform mapping, meshless techniques, others)or the adaptation of available experimental data and/or correlations enabling to initialize the state of stresswithin the soils prior to further loading. The initiali-zation of the normal stress and the residual shearstress acting on the pile shaft and the estimation ofthe residual tip load after driving are likely to be thecrucial issues associated with this phase. Modelling ofbored piles looks easier, though some features stillneed serious investigation (unloading of soils, for in-stance). Both methods may require advanced consti-tutive equations for the ground which are not com-monly used in standard practice.
The calculations presented herein aim at simu-lating the mechanical behaviour of the pile consid-ering explicitly (i) the soil and the interface geotech-nical characterisation, and (ii) the effect of installa-tion in terms of normal stress and shear stresschanges on the interface layer and residual tip load.This is done following the standard FEM approachand considering available experimental data andknown correlations enabling to initialize the state ofstress within the soil mass prior to further loading.
Constitutive models for pile, sand and interface
The mechanical parameters have been obtainedfrom data by KUWANO [1996], quoted by CHOW
[1997], derived from triaxial tests and interface di-rect shear tests on Flandrian sand from Dunkerque.In the lack of detailed tests results to be analysedonly the elastic parameters (E, ν) and the plastic pa-rameters (c’, φ’, ψ) given by the author were consid-ered and during simulations Flandrian sand hasbeen assumed elastic perfectly plastic, obeying theMohr-Coulomb failure criterion.
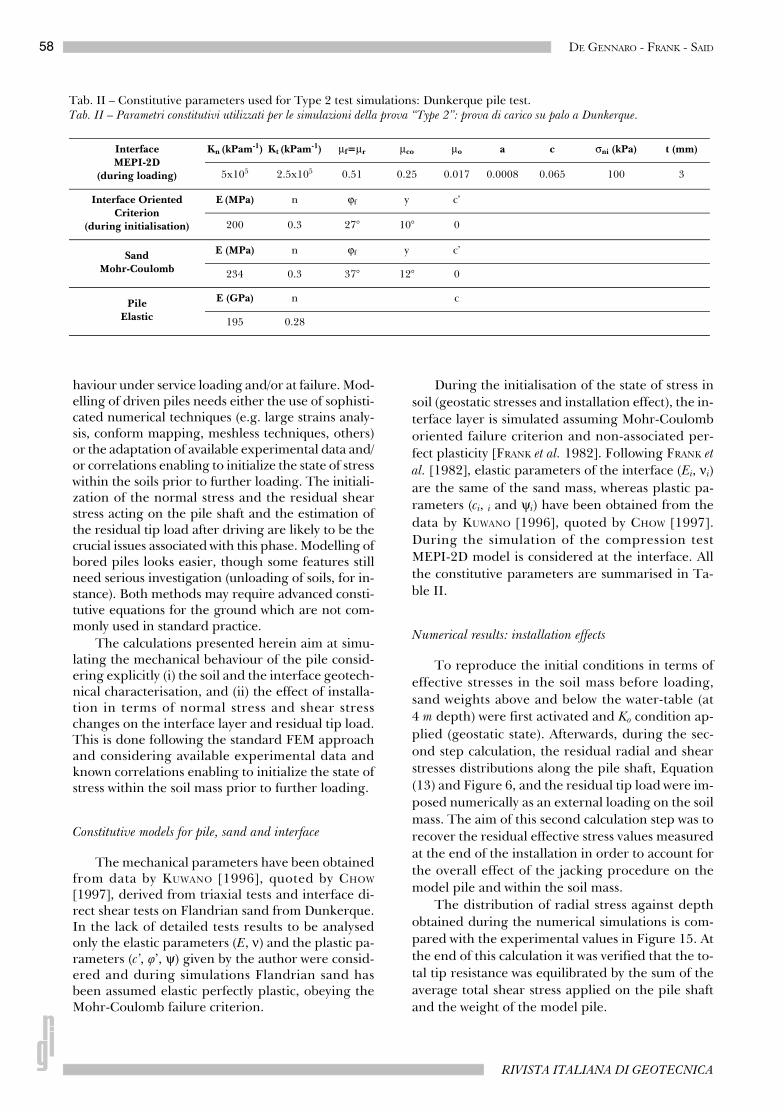
During the initialisation of the state of stress insoil (geostatic stresses and installation effect), the in-terface layer is simulated assuming Mohr-Coulomboriented failure criterion and non-associated per-fect plasticity [FRANK et al. 1982]. Following FRANK etal. [1982], elastic parameters of the interface (Ei, νi)are the same of the sand mass, whereas plastic pa-rameters (ci, i and ψi) have been obtained from thedata by KUWANO [1996], quoted by CHOW [1997].During the simulation of the compression testMEPI-2D model is considered at the interface. Allthe constitutive parameters are summarised in Ta-ble II.
Numerical results: installation effects
To reproduce the initial conditions in terms ofeffective stresses in the soil mass before loading,sand weights above and below the water-table (at4 m depth) were first activated and Ko condition ap-plied (geostatic state). Afterwards, during the sec-ond step calculation, the residual radial and shearstresses distributions along the pile shaft, Equation(13) and Figure 6, and the residual tip load were im-posed numerically as an external loading on the soilmass. The aim of this second calculation step was torecover the residual effective stress values measuredat the end of the installation in order to account forthe overall effect of the jacking procedure on themodel pile and within the soil mass.
The distribution of radial stress against depthobtained during the numerical simulations is com-pared with the experimental values in Figure 15. Atthe end of this calculation it was verified that the to-tal tip resistance was equilibrated by the sum of theaverage total shear stress applied on the pile shaftand the weight of the model pile.
Tab. II – Constitutive parameters used for Type 2 test simulations: Dunkerque pile test.Tab. II – Parametri constitutivi utilizzati per le simulazioni della prova “Type 2”: prova di carico su palo a Dunkerque.
InterfaceMEPI-2D
(during loading)
Kn (kPam-1) Kt (kPam-1) μf=μr μco μo a c σni (kPa) t (mm)
5x10⁵ 2.5x10⁵ 0.51 0.25 0.017 0.0008 0.065 100 3
Interface Oriented Criterion
(during initialisation)
E (MPa) n ϕf y c’
200 0.3 27° 10° 0
SandMohr-Coulomb
E (MPa) n ϕf y c’
234 0.3 37° 12° 0
PileElastic
E (GPa) n c
195 0.28
59FINITE ELEMENT ANALYSIS OF MODEL PILES AXIALLY LOADED IN SANDS
APRILE - GIUGNO 2008
Numerical results: pile loading test
Moving from the initial conditions obtainedduring the previous calculation step, pile test hasbeen simulated imposing a total pile head displace-ment wto=8 mm. This has been achieved applyingincrementally 1.25% of the final vertical displace-ment on the pile head in 80 increments.
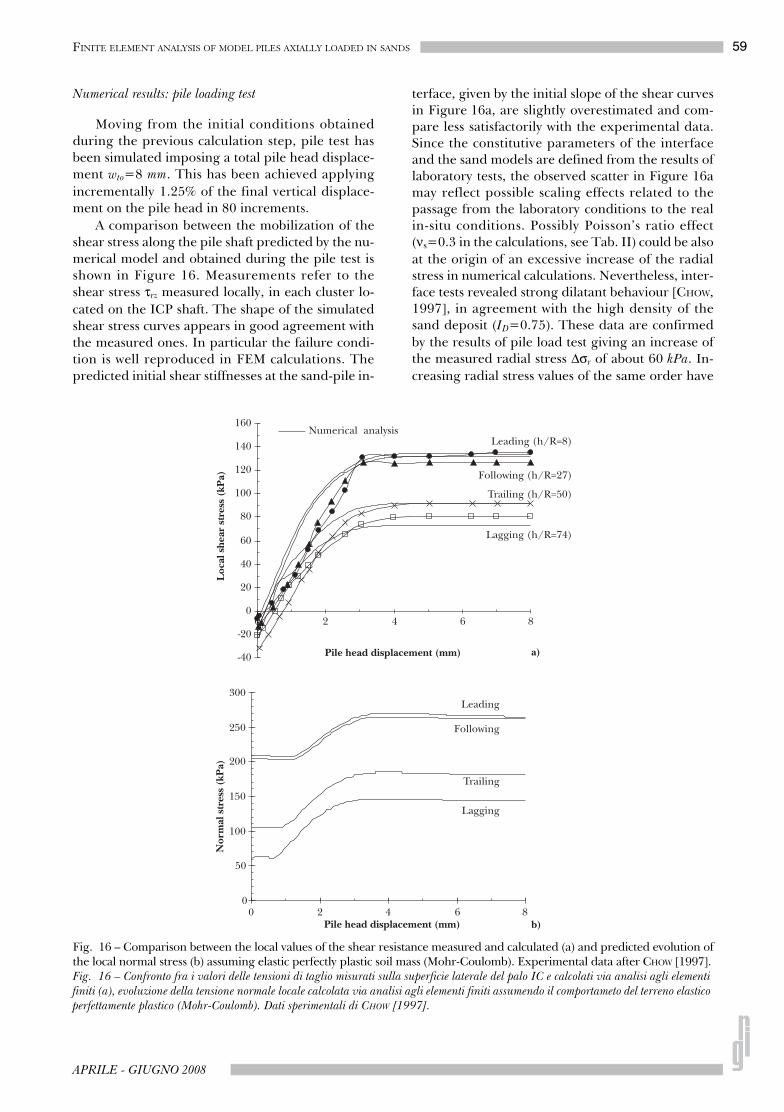
A comparison between the mobilization of theshear stress along the pile shaft predicted by the nu-merical model and obtained during the pile test isshown in Figure 16. Measurements refer to theshear stress τrz measured locally, in each cluster lo-cated on the ICP shaft. The shape of the simulatedshear stress curves appears in good agreement withthe measured ones. In particular the failure condi-tion is well reproduced in FEM calculations. Thepredicted initial shear stiffnesses at the sand-pile in-
terface, given by the initial slope of the shear curvesin Figure 16a, are slightly overestimated and com-pare less satisfactorily with the experimental data.Since the constitutive parameters of the interfaceand the sand models are defined from the results oflaboratory tests, the observed scatter in Figure 16amay reflect possible scaling effects related to thepassage from the laboratory conditions to the realin-situ conditions. Possibly Poisson’s ratio effect(νs=0.3 in the calculations, see Tab. II) could be alsoat the origin of an excessive increase of the radialstress in numerical calculations. Nevertheless, inter-face tests revealed strong dilatant behaviour [CHOW,1997], in agreement with the high density of thesand deposit (ID=0.75). These data are confirmedby the results of pile load test giving an increase ofthe measured radial stress Δσr of about 60 kPa. In-creasing radial stress values of the same order have
Fig. 16 – Comparison between the local values of the shear resistance measured and calculated (a) and predicted evolution ofthe local normal stress (b) assuming elastic perfectly plastic soil mass (Mohr-Coulomb). Experimental data after CHOW [1997].Fig. 16 – Confronto fra i valori delle tensioni di taglio misurati sulla superficie laterale del palo IC e calcolati via analisi agli elementi finiti (a), evoluzione della tensione normale locale calcolata via analisi agli elementi finiti assumendo il comportameto del terreno elastico perfettamente plastico (Mohr-Coulomb). Dati sperimentali di CHOW [1997].
60 DE GENNARO - FRANK - SAID
RIVISTA ITALIANA DI GEOTECNICA
been found during calculations, as shown inFigure 16b, and dilatancy of the interface, associ-ated to the increase of the radial (normal) stress, iswell captured by the numerical simulations. Δσr inthe Leading and Following clusters is of about 60kPa and is close to 80 kPa in the Trailing and Lag-ging clusters (Fig. 16b).
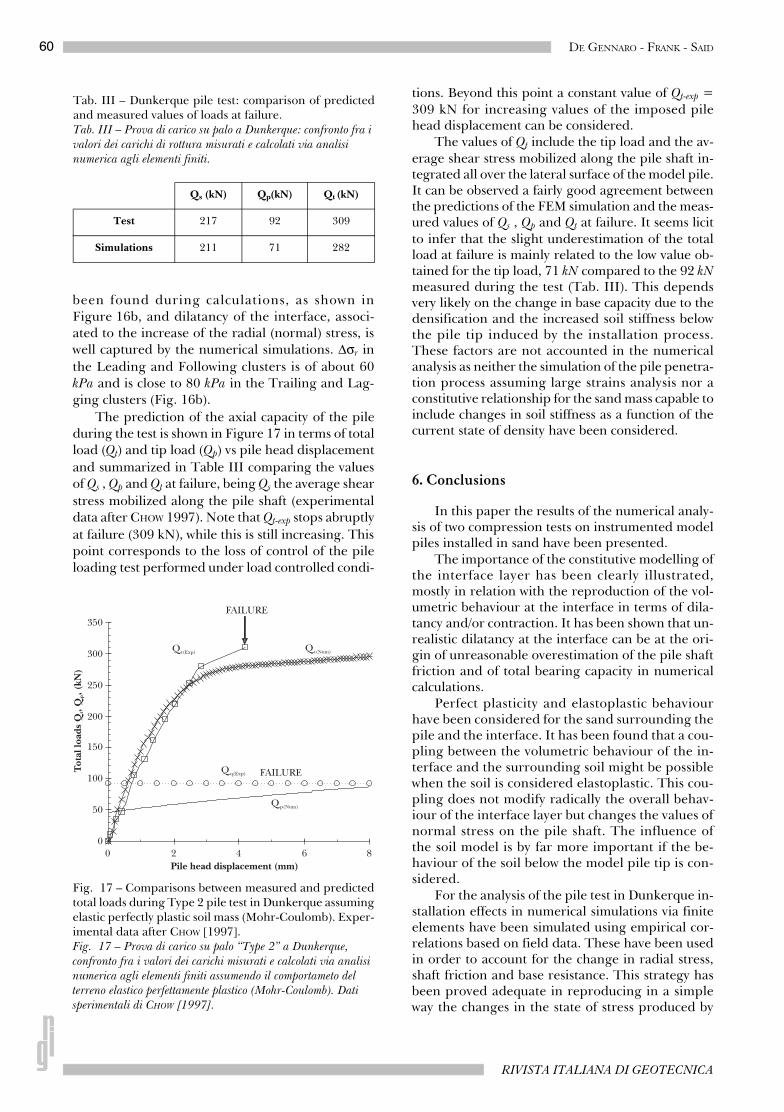
The prediction of the axial capacity of the pileduring the test is shown in Figure 17 in terms of totalload (Qt) and tip load (Qp) vs pile head displacementand summarized in Table III comparing the valuesof Qs , Qp and Qt at failure, being Qs the average shearstress mobilized along the pile shaft (experimentaldata after CHOW 1997). Note that Qt-exp stops abruptlyat failure (309 kN), while this is still increasing. Thispoint corresponds to the loss of control of the pileloading test performed under load controlled condi-
tions. Beyond this point a constant value of Qt-exp =309 kN for increasing values of the imposed pilehead displacement can be considered.
The values of Qt include the tip load and the av-erage shear stress mobilized along the pile shaft in-tegrated all over the lateral surface of the model pile.It can be observed a fairly good agreement betweenthe predictions of the FEM simulation and the meas-ured values of Qs , Qp and Qt at failure. It seems licitto infer that the slight underestimation of the totalload at failure is mainly related to the low value ob-tained for the tip load, 71 kN compared to the 92 kNmeasured during the test (Tab. III). This dependsvery likely on the change in base capacity due to thedensification and the increased soil stiffness belowthe pile tip induced by the installation process.These factors are not accounted in the numericalanalysis as neither the simulation of the pile penetra-tion process assuming large strains analysis nor aconstitutive relationship for the sand mass capable toinclude changes in soil stiffness as a function of thecurrent state of density have been considered.
6. Conclusions
In this paper the results of the numerical analy-sis of two compression tests on instrumented modelpiles installed in sand have been presented.
The importance of the constitutive modelling ofthe interface layer has been clearly illustrated,mostly in relation with the reproduction of the vol-umetric behaviour at the interface in terms of dila-tancy and/or contraction. It has been shown that un-realistic dilatancy at the interface can be at the ori-gin of unreasonable overestimation of the pile shaftfriction and of total bearing capacity in numericalcalculations.
Perfect plasticity and elastoplastic behaviourhave been considered for the sand surrounding thepile and the interface. It has been found that a cou-pling between the volumetric behaviour of the in-terface and the surrounding soil might be possiblewhen the soil is considered elastoplastic. This cou-pling does not modify radically the overall behav-iour of the interface layer but changes the values ofnormal stress on the pile shaft. The influence ofthe soil model is by far more important if the be-haviour of the soil below the model pile tip is con-sidered.
For the analysis of the pile test in Dunkerque in-stallation effects in numerical simulations via finiteelements have been simulated using empirical cor-relations based on field data. These have been usedin order to account for the change in radial stress,shaft friction and base resistance. This strategy hasbeen proved adequate in reproducing in a simpleway the changes in the state of stress produced by
Fig. 17 – Comparisons between measured and predictedtotal loads during Type 2 pile test in Dunkerque assumingelastic perfectly plastic soil mass (Mohr-Coulomb). Exper-imental data after CHOW [1997].Fig. 17 – Prova di carico su palo “Type 2” a Dunkerque, confronto fra i valori dei carichi misurati e calcolati via analisi numerica agli elementi finiti assumendo il comportameto del terreno elastico perfettamente plastico (Mohr-Coulomb). Dati sperimentali di CHOW [1997].
Tab. III – Dunkerque pile test: comparison of predictedand measured values of loads at failure.Tab. III – Prova di carico su palo a Dunkerque: confronto fra i valori dei carichi di rottura misurati e calcolati via analisi numerica agli elementi finiti.
Qs (kN) Qp(kN) Qt (kN)
Test 217 92 309
Simulations 211 71 282
61FINITE ELEMENT ANALYSIS OF MODEL PILES AXIALLY LOADED IN SANDS
APRILE - GIUGNO 2008
the installation procedure. Despite the good agree-ment between experimental data and numericalpredictions some aspect (e.g. densification of thesand below the pile tip ad increased soil stiffness)still require a refined analysis able to reproduce thereal installation process.
References
ALAWNEH A.S., MALKAWI A.I.H. (2000) – Estimation ofpost-driving residual stresses along driven piles insand. Geotechnical Testing Journal, vol. XXIII, n.3, pp. 313-326.
BRANSBY M.F., SPRINGMAN S.M. (1996) – 3D finite ele-ment modelling of piles groups adjacent to surchargeloads. Computers and Geotechnics, 19, pp. 301-324.
BOND A.J. (1989) – Behaviour of diplacment piles inoverconsolidated clays. PhD Thesis, Imperial Col-lege, London.
BOULON M., NOVA R. (1990) – Modelling of soil-struc-ture interface behaviour, a comparison between elasto-plastic and rate type laws. Computers and Geotech-nics, 9, pp. 21-46.
BUSTAMANTE M. (1982) – The pile loading test. Founda-tion Engineering, vol. I, G. Pilot (Ed.), Presse del’école Nationale des Ponts et Chaussées, pp.263-273.
CHOW F.C. (1997) – Investigations in the behaviour ofdisplacement piles for offshore foundations. PhD The-sis, Imperial College, London.
COMODROMOS E.M., ANAGNOSTOPOULOS C.T., GEOR-GIADIS M.K. (2003) – Numerical assessment of axialgroup response based on load test. Computers andGeotechnics, 30, pp. 505-515.
CUBRINOVSKI M., ISHIHARA K. (1998) – Modelling ofsand behaviour based on state concept. Soils andFoundations, 38, 3, pp. 115-127.
DAY R.A., POTTS D.M. (1994) – Zero thickness interfaceelements. Numerical stability and application. Int.Journ. Num. Anal. Meth. Geomech., 18, pp. 689-708.
DE GENNARO V. (1999) – Etude du comportement méca-nique des interfaces sol-structure. Application à l’analysedu comportement des pieux. PhD Thesis, Ecole Na-tionale des Ponts et Chaussées, Paris, France, pp.427.
DE GENNARO V., PANDE G.N., LERAT P. (2002) – Stabilityproblems in soil-structure interfaces: experimental obser-vations and numerical study. International Journal ofGeomechanics, vol. II, n. 2, pp. 175-203.
DE GENNARO V,. FRANK F. (2002) – Elasto-plastic anal-ysis of the interface behaviour between granular mediaand structure. Computers and Geotechnics, 29,pp. 547-572.
DE GENNARO V., FRANK F. (2003) – Elastoplastic model-ling of the behaviour of the granular soil-structure in-
terface. In Novel approaches in civil engineering,Frémond and Maceri (Eds.), Springer Verlag, pp.133-158.
DE GENNARO V., SAID I., FRANK R. & MESTAT P.H.(2004) – Numerical simulations of installation effectson embedded model piles in calibration chamber. Proc.9th Int. Symp. on Num. Models in Geom. (NU-MOG IX), Ottawa (Canada), pp. 197-203.
DE GENNARO V., FRANK R. (2005) – Modélisation del’interaction sol-pieu par la méthode des éléments finis.Bull. de Liaison des Laboratoire des Ponts etChaussées, pp. 256-257, pp. 107-133.
DESAI C.S., ZAMAN M.M., LIGHTNER J.G., SIRIRWAR-DANE H.J. (1984) – Thin-layer element for interfacesand joints. Int. J. Numer. Anal. Methods Geo-mech. 8, pp. 19-43.
DIETZ M.S., LINGS M.L. (2006) – Post peak Strength ofInterfaces in a Stress-Dilatancy Framework. Journalof Geotechnical and Geoenvironmental Engi-neering, ASCE, vol. cXXXII, n. 11.
DUPLA J.C., CANOU J. (1994) – Caractérisation méca-nique du sable de Fontainbleau à partir d’essais triaxi-aux de compression et d’extension. Rapport de Syn-these Projet National Clouterre II, CERMES/ENPC, Paris, France.
FRANK R., GUENOT A., HUMBERT P. (1982) – Numericalanalysis of contacts in geomechnics. Proc. 4th Int.Conf. on Num. Meth. in Geomechanics, Edmon-ton, May 31-June 4, pp. 37-45.
FRANK R., BAUDUIN C., DRISCOLL R., KAVVADAS M.,KREBS OVESEN N., ORR T., SCHUPPENER B. (2004) –Designer’s guide to EN 1997-1 Eurocode 7: Geotech-nical design - General rules. Thomas Telford, Lon-don, 216 pp.
GHIONNA V.N., MORTARA G. (2002) – An elastoplasticmodel for sand-structure interface behaviour. Géo-technique, 52, n. 1, pp. 41-50.
GOODMAN R.E., TAYLOR R.L., BREKKE T.L. (1968) – Amodel for the mechanics of jointed rocks. J. of SoilsMech. and Found. Div., ASCE, 94, (SM3), pp.637-659.
HOHBERG J-M., SCHWEIGER H. (1992) – On the penaltybehaviour of thin-layer elements. Proc. 4th Int.Symp. on Num. Models in Geom. (NUMOG IV),Swansea, UK, pp. 241-248.
HUMBERT P. (1989) – CESAR-LCPC, un code généralde calcul par éléments finis. Bull. Liaison Labo.Ponts et Chaussées, 160, févr-mars, pp. 112-116.
JARDINE R.J., OVERY R.F., CHOW F.C. (1998) – Axialcapacity of offshore piles in dense marine sand. Journalof Geotech. and Geoenvir. Engrg., ASCE, 124 (2),pp. 171-178.
JARDINE R., CHOW F.C., OVERY R., STANDING J. (2005)– ICP design methods for driven piles in sands andclays. Thomas Telford, pp. 112.
KATONA M.G., (1983) – A simple contact-friction inter-face element with application to buried culverts. Int.Journ. Num. Anal. Geomech., 7, pp. 371-384.
62 DE GENNARO - FRANK - SAID
RIVISTA ITALIANA DI GEOTECNICA
KUWANO R. (1996) – Laboratory tests on Dunkirk sand.Imperial College Internal Report.
LI X.S., DAFALIAS Y.F. (2000) – Dilatancy for cohesion-less soils. Gétechnique, 50, n. 4, pp. 449-460.
LINGS M.L., DIETZ M.S. (2004) – An improved directshear apparatus for sand. Géotechnique, 54, n. 4,pp. 245–256.
MABSOUT M.E., REESE L.C. TASSOULAS L. (1995) –Study of pile driving by finite element method. Journalof Geotechnical Engineering, ASCE, 121, 7, pp.535-543.
MAQTADIR A., DESAI C.S. (1986) – Three-dimensionalanalysis of a pile-group foundation. Int. J. Numer.Anal. Methods Geomech. 10, pp. 41-58.
MAYNE P.M., KULHAWY F.H. (1982) – Ko-OCR relation-ships in soils. Journal of Geotechnical Engineering.ASCE, 108 (GT6), pp. 851-872.
MOHAMEDZEIN Y.E.A., MOHAMED M.G., EL SHARIEF
A.M. (1999) – Finite element analysis of short piles inexpansive soils. Computers and Geotechnics, 24,pp. 231-243.
MUIR WOOD D., BELKHEIR K., LIU D.F. (1994) – Strainsoftening and state parameter for sand modelling.Géotechnique, 44, n. 2, pp. 335-339.
NOVA R. (1977) – On the hardening of soils. Arch.Mech. Stosow, 29, (3), pp. 435–458.
NOVA R. (1982) – A model of soil behaviour in plastic andhysteric ranges. Part I: Monotonic loading. Results ofthe International Workshop on Constitutive Re-lations for Soils, Grenoble, 6-8 September, pp.289-309.
PANDE G.N., SHARMA K.G. (1979) – On joint/interfaceelements and associated problems of numerical ill-con-ditioning. Int. J. Numer. Anal. Methods Geo-mech., 3, pp. 293-300.
POTTS D.M., ZDRAVKOVIC L. (2001) – Finite elementanalysis in geotechnical engineering. Thomas Tel-ford, London.
SAID I. (2006) – Comportement des interfaces et modélisa-tion des pieux sous charge axiale. PhD Thesis, EcoleNationale des Ponts et Chaussées, Paris, France.
SCHANZ T., VERMEER P.A. (1996) – Angles of friction anddilatancy of sand. Géotechnique, 46, n. 1, pp. 145-151.
SHENG D., WRIGGERS P., SLOAN S.W. (2007) – Applica-tion of frictional contactin geotechnical engineering.International Journal of Geomechanics, vol. VII,n. 3, pp. 176-185.
SCHOFIELD A.N., WROTH P. (1968) – Critical state soilmechanics. McGraw-Hill, European Civil Engi-neering series, London.
VAID Y.P., SASITHARAN S. (1992) – The strength and di-latancy of sand. Can. Geotech. J., 29, pp. 522-526.
WAKAI A., GOSE S., UGAI K. (1999) – 3-D elasto-plasticfinite element analyses of pile foundations subjected tolateral loading. Soils and Foundations 39, (1), pp.97-111.
WEHNERT M., VERMEER P.A. (2004) – Numerical analy-ses of load tests on bored piles. Proc. Num. Models inGeomechanics, (NUMOG IX), pp. 505-511.
Analisi agli elementi finiti di pali modello sottoposti a carico assiale in sabbie
SommarioNel corso dell’interazione fra due materiali con caratteristiche
di deformabilità molto diverse la rottura è spesso associata alla formazione all’interno del mezzo più deformable di una zona di spessore ridotto, orientata parallelamente alla superficie di contatto. In questa zona, generalmente identificata con il termine di interfaccia, le deformazioni si localizzano creando una discontinuità cinematica caratterizzata da forti gradienti di tensioni. La maggior parte delle strutture in ingegneria civile è in contatto con i terreni. In tali circostanze, e per delle condizioni di sforzo critiche, la rottura è spesso osservata all’interfaccia, nel mezzo più deformabile: il terreno. La descrizione del comportamento meccanico del sistema terreno-struttura, pricipalmente in termini di attrito mobilizzato fra l’elemento strutturale e il terreno, deve conseguentemente richiedere una modellazione precisa del comportamento dell’interfaccia.
In questo lavoro l’attenzione sarà concentrata sul comportamento dei pali di fondazione in sabbie sottoposti a carico assiale, un esempio tipico d’interazione terreno-struttura fortemente influenzato dal comportamento d’interfaccia. Il problema sarà analizzato utilizzando il metodo degli elementi finiti (FEM). Si fornirà una descrizione preliminare della modellazione numerica FEM del problema del contatto. Ci si interesserà successivamente, in dettaglio, al comportamento d’interfaccia e alla sua descrizione matematica nel quadro della teoria dell’elastoplasticità. Si forniranno anche dei richiami sulla modellazione matematica del comportamento delle sabbie. Al fine di risolvere gli ostacoli numerici associati alla simulazione degli effetti dell’installazione del palo sarà proposta una strategia numerica alternativa per attenuare la relativa complessità dei metodi numerici utilizati per simulare i problemi di penetrazione. Saranno infine proposte, come validazione, delle analisi comparative dei risultati di prove di carico su pali modello e delle relative analisi FEM.


![[Report] Resistance Factor Calculations for LRFD of Axially Loaded Driven Piles in Sands](https://img.dokumen.tips/doc/110x75/577d1e381a28ab4e1e8e01c5/report-resistance-factor-calculations-for-lrfd-of-axially-loaded-driven-piles.jpg)
