Embed Size (px)
Citation preview
Finite element analysis of diagonal tension failure in RC beams T. HasegawaInstitute of Technology, Shimizu Corporation, Tokyo, Japan
ABSTRACT: Finite element analysis of diagonal tension failure in a reinforced concrete beam is performed by using different meshes and different concrete crack models. It is found that inserting specific finite element bands in the mesh to model diagonal cracking improves crack localization and propagation. Multi-directional fixed crack and rotating crack models exhibit convergence problems, and lead to flexural or shear compression failure rather than diagonal tension failure. It is shown that the Multi Equivalent Series Phase Model clearly describes the complex mixed mode fracture that is typical of diagonal tension failure.
1 INTRODUCTION
Numerical analysis is important and effective for studying complicated mechanisms of diagonal tension failure of reinforced concrete beams without shear reinforcement, since numerical analysis can take factors influencing the failure and the causes of failure into account individually and systematically, whereas experiments cannot easily do so. In the previous study (Hasegawa 2004b) finite element analysis of diagonal tension failure in a reinforced concrete beam was performed using the Multi Equivalent Series Phase Model (MESP model; Hasegawa 1998), and the failure mechanisms were discussed by analyzing the numerical results. The first series of analysis showed that in order for diagonal tension failure of the beam to be complete, the longitudinal splitting crack should propagate unstably, leading to widening and propagation of the diagonal crack. In addition the second series of analysis with the branch-switching method was performed to simulate diagonal tension failure, assuming that the failure results from a bifurcation starting at a singular point (bifurcation or limit point) on the equilibrium path. Both series of analysis were able to simulate localization and initial propagation of diagonal cracks, but not unstable propagation of the cracks, and the formation of final shear collapse mechanism of beam could not be simulated.
In the present study (Hasegawa 2004a, 2005, 2006), based on the results of the previous analysis, another series of finite element failure analysis of a reinforced concrete beam is performed using different finite element meshes and alternative concrete crack models as factors to influence the diagonal tension failure.
2 ANALYSIS MODEL
2.1 Analysis cases D
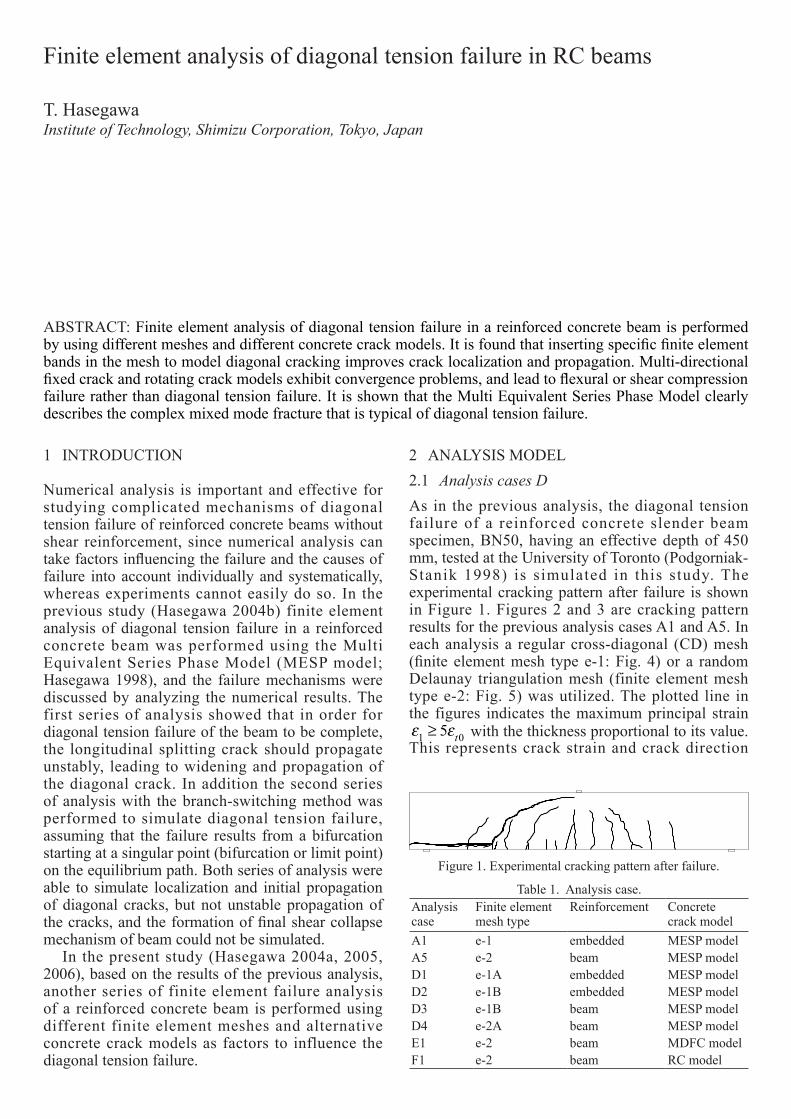
As in the previous analysis, the diagonal tension failure of a reinforced concrete slender beam specimen, BN50, having an effective depth of 450 mm, tested at the University of Toronto (Podgorniak-Stanik 1998) is simulated in this study. The experimental cracking pattern after failure is shown in Figure 1. Figures 2 and 3 are cracking pattern results for the previous analysis cases A1 and A5. In each analysis a regular cross-diagonal (CD) mesh (finite element mesh type e-1: Fig. 4) or a random Delaunay triangulation mesh (finite element mesh type e-2: Fig. 5) was utilized. The plotted line in the figures indicates the maximum principal strain ε ε1 05≥ t with the thickness proportional to its value. This represents crack strain and crack direction
Analysis case
Finite element mesh type
Reinforcement Concrete crack model
A1 e-1 embedded MESP modelA5 e-2 beam MESP modelD1 e-1A embedded MESP modelD2 e-1B embedded MESP modelD3 e-1B beam MESP modelD4 e-2A beam MESP modelE1 e-2 beam MDFC modelF1 e-2 beam RC model
Table 1. Analysis case.
Figure 1. Experimental cracking pattern after failure.
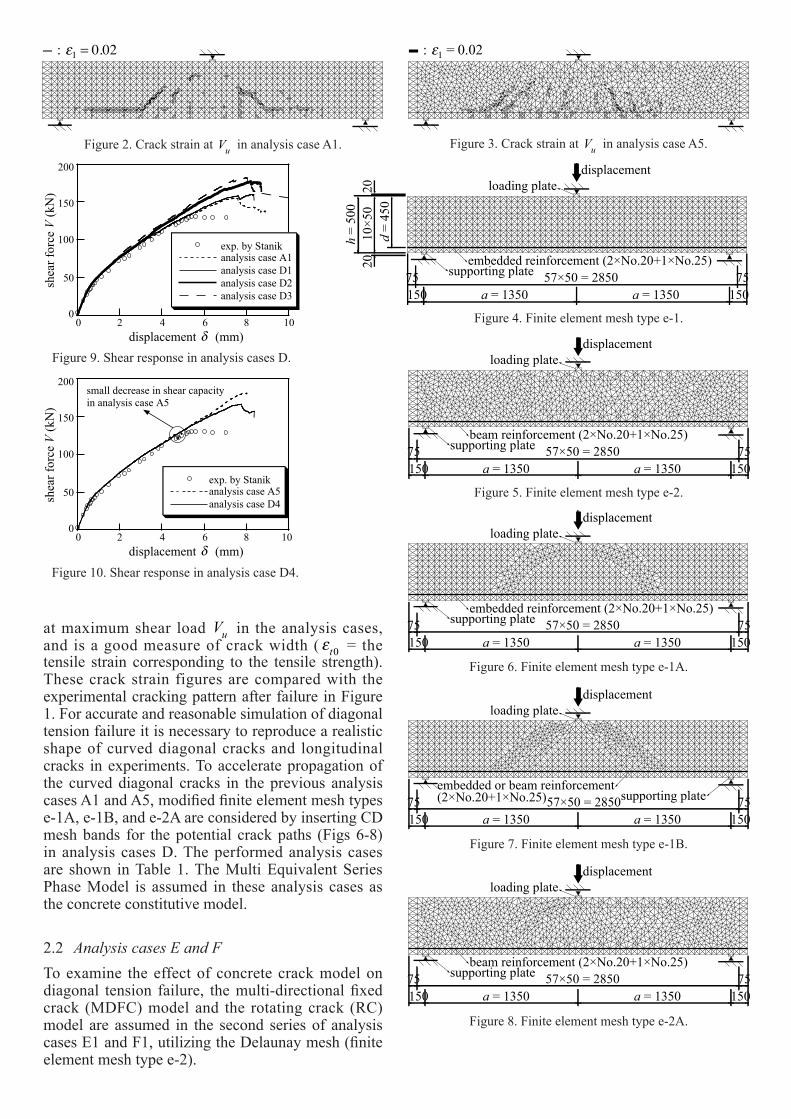
Figure 2. Crack strain at Vu in analysis case A1. Figure 3. Crack strain at Vu in analysis case A5.
Figure 6. Finite element mesh type e-1A.
Figure 7. Finite element mesh type e-1B.
Figure 8. Finite element mesh type e-2A.
10
displacement
20 80
50
100
150
200
exp. by Stanik
4
analysis case A1
6
shea
r fo
rce V
(kN
)
analysis case D1
analysis case D2
analysis case D3
(mm)δ
Figure 9. Shear response in analysis cases D.
1020 80
50
100
150
200
exp. by Stanik
4
analysis case A5
6
analysis case D4
small decrease in shear capacity
in analysis case A5
shea
r fo
rce V
(kN
)
displacement (mm)δ
Figure 10. Shear response in analysis case D4.
Figure 4. Finite element mesh type e-1.
Figure 5. Finite element mesh type e-2.
at maximum shear load Vu in the analysis cases, and is a good measure of crack width ( εt0 = the tensile strain corresponding to the tensile strength). These crack strain figures are compared with the experimental cracking pattern after failure in Figure 1. For accurate and reasonable simulation of diagonal tension failure it is necessary to reproduce a realistic shape of curved diagonal cracks and longitudinal cracks in experiments. To accelerate propagation of the curved diagonal cracks in the previous analysis cases A1 and A5, modified finite element mesh types e-1A, e-1B, and e-2A are considered by inserting CD mesh bands for the potential crack paths (Figs 6-8) in analysis cases D. The performed analysis cases are shown in Table 1. The Multi Equivalent Series Phase Model is assumed in these analysis cases as the concrete constitutive model.
2.2 Analysis cases E and F
To examine the effect of concrete crack model on diagonal tension failure, the multi-directional fixed crack (MDFC) model and the rotating crack (RC) model are assumed in the second series of analysis cases E1 and F1, utilizing the Delaunay mesh (finite element mesh type e-2).
: .1 0 02 : .1 0 02=
2010
×50
20h
= 50
0
d =
450
supporting plateembedded reinforcement (2×No.20+1×No.25)
a = 1350 a = 1350150 15057×50 = 285075 75
loading platedisplacement
loading platedisplacement
supporting platebeam reinforcement (2×No.20+1×No.25)
a = 1350 a = 1350150 15057×50 = 285075 75
loading plate
supporting plateembedded reinforcement (2×No.20+1×No.25)
a = 1350 a = 1350150 15057×50 = 285075 75
displacement
loading platedisplacement
supporting plateembedded or beam reinforcement (2×No.20+1×No.25)
a = 1350 a = 1350150 15057×50 = 285075 75
loading platedisplacement
supporting platebeam reinforcement (2×No.20+1×No.25)
a = 1350 a = 1350150 15057×50 = 285075 75

2.27×10⁻² mm
Figure 14. Incremental deformation at Vu in analysis case D2.
: .1 0 02=
Figure 15. Crack strain at step 400 in analysis case D4.
: .1 0 02=
Figure 16. Crack strain at Vu in analysis case D4.
2.23×10⁻² mm
Figure 17. Incremental deformation at Vu in analysis case D4.
: .1 0 02=
Figure 11. Crack strain at Vu in analysis case D1.
5.20×10⁻³ mm
Figure 12. Incremental deformation at Vu in analysis case D1.
: .1 0 02=
Figure 13. Crack strain at Vu in analysis case D2.
2.3 Crack models for concrete
The Multi Equivalent Series Phase Model is a versatile nonlocal constitutive model, and is capable of describing cracking behavior under tension as well as shear and compression with good accuracy. The model is used in analysis cases A and D.
The multi-directional fixed crack model and the rotating crack model, adopted in this study, are standard ones available in the general purpose finite element system DIANA (Witte & Feenstra 1998). In analysis case E1 with the multi-directional fixed crack model, a strain hardening-softening type of elastoplastic model with the Drucker-Prager criterion under compression is combined. The hardening- is combined. The hardening-is combined. The hardening-softening parameter is determined to fit the uniaxial compression behavior to the relationship given in the CEB-FIP Model Code 1990 (Euro-International Committee for Concrete 1993). The crack band model is used for tension, and a linear elastic-bilinear softening stress-strain relationship as well as an appropriate fracture energy value are assumed together with a threshold angle of 60 degrees. Crack shear behavior is modeled with a shear retention factor of 0.01 (nearly equal to zero).
In analysis case F1 with the rotating crack model, uniaxial tension and compression stress-strain relationships are assumed to be identical to the ones for the multi-directional fixed crack model. A shear model after cracking is unnecessary since coaxiality between principal stress and strain determines
incremental shear stiffness in the constitutive relation.
3 MESH DEPENDENCY
Figure 9 compares the calculated shear response in analysis cases A1, D1, D2, and D3, using CD meshes, with the experiment. Figures 11 and 13 are crack strain at maximum shear load Vu in analysis cases D1 and D2. Figures 12 and 14 show incremental deformation at Vu in analysis cases D1 and D2. Those crack strain figures are to be compared with the experimental cracking pattern after failure, shown in Figure 1. In analysis case D1 a main diagonal crack does not propagate in the inserted CD mesh band, but results in a very similar final cracking pattern to analysis case A1 and diagonal tension failure due to aligned elements with an inclination of about 45 degrees. Because of the similar diagonal crack shape the maximum shear loads are almost equal in analysis cases A1 and D1, which are overestimates of the experimental result. On the other hand in analysis case D2, diagonal cracks do not propagate to upper side of beam both inside and outside the CD mesh band, and a flexural failure with tensile reinforcement yielding occurs. To increase dowel action of tensile reinforcement, beam elements are used in analysis case D3 instead of embedded reinforcement, however, an improvement is not achieved.
In Figure 10 the shear response obtained in analysis cases A5 and D4, using the Delaunay meshes, is shown. Figures 15 and 16 are crack strain at step 400, which corresponds to the experimental maximum shear load, and at Vu in analysis case D4. In Figure 17 incremental deformation at Vu

Figure 18. Selected elements in analysis case A1.
Figure 19. Stress-strain responses of element a in analysis case A1.
3-1-2 2
0
2
0
1
-1
-2
-3
-41
stre
ss (N
/mm
2)
strain (10-2)
4-2-4
0
2
0-6
-2
-4
2
strain (10-2)
stre
ss (N
/mm
2)
8-2-4 4
0
2
0
1
-1
-2
-3
-52-6 6
-4
strain (10-3)
stre
ss (N
/mm
2)
Figure 20. Stress-strain responses of element b in analysis case A1.
Figure 21. Stress-strain responses of element c in analysis case A1.
Figure 22. Stress-strain responses of element d in analysis case A1.
σ1− ε
1
σ2− ε
2
σxx− ε
xx
σyy− ε
yy
τxy− γ
xyσ
1− ε
1
σ2− ε
2
σxx− ε
xx
σyy− ε
yy
τxy− γ
xy
at Vu
at Vu
at Vu
at Vu
at Vu
4-2-4 2
0
2
0
strain (10-3)
1
stre
ss (N
/mm
2)
-1
-2
-3
-4
15-5 5
0
5
0
-5
-10
-15-10 10
strain (10-3)
stre
ss (N
/mm
2)
2-1 1
0
10
0
-20
-10
-40-2
-30
strain (10-2)
stre
ss (N
/mm
2)
Figure 23. Stress-strain responses of element e in analysis case A1.
Figure 24. Stress-strain responses of element f in analysis case A1.
is shown. In the previous analysis case A5 using ordinal displacement control as well as branch-switching analysis, initial propagation of the main diagonal cracks was well simulated, but subsequent further unstable propagation of those cracks could not be obtained due to mesh dependency such as stress-locking and crack diffusion. In analysis case D4, the curved CD mesh band is inserted in the Delaunay mesh for the purpose of accelerating such unstable propagation of the diagonal crack. As shown in Figures 15-17, analysis case D4 succeeds in simulating the diagonal crack localizing into the inserted CD mesh band, and the further propagation to upper side of the beam. However, the further propagation of the diagonal crack is not unstable, but still stable. Therefore, the shear collapse mechanism can not be simulated, and finally flexural failure occurs.
4 MIXED MODE FRACTURE
It is believed that Mode I tensile cracking is dominant within the fracture process zone in diagonal tension failure, and the effect of mixed mode fracture of tension and shear is regarded as less important. In this section stress-strain responses
in the finite elements corresponding to the diagonal crack path are examined to study the effect of mixed mode fracture in diagonal tension failure.
Finite elements a-f (Figs 18, 25) are selected in analysis cases A1 and D4 to examine the stress-strain responses, which are shown in Figures 19-24, 26-31. Figures 32-35 are the angles θσ , θε of the principal stress and strain axes for elements c and d in each analysis case. Mode I fracture, observed as tensile softening responses σ ε1 1− , σ εxx xx− , and σ εyy yy− , is accompanied by mode II fracture, observed as a shear softening response τ γxy xy− , and which forms complicated mixed mode fracture. In elements c and d for both analysis cases A1 and D4 tensile cracking, as observed in softening responses of relation σ ε1 1− , is followed by shear softening response recognized in the relation τ γxy xy− at the earlier stage of loading. And then the shear softening turns into shear hardening because of shear friction on the crack due to shear strain increase as well as suppressed crack dilatancy.
In Figures 34 and 35 it is shown that relatively large rotation of the principal axes occurs just after the tensile softening starts, i.e. at the initial stage of the fracture process zone in elements c and d, and
: .1 0 02=c d
a b
e f
Figure 25. Selected elements in analysis case D4.
Figure 26. Stress-strain responses of element a in analysis case D4.
σ1 − ε1σ2 − ε2σ xx − ε xxσ yy − ε yyτ xy − γ xy
at Vu
σ1 − ε1σ2 − ε2σ xx − ε xxσ yy − ε yyτ xy − γ xy
at Vu
at Vu
at Vu
at Vu
6-2-6 2
0
2
0
1
-1
-2
-3
-5
-4
-4 4
strain (10-3)
stre
ss (N
/mm
2)
Figure 27. Stress-strain responses of element b in analysis case D4.
Figure 28. Stress-strain responses of element c in analysis case D4.
Figure 29. Stress-strain responses of element d in analysis case D4.
Figure 30. Stress-strain responses of element e in analysis case D4.
Figure 31. Stress-strain responses of element f in analysis case D4.
2-1-2 1
0
2
0
1
-2
-1stre
ss (N
/mm
2)
strain (10-2)
2-1-2 1
0
2
0
1
-1
-2
strain (10-2)
stre
ss (N
/mm
2)
15-5-10 5
0
2
0
1
-1
-2
-310
strain (10-3)
stre
ss (N
/mm
2)
20-5-10 10
0
4
0
2
-2
-6
-4
-10
-8
5 15
strain (10-4)
stre
ss (N
/mm
2)
2-2-3 1
0
10
0
-10
-20
-30-1
strain (10-3)
stre
ss (N
/mm
2)
that coaxiality between principal stress and strain is approximately preserved. As observed above, mixed mode fracture and the effect of rotation of the principal axes start at a very early stage of the fracture process zone, but not at the last stage with wide open cracks. Therefore, crack and constitutive models that neglect or underestimate this effect should be applied with caution. Undoubtedly the observed mixed mode phenomena in analysis have not been verified by experiments. However, the consistent, rational and reasonable results shown for overall structural behavior might give the argument validity. It is worth noticing that the above-mentioned mixed mode fracture in the process zone as well as rotation of the principal axes could not be simulated with accuracy by using aggregate interlock models derived from perfectly open cracks in concrete, rotating crack models with coaxiality between principal stress and strain, or multi-directional fixed crack models either with simple crack shear models or with shear retention neglected.
Although elements b have large shear strains due to large crack mouth sliding displacement (CMSD) at the tension extreme fiber as well as dowel action of the tensile reinforcement bar, shear softening in elements b is monotonic, and does not turn into
shear hardening as in elements c and d because of large tensile strain due to large crack mouth opening displacement (CMOD) at the tension extreme fiber (Figs 20, 27). In analysis case A1 where the maximum shear load and diagonal tension failure are predicted relatively well, mixed mode response similar to elements c and d is observed at element e. At the maximum shear load in analysis case A1 shear softening response at element f (Fig. 24) completes the diagonal tension failure, indicating that the shear crack reaches to underneath the loading plate. On the other hand, in analysis case D4 where the maximum shear load and diagonal tension failure are not predicted well, neither tensile softening fracture nor shear softening fracture reaches to element e at the tip of the diagonal crack as well as element f beneath the loading plate (Figs 30, 31).
5 EFFECT OF CRACK MODELS
Figure 36 shows calculated shear response in analysis cases A5, E1, and F1, using the Multi Equivalent Series Phase Model, the multi-directional fixed crack model, and the rotating crack model. In
: .1 0 02=c
a b
d e f

θε − γ xy
θσ − γ xy
τ xy − γ xy
σ1 − γ xy
τ xy − γ xy
σ1 − γ xy
at Vu
θε − γ xy
θσ − γ xy at Vu
at Vu
at Vu
135
180an
gle
of
pri
nci
pal
axis
(d
egre
e)
90
45
0 -4
-2
0
2
4
stress (N/m
m2)
shear strain (10-2)
Figure 32. Responses of element c in analysis case A1.
135
180
90
45
0 -2
-1
0
1
2
1-2-5 0-1-4 -3angle
of
pri
nci
pal
axis
(d
egre
e)
stress (N/m
m2)
shear strain (10-3)
Figure 33. Responses of element d in analysis case A1.
135
180
90
45
0 -2
-1
0
1
2
5-10 0-5-15-20angle
of
pri
nci
pal
axis
(d
egre
e)
stress (N/m
m2)
shear strain (10-3)
135
180
90
45
0 -2
-1
0
1
2
2-2-10 0-8 -4-6angle
of
pri
nci
pal
axis
(d
egre
e)
stress (N/m
m2)
shear strain (10-3)
Figure 34. Responses of element c in analysis case D4. Figure 35. Responses of element d in analysis case D4.
Figure 36. Shear response in analysis cases E1 and F1.
20 80
50
100
150
4 6
small decrease in shear capacity
in analysis case A5
exp. by Stanikanalysis case A5analysis case E1analysis case F1
shea
r fo
rce V
(k
N)
displacement (mm)δ
θε − γ xy
θσ − γ xy
τ xy − γ xy
σ1 − γ xy
τ xy − γ xy
σ1 − γ xy
at Vu
θε − γ xy
θσ − γ xy at Vu
at Vu
at Vu
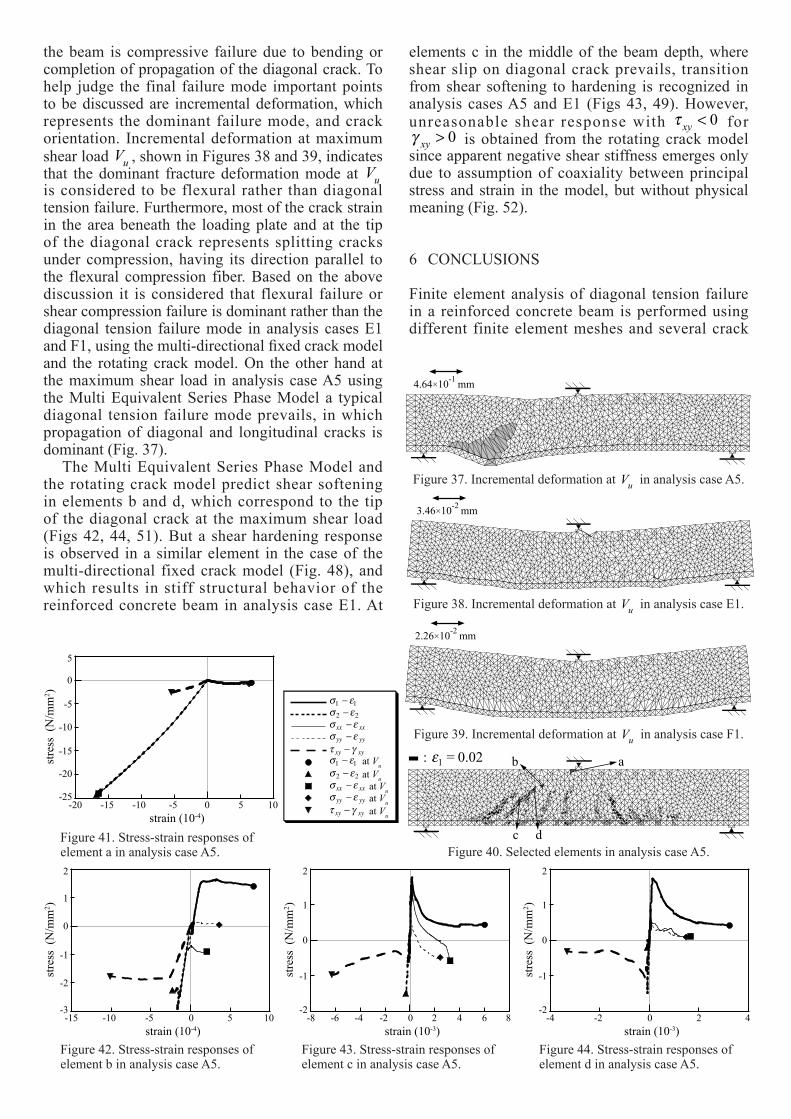
the previous analysis case A5, the diagonal tension failure mode with unstable propagation of diagonal and longitudinal cracks became dominant when the small decrease in shear capacity occurred at step 375. However, after the decrease a bifurcation from diagonal tension failure mode to bending mode took place. Therefore, step 375 is regarded as corresponding to the maximum shear load, and shear hardening behavior after the small decrease in shear capacity is neglected in the following discussion. Figure 37 shows incremental deformation at step 375 in analysis case A5. Figures 38 and 39 are incremental deformation at maximum shear load Vu in analysis cases E1 and F1. As pointed out in the previous study, shear response up to the small decrease of shear capacity captures the experimental results very well in analysis case A5. On the other hand analysis case F1 using the rotating crack model results in underestimation of the experimental maximum shear load and stiffness, while analysis case E1 using the multi-directional fixed crack model can achieve relatively good prediction of the experiment.
In analysis cases E1 and F1, using the multi-directional fixed crack model and the rotating crack model it is relatively hard to obtain convergence in iterative calculation for equilibrium. When convergence criteria (one percent of relative out-of-balance force) can not be satisfied after a final iteration (fifty iterations) at a step the calculation is continued to the next step, bringing out-of-balance forces in the final iteration to the next step although strictly speaking the calculation should be terminated. Surprisingly at the steps corresponding to eleven and nine percent of all the steps up to
maximum shear load, the convergence criteria are not satisfied in analysis cases E1 and F1. Both the multi-directional fixed crack model and the rotating crack model are considered to have serious problems in convergence and lack robustness as numerical crack models. On the other hand, in analysis case A5 using the Multi Equivalent Series Phase Model convergence criteria are satisfied at all the steps, which confirms that the Multi Equivalent Series Phase Model possesses excellent robustness as a numerical crack model.
In Figures 40, 45, 46 crack strain is shown for analysis cases A5, E1, and F1, and finite elements a-d are selected to examine the stress-strain responses in the diagonal cracks. Figures 41-44, 47-49, 50-52 are the stress-strain responses in the analysis cases. Minimum principal stress-strain responses σ ε2 2− and compressive responses σ εxx xx− at elements a indicate that compressive failure occurs in the area beneath the loading plate and at the tip of the diagonal crack (Figs 47, 50). We have here a very difficult problem in judging whether this compressive failure at the upper side of
σ1 − ε1σ2 − ε2σ xx − ε xxσ yy − ε yyτ xy − γ xy
at Vu
σ1 − ε1σ2 − ε2σ xx − ε xxσ yy − ε yyτ xy − γ xy
at Vu
at Vu
at Vu
at Vu
10-10-20
-5
5
-5
0
-10
-15
-20
-25-15 0 5
strain (10-4)
stre
ss (N
/mm
2)
Figure 41. Stress-strain responses of element a in analysis case A5.
10-10-15 5
0
2
-5
1
-1
-2
-30
strain (10-4)
stre
ss (N
/mm
2)
Figure 42. Stress-strain responses of element b in analysis case A5.
8-4-8 4
0
2
-2
1
-20 2
-1
-6 6
strain (10-3)
stre
ss (N
/mm
2)
Figure 43. Stress-strain responses of element c in analysis case A5.
4-2-4 2
0
2
1
-1
-20
strain (10-3)
stre
ss (N
/mm
2)
Figure 44. Stress-strain responses of element d in analysis case A5.
Figure 40. Selected elements in analysis case A5.
4.64×10⁻¹ mm
Figure 37. Incremental deformation at Vu in analysis case A5.
3.46×10⁻² mm
Figure 38. Incremental deformation at Vu in analysis case E1.
2.26×10⁻² mm
Figure 39. Incremental deformation at Vu in analysis case F1.
the beam is compressive failure due to bending or completion of propagation of the diagonal crack. To help judge the final failure mode important points to be discussed are incremental deformation, which represents the dominant failure mode, and crack orientation. Incremental deformation at maximum shear load Vu , shown in Figures 38 and 39, indicates that the dominant fracture deformation mode at Vu is considered to be flexural rather than diagonal tension failure. Furthermore, most of the crack strain in the area beneath the loading plate and at the tip of the diagonal crack represents splitting cracks under compression, having its direction parallel to the flexural compression fiber. Based on the above discussion it is considered that flexural failure or shear compression failure is dominant rather than the diagonal tension failure mode in analysis cases E1 and F1, using the multi-directional fixed crack model and the rotating crack model. On the other hand at the maximum shear load in analysis case A5 using the Multi Equivalent Series Phase Model a typical diagonal tension failure mode prevails, in which propagation of diagonal and longitudinal cracks is dominant (Fig. 37).
The Multi Equivalent Series Phase Model and the rotating crack model predict shear softening in elements b and d, which correspond to the tip of the diagonal crack at the maximum shear load (Figs 42, 44, 51). But a shear hardening response is observed in a similar element in the case of the multi-directional fixed crack model (Fig. 48), and which results in stiff structural behavior of the reinforced concrete beam in analysis case E1. At
elements c in the middle of the beam depth, where shear slip on diagonal crack prevails, transition from shear softening to hardening is recognized in analysis cases A5 and E1 (Figs 43, 49). However, unreasonable shear response with τ xy < 0 for γ xy > 0 is obtained from the rotating crack model since apparent negative shear stiffness emerges only due to assumption of coaxiality between principal stress and strain in the model, but without physical meaning (Fig. 52).
6 CONCLUSIONS
Finite element analysis of diagonal tension failure in a reinforced concrete beam is performed using different finite element meshes and several crack
: .1 0 02= ab
c d

4-4 2
10
0
-10
-30
-20
-40-2 0
strain (10-2)
stre
ss (N
/mm
2)
Figure 50. Stress-strain responses of element a in analysis case F1.
144-2 12
5
6
0
-5
-1020 8 10
strain (10-3)
stre
ss (N
/mm
2)
Figure 51. Stress-strain responses of element b in analysis case F1.
41-1 3
3
2
2
1
0
-10
strain (10-2)
stre
ss (N
/mm
2)
Figure 52. Stress-strain responses of element c in analysis case F1.
150-5
10
5
0
-10
-30
-20
-4010
strain (10-3)
stre
ss (N
/mm
2)
Figure 47. Stress-strain responses of element a in analysis case E1.
3-1 2
-5
5
1
0
-10
-150
strain (10-3)
stre
ss (N
/mm
2)
Figure 48. Stress-strain responses of element b in analysis case E1.
15-5 5
1
3
2
0
-1
-2
-30 10
strain (10-3)
stre
ss (N
/mm
2)
Figure 49. Stress-strain responses of element c in analysis case E1.
Figure 45. Selected elements in analysis case E1. Figure 46. Selected elements in analysis case F1.
models for concrete. To accelerate propagation of curved diagonal cracks cross-diagonal mesh bands are inserted in the original meshes. This can improve localization and propagation of the cracks in some analysis cases, but it does not result in a rational shear collapse mechanism. The multi-directional fixed crack model can predict shear capacity and stiffness of the beam with relatively good accuracy, but the rotating crack model cannot. In analysis using both models, the flexural or shear compression failure mode is dominant rather than diagonal tension failure mode. Both models have serious problems in convergence and lack robustness as numerical crack models. However, the Multi Equivalent Series Phase Model results in good convergence and has excellent robustness. Stress-strain responses in finite elements corresponding to diagonal cracks give clear explanations of complicated mixed mode fracture relating to the mechanism of diagonal tension failure. It is found that mixed mode fracture and the effect of rotation of the principal axes start at a very early stage of the fracture process zone. In the case of the multi-directional fixed crack model and the rotating crack model, some of the stress-strain responses are unreasonable and are responsible for the inability to capture the diagonal tension failure.
REFERENCES
Euro-International Committee for Concrete (CEB). 1993. CEB-FIP Model Code 1990. London: Thomas Telford.
Hasegawa, T. 1998. Multi equivalent series phase model for nonlocal constitutive relations of concrete. In H. Mihashi & K. Rokugo (eds), Fracture Mechanics of Concrete Structures: 1043-1054. Freiburg: AEDIFICATIO Publishers.
Hasegawa, T. 2004a. Mesh dependency in finite element analysis for diagonal tension failure of reinforced concrete beam. Proc. 59th annual conference, JSCE 5: 771-772.
Hasegawa, T. 2004b. Numerical study of mechanism of diagonal tension failure in reinforced concrete beams. In V. C. Li, C. K. Y. Leung, K. J. Willam, & S. L. Billington, (eds), Fracture Mechanics of Concrete Structures: 391-398. Ia-FraMCos, USA.
Hasegawa, T. 2005. Mixed mode fracture in mechanism of diagonal tension failure of reinforced concrete beam. Proc. 60th annual conference. JSCE 5: 1053-1054.
Hasegawa, T. 2006. Concrete constitutive models in analysis for diagonal tension failure of reinforced concrete beam. Proc. 61st annual conference. JSCE 5: 857-858.
Podgorniak-Stanik, B. A. 1998. The influence of concrete strength, distribution of longitudinal reinforcement, amount of transverse reinforcement and member size on shear strength of reinforced concrete members. M.A.S. thesis: University of Toronto.
Witte, F. & Feenstra, P. 1998. DIANA - Finite element analysis. Release 7. Delft: Building and Construction Research. Netherlands Organization for Applied Scientific Research.
: .1 0 02= ab
c
: .1 0 02= ab
c