Embed Size (px)
Citation preview

EXPERIMENTAL STUDY ON PERFORMANCE AND EMISSION
CHARACTERISTICS OF LGO-DIESEL BLEND USING WATER
EMULSION AND EGR
A PROJECT REPORT
Submitted by
BELGIN.M (211411114022)
DEEPAN.R (211411114026)
HARI PRASATH.R (211411114042)
VIVEKANANDAN.B (211411114324)
In partial fulfillment for the award of the degree
Of
BACHELOR OF ENGINEERING
in
MECHANICAL ENGINEERING
PANIMALAR ENGINEERING COLLEGE, CHENNAI-600123
ANNA UNIVERSITY: CHENNAI - 600 025
April 2015
i

BONAFIDE CERTIFICATE
Certified that this project report “EXPERIMENTAL STUDY ON
PERFORMANCE AND EMISSION CHARACTERISTICS OF LGO-DIESEL
BLEND USING WATER EMULSION AND EGR” is the bonafide work of
BELGIN.M (211411114022)
DEEPAN.R (211411114026)
HARI PRASATH.R (211411114042)
VIVEKANANDAN.B (211411114324)
who carried out the project work under my supervision.
SIGNATURE SIGNATURE
DR.L.KARTHIKEYAN M.E.,Ph.D., Mr.R.SATHIYAMOORTHI M.E.,
PROFESSOR ASSISTANT PROFESSOR GRADE-1
HEAD OF THE DEPARTMENT PROJECT SUPERVISIOR
Dept. of mechanical engineering Dept. of mechanical engineering
Panimalar engineering college Panimalar engineering college
Varadharajapuram, Varadharajapuram,
Nasarathpettai Nasarathpettai
Poonamalle, Chennai-600 123 Poonamalle, Chennai-600 123
Submitted for Anna university project viva-voce held on …………..during the
year……………
INTERNAL EXAMINER EXTERNAL EXAMINER
ii

ACKNOWLEDEGMENT
We wish to express our sincere thanks to our Founder and Chairman,
Dr. JEPPIAR, M.A., B.L., Ph. D, for his endeavor in educating me in his premier
institution.
We would like to express deep gratitude to our Secretary and Correspondent,
Dr. P. CHINNADURAI, M.A, M. Phil. B.Ed. Ph. D, for his kind words and
enthusiastic motivation which inspired us a lot in completing this project.
We express my sincere thank our Directors Mrs. C.VIJAYA RAJESHWARI,
and Mr. C.SAKTHIKUMAR M.E., for providing us with the necessary facilities for
completion of this report.
We would like to express our gratitude to our Principal,
Dr. K. MANI, M.E., Ph.D., for his encouragement and sincere guidance.
We wish to convey my thanks and gratitude to
Dr. L.KARTHIKEYAN M.E, M.B.A, Ph.D., Head Of the Department of Mechanical
Engineering and our dedicated guide for providing us with sample time and
encouragement for successful completion of our project.
We are most grateful to our Professor Dr.S.CHEZHIAN BABU M.E., Ph.D.,
for his valuable guidance and quality advice.
We are obliged to thanks our internal guide
Mr.R.SATHIYAMOORTHI M.E.,(Ph.D)., Assistant Professor G1 Department of
Mechanical Engineering for his valuable guidance, support and suggestions.
Finally we dedicate our efforts to our divine parents who have given us the
opportunity to receive education and provided us ample resources and environment to
work effectively.
iii

TABLE OF CONTENTS
ABSTRACT
CHAP. NO TITLE PG.NO
ABSTRACT vi
LIST OF TABLES vii
LIST OF FIGURES viii
LIST OF SYMBOLS x
1. INTRODUCTION
1.1 DIESEL ENGINE 1
1.2 BIO-FUELS 1
1.3 EMISSION CONTROL TECHNIQUES 2
1.3.1 EXHAUST GAS RECIRCULATION 2
1.3.2 WATER EMULSION 3
2. LITERATURE SURVEY
2.1 BIO-FUEL 4
2.2 EXHAUST GAS RECIRCULATION 5
2.3 WATER EMULSION 6
3. TEST FUEL
3.1 NEAT LEMONGRASS OIL 8
3.2 PROPERTIES 9
3.3 OIL PREPARATION 9
3.4 TEST FUEL PREPARATION 10
iv

4. EXPERIMENTAL SETUP AND PROCEDURE
4.1 EXPERIMENTAL SETUP 12
4.2 EXPERIMENTAL PROCEDURE 14
4.2.1 WATER EMULSION 14
4.2.2 EGR 14
5. OBSERVATION AND TABULATION 15
6. CALCULATIONS
6.1 FORMULAS USED 19
6.2 MODEL CALCULATION 20
6.3 RESULT TABULATION 22
7. RESULTS AND DISCUSSION
7.1 PERFORMANCE ANALYSIS FOR WATER EMULSION 24
7.2 EMISSION ANALYSIS FOR WATER EMULSION 27
7.3 PERFORMANCE ANALYSIS FOR EGR 30
7.4 EMISSION ANALYSIS FOR EGR 33
8. COST ESTIMATION 36
9. CONCLUSION 37
10. PHOTOS 38
11. REFERENCES 40
v

ABSTRACT
Many researchers have proposed various solutions towards reducing pollutant
emissions, especially nitrogen oxides (NOx) from direct injection (DI) diesel engines.
The aim of the present work is to investigate the influence of two emission control
techniques namely Water Emulsion and Exhaust gas recirculation (EGR) rates on
Lemon Grass Oil (LGO)-diesel blend. A direct injection (DI) diesel engine was tested
by diesel, blends of 75% diesel and 25 % LGO(i.e., LGO25) and other blends like
LGO25+Water2.5%, LGO25+Water5%. The engine characteristics with LGO
biodiesel were compared against those obtained using diesel fuel. From the results, it
is observed that the biodiesel performance and emission are lower than that of diesel
fuel. However, the NOx emission of LGO biodiesel is more than that of diesel fuel.
The EGR system reduces NOx emissions by recirculation small amount of exhaust
gases into the intake manifold which reduces the combustion temperature. And the
Water Emulsion technique also comparatively reduces the NOx emissions. A single
cylinder water cooled DI diesel engine was used for investigation. Smoke, NOx, CO,
HC, CO2 emissions were recorded and various engine performance parameters were
also evaluated . The results and discussion based on the effect EGR system on engine
performance and emission characteristics of LGO25 with 10% and 20% EGR rates
and effect of diesel-water emulsion of LGO25+W2.5%, LGO25+W5% are studied
and compared with standard results of diesel and LGO25 blend.
Keywords ---Bio-diesel, LGO oil, EGR rates, Water emulsion, NOx emissions.
vi

LIST OF TABLES
TAB. NO NAME OF THE TABLE PG.NO
3.1 LEMONGRASS OIL PROPERTIES 09
4.1 TEST ENGINE SPECIFICATIONS 13
5.1 PERFORMANCE TABLE FOR LGO25+WATER2.5% 15
5.2 PERFORMANCE TABLE FOR LGO25+WATER5% 15
5.3 PERFORMANCE TABLE FOR LGO25+EGR10% 16
5.4 PERFORMANCE TABLE FOR LGO25+EGR20% 16
5.5 EMISSION TABLE FOR LGO25+WATER2.5% 17
5.6 EMISSION TABLE FOR LGO25+WATER5% 17
5.7 EMISSION TABLE FOR LGO25+EGR10% 18
5.8 EMISSION TABLE FOR LGO25+EGR20% 18
6.1 RESULT TABLE FOR LGO25+WATER2.5% 22
6.2 RESULT TABLE FOR LGO25+WATER5% 22
6.3 RESULT TABLE FOR LGO25+EGR10% 23
6.4 RESULT TABLE FOR LGO25+EGR20% 23
8.1 COST ESTIMATION OF TOTAL PROJECT 36
vii

LIST OF FIGURES
FIG.NO NAME OF THE FIGURE PG.NO
1.1 SCHEMATIC DIAGRAM FOR EGR 03
3.1 LEMONGRASS OIL 08
3.2 PRINCIPLE OF STEAM DISTILLATION 10
3.3 TEST FUEL PREPARATION 10
3.4 FORMATION OF PRECIPITATE 11
3.5 SURFACTANTS (TWEEN80, SPAN20) 11
3.6 LGO25+WATER2.5% 11
3.7 LGO25+WATER5% 11
3.8 LGO25+EGR 11
4.1 SCHEMATIC DIAGRAM OF ENGINE SETUP 12
4.2 SCHEMATIC DIAGRAM OF EGR SETUP 13
7.1 BP VS IP COMPARISON FOR LGO25+WATER BLEND 24
7.2 BP VS BSFC COMPARISON FOR LGO25+WATER BLEND 24
7.3 BP VS ɳmech COMPARISON FOR LGO25+WATER BLEND 25
7.4 BP VS BTE COMPARISON FOR LGO25+WATER BLEND 25
7.5 BP VS ITE COMPARISON FOR LGO25+WATER BLEND 26
7.6 BP VS EGT COMPARISON FOR LGO25+WATER BLEND 26
7.7 BP VS CO COMPARISON FOR LGO25+WATER BLEND 27
7.8 BP VS HC COMPARISON FOR LGO25+WATER BLEND 27
7.9 BP VS CO2 COMPARISON FOR LGO25+WATER BLEND 28
7.10 BP VS SMOKE COMPARISON LGO25+WATER BLEND 28
7.11 BP VS NOx COMPARISON FOR LGO25+WATER BLEND 29
viii

7.12 BP VS IP COMPARISON FOR BLENDS WITH EGR 30
7.13 BP VS BSFC COMPARISON FOR BLENDS WITH EGR 30
7.14 BP VS ɳmech COMPARISON FOR BLENDS WITH EGR 31
7.15 BP VS BTE COMPARISON FOR BLENDS WITH EGR 31
7.16 BP VS ITE COMPARISON FOR BLENDS WITH EGR 32
7.17 BP VS EGT COMPARISON FOR BLENDS WITH EGR 32
7.18 BP VS CO COMPARISON FOR BLENDS WITH EGR 33
7.19 BP VS HC COMPARISON FOR BLENDS WITH EGR 33
7.20 BP VS CO2 COMPARISON FOR BLENDS WITH EGR 34
7.21 BP VS SMOKE COMPARISON FOR BLENDS WITH EGR 34
7.22 BP VS NOx COMPARISON FOR BLENDS WITH EGR 35
10.1 INLET AND OUTLET LINES OF THE ENGINE 38
10.2 SETUP FOR OBSERVATION OF READINGS 38
10.3 EXHAUST GAS RECIRCULATION CONTROL SETUP 39
10.4 AVL SMOKE METER & CRYPTON 295 GAS ANALYSER 39
ix

LIST OF SYMBOLS
LGO = LEMON GRASS OIL
EGR = EXHAUST GAS RECIRCULATION
LGO25 = LGO25% + DIESEL75%
NOX = OXIDES OF NITROGEN
CO = CARBON MONOXIDE
HC = HYDROCARBON
BTDC = BEFORE TOP DEAD CENTRE
BP = BRAKE POWER
IP = INDICATED POWER
TFC = TOTAL FUEL CONSUMPTION
BSFC = BRAKE SPECIFIC FUEL CONSUMPTION
ɳm = MECHANICAL EFFICIENCY
ɳBTH = BRAKE THERMAL EFFICIENCY
ɳITH = INDICATED THERMAL EFFICIENCY
x

CHAPTER 1
INTRODUCTION
1.1 DIESEL ENGINE:
Diesel engines have been used in heavy duty applications for a long time; it is
only during the past decade that it has become popular in light duty application due to
their higher fuel efficiency. Higher fuel efficiency in the diesel engine is achieved due
to the high compression ratios along with relatively high oxygen concentration in the
combustion chamber. However, these same factors results in high NOx emission in
diesel engine. The stringent emission norms have been an important driving force to
develop the internal combustion engines more environment friendly. The main
pollutants from diesel engines are NOx and particulate matter (PM).Also, their
combustion products are causing global problems, such as the greenhouse effect,
ozone layer depletion, acid rains and pollution, which are posing great danger for our
environment, and eventually, for the total life on our planet.
1.2 BIOFUELS:
a. First Generation Fuels
Edible oils (Vegetable oils)
Ex: Sun flower oil, Groundnut oil, Coconut oil, Soybean oil, Rapeseed oil, etc.,
b. Second Generation Fuels
Non-Edible oils
Ex: Jatropha, Pongamia pinnata, Nagchampa, Rubber seeds, Castor oil, etc.,
c. Third Generation Fuels
Algae Fuels
1

d. Other Fuels
Biodiesel is produced from vegetable oils and animal fats, there are concerns
that biodiesel feedstock may compete with food supply in the long-term. Hence, the
recent focus is to find oil bearing plants that produce non-edible oils as the feedstock
for biodiesel production.
Ex: Alcohol fuels and Gaseous Fuels ( LPG, CNG and H2 )
In this project, plant species, Lemon grass (Cymbopogan flexuosus) is
discussed as newer sources of oil for biodiesel production. Lemongrass is native to
India and tropical Asia. In India, it is cultivated along Western Ghats (Maharashtra,
Kerala), Karnataka and Tamil Nadu states besides foot-hills of Arunachal Pradesh and
Sikkim i.e., it can be cultivated on wide range throughout India and may favor easy
availability.
1.3 EMISSION CONTROL TECHNIQUES:
Advances in engine and vehicle technology continually reduce the toxicity of
exhaust leaving the engine, but these alone have generally been proved insufficient to
meet emissions goals. Therefore, technologies to detoxify the exhaust are an essential
part of emissions control. The techniques used in emission control are air injection,
Exhaust Gas Recirculation (EGR), Catalytic Converter, Water Emulsion. We are
going to discuss about the following techniques:
1.3.1 Exhaust Gas Recirculation:
In the United States and Canada, many engines in 1973 and newer vehicles
have a system that routes a metered amount of exhaust into the intake tract under
particular operating conditions. Exhaust neither burns nor supports combustion, so it
dilutes the air/fuel charge to reduce peak combustion chamber temperatures. This, in
turn, reduces the formation of NOx.
2

EGR is defines as a mass percent of the total intake flow.
EGR = mEGR
mcyl ×100
Where cyl = total mass flow into the cylinders.
After EGR combines with the exhaust residual left from the previous cycle, the total
fraction of exhaust in the cylinder during the compression stroke is
xex = EGR
100 × (1-xr) + xr
Where xr = exhaust residual from previous cycle.
Fig 1.1 SCHEMATIC DIAGRAM FOR EGR
1.3.2 Water Emulsion:
Oxides of nitrogen (NOx) and particulate matter (PM) are the main pollutants
from diesel engines. Diesel-water emulsion, as alternative fuel, has potential to
significantly reduce the formation of NOx and PM in the diesel engine. The emulsion
fuel contains water (in the range of 5–15%) and diesel fuel with specific surfactants,
to stabilize the system. The surfactants used are span 20 and tween 80.This helps
water to dissolve in the diesel.
3

CHAPTER 2
LITERATURE SURVEY
2.1 BIOFUEL:
H.E. Saleh., [1] investigated that biodiesel is a renewable fuel which is free
from sulfur and aromatic compounds. Biodiesel does not overburden the environment
with CO2 emission as CO2 from the atmosphere is absorbed by the vegetable oil crop
during the photosynthesis process, while the plant is growing. Hence biodiesel offers
net CO2 advantage over conventional fuels. The use of biodiesel in diesel engines does
not require any hardware modification,
Sharma,Y.C et al., [2] studied on biodiesel preparation. Soyabean oil is
commonly used in United States and rapeseed oil is used in many European countries
for biodiesel production, whereas, coconut oil and palm oils are used in Malaysia for
biodiesel production. Jatropha is the common feed stock used for making biodiesel in
India and Africa. Transesterfication is the processes that convert the vegetable oils to
correspond ethyl or methyl esters. Transesterfication referred to conversion of an
organic acid ester into another ester of the same acid, this requires at least of three
moles of alcohol per mole of vegetable oil to yield three moles of fatty acid ester and
one mole of glycerol. The alcohols most frequently tried as reactants in the
transesterfication process are ethanol, methanol and butanol. The catalysts used, are
NaOH, NaOCH 3, and KOH etc. The selection of catalyst depends on molar ratio of
the reactants and the presence of free fatty acids.
K. Rajan et al., [3] conducted experiment with diesel blended with sunflower
oil methyl ester which has reduced the emission of NOx by 25% and other unburnt
HC,CO emission are also decreased comparatively in different percentage of biodiesel
blends in order of 5%,10%,20%. Calorific value of this biodiesel is less hence brake
thermal efficiency is increased by 4% and BSFC is increased by 10%.
4

2.2 EXHAUST GAS RECIRCULATION:
Pooja Ghodasara et al., [4] investigated that increase in EGR rates leads to
decrease in NOx emission, but increases HC emission and smoke opacity and
decreases brake thermal efficiency at lower loads. Decrease in EGR rates increases
brake thermal efficiency at higher loads. Through experiment 15% EGR is more
optimum for NOx reduction.
Achuthanunni et al., [5] done experiment with 10% EGR for diesel blended
with sunflower oil and methanol (B20) that showed 40% reduction in NOx emission.
This B20 biodiesel blend shown better performance than other blends and
comparative performance to diesel at all loads.
Donepudi Jagadish et al., [6] investigated that EGR rate variation causes
positive result in NOx emission reduction, but in HC , CO emission causes negative
result of reduction. So 10-15% EGR found to be optimum rate for NOx emission
reduction and reduces considerable increase in HC, CO emission.
Abd-Alla.G.H et al., [7] studied that EGR is an effective and simple means to
control NOx emissions by lowering combustion temperature and reducing oxygen
concentrations in the intake air. EGR involves replacement of oxygen and nitrogen of
fresh air entering in the combustion chamber with the carbon dioxide and water
vapour from the engine exhaust. However, EGR results in increasing the PM, UHC
and CO emissions, with the observed outcome of reduction in NO emissions.
D. Agarwal et al., [8] conducted a test on a single cylinder DI diesel engine and
measured the performance and emission characteristics with rice bran methyl ester
(RBME) and its blends as fuel with EGR system. They optimized and reported that
20% biodiesel blends with 15% EGR produce the less NOx, CO and HC emissions
and also improved thermal efficiency and reduced BSFC.
5

Ken Satoh et al., [9] investigated on a naturally aspirated single cylinder DI
diesel engine with various combinations of EGR, fuel injection pressures, injection
timing and intake gas temperatures affect exhaust emissions and they found that NOx
reduction ratio has a strong correlation with oxygen concentration regardless of
injection pressure or timing. NOx reduction ratio is in direct proportion to intake gas
temperatures. EGR may adversely affect the smoke emission because it lowers the
average combustion temperatures and reduces the oxygen intake gases, which in turn
keeps soot from oxidizing. Also they suggested that for a given level of oxygen
concentration the cooled EGR reduces more NOx with less EGR rates than does at hot
EGR.
Sharma et al., [10] have studied performance of a single cylinder DI diesel
engine with Jatropha oil methyl ester biodiesel (JBD) with hot EGR .They optimized
15 %EGR gave the adequate reduction of NOx emission with minimum possible
smoke, CO, UBHC emissions. And further increased EGR rates produced more NOx
emissions.
2.3 WATER EMULSION:
Prof. Dr. Eng. Dan Scarpete [11] proved that diesel-water emulsion has a
potential in reducing NOx and PM emissions of diesel engines. Water-in-oil emulsion
is best suited type of fuel for diesel engines rather than oil-in-water type due to the
micro-explosion phenomenon of droplet of water, which causes a large fragmentation
of the oil and less change in viscosity with water content.
Yoshimoto et al., [12] investigated the engine performance with a stable
emulsified fuel including frying oil, composed of vegetable oils discarded from
restaurants and households. It had been further reported that NOx concentration and
smoke density were reduced without worsening BSFC with water to fuel volume
ratios of 15-30% at a rated power output.
6

Kweonha Park et al., [13] argued that water in the oil was quickly evaporated
by micro-explosion into extremely tiny droplets; this would make the water droplets
not to reach directly to the combustion chamber wall, so there would be no corrosion
on the cylinder surface.
Samec et al., [14] conducted numerical and experimental studies on some of the
chemical and physical properties of water/oil emulsified fuel (W/OEF) combustion
characteristics. Their results of engine testing in a broad field of engine loads and
speeds have shown a significant pollutant emission reduction with no worsening of
specific fuel consumption.
Kannan and Udayakumar [15] Used commercial diesel fuel and diesel fuel with
10% and 20% water by volume. Their results showed that the water emulsification
has a potential to improve brake thermal efficiency and brake specific fuel
consumption. The NOx and hydrocarbon emissions were found to decrease with
increase in water percentage in the emulsified diesel.
7

CHAPTER 3
TEST FUEL
3.1 NEAT LEMONGRASS OIL:
Lemongrass (Cymbopogan citratus) is a plant in the grass family that
contains 1 to 2% essential oil on a dry basis. Lemongrass oil has a Lemony, sweet
smell and is dark Yellow to amber and reddish in Color, with a watery viscosity. The
main Component in lemongrass oil is Cymbopogon Citral, or Citral. Lemon Grass oil
consists of 65 to 85 percent Citral. Citral is a pale yellow liquid, often Colorless, with
a strong Fresh lemon smell. Citral is extracted from fresh leaves by Using steam
distillation. Steam distillation yields a mixture of water/ essential oil.
Dichloromethane was used to separate the essential oil from the water layer.
Lemongrass oil (Family: Poecea, Genus: Lemon Grass, Species: Cymbopogon
Citratus, Parts used: Leaves, Stems).
Lemongrass is a high-biomass crop that may have applications for biofuel
production. Because of the content of its high-value essential oil, the cost for
production of biomass for biofuel may be low, since the biomass would be a by-
product of essential oil production. Lemongrass is native to India, Southeast Asia, and
Oceania.
Fig 3.1 LEMONGRASS
8

3.2 PROPERTIES:
Lemongrass oil has a lemony, sweet smell and is dark yellow to amber and reddish in
colour with a watery viscosity.
Table.3.1. Lemongrass oil properties
Specific gravity 0.9253
Density 925.3 kg/m3
Calorific value 8829 kcal/kg (37000 kJ/kg)
Kinematic viscosity 4.16 Ns/m2
Flash Point 50˚C
Fire point 58˚C
Cetane Index 38
3.3 OIL PREPARATION:
STEAM DISTILLATION METHOD:
Steam distillation is a special type of distillation (a separation process) for temperature
sensitive materials like natural aromatic compounds.
Principle:
When a mixture of two practically immiscible liquids are cooled while being agitated
to expose the surface of one liquid to the vapor phase, each constituent independently
exerts its own vapor pressure as a function of temperature as if the other constituent
were not present. Consequently, the vapor pressure of the whole system increases.
Boiling begins when the sum of the partial pressures of the two immiscible liquids just
exceeds the atmospheric pressure (approximately 101 kPa at sea level). In this way,
many organic compounds insoluble in water can be purified at a temperature well
below the point at which decomposition occurs.
9

Fig 3.2 Principle of Steam Distillation
3.4 TEST FUEL PREPARATION:
Test fuels were prepared for different proportions. For the EGR process, diesel with
25% of LGO was blended using a mechanical stirrer. Same test fuel was used for both
10 &20% EGR processes. For the Water Emulsion process, two test fuels were
made with 2.5% and 5% water blended with diesel-LGO25 blend (i.e).,2.5% water,
25%LGO, 70% diesel, 1.5% span20, 1% tween80 is the composition for LG2W blend.
Fig3.3 Test Fuel Preparation
10

Fig 3.4 Formation Of Precipitate Fig 3.5 Surfactants (Tween80,Span20)
Fig 3.6 LGO25+Water2.5% Fig3.7 LGO25+Water5%
Fig3.8 LGO25+EGR
11

CHAPTER 4
EXPERIMENTAL SETUP AND PROCEURE
4.1Experimental Engine Setup:
The engine used in this experiment was a single cylinder, water cooled, NA, 4-
stroke DI diesel engine, the Engine was coupled with an eddy current dynamometer
through a load cell. The specifications of the engine are shown in Table 4.1. All the
experiments were conducted at standard temperature and pressure. The engine is
integrated with a data acquisition system to store the data for the off-line analysis.
AVL smoke meter is used to measure intensity of smoke and gas analyzer to measure
various emissions like NOx, CO, HC.
1-Manometer Tube 5-RPM 9-Engine 13-Exaust Pipe
2-Burette 6-Voltmeter 10-Coupling 14-Gas Analyser
3-Exhaust Gas Temperature 7-Load 11-Eddy Current Dynamometer 15-AVL smoke meter
4-Ammeter 8-Fuel pipe 12-Load cell
Fig 4.1 Schematic Diagram Of Engine Setup
The engine is operated on diesel as baseline mode at a constant speed of 1500 rpm at
no load to full load. The engine was loaded with eddy current dynamometer and the
loads are applied in steps of 0, 25, 50, 75 and 100 percent of full load.
12

For each load, the engine performance parameters and engine emissions were
recorded; the dynamic fuel injection timing was set at 23° BTDC.
4.1.1 EGR Setup:
Fig4.2 Schematic diagram of EGR setup
A pipeline should be made to take the exhaust gases from the exhaust pipe to
the air inlet pipeline through EGR valve.
Table.4.1. Test Engine Specifications
Model Kirloskar AV1
Type Single Cylinder, 4 Stroke, Direct Injection,
Vertical Water Cooled Engine
Rated Power 4.4KW
Rated Speed 1500rpm
Bore Diameter(D) 87.5mm
Stroke(L) 110mm
Compression ratio 17.5:1
Ambient Temperature 30°c
Injection Pressure 200bar
Injection Timing 23° BTDC
13

4.2 EXPERIMENTAL PROCEDURE:
4.2.1 Water Emulsion:
Fuel consumption was measured by a burette attached to the engine and a stop
watch was used to measure fuel consumption time for every 10 cm3 fuel. Carbon
monoxide, unburnt hydrocarbon and NOx emission were measured by Wahun Cubic
Gas Analyzer. Smoke emissions were measured by means of Bosch smoke meter
(GASBOARD-5020H). Chromyl-alumel (k-type) thermocouple was used to measure
the exhaust gas temperature. The engine is started by using standard diesel and the
engine operating temperature was reached and then loads are applied. The warm up
period ends when cooling water temperature is stabilized at 60°C. The tests are
conducted at the rated speed of 1500 rpm. In every test, volumetric fuel consumption
and exhaust gas emissions such as carbon monoxide (CO), hydrocarbon (HC),
nitrogen oxides (NOx), carbon dioxide (CO2) and oxygen (O2) are measured. From the
initial measurement, brake thermal efficiency (BTE), specific fuel consumption
(SFC), brake power (BP), Indicated mean effective pressure (IMEP), mechanical
efficiency and exhaust gas temperature for different ratios of water(2.5% & 5%) are
calculated and recorded.
4.2.2 EGR:
The experimental procedure for the EGR technique is by bypassing the
percentage of the exhaust gas into the combustion chamber and the amount of
recirculation is varied by adjusting the valve in the EGR pipeline. This percentage is
varied by considering the manometer level. From the difference in the manometer
level the EGR percentages (10% &20%) are adjusted. The flow of EGR is controlled
by the Engine Management System.
14
CHAPTER 5
OBSERVATION TABULATION
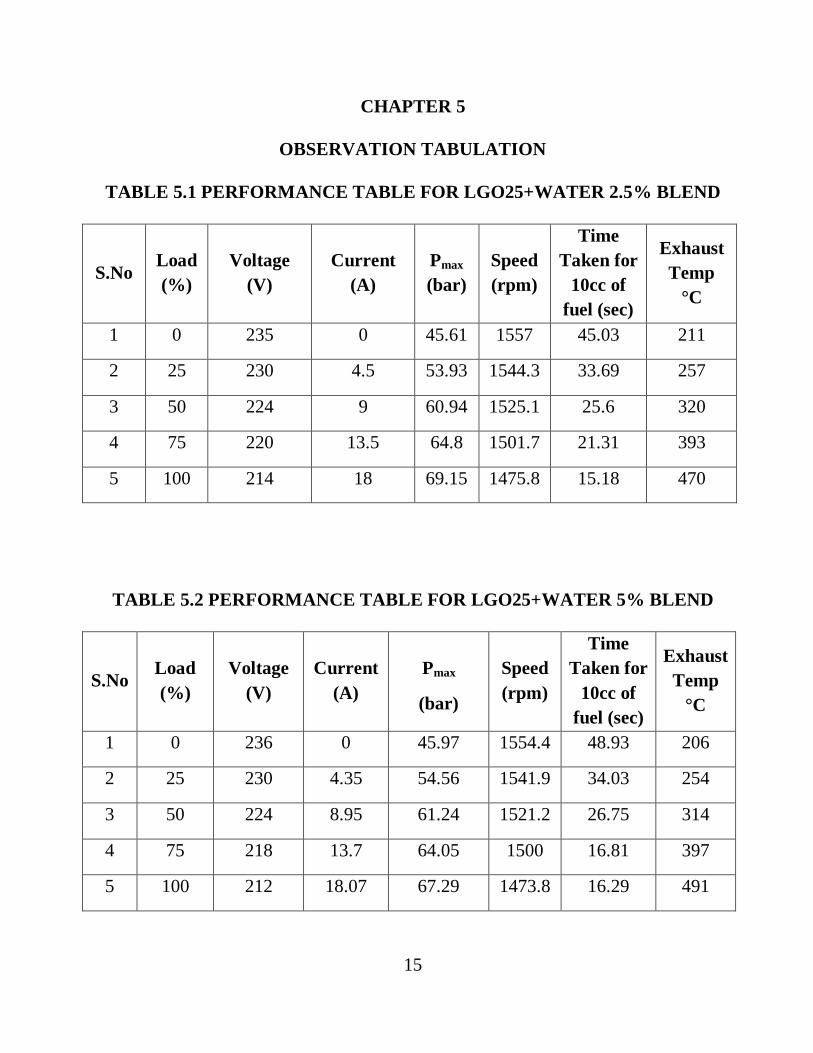
TABLE 5.1 PERFORMANCE TABLE FOR LGO25+WATER 2.5% BLEND
S.No
Load
(%)
Voltage
(V)
Current
(A)
Pmax
(bar)
Speed
(rpm)
Time
Taken for
10cc of
fuel (sec)
Exhaust
Temp
°C
1 0 235 0 45.61 1557 45.03 211
2 25 230 4.5 53.93 1544.3 33.69 257
3 50 224 9 60.94 1525.1 25.6 320
4 75 220 13.5 64.8 1501.7 21.31 393
5 100 214 18 69.15 1475.8 15.18 470
TABLE 5.2 PERFORMANCE TABLE FOR LGO25+WATER 5% BLEND
S.No
Load
(%)
Voltage
(V)
Current
(A)
Pmax
(bar)
Speed
(rpm)
Time
Taken for
10cc of
fuel (sec)
Exhaust
Temp
°C
1 0 236 0 45.97 1554.4 48.93 206
2 25 230 4.35 54.56 1541.9 34.03 254
3 50 224 8.95 61.24 1521.2 26.75 314
4 75 218 13.7 64.05 1500 16.81 397
5 100 212 18.07 67.29 1473.8 16.29 491
15
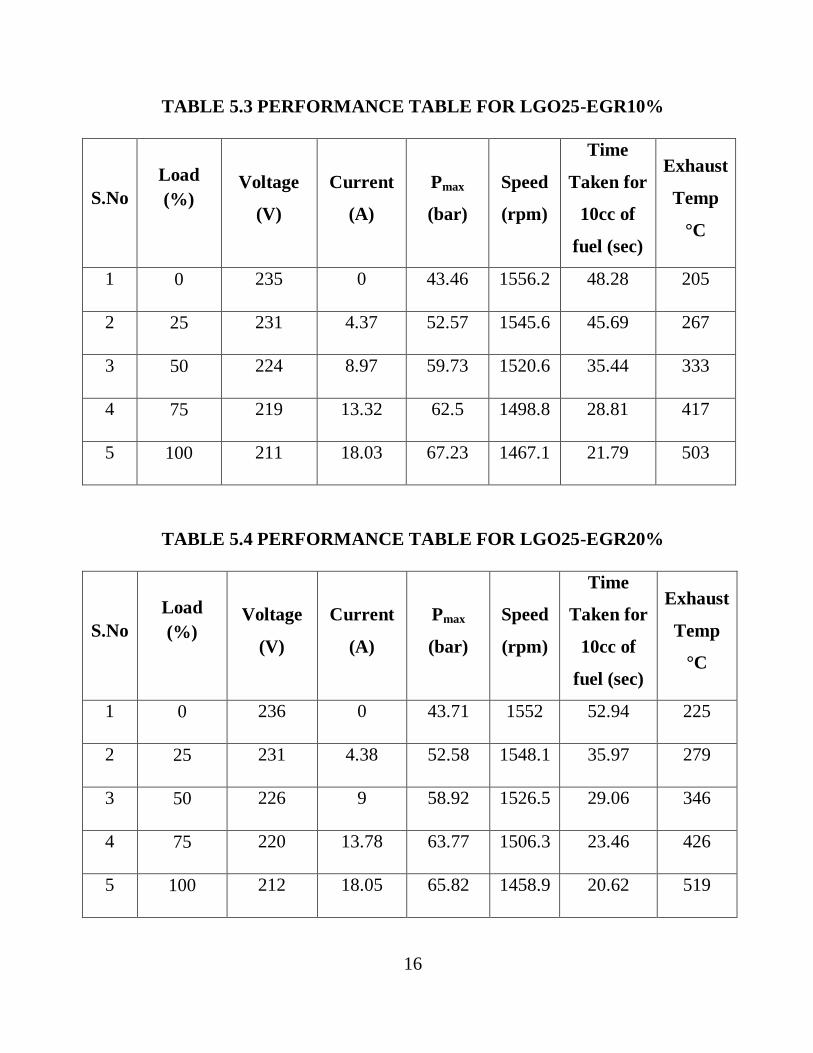
TABLE 5.3 PERFORMANCE TABLE FOR LGO25-EGR10%
S.No
Load
(%) Voltage
(V)
Current
(A)
Pmax
(bar)
Speed
(rpm)
Time
Taken for
10cc of
fuel (sec)
Exhaust
Temp
°C
1 0 235 0 43.46 1556.2 48.28 205
2 25 231 4.37 52.57 1545.6 45.69 267
3 50 224 8.97 59.73 1520.6 35.44 333
4 75 219 13.32 62.5 1498.8 28.81 417
5 100 211 18.03 67.23 1467.1 21.79 503
TABLE 5.4 PERFORMANCE TABLE FOR LGO25-EGR20%
S.No
Load
(%) Voltage
(V)
Current
(A)
Pmax
(bar)
Speed
(rpm)
Time
Taken for
10cc of
fuel (sec)
Exhaust
Temp
°C
1 0 236 0 43.71 1552 52.94 225
2 25 231 4.38 52.58 1548.1 35.97 279
3 50 226 9 58.92 1526.5 29.06 346
4 75 220 13.78 63.77 1506.3 23.46 426
5 100 212 18.05 65.82 1458.9 20.62 519
16

TABLE 5.5 EMISSION TABLE FOR LGO25+WATER 2.5% BLEND
S.No
Load
(%)
CO%
VOL HC-PPM
CO2%-
VOL
O2%-
VOL
NOX-
PPM
SMOKE
OPACITY
1 0 0.05 23 2.5 17.3 90 1.2
2 25 0.04 25 3.8 15.49 245 3.4
3 50 0.03 22 5.1 13.71 388 5.8
4 75 0.03 24 6.8 11.51 521 11.6
5 100 0.05 35 8.5 9.19 556 29.3
TABLE 5.6 EMISSION TABLE FOR LGO25+WATER 5% BLEND
S.No
Load
(%)
CO%
VOL HC-PPM
CO2%-
VOL
O2%-
VOL
NOx-
PPM
SMOKE
OPACITY
1 0 0.06 27 2.5 17.08 84 0.4
2 25 0.05 28 3.8 15.42 233 0.5
3 50 0.04 25 5.3 13.45 374 0.8
4 75 0.03 27 6.9 11.38 485 3.8
5 100 0.06 38 8.7 8.89 498 28.6
17

TABLE 5.7 EMISSION TABLE FOR LGO25-EGR10%
S.No
Load
(%)
CO%
VOL
HC-
PPM
CO2%-
VOL
O2%-
VOL
NOx-
PPM
SMOKE
OPACITY
1 0 0.12 45 4 14.96 74 0.2
2 25 0.08 36 5.4 13.11 231 0.6
3 50 0.03 46 7.2 10.85 417 3.3
4 75 0.04 53 9.8 7.41 500 22.5
5 100 0.25 100 12.4 2.71 430 57.2
TABLE 5.8 EMISSION TABLE FOR LGO25-EGR20%
S.No
Load
(%)
CO%
VOL
HC-
PPM
CO2%-
VOL
O2%-
VOL
NOx-
PPM
SMOKE
OPACITY
1 0 0.12 39 4.4 14.23 73 0.8
2 25 0.1 42 5.7 12.59 195 1.3
3 50 0.06 28 7.7 10.14 317 3.5
4 75 0.06 47 9.6 7.58 459 21.7
5 100 0.32 109 12.4 1.69 369 54
18

CHAPTER 6
CALCULATIONS
6.1 FORMULAS USED:
1. BRAKE POWER, B.P = V × I × Φ
ɳ × 1000
Where
V = Voltage
I = Current
Φ = Power Factor
ɳ = Generator Efficiency
2. INDICATED POWER, I.P = IMEP × L × A × N
Z × 60 × 1000
Where
IMEP = Indicated Mean Effective Pressure (N/m2)
L = Stroke length (m)
A = Area of Piston (m2)
N = Speed (rpm)
Z = Power Factor (Z=1 for 2 Stroke, Z=2 for 4stroke)
3. TOTAL FUEL CONSUMPTION, T.F.C = q × Density Of Fuel
t
Where
q = Volume of fuel consumed (10cc)
t = Time taken for 10cc of fuel consumption (sec)
4. BRAKE SPECIFIC FUEL CONSUMPTION, B.S.F.C = T.F.C
B.P
5. MECHANICAL EFFICIENCY, ɳm =
B.P
I.P × 100
19

6. BRAKE THERMAL EFFICIENCY, ɳBTH =
B.P
T.F.C × C.V × 100
C.V = Calorific Value of fuel used (kJ/kg)
7. INDICATED THERMAL EFFICIENCY, ɳITH = I.P
T.F.C × C.V × 100
6.2 MODEL CALCULATION:
1. BRAKE POWER
B.P = V × I × Φ
ɳ × 1000
= 224 × 8.95 × 1
0.9 × 1000
=2.227 kW
2. INDICATED POWER
I.P = IMEP × L × A × N
Z × 60 × 1000
= 4.33×10
5 × 0.11 × 1521.2 × 6.01×10
-3
2 × 60 × 1000
= 3.628 kW
3. TOTAL FUEL CONSUMPTION
T.F.C = q × Density Of Fuel
t
= 10×10
-6 × 877
26.75
= 3.278×10⁻⁴
kg/sec
= 1.180 kg/hr
20
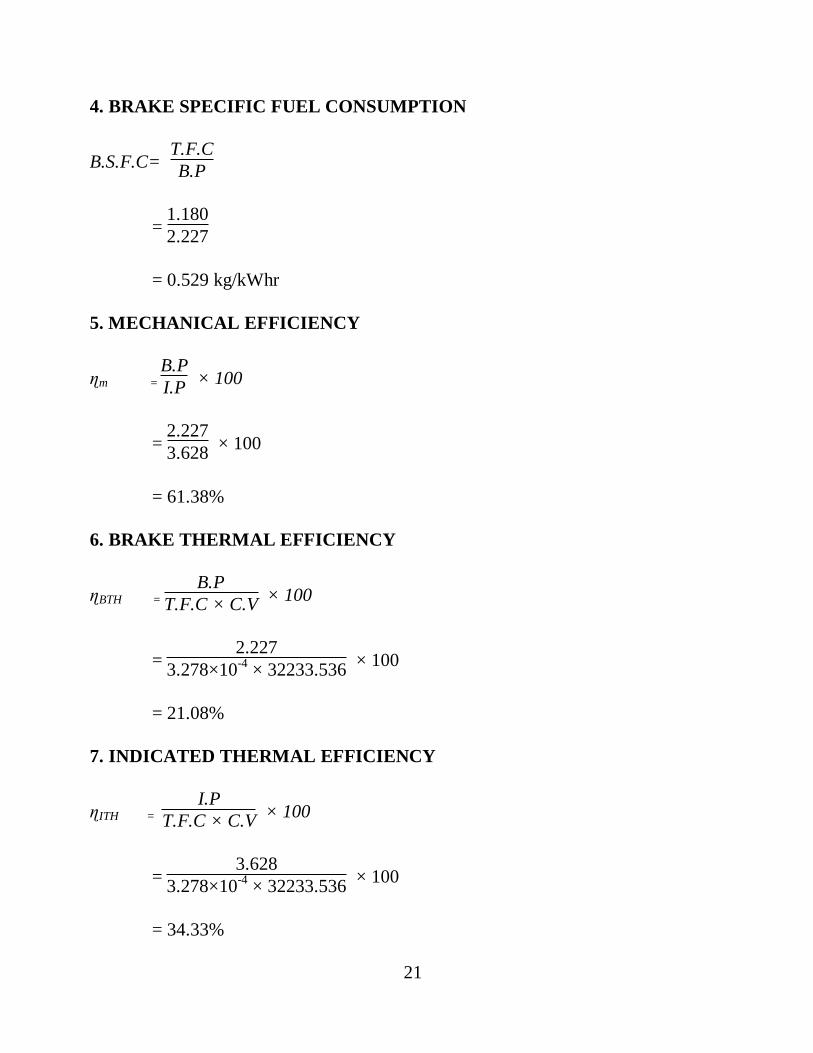
4. BRAKE SPECIFIC FUEL CONSUMPTION
B.S.F.C= T.F.C
B.P
= 1.180
2.227
= 0.529 kg/kWhr
5. MECHANICAL EFFICIENCY
ɳm =
B.P
I.P × 100
= 2.227
3.628 × 100
= 61.38%
6. BRAKE THERMAL EFFICIENCY
ɳBTH =
B.P
T.F.C × C.V × 100
= 2.227
3.278×10-4
× 32233.536 × 100
= 21.08%
7. INDICATED THERMAL EFFICIENCY
ɳITH = I.P
T.F.C × C.V × 100
= 3.628
3.278×10-4
× 32233.536 × 100
= 34.33%
21
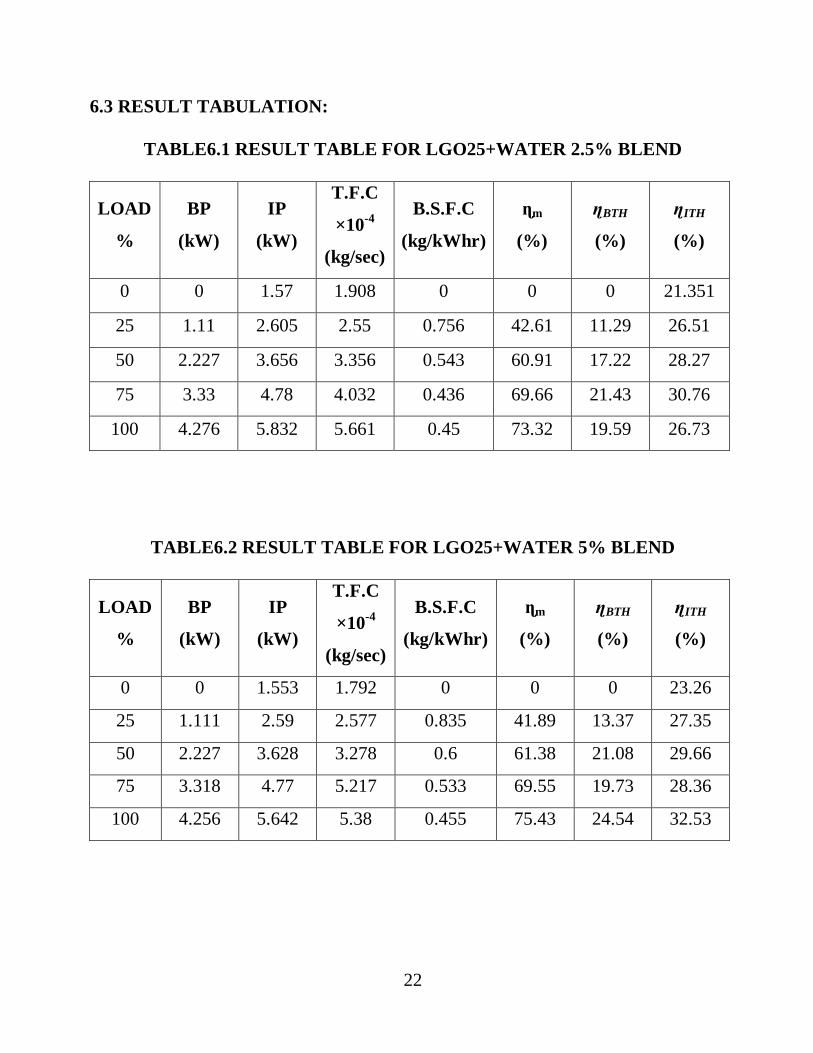
6.3 RESULT TABULATION:
TABLE6.1 RESULT TABLE FOR LGO25+WATER 2.5% BLEND
LOAD
%
BP
(kW)
IP
(kW)
T.F.C
×10-4
(kg/sec)
B.S.F.C
(kg/kWhr)
ɳm
(%)
ɳBTH
(%)
ɳITH
(%)
0 0 1.57 1.908 0 0 0 21.351
25 1.11 2.605 2.55 0.756 42.61 11.29 26.51
50 2.227 3.656 3.356 0.543 60.91 17.22 28.27
75 3.33 4.78 4.032 0.436 69.66 21.43 30.76
100 4.276 5.832 5.661 0.45 73.32 19.59 26.73
TABLE6.2 RESULT TABLE FOR LGO25+WATER 5% BLEND
LOAD
%
BP
(kW)
IP
(kW)
T.F.C
×10-4
(kg/sec)
B.S.F.C
(kg/kWhr)
ɳm
(%)
ɳBTH
(%)
ɳITH
(%)
0 0 1.553 1.792 0 0 0 23.26
25 1.111 2.59 2.577 0.835 41.89 13.37 27.35
50 2.227 3.628 3.278 0.6 61.38 21.08 29.66
75 3.318 4.77 5.217 0.533 69.55 19.73 28.36
100 4.256 5.642 5.38 0.455 75.43 24.54 32.53
22

TABLE6.3 RESULT TABLE FOR LGO25-EGR10%
LOAD
%
BP
(kW)
IP
(kW)
T.F.C
×10-4
(kg/sec)
B.S.F.C
(kg/kWhr)
ɳm
(%)
ɳBTH
(%)
ɳITH
(%)
0 0 1.71 1.76 0 0 0 24.48
25 1.12 2.66 1.86 0.598 42.1 15.18 36.04
50 2.23 3.75 2.4 0.387 59.46 23.42 39.38
75 3.21 4.27 2.95 0.331 75.17 27.42 36.48
100 4.23 5.83 3.9 0.332 72.55 27.33 37.67
TABLE6.4 RESULT TABLE FOR LGO25-EGR20%
LOAD
%
BP
(kW)
IP
(kW)
T.F.C
×10-4
(kg/sec)
B.S.F.C
(kg/kWhr)
ɳm
(%)
ɳBTH
(%)
ɳITH
(%)
0 0 1.68 1.61 0 0 0 26.3
25 1.12 2.62 2.36 0.76 42.75 11.96 27.98
50 2.26 3.68 2.92 0.466 61.41 19.51 31.76
75 3.36 4.91 3.62 0.388 68.43 23.39 34.18
100 4.25 5.67 4.12 0.349 74.95 25.99 34.68
23

CHAPTER 7
RESULTS AND DISCUSSION
7.1 PERFORMANCE ANALYSIS FOR WATER EMULSION:
Fig 7.1 BP VS IP COMPARISON FOR LGO25+WATER BLEND
The brake power and indicated power of LGO25+water2.5 blend is compared
in the fig 7.1.It shows that indicated power increases for emulsified biofuel.This is due
to the higher CO2 formation.
Fig 7.2 BP VS BSFC COMPARISON FOR LGO25+WATER BLEND
The BSFC of diesel,LGO25 and emulsified blends is compared in the fig
7.2.It shows that BSFC increases in emulsified biofuel than diesel and LGO25.But
both emulsified proportions have closer values of BSFC. This is due to lower calorific
value and high viscosity of the LGO25 blend when compared to diesel.
24

Fig 7.3 BP VS ɳmech COMPARISON FOR LGO25+WATER BLEND
The mechanical efficiency of diesel,LGO25 and emulsified blends is compared
in the fig 7.3.It shows that mechanical efficiency decreases for emulsified biofuel than
diesel and LGO25.But both the emulsified proportions have closer values.
Fig 7.4 BP VS ɳBTH COMPARISON FOR LGO25+WATER BLEND
The brake thermal efficiency of emulsified blends,diesel and LGO25 is
compared in the fig 7.4.It shows that brake thermal efficiency decreases for
emulsified biofuel than diesel and LGO25.But both the emulsified proportions have
closer values. Brake thermal efficiency decreases due to amount of fresh oxygen
available for combustion get decreased.
25

Fig 7.5 BP VS ɳITH COMPARISON FOR LGO25+WATER BLEND
The indicated thermal efficiency of emulsified blends,diesel and LGO25 is
compared in the fig 7.5.It shows that indicated thermal efficiency slightly decreases
for emulsified biofuel than diesel and LGO25.
Fig 7.6 BP VS EGT COMPARISON FOR LGO25+WATER BLEND
The exhaust gas temperature of emulsified blends,diesel and LGO25 is
compared in the fig 7.6.It shows that exhaust gas temperature increases for emulsified
biofuel than diesel and LGO25.But both the emulsified proportions have closer
values.
26

7.2 EMISSION ANALYSIS FOR WATER EMULSION:
Fig 7.7 BP VS CO COMPARISON FOR LGO25+WATER BLEND
The CO emission of emulsified blends,diesel and LGO25 is compared in the fig
7.7.It shows that CO decreases for emulsified biofuel than diesel and LGO25.
Fig 7.8 BP VS HC COMPARISON FOR LGO25+WATER BLEND
The HC emission of emulsified blends,diesel and LGO25 is compared in the
fig 7.8.It shows that HC decreases for emulsified biofuel than diesel and LGO25.
Lower oxygen content available for combustion results in rich mixture which results
incomplete combustion and results higher hydro carbon emission.
27

Fig 7.9 BP VS CO2 COMPARISON FOR LGO25+WATER BLEND
The Co2 emission of emulsified blends,diesel and LGO25 is compared in the fig
7.9.It shows that Co2 increases for emulsified biofuel than diesel and LGO25.But
both the emulsified proportions have closer values.
Fig 7.10 BP VS SMOKE COMPARISON FOR LGO25+WATER BLEND
The smoke emission of emulsified blends,diesel and LGO25 is compared in the
fig 7.10.It shows that smoke decreases for emulsified biofuel than diesel and
LGO25.This is due to the lower peak temperature in cylinder due to the water content
in emulsion fuel and enhanced mixing with air by micro-explosions.
28

Fig 7.11 BP VS NOx COMPARISON FOR LGO25+WATER BLEND
The NOx emission of emulsified blends,diesel and LGO25 is compared in the
fig 7.11.It shows that NOx decreases for emulsified biofuel than diesel and
LGO25.But both the emulsified proportions have closer values.It is due to the reduced
combustion chamber temperature. This is due to the lower peak temperature in
cylinder due to the water content in emulsion fuel and enhanced mixing with air by
micro-explosions.
29

7.3 PERFORMANCE ANALYSIS FOR EGR:
Fig 7.12 BP VS IP COMPARISON FOR BLENDS WITH EGR
The indicated power of blends with EGR,pure diesel and LGO25 is compared
in the fig 7.12.It shows that indicated power increases for biofuel with EGR than
diesel and LGO25.But both the proportions have closer values.
Fig 7.13 BP VS BSFC COMPARISON FOR BLENDS WITH EGR
The BSFC of blends with EGR,diesel and LGO25 is compared in the fig 7.13.It
shows that BSFC increases for biofuel with EGR than pure diesel and LGO25. This is
due to lower calorific value and high viscosity of the LGO25 blend when compared to
diesel.
30

Fig 7.14 BP VS ɳmech COMPARISON FOR BLENDS WITH EGR
The mechanical efficiency of blends with EGR,pure diesel and LGO25 is
compared in the fig 7.14.It shows that mechanical efficiency decreases for biofuel
with EGR than diesel and LGO25.But both the proportions have closer values.
Fig 7.15 BP VS ɳBTH COMPARISON FOR BLENDS WITH EGR
The brake thermal efficiency of blends with EGR,pure diesel and LGO25 is
compared in the fig 7.15.It shows that brake thermal efficiency decreases for biofuel
with EGR than diesel and LGO25. Brake thermal efficiency decreases due to amount
of fresh oxygen available for combustion get decreased due to replaced by exhaust
gas. 31
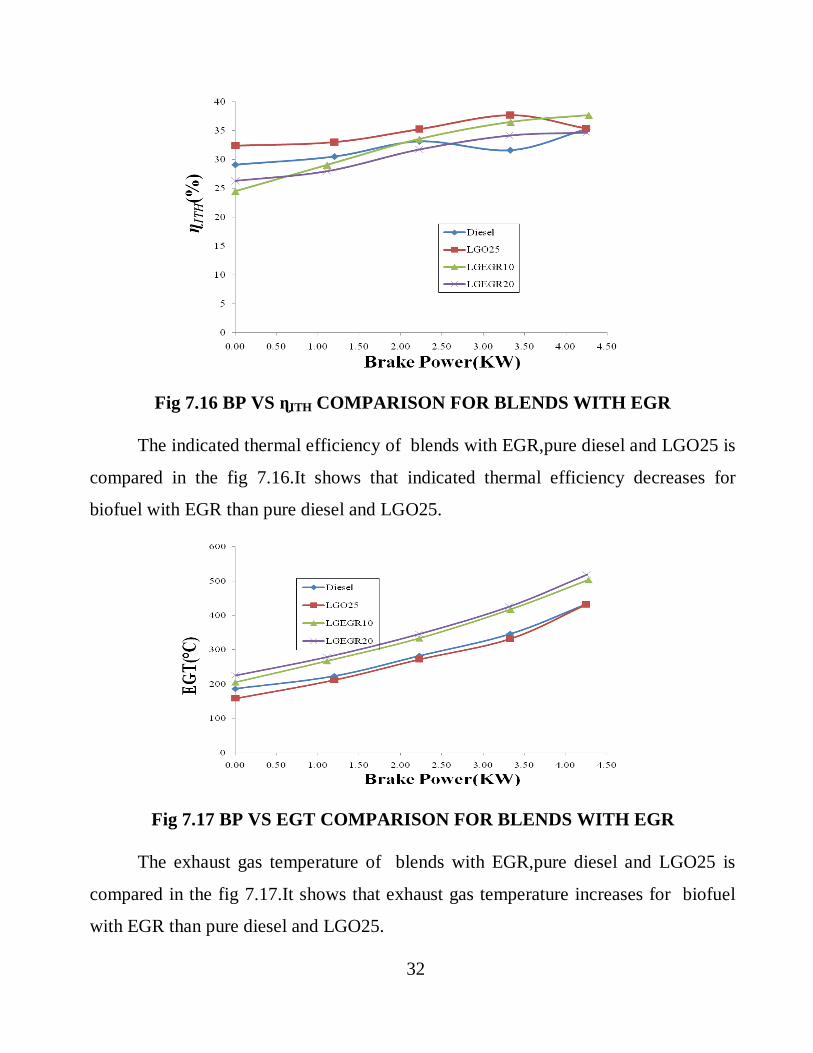
Fig 7.16 BP VS ɳITH COMPARISON FOR BLENDS WITH EGR
The indicated thermal efficiency of blends with EGR,pure diesel and LGO25 is
compared in the fig 7.16.It shows that indicated thermal efficiency decreases for
biofuel with EGR than pure diesel and LGO25.
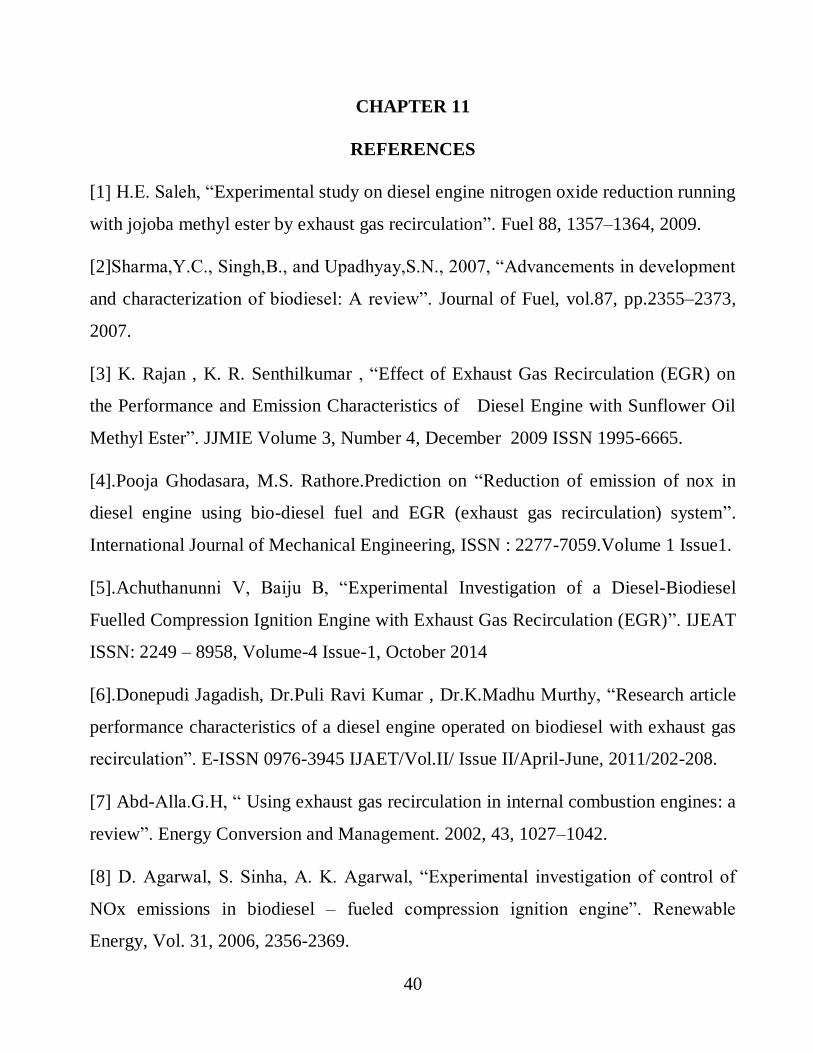
Fig 7.17 BP VS EGT COMPARISON FOR BLENDS WITH EGR
The exhaust gas temperature of blends with EGR,pure diesel and LGO25 is
compared in the fig 7.17.It shows that exhaust gas temperature increases for biofuel
with EGR than pure diesel and LGO25.
32

7.4 EMISSION ANALYSIS FOR EGR:
Fig 7.18 BP VS CO COMPARISON FOR BLENDS WITH EGR
The CO of blends with EGR,pure diesel and LGO25 is compared in the fig
7.18.It shows that CO increases for biofuel with EGR than pure diesel and LGO25.
Fig 7.19 BP VS HC COMPARISON FOR BLENDS WITH EGR
The HC of blends with EGR,pure diesel and LGO25 is compared in the fig
7.19.It shows that HC slightly increases for biofuel with EGR than pure diesel and
LGO25. Lower oxygen content available for combustion results in rich mixture which
results incomplete combustion and results higher hydro carbon emission.
33

Fig 7.20 BP VS Co2 COMPARISON FOR BLENDS WITH EGR
The CO2 of blends with EGR,pure diesel and LGO25 is compared in the fig
7.20.It shows that CO2 increases for biofuel with EGR than pure diesel and LGO25.
CO2 for biodiesel with EGR is noticed higher than diesel as it contains molecular
oxygen and more HC which is responsible for better combustion.
Fig 7.21 BP VS SMOKE COMPARISON FOR BLENDS WITH EGR
The SMOKE of blends with EGR,pure diesel and LGO25 is compared in the
fig 7.21.It shows that SMOKE decreases for biofuel with EGR than pure diesel and
LGO25. Smoke opacity for biodiesel with EGR is noticed lower than diesel as it
contains molecular oxygen responsible for better combustion.
34

Fig 7.22 BP VS NOx COMPARISON FOR BLENDS WITH EGR
The NOx of blends with EGR,pure diesel and LGO25 is compared in the
fig 7.22.It shows that NOx decreases for biofuel with EGR than pure diesel and
LGO25. It is due to the reduced combustion chamber temperature. The reasons for
reduction in NOx emissions using EGR in diesel engines are reduced oxygen
concentration and decreased the flame temperatures in the combustion chamber.
35

CHAPTER 8
COST ESTIMATION
TABLE 8.1 : COST ESTIMATION OF THE TOTAL PROJECT
36
SL.NO
PARTICULARS
AMOUNT ( ₹ )
1. LemonGrass Oil (2 litres) 1000
2. Span 80 (250ml) 500
3. Tween 80 (250 ml) 250
4. 1000ml beaker (2) 500
5. 20ml test tube (2) 40
6. Distilled water (1 litre) 20
7. Fuel Properties Testing (4 tests) 3600
8. Engine Testing (4 tests) 8000
9. Transportation 400
TOTAL ₹ 14310

CHAPTER 9
CONCLUSION
Influence of two emission control techniques namely Water Emulsion and
Exhaust gas recirculation (EGR) rates on Lemon Grass Oil biodiesel (LGO), diesel
and their blends are investigated. The results shows that NOx emission and smoke is
reduced in both the techniques. By using both techniques there is some small loss in
the efficiencies (brake thermal, indicated thermal and mechanical), but they are
negligible or do not have much effects. Using bio-fuel as a alternate fuel emission
increases which can be overcome by the discussed two techniques. With the help of
these two techniques Lemon Grass Oil (LGO)-Diesel blends can be successfully used
as a alternate fuel in future.
The reduction in NOx and smoke in water emulsion is due to the lower peak
temperature in cylinder due to the water content in emulsion fuel and enhanced
mixing with air by micro-explosions.And the reduction in NOx and smoke in EGR is
due to reduced oxygen concentration and decreased the flame temperatures in the
combustion chamber.
37

CHAPTER 10
PHOTOS
Fig 10.1 Inlet And Outlet Line Of The Engine
Fig 10.2 Setup For Observation Of Readings
38

Fig 10.3 Exhaust Gas Recirculation Control Setup
Fig 10.4 AVL Smoke Meter and CRYPTON 295 Five Gas Analyser
39
CHAPTER 11
REFERENCES
[1] H.E. Saleh, “Experimental study on diesel engine nitrogen oxide reduction running
with jojoba methyl ester by exhaust gas recirculation”. Fuel 88, 1357–1364, 2009.
[2]Sharma,Y.C., Singh,B., and Upadhyay,S.N., 2007, “Advancements in development
and characterization of biodiesel: A review”. Journal of Fuel, vol.87, pp.2355–2373,
2007.
[3] K. Rajan , K. R. Senthilkumar , “Effect of Exhaust Gas Recirculation (EGR) on
the Performance and Emission Characteristics of Diesel Engine with Sunflower Oil
Methyl Ester”. JJMIE Volume 3, Number 4, December 2009 ISSN 1995-6665.
[4].Pooja Ghodasara, M.S. Rathore.Prediction on “Reduction of emission of nox in
diesel engine using bio-diesel fuel and EGR (exhaust gas recirculation) system”.
International Journal of Mechanical Engineering, ISSN : 2277-7059.Volume 1 Issue1.
[5].Achuthanunni V, Baiju B, “Experimental Investigation of a Diesel-Biodiesel
Fuelled Compression Ignition Engine with Exhaust Gas Recirculation (EGR)”. IJEAT
ISSN: 2249 – 8958, Volume-4 Issue-1, October 2014
[6].Donepudi Jagadish, Dr.Puli Ravi Kumar , Dr.K.Madhu Murthy, “Research article
performance characteristics of a diesel engine operated on biodiesel with exhaust gas
recirculation”. E-ISSN 0976-3945 IJAET/Vol.II/ Issue II/April-June, 2011/202-208.
[7] Abd-Alla.G.H, “ Using exhaust gas recirculation in internal combustion engines: a
review”. Energy Conversion and Management. 2002, 43, 1027–1042.
[8] D. Agarwal, S. Sinha, A. K. Agarwal, “Experimental investigation of control of
NOx emissions in biodiesel – fueled compression ignition engine”. Renewable
Energy, Vol. 31, 2006, 2356-2369.
40
[9] K. Santoh, L. Zhang, H. Hatanaka, T. Takatsuki, K. Yokoto, “Relationship
between NOx and SM emissions from DI diesel engine with EGR”. Society of
Automotive engineers of Japan,Vol.18, 1997, 369-375.
[10] V. Pradeep, R. P. Sharma, “Use of HOT EGR for NOx control in a compression
ignition engine fuelled with bio- diesel from Jatropha oil”. Renewable Energy, Vol.
32, 2007, 1136-1154.
[11].Prof. Dr. Eng. Dan Scarpete University “Dunarea de Jos” of Galati,
“Romania.Diesel-water emulsion, an alternative fuel to reduce diesel engine
emissions. A review”. Machines, Technologies, Materials, ISSN 1313-0226.
[12] Yoshimoto, Y., et al., “Reduction of NOx, smoke and BSFC in a Diesel engine
Fueled by Biodiesel Emulsion with Used Frying Oil”. SAE paper 1999-01-3598,1999.
[13] Kweonha Park, Inseok Kwak, Seungmook Oh. 2004, “The effect of water
emulsified fuel on a motorway-bus diesel engine”. KSME International Journal. 18:
2049- 2057.
[14] Samec, N., B. Kegl, and R.W. Dibble, “Numerical and experimental study of
water/oil emulsified fuel combustion in a diesel engine”. Fuel, Volume 81, Issue 16,
2002, Pages 2035-2044.
[15] Kannan, K., M. Udayakumar, “NOx and HC emission control using water
emulsified diesel in single cylinder diesel engine”. ARPN Journal of Engineering and
Applied Sciences. Vol.4, No. 8, 2009.
[16] Sathiyamoorthi.R and Sankaranarayanan.G, “Experimental Investigation of
Performance, Combustion and Emission characteristics of neat Lemongrass oil in DI
Diesel engine”. International Journal of Current Engineering and Technology ISSN
2277 - 4106
41