Embed Size (px)
Citation preview

Findings From the Second-Grade Rounds of the Early Childhood Longitudinal Study, Kindergarten Class of 2010–11 (ECLS-K:2011)
First Look
May 2015
Gail M. Mulligan and Jill Carlivati McCarroll National Center for Education Statistics Kristin Denton Flanagan and Daniel Potter American Institutes for Research
Gail Mulligan Project Officer National Center for Education Statistics NCES 2015-077
U.S. DEPARTMENT OF EDUCATION

U.S. Department of Education
Arne Duncan
Secretary
Institute of Education Sciences
Sue Betka
Acting Director
National Center for Education Statistics
Peggy G. Carr
Acting Commissioner
The National Center for Education Statistics (NCES) is the primary federal entity for collecting, analyzing, and
reporting data related to education in the United States and other nations. It fulfills a congressional mandate to
collect, collate, analyze, and report full and complete statistics on the condition of education in the United States;
conduct and publish reports and specialized analyses of the meaning and significance of such statistics; assist state
and local education agencies in improving their statistical systems; and review and report on education activities in
foreign countries.
NCES activities are designed to address high-priority education data needs; provide consistent, reliable, complete,
and accurate indicators of education status and trends; and report timely, useful, and high-quality data to the U.S.
Department of Education, the Congress, the states, other education policymakers, practitioners, data users, and the
general public. Unless specifically noted all information contained herein is in the public domain.
We strive to make our products available in a variety of formats and in language that is appropriate to a variety of
audiences. You, as our customer, are the best judge of our success in communicating information effectively. If you
have any comments or suggestions about this or any other NCES product or report, we would like to hear from you.
Please direct your comments to
NCES, IES, U.S. Department of Education
1990 K Street NW
Washington, DC 20006-5651
May 2015
The NCES Home Page address is http://nces.ed.gov.
The NCES Publications and Products address is http://nces.ed.gov/pubsearch.
This publication is only available online. To download, view, and print the report as a PDF file, go to the NCES
Publications and Products address shown above.
This report was prepared in part under Contract No. ED-IES-12-D-0002 with the American Institutes for Research.
Mention of trade names, commercial products, or organizations does not imply endorsement by the U.S.
Government.
Suggested Citation
Mulligan, G.M., McCarroll, J.C., Flanagan, K.D., and Potter, D. (2015). Findings From the Second-Grade Rounds
of the Early Childhood Longitudinal Study, Kindergarten Class of 2012–11 (ECLS-K:2011) (NCES 2015-077). U.S.
Department of Education, Washington, DC: National Center for Education Statistics. Retrieved [date] from
http://nces.ed.gov/pubsearch.
Content Contact
Gail M. Mulligan
(202) 502-7491

iii
Acknowledgments
We wish to thank the parents and children participating in the ECLS-K:2011 for their cooperation, time, and willingness to provide information about themselves and their families. We also would like to thank the teachers and administrators of the schools we visited across the United States for allowing us to work with their students and parents and for providing us with information about their students and schools. We are especially appreciative of the assistance we received from the chief state school officers, district superintendents and staff, and private school officials who helped enable us to conduct the study in their schools. We also wish to acknowledge the support that we have received from the Administration on Children, Youth, and Families, U.S. Department of Health and Human Services; the Economic Research Service, U.S. Department of Agriculture; the National Institute on Deafness and Other Communication Disorders, National Institutes of Health, U.S. Department of Health and Human Services; and the U.S. Department of Education’s Office of Special Education and Rehabilitative Services, Office of English Language Acquisition, and National Center for Special Education Research in the Institute of Education Sciences. A special thank-you to Kendra Chandler Webb who, at age 9, designed the ECLS logo in 1994.

iv
Contents
Page Acknowledgments .................................................................................................................................................................................... iii List of Tables ............................................................................................................................................................................................... v Introduction ................................................................................................................................................................................................. 1 Selected Findings ....................................................................................................................................................................................... 2 References .................................................................................................................................................................................................... 7 Appendix A. Survey Methodology and Glossary .......................................................................................................................... 8 Appendix B. Standard Error Tables .................................................................................................................................................. 17

v
List of Tables
Table Page 1. Percentage distribution of children who were in kindergarten for the first time in the 2010–11
school year and in second grade in the 2012–13 school year, by child and family characteristics: School year 2012–13 .......................................................................................................................... 3
2. Mean second-grade reading scale scores for children who were in kindergarten for the first
time in the 2010–11 school year and in second grade in the 2012–13 school year, by child and family characteristics: School year 2012–13 ............................................................................................................ 4
3. Mean second-grade mathematics scale scores for children who were in kindergarten for the
first time in the 2010–11 school year and in second grade in the 2012–13 school year, by child and family characteristics: School year 2012–13 ................................................................................................... 5
4. Mean second-grade science scale scores for children who were in kindergarten for the first
time in the 2010–11 school year and in second grade in the 2012–13 school year, by child and family characteristics: School year 2012–13 ............................................................................................................ 6
B-1.
Standard errors for Table 1: Percentage distribution of children who were in kindergarten for the first time in the 2010–11 school year and in second grade in the 2012–13 school year, by child and family characteristics: School year 2012–13 ....................................................................................... ...... 18
B-2. Standard errors for Table 2: Mean second-grade reading scale scores for children who were in
kindergarten for the first time in the 2010–11 school year and in second grade in the 2012–13 school year, by child and family characteristics: School year 2012–13 ....................................................... ...... 19
B-3. Standard errors for Table 3: Mean second-grade mathematics scale scores for children who
were in kindergarten for the first time in the 2010–11 school year and in second grade in the 2012–13 school year, by child and family characteristics: School year 2012–13 ................................... 20
B-4. Standard errors for Table 4: Mean second-grade science scale scores for children who were in
kindergarten for the first time in the 2010–11 school year and in second grade in the 2012–13 school year, by child and family characteristics: School year 2012–13 ....................................................... 21

Introduction
The Early Childhood Longitudinal Study, Kindergarten Class of 2010–11 (ECLS-K:2011), is collecting information about the early educational experiences of a nationally representative sample of children who were in kindergarten or who were of kindergarten age in ungraded classrooms or schools in the 2010–11 school year. The data collection began in the 2010–11 school year, when the children in the sample were in kindergarten, and will continue through the spring of 2016, when most of the children in the sample are expected to be in fifth grade. This brief report provides information from data collections conducted in the 2012–13 school year, when the majority of the students were in second grade. The ECLS-K:2011 provides information on students’ status at school entry, on their transition into school, and on their progression through the elementary grades. The longitudinal nature of the ECLS-K:2011 data enables researchers to study how a wide range of family, school, community, and individual factors are associated with educational, socioemotional, and physical development over time. Information is being collected from the students, their parents and guardians, their teachers, and their school administrators. Information was also collected from their before- and after-school care providers in the kindergarten year. The ECLS-K:2011 is the third in a series of longitudinal studies of young children conducted by the National Center for Education Statistics (NCES), within the U.S. Department of Education’s Institute of Education Sciences. The other studies in the Early Childhood Longitudinal Study (ECLS) program are the Early Childhood Longitudinal Study, Kindergarten Class of 1998–99 (ECLS-K) and the Early Childhood Longitudinal Study, Birth Cohort (ECLS-B). This report is intended to provide a snapshot of the children in the ECLS-K:2011 cohort who were in kindergarten for the first time in the 2010–11 school year and in second grade 2 years later during the 2012–13 school year.1 Information is presented on selected child and family characteristics, such as poverty status, parental education, family type, and primary home language (table 1), obtained when the children were in kindergarten. Information is also provided on the children’s knowledge and skills in reading (table 2), math (table 3), and science (table 4) in the fall and spring of second grade, both overall and by the selected kindergarten-year child and family characteristics. For brevity, the selected findings focus on achievement in the spring of the children’s second-grade year. Readers are cautioned not to draw causal inferences based on the results presented in this report. Although many of the characteristics examined may be related to one another, the complex interactions and relationships among them were not explored. It should also be noted that the variables examined here are just a few of the several thousand that can be examined in the ECLS-K:2011 data. The selected findings present examples of the estimates that can be obtained from the data and are not designed to emphasize any particular issue. All comparisons made in the text were tested for statistical significance to ensure that differences are larger than might be expected due to sampling variation. All differences reported are statistically significant at the p < .05 level and are at least one-fifth of a standard deviation in size. Adjustments were not made for multiple comparisons. Appendix A provides technical documentation for the estimates presented in this report, a glossary describing the variables, and general information about the study. Appendix B reports the standard errors for the estimates. Additional information about the study can be found online at http://nces.ed.gov/ecls/kindergarten2011.asp.
1 About 90 percent of children enrolled in kindergarten in 2010–11 were in kindergarten for the first time and were in second grade in 2012–13. The remaining 10 percent includes children who were repeating kindergarten in 2010–11 or who were not in second grade in 2012–13, including children who were advanced to a grade higher than second or who were in an ungraded classroom or setting in 2012–13.
1

Selected Findings
Below are selected findings for children who were first-time kindergartners in the 2010–11 school year and in second grade in the 2012–13 school year:
Child and Family Characteristics (table 1)
Approximately 88 percent were 5 years old (60 to 71 months) when they entered kindergarten for the first time, about 9 percent were age 6 or older (72 months or older), and approximately 3 percent were younger than age 5 (less than 60 months).
Approximately 24 percent lived in households with incomes below the federal poverty level in their kindergarten year.
About 8 percent had parents whose highest level of education was less than a high school credential; about 23 percent had parents with a high school diploma or an alternative credential; about 34 percent had parents whose highest level of education was some college, an associate's degree, or career/technical education; and about 35 percent had parents whose highest level of education was a bachelor’s degree or higher.
Reading, Math, and Science Knowledge and Skills in the Spring of Second Grade (tables 2, 3, and 4)
No significant differences by age of entry into kindergarten were detected for children’s reading knowledge and skills in the spring of second grade (table 2). However, children who were 66 to 71 months old when they entered kindergarten had higher average math scores than those who were younger than 60 months old at kindergarten entry (table 3) and higher average science scores than those in the two youngest age groups (60 to 65 months and less than 60 months old) (table 4).
In reading, math, and science, White students, Asian students, and students of two or more races had higher average scores in the spring of second grade than did either Black students or Hispanic students (tables 2, 3, and 4).2 In math, Hispanic students had higher average scores on the spring assessment than did Black students (table 3).
Spring second-grade scores in reading, math, and science differed across the three income groups examined (tables 2, 3, and 4). Scores were lowest for students in households with incomes below the federal poverty level and highest for students in households with incomes at or above 200 percent of the federal poverty level.
In reading, math, and science, assessment scores in the spring of second grade increased with parental education (tables 2, 3, and 4), with one exception. In math, no significant difference was detected between children whose parents’ highest level of education was a high school diploma or alternative credential and children whose parents’ highest level of education was less than a high school credential (table 3).
Assessment scores in the spring of second grade varied by family type, with students in two-parent households scoring higher in reading, math, and science than students in single-parent and other parent-type households (tables 2, 3, and 4).
Students with a primary home language of English scored higher in reading, math, and science in the spring of second grade than did students with a non-English primary home language (tables 2, 3, and 4). In reading and science, students with a primary home language of English scored higher than students with multiple home languages (tables 2 and 4).
2 Note that persons of Hispanic or Latino background are included in the Hispanic category, regardless of their race; the other race/ethnicity categories exclude persons of Hispanic or Latino background.
2

Table 1.
Percent
100.0
50.4
49.6
3.5
42.0
45.8
8.7
54.0
12.8
23.3
4.3
‡
1.5
4.0
24.1
23.0
52.9
7.9
23.0
34.3
18.5
16.3
77.7
20.5
1.9
14.1
84.6
1.3
Some college, associate's degree, or career/technical education
Bachelor's degree
Graduate/professional school
Black, non-Hispanic
Hispanic
Asian, non-Hispanic
Native Hawaiian or Other Pacific Islander, non-Hispanic
American Indian or Alaska Native, non-Hispanic
Income at or above 200 percent of the federal poverty level
Parents' highest level of education, 2010–11 kindergarten year
Less than high school credential
High school diploma or alternative credential
Percentage distribution of children who were in kindergarten for the first time in the 2010–11 school year
and in second grade in the 2012–13 school year, by child and family characteristics: School year 2012–13
Characteristics
72 months or older
Child's race/ethnicity1
66 months to 71 months
Total
Sex
Male
Female
Age at kindergarten entry
Less than 60 months
60 months to 65 months
White, non-Hispanic
Poverty status, spring 20112
Two or more races, non-Hispanic
‡ Reporting standards not met.1 Black, non-Hispanic includes African American. Hispanic includes Latino.
2 Poverty status is based on preliminary U.S. Census thresholds for 2010, which identify incomes determined to meet household needs, given the household size. For example,
in 2010 a family of two was below the poverty threshold if its income was lower than $14,220.3
“Two parents” includes two biological parents, two adoptive parents, and one biological/adoptive parent and one other parent/partner. “One parent” refers to one biological or
adoptive parent only. “Other” refers to related and/or unrelated guardians.
NOTE: Estimates pertain to those children who were in kindergarten for the first time in 2010–11 and in second grade in the 2012–13 school year. Estimates weighted by
W6CF6P_2A0. Detail may not sum to total due to rounding and/or missing data.
SOURCE: U.S. Department of Education, National Center for Education Statistics, Early Childhood Longitudinal Study, Kindergarten Class of 2010–11 (ECLS-K:2011),
Kindergarten-Second Grade Restricted-Use Data File.
English
Multiple home languages, no primary language specified
Two parents
One parent
Other
Primary home language, 2010–11 kindergarten year
Not English
Family type, fall 20103
Income below 100 percent of the federal poverty level
Income between 100 and 199 percent of the federal poverty level
3

Table 2.
Fall 2012 Spring 2013
90.5 97.7
89.7 97.0
91.4 98.5
89.2 96.3
89.7 97.2
91.5 98.4
90.3 97.1
93.0 100.0
86.7 94.3
85.8 93.4
94.4 101.1
‡ ‡
87.4 94.4
93.9 100.3
84.4 92.0
89.4 96.7
94.4 101.3
83.2 90.7
86.4 93.9
89.6 97.2
94.6 101.2
97.4 103.9
92.0 99.0
87.3 94.6
86.3 93.8
84.0 92.1
91.7 98.7
87.1 95.0
Two parents
One parent
Less than 60 months
60 months to 65 months
Poverty status, spring 20112
72 months or older
Child's race/ethnicity1
White, non-Hispanic
Black, non-Hispanic
Hispanic
Asian, non-Hispanic
Native Hawaiian or Other Pacific Islander, non-Hispanic
American Indian or Alaska Native, non-Hispanic
Two or more races, non-Hispanic
Graduate/professional school
Mean second-grade reading scale scores for children who were in kindergarten for the first time in the
2010–11 school year and in second grade in the 2012–13 school year, by child and family characteristics:
School year 2012–13
Characteristics
Total
Sex
‡ Reporting standards not met.1 Black, non-Hispanic includes African American. Hispanic includes Latino.
2 Poverty status is based on preliminary U.S. Census thresholds for 2010, which identify incomes determined to meet household needs, given the household size. For example, in
2010 a family of two was below the poverty threshold if its income was lower than $14,220.3 “Two parents” includes two biological parents, two adoptive parents, and one biological/adoptive parent and one other parent/partner. “One parent” refers to one biological or
adoptive parent only. “Other” refers to related and/or unrelated guardians.
NOTE: Estimates pertain to those children who were in kindergarten for the first time in 2010–11 and in second grade in the 2012–13 school year. Estimates weighted by
W6CF6P_2A0. The possible range of scores was 0 to 120. The actual range of scores for these children in fall 2012 was 49.6 to 116.4; when weighted by W6CF6P_2A, the
scores have a mean of 90.5 and a standard deviation of 12.53. The actual range of scores for these children in spring 2013 was 52.0 to 116.4; when weighted by W6CF6P_2A, the
scores have a mean of 97.7 and a standard deviation of 10.80. Detail may not sum to total due to rounding and/or missing data.
SOURCE: U.S. Department of Education, National Center for Education Statistics, Early Childhood Longitudinal Study, Kindergarten Class of 2010–11 (ECLS-K:2011),
Kindergarten-Second Grade Restricted-Use Data File.
Male
66 months to 71 months
Female
Age at kindergarten entry
Family type, fall 20103
Income below 100 percent of the federal poverty level
Income between 100 and 199 percent of the federal poverty level
Income at or above 200 percent of the federal poverty level
Parents' highest level of education, 2010–11 kindergarten year
Less than high school credential
High school diploma or alternative credential
Some college, associate's degree, or career/technical education
Bachelor's degree
Other
English
Multiple home languages, no primary language specified
Primary home language, 2010–11 kindergarten year
Not English
4
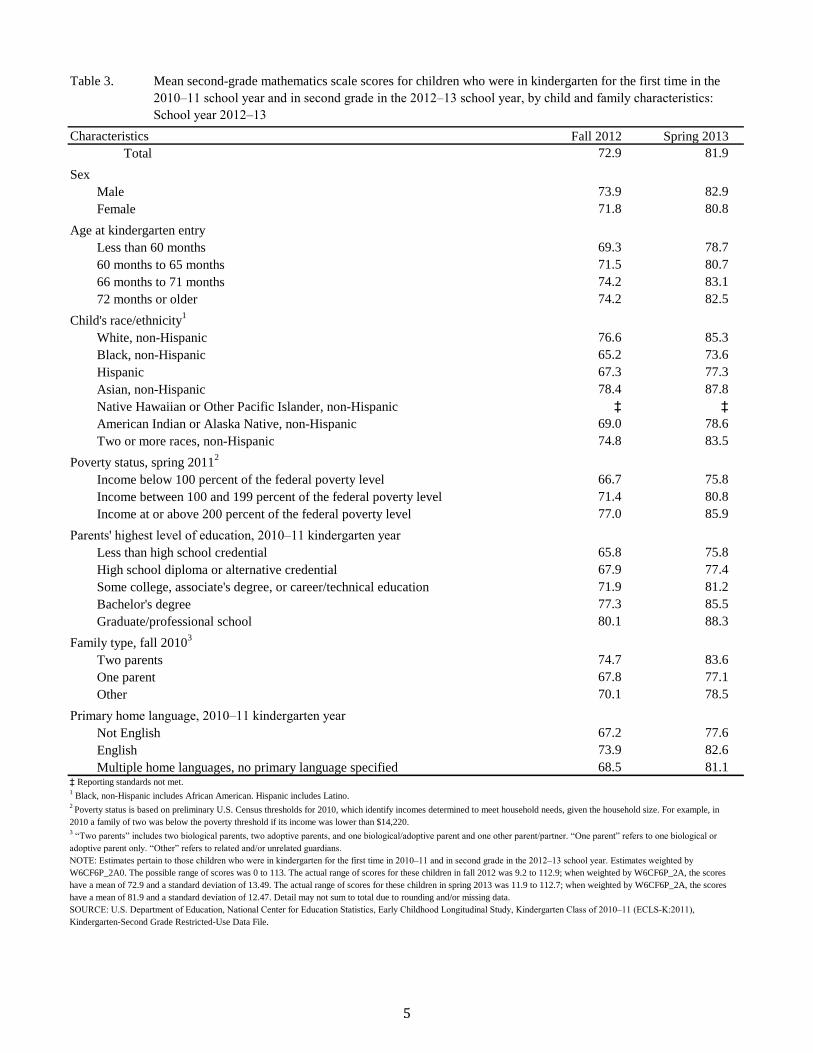
Table 3.
Fall 2012 Spring 2013
72.9 81.9
73.9 82.9
71.8 80.8
69.3 78.7
71.5 80.7
74.2 83.1
74.2 82.5
76.6 85.3
65.2 73.6
67.3 77.3
78.4 87.8
‡ ‡
69.0 78.6
74.8 83.5
66.7 75.8
71.4 80.8
77.0 85.9
65.8 75.8
67.9 77.4
71.9 81.2
77.3 85.5
80.1 88.3
74.7 83.6
67.8 77.1
70.1 78.5
67.2 77.6
73.9 82.6
68.5 81.1
One parent
Other
Black, non-Hispanic
Hispanic
Asian, non-Hispanic
Native Hawaiian or Other Pacific Islander, non-Hispanic
American Indian or Alaska Native, non-Hispanic
Graduate/professional school
Mean second-grade mathematics scale scores for children who were in kindergarten for the first time in the
2010–11 school year and in second grade in the 2012–13 school year, by child and family characteristics:
School year 2012–13
Characteristics
72 months or older
Child's race/ethnicity1
66 months to 71 months
Total
Sex
Male
Female
Age at kindergarten entry
Less than 60 months
60 months to 65 months
‡ Reporting standards not met.1 Black, non-Hispanic includes African American. Hispanic includes Latino.
2 Poverty status is based on preliminary U.S. Census thresholds for 2010, which identify incomes determined to meet household needs, given the household size. For example, in
2010 a family of two was below the poverty threshold if its income was lower than $14,220.3 “Two parents” includes two biological parents, two adoptive parents, and one biological/adoptive parent and one other parent/partner. “One parent” refers to one biological or
adoptive parent only. “Other” refers to related and/or unrelated guardians.
NOTE: Estimates pertain to those children who were in kindergarten for the first time in 2010–11 and in second grade in the 2012–13 school year. Estimates weighted by
W6CF6P_2A0. The possible range of scores was 0 to 113. The actual range of scores for these children in fall 2012 was 9.2 to 112.9; when weighted by W6CF6P_2A, the scores
have a mean of 72.9 and a standard deviation of 13.49. The actual range of scores for these children in spring 2013 was 11.9 to 112.7; when weighted by W6CF6P_2A, the scores
have a mean of 81.9 and a standard deviation of 12.47. Detail may not sum to total due to rounding and/or missing data.
SOURCE: U.S. Department of Education, National Center for Education Statistics, Early Childhood Longitudinal Study, Kindergarten Class of 2010–11 (ECLS-K:2011),
Kindergarten-Second Grade Restricted-Use Data File.
White, non-Hispanic
Poverty status, spring 20112
Two or more races, non-Hispanic
Two parents
Family type, fall 20103
Income below 100 percent of the federal poverty level
Income between 100 and 199 percent of the federal poverty level
Income at or above 200 percent of the federal poverty level
Parents' highest level of education, 2010–11 kindergarten year
Less than high school credential
High school diploma or alternative credential
Some college, associate's degree, or career/technical education
Bachelor's degree
English
Multiple home languages, no primary language specified
Primary home language, 2010–11 kindergarten year
Not English
5

Table 4.
Fall 2012 Spring 2013
39.8 44.1
40.3 44.5
39.3 43.8
37.4 41.3
38.5 43.2
41.0 45.1
40.9 44.7
42.7 46.6
35.9 40.3
35.0 40.0
39.8 45.6
‡ ‡
38.8 42.6
42.2 46.1
35.3 39.8
38.8 43.6
42.9 46.7
33.0 38.2
36.8 41.5
39.5 44.0
42.8 46.6
44.7 48.2
40.7 45.0
37.6 41.8
39.3 41.9
33.2 39.1
41.0 45.0
36.1 41.3
Two parents
One parent
Less than 60 months
60 months to 65 months
Poverty status, spring 20112
72 months or older
Child's race/ethnicity1
White, non-Hispanic
Black, non-Hispanic
Hispanic
Asian, non-Hispanic
Native Hawaiian or Other Pacific Islander, non-Hispanic
American Indian or Alaska Native, non-Hispanic
Two or more races, non-Hispanic
Graduate/professional school
Mean second-grade science scale scores for children who were in kindergarten for the first time in the
2010–11 school year and in second grade in the 2012–13 school year, by child and family characteristics:
School year 2012–13
Characteristics
Total
Sex
‡ Reporting standards not met.1 Black, non-Hispanic includes African American. Hispanic includes Latino.
2 Poverty status is based on preliminary U.S. Census thresholds for 2010, which identify incomes determined to meet household needs, given the household size. For example, in
2010 a family of two was below the poverty threshold if its income was lower than $14,220.3 “Two parents” includes two biological parents, two adoptive parents, and one biological/adoptive parent and one other parent/partner. “One parent” refers to one biological or
adoptive parent only. “Other” refers to related and/or unrelated guardians.
NOTE: Estimates pertain to those children who were in kindergarten for the first time in 2010–11 and in second grade in the 2012–13 school year. Estimates weighted by
W6CF6P_2A0. The possible range of scores was 0 to 64. The actual range of scores for these children in fall 2012 was 9.4 to 56.3; when weighted by W6CF6P_2A, the scores
have a mean of 39.8 and a standard deviation of 8.49. The actual range of scores for these children in spring 2013 was 9.5 to 59.0; when weighted by W6CF6P_2A, the scores
have a mean of 44.1 and a standard deviation of 7.67. Detail may not sum to total due to rounding and/or missing data.
SOURCE: U.S. Department of Education, National Center for Education Statistics, Early Childhood Longitudinal Study, Kindergarten Class of 2010–11 (ECLS-K:2011),
Kindergarten-Second Grade Restricted-Use Data File.
Male
66 months to 71 months
Female
Age at kindergarten entry
Family type, fall 20103
Income below 100 percent of the federal poverty level
Income between 100 and 199 percent of the federal poverty level
Income at or above 200 percent of the federal poverty level
Parents' highest level of education, 2010–11 kindergarten year
Less than high school credential
High school diploma or alternative credential
Some college, associate's degree, or career/technical education
Bachelor's degree
Other
English
Multiple home languages, no primary language specified
Primary home language, 2010–11 kindergarten year
Not English
6

References
Tourangeau, K., Nord, C., Lê, T., Wallner-Allen, K., Hagedorn, M.C., Leggitt, J., and Najarian, M. (2015). Early Childhood Longitudinal Study, Kindergarten Class of 2010–11 (ECLS-K:2011), User’s Manual for the ECLS-K:2011 Kindergarten–Second Grade Data File and Electronic Codebook (NCES 2015-050). U.S. Department of Education. Washington, DC: National Center for Education Statistics. Tourangeau, K., Nord, C., Lê, T., Wallner-Allen, K., Hagedorn, M.C., Leggitt, J., and Najarian, M. (2014). Early Childhood Longitudinal Study, Kindergarten Class of 2010–11 (ECLS-K:2011), User’s Manual for the ECLS-K:2011 Kindergarten–First Grade Data File and Electronic Codebook (NCES 2015-069). U.S. Department of Education. Washington, DC: National Center for Education Statistics. Tourangeau, K., Nord, C., Lê, T., Sorongon, A.G., Hagedorn, M.C., Daly, P., and Najarian, M. (2013). Early Childhood Longitudinal Study, Kindergarten Class of 2010–11 (ECLS-K:2011), User’s Manual for the ECLS-K:2011 Kindergarten Data File and Electronic Codebook (NCES 2013-061). U.S. Department of Education. Washington, DC: National Center for Education Statistics.
7

Appendix A. Survey Methodology and Glossary
Survey Overview and Methodology The Early Childhood Longitudinal Study, Kindergarten Class of 2010–11 (ECLS-K:2011), is sponsored by the National Center for Education Statistics (NCES), within the U.S. Department of Education’s Institute of Education Sciences, to provide detailed information on the school achievement and experiences of students throughout their elementary school years. Westat, Inc., assisted with the design of the study and collected the data upon which this report is based. The students participating in the ECLS-K:2011 are being followed longitudinally from kindergarten (the 2010–11 school year) through the spring of 2016, when most are expected to be in fifth grade. This sample of students is designed to be nationally representative of all students who were enrolled in kindergarten or who were of kindergarten age and being educated in an ungraded classroom or school in the United States in the 2010–11 school year, including those in public and private schools,1 those who attended full-day and part-day programs, those who were in kindergarten for the first time, and those who were kindergarten repeaters. The ECLS-K:2011 places an emphasis on measuring students’ experiences within multiple contexts and development in multiple domains, including cognitive, socioemotional, and physical development. The study is designed to collect information from students as well as from their parents and guardians, teachers, schools, and before- and after-school care providers. The estimates in this First Look report are based on the data collected from students, in the form of direct assessments in reading, mathematics, and science, and on information collected from the students’ parents or guardians during the kindergarten parent interview. The estimates pertain only to those children who attended kindergarten for the first time in the 2010–11 school year and who were in second grade in the 2012–13 school year. About 90 percent of children enrolled in kindergarten in 2010–11 were in kindergarten for the first time and were in second grade in 2012–13. The remaining 10 percent includes children who were repeating kindergarten in 2010–11 or who were not in second grade in 2012–13, including children who were advanced to a grade higher than second or who were in an ungraded classroom or setting in 2012–13. Sample Design A nationally representative sample of approximately 18,170 children from about 1,310 schools2 participated in the base-year administration of the ECLS-K:2011 in the 2010–11 school year. The sample included children from different racial/ethnic and socioeconomic backgrounds. The ECLS-K:2011 cohort was sampled using a multistage sampling design. In the first stage, 90 primary sampling units (PSUs) were selected from a national sample of PSUs. The PSUs were counties and county groups. In the second stage, public and private schools educating kindergartners (or ungraded schools educating children of kindergarten age) were selected within the PSUs. Finally, students were sampled from the selected schools. The schools were selected from a preliminary version of the frame developed for the 2010 National Assessment of Educational Progress (NAEP), which contained information about public schools that were included in the 2006–07 Common Core of Data Public Elementary/Secondary School Universe Survey and private schools that were included in the 2007–08 Private School Universe Survey. The NAEP frame had not yet been updated and, therefore, was not final at the time it was obtained for use in the ECLS-K:2011. For this reason, a supplemental frame of newly opened schools and kindergarten programs was developed in the spring of 2010, and a supplemental sample of schools selected from that frame was added to the main sample of study schools. In the third stage of sampling, approximately 23 kindergartners were
1 Students who attended early learning centers or institutions that offered education only through kindergarten are also included in the study sample and represented in the cohort. 2 This number includes both schools that were part of the original sample of schools selected for the study (approximately 970) and schools to which children transferred during the base year of the study (approximately 340).
8

selected from a list of all enrolled kindergartners (or students of kindergarten age being educated in an ungraded classroom) in each of the sampled schools.
Data Collection Fall and spring data collections were conducted in the 2010–11 school year, when all study children were in kindergarten; in the 2011–12 school year, when most study children were in first grade; and in the 2012–13 school year, when most study children were in second grade. This report features the data collected in 2012–13. The fall second-grade data collection included base-year respondents—those students who had a completed assessment or a completed parent interview in at least one of the two rounds of the kindergarten data collection—who attended schools within a subsample of 30 PSUs during their kindergarten year. This is the same subgroup of students who were included in the fall first-grade data collection. The spring second-grade data collection included base-year respondents who attended schools within all 90 sampled PSUs. Due to the increased data collection costs associated with following students who transferred from their original sample school, in each round of data collection only a subsample of these students were followed into their new schools. About 4,740 children from about 890 schools participated in the fall second-grade data collection, and about 13,850 children from about 2,330 schools participated in the spring second-grade data collection. For more information on the sample design and sampling procedures, refer to the Early Childhood Longitudinal Study, Kindergarten Class of 2010–11 (ECLS-K:2011), User’s Manual for the ECLS-K:2011 Kindergarten Data File and Electronic Codebook (Tourangeau et al. 2013), the Early Childhood Longitudinal Study, Kindergarten Class of 2010–11 (ECLS-K:2011), User’s Manual for the ECLS-K:2011 Kindergarten–First Grade Data File and Electronic Codebook (Tourangeau et al. 2014), and the Early Childhood Longitudinal Study, Kindergarten Class of 2010–11 (ECLS-K:2011), User’s Manual for the ECLS-K:2011 Kindergarten–Second Grade Data File and Electronic Codebook (Tourangeau et al. 2015). The fall second-grade direct child assessments were conducted from August through December of 2012. About 78 percent of the assessments were completed by the end of October, with about 97 percent completed by the end of November. The spring second-grade direct child assessments were conducted from March through June of 2013. Approximately 63 percent of the assessments were completed by the end of April, with about 98 percent completed by the end of May. Information on the child and family characteristics used in this report (children’s race/ethnicity, household poverty status, parents’ highest level of education, family type, and primary home language) was collected through interviews with parents in the children’s kindergarten year. Most parent interviews were conducted by telephone; however, they were conducted in person for parents who were unreachable by telephone or who preferred an in-person interview. The respondent to the parent interview was usually a parent or guardian in the household who identified himself or herself as the person who knew the most about the child’s care, education, and health. The parent interview was fully translated into Spanish before data collection began and could be administered by bilingual interviewers if parent respondents preferred to speak in Spanish. Because it was cost prohibitive to do so, the parent interview was not translated into other languages. However, interviews could be completed with parents who spoke other languages by using an interpreter who translated from the English during the interview.
Response Rates The weighted child assessment unit response rates3 were 87.0 percent for the fall kindergarten data collection, 85.2 percent for the spring kindergarten data collection, 84.0 percent for the fall second-grade data
3 The weighted unit response rates for the child assessment and parent interview were calculated using the student base weight, which is the product of the school base weight and the within-school student weight.
9

collection, and 83.4 percent for the spring second-grade data collection. The weighted parent unit response rates were 74.2 percent for the fall kindergarten data collection and 67.1 percent for the spring kindergarten data collection. The overall response rates for the child assessment, which take into account the base-year school-level response rate (62.7 percent), were 54.8 percent for the fall kindergarten data collection, 53.4 percent for the spring kindergarten data collection, 52.7 percent for the fall second-grade data collection, and 52.3 percent for the spring second-grade data collection. The overall response rates for the kindergarten parent interviews, which also take into account school-level response, were 46.7 percent for the fall kindergarten data collection and 42.1 percent for the spring kindergarten data collection. A nonresponse bias analysis was conducted to determine if substantial bias was introduced as a result of nonresponse. To examine the effect of school nonresponse, estimates from the ECLS-K:2011 schools were compared to those produced using frame data (i.e., data from the Common Core of Data and the Private School Universe Survey). The differences in the two sets of estimates are very small, suggesting there is not significant nonresponse bias present in the data. To examine the effect of nonresponse for data collected through instruments that have a response rate lower than 85 percent, in this case the kindergarten parent interviews and the second-grade child assessment, estimates produced using weights that include adjustments for nonresponse were compared to estimates produced using weights without nonresponse adjustments. Additionally, for the parent interview data, estimates from the ECLS-K:2011 were compared to those from other data sources (for example, the National Household Education Surveys Program). The results of these nonresponse bias analyses also suggest that there is not a substantial bias due to nonresponse after adjusting for that nonresponse. For more information on the nonresponse bias analyses, refer to the Early Childhood Longitudinal Study, Kindergarten Class of 2010–11 (ECLS-K:2011), User’s Manual for the ECLS-K:2011 Kindergarten Data File and Electronic Codebook (Tourangeau et al. 2013) and the Early Childhood Longitudinal Study, Kindergarten Class of 2010–11 (ECLS-K:2011), User’s Manual for the ECLS-K:2011 Kindergarten–Second Grade Data File and Electronic Codebook (Tourangeau et al. 2015). The item missing rate for the variables in the analytic sample used in this report is generally low (less than 1 percent). The exceptions were poverty status in the spring of kindergarten, which has an item missing rate of 13 percent, and family type in the fall of kindergarten, which has an item missing rate of 8 percent. The item-level missing rates for parents’ highest level of education were 2 percent for the first parent identified in the household and 3 percent for the second parent identified in the household. Even though the item-level nonresponse rate was relatively low, missing parent education data were imputed. This was done because parent education and other variables were used to create a measure of household socioeconomic status that is provided in the data file. More information on item-level missing data and hot-deck imputation can be found in the Early Childhood Longitudinal Study, Kindergarten Class of 2010–11 (ECLS-K:2011), User’s Manual for the ECLS-K:2011 Kindergarten Data File and Electronic Codebook (Tourangeau et al. 2013) and the Early Childhood Longitudinal Study, Kindergarten Class of 2010–11 (ECLS-K:2011), User’s Manual for the ECLS-K:2011 Kindergarten–Second Grade Data File and Electronic Codebook (Tourangeau et al. 2015). Data Reliability Estimates produced using data from the ECLS-K:2011 are subject to two types of error: nonsampling and sampling errors. Nonsampling errors are errors made in the collection and processing of data. Sampling errors occur because the data are collected from a sample rather than a census of the population. Nonsampling Errors Nonsampling error is the term used to describe variations in the estimates that may be caused by population coverage limitations as well as by data collection, processing, and reporting procedures. The sources of nonsampling errors are typically nonresponse, differences in respondents’ interpretations of the meaning of survey questions, response differences related to the particular time when the survey was conducted, and mistakes in data preparation.
10
In general, it is difficult to identify and estimate either the amount of nonsampling error or the bias that it causes. In the ECLS-K:2011, efforts were made to prevent such errors from occurring and to compensate for them where possible (e.g., by field-testing items and assessments, using survey questions that had been tested and used in previous surveys, conducting multiday assessor/interviewer training, holding assessor certification sessions, and monitoring assessor/interviewer performance and field data quality throughout the collection period). Another potential source of nonsampling error is respondent bias, which occurs when respondents systematically misreport (intentionally or unintentionally) information in a study. One potential source of respondent bias is social desirability bias, which can result when respondents provide information they believe is socially desirable or acceptable but that does not accurately reflect the respondents’ characteristics or experiences. An associated error occurs when respondents give unduly positive reports about those close to them. For example, parents may give a better assessment of their children’s reading ability than might be obtained from a direct assessment. If there are no systematic differences among specific groups under study in their tendency to give socially desirable or unduly positive responses, then comparisons of the different groups will provide reasonable measures of relative differences among the groups. The information in this First Look report is based on items from the kindergarten parent interviews and second-grade child assessments. Analysis of potential bias due to item nonresponse is typically conducted for those items with a response rate less than 85 percent. As noted earlier, most of the items used in this report had an item-level missing rate below 1 percent and none had a response rate lower than 85 percent. The child assessment data are not reported out at the item level, so it is not appropriate to discuss item-level nonresponse rates in this regard.
Sampling Errors and Weighting The ECLS-K:2011 data are weighted to compensate for unequal probabilities of selection at each sampling stage and to adjust for the effects of school, teacher, before- and after-school care provider, child, and parent nonresponse. The sample weights used in the ECLS-K:2011 analyses were developed in several stages.4 The first stage of the weighting process assigned weights to the sampled PSUs that are equal to the inverse of their probability of selection. The second stage of the weighting process assigned weights to the schools sampled within the selected PSUs. The base weight for each sampled school is the PSU weight multiplied by the inverse of the probability of the school being selected from the PSU. The base weights of responding schools were adjusted to compensate for nonresponse among the set of eligible schools. These adjustments were made separately for public and private schools. To compute the kindergarten base weight for each student in the sample, the school nonresponse-adjusted weight for the school the student attended was multiplied by the within-school student weight. The within-school student weight was calculated separately for Asian/Pacific Islander (API) students and non-API students to account for the oversampling of API students.5 For API students, the within-school student weight is the total number of API kindergarten students in the school divided by the number of API kindergarten students sampled in the school. For non-API students, the within-school student weight is the total number of non-API kindergarten students in the school divided by the number of non-API kindergarten students sampled in the school. The student-level base weight was then adjusted for nonresponse for different components of the study.
4 The approach used to develop weights for the ECLS-K:2011 is described in the Early Childhood Longitudinal Study, Kindergarten Class of 2010–11 (ECLS-K:2011), User’s Manual for the ECLS-K:2011 Kindergarten Data File and Electronic Codebook (Tourangeau et al. 2013) and the Early Childhood Longitudinal Study, Kindergarten Class of 2010–11 (ECLS-K:2011), User’s Manual for the ECLS-K:2011 Kindergarten–First Grade Data File and Electronic Codebook (Tourangeau et al. 2014). 5 Asians, Native Hawaiians, and Other Pacific Islanders were sampled at a higher rate in order to achieve the minimum sample size required to generate reliable estimates. Although they were oversampled as one group, the numbers of completed interviews for children in the Asian group and children in the Native Hawaiian and Other Pacific Islander group were large enough to produce estimates for each of these two groups separately.
11

The weights developed for use in the analysis of the data collected in second grade are derived from the kindergarten student base weight. The fall second-grade student base weight is the product of the base-year student base weight adjusted for base-year nonresponse and the inverse of the selection probabilities for the PSUs for the fall subsample. The spring second-grade student base weight is the base-year student base weight adjusted for base-year nonresponse. The estimates in this report were weighted by W6CF6P_2A. This weight was computed from the fall second-grade child base weight adjusted for nonresponse to the data collection instruments that are the sources of information featured in this report to minimize bias in the estimates. That is, this weight is adjusted for nonresponse to the parent interview in the fall or spring of kindergarten and for nonresponse to the fall second-grade and the spring second-grade child assessments. In addition to properly weighting the data in this report, special procedures for estimating the statistical significance of the estimates were employed, because the data were collected using a complex sample design. A complex sample design, like that used in the ECLS-K:2011, results in data that violate the assumptions that are normally required to assess the statistical significance of results. Statistical tests of significance from sample surveys require information about standard errors. The standard errors of the estimates from complex sample surveys may vary from those that would be expected if the sample were a simple random sample and the observations were independent and identically distributed random variables. Using the statistical software Stata, the jackknife replication variance estimation method was used to compute approximately unbiased estimates of the standard errors of the estimates in the report.6 Statistical Procedures Comparisons made in the text were tested for statistical significance at the p < .05 level to ensure that the differences were larger than might be expected due to sampling variation. When comparing estimates within categorical groups (e.g., sex, race/ethnicity), Student’s t statistics were calculated. The formula used to compute the t statistic is
)( 21
22
12
SESE
xxt
where x1 and x2 are the estimates being compared and SE1 and SE2 are their corresponding standard errors. With sample sizes as large as that of the ECLS-K:2011, t-scores greater than 1.96 or less than -1.96 are significant at the .05 level of significance. Due to the large sample size, many differences (no matter how substantively minor) are statistically significant. In this report, differences are considered substantively meaningful if they are at least one-fifth of a standard deviation in size. Therefore, only differences that are statistically significant at the p <. 05 level and are at least one-fifth of a standard deviation in size are reported. No adjustments were made for multiple comparisons.
Direct Cognitive Assessments: Reading, Math, and Science In the second-grade data collections, children were assessed in reading, math, and science in both the fall and the spring. The assessments were administered directly to the sampled children on an individual basis by trained and certified child assessors. The longitudinal design of the ECLS-K:2011 requires that the cognitive assessments be developed to support the measurement of change in knowledge and skills demonstrated by children from kindergarten entry through the spring of fifth grade. To that end, the majority of the items included in the second-grade
6 More detail about the jackknife replication variance estimation method is provided in the Early Childhood Longitudinal Study, Kindergarten Class of 2010–11 (ECLS-K:2011), User’s Manual for the ECLS-K:2011 Kindergarten Data File and Electronic Codebook (Tourangeau et al. 2013) and the Early Childhood Longitudinal Study, Kindergarten Class of 2010–11 (ECLS-K:2011), User’s Manual for the ECLS-K:2011 Kindergarten–Second Grade Data File and Electronic Codebook (Tourangeau et al. 2015).
12

assessments had been included in the first-grade assessments. However, to ensure that the assessments adequately measured the knowledge and skills of the children as they progress through school, new, more difficult items were added to the assessments in second grade and the easiest items, reflecting lower level first-grade skills, were omitted. The ECLS-K:2011 reading, math, and science specifications were based on the frameworks developed for the National Assessment of Educational Progress. Although the NAEP assessments are administered starting in fourth grade, the specifications were extrapolated down to lower grades based on current curriculum standards from several states and, for math, the National Council of Teachers of Mathematics Principles and Standards for School Mathematics. The frameworks necessarily cover content strands applicable to a range of content at different grade levels—for example, from number sense (i.e., basic knowledge of numbers) to algebra in mathematics. Content appropriate for most second-graders was included in the assessments used in the fall of 2012 and the spring of 2013. For example, in the math assessment, the “algebra” content strand was assessed with questions asking children to complete patterns involving numbers and patterns involving shapes. While the assessments were designed to contain mostly items that assessed knowledge and skills at a second-grade level, easier and more difficult items were included to measure the abilities of students performing below or above grade level. The reading assessment included questions measuring basic skills (print familiarity, letter recognition, beginning and ending sounds, rhyming words, and word recognition), vocabulary knowledge, and reading comprehension. The reading comprehension questions asked the child to identify information specifically stated in the text (e.g., definitions, facts, supporting details) and to make inferences about the text. The math assessment was designed to measure skills in conceptual knowledge, procedural knowledge, and problem solving. The assessment consisted of questions on number sense, properties, and operations; measurement; geometry and spatial sense; data analysis, statistics, and probability; and patterns, algebra, and functions. The science assessment included questions about physical science, life science, environmental science, and scientific inquiry. Most sampled students participated in the cognitive assessments regardless of disability status or home language; however, there were some exceptions. Students whose Individualized Education Program (IEP) indicated that they should not participate in standardized assessments were excluded from the assessments. Also, students who required an assessment in Braille, students who required a sign language interpreter, and students whose IEP required them to be assessed using large-print materials were excluded from the assessments because the study did not provide these accommodations. Although these exclusions do result in the assessment data not being generalizable to students with these particular needs, this accounts for less than 1 percent of all students. To the greatest extent possible, other necessary accommodations were allowed (for example, allowing a health care aide to be present during the assessment). Unlike the kindergarten and first-grade data collections, a language screener was not used in second grade for children whose home language was not English. By the spring of first grade, nearly all children (99.9 percent) were routed through the assessment in English; therefore, the language screener was not administered beyond the spring of first grade. All children were assessed in English in both the fall and spring of second grade. For the second-grade rounds of data collection, the overall testing time for each child was expected to be approximately 60 minutes, with more time allotted for the reading assessment (30 minutes) than for the mathematics and science assessments (approximately 15 minutes each). The ECLS-K:2011 employed a two-stage assessment in which children were administered a set of items appropriate to their demonstrated ability level rather than all of the items in the assessment. Although this procedure resulted in children being administered different sets of items, there was a subset of items that all children received (the items in the routing tests, plus a set of items common across the different second-stage forms). These common items were used to calculate scores for all children on the same scale. Broad-based scores using the full set of items administered in the kindergarten through second-grade assessments in reading, math, and science were calculated using item response theory (IRT) procedures. IRT is a method for modeling assessment data that makes it possible to calculate an overall score for each domain measured. IRT has several advantages over raw number-right scoring. By using the overall pattern of right
13

and wrong responses and the characteristics of each item to estimate ability, IRT can adjust for the possibility of a low-ability child guessing several difficult items correctly. If answers on several easy items are wrong, the probability of a correct answer on a difficult item would be quite low. Omitted items are also less likely to cause distortion of scores, as long as enough items have been answered to establish a consistent pattern of right and wrong answers. This First Look report presents information on children’s IRT-based overall scale scores in reading, math, and science from the second-grade data collection rounds. The IRT-based overall scale score for each content domain is an estimate of the number of items a child would have answered correctly in each data collection round if he or she had been administered all of the questions that had been included in the assessments for that domain in kindergarten, first grade, and second grade. To calculate the IRT-based overall scale score for each domain, a child’s IRT ability estimate (theta) is used to predict a probability for each assessment item that the child would have gotten that item correct. Then, the probabilities for all of the items fielded as part of the domain in every round are summed to create the overall scale score. Because the computed scale scores are sums of probabilities, the scores are not integers. Glossary: Constructs and Variables Used in the Analyses Reading, Math, and Science Scores Reading [X5RSCALK2, X6RSCALK2]. The possible range of scores was 0 to 120. For this report, estimates pertain to children who entered kindergarten for the first time in the 2010–11 school year and were in second grade in the 2012–13 school year. The actual range of scores for these children in fall 2012 (X5RSCALK2) was 49.6 to 116.4; when weighted by W6CF6P_2A, the scores have a mean of 90.5 and a standard deviation of 12.53. The actual range of scores for these children in spring 2013 (X6RSCALK2) was 52.0 to 116.4; when weighted by W6CF6P_2A, the scores have a mean of 97.7 and a standard deviation of 10.80. Math [X5MSCALK2, X6MSCALK2]. The possible range of scores was 0 to 113. For this report, estimates pertain to children who entered kindergarten for the first time in the 2010–11 school year and were in second grade in the 2012–13 school year. The actual range of scores for these children in fall 2012 (X5MSCALK2) was 9.2 to 112.9; when weighted by W6CF6P_2A, the scores have a mean of 72.9 and a standard deviation of 13.49. The actual range of scores for these children in spring 2013 (X6MSCALK2) was 11.9 to 112.7; when weighted by W6CF6P_2A, the scores have a mean of 81.9 and a standard deviation of 12.47. Science [X5SSCALK2, X6SSCALK2]. The possible range of scores was 0 to 64. For this report, estimates pertain to children who entered kindergarten for the first time in the 2010–11 school year and were in second grade in the 2012–13 school year. The actual range of scores for these children in fall 2012 (X5SSCALK2) was 9.4 to 56.3; when weighted by W6CF6P_2A, the scores have a mean of 39.8 and a standard deviation of 8.49. The actual range of scores for these children in spring 2013 (X6SSCALK2) was 9.5 to 59.0; when weighted by W6CF6P_2A, the scores have a mean of 44.1 and a standard deviation of 7.67. Child and Family Characteristics A number of variables used in this report were derived by combining information from one or more questions in the ECLS-K:2011 study instruments. More information on the derivation of key variables is provided in chapter 7 of the following users manuals: Early Childhood Longitudinal Study, Kindergarten Class of 2010–11 (ECLS-K:2011), User’s Manual for the ECLS-K:2011 Kindergarten Data File and Electronic Codebook (Tourangeau et al. 2013), the Early Childhood Longitudinal Study, Kindergarten Class of 2010–11 (ECLS-K:2011), User’s Manual for the ECLS-K:2011 Kindergarten–First Grade Data File and Electronic Codebook (Tourangeau et al. 2014), and the Early Childhood Longitudinal Study, Kindergarten Class of 2010–11 (ECLS-K:2011), User’s Manual for the ECLS-K:2011 Kindergarten–Second Grade Data File and Electronic Codebook (Tourangeau et al. 2015).
14
Student’s sex [X_CHSEX_R]. Information about child’s sex was collected from schools at the time of sampling and stored in the study’s administrative database (called the field management system, or FMS), collected from parents in the fall kindergarten parent interview, confirmed by parents in the spring kindergarten parent interview, and asked again in later-round interviews if the data were either missing or had never been confirmed by the parent.
Child’s age at kindergarten entry [X1AGEENT]. A composite for the child’s age at kindergarten entry was created using the child’s date of birth and parent reports in the fall of 2010 about whether it was the child’s first, second, or third (or more) year of kindergarten. The child’s age in months was calculated as of September 1, 2010, if the parent reported that it was the child’s first year of kindergarten; as of September 1, 2009, if the parent reported that it was the child’s second year of kindergarten; and as of September 1, 2008, if the parent reported that it was the child’s third or more year of kindergarten. If data were missing for the parent report of the year of kindergarten, the teacher’s report of whether it was the child’s first or second year of kindergarten was used.
Student’s race/ethnicity [X_RACETH_R]. This composite variable, which takes into account both ethnicity and race, is derived from information collected from parents in the parent interview or, if parent-reported information was missing, from the school. Parents provided information during the kindergarten year (2010–11). In the spring of 2012 and the spring of 2013, parents were asked to provide information on child’s ethnicity and race if these data were missing or had not been confirmed by a parent in a prior round.
Parent respondents were asked to indicate whether their child belonged to one or more of the following races: White, Black or African American, American Indian or Alaska Native, Asian, and Native Hawaiian or Other Pacific Islander. In addition, each parent respondent was asked to identify whether his or her child was Hispanic or Latino. Hispanicity and race were used to create eight mutually exclusive categories: White, not Hispanic; Black or African American, not Hispanic; Hispanic, race specified; Hispanic, no race specified; Asian, not Hispanic; Native Hawaiian or Other Pacific Islander, not Hispanic; American Indian or Alaska Native, not Hispanic; and two or more races, not Hispanic.
The data file includes the categories “Hispanic, race specified” and “Hispanic, no race specified” because some parents reported a race for their Hispanic children, while others did not. For this report, these two categories are collapsed into one category indicating that a child is Hispanic. A student is classified as Hispanic if a parent indicated the child’s ethnicity was Hispanic regardless of whether a race was identified and what that race was. When race/ethnicity differences are presented in this report, White refers to White, non-Hispanic; Black refers to Black, non-Hispanic; Asian refers to Asian, non-Hispanic; Native Hawaiian or Other Pacific Islander refers to Native Hawaiian or Other Pacific Islander, non-Hispanic; American Indian or Alaska Native refers to American Indian or Alaska Native, non-Hispanic; and two or more races refers to two or more races, non-Hispanic.
Poverty status in the spring of 2011 [X2POVTY]. The federal poverty-level status composite variable is derived from household income and the total number of household members. Parent respondents first were asked to report their household income using a standard list of income categories. If a respondent reported a household income that indicated that the household was close to or lower than 200 percent of the U.S. Census Bureau poverty threshold for a household of its size, the respondent was asked to report household income to the nearest $1,000 (referred to as exact income). Poverty classification was determined using the reported income category; exact income, when necessary; and household size.
Preliminary weighted 2010 Census poverty thresholds were used to define household poverty status.7 Households with a total annual income below the appropriate threshold were classified as being below the federal poverty level. Households with a total income at or above 100 percent, but below 200 percent, of the poverty threshold were classified in a middle category (100 to 199 percent of the federal poverty level). Households with a total income at or above 200 percent of the poverty threshold were categorized as being at
7 These were the thresholds available at the time the kindergarten poverty composite variable was created.
15
or above 200 percent of the federal poverty level. For example, if a household with two members had an income lower than $14,220, the household was classified as below the federal poverty level. If a household with two members had an income of $14,220 or more, but less than $28,440 (200 percent of the poverty threshold for a household of two), the household was classified at 100 to 199 percent of the federal poverty level. If a household with two members had an income of $28,440 or more, the household was classified at or above 200 percent of the federal poverty level. Parents’ highest level of education in the 2010-11 kindergarten year [X12PAR1ED_I, X12PAR2ED_I]. Parents’ highest level of education is the highest level of education achieved by either of the parents or guardians in a two-parent household or by the only parent or guardian in a single-parent household. This composite variable is derived from parent interview information about parents’ educational attainment. Data were imputed using a hot-deck procedure if they were not obtained during the parent interview, but a parent had completed at least a portion of the parent interview in either the fall or spring kindergarten data collection. For this report, the parent education composite variable available in the data file was collapsed into five categories: less than a high school credential; a high school diploma or alternative credential; some college, associate’s degree, or career/technical education; bachelor’s degree; and graduate/professional school. Family type in the fall of 2010 [X1HPARNT]. This composite variable is derived from information collected during the fall 2010 parent interview about the number and type of parents in the home. For this report, the composite was collapsed into a three-category variable: two parents, one parent, and other. “Two parents” includes two biological parents, two adoptive parents, and one biological/adoptive parent and one other parent/partner. “One parent” refers to one biological or adoptive parent only. “Other” refers to related and/or unrelated guardians. Primary home language in the 2010-11 kindergarten year [X12LANGST]. This composite variable indicates whether English was the primary language spoken in a student’s home or whether a non-English language was the primary language spoken, according to information collected in the parent interview. If English was the only language spoken in the home, or if a language other than English was spoken in the home but the primary language of the household was English, a student was classified as coming from a home in which the primary language was English. If a language other than English was the primary language spoken in the home, a student was classified as coming from a home in which the primary language was not English, even if English was also spoken. In some instances, children lived in a home where more than one language, including English, was spoken, and the parent respondent could not choose a primary language. These children are coded in a third category indicating that a primary language was not identified. Children whose parents indicated they spoke more than one language equally are also categorized in the third category.
16
Appendix B. Standard Error Tables
17

Table B-1.
Percent
†
1.24
1.24
0.92
1.08
1.14
0.98
5.78
2.53
5.27
1.31
†
1.04
0.69
2.18
1.45
3.08
1.13
1.33
1.56
1.37
2.26
1.94
1.70
0.42
2.71
2.97
0.41
English
Multiple home languages, no primary language specified† Not applicable.
SOURCE: U.S. Department of Education, National Center for Education Statistics, Early Childhood Longitudinal Study, Kindergarten Class of 2010–11 (ECLS-K:2011),
Kindergarten-Second Grade Restricted-Use Data File.
Two parents
One parent
Other
Primary home language, 2010–11 kindergarten year
Not English
Family type, fall 20103
Income below 100 percent of the federal poverty level
Income between 100 and 199 percent of the federal poverty level
Income at or above 200 percent of the federal poverty level
Parents' highest level of education, 2010–11 kindergarten year
Less than high school credential
High school diploma or alternative credential
Some college, associate's degree, or career/technical education
Bachelor's degree
Graduate/professional school
Poverty status, spring 20112
72 months or older
Child's race/ethnicity1
White, non-Hispanic
Black, non-Hispanic
Hispanic
Asian, non-Hispanic
Native Hawaiian or Other Pacific Islander, non-Hispanic
American Indian or Alaska Native, non-Hispanic
Two or more races, non-Hispanic
66 months to 71 months
Standard errors for Table 1: Percentage distribution of children who were in kindergarten for the first time
in the 2010–11 school year and in second grade in the 2012–13 school year, by child and family
characteristics: School year 2012–13
Characteristics
Total
Sex
Male
Female
Age at kindergarten entry
Less than 60 months
60 months to 65 months
18

Table B-2.
Fall 2012 Spring 2013
0.85 0.70
1.02 0.84
0.81 0.64
1.89 1.80
0.88 0.76
0.94 0.74
1.11 1.02
0.88 0.76
1.33 1.22
0.75 0.61
1.10 1.62
† †
0.48 0.80
1.52 0.95
1.21 0.89
0.83 0.81
0.79 0.61
1.28 0.94
0.81 0.64
0.59 0.57
0.66 0.57
1.06 0.82
0.90 0.75
0.59 0.66
1.76 1.53
1.18 1.08
0.75 0.61
1.37 1.57
Male
Standard errors for Table 2: Mean second-grade reading scale scores for children who were in kindergarten
for the first time in the 2010–11 school year and in second grade in the 2012–13 school year, by child and
family characteristics: School year 2012–13
Characteristics
Total
Sex
Hispanic
Female
Age at kindergarten entry
Less than 60 months
60 months to 65 months
66 months to 71 months
72 months or older
Child's race/ethnicity
White, non-Hispanic
Black, non-Hispanic
Less than high school credential
Asian, non-Hispanic
Native Hawaiian or Other Pacific Islander, non-Hispanic
American Indian or Alaska Native, non-Hispanic
Two or more races, non-Hispanic
Poverty status, spring 2011
Income below 100 percent of the federal poverty level
Income between 100 and 199 percent of the federal poverty level
Income at or above 200 percent of the federal poverty level
Parents' highest level of education, 2010–11 kindergarten year
Not English
High school diploma or alternative credential
Some college, associate's degree, or career/technical education
Bachelor's degree
Graduate/professional school
Family type, fall 2010
Two parents
One parent
Other
Primary home language, 2010–11 kindergarten year
English
Multiple home languages, no primary language specified† Not applicable.
SOURCE: U.S. Department of Education, National Center for Education Statistics, Early Childhood Longitudinal Study, Kindergarten Class of 2010–11 (ECLS-K:2011),
Kindergarten-Second Grade Restricted-Use Data File.
19

Table B-3.
Fall 2012 Spring 2013
0.84 0.73
0.89 0.77
0.84 0.73
1.46 1.93
1.00 0.96
0.92 0.74
1.14 1.14
0.64 0.66
1.31 1.46
0.94 0.62
1.81 1.44
† †
1.54 2.00
1.25 1.16
1.22 0.99
0.87 0.84
0.73 0.58
1.23 1.07
0.92 0.68
0.65 0.60
1.02 0.79
0.83 0.85
0.86 0.74
0.98 1.00
3.06 2.32
1.21 1.07
0.70 0.67
1.93 1.97
Male
Standard errors for Table 3: Mean second-grade mathematics scale scores for children who were in
kindergarten for the first time in the 2010–11 school year and in second grade in the 2012–13 school year,
by child and family characteristics: School year 2012–13
Characteristics
Total
Sex
Hispanic
Female
Age at kindergarten entry
Less than 60 months
60 months to 65 months
66 months to 71 months
72 months or older
Child's race/ethnicity
White, non-Hispanic
Black, non-Hispanic
Less than high school credential
Asian, non-Hispanic
Native Hawaiian or Other Pacific Islander, non-Hispanic
American Indian or Alaska Native, non-Hispanic
Two or more races, non-Hispanic
Poverty status, spring 2011
Income below 100 percent of the federal poverty level
Income between 100 and 199 percent of the federal poverty level
Income at or above 200 percent of the federal poverty level
Parents' highest level of education, 2010–11 kindergarten year
Not English
High school diploma or alternative credential
Some college, associate's degree, or career/technical education
Bachelor's degree
Graduate/professional school
Family type, fall 2010
Two parents
One parent
Other
Primary home language, 2010–11 kindergarten year
English
Multiple home languages, no primary language specified† Not applicable.
SOURCE: U.S. Department of Education, National Center for Education Statistics, Early Childhood Longitudinal Study, Kindergarten Class of 2010–11 (ECLS-K:2011),
Kindergarten-Second Grade Restricted-Use Data File.
20

Table B-4.
Fall 2012 Spring 2013
0.68 0.59
0.77 0.65
0.63 0.56
1.46 1.55
0.72 0.67
0.73 0.59
1.03 0.83
0.52 0.36
1.01 1.09
0.70 0.58
0.55 0.48
† †
0.92 0.99
0.72 0.59
1.23 1.05
0.58 0.49
0.53 0.41
1.36 1.25
0.58 0.51
0.52 0.39
0.63 0.53
0.71 0.62
0.68 0.58
0.88 0.81
1.51 1.28
1.31 1.10
0.52 0.46
1.00 1.02
Male
Standard errors for Table 4: Mean second-grade science scale scores for children who were in kindergarten
for the first time in the 2010–11 school year and in second grade in the 2012–13 school year, by child and
family characteristics: School year 2012–13
Characteristics
Total
Sex
Hispanic
Female
Age at kindergarten entry
Less than 60 months
60 months to 65 months
66 months to 71 months
72 months or older
Child's race/ethnicity
White, non-Hispanic
Black, non-Hispanic
Less than high school credential
Asian, non-Hispanic
Native Hawaiian or Other Pacific Islander, non-Hispanic
American Indian or Alaska Native, non-Hispanic
Two or more races, non-Hispanic
Poverty status, spring 2011
Income below 100 percent of the federal poverty level
Income between 100 and 199 percent of the federal poverty level
Income at or above 200 percent of the federal poverty level
Parents' highest level of education, 2010–11 kindergarten year
Not English
High school diploma or alternative credential
Some college, associate's degree, or career/technical education
Bachelor's degree
Graduate/professional school
Family type, fall 2010
Two parents
One parent
Other
Primary home language, 2010–11 kindergarten year
English
Multiple home languages, no primary language specified† Not applicable.
SOURCE: U.S. Department of Education, National Center for Education Statistics, Early Childhood Longitudinal Study, Kindergarten Class of 2010–11 (ECLS-K:2011),
Kindergarten-Second Grade Restricted-Use Data File.
21