Embed Size (px)
Citation preview
An AppDynamics Business White Paper
The most enjoyable part of my job at AppDynamics is to witness and evangelize customer success. What’s slightly strange is that for this to happen, an application has to slow down or crash.
HOW MUCH REVENUE DOES IT GENERATE?
Finding the Root Cause of Application Performance Issues in Production

Finding the Root Cause of Application PerformanceIssues in Production
2
“If we’ve sold less than $1,000 in five minutes, there is probably a problem, even if it’s 2 o’clock in the morning. If our sales have flatlined, that’s a critical problem. I don’t know how to be any clearer.”
Geover, Manager of Quality Engineering at Orbitz Worldwide
It’s a bittersweet feeling when End Users, Operations, Developers and many Businesses suffer application performance pain. Outages cost the business money, but sometimes they cost people their jobs--which is truly unfortunate. However, when people solve performance issues, they become overnight heroes with a great sense of achievement, pride, and obviously relief.
To explain the complexity of managing application performance, imagine your application is 100 haystacks that represent tiers, and somewhere a needle is hurting your end user experience. It’s your job to find the needle as quickly as possible! The problem is, each haystack has over half a million pieces of hay, and they each represent lines of code in your application. It’s therefore no surprise that organizations can take days or weeks to find the root cause of performance issues in large, complex, distributed production environments.
End User Experience Monitoring, Application Mapping and Transaction profiling will help you identify unhappy users, slow business transactions, and problematic haystacks (tiers) in your application, but they won’t find needles. To do this, you’ll need x-ray visibility inside haystacks to see which pieces of hay (lines of code) are holding the needle (root cause) that is hurting your end users. This X-Ray visibility is known as “Deep Diagnostics” in application monitoring terms, and it represents the difference between isolating performance issues and resolving them.
For example, AppDynamics has great End User Monitoring, Business Transaction Monitoring, Application Flow Maps and very cool analytics all integrated into a single product. They all look and sound great (honestly they do), but they only identify and isolate performance issues to an application tier. This is largely what Business Transaction Management (BTM) and Network Performance Management (NPM) solutions do today. They’ll tell you what and where a business transaction slows down, but they won’t tell you the root cause so you can resolve the issues.

Finding the Root Cause of Application PerformanceIssues in Production
3
Why Deep Diagnostics for Production Monitoring MattersA key reason why AppDynamics has become very successful in just a few years is because our Deep Diagnostics, behavioral learning, and analytics technology is 18 months ahead of the nearest vendor. A bold claim? Perhaps, but it’s backed up by bold customer case studies such as Edmunds.com and Karavel, who compared us against some of the top vendors in the application performance management (APM) market in 2011. Yes, End User Monitoring, Application Mapping and Transaction Profiling are important--but these capabilities will only help you isolate performance pain, not resolve it.
AppDynamics has the ability to instantly show the complete code execution and timing of slow user requests or business transactions for any Java or .NET application, in production, with incredibly small overhead and no configuration. We basically give customers a metal detector and X-Ray vision to help them find needles in haystacks. Locating the exact line of code responsible for a performance issue means Operations and Developers solve business pain faster, and this is a key reason why AppDynamics technology is disrupting the market.
Below is a small collection of needles that customers found using AppDynamics in production. The simple fact is that complete code visibility allows customers to troubleshoot in minutes as opposed to days and weeks. Monitoring with blind spots and configuring instrumentation are a thing of the past with AppDynamics.
Needle #1 - Slow SQL StatementIndustry: EducationPain: Key Business Transaction with 5 sec response timesRoot Cause: Slow JDBC query with full-table scan
Finding the Root Cause of Application PerformanceIssues in Production
4
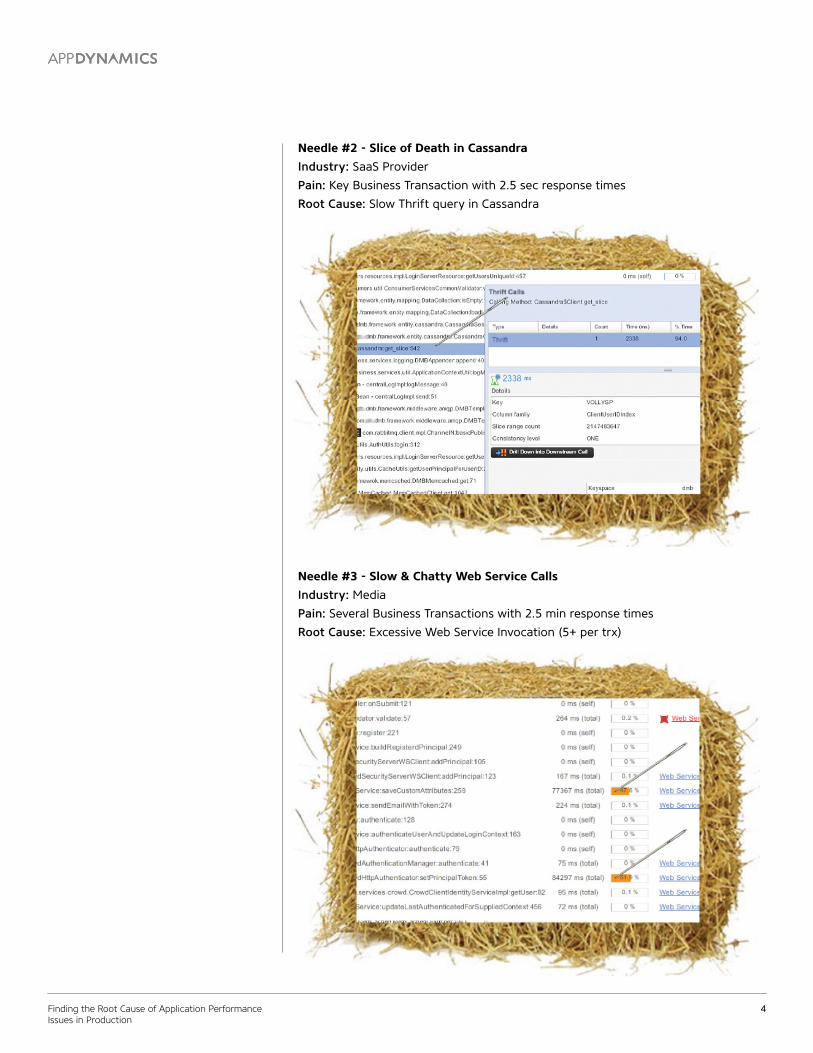
Needle #2 - Slice of Death in CassandraIndustry: SaaS ProviderPain: Key Business Transaction with 2.5 sec response timesRoot Cause: Slow Thrift query in Cassandra
Needle #3 - Slow & Chatty Web Service CallsIndustry: MediaPain: Several Business Transactions with 2.5 min response timesRoot Cause: Excessive Web Service Invocation (5+ per trx)

Finding the Root Cause of Application PerformanceIssues in Production
5
Needle #4 - Extreme XML processingIndustry:Retail/E-CommercePain: Key Business Transaction with 17 sec response timesRoot Cause: XML serialization over the wire.
Needle #5 - Mail Server ConnectivityIndustry: Retail/E-CommercePain: Key Business Transaction with 20 sec response timesRoot Cause: Slow Mail Server Connectivity

Finding the Root Cause of Application PerformanceIssues in Production
6
Needle #6 - Slow Result Set IterationIndustry: Retail/E-CommercePain: Several Business Transactions with 30+ sec response timesRoot Cause: Querying too much data
Needle #7 - Slow Security 3rd Party FrameworkIndustry: EducationPain: All Business Transactions with > 3 sec response timesRoot Cause: Slow 3rd party code

Finding the Root Cause of Application PerformanceIssues in Production
7
Needle #8 - Excessive SQL QueriesIndustry: EducationPain: Key Business Transactions with 2 min response timesRoot Cause: Thousands of SQL queries per transaction
Needle #9 - Commit HappyIndustry: Retail/E-CommercePain: Several Business Transactions with 25+ sec response timesRoot Cause: Unnecessary use of commits and transaction management.

Finding the Root Cause of Application PerformanceIssues in Production
8
Needle #10 - Locking under ConcurrencyIndustry: Retail/E-CommercePain: Several Business Transactions with 5+ sec response timesRoot Cause: Non-Thread safe cache forces locking for read/write consistency
Needle #11 - Slow 3rd Party Search ServiceIndustry: SaaS ProviderPain: Key Business Transaction with 2+ min response timesRoot Cause: Slow 3rd Party code

AppDynamics, Inc. www.appdynamics.com
Copyright © 2014 AppDynamics, Inc. All rights reserved. The term APPDYNAMICS and any logos of AppDynamics are trademarked or registered trademarks of AppDynamics, Inc.
Try it FREE at www.appdynamics.com
Needle #12 - Slow 3rd Party Search ServiceIndustry: SaaS ProviderPain: Key Business Transaction with 2+ min response timesRoot Cause: Slow 3rd Party code
Needle #13 - Slow 3rd Party Search ServiceIndustry: SaaS ProviderPain: Key Business Transaction with 2+ min response timesRoot Cause: Slow 3rd Party code