Embed Size (px)
Citation preview

University of Central Florida University of Central Florida
STARS STARS
HIM 1990-2015
2012
Finding the dominant characteristics that contribute to effectively Finding the dominant characteristics that contribute to effectively
implementing best practices in primary inclusion classrooms implementing best practices in primary inclusion classrooms
using the inclusive classroom profile (icp) using the inclusive classroom profile (icp)
Marilyn Romero University of Central Florida
Part of the Political Science Commons
Find similar works at: https://stars.library.ucf.edu/honorstheses1990-2015
University of Central Florida Libraries http://library.ucf.edu
This Open Access is brought to you for free and open access by STARS. It has been accepted for inclusion in HIM
1990-2015 by an authorized administrator of STARS. For more information, please contact [email protected].
Recommended Citation Recommended Citation Romero, Marilyn, "Finding the dominant characteristics that contribute to effectively implementing best practices in primary inclusion classrooms using the inclusive classroom profile (icp)" (2012). HIM 1990-2015. 1298. https://stars.library.ucf.edu/honorstheses1990-2015/1298

iii
Finding the Dominant Characteristics that Contribute to Effectively Implementing
Best Practices in Primary Inclusion Classrooms Using the Inclusive Classroom Profile (ICP)
by
MARILYN N. ROMERO
A Thesis submitted in partial fulfillment of the requirements for the Honors in the Major Program in Political Science
in the College of Arts and Sciences and in the Burnett Honors College at the University of Central Florida
Orlando, Florida
Spring Term 2012
Thesis Chair: Dr. Maria Reyes-Macpherson

© 2012 Marilyn N. Romero

iii
ABSTRACT
In 1997, the Individuals with Disabilities Education Act (IDEA) was amended to
emphasize the need for students with disabilities to have access to the general curriculum. Along
with IDEA, No Child Left Behind (NCLB), emphasized that all children must have a fair, equal,
and significant opportunity to obtain a high-quality education (Sec. 1001, Part A, Title 1 of
ESEA; 20U.S.C. 6301) increasing the need for effective inclusion classrooms in schools around
the country. This study evaluated six inclusive classrooms (three partial and three full) from a
large metropolitan school district in Florida. The classrooms’ best practices were assessed using
the Inclusive Classroom Profile (ICP). The ICP is a 7-point rating scale conducted through an
observation procedure that is designed to assess the quality of daily classroom practices of
children with disabilities (Soukakou, 2007). Teacher characteristics, student characteristics, and
classroom characteristics were gathered from all classrooms and analyzed through correlation
tests with the ICP scores. Although statistical results did not demonstrate statistically significant
data in regards to the strength of relationships between these characteristics and ICP scores, the
direction of the relationship on the following characteristics: related experience, severity of
disabilities, and level of support, revealed a possible impact on ICP scores.

iv
ACKNOWLEDGMENTS I primarily would like to thank God for giving me the strength and wisdom to endure this rigorous, academic task. I would like to thank my devoted family. To my Mami and Papi for pushing me to reach my fullest potential and taking pride in my education. To Edwin and Bernadette for always providing me with encouragement and support. To Cynthia for taking the time to guide me every step of the way. I could not have accomplished this without your enlightening direction. My gratitude extends to Nick who motivated and inspired me throughout this entire endeavor. You made me coffee at two in the morning and carried my heavy books to my car, always showing me that you genuinely cared. A great amount of gratitude goes to my thesis chair, Dr. Maria Reyes-Macpherson for remaining strong and positive through all the highs and lows this project entailed. You have taught me a vast amount of knowledge that will have a continuous impact in my life. I aspire to gain your level of experience and eloquence. To Dr. Sherron Roberts for facilitating my journey by opening many doors to a world of insightful resources. To Dr. Caroline Pratt-Marrett for always comforting me with your wise and soothing words. An immense appreciation goes to all of you for your dedication and faithfulness towards a project based on a topic that is so near and dear to me. You all contributed a significant piece to the completion of this project.

v
TABLE OF CONTENTS
LIST OF TABLES ....................................................................................................................... viii
LIST OF FIGURES ........................................................................................................................ x
CHAPTER ONE: INTRODUCTION ............................................................................................ 1
Research Question ...............................................................................................................2
Null Hypothesis ...................................................................................................................3
Thesis Objectives .................................................................................................................3
CHAPTER TWO: LITERATURE REVIEW ................................................................................ 4
1. Adaptations of Space and Materials/ Equipment .............................................................4
2. Adult Involvement in Peer Interactions ...........................................................................5
3. Adult’s Guidance of Children’s Play ...............................................................................6
4. Conflict Resolution ..........................................................................................................7
5. Membership .....................................................................................................................8
6. Adult-Child Social Communicative Interactions .............................................................9

vi
7. Support for Social Communication ...............................................................................10
8. Adaptation of Group Activities ......................................................................................12
9. Transitions Between Activities ......................................................................................12
10. Feedback ......................................................................................................................13
11. Planning and Monitoring of Children’s Individual Needs and Goals..........................13
Summary ............................................................................................................................14
CHAPTER THREE: METHODS ................................................................................................ 15
Theoretical Framework ......................................................................................................15
Participant Profile ..............................................................................................................16
Limitations .........................................................................................................................19
Summary ............................................................................................................................19
CHAPTER FOUR: RESULTS .................................................................................................... 20
ICP Scores ..........................................................................................................................22
Teacher Characteristics ......................................................................................................26
Student Characteristics.......................................................................................................29
vii
Classroom Characteristics ..................................................................................................34
Summary ............................................................................................................................37
CHAPTER FIVE: DISCUSSION ................................................................................................ 40
Overview ............................................................................................................................40
Suggestions for Future Implementation of Inclusion Classrooms .....................................46
APPENDIX A: UCF IRB Approval Letter .................................................................................. 47
APPENDIX B: Principal Letters to IRB ...................................................................................... 49
APPENDIX C: Orange County Public Schools Approved Research Request Form .................. 52
APPENDIX D: Principal Letters to Orange County Public Schools ............................................ 54
APPENDIX E: Teacher Profile ................................................................................................... 57
APPENDIX F: Classroom Profile ............................................................................................... 59
APPENDIX G: Assessment Tool: Inclusion Classroom Profile (ICP) ....................................... 62
REFERENCES ............................................................................................................................. 68

viii
LIST OF TABLES
Table 1: Sample Lesson Plan (Cote, 2011, p. 263) ......................................................................... 8
Table 2: Most Common Visual Approaches (Devlin, 2009, p. 331-332) .................................... 11
Table 3: Overview of Classroom Settings .................................................................................... 22
Table 4: Mean ICP Scores Dependent on Inclusion Program ...................................................... 23
Table 5: Mean ICP Score Dependent on Grade Level ................................................................. 24
Table 6: Pearson Correlation Coefficients between ICP Scores and Inclusion Program ............. 25
Table 7: Overview of Teacher Characteristics ............................................................................. 27
Table 8: Mean ICP Scores Dependent on Teacher’s having ESE Certification (Y / N) .............. 28
Table 9: Pearson Correlation Coefficients between ICP Scores and ESE Certification .............. 29
Table 10: Scores Compared to Student Characteristics (Gender, Type of Disability, & Severity
of Disability) ................................................................................................................................. 31
Table 11: Mean ICP Scores Dependent on Severity of Disabilities ............................................. 32
Table 12: Pearson Correlation Coefficients between ICP Scores and Severity of Disabilities .... 33
Table 13: Overview of Classroom Characteristics ....................................................................... 35
ix
Table 14: Pearson Correlation Coefficients between ICP Scores and Number of Personnel in
Classroom ..................................................................................................................................... 37
x
LIST OF FIGURES Figure 1: Project Plan .................................................................................................................................................. 18

1
CHAPTER ONE: INTRODUCTION
From its inception, PL 94-142, established the need for a free appropriate education in the
least restrictive environment for ALL children. In 1997, the Individuals with Disabilities
Education Act (IDEA) was amended to emphasize the need for students with disabilities to have
access to the general curriculum. Along with IDEA, No Child Left Behind (NCLB), emphasized
that all children have a fair, equal, and significant opportunity to obtain a high-quality education
(Sec. 1001, Part A, Title 1 of ESEA; 20U.S.C. 6301) increasing the need for effective inclusion
classrooms in schools around the country. As regular and exceptional education teachers face the
challenges of the inclusive classroom in an education arena characterized by strong budget cuts
and a call for teacher accountability it becomes critical to identify the best practices in inclusive
settings.
Not only is there a need for effective inclusion classrooms, but this need is increasing.
This need has become evident under many circumstances. For example, the U.S. Department of
Education reported that in the 1991-1992 school year the number of children diagnosed with
autism was 5,415 and by the 2001-2002 school year this number had increased by 77%.
Comparably, another instance where the need for inclusion classrooms becomes highly evident is
through the research recently conducted concerning health, educational, and developmental
issues among students in high stress and low income environments. The research demonstrates
that there is distinguished socioeconomic gradient in the relation between family income and
children’s outcomes (Aber, 2010). The number of low-income families is steadily increasing, as
our country’s economy is not seeing relief. Due to this concerning issue, some predict that we

2
may see an increase in students with higher emotional needs. With the rise in students with
disabilities, a movement towards inclusion practices is swift. In fact, the U.S. Department of
Education also recently reported that more than 95% of students with disabilities are currently
enrolled in regular schools, and of those students, 52% spent a majority of the school day in a
general education classroom (Klotz, 2004).
As the need for inclusion classrooms rises, efforts to improve their quality are necessary.
However, an uncertainty persists as to a true definition of the term inclusion, which as a result
may be hindering these efforts (Kilanowski-Press, 2010). As more schools and institutions
embrace the concept, linking inclusion to the qualities and characteristics that it should possess is
imperative. These qualities should be continuously assessed to ensure the effectiveness of any
inclusion approach. To achieve a proper assessment of inclusion efforts, we need a set of
standard criteria to guide such a critical assessment. A standard process and criteria for inclusion
classrooms are necessary to identify and track successful practices in order to better cater to
students with and without disabilities. Quality and improvement derive from frequent evaluation
and communication of feedback (Ludtke, 2009). Giving the community a common
understanding of what is expected from an inclusive classroom is a movement closer to guiding
educators to utilize more effective researched practices.
Research Question
What are the dominant teacher, student, and classroom characteristics that contribute to
the effective implementation of best practices in primary inclusion classrooms?

3
Null Hypothesis
There will be no relationship between any of the characteristics and the trend of the
Inclusion Classroom Profile (ICP) Scores.
Thesis Objectives
The purpose of this study is to discover dominant characteristics among those inclusion
classrooms that are effectively implementing inclusion best practices. For this study, best
practices are defined as the productivity among the 11 core qualities from the ICP that should be
found in an inclusion classroom. The 11 core qualities will further be described in detail in both
Chapters 2 and 3. We would like to report our findings to facilitate the implementation of these
core qualities to other inclusion classrooms.

4
CHAPTER TWO: LITERATURE REVIEW
Inclusion is an intricate practice that is affected by many factors of a classroom. The
Inclusion Classroom Profile (ICP) (Soukakou, 2007), focuses on assessing 11 core qualities, that
if delivered correctly, compile as indicators of an inclusive classroom conducting its best
practices. This chapter consists of a review of literature that was driven by researching these 11
core qualities to demonstrate justification for why these qualities are significant to an inclusive
classroom. Each quality was depicted by linking its background to past evidence or research of
students’ benefitting from implementation of each individual quality. The following 11core
qualities are considered best practice.
1. Adaptations of Space and Materials/ Equipment
A crucial aspect of a student with a disability entering a general education classroom is
that the classroom in itself is appropriate to the students’ needs. Studies have shown that
classrooms should provide adequate space for movement, have matched areas to learning styles,
and have visual/ auditory accommodations (Mohr, 1995). A student may have a cognitive,
communication, physical, social emotional, or developmental disability. Depending on the
student’s particular disability they may have equipment and devices that facilitate their mobility
and communication. Students with physical disabilities may use wheelchairs or other mobility
equipment. It is important that the classroom is wheelchair accessible in order to allow the
student to access all parts of the room so that their resources are equal to that of other students.
Students may also have standers, walkers, or gait trainers that are necessary for the student to
improve physical abilities. A classroom should be able to accommodate students’ equipment so

5
that it is accessible to them at necessary times. Furthermore, students with cognitive or
communicative disabilities may use visual aids or communication devices. A study conducted by
the technology and psychology education department of the University of Arizona reported that
students who were able to access visual cues and assistive technologies scored significantly
better on test scores (Lin. 2011). Therefore, students should be able to access necessary
equipment and devices as independently as possible.
2. Adult Involvement in Peer Interactions
As early as the 1920‘s, Vygotsky began exploring the concept of the Zone of Proximal
Development (ZPD), which is defined in the 1978 publication of Vygotsky’s work as the
distance between the actual developmental level, as determined by independent problem solving,
and the level of potential development, as determined through problem solving under adult
guidance or in collaboration with more capable peers (Wass, 2011). This concept was a part of
Vygptsky’s socio-cultural theory that emphasized social interaction as a fundamental role in
cognitive development. Teachers play a major role in providing opportunities that encourage
students to be challenged and learn concepts that would otherwise be too difficult. This can be
accomplished by strategically grouping students to have positive peer role models and be
complemented by their group member’s strength and weaknesses. Students can accomplish more
when appropriately supported and guided. Along with Vygotsky’s socio-cultural theory of
learning came the idea of scaffolding (Wood et al. 1976). Scaffolding refers to metaphor adopted
to explain the role that adults can play in joint problem-solving activities with children. The same
way a scaffold is temporarily erected to help with the building or modification of another
structure, a student can be temporarily assisted until they can complete a more difficult task on
6
their own (van de Pol, 2010). Both theories, ZPD and scaffolding, display the benefits of adult
involvement in peer interactions. Teachers can facilitate learning, by prompting and
manipulating peer interaction. Students will learn from peer modeling and peer inquiry.
3. Adult’s Guidance of Children’s Play
Along the same lines teachers can manipulate peer interaction to make children’s play
meaningful. Students with low interactions may be pared with a high interacting peer to
encourage communication and appropriate use of play. Teachers may provide unique
opportunities to interact with different manipulatives. Teachers may also prompt students by
asking questions during play. The teacher may monitor play and at times interact, but there
should be a balance between how much a teacher should intervene and how much teachers
should allow students to use their own creativity. The Center for Early Childhood Education in
Eastern Connecticut State University categorized levels to distinguish appropriate adult
interaction. They reported that child play behaviors could be sorted into three basic categories
related to the amount of needed adult guidance, labeled much need, some need, and no need.
“Much need” students, need a lot of adult prompting because they cannot proceed with the tasks
on their own. They require frequent role enactment, peer interaction, and daily routine. “Some
need” students, need some adult support during play due to being unable to remain engaged,
having difficulty problem solving, and maintaining positive interactions with others. Lastly, are
“No need” students that do not need any adult support because they are independent and display
elaborate and social play patterns. Being able to judge when to effectively support students in
play is necessary to meet the social needs of students at varying levels (Trawick-Smith &
Dziurgot, 2011).

7
4. Conflict Resolution
A quality classroom should have procedures in place to prevent conflicts from occurring
such as a visual for classroom rules or a familiar behavior system. However, it is inevitable that
conflicts occur. Therefore, there are numerous critical strategies that should be implemented in
encouraging students to utilize problem solving skills. These strategies include giving the student
options, modeling, and allowing students to play an “active role” in the solution (Soukakou,
2007). According to the Hammill Institute on Disabilities, decision-making is a significant step
in problem solving. Giving students choices allows the student to reach a higher order of
thinking that will lead them to justify an appropriate decision. Questioning students’ daily
decisions to strengthen their confidence and reasoning can practice this step. For example,
prompting the students to ask themselves “What’s the problem?” “How can we fix it?” and
“Why would it work?” (Cote, 2011). Helping students understand the rationale behind their
decisions guides them to become independent thinkers.
The next important factor in developing problem solving skills is modeling. The teacher
is the primary role model in the classroom setting; therefore he/she should act as they would like
their students to act. For example, using polite words to the students will demonstrate that they
too should use polite words to others. Another way to model is to practice daily routines such
standing in line. Many times a problem is triggered by the students’ lack of confidence with a
task. If the student is exposed to the correct procedure they are more likely to pursue it in the
correct manner. Lastly, allowing the student to be a part of the solution process is important. If
they help create the solution and help implement the solution it becomes more meaningful to the
student, which will in return raise the probability of the student repeating the solution when the

8
same problem occurs at another time. Hamill Institute on Disabilities also composed a sample
lesson plan used to allow the student to play an “active role” in the solution process. As seen in
Table 1 the sample lesson plan consists of the direct steps and descriptions used to depict a
particular problem and guide students to analyze every factor of their problem.
Table 1: Sample Lesson Plan (Cote, 2011, p. 263)
Lesson plan Explanation and sample dialogue
Objective Teacher writes the goal (e.g., identify a problem, identify possible solutions) on the board
Describe Teacher describes and reviews the three problem-solving steps using flash cards. Sample dialogue: A detective symbolizes What’s the problem?, a nurse symbolizes How can you fix it?, and a cheerful boy symbolizes Why would it work?
Model Teacher makes use of the problem-solving storybooks. Sample dialogue: “Listen as I read the story. Notice the problem that she had. She solved her problem by asking for help.”
Guided practice
Teacher facilitates the student in defining the problem and generating possible solutions using the Problem Situation Measure (adapted from Glago, 2005). Sample dialogue: “Listen as I read to you a problem. Ann is having trouble remembering her math facts. Ann’s teacher is giving a math test on Friday. Ann wants to get an A on the test. What is Ann’s problem?”
Role-play Teacher prompts and assists the student in identifying problems and possible solutions during role-play. Sample dialogue: “Your teacher tells you to take out a pencil for the next assignment. You look and cannot find your pencil. You remember leaving a pencil in your desk.”
Feedback Teacher encourages the student to justify or defend why the solution would work. Sample dialogue: “Yes, you could do that to solve your problem. What else could you do? Why is that the best solution?”
5. Membership
A main concern of students with disabilities entering a general education classroom is the
possibility of bullying or a negative reaction to the differences. However, teachers can create a
sense of membership where all students feel accepted and celebrate each other’s differences.
Klotz (2004) explains that students can be encouraged to welcome students with disabilities by
9
being honest, developing empathy, increasing exposure, and therefore eliminating bullying.
Many times students are unfamiliar with disabilities so they avoid interaction, but honesty is the
best solution. Students should openly ask questions to better understand their peers. The process
can better be facilitated through the use of literature on encouraging peers. Likewise, to better
understand their peers, students must feel empathy for one another. Teachers can help students
develop empathy by planning for all students to experience a form of disability themselves. The
web has numerous resources that allow students to simulate various disabilities. The longer the
students are exposed to students with disabilities, the more one might expect they would gain an
understanding of their peers and see past their differences. Perhaps, the students will gain a sense
of respect for one another, which will prevent bullying. When students respect each other, the
classroom should become safe and conducive to learning.
6. Adult-Child Social Communicative Interactions
Correspondingly, classroom environment is also established through adult- child social
communication. Students should feel comfortable to speak to their teachers. Building positive
student- teacher relationships leads to creating a positive and inviting classroom environment.
Instructors can establish a sense of connection in the classroom through communicative
behaviors that exhibit warmth (Beattie & Olley, 1977; Voelkl, 1995). Students should feel
welcomed to ask questions and express their emotions. Students should not be shamed for their
wrong answers, but rather redirected to the correct answers. In an inclusive setting this becomes
all the more significant because all students need to have the trust to confide any concerns to
their teacher, whether it be regarding a disability or not.
10
7. Support for Social Communication
Students should be given opportunities to actively participate and all students’ responses
should be encouraged in class discussions. For students with limited social communication
research has found that visual approaches are an effective alternative (Devlin, 2009). Table 2
represents a compiled list of the most common visual approaches. Giving students options to
communicate such as, visual or vocal approaches, is one of the most important aspects of
encouraging communication, so that the student may pick the option they feel most comfortable
using. The communication approach used is suggested to be that most appropriate for the child
and be used for the adequate reason, whether it is for social communication, social
understanding, or social interaction.

11
Table 2: Most Common Visual Approaches (Devlin, 2009, p. 331-332)
Approach Description Aim Target Group
Picture Scripts (Groden & LeVasseur, 1995; Hodgdon, 1995)
Illustrating situations that a child has difficulty with, accompanied by guidance on what to do in that situation
To help children adapt to a social situation
Verbal and non-verbal children
Social Stories (Gray, 1995)
Four to six sentences that describe factual information about a social situation, the possible reaction of others and directive statements of desired emotions and/or behaviour
To promote social interaction and adaptation to social situations
Verbal and non-verbal children who can read text
Video feedback (Kern, Wacker, Mace, Dunlap, & Kormrey, 1995)
Individual’s interactions are videoed and then played back during individual coaching to help the individual develop new skills
To promote social interaction and communication
Verbal and non-verbal children
Comic Strip Conversations (Gray, 1994)
Simple drawings and thought bubbles. Colours can be used to display and highlight feelings as well
To illustrate the actions, feelings, thoughts and intentions of those involved in a particular social situation
Verbal children who can read text
Picture Exchange Communication System (PECS) (Bondy & Frost, 1994) and other augmentative communication approaches
Signs, pictures, symbols or written words are used as an alternative to, or as a precursor of, speech
To facilitate and promote communication
Verbal and non verbal children
Visual timetables (Schopler & Mesibov, 1995)
Pictures or symbols are displayed horizontally or vertically to show a sequence of activities to a child
To promote sequencing, reduce anxiety and to communicate information and clarify expectations
Verbal and non verbal children
Sign language (Kiernan, 1983)
Hand gestures are used to symbolically communicate meaning
To facilitate and promote communication
Verbal and non-verbal children
Written prompts (Kistner, Robbins, & Haskett, 1988)
Verbal prompts are supported with written prompts (verbal prompt: – “do you want?” written prompt: – “want cookie”)
Improve responses to questions
Verbal children who can read text
Power Cards (Gragnon, 2001)
Visual aids that incorporate a student’s special interest(s) to teach appropriate social interactions. The Power Card presents the pupil’s “hero” or special interest solving a problem with a suggestion of how the pupil might use that same strategy to solve a problem for themselves
To teach problem solving skills and how to adapt to social situations
Verbal children who can read text
Facilitated Communication (NAS, 1994) and communication boards (Siegel, 1996)
Children are supported so they can point to a communication board or keyboard. Communication aids can be two dimensional using pictures or three dimensional using objects
To promote communication
Verbal and non-verbal children. Children who can read
12
8. Adaptation of Group Activities
Classroom groups have many uses, but in order for the groups to be productive, they
must be designed strategically. Groups can be used for classroom activities, centers, and small
focus groups. Groups need to be adaptable to meet the needs of all students. Some groups can be
created with students at all varying skill levels to promote learning and prevent labeling
(Allington, 2007). However, students are particularly placed in groups with students of opposite
strengths and weaknesses so that they can complement their needs. Some groups may be specific
to a need so that all students with that need, can receive extra practice. Groups for classroom
activities should be created in a way that objectives, materials, and other instructional support
can enable the engagement of all students while still allowing students to do the same activity
(Soukakou, 2007).
9. Transitions Between Activities
Transitions can be a challenging time for some classrooms. These challenges can be
prevented by having strategies in place to ameliorate the process. Transitions are especially
important to have in place for students with autism because they need additional assistance in
grasping the concept of time (Devlin, 2009). Firstly, students should discuss the daily schedule,
for example stating “First we will go to art and then to lunch.” Students should also have a
schedule posted in the room for reference at any time. Therefore, the schedule should be mostly
consistent on a day to day basis. Additional strategies to provide individual support for students
who struggle with disabilities would be to provide an individual picture schedule where they can
manipulate the picture tasks that have been completed and the picture tasks that are yet to be
completed (Olive, 2004). Another contributing factor to maintain smooth transitions is to limit
13
down time by having additional activities planned or in place for those who finish early.
Transitions are the strings that hold a classroom together and therefore are an important aspect of
quality classrooms.
10. Feedback
In a study that collected perceptions of feedback (Rowe, 2011), students were asked
“Why do you value feedback?” One student responded “It can evaluate my progress so far, show
the weakness I get whether I should keep doing [study] in the same way or put [in] more time or
change the way I study,” while another responded “It provides an indication of the level of work
expected to do well in the subject and helps to highlight strengths and weaknesses.” Ultimately,
the common trend seemed to be students wanting feedback. Most students wanted to know why
they were wrong and did not want to be wrong for no reason. Since the students were eager to
know why they were wrong, immediate feedback was most effective because they were able to
identify a correct answer and justify it. All students need to receive feedback so that they can
excel in their strengths and know how to work on their weaknesses.
11. Planning and Monitoring of Children’s Individual Needs and Goals
One of the most important factors in assessing the quality of classrooms is monitoring
students’ needs and goals to assure that each student is being catered to. It all comes down to
whether or not the student is making progress under the current practices. Students’ goals and
plans should be created around the student’s current strengths and weaknesses. Continuous
assessments should be conducted to assure that the current practices are being effective and to
isolate the students’ weaknesses that still need to be worked on. Monitoring progress can be
conducted in either formal or informal ways. Instructors may choose to do anecdotal recordings,
14
portfolio assessments, or a school/state standardized test. The most important aspect in progress
monitoring is recording dates, examples of behavior, responses to interventions, and change over
time.
Summary
Overall, this review of relevant literature supports the implementation of these 11 core
qualities. From adapting space for materials/equipment to planning and monitoring children’s
individual needs and goals, a classroom that practices these items exudes classroom quality.
Students with and without disabilities should be both accepted in a classroom and be
accommodated in a classroom. For this reason the ICP narrowed the essence of quality
classrooms down to these 11core items and is an adequate way to assess inclusive classrooms.
Our goal is to discover dominant characteristics among those classrooms that score high on the
ICP in order to implement quality in future inclusion classrooms. Through this study we want to
set a standard of quality among all inclusive classrooms that we found evident through the
review of this literature. Through these efforts of establishing a standard of quality, we will not
only be advocating to improve current inclusion practices, but be making a movement to achieve
best practices among the inclusion classrooms that are increasingly being actualized.

15
CHAPTER THREE: METHODS Theoretical Framework
This study was framed around the Inclusive Classroom Profile (ICP) created by Elena P.
Soukakou. A sample of the ICP can be found in Appendix G. The ICP is a 7-point rating scale
conducted through an observation procedure that is designed to assess the quality of daily
classroom practices of children with disabilities (Soukakou, 2007). The ICP has been widely
tested in 45 inclusive pre-K classrooms. Inter-rater reliability was established in a separate set of
classrooms (n=10), and results suggested that independent observers were highly consistent in
their ratings of individual items. The mean weighted kappa for all items was 0.79. Cronbach’s
Alpha analysis was conducted on the scale’s items and assessed the measure’s internal
consistency (α=0.79). The factor structure of the Inclusive Classroom Profile was tested through
confirmatory factor analysis. The one factor model filled the assumptions and showed good
values for model fit; Model fit indices were: χ2= 35.164, df= 35, p=.460, CMIN/df = 1.005,
RMSEA= .010, NNFI = .998, and CFI= .998. To assess construct validity the ICP was compared
with other measures of classroom quality. The total score of the ICP showed a .626 (p<0.001)
moderately high correlation with the ECERS-R, suggesting the two instruments are measuring
similar but not identical constructs.
The 7-point range commences at number 1, suggesting that the classroom is highly
inadequate, to the number 7, suggesting that the classroom promotes the highest degree of
quality practices to ensure that the needs of students with disabilities are being met. The ICP
rates 11 core qualities that an inclusion classroom should be implementing. These qualities
consist of adaptations of space and material/ equipment, adult involvement in peer interactions,

16
adult’s guidance of children’s play, conflict resolution, membership, adult-child social
communicative interaction, support for social communication, adaptation of group activities,
transitions between activities, feedback, and planning and monitoring of children’s individual
needs and goals.
This study examines six primary level, inclusion classrooms using the ICP. For the
purpose of this study we are defining inclusion as any general education classroom with an
enrollment of at least one student with an identified disability. Three of the participating
classrooms were partial inclusion and the other three participating classrooms were full
inclusion. Partial inclusion is having enrollment of the student(s) with a disability for only a
percentage of an average school day (e.g. student arrives for only reading) and full inclusion is
having classroom enrollment of the student(s) with a disability for the entire school day. In
addition, to conducting the ICP, teacher, student, and classroom characteristics were collected
and analyzed to determine possible relationships. Teacher characteristics were collected using
the Teacher Profile found in Appendix E. Student and classroom characteristics will be collected
using the classroom profile found in Appendix F.
Participant Profile This study took place in a large metropolitan school district in South Eastern United
States. A total of six classrooms were conveniently sampled from classrooms of one charter
school and one public school who were willing to participate in the study. The six classrooms
were divided by two settings: Inclusion Program and Grade Level. From the six classrooms,
three followed a Partial Inclusion Program and the other three followed Full Inclusion Program.
Each Inclusion Program had one Kindergarten classroom, one First grade classroom, and one
17
Second grade classroom. This study was submitted for approval of the Institutional Review
Board (IRB). Approval from IRB can be found in Appendix A and principal letters to IRB can
be found in Appendix B. This study was also submitted for approval from the Orange County
Public School district (OCPS). Approval from OCPS can be found in Appendix C and principal
letters to OCPS can be found in Appendix D. In order to protect participants’ confidentiality
pseudonyms were given to participating teachers and classrooms. Names of teachers and
classrooms used in this study are fictional. Participation of this study was completely voluntary
and participants could terminate their participation at any time.
Teachers were observed only after they consented to participate. Each classroom was
observed for a total of two hours and a half by one researcher. The first half hour was used to
collect qualitative notes such as teacher characteristics (age, gender, years of experience, ESE
certification (y/n)) using the Teacher Profile (Appendix E), student characteristics (gender, type
of disability (cognitive, communication, physical, social emotional, developmental), severity of
disabilities) using the Classroom Profile (Appendix F), and classroom characteristics (number of
students in classroom, ESE to general education student ratio, support given to teachers) using
the Classroom Profile. The last two hours were used to conduct the ICP (Appendix G). The
researcher was prepared by the author of the ICP to appropriately assess classrooms. Scores were
given according to assessment protocol to eliminate biases. Each classroom was given a score on
each of the 11 core qualities and was given an overall average score by the researcher.
Correlational analyses were conducted to find possible relationships between the ICP scores and
the collected characteristics. From the analyses dominant characteristics were depicted. The ICP
assessment instrument was the independent variable and the ICP Scores were the dependent

18
variable. Scores were inputted into an electronic spreadsheet to facilitate the analyses of the data.
Lastly, we reported our findings to communicate the dominant characteristics of the higher
scoring classrooms. These characteristics may be replicated in future inclusive classrooms to
raise the overall quality of inclusion settings. An image of our project plan can be found in
Figure 1 below.
Figure 1: Project Plan

19
Limitations This study encountered a few limitations. The researcher created the Teacher Profile and
the Classroom Profile used to collect various characteristics in the study. They were not directly
tested for reliability and validity. However, the ICP creator suggested the characteristics included
on the profiles. Another limitation is the population of the study. Although the study was
completed in a large, metropolitan school district, it was limited to one county and in that county
it was limited to only one charter school and one public school. An additional limitation was
sample size. The population may not be entirely representative of the sample due to only six
classroom participating.
Summary
The purpose of this study was to determine possible relationships between Teacher
Characteristics, Student Characteristics, Classroom Characteristics and ICP Scores. This study
examines six inclusion classrooms using the ICP. In addition, to conducting the ICP, teacher,
student, and classroom characteristics were collected and analyzed to determine possible
relationships. The independent variable was the ICP assessment tool and the dependent variable
is the ICP Scores. A few limitations were evident in this study concerning its sample size and
population.

20
CHAPTER FOUR: RESULTS
In this study the ICP scores represent the degree in which an inclusion classroom is
implementing it’s best practices. The ICP is a 7-point rating scale conducted through an
observation procedure that is designed to assess the quality of daily classroom practices of
children with disabilities (Soukakou, 2007). The 7-point range commences at number 1,
suggesting that the classroom is highly inadequate, to the number 7, suggesting that the
classroom promotes the highest degree of quality practices to ensure that the needs of students
with disabilities are being met. This research focuses on three main types of characteristics
affecting classrooms’ efforts to implement best practices, which are: Teacher Characteristics,
Student Characteristics, and Classroom Characteristics. This study examined the relationship
between ICP scores and these three main types of characteristics. The research question studied
was, “What are the dominant teacher, student, and classroom characteristics that contribute to the
effective implementation of best practices in primary inclusion classrooms?” The null hypothesis
predicted no relationship will exist between any of the characteristics and the trend of the ICP
Scores. This chapter presents the analyses and outcomes of ICP scores and dominant
characteristics that affected the classrooms that scored higher on the ICP. All tables presented in
the results will include the ICP Scores, for the purpose of comparing the ICP Scores to all of the
characteristics collected.
In the study, classrooms were selected dependent on their setting. The study had two
Inclusion Programs: Partial Inclusion and Full Inclusion. From the classrooms selected, three
classrooms were Full Inclusion Programs and three classrooms were Partial Inclusion Programs.
For each Inclusion Program, three Grade Levels were observed: one Kindergarten classroom,
21
one First grade classroom, and one Second grade classroom. The results of the scores are
displayed first, according to the settings of the classrooms and secondly by the category of the
three main types of characteristics: Teacher Characteristics, Student Characteristics, and
Classroom Characteristics. All of the subgroups from each of the characteristics were compared
by calculating the mean ICP score of classrooms that fell under the same subgroups. For
example, for the subgroup of Gender under Student Characteristics a mean ICP score was
calculated for all classrooms that had a majority of female students and a mean ICP score was
calculated for all classrooms that had a majority of male students. The two means were then
compared to find distinct differences. For this study we defined distinct differences as the
difference between the means of two characteristics being at least 0.5. Subgroups that
demonstrated means with distinct differences were considered dominant characteristics and were
further analyzed. An asterisk was placed by the dominant characteristics that were to be further
analyzed and displayed on their own.
The dominant characteristics were further analyzed using the Pearson Correlation Test on
Statistical Packages for the Social Sciences (SPSS). The Pearson Correlation test is a measure of
strength of association between two variables. It finds the correlation coefficient to show the
data’s closeness to a linear line. The correlations coefficient demonstrates strength and direction
between two variables. The Pearson’s correlation coefficient runs from an interval of -1 to 1. A
positive correlation indicates that both variables are either increasing or decreasing together,
while a negative correlation indicates inverse relationship, that as one variable is increasing the
other is decreasing. For this study a correlation is considered significant at a level of 0.05. The
Pearson correlation test was the most appropriate test for this analysis because only two variables
22
were considered at a time. The significance of the dominant characteristics will further be
discussed in Chapter 5.
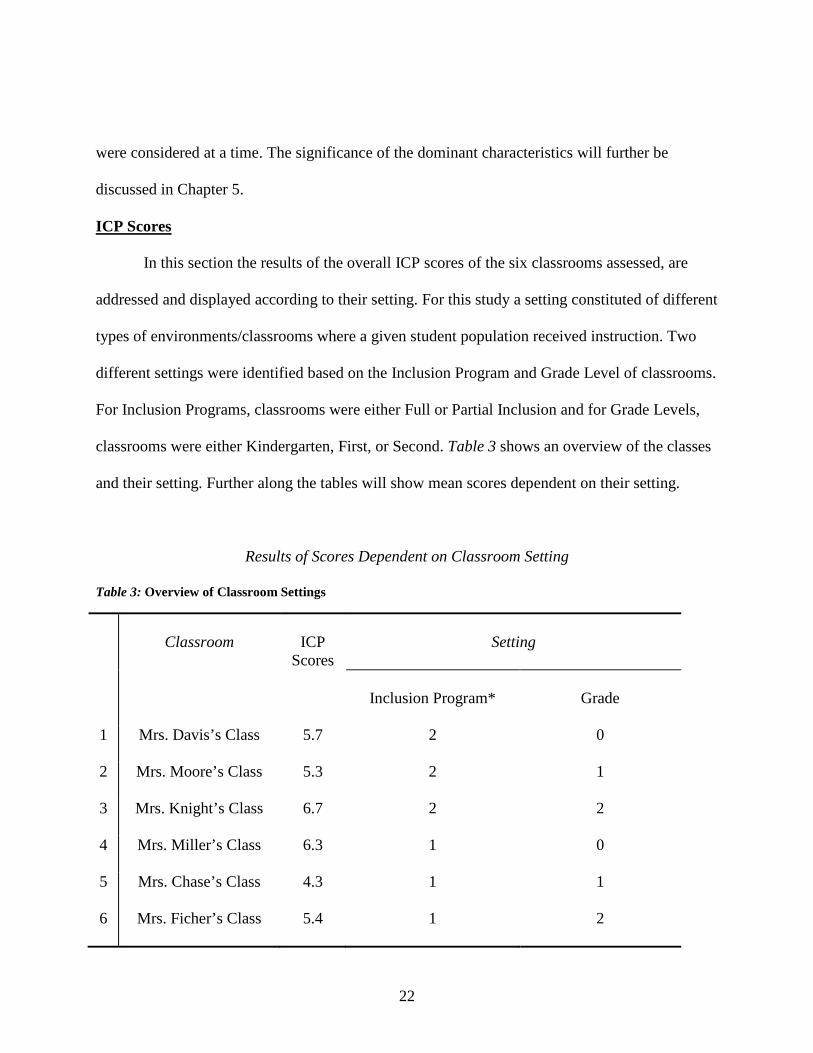
ICP Scores
In this section the results of the overall ICP scores of the six classrooms assessed, are
addressed and displayed according to their setting. For this study a setting constituted of different
types of environments/classrooms where a given student population received instruction. Two
different settings were identified based on the Inclusion Program and Grade Level of classrooms.
For Inclusion Programs, classrooms were either Full or Partial Inclusion and for Grade Levels,
classrooms were either Kindergarten, First, or Second. Table 3 shows an overview of the classes
and their setting. Further along the tables will show mean scores dependent on their setting.
Results of Scores Dependent on Classroom Setting
Table 3: Overview of Classroom Settings
Classroom
ICP
Scores
Setting
Inclusion Program*
Grade
1
Mrs. Davis’s Class 5.7 2 0
2
Mrs. Moore’s Class 5.3 2 1
3
Mrs. Knight’s Class 6.7 2 2
4
Mrs. Miller’s Class 6.3 1 0
5
Mrs. Chase’s Class 4.3 1 1
6 Mrs. Ficher’s Class 5.4 1 2

23
This table shows the six classrooms overall scores, from a scale of 1 to 7, and their
settings. In this table the settings were coded for numerical data. For the setting of Inclusion
Program, a 2 was given to those classrooms participating in Full Inclusion and a 1 was given to
those classrooms participating in Partial Inclusion. For the setting of grade, classrooms were
given codes as follows: 0 for Kindergarten, 1 for First grade, and 2 for Second grade.
Setting: Inclusion Program* Table 4: Mean ICP Scores Dependent on Inclusion Program
Classroom
ICP Score
Mean
Full
Mrs. Davis’s Class
5.7
5.9 Mrs. Moore’s Class
5.3
Mrs. Knight’s Class
6.7
Partial
Mrs. Miller’s Class
6.3
5.3 Mrs. Chase’s Class
4.3
Mrs. Ficher’s Class
5.4
In this table a mean was calculated of the ICP scores dependent on the Inclusion Program
the classrooms participated in. The mean was calculated to compare if any of the two Inclusion
Programs scored higher on the ICP collectively.

24
Setting: Grade Level
Table 5: Mean ICP Score Dependent on Grade Level
Grade
Classroom
ICP Score
Mean
K
Mrs. Davis’s Class
5.7
6
Mrs. Miller’s Class
6.3
1
Mrs. Moore ’s Class
5.3
4.8 Mrs. Chase’s Class
4.3
2
Mrs. Knights Class
6.7
6.1 Mrs. Ficher’s Class
5.4
In this table a mean was calculated of the ICP scores dependent on the Classrooms’
Grade Levels. The mean was calculated to compare if any of the three grade levels scored higher
on the ICP collectively.
*Dominant Setting: Inclusion Program
When considering the settings of Grade Level and Inclusion Program, Inclusion Program
was the dominant setting. Attention was given to the possible relationship between the ICP
Scores and Inclusion Programs, because it was noticed that the mean of classrooms participating
in Full Inclusion Programs was higher than the mean of the classrooms participating in Partial
Inclusion Programs. The Inclusion Program and ICP scores were analyzed by listing all scores

25
and all Inclusion Programs for each individual classroom, not collectively through the mean of
each Inclusion Program. Classroom data was coded as a 2 for a Full Inclusive Program and a 1
for a Partial Inclusive Program. The classroom data and the ICP scores were then analyzed
using the Pearson Correlation Test in search of a correlation. The results of the correlation found
between the ICP score and the Inclusion Program of each class is presented in Table 6.
Table 6: Pearson Correlation Coefficients between ICP Scores and Inclusion Program
Correlations Scores Program
Scores Pearson Correlation 1 .369 Sig. (2-tailed) .471 N 6 6
Program Pearson Correlation .369 1 Sig. (2-tailed) .471 N 6 6
*p<.05
The table shows the Pearson Coefficients between the ICP Scores and the Inclusion
Program. The coefficient .471 is not significant at .05, but shows a positive relationship between
ICP Scores and classrooms who were implementing Full Inclusion. Full Inclusion Programs
were coded as a 2 and Partial Inclusion Programs were coded as a 1. Since 2 is a bigger number,
the relationship is that as ICP Scores went up, the Inclusion Program went up as well. This
implies that classrooms participating in Full Inclusion programs had higher scores than those
classrooms participating in Partial Inclusion programs.

26
Teacher Characteristics
For this study only self-reported teacher demographics were used as Teacher
Characteristics. Teacher Characteristics collected pertained to three subgroups: a) Personal
Information, b) Education, and c) Related Experience. This information was collected from the
Teacher Profile found in Appendix E. Teachers’ Age and Gender were collected under the
Personal Information subgroup. Teachers’ Highest Education and Number of Additional
Certifications (e.g. ESOL) were collected under the Education subgroup. Teachers’ Number of
Years of Experience (years teaching), ESE Certification (Y / N), and Number of Professional
Development Courses taken related to Education were collected under the Related Experience
subgroup. An overview of the Teacher Characteristics collected can be found in Table 7.

27
Table 7: Overview of Teacher Characteristics
The table shows the various Teacher Characteristics collected. Coding was used to create
numerical data. For the teachers’ gender codes were given as follows: 0 for males and 1 for
females. In this case by chance, our study had all females. For the Teachers’ Highest Degree of
Education the codes were as followed: 1 for Bachelors, 2 for Masters, and 3 for Doctorates. For
the Teachers’ ESE Certification, the researcher coded a 1 for yes if they have it and a 1 for no if
they do not have it.
Teacher
ICP
Scores
Teacher Characteristics
Personal Information
Education
Related Experience
Age Gender Highest Educatio
n
Number of Additional
Certifications
Years of Experien
ce
ESE Certification*
Number of Professional Development
Courses Taken
Mrs. Davis
5.7
47
1
2
4
20
1
3
Mrs. Moore
5.3 40 1 2 4 27 1 3
Mrs.
Knight
6.7
44
1
1
1
11
1
3
Mrs. Miller
6.3 55 1 1 1 32 0 3
Mrs. Chase
4.3 28 1 1 1 5 0 2
Mrs. Ficher
5.4 29 1 2 2 6 0 3

28
Teacher Characteristic: Related Experience, ESE Certification (Y / N)*
Table 8: Mean ICP Scores Dependent on Teacher’s having ESE Certification (Y / N)
ESE Certification
Classroom
ICP Score
Mean
Yes
Mrs. Davis’s Class
5.7
5.9 Mrs. Moore’s Class
5.3
Mrs. Knight’s Class
6.7
No
Mrs. Miller’s Class
6.3
5.3 Mrs. Chase’s Class
4.3
Mrs. Ficher’s Class
5.4
In this table, means were calculated of the ICP scores dependent on those teachers who
had their ICP Certifications and those teachers who did not have their ESE certification. The
means were calculated to compare if either teachers with or without their ESE certifications
scored higher on the ICP collectively.
*Dominant Teacher Characteristic: Related Experience (ESE Certification)
Among all the Teacher Characteristics collected, Teachers’ Related Experience,
particularly the status of their ESE Certification, was the dominant characteristic and was further
analyzed. The possible relationship between the ICP scores and the Teachers’ ESE Certification

29
was explored because it was noticed that collectively those teachers who had their ESE
Certification, scored higher than those who did not.
Table 9: Pearson Correlation Coefficients between ICP Scores and ESE Certification
Correlations Scores ESE
Scores Pearson Correlation 1 .369 Sig. (2-tailed) .471 N 6 6
ESE Pearson Correlation .369 1 Sig. (2-tailed) .471 N 6 6
*p<.05
The table shows the Pearson Coefficients between the ICP Scores and the status of
teachers having their ESE Certification. The coefficient .369 is not significant at .05, but shows a
positive relationship between ICP Scores and teachers who had an ESE Certification. Teachers
who did not have an ESE certification were coded with a 0 and Teachers with an ESE
certification were coded with a 1. Since 1 is a bigger number, the relationship is that as ICP
Scores went up the ESE Certification status went up as well. This implies that the classrooms of
teachers with ESE Certifications had higher ICP scores than those classrooms of teachers that did
not have ESE Certifications.
Student Characteristics
For this study only collected students’ demographic characteristics were considered. The
Student Characteristics were collected from three subgroups: a) Gender, b) Type of Disability,
and c) Severity of their disability. Only the percentage of students with these characteristics were

30
displayed. To describe Gender, the percentage of males and females in each class were
displayed. For Type of Disability, disabilities were categorized into broader types of disabilities
such as, Cognitive, Communication, Physical, Social, Emotional, and Developmental. From the
number of ESE students in the class the percentage of each disability was calculated to better
describe the ESE population in each class.
The severity of individual students with disabilities were collected and used to determine
the overall severity of the disabilities present in each classroom. During the data collection
process, a 1 was given to a student with a mild disability, a 2 was given to a student with a
moderate disability, and a 3 was given to a student with a severe disability. Then for each class
the number of students with mild disabilities were added together, the number of students with
moderate disabilities were added together, and the number of students with severe disabilities
were added together. Percentages for each of the categories were calculated, to provide an
overview of the general severity of the ESE population in each classroom. An overview of the
Student Characteristics can be found in Table 10 below.

31
Table 10: Scores Compared to Student Characteristics (Gender, Type of Disability, & Severity of Disability)
Class-room
ICP Scores
Student Characteristics
Gender (% from Students)
Type of Disability (% from ESE)
Severity*
(% from ESE)
F M Cognitiv
e
Communication
Physical
Social
Emotional
Developmental
Mild Moderate
Severe
Mrs.
Davis’s Class
5.7
12.5
87.5
23.1
0
7.7
7.7
0
61.5
61.5
30.8
7.8
Mrs. Moore’s
Class
5.3 25 75 0 33.3 33.3 11.1 0 22.2 77.8 11.1 11.1
Mrs. Knight’s
Class
6.7 50 50 16.7 25 41.7 16.7 0 0 58.3 16.7 25
Mrs. Miller’s
Class
6.3 44.4 55.6 0 0 100 0 0 0 0 100 0
Mrs. Chase’s Class
4.3 50 50 0 0 100 0 0 0 0 0 100
Mrs. Ficher’s
Class
5.4 41.2 58.8 0 0 0 50 0 50 100 0 0
The table shows student characteristics as collected from each classroom. The gender
percentage is calculated for the whole class. The type of disability percentage is taken from only

32
the ESE students in the class. The severity percentage is taken only from the ESE students in the
class.
Student Characteristic: Severity (Mild, Moderate, or Severe)*
Table 11: Mean ICP Scores Dependent on Severity of Disabilities
Severity
Class
ICP Score
Mean
1
Mrs. Davis’s Class
5.7
5.8
Mrs. Moore’s Class
5.3
Mrs. Knight’s Class
6.7
Mrs. Ficher’s Class
5.4
2
Mrs. Miller’s Class
6.3
6.3
3
Mrs. Chase’s Class
4.3
4.3
In this table a mean was calculated for the ICP scores for each set of classroom according
to the predominant severity level of disabilities present in the classroom. If the majority of ESE
students in the class had a mild severity the classroom was given a 1. If the majority of ESE
students in the classroom had a moderate severity the classroom was given a 2. If the majority of
the ESE students in the classroom had a severe severity the classroom given a 3. The mean was

33
calculated to compare if each level of severity represented by the classrooms scored higher or
lower on the ICP collectively.
*Dominant Student Characteristic: Severity; Mild, Moderate, or Severe
Among all the Student Characteristics collected, the Severity of students’ disabilities was
the dominant characteristic and was further analyzed. Possible relationships were investigated
between the ICP scores and the Severity of the classrooms, particularly classrooms that were
categorized as severe. Findings depict that classrooms with students who had more severe
disabilities had the lowest ICP scores.
Table 12: Pearson Correlation Coefficients between ICP Scores and Severity of Disabilities
Correlations Scores Severity
Scores Pearson Correlation 1 -.555 Sig. (2-tailed) .253 N 6 6
Severity Pearson Correlation -.555 1 Sig. (2-tailed) .253 N 6 6
*p<.05
The table shows the Pearson Coefficients between the ICP Scores and the Severity of
disabilities represented by the classroom. Although the findings do not indicate a significant
correlation at .05, it is interesting to consider the direction of the correlation. A negative
coefficient of -.555 indicates an inverse relationship between ICP Scores and the Severity of
disabilities represented by a classroom. Classrooms that had the majority of ESE students with
34
mild disabilities were coded with a 1, classrooms with a majority of ESE students with moderate
disabilities were coded with a 2, and classrooms with majority of ESE students with severe
disabilities were coded with a 3. Therefore, classrooms with students with more severe
disabilities had the higher numbers given to classrooms. The classrooms’ severities were
inputted individually rather than using the means of classrooms with same severity. Findings
depict that classrooms with a higher number of students with severe disabilities scored lower
than classrooms with a less severe level of disability.
Classroom Characteristics
For this study we considered Classroom Characteristics as any demographic pertaining to
the classroom as a whole. The Classroom Characteristics were based on data collected based on
two subgroups: Student Ratios and Support. For subgroup Student Ratios, the number of students
in each class and the percentage of ESE students in each class were collected. For the subgroup
Support, the Number of Teachers in each classroom and the Number of Paraprofessional in each
classroom were collected. The data collected for the Classroom Characteristics was collected
from the Classroom Profile found in Appendix F. An overview of all the Classroom
characteristics can be found in Table 13 below.
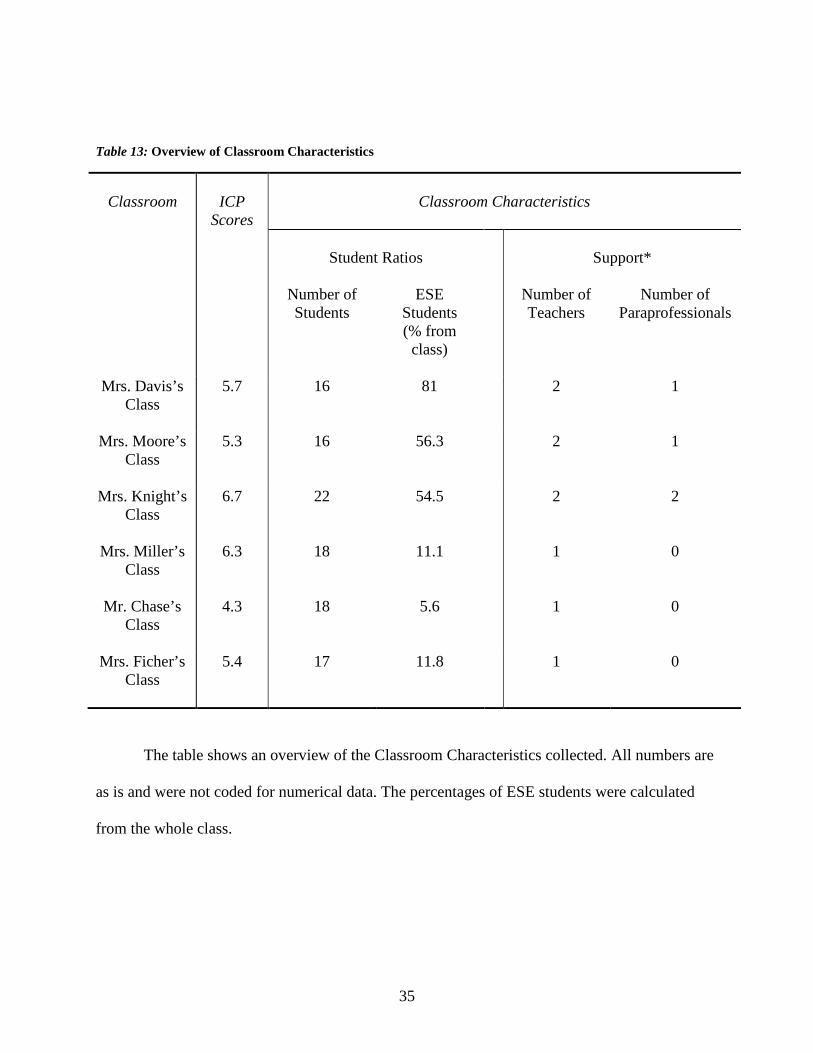
35
Table 13: Overview of Classroom Characteristics
Classroom
ICP
Scores
Classroom Characteristics
Student Ratios
Support*
Number of Students
ESE Students (% from
class)
Number of Teachers
Number of Paraprofessionals
Mrs. Davis’s Class
5.7 16 81 2 1
Mrs. Moore’s Class
5.3 16 56.3 2 1
Mrs. Knight’s Class
6.7 22 54.5 2 2
Mrs. Miller’s Class
6.3 18 11.1 1 0
Mr. Chase’s Class
4.3 18 5.6 1 0
Mrs. Ficher’s Class
5.4 17 11.8 1 0
The table shows an overview of the Classroom Characteristics collected. All numbers are
as is and were not coded for numerical data. The percentages of ESE students were calculated
from the whole class.
36
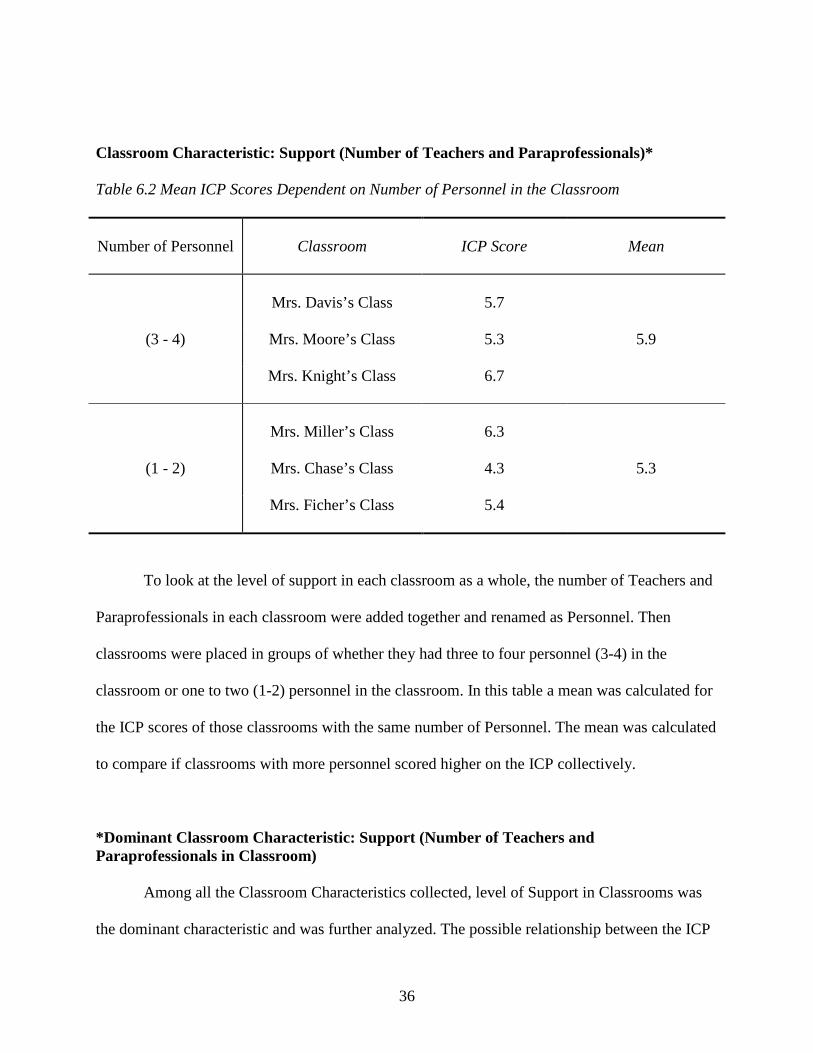
Classroom Characteristic: Support (Number of Teachers and Paraprofessionals)*
Table 6.2 Mean ICP Scores Dependent on Number of Personnel in the Classroom
Number of Personnel
Classroom
ICP Score
Mean
(3 - 4)
Mrs. Davis’s Class
5.7
5.9 Mrs. Moore’s Class
5.3
Mrs. Knight’s Class
6.7
(1 - 2)
Mrs. Miller’s Class
6.3
5.3 Mrs. Chase’s Class
4.3
Mrs. Ficher’s Class
5.4
To look at the level of support in each classroom as a whole, the number of Teachers and
Paraprofessionals in each classroom were added together and renamed as Personnel. Then
classrooms were placed in groups of whether they had three to four personnel (3-4) in the
classroom or one to two (1-2) personnel in the classroom. In this table a mean was calculated for
the ICP scores of those classrooms with the same number of Personnel. The mean was calculated
to compare if classrooms with more personnel scored higher on the ICP collectively.
*Dominant Classroom Characteristic: Support (Number of Teachers and Paraprofessionals in Classroom) Among all the Classroom Characteristics collected, level of Support in Classrooms was
the dominant characteristic and was further analyzed. The possible relationship between the ICP
37
scores and the number of personnel in each classroom was explored. Findings indicate that those
classrooms with more personnel scored higher on the ICP collectively than those classrooms
who had less personnel.
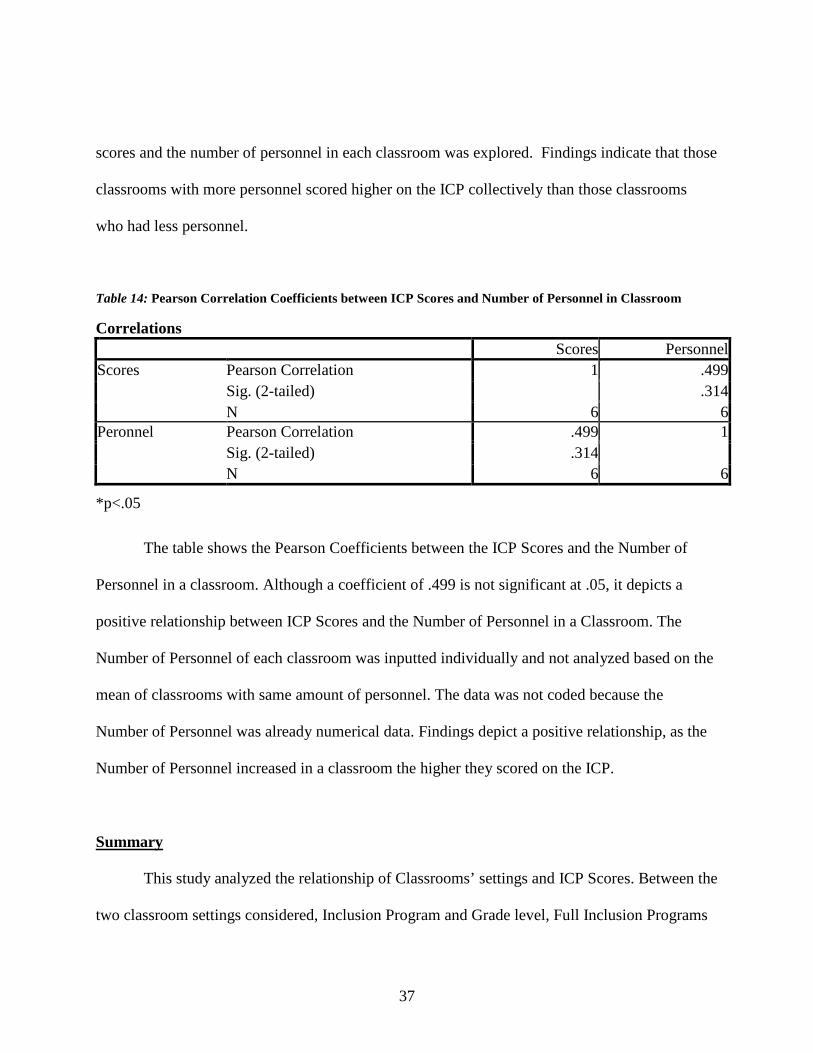
Table 14: Pearson Correlation Coefficients between ICP Scores and Number of Personnel in Classroom
Correlations Scores Personnel
Scores Pearson Correlation 1 .499 Sig. (2-tailed) .314 N 6 6
Peronnel Pearson Correlation .499 1 Sig. (2-tailed) .314 N 6 6
*p<.05
The table shows the Pearson Coefficients between the ICP Scores and the Number of
Personnel in a classroom. Although a coefficient of .499 is not significant at .05, it depicts a
positive relationship between ICP Scores and the Number of Personnel in a Classroom. The
Number of Personnel of each classroom was inputted individually and not analyzed based on the
mean of classrooms with same amount of personnel. The data was not coded because the
Number of Personnel was already numerical data. Findings depict a positive relationship, as the
Number of Personnel increased in a classroom the higher they scored on the ICP.
Summary
This study analyzed the relationship of Classrooms’ settings and ICP Scores. Between the
two classroom settings considered, Inclusion Program and Grade level, Full Inclusion Programs

38
collectively scored higher than those classrooms classified as Partial Inclusion Programs. The
Pearson Correlation Test between the ICP Scores and the Classroom’s Inclusion Program found
no significant correlations at .05. Analysis of the categorizing characteristics: Teacher
Characteristics, Student Characteristics, and Classroom Characteristics and the ICP Scores were
compared next.
Teacher Characteristics we divided into three subgroups: a) Personal Information, b)
Education, and c) Related Experience. From these subgroups, Related Experience, was analyzed
further by considering Teachers’ Number of Years teaching and whether or not they had their
ESE Certification. When looking at the teachers’ ESE Certification status, the teachers that had
their ESE certification, collectively scored higher on the ICP than those teachers who did not
have their ESE Certification. Nevertheless, the Pearson Correlation Test between the ICP Scores
and Teachers’ ESE Certification Status found no significant correlations p< .05.
Student Characteristics were divided into three subgroups: a) Gender, b) Type of
Disability, and c) Severity. From these subgroups, further analysis was done to the Severity of
the ESE students in the classroom. Each classroom was assigned a category according to the
degree of disability of the majority of the ESE students in each classroom. The categories were
mild, moderate, or severe. Classrooms in which the majority of ESE students had severe
disabilities scored lower on the ICP. Nevertheless, the Pearson Correlation Test between the ICP
Scores and the Classrooms’ Representation of the ESE student’s severity found no significant
correlations p< .05.
Classroom Characteristics we divided into two subgroups: a) Student Ratios and b)
Support. From these subgroups further analysis was done the level of Support. Support was
39
analyzed collectively by adding the number of teacher and paraprofessionals in a classroom and
renaming them as personnel. When looking at the classroom who had (3-4) personnel compared
to those classroom who had (1-2) personnel, those classroom who had (3-4) personnel in their
classroom scored collectively higher on the ICP than those classrooms who had (1-2) personnel.
Nonetheless, the Pearson Correlation Test between the ICP Scores and the number of personnel
in a classroom found no significant correlations at p< .05.
The results demonstrated that no statistically significant relationships exist between any
of the characteristics and the trends of the ICP scores. Therefore, the null hypothesis was
accepted, but suggestions for future Implementation of Inclusive Classrooms were compiled and
will be discussed in Chapter 5.

40
CHAPTER FIVE: DISCUSSION
Overview
Despite not finding statistically significant data to support a relationship between any of
the three dominant characteristics and trends in ICP Scores, there were some characteristics that
had a greater impact on the classrooms’ overall ICP Scores. The small size of the sample could
have affected the analysis and therefore prevented to find statistically significant results.
However, even with a small sample size it is possible to see trends in those classrooms that
scored higher on the ICP. Through the process of assessing classrooms with the ICP, the
researcher was also able to collect compelling qualitative data.
This study was guided by the research question (1) What are the dominant teacher,
student, and classroom characteristics that contribute to the effective implementation of best
practices in primary inclusion classrooms? In this study the ICP scores represented the degree in
which inclusive classrooms were implementing best practices. The ICP enabled us to see many
factors affecting, which included some that can be controlled by school personnel and others that
cannot. For example, although schools may be limited by budget constraints, efforts may still be
made in strategically staffing classrooms and having higher qualified personnel in the room.
This study found that common traits do exist among classrooms who are implementing
successful inclusive programs. When comparing scores of the Inclusion Program setting
between Full and Partial the means showed that collectively Full Inclusion Programs scored
higher on the ICP Partial Inclusion Programs. Although the results were not statistically

41
significant, some observations may be made to help explain these results and possible
relationships.
In the results, the ICP Scores of those classrooms participating in Full Inclusion Programs
were exactly the same as the mean ICP Score of those teachers who had their ESE Certifications.
Unlikely to be just a coincidence, since the same group of teachers who participated in Full
Inclusion were the same group of teachers who had their ESE Certifications. In fact, none of the
teachers in Partial Inclusion Programs had their ESE certifications. All teachers in the Full
Inclusion Program were required to be ESE certified while teachers in Partial Inclusion Programs
were not. ESE certification may be a contributing factor for Full Inclusion Programs scoring
higher on the ICP collectively than the Partial Inclusion Programs.
The mean of ICP scores of Full Inclusion Programs was yet again the same as another
characteristic that was explored. Support, among the Classroom Characteristics had the same
mean of ICP Scores as the Full Inclusion Programs. Once more it is unlikely that this is a
coincidence since the same classroom group that follows a Full Inclusion Program was the same
classroom group that had more (3-4) personnel. In the partial inclusion classrooms when the
ESE students came from their homerooms into their inclusive classroom they became an
additional student to the classroom, but the number of personnel in the classroom stayed the
same. The Partial Inclusion teachers did not receive any additional support when they received
ESE students into their classroom in addition to them not having their ESE certification. Giving
teachers support both physically and educationally is crucial to the success of an Inclusive
classroom. This may be another characteristic contributing to the higher scores of the Full
Inclusion on the ICP when compared to the Partial Inclusion Programs.

42
Among the 11 core qualities of the ICP, one may want to further examine Membership
for both the Full Inclusion and Partial Inclusion programs. Membership was defined as having
all students feel accepted regardless of their differences. In a Partial Inclusion Program, ESE
students are only a part of the classroom for a part of the day, thus the term partial. This may
make it more difficult for ESE students to feel a sense of belongingness when they enter their
Inclusive classroom daily for only a fraction of the day. The student may not feel belongingness
within their classroom and interactively, the teacher may not feel ownership of the student.
Correspondingly, the ICP assesses how a teacher progress monitors students. When I asked Mrs.
Chase, a first grade teacher from our study, who participated in partial inclusion, “What do you
do to progress monitor the ESE student who comes in daily?” she responded, “I don’t usually
progress monitor the ESE student, he is only here for an hour, so his ESE teacher is the one who
takes care of that.” The other Partial Inclusion teachers responded in a similar way.
This type of response affected their scores in both areas of membership and progress
monitoring. Since the ESE students only came to their classroom for only an hour or so, they
were seen more as daily visitors than students from that class, making it difficult for students to
feel like members of the classroom. Feeling accepted in a classroom plays a large role in
students, emotional needs and may affect a child’s performance in the classroom. In fact,
according to Maslow’s Hierarchy of Needs (Maslow, 1943), Love and Belongingness are the
initial hurdles before a student can reach their fullest potential. Likewise, in the area of progress-
monitoring, students in the Partial Inclusion Classrooms were not being monitored as frequently
by their general education teacher and some were not being progress monitored at all. Progress
monitoring is beneficial to both the teacher and the students. It notifies teachers whether their
43
teaching methods are being effective and it also shows students’ strengths and weaknesses. If the
general education teacher does not know where the student needs improvement, how is the
student serviced going to have his/ her needs met? Subsequently, how can the quality of the
inclusion program be improved if areas of weakness are unknown?
The goal of Partial Inclusion Programs is to equip and prepare ESE students for the long-
term goal of being in general education classrooms full time. However, they are being seen as
temporary students rather than stationary students, which is not what inclusion entails. Inclusion
means to become a part of. If students are hoped to be successfully included, they must first be
given the opportunity to do so and be treated as a member not as a visitor.
The 11 core qualities of the ICP were set into place for significant reasons and all bind
together to create a strong foundation for inclusion settings implementing best practices. The 11
core qualities are all interconnected in many ways. When one quality is lacking it may have a
ripple effect. For example, when the areas of membership and progress monitoring were not
executed correctly the next area to be affected was student’s accommodations. Since students
were only seen as temporary students and not permanent students in the partial inclusion
programs, their necessary equipment were usually left behind in their homerooms or not given
the assistance for use because of lack of time or personnel. Students’ accommodations and
necessary equipment are what facilitates learning and helps students overcome their disabilities.
Placing students without their necessary tools in a classroom that is already a more difficult
learning environment for them, deprives students of being able to adequately participate in
inclusion programs.

44
Furthermore, when the two classrooms’ scores are compared, the lowest and the highest
on the ICP reveal some very clear distinctions. Mrs. Knight’s class scored the highest on the ICP
with a score of 6.7. Mrs.Chase’s class scored the lowest on the ICP with a score of 4.3. Mrs.
Knight teaches in a Full Inclusion Setting. She has her ESE certification and of all the
classrooms had the highest number of personnel (4) in her classroom: two teachers and two
paraprofessionals. Mrs. Chase teaches in a Partial Inclusion Program. She does not have her ESE
certification and receives no additional support when the ESE student joins her classroom.
Another interesting characteristic of Mrs. Chase’s classroom is that the only student participating
in her Inclusion classroom had severe physical disabilities. The severity of her student’s
disability skewed the classroom classification and was assigned a “majority severe” code.
Conversely, Mrs. Knight’s class had a majority of ESE students with mild disabilities in her
classroom.
As the researcher examined possible reasons for Mrs. Knight’s class scoring higher on
the ICP than Mrs. Chase’s class, attention was given to the level of accommodations provided to
students in these classrooms. When considering the student characteristic of severity, it is
important to consider that it could be harder to make accommodations for ESE students with
severe disabilities than ESE students with mild disabilities. Yet, when looking back, Mrs.
Chase’s class had the lowest percentage of ESE students while Mrs. Knight had among the top
three highest percentages of ESE students in her class. So why did Mrs. Chase score lower on the
ICP with less ESE students and Mrs. Knight score higher on the ICP with more ESE students?
Perhaps, succeeding in a classroom with less ESE students is easier, but Mrs. Chase’s class was
only Partial Inclusion while Mrs. Knight’s class was full inclusion. This may lead to the thinking
45
that Mrs. Knight’s Full Inclusion class was better equipped to accommodate students’ needs
initially all day unlike Mrs. Knight’s Partial Inclusion class because the student is only in the
classroom for a part of the day. It is assumed that the child can do without certain
accommodations because it is only for a brief part of the day. Students are being left without
their designated equipment that helps them succeed in their learning environment. Although
Partial Inclusion programs take place for a temporary part of the day it sill crucial part of the day
to the students’ education.
All of the dominant characteristics further analyzed were found to be contributing factors
to the ICP scores between the highest and lowest scoring classrooms. When acknowledging the
Teacher Characteristic of Related Experience, the teacher with the ESE Certification scored the
highest. When acknowledging the Student Characteristic of Severity, the classroom represented
by a majority of ESE students with severe disabilities scored the lowest. Lastly, when
acknowledging the Classroom Characteristics of Support, the classroom with the highest number
of personnel scored the highest on the ICP. It is obvious that when teachers are not adequately
prepared and supported to serve students with disabilities, their classrooms are left to minimally
carry through the ethics of inclusion. In order for inclusion classrooms to strive for best
practices they must possess qualities such as membership, providing materials/equipment, and
monitoring students progress. Educators should be held accountable to fulfill all students’ needs
to their best of our abilities. There is a prominent demand for these dominant characteristics to be
evaluated by school personnel and be further researched. It is unethical to serve any student with
anything less than quality education.

46
Suggestions for Future Implementation of Inclusion Classrooms
These observations clearly suggest three very specific characteristics that are likely
necessary for a successful Inclusive Classroom Setting. The first falls under Teacher
Characteristics, all teachers must earn an ESE certification. Higher standards regarding teacher
preparation are necessary to better understand and serve the needs of ESE students. Secondly,
further examination of Student Characteristics is crucial to ensure that the severity of the
students’ disabilities is considered when placing students in their classrooms. Every classroom
should provide the necessary accommodations such as assistive technologies to better serve
students’ needs. Finally, considering Classroom Characteristics and providing teachers with the
necessary support is vital. Teachers who are given more ESE students in their classroom need a
supporting staff to accommodate teacher-to-student ratios in a manner that is conducive to
learning. With the emphasis towards inclusion, research should continue investigating the
commonalities among classrooms that are implementing successful inclusive programs, so that
one day ALL students receive the free, appropriate education to which they are entitled to.

47
APPENDIX A: UCF IRB Approval Letter

48
Appendix A: UCF IRB Approval Letter

49
APPENDIX B: Principal Letters to IRB

50
Appendix B: Principal Letters to IRB

51

52
APPENDIX C: Orange County Public Schools Approved Research Request Form
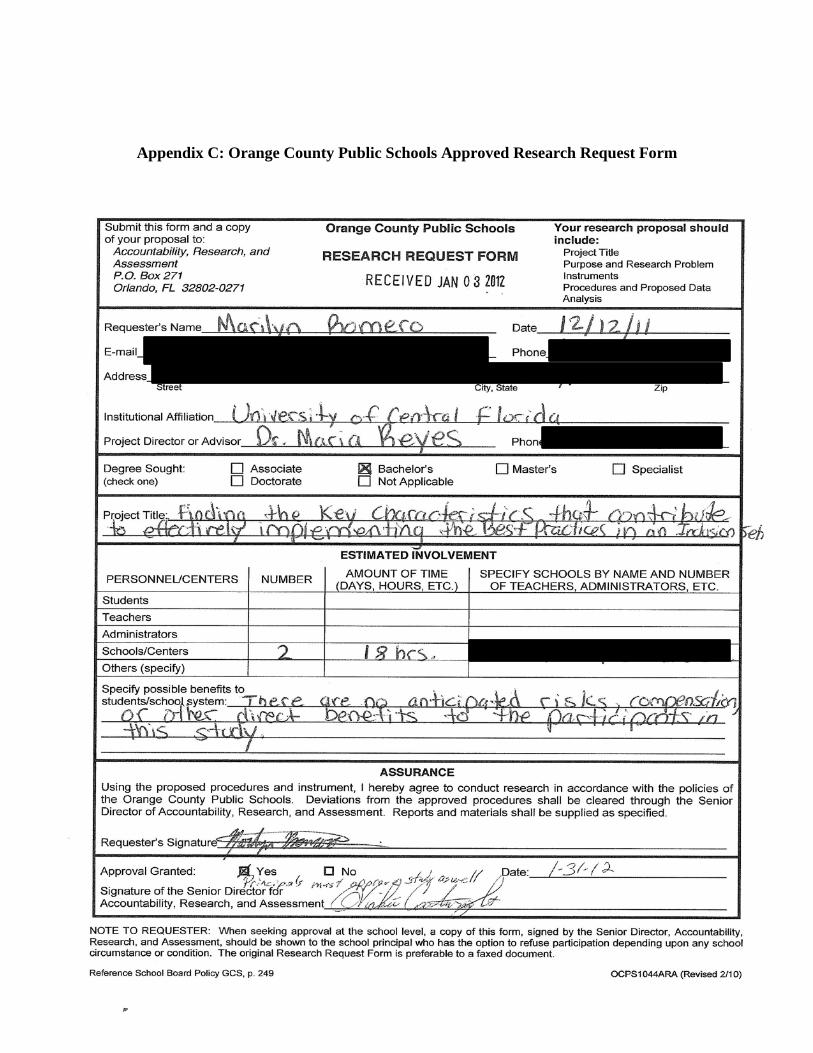
53
Appendix C: Orange County Public Schools Approved Research Request Form

54
APPENDIX D: Principal Letters to Orange County Public Schools

55
Appendix D: Principal Letters to Orange County Public Schools

56

57
APPENDIX E: Teacher Profile

58
Appendix E: Teacher Profile
Classroom: 1 2 3 │ 4 5 6 Inclusion Setting: Partial or Full Teacher : A B C ---------------------------------------------------------------------------------------------------------------------
Teacher Profile
Personal Information: 1. Age:________
2. Gender:________
Education: 3. Degrees (Check all that apply)
□ Bachelors in: ____________________
□ Masters in: ____________________
□ Doctorates in: ____________________
4. List any additional certifications _____________________________ _____________________________ _____________________________ _____________________________
Related Experience:
5. Number of years teaching: ______________
6. ESE Certification (circle): Yes or No
7. Professional Development Courses Taken (Circle):
(0-4) (5-9) (10-14) (15 +)

59
APPENDIX F: Classroom Profile

60
Appendix F: Classroom Profile
Classroom: 1 2 3 │ 4 5 6 Inclusion Setting: Partial or Full ---------------------------------------------------------------------------------------------------------------------
Classroom Profile 1. Number of Teachers:________ 2. Number of Paraprofessionals:________ 3. Number of Students in Classroom:________ 4. Number of Female Students:________ 5. Number of Male Students:________ 6. Number of ESE Students in Classroom:________ 7. Student Demographics:
Type of Disability Severity Mild (1) Moderate (2) Severe (3)
Gender Male (M) Female (F)
Service (If Partial) Time spent in Inclusion: 1hr- 2hr (A) 2hr- 3hr (B) 3hr- 4hr (C)
List Subjects: Math (M) Language Arts (LA) Social Studies (SS) Science (S) Specials (SP) Lunch (L)
Cognitive 1.
2.
3.
4.
5.
Communication 1.
2.
3.
4.
5.
Physical
61
1.
2.
3.
4.
5.
Social 1.
2.
3.
4.
5.
Emotional 1.
2.
3.
4.
5.
Developmental 1.
2.
3.
4.
5.

62
APPENDIX G: Assessment Tool: Inclusion Classroom Profile (ICP)
63
Appendix G: Assessment Tool: Inclusion
64

65
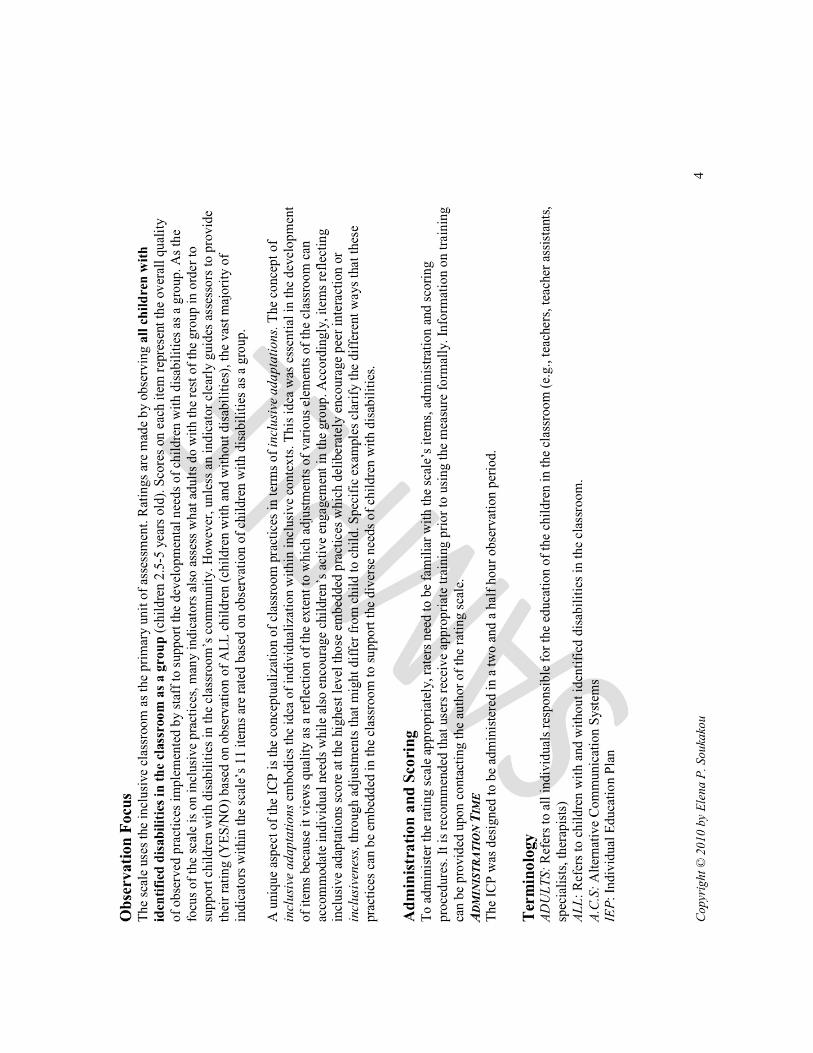
66
67

68
REFERENCES Aber, L., Chaudry, A., & Urban, I. (2010). Low-income children, their families and the
greatrecession: What next in policy? Urban Institute. Retrieved 25 July 2011.
http://www.urban.org/publications/412069.html
Allen, P., Ciancio, J., & Rutkowski, S. (2008). Transitioning students with disabilities into work.
Techniques: Connecting Education and Careers, 83(2), 22-25.
Allington, R. L. (2007). Intervention all day long: New hope for struggling readers. Voices From
The Middle, 14(4), 7-14.
Beattie, I., & Olley, P. (1977). Non-instructional factors relating to classroom climate: an
exploratory study. Education, 98, 180-184.
Bondy, A., & Frost, L. (1994). The picture exchange communication system. Focus on Autistic
Behaviour, 9, 1–19.
Cote, D. L. (2011). Implementing a problem-solving intervention with students with mild to
moderate disabilities. Intervention in School and Clinic, 46(5), 259-265. Retrieved 24
July 2011. http://isc.sagepub.com/content/46/5/259
Devlin, N. (2009). The rules grid: Helping children with social communication and interaction
needs manage social complexity. Educational Psychology in Practice, 25(4), 327-338.
Frisby, B. N., & Martin, M. M. (2010). Instructor-student and student-student rapport in the
classroom. Communication Education, 59(2), 146-164.
Glago, K. D. (2005). The effect of problem solving self-determination instruction on elementary
students with learning disabilities and emotional disabilities. Dissertation Abstracts
International, 66(02), 549.
69
Gragnon, E. (2001). Power Cards: Using special interests to motivate children and youth with
Asperger syndrome and autism. Shawnee Mission, KS: Autism Asperger Publishing Co.
Gray, C.A. (1994). Comic strip conversations: Arlington: Future Directions.
Gray, C.A. (1995). Teaching children with autism to “read” social situations. In K.A. Quill (Ed.),
Teaching children with autism: Strategies to enhance communication and socialization
(pp. 219–242). New York: Delmar.
Groden, J., & LeVasseur, P. (1995). Cognitive picture rehearsal: A system to teach self-control.
In K.A. Quill (Ed.), Teaching children with autism: Strategies to enhance communication
and socialization (pp. 287–306). New York: Delmar.
Hodgdon, L. (1995). Solving social-behaviour problems through the use of visually supported
communication. In K.A. Quill (Ed.), Teaching children with autism: Strategies to
enhance communication and socialization (pp. 256–286). New York: Delmar.
Kargin, T., Guldenoglu, B., & Sahin, F. (2010). Opinions of the general education teachers on
the adaptations for students with special needs in general education classrooms.
Educational Sciences: Theory and Practice, 10(4), 2455-2464.
Kern, L., Wacker, D.P., Mace, F.C., Dunlap, G., & Kormrey, J.D. (1995). Improving the peer
interaction of students with emotional and behavioural disorders through self-evaluation
procedures: A component analysis and group application. Journal of Applied Behaviour
Analysis, 28, 47–59.
Kiernan, C. (1983). The use of nonvocal communication techniques with autistic individuals.
Child Psychology and Psychiatry, 24(3), 339–375.

70
Kilanowski-Press, L., Foote, C. J., & Rinaldo, V. J. (2010). Inclusion classrooms and teachers: A
survey of current practices. International Journal of Special Education, 25(3), 43-56.
Kistner, J., Robbins, F., & Haskett, M. (1988). Assessment and skills remediation of hyper- lexic
children. Journal of Autism and Developmental Disorders, 18, 191–205.
Klotz, M. (2004). Help kids welcome disabled students. Education Digest: Essential Readings
Condensed for Quick Review, 69(6), 41-42.
Lin, L., & Atkinson, R. K. (2011). Using animations and visual cueing to support learning of
scientific concepts and processes. Computers & Education, 56(3), 650-658.
Ludtke, O., Robitzsch, A., Trautwein, U., & Kunter, M. (2009). Assessing the impact of learning
environments: How to use student ratings of classroom or school characteristics in
multilevel modeling. Contemporary Educational Psychology, 34(2), 120-131.
Maslow, A. H. (1943). A Theory of Human Motivation. Psychological Review, 50, pp. 370.
Mohr, L. L. (1995). Teaching Diverse Learners in Inclusive Settings: Steps for Adapting
Instruction.
National Autistic Society (NAS). (1994). Approaches to autism: An annotated list (2nd ed.).
London: NAS.
Olive, M. L. (2004). Transitioning children between activities: Effective strategies for decreasing
challenging behavior. Beyond Behavior, 14(1), 11-16.
Rowe, A. (2011). The personal dimension in teaching: Why students value feedback.
International Journal of Educational Management, 25(4), 343-360.
Schopler, E., & Mesibov, G.B. (1995). Learning and cognition in autism. New York: Plenum
Press.

71
Siegel, B. (1996). The world of the autistic child: Understanding and treating autistic spectrum
disorders. New York: Oxford University Press.
Soukakou, E.P. (2007). Assessment of classroom quality in inclusive preschool settings:
development and validation of a new observation measure. Unpublished D.Phil Thesis.
Department of Education, Oxford University.
Stecker, P. M., & Fuchs, L. S. (2000). Effecting superior achievement using curriculum-based
measurement: The importance of individual progress monitoring. Learning Disabilities:
Research & Practice, 15(3), 128-34.
Trawick-Smith, J., & Dziurgot, T. (2011). "Good-Fit" teacher-child play interactions and the
subsequent autonomous play of preschool children. Early Childhood Research Quarterly,
26(1), 110-123.
Wass, R., Harland, T., & Mercer, A. (2011). Scaffolding critical thinking in the zone of proximal
development. Higher Education Research and Development, 30(3), 317-328.
Williams, S., Mastergeorge, A. M., & Ontai, L. L. (2010). Caregiver Involvement in Infant Peer
Interactions: Scaffolding in a Social Context. Early Childhood Research Quarterly,
25(2), 251-266.
Wood, D., Bruner, J. S., & Ross, G. (1976). The role of tutoring in problem-solving. Journal of
Child Psychology and Psychiatry and Allied Disciplines, 17, 89–100.
van de Pol, J., Volman, M., & Beishuizen, J. (2010). Scaffolding in teacher-student interaction:
A decade of research. Educational Psychology Review, 22(3), 271-296.
Voelkl, K. E. (1995). School warmth, student participation, and achievement. Journal of
Experimental Education, 63, 127-139.

72
Vygotsky, L.S. (1978). Mind in society: The development of higher psychological processes.
Cambridge, MA: Harvard University Press.
Yazbak, F. Edward. (2003). Autism in the United States: A perspective. Journal of American
Physicians and Surgeons, 8(4), 103-107.