Embed Size (px)
Citation preview

Finding solutions for diverting food waste from landfills to compost: An urban, vacant lot assessment for the City of Milwaukee, Wisconsin
Nicole M. Enders Department of Geography, Honor Student of Conservation of Environmental Science - Major, Biological Sciences, Geography, and GIS – Minors; University of Wisconsin-Milwaukee
AbstractAs soil continues to be degraded and contaminated by continued fertilizer use and improper agricultural practices, researchers are looking into using natural soil amendments, such as food waste compost. Additionally, food waste is dominating landfill space in the United States. The objective of this study was to present two separate composting techniques for consideration: windrow and in-vessel composting. Windrow composting is a method where a long line of organic material is piled up to decompose over time. Common compostable items include organic waste such as food and yard trimmings, as well as, degradable animal and plant based materials. For large-scale windrow composting, a machine is often employed to turn and aerate the piles for optimum decomposition. In-vessel utilizes an enclosed structure for composting. While this paper highlights using an engineered system; other confined methods are also exploited. Old, run-down buildings or even simple plastic containers are utilized; however, decomposition factors must be controlled. Secondly, this research evaluated the current yearly amount of food waste for the City of Milwaukee and how this waste could be diverted from landfills to urban, city owned, vacant properties for composting. By using GIS methods to narrow down properties,
potential sites were presented as options for further analysis.
Keywords Milwaukee, GIS, land inventory, windrow composting, in-vessel composting, Earth Flow, zero waste, vacant land
IntroductionComposting food waste is growing in popularity as an organic soil amendment used in gardening due its nitrogen, phosphorus, and potassium content. (Li et al. 2013) Municipalities are composting with the goal to reduce waste entering landfills while converting organic material into a beneficial product (Mu et al. 2016).
Using compost to enhance soil nutrition reduces the use of synthetic fertilizers and increases the amount of carbon in the soil which decreases greenhouse gas emissions (Mu et al. 2016).
In the United States, food waste ranks as the largest waste product entering landfills with only 3% of the total waste being recycled (Saer et al. 2013).
In Wisconsin, there are more than 200 licensed composting facilities which are able to turn over 200,000 tons of yard waste each year (Lamensky 2016). However, the DNR determined that 500,000
1 | P a g e

tons of other compostable materials are ending up in landfills (Lamensky 2016).
There is growing momentum throughout the United States to reduce the amount of waste being produced. San Francisco leads the country with their zero waste initiatives and coverts 220,000 tons of organic waste into compost (Sullivan 2011). Using San Francisco’s achievements of recycling food residuals to compost, the City of Milwaukee can benefit by implementing a stronger, urban composting system.
Statistics used in this studyUsing the 2010 U.S. Census Bureau data, the City of Milwaukee (“City”) population total was 594,833; and, the County of Milwaukee (“County”) was 947,736, making the City 62.8% of the total County population (US Bureau 2010).
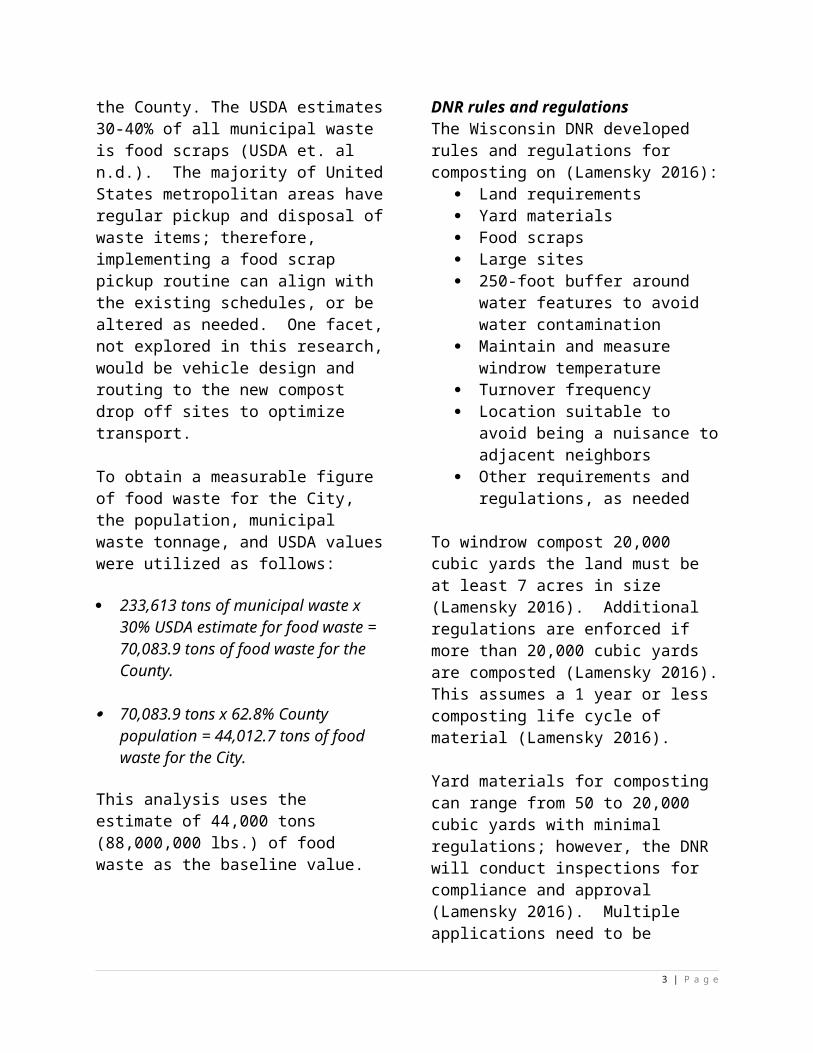
The Wisconsin DNR’s 2016 Municipal and Industrial Waste Landfill Tonnage report indicated a total of 233,613 tons of municipal waste for the County (DNR 2016). This waste was generated from residential, commercial, and industrial sectors throughout the County. The USDA estimates 30-40% of all municipal waste is food scraps (USDA et. al n.d.). The majority of United States metropolitan areas have regular pickup and disposal of waste items; therefore, implementing a food scrap pickup routine can align with the existing schedules, or be altered as needed. One facet, not explored in this research, would be vehicle design and routing to the new compost drop off sites to optimize transport.
To obtain a measurable figure of food waste for the City, the population, municipal
waste tonnage, and USDA values were utilized as follows:
233,613 tons of municipal waste x 30% USDA estimate for food waste = 70,083.9 tons of food waste for the County.
70,083.9 tons x 62.8% County population = 44,012.7 tons of food waste for the City.
This analysis uses the estimate of 44,000 tons (88,000,000 lbs.) of food waste as the baseline value.
DNR rules and regulationsThe Wisconsin DNR developed rules and regulations for composting on (Lamensky 2016):
Land requirements Yard materials Food scraps Large sites 250-foot buffer around water
features to avoid water contamination
Maintain and measure windrow temperature
Turnover frequency Location suitable to avoid being a
nuisance to adjacent neighbors Other requirements and regulations,
as needed
To windrow compost 20,000 cubic yards the land must be at least 7 acres in size (Lamensky 2016). Additional regulations are enforced if more than 20,000 cubic yards are composted (Lamensky 2016). This assumes a 1 year or less composting life cycle of material (Lamensky 2016).
2 | P a g e
Yard materials for composting can range from 50 to 20,000 cubic yards with minimal regulations; however, the DNR will conduct inspections for compliance and approval (Lamensky 2016). Multiple applications need to be completed and submitted along with obtaining a license (Lamensky 2016).
Food waste are considered source-separated material as they are separated prior to entering the trash (Lamensky 2016). Food scrap compost sites can manage 5,000-20,000 cubic yards which is applicable to 5 of the 6 sites evaluated in this study. Aside from food scraps, food containers and utensils that meet ASTM International standards for biodegradability may also be composted on these sites (Lamensky 2016).
Large compost sites turning over more than 20,000 cubic yards per year require a site inspection and a full operation plan to be reviewed and approved by the Wisconsin DNR (Lamensky 2016).
Composting methodsTwo popular compost methods include windrow composting and in-vessel systems. Compost has multiple factors which impact rate of decomposition and quality such as temperature, aeration, moisture content, pH, particle size, and degree of compaction (Onwosi et al. 2017). For reference, this paper summarizes the basic importance of these factors.
Windrow compostingThe internal temperature of a compost pile or windrow is an integral part for productive composting. Some analyses show that compost decomposition happens in stages and in each stage the internal temperature should be adjusted accordingly
(Onwosi et al. 2017). Temperature regulates the decomposition rate, kills off weed seeds and soil pathogens, and determines the microbial content (Onwosi et al. 2017). Microorganisms are useful in increasing nitrogen content, producing antimicrobial compounds that kill off pathogens and inhibit plant diseases from forming, and also give off heat (Onwosi et al. 2017).
Aeration is achieved by turning compost piles. Too much or too little turning drastically alters factors such as nitrogen content, total moisture, pH, temperature, amount of dry materials including total carbon to nitrogen ratios (Onwosi et al. 2017). A balanced aeration routine makes the material available to microorganisms, aiding in reducing overall compaction while allowing for gas emission (Onwosi et al. 2017). The compost contents impact the turning frequency as does particle size.
Particle size is directly related to the water holding capacity, porosity and degree of compaction, water and gas exchange, and end compost quality (Onwosi et al. 2017).
A critical factor in composting is maintaining the moisture content as this influences “oxygen uptake rate, free air space, microbial activity, and temperature of the process” (Onwosi et al. 2017). The compost contents determine the moisture content; however, sufficient moisture needs to be available to the microbial community otherwise decomposition rates slow (Onwosi et al. 2017).
In-vessel composting Using urban properties for windrow composting may cause issues for adjacent owners due to potential odors (Mu et al.
3 | P a g e

2016). By installing in-vessel systems, odor ceases to be an issue, and in addition to, requires less land to achieve similar composting goals. An added benefit of in-vessel systems includes automatic processing which reduces human effort for monitoring and turning over compost. A steel, rotary vessel created by Kean University was able to turn over 1000 pounds of food residuals each day (Mu et al. 2016). Other in-vessel systems, such as Green Mountain technologies can turn over as much as 6.7 tons per day using their Earth Flow system 10012-SB, but comes at a hefty price of $120,000 (Green Mountain Technologies 2015).
Objectives for studyThis research is a mere introduction of how a metropolitan area, the City of Milwaukee, could maximize food residual composting by diverting it from landfills to centralized, vacant, City owned real estate. The targeted property size is 1 acre in order to adequately create windrows and accommodate machinery for composting.
Several factors were not analyzed for this preliminary research; however, various variables should be evaluated on all potential compost sites:
Slope of land Duration of sunlight Sufficient access to and on to
property Odor buffer Current ground cover Environmental assessment Contamination assessment Soil analysis Utility access/connection Additional variables as
needed/required under (Chapter NR 502. Wis. Stats. 2017)
Additionally, the analysis reviewed privately owned billboard locations for placing in-vessel composting systems. This would require a partnership, agreement, or financial incentive between billboard owner and the City; however, the idea is that the government would have to donate less of their land to obtain the same food residual composting outcome. Investment in the in-vessel units may be a concern due to cost. A cost analysis breakdown for all aspects would be optimal to determine if windrow or in-vessel composting, or a blend between the two, should be considered.
Materials and MethodsThe analysis uses the City’s Master Property Record (“MPROP”) data and ArcMap 10.5 to narrow down potential properties as drop sites for windrow and in-vessel composting.
Vacant land methodology To obtain City property records and create a database, the full Master Property Records excel spreadsheet was downloaded then exported into Microsoft access database. Next step included isolating all vacant land records from MPROP using the Land_USE_GP column, sorting numerically, then extracting all vacant land records: Code 13.
After reviewing government entities several discrepancies and issues presented such as various title names being used and inconsistent formatting. An isolated owner list was created as a verification tool to ensure all properties were included.
4 | P a g e

Isolated Owner Names
Board of Regents
Century City Redevelopment
City of Milwaukee
Development Authority
Development for Community Empowerment
Foreclosed Asset
Housing Authority
Inner City Redevelopment
Milwaukee Community
Milwaukee County
Milwaukee Economic Development
Milwaukee Metro
Milwaukee Neighborhood Reclamation
Neighborhood Improvement
Redevelopment Authority
Register of Deeds
Secretary of Housing
State of Wisconsin
United States of America
Wisconsin
Table 1: Isolated Government Entities
Each record was analyzed to determine inclusion for analysis. After removing non-matching ownership records, roughly 4000 records remained.
The database was then uploaded into ArcMap along with the following shapefiles obtained online: from the County of Milwaukee’s Geospatial Data Portal:
street centerlines railroad tax parcel city limit city neighborhoods
The following shapefiles were obtained from USDA: NRCS: Geospatial Data Gateway:
hydrology (included main rivers, streams and bodies of water)
All layers were properly transformed into the same projected coordinate system: NAD 1927 State Plane Wisconsin South FIPS 4803.
In order to match the government owned property records to a shapefile, the tax parcel layer was joined to the database using the TAXKEY column in the attribute table.
To begin narrowing down properties, a 250-foot buffer was created around all of the hydrology features. Wisconsin’s Chapter NR 502 includes a regulation for storage facilities not being within 250 feet of any hydrology feature; all 234 matching properties were removed (Chapter NR 502. Wis. Stats. 2017).
Given the compost site location goal is a city-wide objective and the amount of remaining properties; all county, state, and federally removed properties were moved from the database. This left 3660 properties left to conduct the aerial view
5 | P a g e

assessment with the goal of removing all properties that are 1 acre in size or less. Blocks containing multiple vacant lots were included only if all adjacent properties contained 1 acre or more. The result was 315 properties.
To deal with the ownership naming inconsistencies, an additional field was added to the attribute table to consolidate owner names while maintaining the integrity of the data to keep the original ownership name. This alias field contained “City of Milwaukee” and subsequently allowed the ArcMap Dissolve tool to combine all shared lined boundaries. The results left 104 total properties for further analysis.
To continue the centralized urban compost location goal, 6 properties were selected to calculate windrow sizes and compost turnover. The method used to select these properties was a simple aerial view with the goal of choosing centralized locations
throughout the city with a property located in the north, west, central, east, and south. For ease of calculation, square or rectangular shaped properties were preferred.
The windrow size used for calculation was 9.23 feet wide (base value) 5 feet tall (height value) with the length being subjective to the property size. Compost properties have slight differences based on windrow size and turning frequency (Tirado and Jr 2010). Additionally, a potential compost turner CT-10, can sufficiently turn over windrows of this size with a max compost turnover of 10,000 tons per year (HCL Machine Works n.d.). This model can be transported on public highways and be used on smaller properties, thus, helped shape the windrow size used in this study.
6 | P a g e

Figure 1: CT-10 Windrow Compost Turner (HCL Machine Works)
In order to accommodate necessary machinery, windrow rows were placed 6 feet from each other as suggested in the Plan of Operation Checklist for Compost Facilities (Wisconsin Department of Natural Resources 2012).
Using ArcMap 10.5, the 6 properties were measured for width (base) and length.
Total combined area for each site was automatically calculated by ArcMap when running the dissolve tool. The area for each site was converted into acreage by dividing the Shape_Area (attribute table column) by 43,560 square feet. (1 acre = 43,560 square feet)
To consider the tonnage a site could produce the following calculations and considerations were conducted for each site. First considering how many windrows would reasonably fit on a site, followed by calculating the volume that all the windrows each site could produce; and then finally, converting the volume towards the resulted weight being produced.
In calculating the number of windrows and vehicle lanes that would reasonably fit on each property, vehicle width (V) was designated at six feet wide, windrow width (W) being 9.5 feet wide, while the shortest length of the property (B) was then utilized to further base the number of both vehicle lanes and windrows that could be accommodated.
BV+W
+1=number of vehicle lanes
BV+W
−1=number of windrows
The greater value was provided towards vehicle lanes as the area can be utilized as a buffer on the length of the property; as well as, further assistance in considering an area for staging vehicles for the sites.
To obtain total compost turnover per windrow (cubic feet), the following triangular prism equation was used where base of the windrow remained 9.5 feet, height five feet and length dependent on the length of the site as in the following equation:
12
(base ) (height ) x length=x ft3
Cubic feet were then converted into cubic yards:
27 ft3=1 yd3
Using the EPA’s Volume to Weight Conversion Standards for food waste (U.S. Environmental Protection Agency Office of Resource Conservation and Recovery 2016):
7 | P a g e

Estimateweight per cubic yard=463lbs .
The last conversion was converting lbs. to tons by dividing lbs. by 2000 to obtain this value.
Multiplying the total number of windrows per site by the calculated tonnage can estimate towards what can be expected per site. Exceptions that needed further manipulation towards calculating were also taken into consideration. The 1.85-acre site as listed site A and B were polygons more triangular instead of being squared and calculated as such by dividing in half. Even the squared properties with differing lengths the lengths were averaged to compensate for their irregular shapes.
Once all calculations were made, a comparison of how much compost turnover per site and overall total was compared to the baseline 44,000 tons of food waste the City estimates enters a landfill each year.
Billboard methodology When reviewing the MPROP data, there were 1049 records with no value in the Land_USE_GP column. After conducting research on the owner names of these records it became clear these sites are
billboard locations. Using the same method of exporting the records from excel to Microsoft access, then uploading to ArcMap and attempting the join by tax key, only 2 records would join of the 1049.
After plugging in several of the billboard tax parcels into Milwaukee County's GIS online interactive map, none were valid tax keys and/or assigned to a specific property.
The “tax key” number sequence was similar to UCC filings; therefore, the sequences were cross-checked on the DFI website for verification. No matches were found. The main owner name for these records, Clear Channel Outdoor, was also checked with no matches.
The last attempt to make sense of the “tax key” discrepancy, a few of the 1049 addresses were checked against personal property records on Milwaukee County Assessor’s website.
This produced a match listing the fee owner of the property, the valid tax key number, and the billboard “tax key” numbers and owner name.
Figure 2: Data and information from the Assessor's website regarding the ambiguous tax key numbers.
Upon review of one of the Clear Channel tax key numbers, the legal description contained a Billboard Permit GPS location with x, y coordinates. An attempt was made to find this data online with no success.
8 | P a g e

Figure 3: Assessor's website providing basic data on Billboard Permit GPS locations.
This presented several options to obtain and/or produce usable data: Contact the city for the data, if available; or, Individually looking up each record and creating a spreadsheet for all 1049 records with
their x, y coordinates; or, Reporting these findings for future research.
The latter option was chosen due to finding an online news article reporting a successful law suit for tax assessments in favor of the City against Clear Channel (Thomas, A. 2017). The dynamics between these parties to work together on a common goal was not an inititive of this project.
Results
Windrow CompostingEach site was assessed, fully calculated, and mapped to determine:
Property size – length, width, area Number of 9.5 ft. x 5 ft. x length windrows (including a distance of 6 feet between rows
plus an additional 6 feet for staging – which could be redistributed to compost production)
Volume per windrow Total weight of compost in pounds and tons
Using this data along with the deconstructed, statistical municipal waste data, a reallocation evaluation was determined that amongst all 6 sites, a total volume of food waste compost is 13,640.31 tons, which is roughly 31% of the 44,000 tons the City estimates as entering the landfill each year. A site by site analysis follows.
(This space intentionally left blank)
9 | P a g e

The overall city owned, vacant land site analysis only produced two options in the most southerly portion of the City boundary. This 1.85-acre site was chosen based on proximity to servicing the southwest section of the City. By breaking the polygon into two and calculating the dimensions using a standard triangle equation; the estimated values are on the low end for maximizing compost production.
By placing the windrows on a horizontal, east to west position, the windrow length was maximized. Both polygon base footage ran north to south with polygon A being
163.8 feet wide and polygon B being 197.1 feet wide. Polygon A length was 445.6 feet and as calculated, roughly 12 windrows were estimated for a square polygon. Due to the shape and dividing by half, 5 windrows were then used to calculate the amounts of compost turnover. Volume total was 1,875 cubic yards for all 5 windrows which equates to 868,171.4 lbs. or 434.1 tons of compost.
Polygon B length was 210.5 and the estimated windrows for a rectangular polygon was 12, leaving 6 for compost turnover. Volume of compost was calculated to 1,084.7 cubic yards which equates to 502,212 lbs. or 251.1 tons.
10 | P a g e

Another westerly site, yet located further north, was chosen due to shape and the need to have multiple properties in the southern region given the lack of city owned, vacant properties in this area. The polygon base for this site was 270 feet with
north-south positioned windrows to maximize the length of 305 feet. Total area or size is 1.89 acres. These values estimated 16.42 windrows. Using a rounded down value of 16 windrows, total cubic volume calculated to 4,405.1 which equates to 2,039,561.3 lbs. or 1,019.8 tons of compost turnover.
11 | P a g e

Moving north and more centralized, this site size was 2.13 acres. Windrow placement maximized length; therefore, was placed in a north-south position. The property base was an average between the southern width, 136.8 feet, and the northern width, 166.7 feet, providing a value of 151.75 feet which was used for calculation. Using the averaged value of east/west property boundaries, the length
used for calculation was 602 feet. This value produced an estimate of 8.79 windrows. This value was rounded up to 9 due to the additional 6 feet of staging area that could be utilized more efficiently by adding another windrow. Total volume calculated to 4,654.8 cubic yards which equates to 2,155,173.04 lbs. or 1,077.59 tons of compost.
12 | P a g e

This 3.71-acre site is located more northern and easterly than the previous properties. The size is also larger; therefore, the compost turnover was higher. Windrow placement was a north-south position and
base width was 347.5 feet with a length of 465 feet. These values produced an estimate of 21.42 windrows. Rounding down to 21 windrows, the volume of compost was calculated as 8,761.1 cubic yards which equates to 4,056,394.4 lbs. or 2,028.2 tons.
13 | P a g e

This property was the largest site in the southern region of the City of Milwaukee and containing 6.25 acres. The base width was an average between the northern and southern widths with a value of 307 feet. Windrow placement was north to south to maximize windrow length. Estimated
number of windrows was 18.81 which was rounded up to take advantage of the additional 6 feet of staging space. Length was averaged to 894 feet which produced an overall volume of 14,799.11 cubic yards and equates to 6,851,988.03 lbs. or 3,425.99 tons.
14 | P a g e

It should be noted that this is the largest site for analysis at 9.25 acres; however, it is not the largest of the city owned, vacant land. This site was chosen due to location and shape, but otherwise did not take advantage of the largest acreage owned by the city which was over 27 acres. The City owns multiple properties that exceed this acreage which should be considered for future evaluation. Base width was averaged to a value of 634 feet. Length was also averaged to 665 feet.
These values estimated 39.90 windrows which was rounded up to 40 windrows. These 40 windrows produced a volume of 23,341.54 cubic yards which equates to 10,807,132.89 lbs. or 5,401.57 tons. If it were possible to have sites of this size throughout the city, merely 8 properties would be required to relocate the food scraps from trash to compost making this an obtainable goal if desired.
15 | P a g e

Site Description
Base of Windro
ws (feet)
Length of
Windrows (feet)
Number of
Windrows
Volume Convert
ed to Cubic Yards
Total Pounds per
Property
Total Tons per Propert
y
9.65 Acre Site 634.00 665.00 39.9023,341.5
410,807,132.
895,403.5
7
6.25 Acre Site 307.00 894.60 18.8114,799.1
16,851,988.0
33,425.9
9
3.71 Acre Site 347.50 465.00 21.42 8,761.114,056,394.4
42,028.2
0
2.13 Acre Site 151.75 602.00 8.79 4,654.802,155,173.0
41,077.5
9
1.89 Acre Site 270.00 305.00 16.42 4,405.102,039,561.3
31,019.7
81.85 Acre Site A 163.80 445.60 5.00 1,875.00 868,171.40 434.101.85 Acre Site B 197.10 210.50 6.00 1,084.70 502,212.00 251.10
Totals: 2,071.15 3,587.70 116.3458,921.3
627,280,633.
1313,640.
32Table 2: Calculations for a 9.5 ft x 5 ft x length windrow pile, including total volume, weight, and tonnage.
Billboard Sites for in-vessel compostingGiven the issues to produce or obtain usable data for analysis, this portion of research was abandoned. Additionally, understanding the legal issues between the City and billboard owner, Clear Channel, the assumption was made these two entities may not be willing to work together.
However, it should be noted that the Green Mountain Technologies Earth Flow system 10012-SB can compost 6.7 tons/day. At 365 days, the total compost is 2,445.5 tons. In order to compost at 44,000 tons, roughly 18 of these units would be required to handle all of the food waste that is being transported to landfills each year.
Discussion and ConclusionsWhat became apparent was the importance of determining a maximum turnover calculation based on property size. This study was an experiment of what could be calculated based on a fixed base and height with length being subjective to property size. Using advanced mathematical methods/calculations to maximize windrow sizes to collect as much food scraps for production of compost would potentially increase the amount of food diversion into the composting system.
Additionally, the properties were specifically targeted due to having a relatively square or rectangular shape. This same model could be applied to any of the other City owned vacant lots that were not
16 | P a g e

used for evaluation, which would increase food scrap diversion and compost production.
Without completing a full review of all City and Statewide regulations and policies, it leaves these 6 properties up to further investigation. Additionally, not all variables were taken into consideration, such as, land slope, light availability year-round, access onto each property with having a sufficient staging area, environmental assessments, etc. However, with 31% of the City’s yearly total of food scrap waste being diverted to 6 potential City owned, vacant lot sites provide hope that this is an issue that can and will be fully addressed given time, effort, cooperation, and investment.
Potential uses for City produced compostEventually there are a multitude of options to consider where the end product can be utilized. Whether it is in the City of Milwaukee’s many green space initiatives, partnership with Milwaukee County Park System, or creating a revenue stream with businesses and citizens the compost would continue to benefit
The city is can take into consideration utilizing the end product for their public works including the 250 planters and 100 hanging baskets on Wisconsin, Old World Third, and along the River Walk being part of Milwaukee’s downtown projects partnered with The Landscape Crew and KEI (Landscrap Crew n.d.). At least three times out of the year the plantings in these areas are rotated.
Other areas of opportunity are the many community gardens throughout Milwaukee county. Further consideration would be
toward partnering with the Milwaukee County Park System that currently manages just shy of 15,000 acres (Milwaukee County Parks n.d).
Revenue options to consider based on current Home Depot bulk compost prices at $195 for five cubic yards, and with an estimation totaling 58,921 cubic yards a maximized revenue could be at $2,297,933.14 given the provided calculations per property. Further areas of interest for potential revenue would be to work with area landscapers, nurseries, and home and garden distribution centers (Home Depot n.d.).
References Data Tools and Apps. City and County of
Milwaukee 2010 Census Population. US Bureau - https://www.census.gov/data/data-tools.html
2016 Wisconsin Municipal and Industrial Waste Landfill Tonnage Report. Wisconsin Department of Natural Resources. Retrieved March 30, 2017, fromhttp://dnr.wi.gov/topic/Landfills/
documents/reports/2016tonnage.pdf
USDA | OCE | U.S. Food Waste Challenge | FAQ's (n.d.). Retrieved May 1, 2017, from https://www.usda.gov/oce/foodwaste/faqs.htm
Solid Waste Storage, Transportation, Transfer, Incineration, Air Curtain Destructors, Processing, Wood Burning, Composting and Municipal Solid Waste Combustors, 35.93 Department of Natural Resources 21
17 | P a g e

§§ NR 502-NR 502.04-NR 502.13 (Wis. Stats. 2017).
Lamensky, C. (2016). “Composting rules and regulations in Wisconsin.” Wisconsin Department of Natural Resources. Retrieved March 29, 2017, from http://dnr.wi.gov/topic/Recycling/regs.html
Lamensky, C. (2016). “Composting overview.” Wisconsin Department of Natural Resources. Retrieved March 29, 2017, from http://dnr.wi.gov/topic/recycling/compost.html
Green Mountain Technologies, Inc. 2015. Earth Flow system 10012-SB. Retrieved March 10, 2018, from www.compostingtechnology.com.
Li, Zhentong, Hongwei Lu, Lixia Ren, and Li He. 2013. “Experimental and Modeling Approaches for Food Waste Composting: A Review.” Chemosphere 93(7): 1247–57.
Mu, Dongyan, Naomi Horowitz, Maeve Casey, and Kimmera Jones. 2016. “Environmental and Economic Analysis of an in-Vessel Food Waste Composting System at Kean University in the U.S.” Waste Management 59: 476–86. http://dx.doi.org/10.1016/j.wasman.2016.10.026.
Onwosi, Chukwudi O. et al. 2017. “Composting Technology in Waste Stabilization: On the Methods, Challenges and Future Prospects.” Journal of Environmental Management 190: 140–57. http://linkinghub.elsevier.com/retrieve/pii/S0301479716310349.
Saer, Alex, Stephanie Lansing, Nadine H. Davitt, and Robert E. Graves. 2013. “Life Cycle Assessment of a Food Waste Composting System:
Environmental Impact Hotspots.” Journal of Cleaner Production 52: 234–44. http://dx.doi.org/10.1016/j.jclepro.2013.03.022.
Sullivan, Dan. 2011. “Zero Waste on San Francisco’s Horizon.” BioCycle 52(7): 28–32.
Tirado, Sandra M, and Frederick C Michel Jr. 2010. “Effects of Turning Frequency , Windrow Size and Season on the Production Of Dairy Manure / Sawdust Composts.” 18(2): 70–80.
HCL Machine Works. (n.d.). Compost Turners, CT-12 Windrow Compost Turner. Retrieved May 20, 2017, from http://www.hclmachineworks.com/compost-turners/
Wisconsin Department of Natural Resources. (2012). Plan of Operation Checklist for Compost Facilities [NR 502.12(13)] [Publication WA 1586]. P.O. Box 7921, Madison, WI.
U.S. Environmental Protection Agency Office of Resource Conservation and Recovery. (2016, April). Volume-to-Weight Conversion Factors (Rep.). Retrieved May 13, 2017, from: https://www.epa.gov/sites/production/files/2016-04/documents/volume_to_weight_conversion_factors_memorandum_04192016_508fnl.pdf
Thomas, A. (2017, February 21). Court upholds $7.2 million in taxes on Clear Channel billboards. Retrieved April 1, 2017, from https://www.biztimes.com/2017/industries/advertising-marketing-media/court-upholds-7-2-million-in-taxes-on-clear-channel-billboards/
Landscape Crew, Flower Power Rocks. (n.d.) Retrieved from http://www.milwaukeedowntown.com/about-us/bid-21-programs/landscape-crew
18 | P a g e

History of the Parks (n.d.) http://county.milwaukee.gov/HistoryoftheParks16572.htm
Garden Soil (n.d.) http://www.homedepot.com/p/5-cu-yd-Bulk-Compost-SLC5/206457184
Raw Geospatial Data and/or validation websites:
Milwaukee County Geospatial Data: http://county.milwaukee.gov/mclio/geodata.htmlUSDA: NRCS: Geospatial Data Gateway: https://datagateway.nrcs.usda.gov/GDGOrder.aspxMilwaukee County Assessors website: http://assessments.milwaukee.gov/DFI website: https://www.wdfi.org/apps/UCCSearch/Milwaukee GIS online interactive map: http://county.milwaukee.gov/mclio/applications/interactivemapping.htmlMPROP data: http://city.milwaukee.gov/DownloadTabularData3496.htm
19 | P a g e