Embed Size (px)
Citation preview

Finding Originally Mislabels with MD-ELM
Anton Akusok1, David Veganzones2, Yoan Miche1,Eric Severin4 and Amaury Lendasse1,2,3,5
1- Dept. of Information and Computer Science,Aalto University School of Science, FI-00076, Finland
2- Dept. of Computer Science & Artificial Intelligence, Univ. del Pais Vasco,Donostia/San Sebastian, Spain
3- IKERBASQUE, Basque Foundation for Science, 48011 Bilbao, Spain
4- University of Lille 1, IAE, 104 avenue du peuple Belge,59043 Lille, France
5- Arcada Univ. of Applied Science, Helsinki, Finland
Abstract. This paper presents a methodology which aims at detectingmislabeled samples, with a practical example in the field of bankruptcyprediction. Mislabeled samples are found in many classification problemsand can bias the training of the desired classifier. This paper proposes anew method based on Extreme Learning Machine (ELM) which allows foridentification of the most probable mislabeled samples. Two datasets areused in order to validate and test the proposed methodology: a toy example(XOR problem) and a real dataset from corporate finance (bankruptcyprediction).
1 Introduction
There is nowadays a large choice in Machine Learning techniques that can beused for the problem of classification. The focus of this paper is on the reliabilityof the data, and more precisely in that of the output. For various possible rea-sons, mislabeled data often exist in real life data sets, e.g. due to a human erroror technical difficulties in the acquisition process. Subsequently, any machinelearning method using this mislabeled data is building a model based on it, andperpetrates the learned mislabels from the training to the test. This problembecomes even more important with a limited amount of training samples. Inthis situation, there might not be enough correctly labeled samples in orderto compensate for the mislabeled ones. Most general approaches for detectingoutliers and mislabeled samples use a majority vote or consensus of results ofseveral different classifiers [1, 2, 3]. In general, finding the mislabeled samplesis not a trivial task to solve, as the model used to identify these mislabels stillneeds to be trained on that same data, with mislabels omitted. This paperproposes a new methodology which focuses on the case of binary classification(i.e. where each sample has only two possible labels, and thus only one possiblere-labeling). The general assumption of the proposed methodology is that bycorrectly re-labeling a number of mislabeled samples, the error in generalizationwill decrease. and thus enable to identify the originally mislabeled samples. TheExtreme Learning Machine (ELM) model for classification is a key part of the
689
ESANN 2014 proceedings, European Symposium on Artificial Neural Networks, Computational Intelligence and Machine Learning. Bruges (Belgium), 23-25 April 2014, i6doc.com publ., ISBN 978-287419095-7. Available from http://www.i6doc.com/fr/livre/?GCOI=28001100432440.

method, as it is a nonlinear universal approximator [4], yet a Leave-One-Out(LOO) Mean Square Error (MSE) for a given set of mislabeled samples is calcu-lated with a direct and exact formula. The Mislabeled samples Detection ELM(MD-ELM) method works as follows. An ELM is trained using the initial la-bels, and a baseline LOO error is calculated. Then labels of different randomsets of samples are flipped, and the LOO error is re-calculated using a PRESS[5, 6] error formula for each of the flips. If the result error is lower than thebaseline one, the selected samples are marked as possibly mislabeled. After sev-eral iterations, it is possible to build an histogram depicting the frequency foreach sample to have been identified as mislabeled. Samples with a high-enoughfrequency are deemed to be actual mislabels, then. The method can use sev-eral different ELMs to explore multiple views on the classification problem andavoid overfitting. The method is presented formally in the following section 2.The Experimental results section 3 presents an application of the MD-ELM totwo datasets: a benchmark and a real-world dataset in the field of Bankruptcyprediction. The summary, conclusions and further works are presented in theConclusions section.
2 Methodology
The proposed methodology is based on the idea that the generalization error ofa chosen model decreases (estimated by its LOO error in this case) if some of themislabeled samples of the training set have their labels changed to the actualcorrect class, i.e. the class they should have had. In fact, mislabeled samples canbe misclassified themselves and/or influence the classification of other correctlylabeled samples.
Denote by X = {xi}1≤i≤N the dataset of input samples, xi ∈ Rd and y =
{yi}1≤i≤N the output labels, with yi ∈ C with C the set of all possible classes. Inthe following, the special case of binary classification, C = {−1, 1} (which impliesthat there is only one possible change of label for each sample), is of concern. TheMachine Learning method considered is the Extreme Learning Machine (ELM)[4] for its low computational cost: as the details of the proposed methodologyhighlight, there is a need for a large number of iterations using several models,and therefore, a very fast model is needed. The details of the methodology aregiven in subsection 2.2.
2.1 Extreme Learning Machine and LOO Error
The Extreme Learning Machine (ELM) [4] is a single-layer feedforward neuralnetwork with fixed random weights and biases. The hidden layer output isgathered to the matrix H (see [4] for details), and the output layer matrix β iscomputed as β = H†y, where y is the vector of outputs and H† stands for theMoore-Penrose pseudo-inverse of H [7]. Due to the linearity between the hiddenneurons and the outputs, there exists a direct and exact formula for finding thePRESS (Prediction Sum of Squares) Leave-One-Out [6, 5, 8] error of the ELM:
690
ESANN 2014 proceedings, European Symposium on Artificial Neural Networks, Computational Intelligence and Machine Learning. Bruges (Belgium), 23-25 April 2014, i6doc.com publ., ISBN 978-287419095-7. Available from http://www.i6doc.com/fr/livre/?GCOI=28001100432440.

MSEPRESS =1
N
N∑i=1
(yi − hi
(HTH
)−1HTy
1− hi (HTH)−1
hTi
)2
, (1)
with H = {hi}1≤i≤N , hi ∈ Rn (n being the number of neurons in the ELM
model). This means that each observation is “predicted” using the other N −1 observations and the residuals are finally squared and summed up. A fastmatrix-oriented algorithm for the evaluation of MSEPRESS can be found in [9].The MSEPRESS formula is well suited for finding mislabeled samples by using
the Leave-One-Out MSE, because the products hi
(HTH
)−1HT are calculated
only once, and used repeatedly in Eq. 1 for calculating MSEPRESS for differentpermutations of labels within y. Indeed, permutations of values in y mean that
only the last part of the matrix product hi
(HTH
)−1HTy need be recomputed.
2.2 Finding mislabeled samples with ELM
The methodology proposed in this paper is named MD-ELM, for Mislabeled-Detecting-ELM, for which the overall algorithm is presented in algorithm 1. Ituses several ELMs to circumvent possible effects of random initialization.
Algorithm 1 Algorithm of the proposed MD-ELM.
1: Inputs X ∈ RN×d and outputs y ∈ CN
2: Set K the maximum amount of mislabelled samples3: Set q ∈ N
N a vector holding the mislabel frequencies for each sample4: Set L the desired number of improvements found by each ELM5: for ELM in a set of ELMs do6: Calculate hi
(HTH
)−1HT (fixed for that ELM)
7: Calculate the baseline MSEPRESS using 1 and the initial y8: Initialize number of improvements l = 09: while l < L do
10: Select random k∗ s.t. 1 ≤ k∗ ≤ K11: Get y∗ by switching randomly a set s∗ of k∗ labels in y12: Get MSE∗
PRESS using y∗ instead of y13: if MSE∗
PRESS <MSEPRESS then14: Update frequencies in q as qi = qi + 1, ∀i ∈ s∗15: l = l+ 116: end if17: end while18: end for19: Select mislabelled samples by a threshold on the frequencies q
In plain text, at the end of algorithm 1, the vector q ∈ NN holds for each
sample the number of times that a flip of the label of this sample has resultedin an improvement of the Leave-One-Out MSE. Which means that the sampleswith the highest counts in q are the ones for which a flip of the output label isthe most beneficial. Of the main ideas of the methodology is thus to use the
691
ESANN 2014 proceedings, European Symposium on Artificial Neural Networks, Computational Intelligence and Machine Learning. Bruges (Belgium), 23-25 April 2014, i6doc.com publ., ISBN 978-287419095-7. Available from http://www.i6doc.com/fr/livre/?GCOI=28001100432440.

computational speed of the calculation of the MSE for the Leave-One-Out caseof the ELM to perform random flips of the class of the samples present in thetraining set. The frequency count of which flips resulted in better LOO MSEenables the identification of statistically likely to be mislabeled samples. Thenext section presents two applications of the method: one for the artificial XORtoy problem to show the correctness and feasibility of the methodology, and theother to a real-world financial problem of bankruptcy prediction.
3 Experimental results
3.1 XOR problem
XOR problem is a well-known benchmark classification problem, which cannotbe solved linearly. The given problem is to predict the sign of a product of twoscalars, both taken uniformly from the interval [−1, 1]. 500 samples are drawnin total for X, out of which 50 output labels were switched on purpose in thedataset — and have therefore the wrong class. The obtained frequencies for eachsample and originally mislabeled samples are shown on Figure 1.
0 100 200 300 400 5000
500
1000
1500
2000
XOR problem
sample index (q)
occu
rren
ce c
ount
in q
Fig. 1: XOR sample occurrence count in q. True mislabeled samples are identi-fied by red stars (the 50 labels that were flipped on purpose).
The method succeeds in finding 49 mislabeled samples out of 50. Mislabeledsample #295 is the only one which was not selected, and sample #98 is thecorrect one selected as a mislabeled. But these samples have input values of(−0.02, 0.47) and (−0.06,−0.01) respectively, so they both lie on a borderline orcenter of the XOR, which makes their classification difficult.
3.2 Bankruptcy prediction
The ability to predict bankruptcy of a firm is crucial for an investor or a creditor(bank) who wishes to ensure that he will be reimbursed later on. This experimentadopts binary classification to label the firms. An healthy company means thatit is able to reimburse its debt and it has continuity and future. However, abankrupted company is one that is unable to meet its financial obligations. Inother words, it cannot pay back its debtors and begin a liquidation process thatstands for sale or cessation of the company. The data set was built by du Jardin[10]. and includes 500 firms from year 2002. In the data set, the proportion
692
ESANN 2014 proceedings, European Symposium on Artificial Neural Networks, Computational Intelligence and Machine Learning. Bruges (Belgium), 23-25 April 2014, i6doc.com publ., ISBN 978-287419095-7. Available from http://www.i6doc.com/fr/livre/?GCOI=28001100432440.
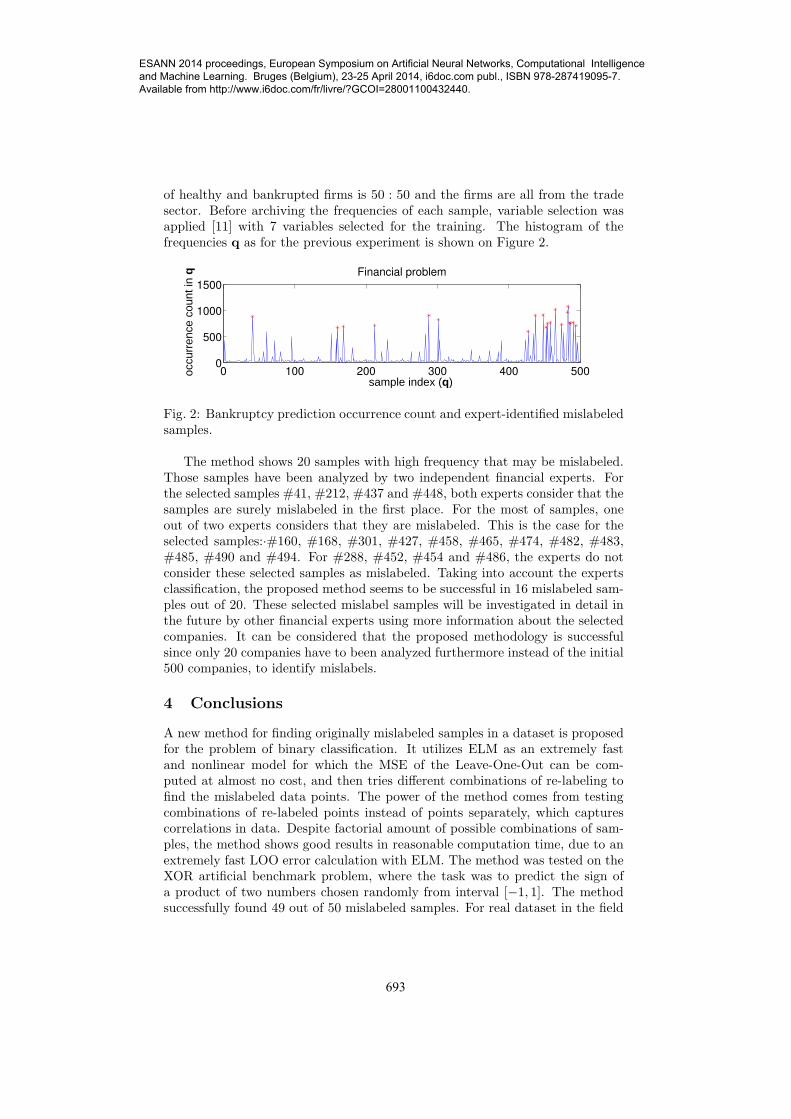
of healthy and bankrupted firms is 50 : 50 and the firms are all from the tradesector. Before archiving the frequencies of each sample, variable selection wasapplied [11] with 7 variables selected for the training. The histogram of thefrequencies q as for the previous experiment is shown on Figure 2.
0 100 200 300 400 5000
500
1000
1500
sample index (q)
occu
rren
ce c
ount
in q Financial problem
Fig. 2: Bankruptcy prediction occurrence count and expert-identified mislabeledsamples.
The method shows 20 samples with high frequency that may be mislabeled.Those samples have been analyzed by two independent financial experts. Forthe selected samples #41, #212, #437 and #448, both experts consider that thesamples are surely mislabeled in the first place. For the most of samples, oneout of two experts considers that they are mislabeled. This is the case for theselected samples:·#160, #168, #301, #427, #458, #465, #474, #482, #483,#485, #490 and #494. For #288, #452, #454 and #486, the experts do notconsider these selected samples as mislabeled. Taking into account the expertsclassification, the proposed method seems to be successful in 16 mislabeled sam-ples out of 20. These selected mislabel samples will be investigated in detail inthe future by other financial experts using more information about the selectedcompanies. It can be considered that the proposed methodology is successfulsince only 20 companies have to been analyzed furthermore instead of the initial500 companies, to identify mislabels.
4 Conclusions
A new method for finding originally mislabeled samples in a dataset is proposedfor the problem of binary classification. It utilizes ELM as an extremely fastand nonlinear model for which the MSE of the Leave-One-Out can be com-puted at almost no cost, and then tries different combinations of re-labeling tofind the mislabeled data points. The power of the method comes from testingcombinations of re-labeled points instead of points separately, which capturescorrelations in data. Despite factorial amount of possible combinations of sam-ples, the method shows good results in reasonable computation time, due to anextremely fast LOO error calculation with ELM. The method was tested on theXOR artificial benchmark problem, where the task was to predict the sign ofa product of two numbers chosen randomly from interval [−1, 1]. The methodsuccessfully found 49 out of 50 mislabeled samples. For real dataset in the field
693
ESANN 2014 proceedings, European Symposium on Artificial Neural Networks, Computational Intelligence and Machine Learning. Bruges (Belgium), 23-25 April 2014, i6doc.com publ., ISBN 978-287419095-7. Available from http://www.i6doc.com/fr/livre/?GCOI=28001100432440.

of bankruptcy, the results are very promising and are helping greatly to decreasethe work of financial experts that have to analyze the given datasets. In the fur-ther work the method will be applied to more diverse range of datasets to findthe areas with maximal benefits provided by correctly re-labeled samples. Anextension of the MD-ELM to Big Data with hundreds of thousands of sampleswill be explored, as such datasets, being labeled by humans, often suffer greatlyfrom mislabeling.
References
[1] C. Brodley and M. Friedl. Identifying mislabeled training data. arXivpreprint arXiv:1106.0219, 2011.
[2] D. Guan, W. Yuan, Y.K.Lee, and S. Lee. Identifying mislabeled trainingdata with the aid of unlabeled data. Applied Intelligence, 35(3):345–358,2011.
[3] A. Guillen, L.J. Herrera, G. Rubio, H. Pomares, A. Lendasse, and I. Rojas.New method for instance or prototype selection using mutual informationin time series prediction. Neurocomputing, 73(10-12):2030–2038, 2010.
[4] G.B. Huang, L. Chen, and C.K. Siew. Universal approximation using in-cremental constructive feedforward networks with random hidden nodes.IEEE Trans. on Neural Networks, 17(4):879–892, 2006.
[5] R.H. Myers. Classical and modern regression with applications, volume 2.Duxbury Press Belmont, CA, 1990.
[6] G. Bontempi, M. Birattari, and H. Bersini. Recursive lazy learning formodeling and control. In Machine Learning: ECML-98, pages 292–303.Springer, 1998.
[7] C. Rao and S.K. Mitra. Generalized inverse of matrices and its applications,volume 7. Wiley New York, 1971.
[8] D. Allen. The relationship between variable selection and data agumenta-tion and a method for prediction. Technometrics, 16(1):125–127, 1974.
[9] Y. Miche, M. van Heeswijk, P. Bas, O. Simula, and A. Lendasse. Trop-elm: A double-regularized ELM using LARS and tikhonov regularization.Neurocomputing, 74(16):2413 – 2421, 2011.
[10] P. du Jardin. Prevision de la defaillance et reseaux de neurones: l’apport desmethodes numeriques de selection de variables. Universite de Nice-Sophia-Antipolis, 2007.
[11] L. Kainulainen, Y. Miche, E. Eirola, Q. Yu, B. Frenay, E. Severin, andA. Lendasse. Ensembles of local linear models for bankruptcy analysis andprediction. Case Studies in Business, Industry and Government Statistics(CSBIGS), 4(2), November 2011.
694
ESANN 2014 proceedings, European Symposium on Artificial Neural Networks, Computational Intelligence and Machine Learning. Bruges (Belgium), 23-25 April 2014, i6doc.com publ., ISBN 978-287419095-7. Available from http://www.i6doc.com/fr/livre/?GCOI=28001100432440.