Embed Size (px)
Citation preview

Finding and Extracting Data Records from Web Pages*
Manuel Álvarez, Alberto Pan†, Juan Raposo, Fernando Bellas, Fidel Cacheda
Department of Information and Communications Technologies University of A Coruña, Campus de Elviña s/n. 15071. A Coruña, Spain
mad,apan,jrs,fbellas,[email protected]
Abstract. Many HTML pages are generated by software programs by querying some underlying databases and then filling in a template with the data. In these situations the metainformation about the data structure is lost, so automated software programs cannot process these data in such powerful manners as information from databases. We propose a set of novel techniques for detecting structured records in a web page and extracting the data values that constitute them. Our method needs only an input page. It starts by identifying the data region of interest in the page. Then it is partitioned into records by using a clustering method that groups similar subtrees in the DOM tree of the page. Finally, the attributes of the data records are extracted by using a method based on multiple string alignment. We have tested our techniques with a high number of real web sources, obtaining high precision and recall values.
1 Introduction
In today’s Web, there are many sites providing access to structured data contained in an underlying database. Typically, these sources, known as “semi-structured” web sources, provide some kind of HTML form that allows issuing queries against the database, and they return the query results embedded in HTML pages conforming to a certain fixed template. For instance, Fig. 1 shows a page containing a list of data records, representing the information about books in an Internet shop.
Allowing software programs to access these structured data is useful for a variety of purposes. For instance, it allows data integration applications to access web information in a manner similar to a database. It also allows information gathering applications to store the retrieved information maintaining its structure and, therefore, allowing more sophisticated processing.
Several approaches have been reported in the literature for building and maintaining “wrappers” for semi-structured web sources ([2][9][11][12][13]; [7] provides a brief survey). Although wrappers have been successfully used for many web data extraction and automation tasks, this approach has the inherent limitation
* This research was partially supported by the Spanish Ministry of Education and Science
under project TSI2005-07730. † Alberto Pan’s work was partially supported by the “Ramón y Cajal” programme of the
Spanish Ministry of Education and Science.

that the target data sources must be known in advance. This is not possible in all cases. Consider, for instance, the case of “focused crawling” applications [3], which automatically crawl the web looking for topic-specific information.
Several automatic methods for web data extraction have been also proposed in the literature [1][4][5][14], but they present several limitations. First, [1][5] require multiple pages generated using the same template as input. This can be inconvenient because a sufficient number of pages need to be collected. Second, the proposed methods make some assumptions about the pages containing structured data which do not always hold. For instance, [14] assumes the visual space between two data records in a page is always greater than any gap inside a data record (we will provide more detail about these issues in the related work section).
In this paper, we present a new method to automatically detecting a list of structured records in a web page and extract the data values that constitute them. Our method requires only one page containing a list of data records as input. In addition, it can deal with pages that do not verify the assumptions required by other previous approaches. We have also validated our method in a high number of real websites, obtaining very good effectiveness.
The rest of the paper is organized as follows. Section 2 describes some basic observations and properties our approach relies on. Sections 3-5 describe the proposed techniques and constitute the core of the paper. Section 3 describes the method to detect the data region in the page containing the target list of records. Section 4 explains how we segment the data region into data records. Section 5 describes how we extract the values of each individual attribute from the data records. Section 6 describes our experiments with real web pages. Section 7 discusses related work.
Fig. 1. Example HTML page containing a list of data records
2 Basic Observations and Properties
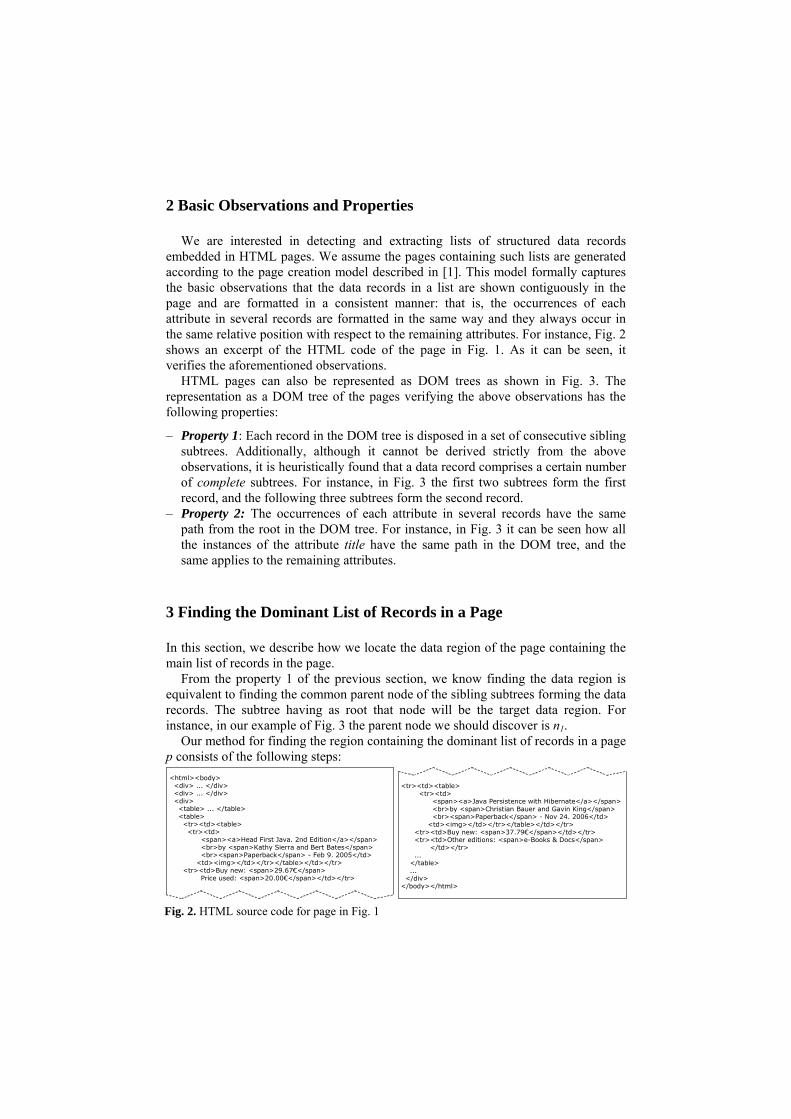
We are interested in detecting and extracting lists of structured data records embedded in HTML pages. We assume the pages containing such lists are generated according to the page creation model described in [1]. This model formally captures the basic observations that the data records in a list are shown contiguously in the page and are formatted in a consistent manner: that is, the occurrences of each attribute in several records are formatted in the same way and they always occur in the same relative position with respect to the remaining attributes. For instance, Fig. 2 shows an excerpt of the HTML code of the page in Fig. 1. As it can be seen, it verifies the aforementioned observations.
HTML pages can also be represented as DOM trees as shown in Fig. 3. The representation as a DOM tree of the pages verifying the above observations has the following properties:
– Property 1: Each record in the DOM tree is disposed in a set of consecutive sibling subtrees. Additionally, although it cannot be derived strictly from the above observations, it is heuristically found that a data record comprises a certain number of complete subtrees. For instance, in Fig. 3 the first two subtrees form the first record, and the following three subtrees form the second record.
– Property 2: The occurrences of each attribute in several records have the same path from the root in the DOM tree. For instance, in Fig. 3 it can be seen how all the instances of the attribute title have the same path in the DOM tree, and the same applies to the remaining attributes.
3 Finding the Dominant List of Records in a Page
In this section, we describe how we locate the data region of the page containing the main list of records in the page.
From the property 1 of the previous section, we know finding the data region is equivalent to finding the common parent node of the sibling subtrees forming the data records. The subtree having as root that node will be the target data region. For instance, in our example of Fig. 3 the parent node we should discover is n1.
Our method for finding the region containing the dominant list of records in a page p consists of the following steps: <html><body>
<div> ... </div><div> ... </div><div> <table> ... </table><table>
<tr><td><table><tr><td>
<span><a>Head First Java. 2nd Edition</a></span><br>by <span>Kathy Sierra and Bert Bates</span><br><span>Paperback</span> - Feb 9. 2005</td>
<td><img></td></tr></table></td></tr><tr><td>Buy new: <span>29.67€</span>
Price used: <span>20.00€</span></td></tr>
<tr><td><table><tr><td>
<span><a>Java Persistence with Hibernate</a></span><br>by <span>Christian Bauer and Gavin King</span><br><span>Paperback</span> - Nov 24. 2006</td>
<td><img></td></tr></table></td></tr><tr><td>Buy new: <span>37.79€</span></td></tr><tr><td>Other editions: <span>e-Books & Docs</span>
</td></tr>...
</table>...
</div></body></html>
Fig. 2. HTML source code for page in Fig. 1

1. Let us consider N, the set composed by all the nodes in the DOM tree of p. To each node ni Є N, we will assign a score called si. Initially, 0..1 =∀ = iNi s .
2. Compute T, the set of all the text nodes in N. 3. Divide T into subsets p1, p2,…,pm, in a way such that all the text nodes with the
same path from the root in the DOM tree are contained in the same pi. To compute the paths from the root, we ignore tag attributes.
4. For each pair of text nodes belonging to the same group, compute nj as their deepest common ancestor in the DOM tree, and add 1 to sj (the score of nj).
5. Let nmax be the node having a higher score. Choose the DOM subtree having nmax as root of the desired data region.
Now, we provide the justification for this algorithm. First, by definition, the target data region contains a list of records and each data record is composed of a series of attributes. By property 2, we know all the occurrences of the same attribute have the same path from the root. Therefore, the subtree containing the dominant list in the page will typically contain more texts with the same path from the root than other regions. In addition, given two text nodes with the same path in the DOM tree, the following situations may occur:
1. By property 1, if the text nodes are occurrences of texts in different records (e.g. two values of the same attribute in different records), then their deepest common ancestor in the DOM tree will be the root node of the data region containing all the records. Therefore, when considering that pair in step 4, the score of the correct node is increased. For instance, in Fig. 3 the deepest common ancestor of d1 and d3 is n1, the root of the subtree containing the whole data region.
2. If the text nodes are occurrences from different attributes in the same record, then in some cases, their deepest common ancestor could be a deeper node than the one we are searching for and the score of an incorrect node would be increased. For instance, in the Fig. 3 the deepest common ancestor of d1 and d2 is n2.
By property 2, we can infer that there will usually be more occurrences of the case 1
TABLE
TR TR TR TR TR TR TR
TD
TABLE
TR
TD
IMG
TD
SPAN BR SPAN BR SPAN
TD
A
SPAN SPAN
n1
r0
r2 r3
TR TR
TD
TABLE
TR
TD
IMG
TD
SPAN BR SPAN BR SPAN
TD
A
SPAN
TR
TD
SPAN
r1
DIV
BODY
HTML
…
……
… …
TITLE: Head First Java. 2nd EditionAUTHOR: Kathy Sierra and Bert BatesFORMAT: PaperbackPUBDATE: Feb 9. 2005PRICE: 29.67PRICEUSED: 20.00
TITLE: Java Persistence with HibernateAUTHOR: Christian Bauer and Gavin KingFORMAT: PaperbackPUBDATE: Nov 24. 2006PRICE: 37.79OTHEREDITIONS: e-Books & Docs
… … … … …
Head First Java. 2nd Edition
Kathy Sierra and Bert Bates
Paperback
Feb 9. 2005
29.67€ 20.00€ 37.79€ e-Books& Docs
Java Persistencewith Hibernate
Christian Bauerand Gavin King
Paperback
Nov 24. 2006
t0 t1
#text
#text #text #text #text
t2 t3 t4 t5 t6 t7 t8 t9
d1
d2
n2
d3
**
**
**
**
#text
Fig. 3. DOM tree for HTML page in Fig. 1

and, therefore, the algorithm will output the right node. Now, we explain the reason for this. Let us consider the pair of text nodes (t11,t12) corresponding with the occurrences of two attributes in a record. (t11, t12) is a pair in the case 2. But, by property 2, for each record ri in which both attributes appear, we will have pairs (t11, ti1), (t11, ti2), (t12, ti1), (t12, ti2), which are in case 1. Therefore, in the absence of optional fields, it can be easily proved that there will be more pairs in the case 1. When optional fields exist, it is still very probable.
This method tends to find the list in the page with the largest number of records and the largest number of attributes in each record. When the pages we want to extract data from have been obtained by executing a query on a web form, we are typically interested in extracting the data records that constitute the answer to the query, even if it is not the larger list (this may happen if the query has few results). If the executed query is known, this information can be used to refine the above method. The idea is very simple: in the step 2 of the algorithm, instead of using all the text nodes in the DOM tree, we will use only those text nodes containing text values used in the query with operators whose semantic be equals or contains. For instance, let us assume the page in Fig. 3 was obtained by issuing a query we could write as (title contains ‘java’) AND (format equals ‘paperback’). Then, the only text nodes considered in step 2 would be the ones marked with an ‘*’ in Fig. 3.
4 Dividing the List into Records
Now we proceed to describe our techniques for segmenting the data region in fragments, each one containing at most one data record.
Our method can be divided into the following steps: – Generate a set of candidate record lists. Each candidate record list will propose a
particular division of the data region into records. – Choose the best candidate record list. The method we use is based on computing
an auto-similarity measure between the records in the candidate record lists. We choose the record division lending to records with the higher similarity.
Sections 4.2 and 4.3 describe in detail each one of the two steps. Both tasks need a way to estimate the similarity between two sequences of consecutive sibling subtrees in the DOM tree of a page. The method we use for this is described in section 4.1.
4.1 Edit-Distance Similarity Measure
To compute “similarity” measures we use techniques based in string edit-distance algorithms. More precisely, to compute the edit-distance similarity between two sequences of consecutive sibling subtrees named ri and rj in the DOM tree of a page, we perform the following steps:
1. We represent ri and rj as strings (we will term them si and sj). It is done as follows: a. We substitute every text node by a special tag called text.

b. We traverse each subtree in depth first order and, for each node, we generate a character in the string. A different character will be assigned to each tag having a different path from the root in the DOM tree. Fig. 4 shows the strings s0 and s1 obtained for the records r0 and r1 in Fig. 3.
2. We compute the edit-distance similarity between ri and rj , denoted as es (ri, rj), as the string edit distance between si and sj (ed(ri,rj)) calculated using a variant of the Levenshtein algorithm [8], which does not allow substitution operations (only insertions and deletions are permitted). To obtain a similarity score between 0 and 1, we normalize the result using the equation (1). In our example from Fig. 4, the similarity between r0 and r1 is 1- (2 / (26+28)) = 0.96.
( ) ( ) ( ) ( )jijiji slenslenssedrres +−= /,1, (1)
4.2 Generating the Candidate Record Lists
In this section, we describe how we generate a set of candidate record lists inside the data region previously chosen. Each candidate record list will propose a particular division of the data region into records.
By property 1, every record is composed of one or several consecutive sibling sub-trees, which are direct descendants of the root node of the data region. We could leverage on this property to generate a candidate record list for each possible division of the subtrees verifying it. Nevertheless, the number of possible combinations would be too high: if the number of subtrees is n, the possible number of divisions verifying property 1 is 2n-1(notice that different records in the same list may be composed of a different number of subtrees, as for instance r0 and r1 in Fig. 3). In some sources, n can be low, but in others it may reach values in the hundreds (e.g. a source showing 25 data records, with an average of 4 subtrees for each record). Therefore, this exhaustive approach is not feasible. The remaining of this section explains how we overcome these difficulties.
TR TR
TD
TABLE
TR
TD
IMG
TD
SPAN BR SPAN BR SPAN
TD
A
SPAN SPAN
#text
#text
#text
#text
#text
t1 TR0
TD0
TEXT0 SPAN0
TEXT1
TEXT0 SPAN0
TEXT1
TR0
TD0
TABLE0
TR1
TD1
IMG0
TD1
#text
#text
#text #text
SPAN1
A1
TEXT4
BR0 TEXT2 SPAN1
TEXT3
BR0 SPAN1
TEXT3
TEXT2
t0
s0 t0: TR0 TD0 TABLE0 TR1 TD1 SPAN1 A1 TEXT4 BR0 TEXT2 SPAN1 TEXT3 BR0 SPAN1 TEXT3 TEXT2 TD1 IMG0t1: TR0 TD0 TEXT0 SPAN0 TEXT1 TEXT0 SPAN0 TEXT1
s1 t2: TR0 TD0 TABLE0 TR1 TD1 SPAN1 A1 TEXT4 BR0 TEXT2 SPAN1 TEXT3 BR0 SPAN1 TEXT3 TEXT2 TD1 IMG0t3: TR0 TD0 TEXT0 SPAN0 TEXT1t4: TR0 TD0 TEXT0 SPAN0 TEXT1
r0
len(s0) = 26 len(s1) = 28 ed(r0, r1) = ed(s0, s1) = 2 Fig. 4. Strings obtained for the records r0 and r1 in Fig. 3

Our method has two stages: clustering the subtrees according to their similarity and using the groups to generate the candidate record divisions.
Grouping the subtrees. For grouping the subtrees according to their similarity, we use a clustering-based process we describe in the following lines:
1. Let us consider the set t1,…,tn of all the subtrees which are direct children of the node chosen as root of the data region. Each ti can be represented as a string using the method described in section 4.1. We will term these strings as s1,…,sn.
2. Compute the similarity matrix. This is a nxn matrix where the (i,j) position (denoted mij) is obtained as es(ti, tj), the edit-distance similarity between ti and tj.
3. We define the column similarity between ti and tj, denoted cs(ti,tj), as the inverse of the average absolute error between the columns corresponding to ti and tj in the similarity matrix (2). Therefore, to consider two subtrees as similar, the column similarity measure requires their columns in the similarity matrix to be very similar. This means two subtrees must have roughly the same edit-distance similarity with respect to the rest of subtrees in the set to be considered as similar. We have found column similarity to be more robust for estimating similarity between ti and tj in the clustering process than directly using es(ti, tj).
4. Now, we apply bottom-up clustering [3] to group the subtrees. The basic idea behind this kind of clustering is to start with one cluster for each element and successively combine them into groups within which inter-element similarity is high, collapsing down to as many groups as desired.
( ) ∑ =−−=
nk jkikji nmmttcs..1
/1, (2) ( ) ( ) ( )∑ Φ∈−ΦΦ=Φ
ji tt ji ttcss,
,1/2 (3)
Fig. 5 shows the pseudo-code for the bottom-up clustering algorithm. Inter-element similarity of a set Φ is estimated using the auto-similarity measure (s(Φ)), and it is computed as specified in (3).
We use column similarity as the similarity measure between ti and tj. To allow a new group to be formed, it must verify two thresholds:
– The global auto-similarity of the group must reach the auto-similarity threshold Ωg. In our current implementation, we set this threshold to 0.9.
– The column similarity between every pair of elements from the group must reach the pairwise-similarity threshold Ωe. This threshold is used to avoid creating groups that, although showing high overall auto-similarity, contain some dissimilar 1. Let each subtree t be in a singleton group t2. Let G be the set of groups3. Let Ωg be the group-similarity threshold and
Ωe be the element-similarity threshold4. While |G| > 1 do
4.1 choose , a pair of groups which maximize the auto-similarity measure (see equation 3). The set must verify:
a)
b) 4.2 if no pair verifies the above conditions, then stop4.3 remove and from G4.4 let4.5 insert into G
5. End while
( ) ejicsji Ω>∆∪Γ∈∆∪Γ∈∀ ,,,
G∈∆Γ, ( )∆∪Γs
( ) gs Ω>∆∪Γ∆∪Γ
∆∪Γ=ΦΦ
Γ ∆
Fig. 5. Pseudo-code for bottom-up clustering

elements. In our current implementation, we set this threshold to 0.9.
Generating the candidate record divisions. For generating the candidate record divisions, we assign an identifier to each of the generated clusters. Then, we build a sequence by listing in order the subtrees in the data region, representing each subtree with the identifier of the cluster it belongs to. For instance, in our example of Fig. 3, the algorithm generates three clusters, leading to the string c0c1c0c2c2c0c1c2c0c1.
The data region may contain, either at the beginning or at the end, some subtrees that are not part of the data. For instance, these subtrees may contain information about the number of results or web forms to navigate to other result intervals. These subtrees will typically be alone in a cluster, since there are not other similar subtrees in the data region. Therefore, we pre-process the string from the beginning and from the end, removing tokens until we find the first cluster identifier that appears more than once in the sequence. In some cases, this pre-processing is not enough and some additional subtrees will still be included in the sequence. Nevertheless, they will typically be removed from the output as a side-effect of the final stage (see section 5).
Once the pre-processing step is finished, we proceed to generate the candidate record divisions. By property 1, we know each record is formed by a list of consecutive subtrees (i.e. characters in the string). From our page model, we know records are encoded consistently. Therefore, the string will tend to be formed by a repetitive sequence of cluster identifiers, each sequence corresponding to a data record. The sequences for two records may be slightly different. Nevertheless, we will assume they always either start or end with a subtree belonging to the same cluster (i.e. all the data records always either start or end in the same way). This is based on the following heuristic observations:
– In many sources, records are visually delimited in an unambiguous manner to improve clarity. This delimiter is present before or after every record.
– When there is not an explicit delimiter between data records, the first data fields appearing in a record are usually key fields appearing in every record.
Based on the former observations, we will generate the following candidate lists:
– For each cluster ci, i=1..k, we will generate two candidate divisions: one assuming every record starts with ci and another assuming every record ends with ci. For instance, Fig. 6 shows the candidate divisions obtained for the example of Fig. 3.
– In addition, we will add a candidate record division considering each record is formed by exactly one subtree.
This reduces the number of candidate divisions from 2n-1, where n is the number of subtrees, to 1+2k, where k is the number of generated clusters, turning feasible to evaluate each candidate list to choose the best one.
0.9489
0.7207
0.5766
0.7477
c0 c1 c0 c2 c2 c0 c1 c2 c0 c1
c0 c1 c0 c2 c2 c0 c1 c2 c0 c1
c0 c1 c0 c2 c2 c0 c1 c2 c0 c1
c0 c1 c0 c2 c2 c0 c1 c2 c0 c1
starting with c0
ending with c1
ending with c0
starting with c2
0.4805
0.4595
0.5105
c0 c1 c0 c2 c2 c0 c1 c2 c0 c1
c0 c1 c0 c2 c2 c0 c1 c2 c0 c1
c0 c1 c0 c2 c2 c0 c1 c2 c0 c1
starting with c1
one record for each subtree
ending with c2
Fig. 6. Candidate record divisions obtained for example page from Fig. 3

4.3 Choosing the Best Candidate Record List
To choose the correct candidate record list, we rely on the observation that the records in a list tend to be similar to each other. Therefore, we will choose the candidate list showing the highest auto-similarity.
Given a candidate list composed of the records <r1, …, rn>, we compute its auto-similarity as the weighted average of the edit-distance similarities between each pair of records of the list. The contribution of each pair to the average is weighted by the length of the compared registers. See equation 4.
( ) ( ) ( )( ) ( ) ( )∑∑ ≠==≠==++
jinjni jijinjni jiji rlenrlenrlenrlenrres,..1,..1,..1,..1
/, (4)
For instance, in Fig. 6, the first candidate record division is chosen.
5. Extracting the Attributes of the Data Records
In this section, we describe our techniques for extracting the values of the attributes of the data records identified in the previous section.
The basic idea consists in transforming each record from the list into a string using the method described in section 4.1, and then using string alignment techniques to identify the attributes in each record. An alignment between two strings matches the characters in one string with the characters in the other one, in such a way that the edit-distance between the two strings is minimized. There may be more than one optimal alignment between two strings. In that case, we choose any of them.
For instance, Fig. 7a shows an excerpt of the alignment between the strings representing the records in our example. Each aligned text token roughly corresponds with an attribute of the record. Notice that to obtain the actual value for an attribute we may need to remove common prefixes/suffixes found in every occurrence of an attribute. For instance, in our example, to obtain the value of the price attribute we would detect and remove the common suffix “€”. In addition, those aligned text nodes having the same value in all the records (e.g. “Buy new:”, “Price used:”) will be considered “labels” instead of attribute values and will not appear in the output.
To achieve our goals, it is not enough to align two records: we need to align all of them. Nevertheless, optimal multiple string alignment algorithms have a complexity of O(nk). Therefore, we need to use an approximation algorithm. Several methods have been proposed for this task [10][6]. We use a variation of the center star approximation algorithm [6], which is also similar to a variation used in [14] (although they use tree alignment). The algorithm works as follows:
1. The longest string is chosen as the “master string”, m. 2. Initially, S, the set of “still not aligned strings” contains all the strings but m. 3. For every s Є S, align s with m. If there is only one optimal alignment between s
and m and the alignment matches any null position in m with a character from s, then the character is added to m replacing the null position (an example is shown in Fig. 7b). Then, s is removed from S.
4. Repeat step 3 until S is empty or the master string m does not change.

6. Experience
This section describes the empirical evaluation of our techniques. During the development phase, we used a set of 20 pages from 20 different web sources. The tests performed with these pages were used to adjust the algorithm and to choose suitable values for the used thresholds.
For the experimental tests, we chose 200 new websites in different application domains (book and music shops, patent information, publicly financed R&D projects, movies information, etc). We performed one query in each website and collected the first page containing the list of results. Some queries returned only 2-3 results while others returned hundreds of results. The collection of pages is available online‡.
While collecting the pages for our experiments, we found three data sources where our page creation model is not correct. Our model assumes that all the attributes of a data record are shown contiguously in the page. In those sources, the assumption does not hold and, therefore, our system would fail. We did not consider those sources in our experiments. In the related work section, we will further discuss this issue.
We measured the results at three stages of the process: after choosing the data region containing the dominant list of data records, after choosing the best candidate record division and after extracting the structured data contained in the page. Table 1 shows the results obtained in the empirical evaluation.
In the first stage, we use the information about the executed query, as explained at the end of section 3. As it can be seen, the data region is correctly detected in all pages but two. In those cases, the answer to the query returned few results and there was a larger list on a sidebar of the page containing items related to the query.
In the second stage, we classify the results in two categories: correct when the chosen record division is correct, and incorrect when the chosen record division contains some incorrect records (not necessarily all). For instance, two different records may be concatenated as one or one record may appear segmented into two.
As it can be seen, the chosen record division is correct in the 93.50% of the cases. It is important to notice that, even in incorrect divisions, there will usually be many correct records. Therefore, stage 3 may still work fine for them. The main reason for the failures at this stage is that, in a few sources, the auto-similarity measure described in section 4.3 fails to detect the correct record division, although it is between the candidates. This happens because, in these sources, some data records are quite dissimilar to each other. For instance, in one case where we have two consecutive data records that are much shorter than the remaining, and the system chooses a candidate division that groups these two records into one.
‡ http://www.tic.udc.es/~mad/resources/projects/dataextraction/testcollection_0507.htm
r0 … TR0 TD0 TEXT0 SPAN0 TEXT1 TEXT0 SPAN0 TEXT1
r1 … TR0 TD0 TEXT0 SPAN0 TEXT1 TR0 TD0 TEXT0 SPAN0 TEXT1
r2 … TR0 TD0 TEXT0 SPAN0 TEXT1 TEXT0 SPAN0 TEXT1 TR0 TD0 TEXT0 SPAN0 TEXT1
r3 … TR0 TD0 TEXT0 SPAN0 TEXT1 TEXT0 SPAN0 TEXT1
PRICE PRICEUSED OTHEREDITIONS
“Buy new:” “Price used:” “Other editions:” a b c b c
a b d c e
current master, m =
new record, s =
optimal alignmenta b – c b ca b d c b -
a b d c b cnew master, m =
a) b)
Fig. 7. (a) Alignment between records of Fig. 1 (b) example of alignment with the master

In stage 3, we use the standard metrics recall and precision. These are the most important metrics in what refers to web data extraction applications because they measure the system performance at the end of the whole process. As it can be seen, the obtained results are very high, reaching respectively to 98.55% and 97.39%. Most of the failures come from the errors propagated from the previous stage.
7. Related Work
Wrapper generation techniques for web data extraction have been an active research field for years. Many approaches have been proposed [2][9][11][12][13]. [7] provides a brief survey.
All the wrapper generation approaches require some kind of human intervention to create and configure the wrapper. When the sources are not known in advance, such as in focused crawling applications, this approach is not feasible.
Several works have addressed the problem of performing web data extraction tasks without requiring human input. IEPAD [4] uses the Patricia tree [6] and string alignment techniques to search for repetitive patterns in the HTML tag string of a page. The method used by IEPAD is very probable to generate incorrect patterns along with the correct ones, so human post-processing of the output is required.
RoadRunner [5] receives as input multiple pages conforming to the same template and uses them to induce a union-free regular expression (UFRE) which can be used to extract the data from the pages conforming to the template. The basic idea consists in performing an iterative process where the system takes the first page as initial UFRE and then, for each subsequent page, tests if it can be generated using the current template. If not, the template is modified to represent also the new page. The proposed method cannot deal with disjunctions in the input schema and it requires receiving as input multiple pages conforming to the same template.
As well as RoadRunner, ExAlg receives as input multiple pages conforming to the same template and uses them to induce the template and derive a set of data extraction rules. ExAlg makes some assumptions about web pages which, according to the own experiments of the authors, do not hold in a significant number of cases: for instance, it is assumed that the template assign a relatively large number of tokens to each type constructor. It is also assumed that a substantial subset of the data fields to be extracted have a unique path from the root in the DOM tree of the pages. It also requires receiving as input multiple pages.
[14] presents DEPTA, a method that uses the visual layout of information in the page and tree edit-distance techniques to detect lists of records in a page and to extract the structured data records that form it. As well as in our method, DEPTA
Precision
% Correct# Incorrect# CorrectStage 2
98.553557# Records to ExtractStage 3
97.39
Recall3464# Correct Extracted Records3515# Extracted Records
93.5013187
99.002198
% Correct# Incorrect# CorrectStage 1
Precision
% Correct# Incorrect# CorrectStage 2
98.553557# Records to ExtractStage 3
97.39
Recall3464# Correct Extracted Records3515# Extracted Records
93.5013187
99.002198
% Correct# Incorrect# CorrectStage 1
Table 1. Results obtained in the empirical evaluation

requires as input one single page containing a list of structured data records. They also use the observation that, in the DOM tree of a page, each record in a list is composed of a set of consecutive sibling subtrees. Nevertheless, they make two additional assumptions: 1) that exactly the same number of sub-trees must form all records, and 2) that the visual gap between two data records in a list is bigger than the gap between any two data values from the same record. Those assumptions do not hold in all web sources. For instance, neither of the two assumptions holds in our example page of Fig. 3. In addition, the method used by DEPTA to detect data regions is considerably more expensive than ours.
A limitation of our approach arises in the pages where the attributes constituting a data record are not contiguous in the page. Those cases do not conform to our page creation model and, therefore, our current method is unable to deal with them. Although DEPTA assumes a page creation model similar to the one we use, after detecting a list of records, they try to identify these cases and transform them in “conventional” ones before continuing the process. These heuristics could be adapted to work with our approach.
References
1. Arasu, A. and Garcia-Molina, H. Extracting Structured Data from Web Pages. In Proc. of the ACM SIGMOD Int. Conf. on Management of Data, 2003.
2. Baumgartner, R., Flesca, S. and Gottlob, G. Visual Web Information Extraction with Lixto. In Proc. of Very Large DataBases (VLDB), 2001.
3. Chakrabarti, S. Mining the Web: Discovering Knowledge from Hypertext Data. ISBN: 1-55860-754-4. Morgan Kaufmann Publishers, 2003.
4. Chang, C. and Lui, S. IEPAD: Information extraction based on pattern discovery. In Proc. of 2001 Int. World Wide Web Conf., pp. 681–688, 2001.
5. Crescenzi, V., Mecca, G. and P. Merialdo. ROADRUNNER: Towards automatic data extraction from large web sites. In Proc. of the 2001 Int. VLDB Conf, pp. 109–118, 2001.
6. Gonnet, G.H., Baeza-Yates, R.A. and Snider, T. New Indices for Text: Pat trees and Pat Arrays. Information Retrieval: Data Structures and Algorithms, Prentice Hall, 1992.
7. Laender, A. H. F., Ribeiro-Neto, B. A., Soares da Silva, A. and Teixeira, J. S. A Brief Survey of Web Data Extraction Tools. ACM SIGMOD Record 31(2), pp 84-93. 2002.
8. Levenshtein, V. I. Binary codes capable of correcting deletions, insertions, and reversals. Soviet Physics Doklady 10, pp. 707–710, 1966.
9. Muslea, I., Minton, S., Knoblock, C. Hierarchical Wrapper Induction for Semistructured Information Sources. Autonomous Agents and Multi-Agent Systems, pp. 93-114, 2001.
10. Notredame, C. Recent Progresses in Multiple Sequence Alignment: A Survey. Technical report, Information Genetique et, 2002.
11. Pan, A.,et al. Semi-Automatic Wrapper Generation for Commercial Web Sources. In Proc. of IFIP WG8.1 Conf. on Engineering Inf. Systems in the Internet Context (EISIC). 2002
12. Raposo, J., Pan, A., Álvarez, M. and Hidalgo, J. Automatically Maintaining Wrappers for Web Sources. Data & Knowledge Engineering 61(2), pp. 331-358, 2007.
13. Zhai, Y. and Liu, B. Extracting Web Data Using Instance-Based Learning. In Proc. of Web Information Systems Engineering (WISE), pp. 318-331, 2005.
14. Zhai, Y. and Liu, B. Structured Data Extraction from the Web Based on Partial Tree Alignment. IEEE Trans. Knowl. Data Eng. 18(12), pp. 1614-1628, 2006.