Embed Size (px)
Citation preview
Financing the Sustainable Development Goals with Diaspora Investment


Financing the Sustainable Development Goals with
Diaspora Investment

Authors Heidi Tavakoli and Charumathi Raja
© Commonwealth Secretariat 2017
All rights reserved. This publication may be reproduced, stored in a retrieval system, or transmitted in any form or by any means, electronic or mechanical, including photocopying, recording or otherwise provided it is used only for educational purposes and is not for resale, and provided full acknowledgement is given to the Commonwealth Secretariat as the original publisher.
Views and opinions expressed in this publication are the responsibility of the author and should in no way be attributed to the institutions to which they are affiliated or to the Commonwealth Secretariat.
Wherever possible, the Commonwealth Secretariat uses paper sourced from responsible forests or from sources that minimise a destructive impact on the environment.
Printed and published by the Commonwealth Secretariat.

Contents \ iii
ContentsExecutive Summary 1
1. Introduction 3
2. TheImportanceofMigrationin theCommonwealth 4
3. Remittances in the Commonwealth 6
4. DefiningandMeasuringDiasporaInvestment 9
4.1 Defining diaspora investments 9
4.2 Measuring diaspora investments 10
4.3 Calculating diaspora investment potential: methodology 12
5. Commonwealth Diaspora Investment Potential 15
5.1 Diaspora investment potential 15
5.2 Migrant investment potential 16
5.3 Caveats 19
6. Policy Options to Advance Diaspora Investment 23
7. Conclusion 26
References and Bibliography 27
Annex 30


Executive Summary \ 1
Executive SummaryThesubstantivefinancinggapassociatedwithimplementingtheSustainable Development Goals (SDGs) is compelling countries to lookfor alternativesourcesoffinancetoachievetheirinternationalcommitments. International diasporas have emerged as an important community to assist countries to advance their development agenda and newformsofdiasporainvestmentmaygosomewaytoclosethe SDG financing gap.
Migration has been one of the key pillars upon which the association of Commonwealth members has been built. It has resulted in a large Commonwealth diaspora across Commonwealth countries, with the significance of intra-Commonwealth migration still visible to this day. In 2015, 44 per cent of migration from Commonwealth countries was to other Commonwealth countries, equivalent to approximately 22 million migrants per annum.1 At the same time, remittance flows now dwarf all other external financial flows to Commonwealth emerging and developing countries2 and were equivalent to approximately 42 per cent of these flows in 2015. Even though the volume of these flows varies greatly across countries, as does the significance of remittances as a proportion of gross domestic product (GDP), they remain a key source of external finance for most Commonwealth countries.
‘Diaspora investment’, as defined here, is distinguishable from remittances, and is a financial transfer that is: (i) sent by members of a diaspora to their country of origin; ii) received by business enterprises, government organisations or non-government organisations; and (iii) provides a financial return (or an item of corresponding value) to the sender. Scaling up diaspora investment offers multiple economic and social benefits for recipient as well as remitter countries.
1 This number is based on formally recorded migration flows.
2 Excluding Australia, Canada, Cyprus, Malta, New Zealand, the UK and Singapore.
Rather than attempting to estimate the total size of current Commonwealth diaspora investment – which is a challenging albeit valuable task – this paper presents an estimate of the ‘diaspora investment potential’ for Commonwealth countries. It is a measure of the maximum additional finance that could be leveraged from a country’s diaspora for investment purposes, and is equal to the proportion of income that is allocated to savings from migrants and their children.
Key findings for Commonwealth diaspora investment potential:
• We estimate that the baseline diaspora investment potential for Commonwealth countries is approximately US$73.2 billion per annum; this comprises US$47.6 billion raised from migrants (migrant investment potential) and US$25.6 billion raised from their children (first-generation diaspora investment potential). Together this is equivalent to approximately 50 per cent of current remittances to Commonwealth countries per annum and roughly $30 per annum for each Commonwealth citizen globally.
• Commonwealth diaspora investment potential is greatest in absolute terms for the South Asia region (India, Pakistan, Bangladesh, Sri Lanka). The group ‘Other Commonwealth countries’, which includes advanced economies in the Commonwealth, and East Asian countries are the next groups that could potentially leverage large absolute additional finance from their diaspora, but
2 \ Financing the Sustainable Development Goals with Diaspora Investment
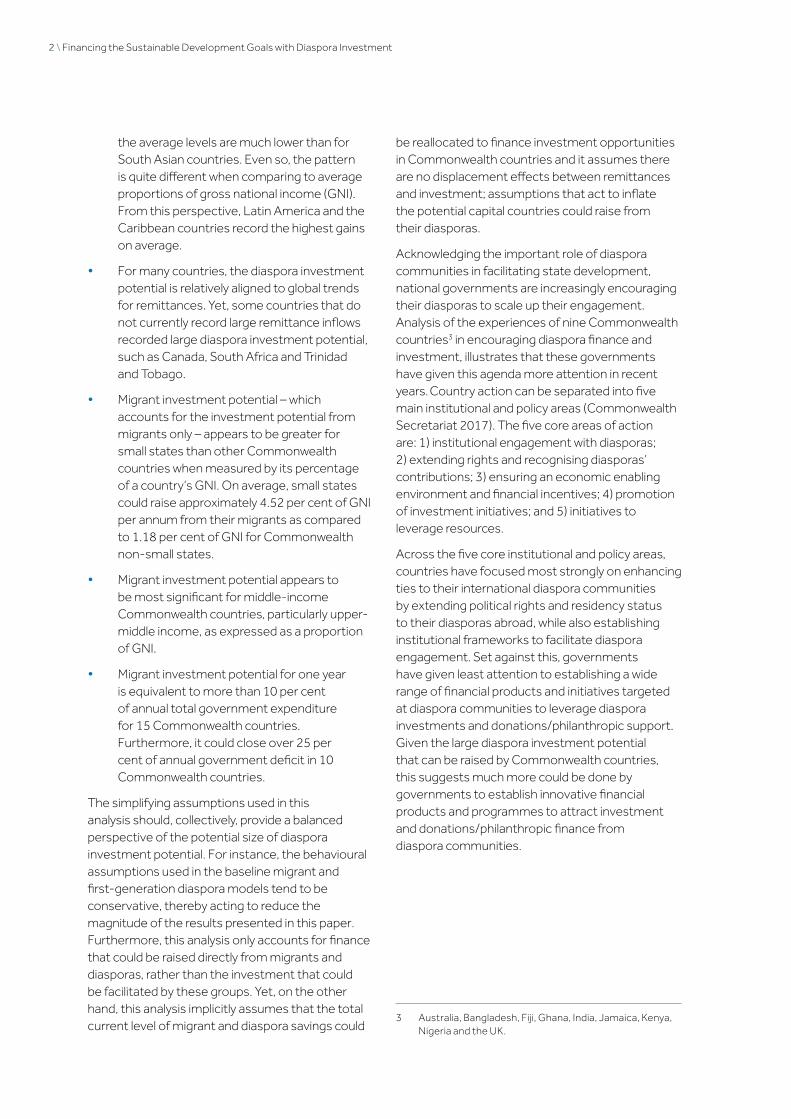
the average levels are much lower than for South Asian countries. Even so, the pattern is quite different when comparing to average proportions of gross national income (GNI). From this perspective, Latin America and the Caribbean countries record the highest gains on average.
• For many countries, the diaspora investment potential is relatively aligned to global trends for remittances. Yet, some countries that do not currently record large remittance inflows recorded large diaspora investment potential, such as Canada, South Africa and Trinidad and Tobago.
• Migrant investment potential – which accounts for the investment potential from migrants only – appears to be greater for small states than other Commonwealth countries when measured by its percentage of a country’s GNI. On average, small states could raise approximately 4.52 per cent of GNI per annum from their migrants as compared to 1.18 per cent of GNI for Commonwealth non-small states.
• Migrant investment potential appears to be most significant for middle-income Commonwealth countries, particularly upper-middle income, as expressed as a proportion of GNI.
• Migrant investment potential for one year is equivalent to more than 10 per cent of annual total government expenditure for 15 Commonwealth countries. Furthermore, it could close over 25 per cent of annual government deficit in 10 Commonwealth countries.
The simplifying assumptions used in this analysis should, collectively, provide a balanced perspective of the potential size of diaspora investment potential. For instance, the behavioural assumptions used in the baseline migrant and first-generation diaspora models tend to be conservative, thereby acting to reduce the magnitude of the results presented in this paper. Furthermore, this analysis only accounts for finance that could be raised directly from migrants and diasporas, rather than the investment that could be facilitated by these groups. Yet, on the other hand, this analysis implicitly assumes that the total current level of migrant and diaspora savings could
be reallocated to finance investment opportunities in Commonwealth countries and it assumes there are no displacement effects between remittances and investment; assumptions that act to inflate the potential capital countries could raise from their diasporas.
Acknowledging the important role of diaspora communities in facilitating state development, national governments are increasingly encouraging their diasporas to scale up their engagement. Analysis of the experiences of nine Commonwealth countries3 in encouraging diaspora finance and investment, illustrates that these governments have given this agenda more attention in recent years. Country action can be separated into five main institutional and policy areas (Commonwealth Secretariat 2017). The five core areas of action are: 1) institutional engagement with diasporas; 2) extending rights and recognising diasporas’ contributions; 3) ensuring an economic enabling environment and financial incentives; 4) promotion of investment initiatives; and 5) initiatives to leverage resources.
Across the five core institutional and policy areas, countries have focused most strongly on enhancing ties to their international diaspora communities by extending political rights and residency status to their diasporas abroad, while also establishing institutional frameworks to facilitate diaspora engagement. Set against this, governments have given least attention to establishing a wide range of financial products and initiatives targeted at diaspora communities to leverage diaspora investments and donations/philanthropic support. Given the large diaspora investment potential that can be raised by Commonwealth countries, this suggests much more could be done by governments to establish innovative financial products and programmes to attract investment and donations/philanthropic finance from diaspora communities.
3 Australia, Bangladesh, Fiji, Ghana, India, Jamaica, Kenya, Nigeria and the UK.

Introduction \ 3
1. Introduction At the United Nations General Assembly in 2015, the international community agreed on a demanding set of goals to advance sustainable development globally. These Sustainable Development Goals (SDGs) are wide-ranging and ambitious, and their implementation will require a significant upscaling of economic, social and environmental activities across the world. Most effort, however, will need to be applied to low- and middle-income countries, which generally have the furthest distance to travel if they are to achieve the SDGs by 2030.
These countries face the largest financing gaps to deliver these improvements. Few studies have attempted to quantify the comprehensive cost of delivering the SDGs. This mammoth task requires analysing advancements across 17 sectoral areas and 169 targets. Nonetheless, those that have undertaken such analysis suggest eye-watering figures. For instance, a paper by the United Nations Sustainable Development Solutions Network suggests the achievement of the SDGs requires additional incremental spending in low- and lower middle-income countries amounting to at least US$1.4 trillion per year (Schmidt-Traub 2015).
This is compelling countries to look for alternative approaches to increase external and domestic resources to fill this financing gap. The aim of this paper is to illustrate that attracting additional finance from a country’s diaspora, in the form of diaspora investment, may be one mechanism to close part of this financing gap.
One of the main historical pillars of the Commonwealth has been its role in facilitating migration within the Commonwealth. This has resulted in a large Commonwealth diaspora across Commonwealth countries, with the significance of intra-Commonwealth migration still visible to this day. These diasporas have significantly increased the volume of international financial transfers to their country of origin in the last 15 years in the form of remittances, and interviews with diaspora communities suggest that many are willing to provide much more (Benson et al. 2016; Developing
Markets Associate 2012; USAID 2014; USAID 2015; World Bank 2010; World Bank 2013). This provides an exciting opportunity for the Commonwealth to play a part in facilitating greater levels of diaspora finance to support the achievement of the SDGs.
This paper will attempt to quantify the volume of diaspora investment Commonwealth countries can potentially leverage from their diaspora, in addition to what is currently being provided in the form of remittances. The first section of the paper examines the historical importance of migration flows and diaspora in the Commonwealth, followed by a section illustrating the substantive increase of remittances in the Commonwealth as a form of external financial flows to Commonwealth countries over the last two decades. Section 4 defines the concept of diaspora investment and outlines the model used to estimate the financial quantum of diaspora investment that could be leveraged by Commonwealth countries. Following this section, the results, disaggregated by Commonwealth country, are discussed. The final section summarises actions taken by several Commonwealth countries aiming to attract this type of investment and points to potential ways forward for countries keen to embark on strategies to encourage greater levels of diaspora investment.

4 \ Financing the Sustainable Development Goals with Diaspora Investment
2. The Importance of Migration in theCommonwealth
Since the establishment of the Commonwealth in 1931, considerable action has been taken by Commonwealth countries to facilitate intra-Commonwealth migration. The British Nationality Act of 1948 granted subjects of the British Empire the right to live and work in the UK. Commonwealth citizens, not subject to immigration control, moved in vast numbers to the UK and over a seven-year period from 1955 to 1962, approximately half a million citizens from Commonwealth countries entered the UK. Even though legislation was passed to restrict Commonwealth migration to the UK in 1962, during the 1960s and 1970s, approximately 72,000–75,000 people were admitted to the UK each year (Migration Watch UK 2014). In the second half of the twentieth century, preferential rules for migrants from Commonwealth countries were also employed by other Commonwealth countries, such as in Australia with the Assisted Passage Scheme and fast-tracked citizenship rules.
Migration prior to 1931, at the time of the British Empire, also left a strong footprint on the global Commonwealth diaspora. Coerced migration during this period led to large flows of people from West Africa to the Caribbean, India to East Africa, and Britain to Australia, among other movements. Furthermore, policies to embed similarities in public administration, legal and education systems have long facilitated strong linkages among these countries.
This legacy of substantial population movements among Commonwealth countries is notable even to this day. In 2015, 44 per cent of migration from Commonwealth countries was to other Commonwealth countries (Table 1). This is equivalent to approximately 22 million migrants per annum and represents a small rise in the absolute value of intra-Commonwealth migration since 1990 from around 19 million (Figure 1). Therefore, one would expect to see large Commonwealth diaspora communities in Commonwealth countries reflecting both the large historical and recent migration trends. Even though the importance on intra-Commonwealth migration has reduced over recent decades, as the share fell from 63 per cent in 1990
to 44 per cent in 2015, the enduring prominence of Commonwealth migration remains to this day, as it continues to be the most significant recipient-country grouping for Commonwealth migration.
These migration estimates are based on official statistics of foreign-born or foreign populations by the UN Population Division. Although the number of refugees as reported by the UN Refugee Agency (UNHCR) was added to country estimates where possible, most of these figures did not account for the large levels of informal or unrecorded migration seen in many countries.
Presenting an accurate picture of the overall size of intra-Commonwealth migration and Commonwealth diaspora communities is important, in so much that it illustrates the size of the resource pool that can be leveraged for additional diaspora capital. Commonwealth migration trends illustrate the historical bias for migration within the Commonwealth, suggesting large Commonwealth diasporas have formed in Commonwealth countries. This implies a potentially large Commonwealth resource pool, and points to an important role for the Commonwealth to facilitate the advancement of diaspora investment.
Even though there is relatively robust data on formal international migration, very limited data exists on the size of international diaspora communities, so it is almost impossible to accurately estimate the size of the global Commonwealth diaspora. Some international organisations, such as the International Organization for Migration (IOM), have worked with individual countries to estimate the size of their diaspora in a particular locality. Other countries have also initiated independent efforts to understand, monitor and calculate the size of their diaspora abroad, through mapping exercises (assessing both the extent of their global diasporas and their skillsets); listening exercises;4 and databases on the activities of diaspora organisations. For instance, in Nigeria, the state-affiliated Nigerian National Volunteer Service (NNVS) was tasked with establishing and maintaining an internet database
4 Listening exercises with diaspora focus groups.

The Importance of Migration in the Commonwealth \ 5
of the stock and skillsets of Nigerians abroad to foster closer linkages between state institutions and diaspora communities. Meanwhile, in India, the High Level Committee on the Indian Diaspora initiated a stocktake of non-resident Indians (NRIs) and persons of Indian origin (PIOs) (Commonwealth Secretariat 2017). Yet, these exercises are particularly complex and time consuming and current methods are largely reliant on the self-
identification of diaspora, which relies heavily on the degree of interest/engagement of those targeted. Therefore, there are no systematic cross-country datasets on the size of diaspora communities in the Commonwealth, with this information only being gathered on a case-by-case basis.5
5 This affects the ability to accurately measure investment potential from diaspora communities.
Figure1Intra-andextra-Commonwealthmigration(millions),1990–2015
1990 1995 2000 2005 2010 2015
0
5
10
15
20
25
30
35
40
45
50
Mil
lion
s
19
18 18
19
20
22
12
15
4
5 57
2
2 2 3
44
2
4 3 23
3
3 4 5 5 6 7
CW - CW CW - GCC CW - OECD* CW - others CW - USA
Source: UN Department of Economic and Social Affairs (UNDESA), Population Division Notes: CW stands for Commonwealth; GCC stands for Gulf Cooperation Council (GCC) countries; and * means non-Commonwealth Organisation for Economic Co-operation and Development (OECD) countries
Table1Intra-andextra-Commonwealthmigration(asapercentage),1990–2015
Years CW–GCC CW–OECD* CW–USA CW–CW CW–others
1990 13.6% 5.8% 10.1% 62.6% 7.9%
1995 14.3% 5.9% 11.7% 56.1% 11.9%
2000 16.3% 6.7% 14.3% 54.2% 8.5%
2005 19.3% 8.2% 14.6% 51.2% 6.7%
2010 26.2% 8.3% 13.4% 46.1% 6.0%
2015 28.8% 7.7% 13.2% 44.2% 6.0%
Source: UNDESA, Population Division Notes: CW stands for Commonwealth; GCC stands for Gulf Cooperation Council (GCC) countries; and * means non-Commonwealth OECD countries

6 \ Financing the Sustainable Development Goals with Diaspora Investment
3. Remittances in the Commonwealth
Despite challenges in compiling a reliable estimate of international diaspora communities in Commonwealth countries, these individuals have emerged as a significant source of funding for Commonwealth countries in recent years.
Remittance flows now dwarf all other external financial flows to Commonwealth emerging and developing countries,6 and were equivalent to approximately 42 per cent of these flows in 2015. As such, they have become a key source of finance for economic and social development in these countries (Figure 2). The absolute size of remittances has grown tremendously over the
6 Excluding Australia, Canada, Cyprus, Malta, New Zealand, the UK and Singapore.
last 15 years, rising from US$22 billion per annum in 2000 to US$147 billion per annum in 2015 among Commonwealth emerging and developing countries. Remittances are now the largest external finance flow to this group of countries, exceeding foreign direct investment, portfolio equity, external debt and official development assistance (ODA).
Nevertheless, the volume of these flows varies greatly across countries, as does the significance of remittances as a proportion of GDP, which is most pronounced for small states. Several Commonwealth countries are some of the biggest receivers of remittances worldwide. For instance, India received the largest quantum of remittances globally in 2015, and Nigeria, Pakistan
Figure2ExternalfinanceflowstoCommonwealthdeveloping countries(billions),2000–15
2000 2005 2010 2015
0
50
100
150
200
250
300
350
Bil
lion
s
106.4
147.0
23.4
27.6
30.6
19.3
45.8
14.2
32.8
66.6
86.1
11.5
74.0
76.1
22.1
54.0
Net official development assistance and official aid receivedPortfolio equity, net flowsForeign direct investment, net inflows (BoP)
External
debt,
net
flow sPersonal
remittances,
received
5.2
611.3
9.5
Source: World Development Indicators, World Bank 2017a Note: Excluding Australia, Canada, Cyprus, Malta, New Zealand, Singapore, UK

Remittances in the Commonwealth \ 7
and Bangladesh were also included in the top-eight worldwide remittance-receiving countries. At the same time, many Commonwealth small states receive much lower absolute amounts of remittances, but they appear to be particularly dependent on these flows (measured as a
proportion of GNI). This is the case for Lesotho, Samoa and Jamaica, where remittances were equivalent to about 17–18 per cent of GNI in 2015 (Figure 5). The Commonwealth also includes a number of large remittance-sending countries, such as the UK and Australia.
Figure3Topfiveremittance-sendingcountriesintheCommonwealth(2015)
0K 1K 2K 3K 4K 5K 6K 7K 8K 9K 10K 11K 12K
M illions
United Kingdom
Australia
India
Canada
M alaysia
10,706
5,876
4,883
4,867
3,076
Source: World Bank Factbook
Figure4Topfiveremittance-receivingcountriesintheCommonwealth(2015)
0K 5K 10K 15K 20K 25K 30K 35K 40K 45K 50K 55K 60K 65K 70K 75K
M illions
India
Nigeria
Pakistan
Bangladesh
Sri Lanka
68,910
21,060
19,306
15,388
6,980
Source: World Bank Factbook
Figure 5 Most remittance-dependent countries in the Commonwealth (2015)
0 2 4 6 8 10 12 14 16 18
Percentage of GNI
Lesotho
Samoa
Jamaica
Kiribati
Tuvalu
Guyana
Sri Lanka
Bangladesh
17.51
17.23
16.86
11.01
10.59
9.27
8.48
7.89
Source: World Bank Factbook

8 \ Financing the Sustainable Development Goals with Diaspora Investment
4. DefiningandMeasuringDiaspora Investment
4.1DefiningdiasporainvestmentsThis paper lays out a conceptual framework for defining and estimating diaspora investment.
‘Diaspora investment’ is defined as financial transfers that:
i. are sent by members of a diaspora – that is, people living outside their, or their ancestors’, country of origin – to their country of origin;
ii. are received by business enterprises, government organisations or non-government organisations – that is, economic units other than households in the receiving country; and
iii. provide a financial return (or an item of corresponding value) to the sender. This excludes charitable and philanthropic donations, as well as returns that are not received by the sender (such as those transferred to family members or friends).7
There is no standard definition of diaspora investment used by international policy-makers. However, US Agency for International Development (USAID) and Inter-American Development Bank (IDB) policy documents refer to diaspora direct investment (DDI) which – according to IDB – refers to direct investments from companies connected to diasporas in productive activities in the home country (Rodriguez-Montemayor 2012). Both institutions infer a broad definition of diaspora investment which incorporates the idea of transnational networks and the influence of the component parts, such as social capital, brain gain and return migration (Debass and Ardovino 2009).
Diaspora investment, as defined here, provides a more restricted definition and focuses on investment that is financed by diasporas, excluding that which is facilitated by them. This definition excludes estimates of investments that have been assisted by diasporas using their management experience and technical know-how. For instance, to support viable business opportunities in their country of origin or to persuade companies to invest
7 This definition is drawn from work by Gelb 2016.
in their homeland. As there is growing evidence to illustrate that diasporas have played an important role in facilitating investments in their country of origin (ibid), the results presented in this paper may well provide an underestimation of the quantum of investment associated with diaspora communities.
Despite this more restrictive definition, scaling up diaspora investment offers multiple benefits for recipient countries, such as: (1) providing additional resources to finance development; (2) expanding capital markets; (3) enabling access to less costly credit (Suhas et al. 2007);8 (4) encouraging greater non-diaspora investor confidence and investment (Debass and Ardovino 2009); and (5) providing a more reliable resource flow that is not solely driven by the rate of financial return, particularly in the face of growing global uncertainty (e.g. Brexit, oil price rises) (Sirkeci et al. 2012). It also offers considerable additional benefits for advanced remittance-sending countries, many of which are facing conflicting pressures to moderate ODA, while at the same time striving to foster peace and international development as a means to address threats from terrorism and instability. This has led international agencies and government administrations to look to ways to encourage diaspora investments, particularly in emerging and developing countries.
Within the Commonwealth, many member states would benefit from scaling up diaspora investment, as it could provide a significant injection of financial resources to advance economic development and strengthen their national strategies to achieve the SDGs.
4.2Measuring diaspora investments
Though diaspora investment can potentially deliver significant benefits, compiling an accurate picture of the volume of diaspora investment is challenging. Cross-country compilations and publications of cross-border capital flows, such as foreign direct
8 By means of ‘patriotic discounts’ for government bonds or securitising assets/remittances to achieve investment grade ratings.
Defining and Measuring Diaspora Investment \ 9
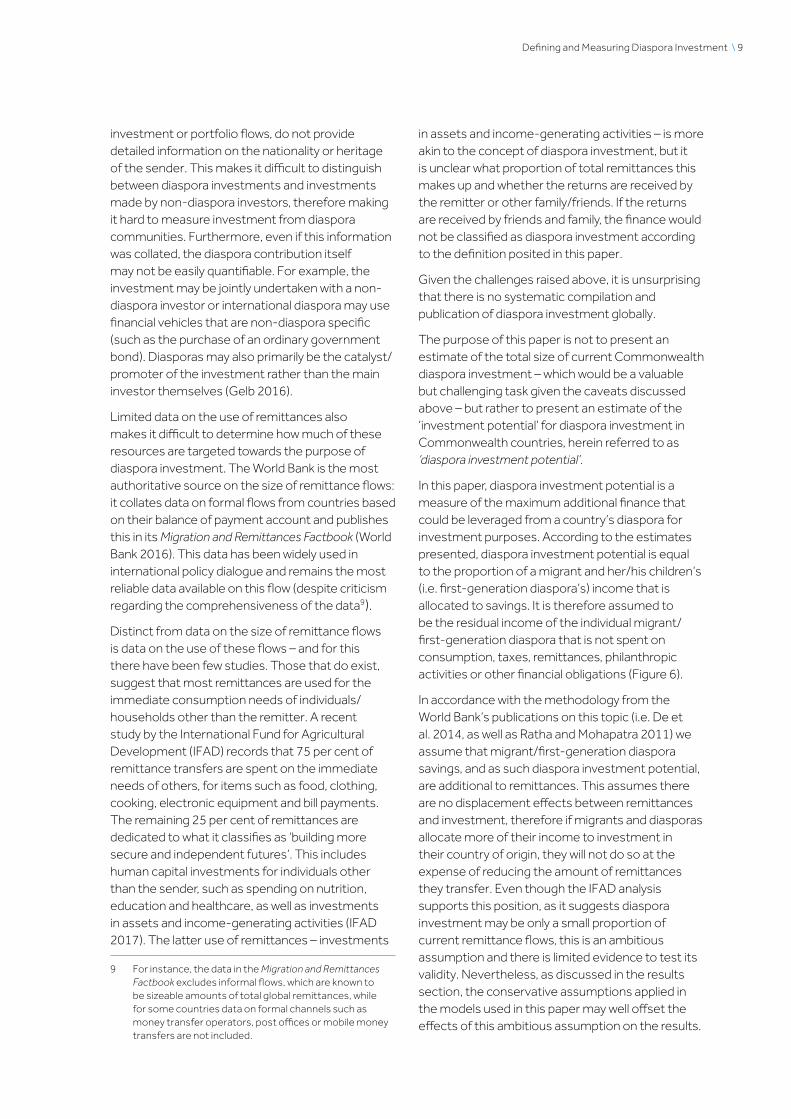
investment or portfolio flows, do not provide detailed information on the nationality or heritage of the sender. This makes it difficult to distinguish between diaspora investments and investments made by non-diaspora investors, therefore making it hard to measure investment from diaspora communities. Furthermore, even if this information was collated, the diaspora contribution itself may not be easily quantifiable. For example, the investment may be jointly undertaken with a non-diaspora investor or international diaspora may use financial vehicles that are non-diaspora specific (such as the purchase of an ordinary government bond). Diasporas may also primarily be the catalyst/promoter of the investment rather than the main investor themselves (Gelb 2016).
Limited data on the use of remittances also makes it difficult to determine how much of these resources are targeted towards the purpose of diaspora investment. The World Bank is the most authoritative source on the size of remittance flows: it collates data on formal flows from countries based on their balance of payment account and publishes this in its Migration and Remittances Factbook (World Bank 2016). This data has been widely used in international policy dialogue and remains the most reliable data available on this flow (despite criticism regarding the comprehensiveness of the data9).
Distinct from data on the size of remittance flows is data on the use of these flows – and for this there have been few studies. Those that do exist, suggest that most remittances are used for the immediate consumption needs of individuals/households other than the remitter. A recent study by the International Fund for Agricultural Development (IFAD) records that 75 per cent of remittance transfers are spent on the immediate needs of others, for items such as food, clothing, cooking, electronic equipment and bill payments. The remaining 25 per cent of remittances are dedicated to what it classifies as ‘building more secure and independent futures’. This includes human capital investments for individuals other than the sender, such as spending on nutrition, education and healthcare, as well as investments in assets and income-generating activities (IFAD 2017). The latter use of remittances – investments
9 For instance, the data in the Migration and Remittances Factbook excludes informal flows, which are known to be sizeable amounts of total global remittances, while for some countries data on formal channels such as money transfer operators, post offices or mobile money transfers are not included.
in assets and income-generating activities – is more akin to the concept of diaspora investment, but it is unclear what proportion of total remittances this makes up and whether the returns are received by the remitter or other family/friends. If the returns are received by friends and family, the finance would not be classified as diaspora investment according to the definition posited in this paper.
Given the challenges raised above, it is unsurprising that there is no systematic compilation and publication of diaspora investment globally.
The purpose of this paper is not to present an estimate of the total size of current Commonwealth diaspora investment – which would be a valuable but challenging task given the caveats discussed above – but rather to present an estimate of the ‘investment potential’ for diaspora investment in Commonwealth countries, herein referred to as ‘diaspora investment potential’.
In this paper, diaspora investment potential is a measure of the maximum additional finance that could be leveraged from a country’s diaspora for investment purposes. According to the estimates presented, diaspora investment potential is equal to the proportion of a migrant and her/his children’s (i.e. first-generation diaspora’s) income that is allocated to savings. It is therefore assumed to be the residual income of the individual migrant/first-generation diaspora that is not spent on consumption, taxes, remittances, philanthropic activities or other financial obligations (Figure 6).
In accordance with the methodology from the World Bank’s publications on this topic (i.e. De et al. 2014, as well as Ratha and Mohapatra 2011) we assume that migrant/first-generation diaspora savings, and as such diaspora investment potential, are additional to remittances. This assumes there are no displacement effects between remittances and investment, therefore if migrants and diasporas allocate more of their income to investment in their country of origin, they will not do so at the expense of reducing the amount of remittances they transfer. Even though the IFAD analysis supports this position, as it suggests diaspora investment may be only a small proportion of current remittance flows, this is an ambitious assumption and there is limited evidence to test its validity. Nevertheless, as discussed in the results section, the conservative assumptions applied in the models used in this paper may well offset the effects of this ambitious assumption on the results.

10 \ Financing the Sustainable Development Goals with Diaspora Investment
Diaspora investment potential is made up of migrant investment potential (where Commonwealth migrants are defined as individuals who have left their Commonwealth country of origin and now reside elsewhere in the world) and first-generation diaspora investment potential (where first-generation diasporas are defined as the children of Commonwealth migrants whose parents still live outside their country of birth). Country of origin is defined as a migrant’s country of birth.
Most perception studies on diaspora investors have focused on migrants’ interest to invest in their country of origin. These studies have regularly shown a large untapped demand for diaspora investment, as migrants are able and willing to invest more than they currently do (Benson et al. 2016; Developing Markets Associate 2012; USAID 2014; USAID 2015; World Bank 2010; World Bank 2013). There is less research on the interests of first-generation diaspora to invest in their parents’ country of origin; however, anecdotal evidence and qualitative analysis suggest future generations may also be interested in making such investments (Nielson and Riddle 2007). As such, we illustrate estimates of the investment potential for first-generation diaspora, as well as for the migrants themselves. The next section outlines the model used to calculate the investment potential from Commonwealth migrants living abroad and from their children.
4.3Calculating diaspora investment potential: methodology
The estimates from these models cover the diaspora investment potential for Commonwealth countries based on their global stock of migrants (i.e. migrants living and working in both Commonwealth and non-Commonwealth countries). The models are static in the sense that they estimate the annual diaspora investment potential per country based on data on the current number of migrant workers living across the world.
The economic modelling of diaspora investment potential builds largely on the model proposed by De et al. (2014) and Ratha and Mohapatra (2011) (herein referred to as the ‘World Bank model’). At the time of writing this paper, the World Bank model provided the most comprehensive approach to calculate savings that could be raised from global diasporas. To strengthen the estimation of Commonwealth diaspora investment potential, this analysis applies three main modifications to the World Bank model. First, additional economic factors related to labour force participation and employment were used in the calculation of worker stocks, reflecting the behaviour of migrants working abroad. Second, this model estimates the potential investment that could be raised from first-generation diasporas. Third, alterative assumptions were used for factors such as average migrant
Figure 6 Diaspora investment potential
Migrants & diaspora income
Direct & indirect taxes
Consumption
SavingsMeasures the ‘diaspora investment potential’
to invest in country of origin
Remittances
Philantrophy
Financial obligations
Defining and Measuring Diaspora Investment \ 11
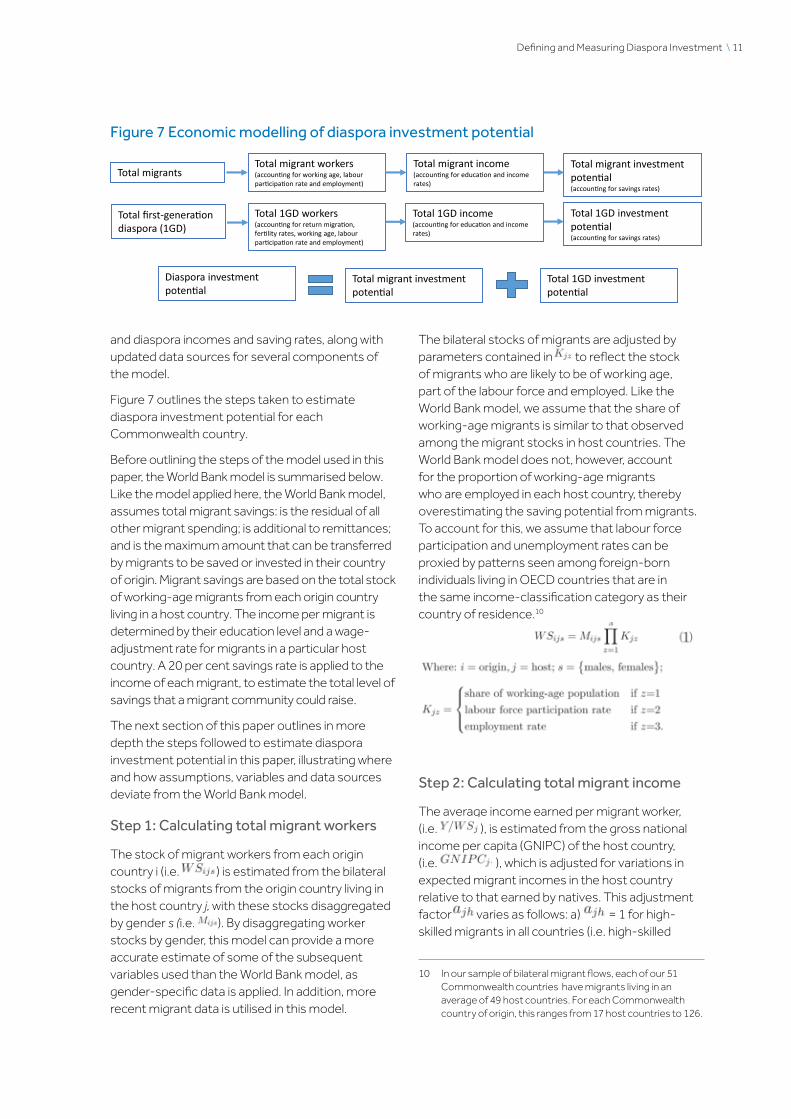
and diaspora incomes and saving rates, along with updated data sources for several components of the model.
Figure 7 outlines the steps taken to estimate diaspora investment potential for each Commonwealth country.
Before outlining the steps of the model used in this paper, the World Bank model is summarised below. Like the model applied here, the World Bank model, assumes total migrant savings: is the residual of all other migrant spending; is additional to remittances; and is the maximum amount that can be transferred by migrants to be saved or invested in their country of origin. Migrant savings are based on the total stock of working-age migrants from each origin country living in a host country. The income per migrant is determined by their education level and a wage-adjustment rate for migrants in a particular host country. A 20 per cent savings rate is applied to the income of each migrant, to estimate the total level of savings that a migrant community could raise.
The next section of this paper outlines in more depth the steps followed to estimate diaspora investment potential in this paper, illustrating where and how assumptions, variables and data sources deviate from the World Bank model.
Step 1: Calculating total migrant workers
The stock of migrant workers from each origin country i (i.e. ) is estimated from the bilateral stocks of migrants from the origin country living in the host country j, with these stocks disaggregated by gender s (i.e. ). By disaggregating worker stocks by gender, this model can provide a more accurate estimate of some of the subsequent variables used than the World Bank model, as gender-specific data is applied. In addition, more recent migrant data is utilised in this model.
The bilateral stocks of migrants are adjusted by parameters contained in to reflect the stock of migrants who are likely to be of working age, part of the labour force and employed. Like the World Bank model, we assume that the share of working-age migrants is similar to that observed among the migrant stocks in host countries. The World Bank model does not, however, account for the proportion of working-age migrants who are employed in each host country, thereby overestimating the saving potential from migrants. To account for this, we assume that labour force participation and unemployment rates can be proxied by patterns seen among foreign-born individuals living in OECD countries that are in the same income-classification category as their country of residence.10
Step 2: Calculating total migrant income
The average income earned per migrant worker, (i.e. ), is estimated from the gross national income per capita (GNIPC) of the host country, (i.e. ), which is adjusted for variations in expected migrant incomes in the host country relative to that earned by natives. This adjustment factor varies as follows: a) = 1 for high-skilled migrants in all countries (i.e. high-skilled
10 In our sample of bilateral migrant flows, each of our 51 Commonwealth countries have migrants living in an average of 49 host countries. For each Commonwealth country of origin, this ranges from 17 host countries to 126.
Figure 7 Economic modelling of diaspora investment potential
Total migrantsTotal migrant income (accounting for education and income rates)
Total migrant investment potential (accounting for savings rates)
Total migrant workers (accounting for working age, labourparticipation rate and employment)
Total first-generation diaspora (1GD)
Total 1GD workers (accounting for return migration, fertility rates, working age, labourparticipation rate and employment)
Total 1GD income (accounting for education and income rates)
Total 1GD investment potential (accounting for savings rates)
Diaspora investment potential
Total migrant investment potential
Total 1GD investment potential

12 \ Financing the Sustainable Development Goals with Diaspora Investment
Commonwealth migrants receive the same GNIPC as high-skilled natives in each host country); b) = 0.30 for low-skilled migrants in OECD countries; c) = 0.2 for low-skilled migrants in Gulf Cooperation Council countries; and d) = 0.5 for low-skilled migrants in all other countries. This model applies the same income adjustment estimates as the World Bank model. This is because there continues to be an absence of cross-country data on migrant income levels in different countries. The World Bank model assumes that highly-skilled migrants can earn similar levels to natives and they therefore earn a similar average GNIPC in the host country, but unskilled migrants will earn substantially less than the average GNIPC. This reduction is even greater in Gulf countries, where the average GNI is high and there is large income inequality.
In addition, whether a migrant worker qualifies as high- or low-skilled, i.e. h is proxied by the ratio of tertiary-educated migrants from origin country, (i.e. ).
The migrant income of the country of origin, (i.e. ), is estimated as the sum of migrant income from all host countries. In each host country, migrant income is calculated as the product of migrant worker stock and the average income earned per migrant worker.
Step 3: Calculating total migrant savings
Migrant savings for an origin country are calculated as the sum of savings from migrants from that country living in all host countries. Within each host country, savings are the product of migrant income (i.e. ) multiplied by an estimated household savings rate (i.e. ). The World Bank paper applies a savings rate of 20 per cent; however, this paper utilised the most comprehensive current cross-country data on household savings to provide a more nuanced estimation of savings rates per migrant community. Here, household savings rates were approximated using the ratio of household savings to household gross disposable income, using data recorded as per the 1993 System of National Accounts. A ten-year average
over the period 2005 to 2014 was calculated for the sample of 60 countries and the average household savings rate for each income group was used. In this model, three different values of savings rates were applied to illustrate the sensitivity of the model to this assumption: i) savings rates varying by host country; ii) savings rates varying by origin country; and iii) a uniform rate of 0.2 – this was an estimated savings rate for developing countries in 2009 used in the World Bank analysis. In the baseline model for migrants, the savings rate was held fixed at the rate observed among countries of the same income classification as the host country.
Step4:Calculatingfirst-generationdiaspora worker stocks, incomes and savings
Following from the baseline model for migrants, an additional model was also estimated for first-generation diaspora – defined as the children born to migrants who have settled abroad. This analysis was not attempted in the World Bank model. As discussed above, this estimation is included because anecdotal evidence suggests that migrants’ children, in addition to migrants themselves, feel an affiliation to their parents’ country of origin and are contributing – or are willing to contribute – financially to their parents’ country of origin.
The difference between models used for migrants and first-generation diaspora arises at the stage of calculating worker stocks. Additional parameters were applied to calculate first-generation diaspora stocks, (i.e. ). In this case, migrants who return to their country of origin or migrate elsewhere, i.e. , were excluded from the bilateral stock of migrants, and estimates of the number of children that the migrants remaining abroad are likely to have (as proxied by the fertility rate, i.e. ) were calculated. Similar to the model for migrants, first-generation diaspora stocks were adjusted to reflect those who are likely to be part of the labour force and employed, i.e. using parameters in . In this instance, however, first-generation diasporas are assumed to be largely similar to native-born

Defining and Measuring Diaspora Investment \ 13
workers, and hence display the same labour force participation and employment rates as observed among native-born workers in the host country. We assume all first-generation diaspora are of working-age, as the model looks ahead to when all the children born to these migrants will be of working-age. The same savings rate scenarios in the migrant’s model were applied. In the results section of this paper, there is a more detailed discussion of the data caveats related to household saving rates for migrants and diaspora communities. Even if one assumes that savings rates for first-generation diaspora would be lower than that for migrants, there is limited evidence to support this, therefore the same simplifying savings assumptions have been applied in both models.
Due to limited socio-economic data on diaspora households, three main scenarios were modelled to test the sensitivity of our estimates of first-generation diaspora stocks, incomes and savings. First, different values were used for the proportion of migrants who are likely to leave their host countries, i.e. . Three values were used: i) the ratio of outflows to inflows of foreign-born population in OECD countries (2010–14), estimated to be 39.33 per cent (this is used in the baseline model for first-generation diasporas); ii) an upper-bound estimate for return migration of 50 per cent; and iii) a lower-bound estimate of 20 per cent (based on anecdotal estimates of the percentage of immigrants who leave within five years after their arrival in OECD countries (Dumont and Spielvogel 2008). Second, higher- and lower-wage adjustment factors were applied for first-generation diasporas. This scenario tests the sensitivity of the model’s estimates to the children of migrants having better or worse labour market prospects compared to their parents. Given the lack of documentation of the differences in opportunities available for migrant, native-born and mixed households in both advanced and developing countries, the wage adjustment factor used in the migrant model was applied in the baseline model for first-generation diasporas. Lastly, different fertility rates were used in the model to estimate the number of first-generation diaspora stock. Considering the limited information on the size and composition of migrant households in different socio-economic
contexts, estimates were based on whether the family structures reflect the characteristics of the host country or origin country, and whether males and females bore children. In the baseline model for first-generation diasporas, women migrants were assumed to have children according to the fertility rate in their host countries. See Table A1 for a more detailed discussion of the list of variables, assumptions and data sources used for this analysis.

14 \ Financing the Sustainable Development Goals with Diaspora Investment
5. Commonwealth Diaspora Investment Potential
This section focuses on estimates of the potential additional resources that can be leveraged by Commonwealth countries in the form of diaspora investments.
As discussed above, diaspora investment potential is based on estimates of migrant savings and first-generation diaspora savings. The estimates presented are based on a number of assumptions about migrant and diaspora characteristics and behaviour, so should be treated as approximations. Data and assumption caveats are presented at the end of the results section.
We estimate that the baseline diaspora investment potential for Commonwealth countries is approximately US$73.2 billion per annum; this comprises US$47.6 billion from migrants and US$25.6 billion from first-generation diasporas. Together, this is equivalent to approximately 50 per cent of total remittances to Commonwealth countries per annum, which stands at US$147 billion (2015), and roughly US$30 dollars per annum for each Commonwealth citizen globally.
The baseline results for the migrant savings and first-generation savings disaggregated by country are included in the annex – in Table A2 (migrant savings) and Table A3 (first-generation diaspora savings).
5.1 Diaspora investment potentialFigure 8 shows the baseline diaspora investment potential for each Commonwealth country, illustrated in logarithmic scale. Given the wide range of countries in the Commonwealth and the widely varying levels of estimated diaspora savings, a logarithmic scale was used to graphically depict these values, which span several orders of magnitude.
Commonwealth diaspora investment potential is greatest for the South Asia region (India, Pakistan, Bangladesh, Sri Lanka). The amounts of additional resources far exceed those that could be raised by other Commonwealth countries (at an average
of US$10 billion per country). The category ‘Other Commonwealth countries’, which includes advanced economies in the Commonwealth, and East Asian countries, are the next groups that could potentially leverage large absolute additional finance from their diaspora. Yet, the performance within both these groups varies considerably, with Malaysia, Canada and the UK recording large diaspora investment potential, while Brunei Darussalam and Malta illustrate low levels of diaspora investment potential. As such, the financial resources raised by East Asia and Other Commonwealth countries is much lower on average (at US$1.7 billion and US$1.4 billion, respectively) than for a Commonwealth South Asian country.
Despite large variations between countries, relatively similar amounts of additional resources can be raised on average across Latin America and Caribbean and African countries, with much less being raised in absolute terms by Pacific countries (excluding Australia and New Zealand).
The pattern is quite different when comparing to average proportions of GNI. From this perspective, Latin America and Caribbean countries record the highest gains on average (with diaspora investment potential equating to an additional 12.2 per cent of GNI on average per country per annum), followed by the Pacific region and South Asia (recording 8.2 per cent and 3.6 per cent respectively). As indicated ahead, this suggests small countries have much more to gain on a GNI per capita basis than some of the larger Commonwealth countries. Yet if displacement effects between remittances and diaspora investment exist, countries that are already heavily reliant on remittances may find any substantial gains from diaspora investment being matched by reductions in remittances.
For many individual countries, the diaspora investment potential is relatively aligned to global trends for remittances. For instance, Commonwealth countries in South Asia are some of the biggest global remittance receivers, (i.e. India, Pakistan and Bangladesh), therefore we

Commonwealth Diaspora Investment Potential \ 15
Africa
Carribbeanand LatinAmerica
South
Asia
East Asia
Pacific
Other
CW countries
Botsw ana
Cameroon
Ghana
Kenya
Lesotho
M alaw i
M auritius
M ozambique
Namibia
Nigeria
Rw anda
Seychelles
Sierra Leone
South Africa
Sw aziland
Tanzania
Uganda
Zambia
Antigua and Barbuda
Bahamas, The
Barbados
Belize
Dominica
Grenada
Guyana
Jamaica
St Kitts and Nevis
St Lucia
SVG
Trinidad and Tobago
Bangladesh
India
Pakistan
Sri Lanka
Brunei Darussalam
M alaysia
Singapore
Fiji
Kiribati
Papua New Guinea
Samoa
Solomon Islands
Tonga
Tuvalu
Vanuatu
Australia
Canada
Cyprus
M alta
New Zealand
United Kingdom
1 2 5 10
20
50
10
0
20
0
50
0
1,0
00
2,0
00
5,0
00
10
,00
0
20
,00
0
Investment
First Generation investment potential Migrant investment potential
Figure8Commonwealthdiasporainvestmentpotential(currentUSDmillions)
Source: Authors’ calculations (2017) Notes: Logarithmic scale: tick marks are drawn at the powers of 10

16 \ Financing the Sustainable Development Goals with Diaspora Investment
would expect that these countries could also raise considerable diaspora investment from their diaspora abroad. Similarly, other countries that also receive large absolute volumes of remittances – such as Nigeria and the UK – show large diaspora investment potential. These results are primarily driven by the larger migrant and worker stocks recorded from these countries. For instance, the largest Commonwealth migrant stocks are recorded for India, Bangladesh, Pakistan, the UK, Malaysia, Sri Lanka and Canada (in this order).
At the same time, there are several countries that currently do not record large remittance inflows, according to global remittances data, but have high diaspora investment potential. Such countries include Canada, South Africa, and Trinidad and Tobago. This result is capturing the relative high migrant stocks from these countries, as well as other factors that positively influence diaspora investment potential in our model (such as higher education levels, higher wage rates in host countries, low employment rates and high fertility rates for first-generation diaspora).
For Canada, the relatively large bilateral migrant stocks and large presence of these migrants in high-income countries explains the large diaspora investment potential. While for South Africa, migrants are on average more highly skilled than those from many African countries and combined with a solid migrant stock, the country records large diaspora investment potential. The gap between remittances and diaspora investment potential may also be explained by the economic performance of the country. For instance, one would expect that there is less behavioural pressure on migrants from high-income countries, such as Canada and Trinidad and Tobago, to remit money back home for the immediate needs of others. Together this explains why some countries record large diaspora investment potential, while receiving relatively low levels of global remittances. It would be useful to further investigate why these anomalies exist, because this analysis suggests that the unexploited potential to raise resources from a country’s diaspora is much greater for these countries than for others.
5.2 Migrant investment potentialFigure 9 and Table 3 present a deeper dive on the part of the investment potential that is made up of the Commonwealth migrant investment potential.
This has been selected because the larger sample size used in the estimation of migrant rather than first-generation diaspora stocks and incomes11 allows for a more accurate estimate of potential savings for migrants.
Migrant investment potential appears to be greater for small states than other Commonwealth countries, when measured by such investment’s percentage of a country’s GNI. According to this classification, countries in Latin America and the Caribbean, and those in the Pacific, rank much higher than those in other regions, due to the fact that these regions in the Commonwealth consist primarily of small states. Small states that observe the highest migrant investment potential are: Guyana, Tonga, Samoa and Dominica. On average, small states could raise an additional 4.52 per cent of GNI per annum from migrants, as compared to 1.18 per cent of GNI for Commonwealth non-small states.
When observing trends across income classifications, estimates suggest that migrant investment potential appears to be most significant for middle-income countries, particularly upper-middle income countries, as expressed as a proportion of GNI. For high-income countries in the Commonwealth, the significance of this flow is comparatively small as a fraction of GNI, even though outward migration is likely to be mostly high-skilled and to other advanced countries with high-earning potential. A similar result is observed for low-income countries, but in this case the modest results are because of the lower volumes of (recorded) outward migrants and their lower earning potential. Nevertheless, given the socio-economic challenges many low-income countries face, the marginal benefit of additional resources that can be mobilised is likely to be large, even if absolute fractions appear relatively small.
Therefore, the migrant investment potential seems most significant for the 31 middle-income countries in the Commonwealth. These countries, which are likely to be phasing out their dependence on concessional flows, are also those actively
11 Primarily because the model excludes children from migrants who have returned to their country of origin and because gaps in the fertility data will have led to the underestimation of diaspora stock results.

Commonwealth Diaspora Investment Potential \ 17
Figure9Commonwealthmigrantinvestmentpotential(asa%ofGNI)
High
Upper
middle
Lower middle
Low
Antigua and Barbuda
Australia
Bahamas, The
Barbados
Brunei Darussalam
Canada
Cyprus
M alta
New Zealand
Seychelles
Singapore
St Kitts and Nevis
Trinidad and Tobago
United Kingdom
Belize
Botsw ana
Dominica
Fiji
Grenada
Guyana
Jamaica
M alaysia
M auritius
Namibia
South Africa
St Lucia
St Vincent and the G..
Tuvalu
Bangladesh
Cameroon
Ghana
India
Kenya
Kiribati
Lesotho
Nigeria
Pakistan
Papua New Guinea
Samoa
Solomon Islands
Sri Lanka
Sw aziland
Tonga
Vanuatu
Zambia
M alaw i
M ozambique
Rw anda
Sierra Leone
Tanzania
Uganda
0 2 4 6 8 10
12
14
16
18
20
22
24
% of GNI
Commonwealth Non Small StateCommonwealth Small State
Source: Authors’ calculations (2017)

18 \ Financing the Sustainable Development Goals with Diaspora Investment
focusing on raising capital from additional sources and for whom targeting diaspora investment could be a desired policy action.
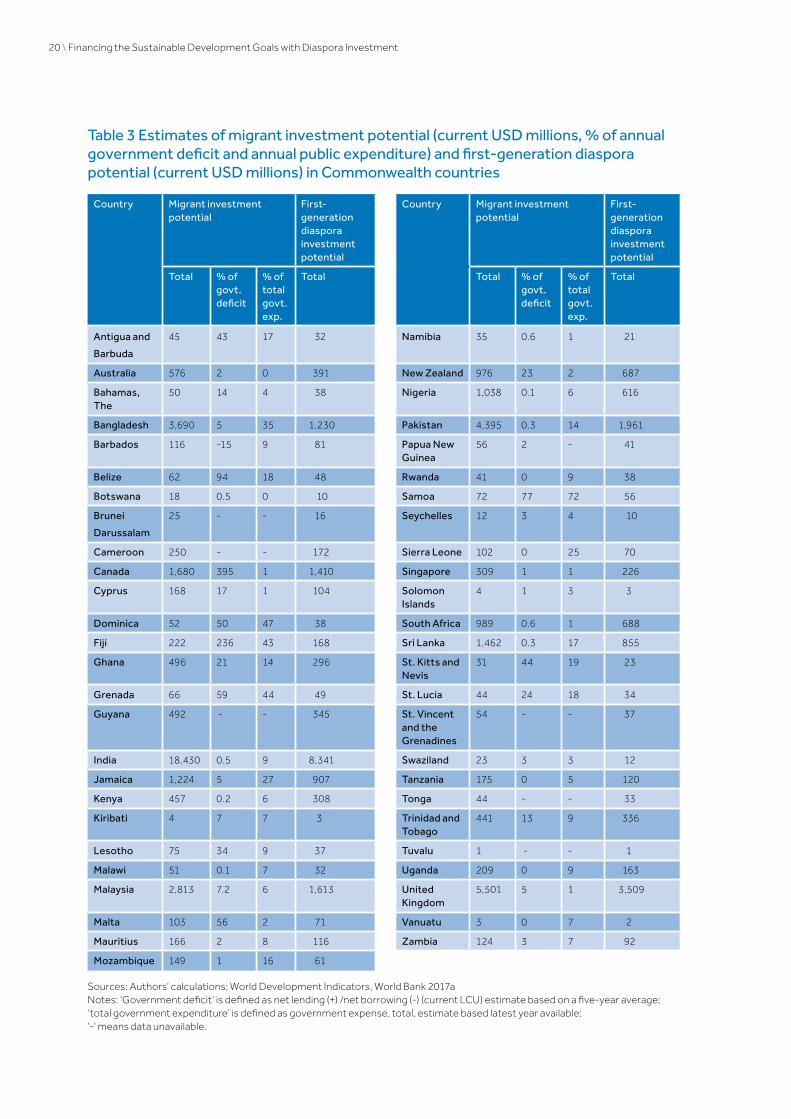
The investment potential that can be leveraged from migrants and first-generation diaspora is considerable for many countries. To make the comparison more meaningful for government officials, in Table 3 we compare the investment potential for migrants to the average annual government deficit and current levels of public expenditure.12 While there may be under-reporting of figures and other data issues associated with the compilation of information on public expenditure, it is clear that the additional financial resource that could be raised from migrants is considerable when compared to the total annual government spending for many countries. For instance, for 15 Commonwealth countries, migrant investment potential for one year is equivalent to more than 10 per cent of annual total government expenditure. Though these 15 countries are predominately small states and results are higher in these countries than for non-small states, the significance of diaspora investment holds even for some of the larger Commonwealth developing countries such as Bangladesh, Ghana, Mozambique, Sierra Leone, Sri Lanka and Pakistan.
Total migrant investment potential is also compared with a five-year average of the government deficit for Commonwealth countries. For 10 countries, investment raised from their migrant communities could close more than 25 per cent of their annual government deficit. As with the comparator to government expenditure, the countries that fair the best according to this measurement are small states. By comparison, for South Asian countries that illustrate the highest diaspora investment potential, such as India, Pakistan and Sri Lanka, their large government deficits mean that less than 1 per cent of this would be covered by additional finance from migrants.
Estimates of the additional investment potential that could be raised from first-generation diasporas are shown in Figure 9, with absolute values presented in Table 3 and annex Table A3. Across the board, estimates of the investment potential of first-generation diaspora are lower than that of migrants. This is primarily because the model
12 These calculations are based on investment potential for migrants only and exclude estimates for first-generation diaspora.
excludes children from migrants who have returned to their country of origin and because gaps in the fertility data will have underestimated the diaspora stock results. Together, this has created a relatively low first-generation diaspora stock from which the investment potential was calculated. Therefore, the baseline model suggests US$25.6 billion could be raised from first-generation diasporas. Our sensitivity analysis suggests that the model is most sensitive to changes in the fertility assumptions. For instance, if we assume both men and women migrants (rather than just women) have children according to the host fertility rates, the first-generation diaspora investment potential rises to US$64.4 billion. Changes to the return migration rates and income adjustment rates have much lower effects on the level of capital that could be raised from diaspora communities, with the income adjustments illustrating the smallest impact.
5.3 Caveats Simplifying assumptions were applied in our migrant and first-generation diaspora models because of the limited availability of reliable data for several factors used. The sensitivity analysis for the first-generation diaspora model, as well as the multiple household savings rates used to calculate both migrant and first-generation savings, illustrate the implications of these assumptions.
One example relates to the assumptions made about household savings rates. It is difficult to accurately quantify the nature of household savings behaviour, especially across multiple different countries, because of the lack of household-level data on consumption and savings decisions. Various studies have also attempted to estimate household-level savings rates, though these remain specific to their country context (Oxford Economics 2014; Chen 2017; Nabar 2011). Even for a similar group of countries, published estimated household savings rates differ widely, therefore it is difficult to determine how much of this is due to real differences in behaviour as opposed to accounting conventions, (i.e. within the OECD), household savings rates are significantly different, ranging from 3.9 per cent in Portugal in 2016 to 16.1 per cent in Sweden (OECD 2017).
Calculating household savings rates for migrant and diaspora communities is further complicated by the fact that they are unlikely to be uniform within countries and are affected by the preferences and

Commonwealth Diaspora Investment Potential \ 19
experiences of the individual migrant/diaspora. A range of empirical and anecdotal studies agree that the propensity to save varies significantly, not only between migrants and natives in a host country, but also between permanent and temporary migrants (De Arcangelis and Joxhe 2015; Bauer and Sinning 2011). For instance, in countries where the stock of migrants is largely temporary, due to factors such as high levels of seasonal migration, savings rates are likely to be higher, as migrants are staying in the host countries primarily as target savers. One would also expect that household savings rates would be different for migrants and their children; however, there is an absence of evidence to confirm this.
Challenges in accurately quantifying household savings have led to differences in estimates of migrant/diaspora savings in the policy literature. For instance, the World Bank model uses an observed uniform rate of 20 per cent, yet our baseline results are based on values in the range of 7.24 per cent to 9.82 per cent. This has considerable effects on the results. For instance, using a household saving rate of 20 per cent results in a diaspora investment potential of US$164.3 billion per annum, as compared to the results in our baseline model, which are US$73.2 billion per annum. Nevertheless, both papers reinforce the overarching premise that considerable additional resources could be channelled to countries in the form of greater diaspora investment.
The simplifying assumptions used in the baseline migrants and first-generation diaspora models tend to be conservative, therefore the results presented in this paper may well underestimate the diaspora investment potential for Commonwealth countries. In particular, this analysis assumes that migrants tend to retain home country savings behaviour, but – as shown above – migrants may well save more than the average citizen in the host country (although we would expect to see different rates for income earners of different levels). Furthermore, the savings rates used for this analysis were much lower than those used in the World Bank model. Second, the analysis is based on formal migration flows; however, for certain Commonwealth countries, this may significantly underestimate the migrant and diaspora pool in countries they could leverage resources from. Further analysis is required to assess which countries are most significantly affected by this, but anecdotal evidence suggests this may explain the low diaspora investment potential results recorded for African countries.
Third, the assumptions applied in the baseline model for the first-generation diaspora investment potential are particularly conservative. For instance, the model assumes only women migrants have children and the fertility rates are those of the host country, which for many countries would tend to be lower than the origin country; that the education levels of migrants’ children are the same as the education levels of their parents; and the income potential for migrants’ children equates to that of their parents rather than that of the native citizens.
It is worth noting that estimating income levels was particularly problematic because of the lack of reliable data on the incomes of migrants and their children, and the education rates of such children. It was for this reason that the income adjustment rates for the baseline migrant model did not deviate from those in the World Bank model, because there is very poor data to accurately assess what migrants’ income should be in different countries. That said, some alternative scenarios were applied to the first-generation diaspora model. Finally, the application of certain data sources – such as the fertility rates – led to the loss of some data points and to reduction of the stock of diaspora workers. Together, these factors could have considerably underestimated diaspora investment potential.
In contrast to these conservative assumptions, the models apply two ambitious assumptions that may offset the underestimation of results due to the conservative assumptions described above. First, the analysis implicitly assumes that the total current level of migrant and diaspora savings could be reallocated to finance investment opportunities in Commonwealth countries. This assumption is applied because providing an accurate estimate of the propensity of migrants and diasporas to invest their money in their homeland is very challenging. There is no standard way to measure the proportion of household savings that is allocated to investments, as some savings estimates include investment activities (such as pensions), while other sources attempt to estimate investments and savings separately (like the European Central Bank).13 In addition, there is no way to accurately measure how much of these investments could or would be invested in their homeland. Second, the model assumes there are no displacement
13 Palenzuela et al 2016. The euro area households’ gross investment rate increased ranged between 8.5 per cent and 11.3 per cent (2007–14), which is slightly higher than the rates used in the baseline model.
20 \ Financing the Sustainable Development Goals with Diaspora Investment
Table3Estimatesofmigrantinvestmentpotential(currentUSDmillions,%ofannualgovernmentdeficitandannualpublicexpenditure)andfirst-generationdiasporapotential(currentUSDmillions)inCommonwealthcountries
Country Migrant investment potential
First-generation diaspora investment potential
Country Migrant investment potential
First-generation diaspora investment potential
Total %ofgovt. deficit
%oftotal govt. exp.
Total Total %ofgovt. deficit
%oftotal govt. exp.
Total
Antigua and
Barbuda
45 43 17 32 Namibia 35 0.6 1 21
Australia 576 2 0 391 NewZealand 976 23 2 687
Bahamas, The
50 14 4 38 Nigeria 1,038 0.1 6 616
Bangladesh 3,690 5 35 1,230 Pakistan 4,395 0.3 14 1,961
Barbados 116 -15 9 81 PapuaNewGuinea
56 2 - 41
Belize 62 94 18 48 Rwanda 41 0 9 38
Botswana 18 0.5 0 10 Samoa 72 77 72 56
Brunei
Darussalam
25 - - 16 Seychelles 12 3 4 10
Cameroon 250 - - 172 Sierra Leone 102 0 25 70
Canada 1,680 395 1 1,410 Singapore 309 1 1 226
Cyprus 168 17 1 104 Solomon Islands
4 1 3 3
Dominica 52 50 47 38 South Africa 989 0.6 1 688
Fiji 222 236 43 168 Sri Lanka 1,462 0.3 17 855
Ghana 496 21 14 296 St. Kitts and Nevis
31 44 19 23
Grenada 66 59 44 49 St. Lucia 44 24 18 34
Guyana 492 - - 345 St. Vincent and the Grenadines
54 - - 37
India 18,430 0.5 9 8,341 Swaziland 23 3 3 12
Jamaica 1,224 5 27 907 Tanzania 175 0 5 120
Kenya 457 0.2 6 308 Tonga 44 - - 33
Kiribati 4 7 7 3 Trinidad and Tobago
441 13 9 336
Lesotho 75 34 9 37 Tuvalu 1 - - 1
Malawi 51 0.1 7 32 Uganda 209 0 9 163
Malaysia 2,813 7.2 6 1,613 UnitedKingdom
5,501 5 1 3,509
Malta 103 56 2 71 Vanuatu 3 0 7 2
Mauritius 166 2 8 116 Zambia 124 3 7 92
Mozambique 149 1 16 61
Sources: Authors’ calculations; World Development Indicators, World Bank 2017aNotes: ‘Government deficit’ is defined as net lending (+) /net borrowing (-) (current LCU) estimate based on a five-year average; ‘total government expenditure’ is defined as government expense, total, estimate based latest year available;‘-‘ means data unavailable.

Commonwealth Diaspora Investment Potential \ 21
effects between remittances and investment, therefore if migrants and diasporas allocate more of their income to investment in their country of origin, they will not do so at the expense of reducing the amount of remittances they transfer. Even though this assumption is supported by some evidence on the use of remittances, it is a strong assumption – particularly (one would expect) for low-income migrants.
To produce more reliable results for diaspora investment potential, better data across a range of socio-economic characteristics of migrants and first-generation diasporas in host countries is required. Diaspora surveys in major destination countries are needed to collect data at the household level on migrants’ and first-generation diasporas’ income and savings profiles, age distribution and workforce participation (De et al. 2014).

22 \ Financing the Sustainable Development Goals with Diaspora Investment
6. Policy Options to Advance Diaspora Investment
This last section examines policy action pursued by some Commonwealth governments to encourage diaspora engagement and finance. It aims to shed light on the types of policy reforms governments may want to consider when trying to attract diaspora investment. It also identifies areas where countries have tended to prioritise their efforts, while identifying areas for improved policy focus going forward.
Government action to encourage diaspora engagement is built on a longstanding appreciation that migrants and diasporas have often been central to facilitating development in their homelands in multiple ways. The most commonly cited include through encouraging trade (Tadesse and White 2011); enhancing productivity through knowledge and skills transfer (Debass and Ardovino 2009); increasing investment and supporting business opportunities; fostering nation building (African Development Bank 2011); financing access to basic services; and smoothing economic downturns and humanitarian crises (Sirkeci et al. 2012).
In terms of diaspora investment, Israel and China are often cited as the most recognised examples of countries that have successfully leveraged the potential of their diaspora communities (or affiliated communities) to finance substantive economic development. Israel’s diaspora engagement and fundraising is longstanding, dating back to at least the 1960s. It was the first country to issue what has commonly become known as a ‘diaspora bond’, which provided the Government of Israel with large capital inflows at a ‘patriotic discount’. Since this time, Israel has issued more diaspora bonds than any other country. Meanwhile, China – instigating its own economic transformation at the end of the last century – has relied heavily on Chinese investors abroad to fuel the substantial manufacturing and infrastructure-driven growth in the country. Between 1979 and 1996, approximately 80 per cent of foreign direct investment (FDI) in China was associated with Chinese investors and businesses abroad (Wei and Balasubramanyam 2006). China’s experience is supported by evidence which shows that migrants often have a positive
impact on investment growth in their country of origin. Analysts suggest this is because diasporas are more likely to invest in their homeland than non-diasporas, because they are privy to a more sophisticated understanding of the governance and business environment. Plus, multinational companies often rely on this local expertise and the personal ties of diasporas when establishing new businesses in countries (Nielson and Riddle 2007; Dolman 2008).
Analysis of the experiences of nine Commonwealth countries14 illustrates that these governments have, in recent years, given more attention to implementing policy action to encourage their diasporas to actively support state development.15 This analysis primarily focused on diaspora investment, but also examined reforms governments had pursued to encourage broader financial and non-financial support from diaspora communities. The four countries that have developed diaspora- or migration-related government-wide policies or strategies have done so in the last five years (with the earliest completed in 2014) and this is illustrative of the more recent attention given to this agenda by some Commonwealth governments. As some frameworks are still in draft form, countries have initiated plans to advance reforms (such as political and residency rights for migrant and diasporas), but they are yet to be realised. The countries that have taken more action recently are middle-income countries – in particular, Kenya, Ghana, Nigeria and Jamaica. This supports our analysis, which suggests these countries potentially have the most to gain from encouraging diaspora investment as they show the largest migrant investment potential.
The same analysis shows that country efforts to encourage active engagement and finance from diaspora communities can be separated into five main institutional and policy areas. The five core areas of action are: 1) institutional engagement with diasporas; 2) extending rights and recognising
14 Australia, Bangladesh, Fiji, Ghana, India, Jamaica, Kenya, Nigeria and the UK.
15 This section draws on Commonwealth Secretariat (2017).

Policy Options to Advance Diaspora Investment \ 23
diasporas’ contributions; 3) establishing an economic enabling environment and financial incentives; 4) promotion of investment initiatives; and 5) initiatives to leverage resources (Figure 9).
Across the five core institutional and policy areas, countries have focused most strongly on enhancing ties to their international diaspora communities by extending political rights and residency status to their diasporas abroad.16 There has also been considerable effort to establish an adequate institutional framework to facilitate diaspora engagement, with all but three countries mandating
16 Apart from Jamaica and Australia, all countries have legislated to establish political rights for their diasporas in four areas: 1) facilitating overseas voting; 2) permitting diasporas to run for public office while they are abroad; 3) providing parliamentary representation; and 4) offering special membership concessions (for example, the waiving of obligatory military service). However, the implementation of these rights varies across countries.
a ministerial-level agency or dedicated government bureau for diaspora affairs, and the same number of countries employing efforts to understand and monitor their diaspora communities abroad (albeit it with varying success). Furthermore, all the government diaspora- or migration-related policies/strategies have incorporated a policy focus on leveraging diaspora finance, focusing on expanding and monitoring remittance flows and measures to attract and facilitate greater levels of diaspora (non-remittance) investment. By initially focusing on the institutional arrangements for engaging diaspora communities and enhancing their rights and recognition, countries are establishing the building blocks for a mutually-beneficial relationship with these communities.
Figure10Countryactiontoattractfinancefrommigrantanddiasporacommunities abroad
DIASPORA ENGAGEMENT
Gov’t level agency or authority
Diaspora strategy
Monitoring diasporas
Extending rights & recognition
Economic Incentives
Leveraging resources
Institutional engagement
Political rights
Residency rights
Official recognition
Information & advice
Business networking
Donations programs
Financial investment products
Knowledge transfer programs
Taxation
Financial services
Special economic rights
Investment promotion
Source: Adapted from Commonwealth Secretariat (2017)

24 \ Financing the Sustainable Development Goals with Diaspora Investment
Traditional forms of investment promotion are also popular, with more than half the countries examined hosting some type of business networking forum targeted at diaspora communities. Indian’s Pravasi Bharatiya Divas (non-resident Indian day) and the Biennial Jamaica Diaspora Conference are the most notable in this regard, with India’s event mobilising 3,000 delegates including foreign dignitaries in 2015 (Government of India 2017; Times of India 2017). The majority of countries in the sample have also set up information and advisory services to help facilitate investment from their diasporas abroad, such as ‘one-stop-shops’, investment promotion agencies and online platforms to share information and market investment opportunities.
Countries have more recently turned their attention to less traditional ways to promote diaspora investment opportunities, such as diaspora-targeted economic incentives. Economic incentives are regularly employed by countries to motivate inward investment, often through the application of special economic rights, such as access to particular property rights or tax incentives. Four of the Commonwealth countries examined have initiated special economic rights for diasporas, related to the purchase of property and preferential tourism packages, while the same number of countries are considering implementing or have already established tax incentives to help leverage investment from their diasporas abroad. Agunias and Newland (2011) provide a useful policy toolkit to illustrate the types of economic incentives governments could employ to foster diaspora investment (ibid). Greater use of traditional economic policy tools to foster investment could be applied by countries to specifically attract diaspora investment.
Of all the core institutional and policy areas, governments have given least attention to establishing a wide range of financial products and initiatives targeted at diaspora communities to leverage diaspora investments and donations/philanthropic support. Even though five of the countries examined – Bangladesh, Ghana, India, Nigeria and Fiji – have established investment products targeted at diaspora communities, and Kenya and Jamaica are considering the development of such products, this attention has almost exclusively focused on types of diaspora bonds, with little attention given to other financial vehicles. Yet, there is a wide range of other financial products that could be employed or encouraged by governments to attract more diaspora investment and Terrazas (2010) provides a useful summary of these. Furthermore, only two countries have initiated government facilities to attract diaspora financial support for humanitarian crises (i.e. the Fiji Prime Minister’s National Disaster Relief and Rehabilitation Fund dedicated to aid Fijians affected by Tropical Cyclone Winston in 2016 and the ‘Kenyans for Kenya’ initiative).17 This suggests much more could be done by governments to establish innovative financial products and programmes to attract investment and donations/philanthropic finance from diaspora communities.
17 Jamaica and Nigeria have outlined their ambitions to set up philanthropy-related initiatives in their diaspora government policy frameworks, but it is unclear if these have been initiated yet.

Conclusion \ 25
7. ConclusionAdvancing economic and social development in Commonwealth countries in line with the ambitions embedded in the SDGs will require a significant scaling up of domestic and external finance.
Over the last two decades, migrants and diaspora communities have emerged as noticeably important development partners for Commonwealth countries, as these individuals are collectively providing substantial financial resources to their countries of origin.
While acknowledging the longstanding practice of migration within the Commonwealth and the important financial role of Commonwealth diasporas today, this paper points to an opportunity for Commonwealth governments to leverage additional diaspora investment from these communities abroad. This paper provides estimates of the diaspora investment potential that could be raised by each Commonwealth country, deriving from both migrants and first-generation diasporas. In doing so, it shows that all Commonwealth countries – from the most advanced to the least developed – face large financial gains from engaging and encouraging their diaspora communities to invest more back home. Some country groupings – such as South Asian Commonwealth countries, middle-income countries and small states – appear to have the largest diaspora investment potential, but all countries could benefit from higher levels of diaspora investment.
The last section of this paper shows that some Commonwealth countries have already made considerable strides to encourage diaspora finance and investment from their diasporas abroad. This policy agenda has received more attention in recent years, as countries are looking to alternative sources of finance to fuel their economic and social advancement. Even though progress has been made in particular policy and institutional areas, it is clear that much more could be done by countries to create a better enabling environment to facilitate diaspora investment. This bourgeoning policy agenda has huge potential for many Commonwealth countries and, if leveraged successfully, could play a crucial role in plugging part of the financing gap for the SDGs.

26 \ Financing the Sustainable Development Goals with Diaspora Investment
References and Bibliography African Development Bank (2011), The Role of the Diaspora in Nation Building: Lessons for Fragile and Post-Conflict Countries in Africa, AfDB, Tunis.
Agunias, DR, and Newland, K (2011), ‘Developing a Road Map for Engaging Diasporas in Development: A handbook for policymakers and practitioners in home and host countries’, Migration Policy Institute (MPI) and International Organisation for Migration (IOM), available at: https://publications.iom.int/system/files/pdf/diaspora_handbook_en_for_web_28may2013.pdf (accessed 19 October 2017).
Bauer, TK, and Sinning, M (2011), ‘The Savings Behavior of Temporary and Permanent Migrants in Germany’, Journal of Population Economics, Vol. 24, Issue 2, 421–449, available at: https://link.springer.com/article/10.1007/s00148-010-0306-z (accessed 29 August 2017).
Benson, JB, Heger, LL, Sorensen, LC and Wise, AE (2016), Somali Diaspora – Investment Survey Report, available at: http://shuraako.org/sites/default/files/SDIS-Survey-Report.pdf (accessed 30 October 2017).
Chen, X (2017), ‘Why Do Migrant Households Consume So Little?’, ADBI Working Paper 727, Asian Development Bank Institute, Tokyo, available at: https://www.adb.org/publications/whydo-migrant-households-consume-so-little (accessed 29 August 2017).
Commonwealth Secretariat (2017), ‘Country Action to Attract Diaspora Finance’, unpublished, Commonwealth Secretariat, London.
De, S, Ratha, D, and Yousefi, SR (2014), ‘A Note on International Migrants’ Savings and Incomes’, available at: http://blogs.worldbank.org/peoplemove/files/Note%20on%20Diaspora%20Savings%20Sep%2023%202014%20Final.pdf (accessed 23 October 2017).
De Arcangelis, G, and Joxhe, M (2015), ‘How do migrants save? Evidence from the British Household Panel Survey on temporary and permanent migrants versus natives’, IZA Journal of Development and Migration, available at: https://doi.org/10.1186/s40176-015-0034-y and https://izajodm.springeropen.com/articles/10.1186/s40176-015-0034-y (accessed 29 August 2017).
Debass, T, and Ardovino, M (2009), USAID DDI: Direct Diaspora Investment – The Untapped Resource for Development, Washington, DC, available at: http://pdf.usaid.gov/pdf_docs/Pnado983.pdf (accessed 30 October 2017).
Developing Markets Associates (2012), Investment Survey: Montserratian Diaspora, London, available at: http://www.gov.ms/wp-content/uploads/2012/06/180912-Montserrat-Investment-Survey-Draft-Report-Final-2.pdf(accessed 30 October 2017).
Dolman, B (2008), Migration, trade and Investment, Productivity Commission, Staff Working Paper, Canberra.
Dumont, J-C and Spielvogel, G (2008), ‘Part III: Return Migration: A New Perspective’, in International Migration Outlook, SOPEMI (2008 edition), Organisation for Economic Co-operation and Development, available at: https://www.oecd.org/migration/mig/43999382.pdf (accessed 23 October 2017).
Gelb, S (2016), ‘Diaspora finance: making investments more productive’ (unpublished), Overseas Development Institute and Commonwealth Secretariat, London.
Government of India, Ministry of External Affairs (2017), Pravasi Bharatiya Divas, available at: http://www.mea.gov.in/pravasi-bharatiya-divas.htm (accessed 19 October 2017).
International Fund for Agricultural Development (2017), Sending Money Home: Contributing to the SDGs, one family at a time, available at: https://www.ifad.org/documents/36783902/4a5640d9-e944-4a8c-8007-a1bc461416e6 (accessed 19 October 2017).
Ketkar, SL, and Ratha, D (2007), Development Finance Via Diaspora Bonds Track Record, World Bank, Washington, DC.
Migration Watch UK (2014), ‘A summary history of immigration to Britain’, available at: https://www.migrationwatchuk.org/Briefingpaper/document/48 (accessed 19 October 2017).

References and Bibliography \ 27
Nabar, M (2011), ‘Targets, Interest Rates, and Household Saving in Urban China’, IMF Working Paper, available at: https://www.imf.org/external/pubs/ft/wp/2011/wp11223.pdf (accessed 29 August 2017).
Neilson, TM, and Riddle, L (2007), ‘Bridging Cultural Distance: A Multi-level Model of Diaspora Homeland Investment’, available at: https://business.gwu.edu/sites/business.gwu.edu/files/downloads/Bridging-Cultural-Distance-A-Multi-level-Model-of-Diaspora-Homeland-Investment-CIBER.pdf (accessed 23 October 2017).
Organisation for Economic Co-operation and Development (2017a), Database on Immigrants in OECD and non-OECD Countries (DIOC-E, 2010/11), available at: http://www.oecd.org/els/mig/dioc.htm (accessed 04 May 2017).
Organisation for Economic Co-operation and Development (2017b), International Migration Database, available at: http://stats.oecd.org/Index.aspx?DataSetCode=MIG (accessed 11 May 2017).
Oxford Economics (2014), ‘Another Penny Saved: The Economic Benefits of Higher US Household Saving’, available at: http://www.oxfordeconomics.com/penny-saved/download (accessed 29 August 2017).
Palenzuela, DR, Dees, S, and the Saving and Investment Task Force (2016), Savings and Investment Behaviour in the Euro Area, Occasional Paper Series, European Central Bank, No 167, available at: https://www.ecb.europa.eu/pub/pdf/scpops/ecbop167.en.pdf (access 30 October 2017).
Ratha, D, and Mohapatra, S (2011), ‘Preliminary Estimates of Diaspora Savings’, Migration and Development Brief 14, available at: http://pubdocs.worldbank.org/en/180201444756851880/MigrationAndDevelopmentBrief14-DiasporaSavings.pdf (accessed 23 October 2017).
Rodriguez-Montemayor, E (2012), ‘Diaspora Direct Investment Policy Options for Development’, IDB Policy Brief, available at: https://publications.iadb.org/bitstream/handle/11319/1444/Diaspora%2520Direct%2520Investment%2520Policy%2520Options%2520for%2520Development.pdf?sequence=1 (accessed 23 October 2017).
Schmidt-Traub, G (2015), ‘Investment Needs to Achieve the Sustainable Development Goals’, Sustainable Development Solutions Network,
available at: http://unsdsn.org/wp-content/uploads/2015/09/151112-SDG-Financing-Needs.pdf (accessed 19 October 2017).
Sirkeci, I, Cohen, JH, and Ratha, D (2012), Migration and Remittances during the Global Financial Crisis and Beyond, World Bank, Washington, DC.
Tadesse, B, and White, R (2011), ‘Emigrant Effects on Trade: Re-examining the Immigrant-trade Link from the Home Country Perspective’, Eastern Economic Journal, 2011, vol. 37, issue 2, 281-302 available at: https://link.springer.com/article/10.1057%2Feej.2010.47 (accessed 30 October 2017).
Terrazas, A (2010), ‘Diaspora Investment in Developing and Emerging Country Capital Markets: Partners and Prospects’, Migration Policy Institute, available at: www.migrationpolicy.org/sites/default/files/publications/diasporas-markets_1023.pdf (accessed 23 October 2017).
The Times of India (2017), ‘Portugal PM is chief guest; 8 CMs to take part’, available at: http://timesofindia.indiatimes.com/city/bengaluru/portugal-pm-is-chief-guest-8-cms-to-take-part/articleshow/56341210.cms (accessed 19 October 2017).
United Nations, Department of Economic and Social Affairs, Population Division (2015), ‘Trends in International Migrant Stock: Migrants by Destination and Origin’, United Nations database, POP/DB/MIG/Stock/Rev.2015, available at: http://www.un.org/en/development/desa/population/migration/data/estimates2/estimates15.shtml (accessed 24 May 2017).
United Nations Statistics Division (2017), ‘National Accounts Statistics: Main Aggregates and Detailed Tables’, available at: https://unstats.un.org/unsd/nationalaccount/madt.asp (accessed 28 April 2017).
US Agency for International Development (USAID) (2014), The US Indian Diaspora: Investment Preferences and Demand for a Fixed-Income Social-Impact Investment, Washington, DC, available at: https://www.chemonics.com/wp-content/uploads/2017/10/US-AMEG-Indian-Diaspora-Investment-Research-Final-Report.pdf (accessed 30 October).
28 \ Financing the Sustainable Development Goals with Diaspora Investment
USAID (2015), Bangladesh Diaspora Assessment – Final Report, Bangladesh Diaspora Assessment Project, Washington, DC, available at: http://pdf.usaid.gov/pdf_docs/PA00KM7B.pdf (accessed 30 October).
Wei, Y, and Balasubramanyam, VN (2006), ‘Diaspora and Development’, The World Economy, Vol. 29, Issue 11, 1599–1609.
World Bank (2010), Sierra Leone Diaspora Investment & Trade Study, Washington, DC, available at: http://documents.worldbank.org/curated/en/833001468189871473/pdf/99768-BRI-PUBLIC-Box393209B-9392-Executive-Summary.pdf (accessed 30 October 2017).
World Bank (2013), Diaspora Investing: The Business and Investment Interests of the Caribbean Diaspora, infoDev, Finance and Private Sector Development Department, Washington, DC, available at http://documents.worldbank.org/curated/en/887081468015022603/pdf/840070WP0Box380esting0december02013.pdf (accessed 30 October 2017).
World Bank (2016), Migration and Remittances Factbook 2016, 3rd edition, World Bank, Washington, DC.
World Bank (2017a), World Development Indicators, available at: http://data.worldbank.org/data-catalog/world-development-indicators (accessed 12 May 2017).
World Bank (2017b), Bilateral Migration Matrix 2013. Migration and Remittances Data, available at: http://www.worldbank.org/en/topic/migrationremittancesdiasporaissues/brief/migration-remittances-data (accessed 28 April 2017).
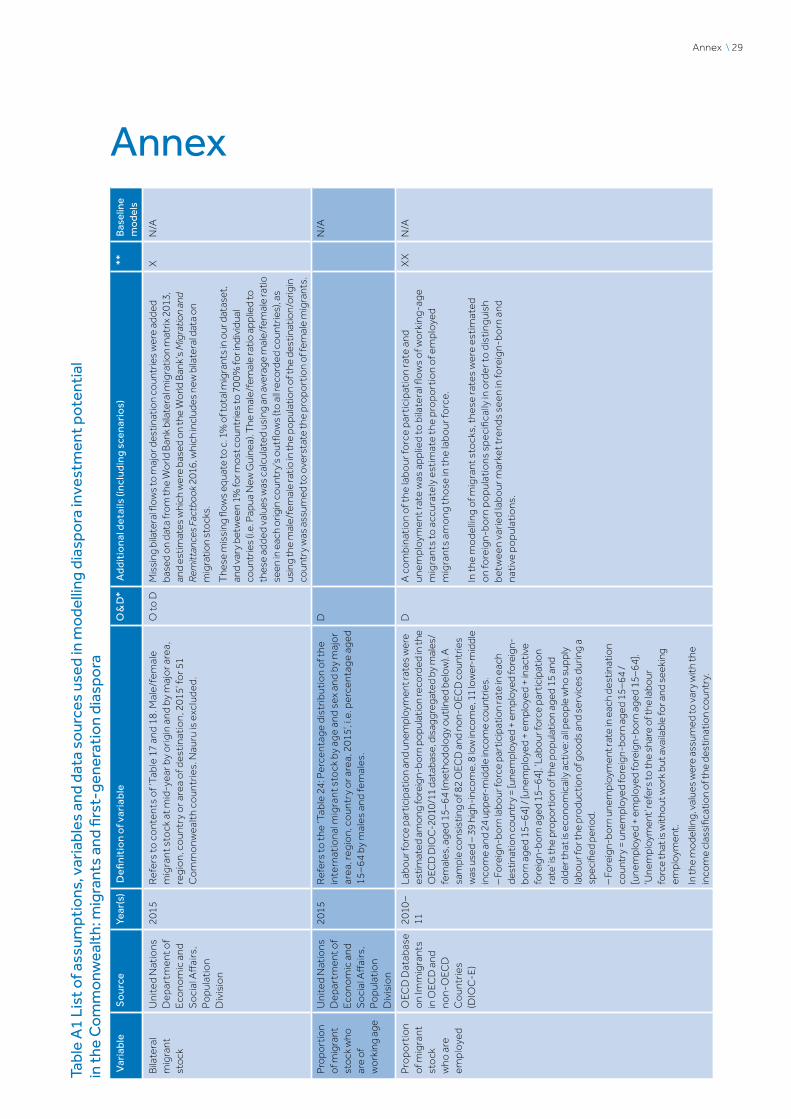
Annex \ 29
Annex
Tabl
e A
1 Li
st o
f ass
umpt
ions
, var
iabl
es a
nd d
ata
sour
ces
used
in m
ode
lling
dia
spo
ra in
vest
men
t pot
enti
al
inth
eCommonw
ealth:migrantsandfirst-generationdiaspo
ra
Var
iabl
eS
our
ce
Year
(s)
Defi
nitionofvariable
O&D*
Ad
diti
ona
l det
ails
(inc
ludi
ng s
cena
rio
s)**
Bas
elin
e m
ode
ls
Bila
tera
l m
igra
nt
sto
ck
Uni
ted
Nat
ions
D
epar
tmen
t of
Eco
nom
ic a
nd
So
cial
Aff
airs
, P
opu
lati
on
Div
isio
n
2015
Ref
ers
to c
ont
ents
of ‘
Tabl
e 17
and
18
. Mal
e/fe
mal
e m
igra
nt s
tock
at m
id-y
ear b
y o
rigi
n an
d by
maj
or a
rea,
re
gio
n, c
oun
try
or a
rea
of d
esti
nati
on,
201
5’ fo
r 51
Co
mm
onw
ealt
h co
untr
ies.
Nau
ru is
exc
lude
d.
O to
DM
issi
ng b
ilate
ral fl
ows
to m
ajo
r des
tinat
ion
coun
trie
s w
ere
adde
d ba
sed
on
data
fro
m th
e W
orld
Ban
k bi
late
ral m
igra
tion
mat
rix 2
013,
an
d es
timat
es w
hich
wer
e ba
sed
on
the
Wo
rld B
ank’
s M
igra
tion
and
Rem
ittan
ces
Fact
book
201
6, w
hich
incl
udes
new
bila
tera
l dat
a o
n m
igra
tion
sto
cks.
The
se m
issi
ng fl
ows
equa
te to
c. 1
% o
f tot
al m
igra
nts
in o
ur d
atas
et,
and
vary
bet
wee
n 1%
for m
ost c
oun
trie
s to
70
0% fo
r ind
ivid
ual
coun
trie
s (i.
e. P
apua
New
Gui
nea)
. The
mal
e/fe
mal
e ra
tio a
pplie
d to
th
ese
adde
d va
lues
was
cal
cula
ted
usin
g an
ave
rage
mal
e/fe
mal
e ra
tio
seen
in e
ach
orig
in c
oun
try’
s o
utflo
ws
(to
all r
eco
rded
co
untr
ies)
, as
usin
g th
e m
ale/
fem
ale
ratio
in th
e po
pula
tion
of th
e de
stin
atio
n/o
rigin
co
untr
y w
as a
ssum
ed to
ove
rsta
te th
e pr
opo
rtio
n of
fem
ale
mig
rant
s.
XN
/A
Pro
port
ion
of m
igra
nt
sto
ck w
ho
are
of
wo
rkin
g ag
e
Uni
ted
Nat
ions
D
epar
tmen
t of
Eco
nom
ic a
nd
So
cial
Aff
airs
, P
opu
lati
on
Div
isio
n
2015
Ref
ers
to th
e ‘T
able
24:
Per
cent
age
dist
ribu
tio
n o
f the
in
tern
atio
nal m
igra
nt s
tock
by
age
and
sex
and
by m
ajo
r ar
ea, r
egio
n, c
oun
try
or a
rea,
201
5’, i
.e. p
erce
ntag
e ag
ed
15–6
4 by
mal
es a
nd fe
mal
es.
D
N
/A
Pro
port
ion
of m
igra
nt
sto
ck
who
are
em
plo
yed
OEC
D D
atab
ase
on
Imm
igra
nts
in O
ECD
and
no
n-O
ECD
C
oun
trie
s (D
IOC
-E)
2010
–11
Labo
ur fo
rce
part
icip
atio
n an
d un
empl
oym
ent r
ates
wer
e es
timat
ed a
mo
ng fo
reig
n-bo
rn p
opu
latio
n re
cord
ed in
the
OEC
D D
IOC
-201
0/11
dat
abas
e, d
isag
greg
ated
by
mal
es/
fem
ales
, age
d 15
–64
(met
hodo
logy
out
lined
bel
ow).
A
sam
ple
cons
istin
g of
82
OEC
D a
nd n
on-
OEC
D c
oun
trie
s w
as u
sed
– 39
hig
h-in
com
e, 8
low
inco
me,
11
low
er-m
iddl
e in
com
e an
d 24
upp
er-m
iddl
e in
com
e co
untr
ies.
–
Fore
ign-
born
labo
ur fo
rce
part
icip
atio
n ra
te in
eac
h de
stin
atio
n co
untr
y =
[une
mpl
oyed
+ e
mpl
oyed
fore
ign-
born
age
d 15
–64]
/ [u
nem
ploy
ed +
em
ploy
ed +
inac
tive
fore
ign-
born
age
d 15
–64]
. ‘La
bour
forc
e pa
rtic
ipat
ion
rate
’ is th
e pr
opo
rtio
n of
the
popu
latio
n ag
ed 1
5 an
d o
lder
that
is e
cono
mic
ally
act
ive:
all p
eopl
e w
ho s
uppl
y la
bour
for t
he p
rodu
ctio
n of
go
ods
and
ser
vice
s du
ring
a sp
ecifi
ed p
erio
d.
– Fo
reig
n-bo
rn u
nem
ploy
men
t rat
e in
eac
h de
stin
atio
n co
untr
y =
unem
ploy
ed fo
reig
n-bo
rn a
ged
15–6
4 /
[une
mpl
oyed
+ e
mpl
oyed
fore
ign-
born
age
d 15
–64]
. ‘U
nem
ploy
men
t’ re
fers
to th
e sh
are
of th
e la
bour
fo
rce
that
is w
itho
ut w
ork
but
ava
ilabl
e fo
r and
see
king
em
ploy
men
t.
In th
e m
ode
lling
, val
ues
wer
e as
sum
ed to
var
y w
ith th
e in
com
e cl
assi
ficat
ion
of th
e de
stin
atio
n co
untr
y.
DA
co
mbi
nati
on
of t
he la
bour
forc
e pa
rtic
ipat
ion
rate
and
un
emp
loym
ent r
ate
was
app
lied
to b
ilate
ral fl
ow
s o
f wo
rkin
g-ag
e m
igra
nts
to a
ccur
atel
y es
tim
ate
the
pro
port
ion
of e
mp
loye
d m
igra
nts
amo
ng th
ose
in th
e la
bour
forc
e.
In th
e m
ode
lling
of m
igra
nt s
tock
s, th
ese
rate
s w
ere
esti
mat
ed
on
fore
ign-
born
po
pula
tio
ns s
peci
fical
ly in
ord
er to
dis
ting
uish
be
twee
n va
ried
labo
ur m
arke
t tre
nds
seen
in fo
reig
n-bo
rn a
nd
nati
ve p
opu
lati
ons
.
XX
N/A

30 \ Financing the Sustainable Development Goals with Diaspora Investment
Var
iabl
eS
our
ce
Year
(s)
Defi
nitionofvariable
O&D*
Ad
diti
ona
l det
ails
(inc
ludi
ng s
cena
rio
s)**
Bas
elin
e m
ode
ls
Educ
atio
n le
vel o
f m
igra
nts
and
esti
mat
ed
first
-ge
nera
tio
n di
aspo
ra
Wo
rld
Ban
k20
11Te
rtia
ry-e
duca
ted
as a
per
cent
age
of t
ota
l em
igra
nts
in O
ECD
co
untr
ies,
201
1.O
Thi
s da
ta w
as u
sed
beca
use
it is
the
mo
st c
om
preh
ensi
ve d
ata
for m
igra
nts’
edu
cati
on
leve
ls. I
t was
use
d fo
r firs
t-ge
nera
tio
n di
aspo
ras
to a
llow
for a
co
nser
vati
ve re
sult
.
N
/A
Adj
ustm
ent
fact
or f
or
high
ly-
skill
ed a
nd
low
-ski
lled
wo
rker
s
Wo
rld
Ban
k–
D
An
adju
stm
ent f
acto
r was
use
d to
sca
le m
igra
nts’
inco
me
rela
tive
to
ave
rage
inco
me
earn
ed b
y an
indi
vidu
al in
the
mig
rant
s’
dest
inat
ion
coun
try
(pro
xied
by
the
GN
I per
cap
ita)
. Thi
s fa
cto
r va
ried
by
two
thin
gs: a
) the
inco
me
clas
sific
atio
n o
f the
des
tina
tio
n co
untr
y an
d b)
the
natu
re o
f the
wo
rk th
e m
igra
nt w
as li
kely
to b
e en
gage
d in
(i.e
. hig
h- o
r lo
w-s
kille
d la
bour
).
In m
ode
lling
the
inco
mes
of m
igra
nts,
the
ori
gina
l val
ues
used
in
Rat
ha a
nd M
oha
patr
a (2
011)
wer
e re
tain
ed.
N
/A
GN
I per
ca
pita
, A
tlas
m
etho
d (c
urre
nt
US
$)
Wo
rld
Ban
k20
11–
15G
NI p
er c
apit
a (f
orm
erly
GN
P p
er c
apit
a) –
gro
ss
nati
ona
l inc
om
e, th
at is
co
nver
ted
to U
S d
olla
rs u
sing
th
e W
orl
d B
ank
Atl
as m
etho
d an
d di
vide
d by
the
mid
-ye
ar p
opu
lati
on.
A fi
ve-y
ear a
vera
ge w
as u
sed.
D
N
/A
Sav
ings
UN
Sta
tist
ics
Div
isio
n,
Syst
em o
f N
atio
nal
Acc
oun
ts
(SN
A)
2005
– 14
Ho
useh
old
sav
ings
rate
s w
ere
esti
mat
ed to
be
the
rati
o
of h
ous
eho
ld s
avin
gs to
ho
useh
old
gro
ss d
ispo
sabl
e in
com
e.
A te
n-ye
ar a
vera
ge w
as c
alcu
late
d, b
ased
on
a sa
mp
le
of 6
0 co
untr
ies
– 29
hig
h-in
com
e, 4
low
-inc
om
e,
14 lo
wer
-mid
dle
inco
me,
13
uppe
r-m
iddl
e in
com
e co
untr
ies.
Val
ues
wer
e as
sum
ed to
var
y by
the
host
or
the
dest
inat
ion
coun
try,
bas
ed o
n th
e av
erag
e fo
r the
in
com
e ca
tego
ry o
f the
co
untr
y. A
ddit
iona
lly, a
sav
ings
ra
te o
f 20
% re
pres
enti
ng a
n o
bser
ved
aver
age
for
deve
lopi
ng c
oun
trie
s in
20
09
(Rat
ha a
nd M
oha
patr
a 20
11) w
as a
lso
use
d in
the
mo
delli
ng.
O &
DLi
mit
ed c
ross
-co
untr
y da
ta o
n ho
useh
old
sav
ings
exi
sts,
so
thre
e sc
enar
ios
wer
e us
ed: i
) ave
rage
sav
ings
rate
of m
igra
nt in
com
es,
vary
ing
by m
igra
nts’
des
tina
tio
n co
untr
y (e
.g. f
or h
igh-
inco
me
coun
trie
s –
8.9
3%; u
pper
-mid
dle
inco
me
coun
trie
s –
7.24
%; l
ow
-m
iddl
e in
com
e co
untr
ies
9.82
%; l
ow
-inc
om
e co
untr
ies
9.67
%);
ii) a
vera
ge s
avin
gs ra
te o
f mig
rant
inco
mes
, var
ying
by
mig
rant
s’
ori
gin
coun
try;
and
iii)
a sa
ving
s ra
te o
f 20
%. I
n th
e ba
selin
e m
ode
l, th
e fir
st s
cena
rio
was
use
d, a
s it
is a
ssum
ed m
igra
nts
wer
e m
ore
lik
ely
to fo
llow
the
savi
ng b
ehav
iour
of t
he h
ost
co
untr
y ra
ther
than
th
e co
untr
y o
f ori
gin.
XX
Mig
rant
m
ode
l &
1G
D
base
line
mo
dels
: av
erag
e sa
ving
s ra
te o
f m
igra
nt
inco
mes
, va
ryin
g by
m
igra
nts’
de
sti-
natio
n co
untr
y
Rat
e o
f re
turn
m
igra
tio
n
Org
anis
atio
n fo
r Eco
nom
ic
Co
-ope
rati
on
and
Dev
elo
pmen
t (O
ECD
)
2010
–14
, 20
08
Diff
eren
t lev
els
of r
etur
n m
igra
tio
n w
ere
esti
mat
ed
usin
g th
e ra
tio
of o
utflo
ws
to in
flow
s o
f fo
reig
n-bo
rn
popu
lati
on
in O
ECD
co
untr
ies.
A fi
ve-y
ear a
vera
ge
was
use
d. In
add
itio
n, a
necd
ota
l dat
a o
f the
est
imat
ed
rang
e o
f the
per
cent
age
of i
mm
igra
nts
who
leav
e w
ithi
n fiv
e ye
ars
afte
r the
ir ar
rival
in O
ECD
co
untr
ies
(i.e.
20
%–5
0%
) was
use
d (D
umo
nt a
nd S
piel
voge
l 20
08)
.
DT
hree
sce
nari
os
wer
e us
ed: i
) ave
rage
leve
ls o
f ret
urn
mig
rati
on
base
d o
n o
utflo
ws
to in
flow
s o
f fo
reig
n-bo
rn p
opu
lati
on
in O
ECD
co
untr
ies
in 2
010
–14
– 39
.33%
; ii)
50%
; and
iii)
20%
. In
the
base
line
mo
del,
the
first
sce
nari
o w
as u
sed
as it
is th
e m
ost
acc
urat
e es
tim
ate
of a
vera
ge re
turn
mig
rati
on.
XX
1GD
ba
selin
e m
ode
l: fiv
e-ye
ar
aver
age
(201
0–1
4)
– 39
.33%

Annex \ 31
Var
iabl
eS
our
ce
Year
(s)
Defi
nitionofvariable
O&D*
Ad
diti
ona
l det
ails
(inc
ludi
ng s
cena
rio
s)**
Bas
elin
e m
ode
ls
Fert
ility
ra
te o
f m
igra
nts
Wo
rld
Ban
k20
11–
15Fe
rtili
ty ra
te, t
ota
l (bi
rths
per
wo
man
): To
tal f
erti
lity
rate
repr
esen
ts th
e nu
mbe
r of c
hild
ren
that
wo
uld
be
born
to a
wo
man
if s
he w
ere
to li
ve to
the
end
of h
er
child
bear
ing
year
s an
d be
ar c
hild
ren
in a
cco
rdan
ce w
ith
age-
spec
ific
fert
ility
rate
s o
f the
spe
cifie
d ye
ar. A
five
-ye
ar a
vera
ge w
as u
sed.
O &
DFe
rtili
ty ra
te w
as u
sed
as a
pro
xy fo
r the
ave
rage
num
ber o
f ch
ildre
n pe
r mig
rant
. Thr
ee s
cena
rio
s w
ere
used
: i) f
erti
lity
rate
o
f wo
men
mig
rant
s in
the
host
co
untr
y; ii
) fer
tilit
y ra
te o
f wo
men
m
igra
nts
in th
e co
untr
y o
f ori
gin;
and
iii)
fert
ility
rate
app
lied
to
wo
men
and
men
mig
rant
s in
the
host
co
untr
y. In
the
base
line
mo
del,
the
first
sce
nari
o w
as u
sed
to a
llow
for a
co
nser
vati
ve re
sult
and
both
the
resu
lts
of t
he lo
wer
- an
d hi
gher
bo
und
– (ii
i) –
are
pres
ente
d in
the
pape
r.
XX
1GD
ba
selin
e m
ode
l: Fe
rtili
ty
rate
per
m
igra
nt
mo
ther
in
the
host
co
untr
y
Pro
port
ion
of
estim
ated
fir
st-
gene
ratio
n di
aspo
ra
who
are
of
wo
rkin
g ag
e
–20
15
DW
e as
sum
ed a
ll fir
st-g
ener
atio
n di
aspo
ra w
ere
of w
ork
ing-
age
, as
the
mo
del l
oo
ks a
head
to w
hen
all t
he c
hild
ren
born
to th
ese
mig
rant
s w
ill b
e o
f wo
rkin
g-ag
e.
XX
N/A
Pro
port
ion
of fi
rst-
gene
rati
on
dias
pora
w
ho a
re
emp
loye
d
Wo
rld
Ban
k20
11–
15T
he la
bour
forc
e pa
rtic
ipat
ion
and
unem
plo
ymen
t rat
es
wer
e ca
lcul
ated
usi
ng th
e va
riabl
es o
utlin
ed b
elo
w:
– U
nem
plo
ymen
t, to
tal (
% o
f to
tal l
abo
ur fo
rce)
(m
ode
lled
Inte
rnat
iona
l Lab
our
Org
aniz
atio
n [IL
O]
esti
mat
e)
– L
abo
ur fo
rce
part
icip
atio
n ra
te, t
ota
l (%
of t
ota
l po
pula
tio
n ag
es 1
5+) (
mo
delle
d IL
O e
stim
ate)
In
the
mo
delli
ng, v
alue
s w
ere
assu
med
to v
ary
wit
h th
e de
stin
atio
n co
untr
y. A
five
-yea
r ave
rage
was
use
d.
DU
nlik
e th
e m
ode
lling
of m
igra
nt s
tock
, firs
t-ge
nera
tio
n di
aspo
ras
wer
e as
sum
ed to
hav
e id
enti
cal c
hara
cter
isti
cs to
the
aver
age
nati
ve b
orn
in th
e de
stin
atio
n co
untr
y o
f the
ir m
igra
nt p
aren
ts.
XX
N/A
Adj
ustm
ent
fact
or f
or
high
-sk
illed
and
lo
w-s
kille
d w
ork
ers
Wo
rld
Ban
k–
D
In th
e m
ode
lling
of th
e in
com
es o
f firs
t-ge
nera
tion
dias
pora
, hig
her
or l
ower
val
ues
of th
ese
adju
stm
ent f
acto
rs w
ere
used
as
part
of
the
scen
ario
-ana
lysi
s. T
he th
ree
scen
ario
s us
ed w
ere:
i) th
e o
rigin
al
valu
es u
sed
in R
atha
and
Mo
hapa
tra;
ii) lo
wer
adj
ustm
ent v
alue
s (i.
e. h
igh-
skille
d m
igra
nts
assu
med
to e
arn
80%
of n
ativ
e in
com
e in
al
l co
untr
ies;
low
-ski
lled
mig
rant
s as
sum
ed to
ear
n 30
% o
f nat
ive
inco
me
in O
ECD
co
untr
ies;
low
-ski
lled
wo
rker
s as
sum
ed to
ear
n 20
%
of n
ativ
e in
com
e in
GC
C; lo
w-s
kille
d m
igra
nts
assu
med
to e
arn
40%
of
nativ
e in
com
e in
all o
ther
co
untr
ies)
; and
iii) h
ighe
r adj
ustm
ent v
alue
s (1
20%
; 30%
; 20%
; and
70%
resp
ectiv
ely)
. In
the
base
line
mo
del, t
he
first
sce
nario
was
use
d be
caus
e th
ese
wer
e th
e m
ediu
m v
alue
s an
d m
ore
relia
ble
data
to e
stim
ate
inco
me
valu
es w
as n
ot a
vaila
ble.
XX
1GD
ba
selin
e m
ode
l: th
e o
rigi-
nal v
alue
s us
ed in
R
atha
and
M
oha
pa-
tra
Not
es: I
nclu
ding
impu
ted
bila
tera
l pai
rs, t
he s
ampl
e co
nsis
ts o
f 5,0
20 o
bser
vatio
ns w
ith 5
1 o
rigin
co
untr
ies
and
179
dest
inat
ion
coun
trie
s. O
n av
erag
e, e
ach
orig
in c
oun
try
is p
aire
d w
ith 4
9 de
stin
atio
n co
untr
ies,
with
the
num
ber o
f bila
tera
l par
tner
s ra
ngin
g fr
om
17
(Tuv
alu)
to 1
26 (U
nite
d K
ingd
om
)*
Val
ue a
sso
ciat
ed w
ith
mig
rant
s’ o
rigi
n o
r des
tina
tio
n co
untr
y, w
here
O is
ori
gin
and
D is
des
tina
tio
n**
Add
ed o
r mo
difie
d da
ta s
our
ce a
nd a
ssum
ptio
ns fr
om
the
mo
del p
ropo
sed
by R
atha
and
Mo
hapa
tra
(201
1), w
here
X m
eans
revi
sed
data
so
urce
and
XX
mea
ns re
vise
d as
sum
ptio
n
Lege
nd:
Var
iabl
es in
mig
rant
sav
ings
mo
del
Add
itio
nal/r
evis
ed v
aria
bles
in th
e fir
st-g
ener
atio
n di
aspo
ra s
avin
gs m
ode
l
Var
iabl
eS
our
ce
Year
(s)
Defi
nitionofvariable
O&D*
Ad
diti
ona
l det
ails
(inc
ludi
ng s
cena
rio
s)**
Bas
elin
e m
ode
ls
Educ
atio
n le
vel o
f m
igra
nts
and
esti
mat
ed
first
-ge
nera
tio
n di
aspo
ra
Wo
rld
Ban
k20
11Te
rtia
ry-e
duca
ted
as a
per
cent
age
of t
ota
l em
igra
nts
in O
ECD
co
untr
ies,
201
1.O
Thi
s da
ta w
as u
sed
beca
use
it is
the
mo
st c
om
preh
ensi
ve d
ata
for m
igra
nts’
edu
cati
on
leve
ls. I
t was
use
d fo
r firs
t-ge
nera
tio
n di
aspo
ras
to a
llow
for a
co
nser
vati
ve re
sult
.
N
/A
Adj
ustm
ent
fact
or f
or
high
ly-
skill
ed a
nd
low
-ski
lled
wo
rker
s
Wo
rld
Ban
k–
D
An
adju
stm
ent f
acto
r was
use
d to
sca
le m
igra
nts’
inco
me
rela
tive
to
ave
rage
inco
me
earn
ed b
y an
indi
vidu
al in
the
mig
rant
s’
dest
inat
ion
coun
try
(pro
xied
by
the
GN
I per
cap
ita)
. Thi
s fa
cto
r va
ried
by
two
thin
gs: a
) the
inco
me
clas
sific
atio
n o
f the
des
tina
tio
n co
untr
y an
d b)
the
natu
re o
f the
wo
rk th
e m
igra
nt w
as li
kely
to b
e en
gage
d in
(i.e
. hig
h- o
r lo
w-s
kille
d la
bour
).
In m
ode
lling
the
inco
mes
of m
igra
nts,
the
ori
gina
l val
ues
used
in
Rat
ha a
nd M
oha
patr
a (2
011)
wer
e re
tain
ed.
N
/A
GN
I per
ca
pita
, A
tlas
m
etho
d (c
urre
nt
US
$)
Wo
rld
Ban
k20
11–
15G
NI p
er c
apit
a (f
orm
erly
GN
P p
er c
apit
a) –
gro
ss
nati
ona
l inc
om
e, th
at is
co
nver
ted
to U
S d
olla
rs u
sing
th
e W
orl
d B
ank
Atl
as m
etho
d an
d di
vide
d by
the
mid
-ye
ar p
opu
lati
on.
A fi
ve-y
ear a
vera
ge w
as u
sed.
D
N
/A
Sav
ings
UN
Sta
tist
ics
Div
isio
n,
Syst
em o
f N
atio
nal
Acc
oun
ts
(SN
A)
2005
– 14
Ho
useh
old
sav
ings
rate
s w
ere
esti
mat
ed to
be
the
rati
o
of h
ous
eho
ld s
avin
gs to
ho
useh
old
gro
ss d
ispo
sabl
e in
com
e.
A te
n-ye
ar a
vera
ge w
as c
alcu
late
d, b
ased
on
a sa
mp
le
of 6
0 co
untr
ies
– 29
hig
h-in
com
e, 4
low
-inc
om
e,
14 lo
wer
-mid
dle
inco
me,
13
uppe
r-m
iddl
e in
com
e co
untr
ies.
Val
ues
wer
e as
sum
ed to
var
y by
the
host
or
the
dest
inat
ion
coun
try,
bas
ed o
n th
e av
erag
e fo
r the
in
com
e ca
tego
ry o
f the
co
untr
y. A
ddit
iona
lly, a
sav
ings
ra
te o
f 20
% re
pres
enti
ng a
n o
bser
ved
aver
age
for
deve
lopi
ng c
oun
trie
s in
20
09
(Rat
ha a
nd M
oha
patr
a 20
11) w
as a
lso
use
d in
the
mo
delli
ng.
O &
DLi
mit
ed c
ross
-co
untr
y da
ta o
n ho
useh
old
sav
ings
exi
sts,
so
thre
e sc
enar
ios
wer
e us
ed: i
) ave
rage
sav
ings
rate
of m
igra
nt in
com
es,
vary
ing
by m
igra
nts’
des
tina
tio
n co
untr
y (e
.g. f
or h
igh-
inco
me
coun
trie
s –
8.9
3%; u
pper
-mid
dle
inco
me
coun
trie
s –
7.24
%; l
ow
-m
iddl
e in
com
e co
untr
ies
9.82
%; l
ow
-inc
om
e co
untr
ies
9.67
%);
ii) a
vera
ge s
avin
gs ra
te o
f mig
rant
inco
mes
, var
ying
by
mig
rant
s’
ori
gin
coun
try;
and
iii)
a sa
ving
s ra
te o
f 20
%. I
n th
e ba
selin
e m
ode
l, th
e fir
st s
cena
rio
was
use
d, a
s it
is a
ssum
ed m
igra
nts
wer
e m
ore
lik
ely
to fo
llow
the
savi
ng b
ehav
iour
of t
he h
ost
co
untr
y ra
ther
than
th
e co
untr
y o
f ori
gin.
XX
Mig
rant
m
ode
l &
1G
D
base
line
mo
dels
: av
erag
e sa
ving
s ra
te o
f m
igra
nt
inco
mes
, va
ryin
g by
m
igra
nts’
de
sti-
natio
n co
untr
y
Rat
e o
f re
turn
m
igra
tio
n
Org
anis
atio
n fo
r Eco
nom
ic
Co
-ope
rati
on
and
Dev
elo
pmen
t (O
ECD
)
2010
–14
, 20
08
Diff
eren
t lev
els
of r
etur
n m
igra
tio
n w
ere
esti
mat
ed
usin
g th
e ra
tio
of o
utflo
ws
to in
flow
s o
f fo
reig
n-bo
rn
popu
lati
on
in O
ECD
co
untr
ies.
A fi
ve-y
ear a
vera
ge
was
use
d. In
add
itio
n, a
necd
ota
l dat
a o
f the
est
imat
ed
rang
e o
f the
per
cent
age
of i
mm
igra
nts
who
leav
e w
ithi
n fiv
e ye
ars
afte
r the
ir ar
rival
in O
ECD
co
untr
ies
(i.e.
20
%–5
0%
) was
use
d (D
umo
nt a
nd S
piel
voge
l 20
08)
.
DT
hree
sce
nari
os
wer
e us
ed: i
) ave
rage
leve
ls o
f ret
urn
mig
rati
on
base
d o
n o
utflo
ws
to in
flow
s o
f fo
reig
n-bo
rn p
opu
lati
on
in O
ECD
co
untr
ies
in 2
010
–14
– 39
.33%
; ii)
50%
; and
iii)
20%
. In
the
base
line
mo
del,
the
first
sce
nari
o w
as u
sed
as it
is th
e m
ost
acc
urat
e es
tim
ate
of a
vera
ge re
turn
mig
rati
on.
XX
1GD
ba
selin
e m
ode
l: fiv
e-ye
ar
aver
age
(201
0–1
4)
– 39
.33%
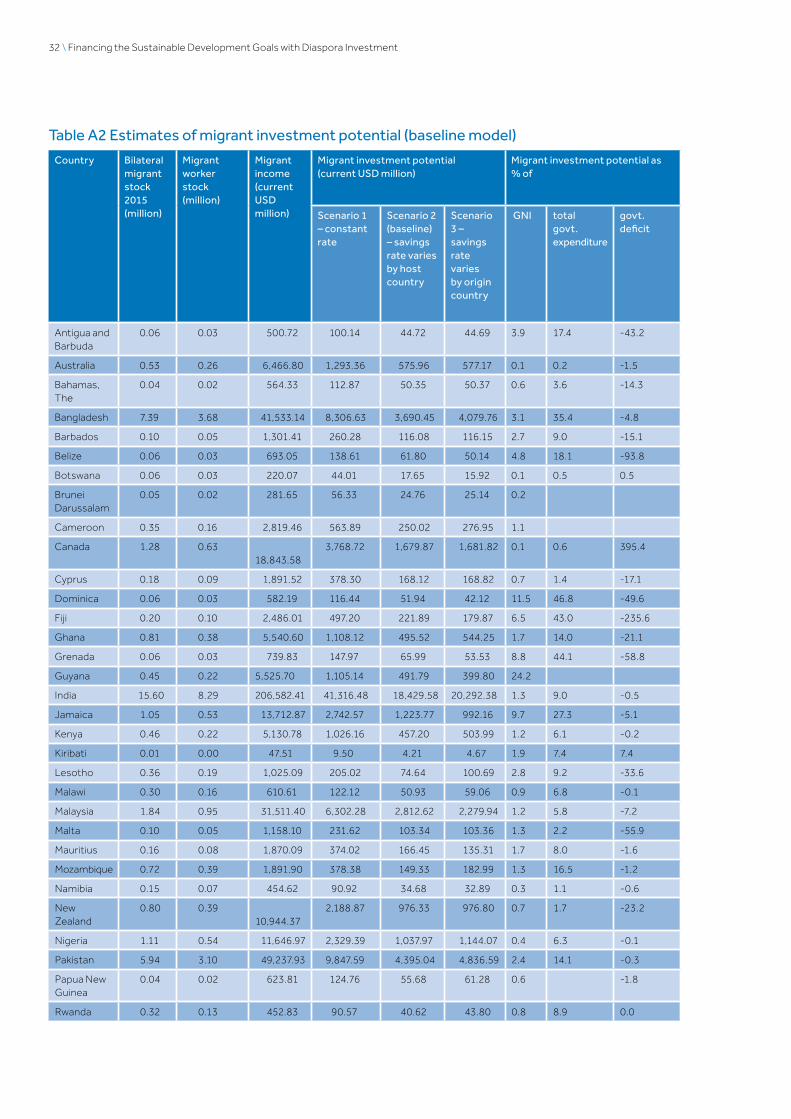
32 \ Financing the Sustainable Development Goals with Diaspora Investment
Table A2 Estimates of migrant investment potential (baseline model)
Country Bilateral migrant stock 2015 (million)
Migrant worker stock (million)
Migrant income (current USDmillion)
Migrant investment potential (currentUSDmillion)
Migrant investment potential as %of
Scenario 1 –constantrate
Scenario 2 (baseline) –savingsrate varies by host country
Scenario 3–savings rate varies by origin country
GNI total govt. expenditure
govt. deficit
Antigua and Barbuda
0.06 0.03 500.72 100.14 44.72 44.69 3.9 17.4 -43.2
Australia 0.53 0.26 6,466.80 1,293.36 575.96 577.17 0.1 0.2 -1.5
Bahamas, The
0.04 0.02 564.33 112.87 50.35 50.37 0.6 3.6 -14.3
Bangladesh 7.39 3.68 41,533.14 8,306.63 3,690.45 4,079.76 3.1 35.4 -4.8
Barbados 0.10 0.05 1,301.41 260.28 116.08 116.15 2.7 9.0 -15.1
Belize 0.06 0.03 693.05 138.61 61.80 50.14 4.8 18.1 -93.8
Botswana 0.06 0.03 220.07 44.01 17.65 15.92 0.1 0.5 0.5
Brunei Darussalam
0.05 0.02 281.65 56.33 24.76 25.14 0.2
Cameroon 0.35 0.16 2,819.46 563.89 250.02 276.95 1.1
Canada 1.28 0.63 18,843.58
3,768.72 1,679.87 1,681.82 0.1 0.6 395.4
Cyprus 0.18 0.09 1,891.52 378.30 168.12 168.82 0.7 1.4 -17.1
Dominica 0.06 0.03 582.19 116.44 51.94 42.12 11.5 46.8 -49.6
Fiji 0.20 0.10 2,486.01 497.20 221.89 179.87 6.5 43.0 -235.6
Ghana 0.81 0.38 5,540.60 1,108.12 495.52 544.25 1.7 14.0 -21.1
Grenada 0.06 0.03 739.83 147.97 65.99 53.53 8.8 44.1 -58.8
Guyana 0.45 0.22 5,525.70 1,105.14 491.79 399.80 24.2
India 15.60 8.29 206,582.41 41,316.48 18,429.58 20,292.38 1.3 9.0 -0.5
Jamaica 1.05 0.53 13,712.87 2,742.57 1,223.77 992.16 9.7 27.3 -5.1
Kenya 0.46 0.22 5,130.78 1,026.16 457.20 503.99 1.2 6.1 -0.2
Kiribati 0.01 0.00 47.51 9.50 4.21 4.67 1.9 7.4 7.4
Lesotho 0.36 0.19 1,025.09 205.02 74.64 100.69 2.8 9.2 -33.6
Malawi 0.30 0.16 610.61 122.12 50.93 59.06 0.9 6.8 -0.1
Malaysia 1.84 0.95 31,511.40 6,302.28 2,812.62 2,279.94 1.2 5.8 -7.2
Malta 0.10 0.05 1,158.10 231.62 103.34 103.36 1.3 2.2 -55.9
Mauritius 0.16 0.08 1,870.09 374.02 166.45 135.31 1.7 8.0 -1.6
Mozambique 0.72 0.39 1,891.90 378.38 149.33 182.99 1.3 16.5 -1.2
Namibia 0.15 0.07 454.62 90.92 34.68 32.89 0.3 1.1 -0.6
New Zealand
0.80 0.39 10,944.37
2,188.87 976.33 976.80 0.7 1.7 -23.2
Nigeria 1.11 0.54 11,646.97 2,329.39 1,037.97 1,144.07 0.4 6.3 -0.1
Pakistan 5.94 3.10 49,237.93 9,847.59 4,395.04 4,836.59 2.4 14.1 -0.3
Papua New Guinea
0.04 0.02 623.81 124.76 55.68 61.28 0.6 -1.8
Rwanda 0.32 0.13 452.83 90.57 40.62 43.80 0.8 8.9 0.0
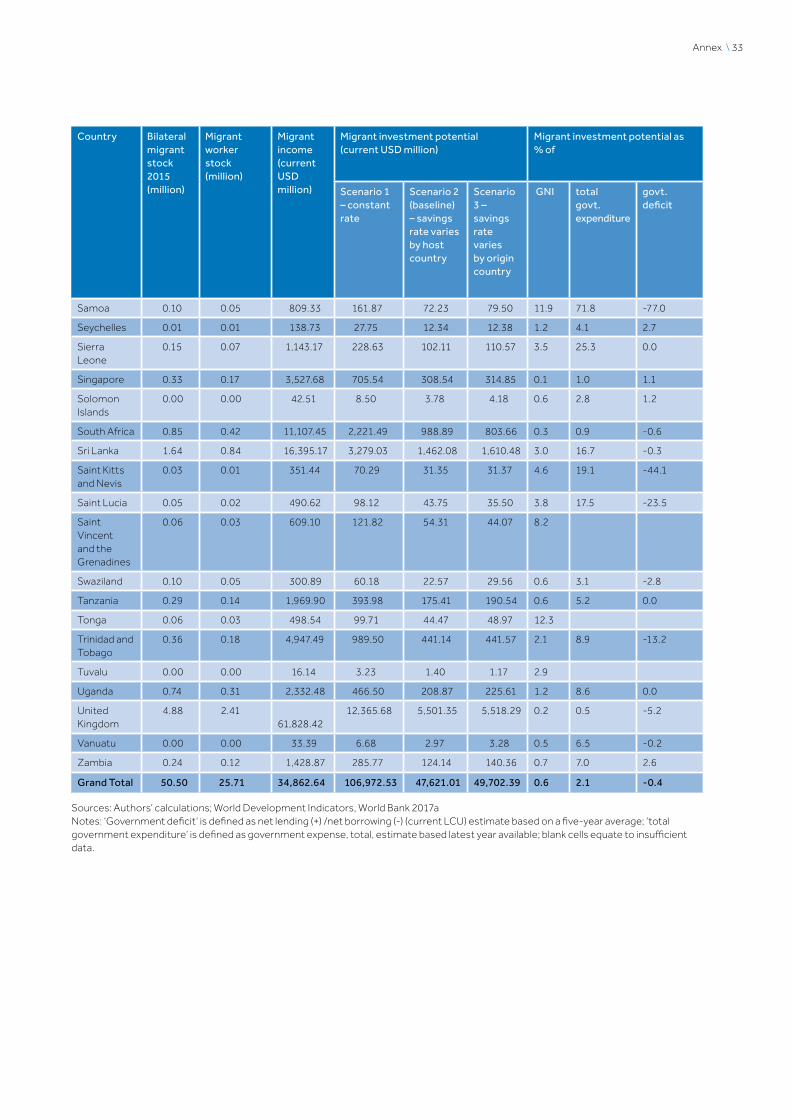
Annex \ 33
Country Bilateral migrant stock 2015 (million)
Migrant worker stock (million)
Migrant income (current USDmillion)
Migrant investment potential (currentUSDmillion)
Migrant investment potential as %of
Scenario 1 –constantrate
Scenario 2 (baseline) –savingsrate varies by host country
Scenario 3–savings rate varies by origin country
GNI total govt. expenditure
govt. deficit
Samoa 0.10 0.05 809.33 161.87 72.23 79.50 11.9 71.8 -77.0
Seychelles 0.01 0.01 138.73 27.75 12.34 12.38 1.2 4.1 2.7
Sierra Leone
0.15 0.07 1,143.17 228.63 102.11 110.57 3.5 25.3 0.0
Singapore 0.33 0.17 3,527.68 705.54 308.54 314.85 0.1 1.0 1.1
Solomon Islands
0.00 0.00 42.51 8.50 3.78 4.18 0.6 2.8 1.2
South Africa 0.85 0.42 11,107.45 2,221.49 988.89 803.66 0.3 0.9 -0.6
Sri Lanka 1.64 0.84 16,395.17 3,279.03 1,462.08 1,610.48 3.0 16.7 -0.3
Saint Kitts and Nevis
0.03 0.01 351.44 70.29 31.35 31.37 4.6 19.1 -44.1
Saint Lucia 0.05 0.02 490.62 98.12 43.75 35.50 3.8 17.5 -23.5
Saint Vincent and the Grenadines
0.06 0.03 609.10 121.82 54.31 44.07 8.2
Swaziland 0.10 0.05 300.89 60.18 22.57 29.56 0.6 3.1 -2.8
Tanzania 0.29 0.14 1,969.90 393.98 175.41 190.54 0.6 5.2 0.0
Tonga 0.06 0.03 498.54 99.71 44.47 48.97 12.3
Trinidad and Tobago
0.36 0.18 4,947.49 989.50 441.14 441.57 2.1 8.9 -13.2
Tuvalu 0.00 0.00 16.14 3.23 1.40 1.17 2.9
Uganda 0.74 0.31 2,332.48 466.50 208.87 225.61 1.2 8.6 0.0
United Kingdom
4.88 2.41 61,828.42
12,365.68 5,501.35 5,518.29 0.2 0.5 -5.2
Vanuatu 0.00 0.00 33.39 6.68 2.97 3.28 0.5 6.5 -0.2
Zambia 0.24 0.12 1,428.87 285.77 124.14 140.36 0.7 7.0 2.6
Grand Total 50.50 25.71 34,862.64 106,972.53 47,621.01 49,702.39 0.6 2.1 -0.4
Sources: Authors’ calculations; World Development Indicators, World Bank 2017aNotes: ‘Government deficit’ is defined as net lending (+) /net borrowing (-) (current LCU) estimate based on a five-year average; ‘total government expenditure’ is defined as government expense, total, estimate based latest year available; blank cells equate to insufficient data.

34 \ Financing the Sustainable Development Goals with Diaspora Investment
TableA3Estimatesoffirst-generationdiasporainvestmentpotential(baselinemodel)
Country Bilateral migrant stock 2015 (million)
First-generation diaspora worker stock (million)
First-generation diaspora income (current USDmillion)
First-generation investment diaspora potential(currentUSDmillion)
First-generation diaspora investmentpotentialasa%of
Scenario 1 –constantrate
Scenario 2 (baseline)–savings rate varies by host country
Scenario 3–savings rate varies by origin country
GNI total govt. expenditure
govt.deficit
Antigua and Barbuda
0.06 0.02 356.83 71.37 31.84 31.85 2.8 12.4 -30.8
Australia 0.53 0.18 4,385.81 877.16 390.79 391.44 0.0 0.1 -1.0
Bahamas, The
0.04 0.02 430.50 86.10 38.40 38.42 0.5 2.7 -10.9
Bangladesh 7.39 2.00 13,818.54
2,763.71 1,230.35 1,357.38 1.0 11.8 -1.6
Barbados 0.10 0.03 908.67 181.73 81.05 81.10 1.9 6.3 -10.6
Belize 0.06 0.02 541.14 108.23 48.20 39.15 3.7 14.1 -73.2
Botswana 0.06 0.02 115.19 23.04 9.55 8.33 0.1 0.3 0.3
Brunei Darussalam
0.05 0.01 181.19 36.24 16.01 16.17 0.1
Cameroon 0.35 0.19 1,938.09 387.62 171.90 190.38 0.7
Canada 1.28 0.52 15,815.43
3,163.09 1,410.06 1,411.55 0.1 0.5 331.9
Cyprus 0.18 0.05 1,170.66 234.13 104.01 104.48 0.4 0.9 -10.6
Dominica 0.06 0.02 424.20 84.84 37.84 30.69 8.4 34.1 -36.1
Fiji 0.20 0.08 1,877.83 375.57 167.61 135.87 4.9 32.5 -178
Ghana 0.81 0.51 3,277.12 655.42 295.94 321.91 1.0 8.3 -12.6
Grenada 0.06 0.02 552.15 110.43 49.24 39.95 6.6 32.9 -43.9
Guyana 0.45 0.16 3,872.69 774.54 344.50 280.20 17.0
India 15.60 4.62 93,416.69 18,683.34 8,341.05 9,176.23 0.6 4.1 -0.2
Jamaica 1.05 0.39 10,159.12 2,031.82 906.62 735.04 7.2 20.3 -3.8
Kenya 0.46 0.24 3,445.97 689.19 307.48 338.49 0.8 4.1 -0.1
Kiribati 0.01 0.00 34.19 6.84 3.04 3.36 1.4 5.4 5.3
Lesotho 0.36 0.10 504.45 100.89 36.91 49.55 1.4 4.5 -16.6
Malawi 0.30 0.20 359.33 71.87 31.92 34.76 0.6 4.3 0.0
Malaysia 1.84 0.51 18,075.18 3,615.04 1,613.20 1,307.79 0.7 3.3 -4.1
Malta 0.10 0.03 793.42 158.68 70.80 70.81 0.9 1.5 -38.3
Mauritius 0.16 0.05 1,306.24 261.25 116.32 94.51 1.2 5.6 -1.1
Mozambique 0.72 0.26 749.62 149.92 61.33 72.51 0.5 6.8 -0.5
Namibia 0.15 0.05 275.36 55.07 21.23 19.92 0.2 0.7 -0.4
New Zealand
0.80 0.27 7,703.53 1,540.71 687.28 687.55 0.5 1.2 -16.3
Nigeria 1.11 0.52 6,884.79 1,376.96 615.58 676.29 0.2 3.7 -0.1
Pakistan 5.94 1.72 21,933.78 4,386.76 1,960.65 2,154.53 1.1 6.3 -0.1
Papua New Guinea
0.04 0.01 461.67 92.33 41.21 45.35 0.4 -1.4

Annex \ 35
Country Bilateral migrant stock 2015 (million)
First-generation diaspora worker stock (million)
First-generation diaspora income (current USDmillion)
First-generation investment diaspora potential(currentUSDmillion)
First-generation diaspora investmentpotentialasa%of
Scenario 1 –constantrate
Scenario 2 (baseline)–savings rate varies by host country
Scenario 3–savings rate varies by origin country
GNI total govt. expenditure
govt.deficit
Rwanda 0.32 0.39 417.74 83.55 38.22 40.41 0.7 8.4 0.0
Samoa 0.10 0.04 622.03 124.41 55.52 61.10 9.2 55.2 -59.1
Seychelles 0.01 0.01 108.93 21.79 9.69 9.72 0.9 3.2 2.1
Sierra Leone
0.15 0.09 781.58 156.32 69.98 75.60 2.4 17.3 0.0
Singapore 0.33 0.11 2,573.58 514.72 226.08 229.70 0.1 0.8 0.8
Solomon Islands
0.00 0.00 33.89 6.78 3.01 3.33 0.5 2.2 1
South Africa 0.85 0.33 7,731.98 1,546.40 688.04 559.43 0.2 0.7 -0.4
Sri Lanka 1.64 0.51 9,587.50 1,917.50 854.96 941.77 1.8 9.8 -0.2
Saint Kitts and Nevis
0.03 0.01 257.51 51.50 22.97 22.98 3.4 14.0 -32.3
Saint Lucia 0.05 0.02 375.26 75.05 33.47 27.15 2.9 13.4 -18
Saint Vincent and the Grenadines
0.06 0.02 419.22 83.84 37.39 30.33 5.7
Swaziland 0.10 0.02 151.71 30.34 11.53 14.90 0.3 1.6 -1.4
Tanzania 0.29 0.23 1,334.99 267.00 119.50 129.13 0.4 3.5 0.0
Tonga 0.06 0.02 369.10 73.82 32.92 36.26 9.1
Trinidad and Tobago
0.36 0.14 3,772.39 754.48 336.38 336.69 1.6 6.8 -10.1
Tuvalu 0.00 0.00 12.17 2.43 1.05 0.88 2.2
Uganda 0.74 0.44 1,795.35 359.07 162.46 173.65 1.0 6.7 0.0
United Kingdom
4.88 1.53 39,425.34
7,885.07 3,508.70 3,518.78 0.1 0.3 -3.3
Vanuatu 0.00 0.00 26.52 5.30 2.36 2.60 0.4 5.2 -0.1
Zambia 0.24 0.16 1,053.54 210.71 92.06 103.49 0.5 5.2 2
Grand Total 50.50 16.88 286,619.70 57,323.94 25,548.25 26,263.47 0.3 7.8 -0.2
Sources: Authors’ calculations; World Development Indicators, World Bank 2017aNotes: ‘Government deficit’ is defined as net lending (+) /net borrowing (-) (current LCU) estimate based on a five-year average; ‘total government expenditure’ is defined as government expense, total, estimate based latest year available; blank cells equate to insufficient data.


Commonwealth Secretariat
Marlborough House, Pall Mall
London SW1Y 5HX
United Kingdom
thecommonwealth.org
P15
590