Embed Size (px)
Citation preview

Financing secondary educationin developing countries:
Strategies for sustainable growth
Keith Lewin and Françoise Caillods
A paper copy of this publication may be obtained on request from:[email protected]
To consult the full catalogue of IIEP Publications and documents on ourWeb site: http://www.unesco.org/iiep
Co-operation Agency (Sida) has provided financial assistance for the publication of
this bookle
Published by:International Institute for Educational Planning/UNESCO
7 - 9 rue Eugène-Delacroix, 75116 Paris
ISBN: 92-803-1199-9
© UNESCO 2001
International Institute for Educational Planning

International Institute for Educational Planning http://www.unesco.org/iiep
Financing secondary education in developing countries:strategies for sustainable growth

International Institute for Educational Planning http://www.unesco.org/iiep
Financing secondary education in developing countries

International Institute for Educational Planning http://www.unesco.org/iiep
UNESCO Publishing
International Institute for Educational Planning
Financing secondary educationin developing countries:strategies for sustainable
growth
byKeith Lewin
Françoise Caillods

International Institute for Educational Planning http://www.unesco.org/iiep
The designations employed and the presentation of material throughout thisreview do not imply the expression of any opinion whatsoever on the part ofUNESCO or IIEP concerning the legal status of any country, territory, city orarea or its authorities, or concerning its frontiers or boundaries.
The IIEP is financed by UNESCO and by voluntary contributions fromMember States. In recent years the following Member States have providedvoluntary contributions to the Institute: Denmark, Germany, Iceland, India,Ireland, Norway, Sweden, Switzerland.
Published by theUnited Nations Educational, Scientific and Cultural Organization,7 place de Fontenoy, F 75352 Paris 07 SP, FrancePrinted in France by SAGIM
Cover design by Corinne HayworthComposition by Linéale ProductionISBN 92-803-1199-9© UNESCO 2001 IIEP
Financing secondary education in developing countries

International Institute for Educational Planning http://www.unesco.org/iiep
The focus on achieving Education for All after the World EducationForum in Jomtien (1990) has meant a singular emphasis on increasingenrolment in primary schools for many agencies and developingcountries. Secondary education has been quietly neglected, squeezed asit is between primary education, the object of so much attention, andhigher education, which has never really lost its supporters. Yet what tooffer to young children graduating from primary school is a growingmatter of concern. As the policies designed to ensure participation of allschool-age children in primary education start bearing fruit, and as alarger proportion of children complete primary education, strongpressure will be felt at the higher levels of the education system. How tofinance secondary education expansion, how to organize it, and what toteach at that level will be burning issues in the years to come.
Secondary education is indeed a crucial stage for the educationsystem. This is where most primary-school teachers are trained; it is alsowhere the future students of higher education are selected and taughtessential foundation skills. Students enter secondary school as childrenand leave it as young adults. What they experience there will influencethe course of the rest of their lives. It is the level at which youngstersconsolidate their basic knowledge gained in primary school, but alsowhere they acquire the common culture that will allow them to be usefulcitizens in a peaceful society, where they build knowledge throughexperience and experiments, where essential subjects such as science,health education and technology are first taught in a formal way. Finally,this is where youngsters learn how to think, how to be, how to work, andhow to co-operate with others.
In the framework of its sixth Medium-Term Plan 1996-2001, theInstitute launched a project on secondary education policies and strategies.This followed an earlier project on planning science education provision,which had brought to the fore several issues directly related to secondaryeducation. In this new project an essential concern was to estimate the
v
Preface

International Institute for Educational Planning http://www.unesco.org/iiep
financial consequences of enrolment expansion at primary level forsecondary schools. The results of this investigation are the subject of thispublication. The book discusses first the rationale for expandingparticipation in secondary education, linking this to the need to remaincompetitive in a globalized world. It then explores the characteristics ofsecondary schooling in developing countries using the extensiveUNESCO database. It develops a series of simulations to estimate whatthe costs of secondary education expansion are likely to be for differentgroups of countries. This global analysis is enriched by a number ofdetailed case studies which illustrate secondary school financing issues ina wide range of countries in Africa, Asia and Latin America.
The analysis shows that several developing countries will faceacute problems in financing their secondary education expansion ifpresent conditions and cost structures continue to prevail. Severaloptions are discussed which include expanding the share of governmentresources allocated to secondary education, reducing unit costs,increasing internal efficiency and developing cost-sharing mechanisms.This book has two main thrusts: first it argues convincingly in favour ofthe need to expand secondary education, within an Education for Allperspective, in order to respond to rising demand for places, to increasethe numbers in the labour force with more than basic education, and toimprove the supply of those who may become teachers; second, itdevelops several options for financing the development of secondaryeducation, building on the past experience of contrasted countries. Itshould interest a wide audience, from development partners toeducational planners in different countries concerned with the ways andmeans to develop their education systems.
This book represents an intermediate stage in the IIEP concerns forsecondary education. Several issues have emerged from this research whichwill have to be investigated in the future: these include relevance and quality– it is not just a question of expanding access to secondary education, butalso of quality of learning; the need to develop access at affordable costwhich may imply the use of alternative delivery systems; and the importanceof ensuring that more equity accompanies greater access.
I would like to take this opportunity to express my gratitude to theDepartment for International Development of the United Kingdom(DFID) for the financial support given to this project.
Gudmund HernesDirector, IIEP
Preface
vi

International Institute for Educational Planning http://www.unesco.org/iiep
This book benefited from sponsorship by the Department forInternational Development (DFID) of the Government of the UnitedKingdom, which made a grant available to support a proportion of thecosts. The International Institute for Educational Planning contributedthe additional funds needed, thanks to the support of several MemberStates, in particular the Swedish International Development Agency. Theauthors are grateful to all for their support.
This book would not have been possible without the assistance ofmany collaborators in the different countries, who assisted in developingthe case studies. These include not only the named co-authors, but manyindividuals who contributed insights and data to enrich the research. Theauthors therefore wish to acknowledge the co-operation and assistanceof those in the ministries of education in each of the countries who gavefreely of their time. In Malawi, the staff of the Centre for EducationalResearch and Training (CERT) also contributed helpful insights, as didcolleagues from the National Institute of Education in Sri Lanka.Collaborators in China, in Beijing and Hanzhou, were very helpful inunravelling some of the intricacies of school financing in a rapidlychanging environment. John Hedges, Anne Pawle and Suzanne Lapstunare thanked for taking on the task of proof-reading the manuscript.
Collecting and analyzing planning and finance data is never easyand requires persistence, skill and tact. It is a tribute to the efforts of allthose involved that this book can now present an analysis grounded inempirical data from each of the countries, which sheds new light onrecent developments.
vii
Acknowledgements

International Institute for Educational Planning http://www.unesco.org/iiep
The authors
This volume includes contributions by the following :
Keith Lewin is a Professor in Education and Director of the Centre forInternational Education of the University of Sussex.
Françoise Caillods is Deputy Director of the International Institute forEducational Planning.
J. Manduvi-Moyo is Education Officer in the Policy Planning Divisionof the Zimbabwe Ministry of Education.
Sugath Mallawarachchi was, at the time of writing, Director of Policy,Planning and Review in the Ministry of Education and Higher Educationof Sri Lanka.
Qu Heng Chang is Professor at Beijing Normal University, where he isDirector of the Institute of Comparative and International Education.
Zeng Xiao Dong is Faculty Member at Beijing Normal University.
Wang Zhan Rei is Faculty Member at Beijing Normal University.
Wu Hua is Faculty Member at Hangzhou University.
Wang Libing is Faculty Member at Hangzhou University.
Francis Hutchinson was Research Fellow at the IIEP at the time ofwriting.
viii

International Institute for Educational Planning http://www.unesco.org/iiep
Preface v
Acknowledgements vii
The authors viii
Introduction 1
Chapter I. Statement of the problem 5Keith M. Lewin
Chapter II. The status of secondary schooling in developing countries 21Keith M. Lewin
Chapter III. Are higher secondary enrolment rates achievable? 39Keith M. Lewin
Chapter IV. Financing secondary education in Zimbabwe:access, equity and efficiency revisited 61J. Manduvi-Moyo and Keith M. Lewin
Chapter V. Secondary schooling in Malawi: the challenge of financing enrolment growth 95Keith M. Lewin
Chapter VI. Financing secondary education in selected francophonecountries of Africa: issues and perspectives 127Françoise Caillods
Chapter VII. Financing secondary schools in Sri Lanka:high participation and low costs 165Keith M. Lewin and Sugath Mallawarachchi
ix
Table of contents

International Institute for Educational Planning http://www.unesco.org/iiep
Chapter VIII.Secondary school financing in China:the new economics of schooling 197Keith M. Lewin with Qu Heng Chang, Zeng Xiao Dong,Wang Zhan Rei, Wu Hua and Wang Libing
Chapter IX. Secondary education financing in Costa Rica:recovering the initiative 245Francis Hutchinson and Keith M. Lewin
Chapter X. Financing increased access and participation at secondary level: main policy options 283Françoise Caillods and Keith M. Lewin
Chapter XI. Overview and conclusions 333Keith M. Lewin and Françoise Caillods
References 357
Table of contents
x

International Institute for Educational Planning http://www.unesco.org/iiep
At the World Conference on Education for All in 1990, most developingcountries reaffirmed their commitment to providing universal access toa first cycle of education to their school-age children. As a result,primary enrolments throughout the developing world have grown,fuelled by grants, expanded lending and by substantial domesticallocations of resources. Little attention was paid at the conference to theconsequences of enrolment expansion in relation to the resources neededfor secondary-schools. However, it was clear then that in manydeveloping countries secondary school participation rates could notgrow rapidly without changes in the structure and nature of theirfinancing. Countries with the lowest gross enrolment rates at secondaryhad the highest ratio of costs per student as a proportion of GNP percapita and were often allocating substantial proportions of the totaleducation budget to secondary. This book takes up the challenge that waspredicted1 and explores the problems and issues that surroundsecondary-school financing.
Chapter I outlines the rationale for a new analysis of secondary-school financing in the context of the changing role that secondaryschools play in the development process. It draws attention to the broaddimensions of the problem, comments on the changing characteristics ofthe labour markets that secondary-school graduates enter and chartsstructural features that will influence the development of secondary-school systems.
Chapter II explores the characteristics of secondary schooling indeveloping countries using analyses based on the UNESCO database. Thisidentifies countries with the lowest gross enrolment rates at secondary,describes features associated with low and high levels of participation, andclassifies country cases in terms of high and low per-pupil costs.
1
Introduction
1. The financial modelling, which was undertaken almost a decade ago for the JomtienConference, anticipated the growing significance of secondary financing issues. Thesehave now become a serious constraint in many developing countries.

International Institute for Educational Planning http://www.unesco.org/iiep
Chapter III investigates under what conditions it might be possibleto increase secondary participation rates at sustainable levels of cost. First,a series of simulations are developed which model key parameters indifferent types of education systems based on data derived from groups ofcountries in the UNESCO database. This leads to some conclusionsillustrating the magnitude of the problems. Subsequently, estimates aregenerated which show what proportion of GNP might have to be allocatedin different groups of countries to achieve higher gross enrolment rates atsecondary. The chapter closes with a summary discussion of the mainresults of the analysis of the magnitude of the problem.
Chapters IV and V provide country case-study analyses ofsecondary-school financing issues in Zimbabwe and Malawi, andChapter 6 provides an overview of problems in a set of francophoneAfrican countries. Zimbabwe has achieved relatively high participationat secondary, whereas Malawi has one of the lowest participation ratesin Africa. Chapters VII and VIII present two Asian case studies – SriLanka and China. Both of these countries enrol large proportions of theage cohort at sustainable levels of cost. Sri Lanka manages this largelythrough public financing centrally; China increasingly mobilizes a widerange of mechanisms for financial support below the national level.Chapter IX explores the case of Costa Rica, a country which has hadhistorically high rates of participation at secondary, but which suffereddeclines in enrolment-rate growth during the 1980s from which it has yetto recover.
Chapter X looks across the case-study data and beyond to collatethe issues that arise and identify those policy options that offer prospectsof improved access at sustainable levels of cost without unacceptabledeterioration in quality. A general discussion is developed of the scopefor budgetary increases to favour increased secondary participation indeveloping countries. Subsequent sections explore the structure andorganization of secondary provision and its cost implications;curriculum constraints and possibilities; mechanisms to increase internalefficiency; opportunities for cost recovery and community support; waysof moderating the costs of secondary-school construction; and finally therange of alternative modes of delivery that may become available forsecondary-level educational services.
Chapter XI reviews the rationale for increased participation atsecondary level. It then develops a policy framework for the analysis ofinvestment decisions for secondary education. Subsequent sectionsconsider the overall financial challenge, along with a synthesis of policy
Introduction
2

International Institute for Educational Planning http://www.unesco.org/iiep
options that could result in lower unit costs and improved efficiency andgenerate more cost sharing. The penultimate section explores the roleexternal assistance can play in supporting expanded access andparticipation. The chapter ends with some concluding remarks.
Introduction
3

International Institute for Educational Planning http://www.unesco.org/iiep
In many developing countries the problems of financing secondaryschools are acute. Participation rates remain low and are not growing inmost of the countries where they are smallest. Costs at secondary levelare often high and are unsustainable if participation is to be increased.Employment based on new production methods, the improvement ofmature technologies and the widespread diffusion of information andcommunication technologies increasingly demands workers with morethan basic education.
Several key observations serve to make the case for theimportance of a new analysis of the problems of financing secondaryschools.
First, though secondary schooling is now universal in richcountries, it is a scarce luxury in much of the rest of the world. There areat least 700 million people in the countries with gross enrolment rates atsecondary level of less than 40 per cent. A further one billion live wheresecondary gross enrolment rates (GERs) are between 40 per cent and 70per cent (about 3 billion, including China and India). In both cases it islikely that the majority of adults have experienced at best the first fewgrades of secondary schooling, and at worst none at all. In the low GERcountries (less than 40 per cent GER) it is unlikely that much more than20 per cent of school-age children are completing a full secondary cycle.
Second, though progress has been made in increasing enrolmentsin primary grades since the World Conference on Education, and mostpeople now live in countries where the primary gross enrolment rateapproaches 100 per cent, progress on increasing secondary participationhas been disappointing. In most of those countries with a secondaryGER of less than 40 per cent, participation rates have not increasedsignificantly over the last decade; in countries with secondary GERsbetween 40 per cent and 70 per cent, the average GER has increasedfrom 49 per cent to only 56 per cent. In countries where GERs exceeded70 per cent in the 1980s, average enrolment ratios have only increased
5
Chapter I
Statement of the problemKeith M. Lewin

International Institute for Educational Planning http://www.unesco.org/iiep
slowly. As population has continued to grow this has meant that theabsolute number of those without access to secondary schools hasincreased, especially in the poorest developing countries.
Third, the analysis presented in this book indicates that thosecountries which have low enrolment rates at secondary cannot financesubstantially higher rates of participation from domestic resources withcurrent cost structures. Secondary schooling is most expensive relativeto GNP per capita in those countries with the lowest enrolment rates.Typically, secondary-school places are much more expensive than thoseat primary, and it appears that secondary-school systems utilize scarceresources (teachers, buildings, etc.) less efficiently than primary schools.Not only are countries with GERs at secondary below 40 per centpredominantly low income, but also fully two-thirds are concentrated insub-Saharan Africa, where economic growth has been low andsometimes negative over the past decade. These countries have highpopulation growth and dependency ratios. This also limits the scope forincreased investment per student.
Fourth, external support for investment in secondary educationhas been patchy. The share of aid targeted on secondary education bybilateral donors ‘remained tiny, both globally and in Sub-saharanAfrica’1 over the period 1983-93 (Bennell and Furlong, 1997:18). WorldBank lending to secondary education declined from 1980 to 1990. At theend of this period it represented only 10 per cent of all lending. This canbe contrasted with over 50 per cent in the 1970s. The inclusion of lowersecondary in many basic education projects has resulted in someincrease since 1990 (World Bank, 1995). However, sub-Saharan Africahas seen its share of IDA funding for education diminish from 50 percent in 1990 to 21 per cent by 1996 (Bennell and Furlong, 1997). Moreoptimistically, multilateral organizations apart from the World Bankwere committing about 22 per cent of their loans to secondary-levelprojects by 1993. World Bank lending for secondary-level projects hasnow recovered to about 27 per cent of the total, with general secondaryaccounting for over 20 per cent. This reflects a renewed interest in thesector (Linden, 1999). The latest DFID policy framework for education(DFID, 1999:15) argues that: ‘The two greatest challenges for thesecondary level are to absorb the growing numbers of students fromexpanded primary systems and to provide a quality of education whichwill build on their basic knowledge and skills, broaden theircompetences and enhance their employment opportunities’. This
6
Financing secondary education in developing countries
1. According to DAC’s Credit Rating System.

International Institute for Educational Planning http://www.unesco.org/iiep
recognizes the importance of the problems emerging related tosecondary provision.
Rates of return for secondary schooling remain high and are oftenargued to be above the opportunity cost of capital and the rates of returnfor many other types of investment in agriculture, industry andinfrastructure (World Bank, 1995). Rates of return on different levels ofschooling have been changing as a result of structural shifts inemployment and in response to the increased supply of school-leavers.As primary schooling becomes near universal in much of the developingworld, rates of return at this level are likely to fall; where secondary-school graduates remain relatively scarce, the rate of return on theirschooling is likely to increase.
There is evidence that investment in secondary education isassociated with export-led growth, utilizing skill endowments generatedby this level of schooling (Wood and Ridao-Cano, 1996; Nelson andPack, 1998) and that those with secondary schooling benefit directly andsubstantially from their participation (Knight and Sabot, 1990). It hasbeen argued that investment in secondary schooling has been especiallysignificant for the rapid growth that East-Asian countries experienced inthe 1970s and 1980s (Lewin, 1999; Asian Development Bank, 1997).Effective secondary schooling offers access to abstract reasoning and thekind of flexible thinking skills associated with growth-orientatedproduction and new jobs in manufacturing and the service sector, whichhave an increasing information processing and knowledge content. Anunder-supply of these skills is often seen as a constraint on development(Caillods et al., 1997).
None of the points made above should be taken to devalue theimportance of continued investment at the primary level. This isespecially the case in countries where primary enrolment growth hasstagnated (Bredie and Beeharry, 1998; Colclough and Al-Samarrai,1998). This remains a major challenge, but it cannot be seen in isolationfrom investment in other parts of education systems. This is true fordevelopmental reasons. No country can respond successfully to the needto increase production in manufacturing and services without middle-level workers likely to have benefited from secondary schooling. It isalso true because inadequate provision of secondary schooling will itselfrestrict the possibilities of increasing enrolment at primary level –through constraints on the supply of those qualified to be trained asteachers.
7
Statement of the problem

International Institute for Educational Planning http://www.unesco.org/iiep
1. The changing importance of secondary schooling in developing countries
The general case for investment in education as a necessary, butnot sufficient, condition for development has been extensively made andis widely accepted. Expansion in enrolments at primary and secondarylevels has been supported by the shared beliefs by governments anddevelopment agencies that social and economic development benefitdirectly and indirectly from mass participation in schooling. There is anextensive and highly nuanced literature demonstrating linkages betweeninvestment in education and training, and desirable developmentoutcomes. There are well-known studies relating economic growth toeducational investment dating from the 1960s, and more recent literaturecorrelating levels of education with improved productivity in agricultureand industry under particular conditions. Other studies suggest thatinvestments in training benefit from higher levels of general educationamongst trainees, and that social benefits in health, nutrition, fertilityand gender equity are also closely related to raised levels of education.There are also suggestions that improved access to education can reduceincome inequality. Evidence on the effects of education on developmentis widely reviewed e.g. World Bank, 1995; Psacharopoulos, 1995;Lewin, 1994; and Colclough with Lewin, 1993. The findings, whichgenerally support the positive impact of educational investment ondevelopment, have been derived from studies at all levels. As primaryschooling becomes more universal, the focus is shifting to theexploration of the benefits of secondary schooling.
2. Interactions with basic education
The 1990s have seen an emphasis on Education for All. Mostcountries which had primary gross enrolment rates below levelssufficient to provide universal access over the first cycle have committedthemselves to plans to achieve this goal. Donors and developmentagencies have supported investment in primary schooling as a priority.For good reasons, attention has been focused on those countries with thelowest primary enrolment rates, and those where inequities in access andretention appear most resistant to change. Primary gross enrolment rateshave increased in many countries, as have the related budgetaryallocations. As a result, most developing countries with low enrolmentrates now have large, externally supported basic education projectsunder way.
8
Financing secondary education in developing countries

International Institute for Educational Planning http://www.unesco.org/iiep
The priority given to investment in primary and basic education inworld fora and national plans has overshadowed analysis of the changingrole and financing problems that affect secondary schooling. As notedabove, bilateral assistance to secondary education has been modest. Thegeneration of basic-education projects may not have actually ‘crowdedout’ initiatives to improve access and quality at secondary level, but it isplausible to argue that the policy agenda has been skewed to the extentthat fewer secondary projects have been externally financed than in thepast. It is of course true that many basic-education projects haveincluded lower secondary (Grades 6-9) in their activities, but not all do.Where they do, it is arguable whether the focus has remained on thedevelopment of basic skills, rather than on things that secondary schoolsmight be thought especially suited to develop – high-level thinking skillsand occupationally relevant knowledge and competence.
It was always clear that the Education for All agenda (1990)carried with it implications that extended beyond the first cycle ofeducation. Analysis conducted in the early 1990s showed that in all butthe short term the recurrent cost burden of increased participation wouldbe most problematic at secondary level in countries with the lowestenrolment rates at the start of the decade (Colclough with Lewin, 1993).Where secondary enrolment growth is occurring without changes in coststructure, these predictions are becoming true.
The picture that is emerging can be described thus. As themajority of countries achieve gross enrolment rates in excess of 90 percent at the primary level, improved quality and enhanced achievementare likely to preoccupy policy-makers and planners. These concerns arenot as obviously linked to financing questions as is increasedparticipation. The school-effectiveness literature contains muchevidence that school quality varies as a result of a wide range of factors.Many are independent of resources. In every system the school-effectiveness literature indicates that schools can be found whichperform at very different levels, despite having essentially similar inputs.Value-added type analyses also indicate that institutions with modestoverall levels of achievement may enhance learning at least as much ashigh-scoring and well-resourced schools.
In every country, allocations to primary have some upper limitdetermined by what is judged to be a sustainable level of cost perprimary-school place. When most primary school-age children areenrolled, gains in quality and achievement are likely to depend onimproved curricula, better school management and more efficient use ofresources. In these cases, budgetary growth for primary will then follow
9
Statement of the problem

International Institute for Educational Planning http://www.unesco.org/iiep
a profile driven predominantly by demographic changes and the fortunesof the national economy. Where the growth of the school-age cohort ishigh, and economic growth modest, it will generate continuing pressuresto shift allocations to the first level, possibly at the expense of investmentin secondary.
Countervailing this tendency for allocations to primary to grow,there will be additional pressure to increase enrolment rates at secondarylevel in countries where secondary-school participation is far fromuniversal. There seem to be few historical precedents for significantdeclines in transition rates into secondary as primary-school enrolmentsgrow. The exceptions occur on the shortest of time scales and areassociated with major pushes to universalize primary education. Thereasons for this are easily appreciated. Pass rates in primary schoolleaving examinations generally do not deteriorate over time (even ifstandards may change); as a result, the numbers graduating successfullyincrease. Consequently, the competition for secondary-school placesintensifies and this creates increased effective demand to expand thesupply of secondary-school places. To the extent that governments aresusceptible to popular pressures to expand opportunity, methods thenneed to be found to finance secondary-school expansion – including thesubstitution of private for public expenditure where this is a feasibleoption.
Closely related to the simple dynamic created by an increasedflow of primary graduates are the changes that are likely to take place inthe social functions and perceived returns to access and participation insecondary schools. Where primary schooling is terminal for themajority, those who succeed in graduating enjoy a premium in themarket place compared to those who drop out at lower levels. As primaryschooling becomes universal, the comparative advantage of possessing itfalls to the point where it has little competitive value. Rates of return toprimary – perceived and real – will cease to be seen as much of a reasonfor individual decision-making to continue in school. Completion ofprimary will become, for most, a pre-entry condition to secondary. Whatwill increasingly differentiate entrants to the labour market will be thelevel and achievement of students through secondary school. If primaryschooling had in part social selection and screening function in the past,this will be largely replaced by participation and achievement insecondary schools.
10
Financing secondary education in developing countries

International Institute for Educational Planning http://www.unesco.org/iiep
Statement of the problem
11
3. Curriculum issues
Another facet of the changing role of secondary schools relates tocurricula patterns. These carry implications for school organization andresources. It is now fairly universal to stress the importance of theacquisition of basic skills through the primary grades. At the simplest levelthese consist of literacy and numeracy, fluency in appropriate languages,the rudiments of scientific literacy and common exposure to that which isculturally valued, e.g. understandings derived from history and geography,and socialization into culturally appropriate behaviour. Most primary-school curricula stress the importance of these basic learning tools to laythe foundations for more systematic acquisition of skills and capabilitiesat higher levels. Secondary-school curricula (especially upper secondary)are typically more specialized, focus increasingly on analytic and abstractskills above the level of knowledge and recall, and, in principle as well aspractice, stress links with outcomes that relate to that which is useful inemployment and adult life. It is at secondary level that science andtechnology can be developed in depth, language skills can be consolidatedand higher cognitive skills refined and applied to problems. Amongst otherthings, this reflects the capacity of older students to reason abstractly andto acquire complex competences that are usually judged inaccessible toprimary-age children. As these differences between the potentialities andpurposes of primary and secondary schools are emphasized, it willbecome more and more important to reshape investment in secondaryschooling so that it can promote higher-level learning goals effectively andbe accessible to greater proportions of the population.
The differentiation of primary- and secondary-school curricula isoccurring for reasons that are not all located within national educationsystems or their students. One reason is that public selectionexaminations are concentrated increasingly at the end of lower- andupper-secondary schooling. These assessments not only determinewhich students proceed and which enter the labour market. They alsocertify competences which are linked more or less to norms which havean increasingly international character. National examination boards arelinked into a network of professional examiners who share manyjudgements of what constitutes appropriate outcomes at a given level ofschooling in particular subject areas. Cross-national studies provideevidence of achievement against common yardsticks. This can providean impetus for change directed towards common sets of outcomes.International systems of indicators are being developed across countriesthat may also promote convergence in valued outcomes.

International Institute for Educational Planning http://www.unesco.org/iiep
The more educational demand is influenced by external standardsand international conventions, the easier it will be for education systems tobe shaped by criteria, content and methods that originate elsewhere. Thiscould be an asset if it leads to higher levels of achievement relevant todomestic needs. But it may also lead to secondary schooling whichattempts to replicate conditions and outcomes most relevant to quitedifferently structured economies and labour markets. These developmentsraise issues about the purposes of schooling, especially at the secondarylevel, which also have implications for curricula, participation and finance.
As secondary-school systems expand, and become less selective onentry, average achievement levels may fall if curricula offerings are notadjusted to reflect the more differentiated needs and capabilities of a widerrange of secondary students. Problems of retention and progression mayalso be exacerbated. Achievement levels amongst average and below-average students need to be set at levels that are attainable and representuseful learning gains. Low achievement in critical areas, e.g. science,technology, mathematics and communication skills, needs identifying andthe reasons for it need exploring (Caillods et al., 1997). The costs ofproviding expensive options in the curriculum have to be constrained tolevels that allow higher rates of participation. Standards of provisionnecessary to reach learning outcomes derived from well-resourcedsystems may not be feasible in impoverished systems without restrictingaccess to a small minority.
4. Globalization
These observations can be extended with reference to changes inthe global economy. Globalization has no single definition. It includes thedevelopment of markets with a level of integration between developingand industrialized countries; increased movement of labour and jobsbetween countries; inter-connectedness of populations in different partsof the world through communication technologies, whose costs arerapidly reducing; student work and study abroad; and culturalconvergence in aspects of taste and values promoted by exposure tointernational media, travel and increasing wealth. It is at secondary andhigher levels that the influences of globalization are most likely to be felt.
Data on employment by sector illustrate very clearly that ingeneral, as national economies become richer, the proportions ofemployment begin to shift from agriculture to industry and then toservices. Those countries which have the most developed economieshave the greatest proportions of employment in manufacturing and
12
Financing secondary education in developing countries
International Institute for Educational Planning http://www.unesco.org/iiep
services. Where these shifts in employment occur, the importance ofeffective secondary schooling is obvious. It is at this level that abstractthinking skills are beginning to be acquired, specific occupationallyrelevant skills can be taught and students become motivated to seekemployment. In most countries where more than 50 per cent of thelabour force is outside agriculture, lower-secondary schooling isapproaching universal levels. In those countries where this has yet totake place, it is plausible to argue that development will be constrainedby an under-supply of secondary-school graduates.
In the most developed countries, the service sector is frequentlythe largest employer. These countries typically provide extended periodsof skill development during the secondary-school years, andsubsequently, to build on basic skills and develop abstract thinking.Many of the new jobs that are becoming available benefit from a mix offamiliarity with information technologies, developed interpersonalskills, analytical capabilities, foreign languages and the abilitiesassociated with the co-ordination and management of complex tasks.The knowledge-intensive parts of labour markets employ those with thehighest levels of technical competence and increasingly depend oncreative design, product innovation, efficient production technology andthe organization of work in ways which adopt best practices and flexibleworkforce deployment.
There is, of course, a potential fallacy in taking an oversimplifiedview of the need to increase participation in secondary schooling. Justbecause more developed labour markets draw on higher-level skills inthe labour force, and these skills are associated with higher levels ofsecondary-school participation, it does not follow that providing moresecondary schooling will necessarily lead to accelerated development.However, the counter-proposition is weak. Continued emphasis onprimary and basic education, once most of the population enjoy itsbenefits, is unlikely to create conditions conducive to economictransformation dependent on movement up the skill and value-addedhierarchy of production. There is presumably some level of balancedinvestment, which optimizes the proportion of those with higher levelsof skill and competence obtained from effective secondary schoolingwho can occupy middle-level employment niches which draw on suchskills. Judgements as to when this is achieved clearly need to be made inrelation to particular economies and education systems, taking intoaccount the sectors where employment is located and likely to grow,signals of under- and oversupply for secondary graduates, and whateverother constraints may exist on growth.
13
Statement of the problem

International Institute for Educational Planning http://www.unesco.org/iiep
5. International labour markets
Other dimensions related to globalization and the changing role ofsecondary schooling need noting. First, the development of internationalmarkets in labour and jobs has encouraged the movement of production,especially that which uses mature technologies, down a staircase relatedto factor costs. Where labour costs are an important component ofproduction, it is the quality of labour, its technical skill, languageabilities and motivation, that creates comparative advantages. Thesederive partly from educational investment at secondary level. At anygiven level of labour cost, those countries which can offer a more highlyeducated labour force are likely to attract more investment, whether it isin manufacturing or services. There are an increasing number ofexamples of production shifting from industrialized countries to cheaperdeveloping countries which have this comparative advantage.
Second, new communication technologies make it possible toaccess information worldwide. It is now realistic for many in middle-income countries to link to common networks, which allow businessesto run internationally and services to be delivered from sites which maybe located anywhere the expertise exists. International flows of studentshave been increasing, resulting in extensive networking of ideas andopportunities and, in some, convergence of educational experience andaspirations. The English language provides access to many of theseopportunities and is often acquired, or at least consolidated, throughsecondary schooling.
Third, temporary migration of labour from poorer to richercountries is almost certainly increasing. These flows have many historicalorigins, but were typically dominated by either professionals migrating tothe richer countries, or low-skill, low-cost migrant labour connected tospecific industries where labour was scarce. It seems possible that in thefuture such flows will be restricted to the more educated and skilled, whoare likely to possess secondary education and above, and have evidencethat they possess scarce job-relevant competences from qualifications andtrade certificates. Where this is true, it will influence the demand for anddevelopment of secondary schooling.
6. Structural and financing issues
The last set of considerations that reinforces the need to examineproblems of secondary-school finance is concerned with structuralfeatures of secondary-school systems and their financing.
14
Financing secondary education in developing countries

International Institute for Educational Planning http://www.unesco.org/iiep
In many developing countries with low participation rates insecondary schooling, the character and organization of secondaryschools have their origins in elite, colonially introduced institutionsdesigned to cater to a small minority of students destined to entergovernment employment. The history of primary schools has its own lifehistory, which differs between countries. In many cases, primary schoolsdeveloped to serve large numbers of children and focused throughdesign or default on basic learning tasks. Characteristically, primary-school systems shared a number of attributes which included massparticipation, curricula based largely on ‘commonsense’ content andgoals accessible to most educated adults, low levels of material resourcesupport, an absence of specialized teaching, and often little selection ofpupils on entry. In contrast, many secondary-school systems have ahistory which is very different. Most have been highly selective, havespecialized teaching and curricula traditions which reflect normsinherited from elite schooling traditions leading to employment in thepublic sector, and have been relatively well resourced. The point to stressis that existing secondary-school systems may have characteristicswhich preclude a simple replication of existing institutions to meet newneeds for greater access. This is manifestly the case in relation tofinancing in systems where unit costs are high, both as a proportion ofGNP per capita and as a proportion of investment at primary level. High-cost, strongly selective and academically orientated secondary schoolingis probably inconsistent with substantially enlarged participation.
A second concern is that different countries have very differenttraditions of investing in secondary schooling. The spectrum is wide.Some have sought to keep public investment to a minimum and restrictthe output of secondary-school leavers to numbers which can beabsorbed into the labour market (Malawi, Tanzania). Others havestressed investment at the primary level first and depended on high levelsof private demand to allow secondary enrolments to increase rapidlywithout large increases in the public costs of the secondary system, e.g.Korea.
Thirdly, in some regions, notably sub-Saharan Africa, boardingtraditions at secondary have been well established and are often themode of delivery of preference. These arrangements may be necessarywhere the population density of secondary-school students is low. Thetraditions and preferences may persist when expansion allows theproportion of day schools to increase substantially. The cost implicationsof retaining boarding where it is not essential are often substantial.
15
Statement of the problem

International Institute for Educational Planning http://www.unesco.org/iiep
Fourth, depending on how provision is organized, investment insecondary schooling may be neither equitable nor efficient. The basicargument is straightforward. Where access to secondary schooling isvery restricted, participation is often skewed in favour of the alreadyadvantaged, who have access to good-quality primary schools,infrastructral support for learning, and better-resourced familybackgrounds. Selection mechanisms which determine who goes tosecondary school may fall well short of fair tests of achievement andcapability. Increasingly, participation in secondary schools determinesoccupational futures more than completion of primary. It is importantboth that selection for scarce opportunity is as equitable as feasible, andthat secondary schools as institutions make efficient use of the resourcesthey consume. This may not be the case where historic patterns oforganization, curricula tradition and public subsidy are maintained at theexpense of expanded access and improved quality and relevance to newneeds and learning priorities. The extent to which these assertions holdis an empirical question. There is plenty of circumstantial evidence tosuggest that there are problems in many secondary-school systems ofhigh failure rates (related to selection and to school quality), skewedparticipation (gender, social group, urban rather than rural),overconcentration of learning resources on the few who survive to thehighest grades (very small class sizes, expensive and underutilizedfacilities) and high costs (inappropriate balance between investment inlearning resources and staffing costs, heavily subsidized boarding, poorutilization of teaching time).
Finally, the spectre of global recession now poses a new challengeto educational investment at the secondary level. Events in East andSouth-East Asia, and in Russia, have led to financial crises, and a loss inconfidence that will dampen growth and may lead to serious recessionacross much of the developing world. Government budgets are alreadysuffering from the pressures created by the devaluation of assets,exchange-rate collapses and reductions in tax revenue, whichaccompany contraction of demand. In the short term, a range of possibleconsequences can be identified which are often associated with public-sector austerity (Lewin, 1987). These are:
• social sector spending is especially vulnerable to generalbudgetary restraint;
• reallocation will favour salary over non-salary and capitalexpenditure;
16
Financing secondary education in developing countries

International Institute for Educational Planning http://www.unesco.org/iiep
• expenditure on some levels of education may suffer less fromausterity than others;
• significant cost-reduction in schools-systems can only come fromreductions in unit costs that are mainly salary dependent and thismay compromise quality;
• various kinds of cost recovery will appear a more attractive policyoption;
• the poorest countries may become more dependent on donorsupport and concessionary financing.
First, it probably will not be true that social-sector spending ingeneral, and education in particular, will experience disproportionatereductions in funding. The opposite is at least as likely, since mostexpenditure is salary recurrent, and strong effective demand foreducation is likely to remain and influence political decision-making.However, this is not to deny the obvious – the absolute level ofinvestment in education will decline where government revenues aresqueezed, with the consequence that the real value of teachers’ salariesmay deteriorate. If safety nets related to structural adjustment and otherpolicy instruments continue to try to protect education spending, thiswill benefit education budgets. Second, as the proportion of salary-recurrent expenditure rises, capital spending will be truncated, and non-salary support (learning materials, etc.) could decline to levels thatdamage quality and achievement. This is likely to have a larger effect onsecondary schools where non-salary costs are higher. Third, whathappens to the distribution of investment between levels will depend onwhether priorities set by government change to reflect new constraints.For example, maintaining targets to achieve universal access to primaryover a given time with a reduced amount of recurrent funding couldrequire reallocation from other parts of the education budget, includingthat currently allocated to secondary schools. Fourth, if recessionpersists it is almost inevitable that the real value of teachers’ salaries willdecline, with possible consequences for commitment and performance.Arguably, these declines may have more impact on secondary teachers iftheir salaries are currently much greater than those for primary teachers.They may also have more opportunity to change employment if theirskills are in demand and teachers’ salaries become less competitive.Fifth, it is almost inevitable that cost recovery will appear moreattractive, but disposable incomes will be falling. Some imagination willbe needed to devise feasible methods of recovering costs in equitableand efficient ways at secondary level against this background in the
17
Statement of the problem

International Institute for Educational Planning http://www.unesco.org/iiep
countries most affected by recession. Sixth, external support maybecome virtually the only source of funding for developmentalinitiatives at secondary-school level in the poorest countries. Ifsecondary participation is not to fall, it may need to be provided in wayswhich support some proportion of recurrent costs, where without thisassistance infrastructure will deteriorate dramatically. This could becoupled with reformed methods of financing that could lead tosustainable expansion in participation once economic growth returns.
7. A rationale
For all the reasons outlined above, the nature of the problem offinancing secondary schools in developing countries is changing. Thisprovides the rationale for this book. In essence the propositions thatprovide the framework for this analysis can be summarized as:
1. Effective provision of secondary schooling is central todevelopment. It can provide a proportion of the population withthe opportunity to acquire insights, skills and competences at ahigher level than can be acquired in primary schools.
2. The learning outcomes secondary schools can facilitate are indemand. These are likely to be needed in sectors of employmentwhere growth is anticipated, and which depend on workers withabstract-thinking skills and systematically acquired knowledgewhich can be applied flexibly to new problems.
3. Many of the poorest countries have very low rates of secondaryenrolment. In the absence of measures to increase participation,the differences in educational levels of the workforce betweenthese countries and those already achieving secondary grossenrolment rates over 60 per cent are likely to grow. It would besurprising if this were not reflected subsequently in nationalcompetitiveness in areas of production which have a substantialknowledge and skill base.
4. Secondary schooling is most expensive in relation to nationalresources where enrolment rates at secondary are lowest. Thereasons for this have to be understood, and the constraints thisplaces on increased participation have to be addressed, if thesupply of secondary graduates is to increase.
5. Secondary schooling as organized in many developing countrieswith low enrolment rates may be as much a source of inequalityas a vector in its reduction. Depending on how it is financed and
18
Financing secondary education in developing countries

International Institute for Educational Planning http://www.unesco.org/iiep
who benefits, it may be neither equitable nor efficient in meetingnational needs. If this is so, reform is needed.
6. Recession will create new stresses on secondary-school financing.Without some considered strategies to provide safety nets toprotect current levels of participation in the countries with thelowest GERs at this level, it is possible that enrolments andquality will decline from already-low levels.
7. Balanced investment strategies are needed which reconcile thecompeting claims for public finance within the formal educationsystem. A careful appraisal is needed in the light of changingdomestic and international circumstances which recognizes thetrade-offs which are inevitable in prioritizing public investment atdifferent educational levels.
Having outlined the rationale for this analysis of secondary-schoolfinance, it is now appropriate to examine in more detail thecharacteristics of school systems where problems of participation andfinancing of secondary schools appear most acute.
19
Statement of the problem

International Institute for Educational Planning http://www.unesco.org/iiep
What, then, are the characteristics of countries with low levels ofsecondary enrolment?
Using UNESCO data, it is possible to identify those countrieswhich have the lowest gross enrolment rates at secondary (GER2).1There are 150 countries for which these rates are available. Forty-four ofthese have GER2s below 40 per cent. In these countries, the netsecondary enrolment rate2 is likely to be between 20 per cent and 30 percent as a result of repetition and over-age enrolment. Those who succeedin completing the cycle and passing secondary-school leavingexaminations will represent an even smaller proportion of the age group.Thus, in many developing countries, only a small minority participate inand finish secondary schooling.
Table 2.1 lists the countries with the lowest GER2 for which thereare data for 1985 and 1995. For purposes of comparison, the value ofprimary gross enrolment rates (GER1), the ratio of female-to-maleenrolments, educational expenditure as a percentage of GNP and thepercentage of government expenditure on education, are also shown.
Fully two-thirds of the countries with the lowest GER2 are inAfrica, and especially in francophone countries. Other regions have asmall number of cases. On average, the GNP per capita of all thesecountries is less than US$600. In this group of countries, improvementsin primary participation (GER1) have been modest over the past decade(from an average of 76 per cent to 81 per cent, 1985-1995). Ten of thesecountries have a GER1 exceeding 100 per cent. This indicates that, inprinciple, enough capacity exists to universalize enrolments at this level(though net enrolments will of course be less).
21
Chapter II
The status of secondary schooling in developing countries
Keith M. Lewin
1. Net enrolment ratios are not used, partly because they are widely unavailable atsecondary level and partly because they are less reliable for cross-country comparisonsthan are GERs.
2. Participation in lower secondary is likely to be greater than for the whole cycle; separatedata are not available which would allow the GER for lower secondary to be established.

International Institute for Educational Planning http://www.unesco.org/iiep
GER2 has seen almost no increase in the recent past. The averageGER2 in 1985 for these countries was 19.2 per cent, and in 1995 it was20.7 per cent.3 In 10 cases, GER2 appears to have fallen. The ratio offemale-to-male enrolments has increased at primary and secondarylevel, but remains substantially skewed towards males. On average,females are 82 per cent of males at primary and 71 per cent at secondary.The average proportion of GNP allocated to education appears to haverisen marginally from 3.7 per cent to 4.1 per cent, as has the proportionof the government budget allocated to education (from 14.3 per cent to17.9 per cent).4
The picture that emerges for very low-GER2 countries is thereforenot encouraging. In these countries, the great majority of students do notcomplete secondary schooling and it is clear that in a good number mostdo not make the initial transition from primary to secondary grades.Changes in budgetary allocations appear to have had little impact onparticipation. Though emphasis on universalizing primary education hashad an effect on increasing primary participation, growth in participationat secondary level has remained severely constrained.
22
Financing secondary education in developing countries
3. If the anomalous case of Albania is excluded, the average GER2 becomes 17.8 per centin 1985 and 20.2 per cent in 1995.
4. Since the missing cases vary between years, these apparent increases should be treatedwith caution.

International Institute for Educational Planning http://www.unesco.org/iiep
The status of secondary schooling in developing countries
23
Table 2.1 GNP per capita, gross enrolment rates at primary andsecondary, females as percentage of males and educationalexpenditure in countries with GER2 below 40 per cent5
Country GNP GER1 GER1 Female Female GER2 GER2 Female Female Public Public Edu- Edu-per % % as % as % % % as % as % expen- expen- cation cation
capita 1985 1995 male male 1985 1995 male male diture diture in go- in go-(US$) 1985 1995 1985 1995 as % as % vern- vern-1995 GNP GNP ment ment
1985 1995 expen- expen-diture diture
% 1985 % 1995AfricaU. R. Tanzania 120 75 67 97 97 3 5 50 83 4 14Malawi 170 60 135 76 90 4 6 50 57 4 6 10 15Burundi 160 52 70 72 82 4 7 40 63 3 3 16Mozambique 80 87 60 77 71 7 7 50 56 4 11Niger 220 26 29 55 61 5 7 38 44Burkina Faso 230 27 38 59 65 4 8 50 55 4 11Mali 250 23 32 57 64 6 9 44 50 4 2Ethiopia 100 37 31 68 62 13 11 67 83 3 5 10 13Guinea 550 34 48 47 54 13 12 39 33 15Uganda 240 74 73 83 85 13 12 53 60 4Sudan 50 54 69 81 20 13 74 86Djibouti 40 38 70 75 12 13 64 73 3 8Madagascar 230 109 72 94 96 29 14 84 100 3Mauritania 460 48 78 67 85 15 15 36 58 5 16Benin 370 68 72 50 57 17 16 42 43 3 15Senegal 600 56 65 69 79 14 16 50 60 4 33Comoros 470 84 78 78 84 29 19 68 81 4 4 23 21Gambia 320 68 73 62 86 16 22 43 54 3 6 16Côte d’Ivoire 660 72 69 70 73 20 23 44 50Kenya 280 99 85 94 100 21 24 62 85 6 7D.R.Congo 120 86 72 65 69 23 26 41 59 1 7Cape Verde 960 117 131 95 98 14 27 81 93 4Cameroon 650 103 88 85 90 23 27 64 69 3 15Togo 310 93 118 62 69 21 27 31 34 5 6 19 19Lesotho 770 110 99 127 114 23 28 147 155 4 6Zambia 400 104 89 90 93 19 28 56 62 5 2 13Nigeria 260 96 89 79 79 33 30 71 85Morocco 1,110 77 83 65 76 35 39 67 75 6 6 23 23Central AmericaGuatemala 1,340 76 84 84 87 19 25 92 2 2 12 18Honduras 600 111 112 103 101 37 32 4 4 14 17South AmericaVenezuela 3,020 97 94 103 103 24 35 129 141 5 5 20 22Paraguay 1,690 105 109 94 97 31 38 97 103 2 3 17 17
5. This and subsequent tables are derived from the UNESCO 1998 Statistical Database. StandardUNESCO definitions have been used for the categories. Thus, % females as % males =females as a proportion of males enrolled etc. See World Education Report, UNESCO, 1998.

International Institute for Educational Planning http://www.unesco.org/iiep
It is illuminating to consider some comparisons that can be madebetween countries with low GER2 and those with higher levels. The dataset was divided into four groups of countries with GER2 falling withindifferent ranges: 7 per cent-40 per cent, 41 per cent-70 per cent, 71 percent-90 per cent, and above 90 per cent. The results are shown belowusing averages6 for each set of data.
Table 2.2 Average values of GNP, population growth, dependencyrates and percentage urban population by group
24
Financing secondary education in developing countries
AsiaAfghanistan 20 49 48 50 8 22 45 34Yemen 260 79 40 23 22 8 21Lao PDR 350 111 107 83 74 23 25 70 61 2Myanmar 98 103 95 97 23 30 92 103 1 14Nepal 200 80 110 46 69 25 37 32 51 3 3 13 13EuropeAlbania 670 103 101 98 102 72 35 91 100 3PNG and OceaniaPapua New Guinea 1,160 67 80 85 85 12 14 64 65Solomon Islands 910 79 97 87 19 17 67 5 12
Average 599 75.5 80.9 76.9 81.7 19.2 20.7 61.8 71.3 3.7 4.1 14.3 17.9
It is clear that low secondary enrolment rates are found in thepoorest countries. Lower values for GER2 are associated with lowerGNP per capita in US$ and $PPP7 (Chart 2.1, R squared = 0.53). Chart2.2 examines countries with GNP ($PPP) below 5,000. Amongst thesethe association remains (R squared = 0.49). It is apparent that the GER2value for countries with GNP ($PPP) per capita between 1,000 and 5,000can vary widely from below 20 per cent to above 80 per cent. Clearly itis not only per-capita income that is determining levels of GER2. Somepoorer countries manage relatively high participation rates at lowincome levels. Below GNP ($PPP) per capita 1,000, all countries in thedatabase have GER2 below 30 per cent.
6. Unweighted averages in this and subsequent tables unless otherwise identified. 7. International dollars.
Group GNP per GNP per Population 0-14 year 0-14 year Urban capita 1995 capita ($PPP) growth rate dependency dependency population
(US$) 1995 % 1995 rate % 1985 rate % 1995 as % of total 1995
Very low GER2 589 1,680 2.88 86 83 32Low GER2 2,545 5,792 2.12 72 64 53Middle GER2 5,831 7,802 1.18 48 43 68High GER2 17,262 15,881 0.81 38 34 73

International Institute for Educational Planning http://www.unesco.org/iiep
Chart 2.1 Gross enrolment rate at secondary by GNP ($PPP) percapita – All countries, 1995
Chart 2.2 Gross enrolment rate at secondary by GNP ($PPP) per capitaCountries below $PPP 5,000, 1995
0
20
40
60
80
100
0 500 1,000 1,500 2,000 2,500 3,000 3,500 4,000 4,500 5,000
GNP ($PPP) per capita
Gro
ss e
nrol
men
t rat
e at
sec
onda
ry
0
20
40
60
80
100
120
140
0 5,000 10,000 15,000 20,000 25,000GNP ($PPP) per capita
Gro
ss e
nrol
men
t rat
e at
sec
onda
ry
25
The status of secondary schooling in developing countries

International Institute for Educational Planning http://www.unesco.org/iiep
Table 2.2 also shows that average population growth rates aremuch higher in countries with low GER2, averaging nearly 2.9 per cent.8The 0-14 year-old dependency rate9 is also very high, at over 80 per centin very low-GER2 countries. It is less than 35 per cent in those with highGER2. This draws attention to the fact that the school-age population isa much greater proportion of the total population in low-GER2countries. Consequently, the burden of financing higher levels ofparticipation is much greater. It is noticeable that not only aredependency rates greater in low-GER2 countries, but that they appear tohave only fallen slowly over the period 1985-1995.
Table 2.3 shows gross enrolment rates at primary and secondaryand participation by gender.
Table 2.3 Gross enrolment rates and females as percentage of males 1985 and 1995
26
Financing secondary education in developing countries
GER1 % GER1 % Primary Primary GER2 % GER2 % Secondary Secondary1985 1995 female as female as 1985 1995 female as female as
% male % male % male % male 1985 1995 1985 1995
Very low GER2 75 80 76 81 19 21 62 70Low GER2 107 106 95 97 49 56 94 100Middle GER2 101 101 98 98 81 80 102 106High GER2 103 102 99 99 92 107 101 102
Primary GERs are over 100 per cent on average in all but the firstgroup of countries, suggesting that there are enough places available toenrol all primary-age children, albeit that repetition and over-ageenrolment will cause the net enrolment rate to fall below 100 per cent.The average GER1 has not changed in the groups between 1985 and1995, except in those with the lowest GER2. Net primary enrolmentrates probably have improved where repetition and over-age enrolmenthave been reduced.10 Gender imbalances in participation at primary levelare not significant between the groups, except in the case of the low-GER1 countries.11
8. These are overall population growth rates. The growth in the school-age cohort may ofcourse be different. Demographic transitions and the effects of HIV may lead to a fall inthese growth rates.
9. This dependency rate is the ratio of 0-14 year-olds as a proportion of 15-65 year-olds.10. Gross enrolment rates can remain unchanged as net enrolment rates increase depending
on the balance between entry-rate increases and changes in repetition, etc.11. Though they remain significant in particular countries.

International Institute for Educational Planning http://www.unesco.org/iiep
The status of secondary schooling in developing countries
27
Secondary GERs follow a different pattern. The mean values ofGER2 for the groups of countries have the values that would be expected.GER2 does not seem to have increased over the past decade in countrieswhere it is lowest (below 40 per cent) and in countries with GER2between 70 per cent and 90 per cent. The greatest gains in participationappear to have been in high-GER2 countries, where the increase has beenfrom 92 per cent to 107 per cent. Gender imbalances in participation atsecondary are only apparent in the very low-GER2 group.
When GER1 and GER2 are compared across the poorestcountries, it is clear that where GER1 is below about 80 per cent, GER2is almost always below about 30 per cent. Above this threshold, GER2varies across a wide range. This reinforces the view that levels of GER2result from policy choices and investment preferences, as well asconstraints on resources (see Chart 2.3).
Chart 2.3 Secondary GER by primary GER – Countries with GNP($PPP) per capita below $PPP 5,000, 1995
Table 2.4 shows that the average length of primary, lower and upper-secondaryschooling does not vary systematically between the groups of countries.
0
20
40
60
80
100
0 20 40 60 80 100 120 140 160Primary GER
Seco
ndar
y G
ER

International Institute for Educational Planning http://www.unesco.org/iiep
Table 2.4 Length of school cycle, pupil/teacher ratio and teachers per 1,000 non-agricultural workers
28
Financing secondary education in developing countries
% GNP allocated % Public expenditure Recurrent expenditureto education 1995 allocated to education as a % of total government
1995 expenditure on education 1995
Very low GER2 3.96 17.90 89Low GER2 5.32 16.86 90Middle GER2 4.70 14.39 91High GER2 5.86 13.33 92
However, average pupil/teacher ratios (PTRs) do show a systematicvariation. High-GER2 countries have lower PTRs at primary andsecondary. PTRs at primary average 17:1 in the high GER2 and 41:1 invery low-GER2 countries. The difference in average PTRs at secondarylevel is much smaller (14:1 to 25:1). It is significant that primary PTRs inlow-GER2 countries are 1.6 times greater than those at secondary, whilst inhigh-GER2 countries the ratio is only 1.2:1. Both these observations haveimplications for the financing of more secondary-school places.
Table 2.5 provides data on expenditure. Low-GER2 countriesappear to allocate a smaller proportion of GNP to education, but largerproportions of government expenditure. There is little systematicdifference in the percentage of recurrent expenditure allocated toeducation between the groups.
Table 2.5 Proportion of GNP and public expenditure allocated toeducation and proportion of expenditure that is recurrent
Length of Length of Length of Pupil/ Pupil/ Pupil/ Pupil/ Teacherprimary- lower- upper- teacher teacher teacher teacher per 1,000
years secondary secondary ratio ratio ratio ratio non-agricul-years years primary primary secondary secondary tural work-
1985 1995 1985 1995 force 1995
Very low GER2 6.3 3.3 3.0 40 41 26 25 44Low GER2 6.1 3.2 3.4 30 29 21 20 45Middle GER2 5.2 3.9 2.9 22 20 16 15 45High GER2 5.6 3.5 3.2 19 17 15 14 40
Table 2.6 shows how allocations to primary, secondary andtertiary vary and how unit costs between levels are distributed. Itsuggests that countries with high GER2 allocate more expenditure onaverage to secondary than do other groups. This observation has to betreated with caution, since this data set contains variable amounts ofunallocated income between levels. The data also only relate to publicexpenditure per student. Private expenditure per student may besubstantial and is likely to vary in magnitude between levels.

International Institute for Educational Planning http://www.unesco.org/iiep
29
The status of secondary schooling in developing countries
% Allocation % Allocation % Allocation Unit cost at Unit cost at Unit cost at Ratio of unit Ratio of unit Ratio of unitto primary to secondary to tertiary primary as secondary as tertiary as costs at costs at costs at
1995 1195 1995 % of GNP/ % of GNP/ % of GNP/ secondary to tertiary to tertiary tocapita capita capita primary secondary primary1995 1995 1995 1995 1995 1995
Very low GER2 48 26 16 11 37 334 3.5 8.8 31.3Low GER2 49 29 19 11 20 102 1.8 4.5 9.2Middle GER2 59 32 17 16 18 44 1.5 3.0 3.4High GER2 48 41 20 19 21 34 1.3 1.8 1.8
Table 2.6 Allocation of expenditure and unit costs by level
The data on public unit costs as a percentage of GNP per capitaindicate that tertiary unit costs are a large multiple of those at lower levelsin very low-GER2 countries – about 31 times greater than primary onaverage. The difference averages less than 2:1 in high-GER countries.The comparison of average unit costs between primary and secondary isstriking. In very low-GER2 countries this averages 3.5:1; in high-GER2countries the public unit cost of secondary is only 1.3 times greater thanprimary. Where the relative cost of secondary-school places is high,increased participation will be more cost-constrained than where it is low.Simply put, secondary-school systems will become much more expensivethan primary in terms of the total budgetary allocation needed, where costratios remain high and mass participation becomes a reality.
Chart 2.4 shows how the ratio of secondary and primary unit costsvaries with GER2. Above about GER2 70 per cent, this ratio is nearlyalways below 2:1. The lower the GER2, the higher the ratio is likely to be.
Chart 2.4 Ratio of secondary to primary unit costs by grossenrolment rate at secondary, 1995
0
1
2
3
4
5
6
0 20 40 60 80 100 120Gross enrolment rate at secondary
Rat
io o
f se
cond
ary
to p
rim
ary
unit
cost
s

International Institute for Educational Planning http://www.unesco.org/iiep
It is evident that there are several possible reasons for thepersistence of low enrolment rates at secondary. Most obviously, countriesdiffer in the priority they give to expanding access to secondaryschooling. This is crudely indicated by the proportion of publicexpenditure allocated to secondary schooling, and the proportion ofGNP this represents. Data on the magnitudes of commitment are verypatchy and not conspicuously reliable. 54 country cases were used tocreate Chart 2.5. This suggests that where allocations to secondary as aproportion of GNP are relatively high, GER2 is also high (R squared =0.31).
Chart 2.5 Public recurrent expenditure on secondary as a % of GNP per capita by gross enrolment rate at secondary, 1995
Different allocations to education as a percentage of GNP have aneffect on participation which is mediated by the level of unit costs forsecondary-school places. The higher these are, the less will be theenrolment for a given proportion of GNP. The extent of the relationshipbetween unit costs at secondary and GER2 is shown for the 80 cases onwhich data are available in Chart 2.6 where GER2 is more than 65 percent, unit costs at secondary are always less than 30 per cent of GNP percapita. Many, but not all, low-GER2 countries tend to have highersecondary unit costs as a percentage of GNP per capita. When theavailable data on public expenditure on education as a percentage ofGNP and secondary unit cost as a proportion of GNP per capita arecorrelated, no association emerges, suggesting that these two variablesbehave largely independently across a wide group of countries.
0
1
2
3
4
0 20 40 60 80 100 120
Gross enrolment rate at secondary
Perc
enta
ge o
f G
NP/
capi
ta a
lloca
ted
to s
econ
dary
sch
oolin
g
30
Financing secondary education in developing countries

International Institute for Educational Planning http://www.unesco.org/iiep
Chart 2.6 Unit cost of secondary as a % of GNP per capita bysecondary GER, 1995
High- and low-cost cases
The macroanalysis can be taken a step further by inspecting thedata on countries with GER2 of less than 80 per cent in terms of highand low unit-cost cases.12 There are insufficient data to repeat thisexercise using the proportion of GNP allocated to secondary education,so total education expenditure as a percentage of GNP has beenincluded. The results are shown below in Tables 2.7 and 2.8.
From these data, it appears that countries with relatively low per-student investment in secondary education as a percentage of GNP havea higher GNP per capita (average = $3,000 compared to $900), but spendless as a proportion of GNP on education (3.4 per cent compared to 5.5per cent). These countries have lower dependency ratios as a result oflower population growth, and have marginally higher gross enrolmentrates at primary.13 The average gross enrolment rate at secondary(GER2) in these countries is 52 per cent compared to 33 per cent in thehigh-cost cases. Low unit-cost countries have a larger proportion of
0
20
40
60
80
0 20 40 60 80 100 120Gross enrolment rate at secondary
Uni
t cos
ts a
t seo
ndar
y as
% G
NP
per
capi
ta
31
The status of secondary schooling in developing countries
12. Low = unit cost at secondary at or below 22 per cent of GNP per capita; High = unit costat secondary at or above 23 per cent.
13. This difference may not be reflected in net enrolment rates if they were available. Assystems develop and repetition and over-age enrolment are reduced, GERs will fall fromvalues over 100.

International Institute for Educational Planning http://www.unesco.org/iiep
female enrolment. The average secondary unit cost as a percentage ofGNP per capita is 13 per cent in low-cost countries and 43 per cent inhigh-cost (or 38 per cent if the outlying case of Malawi is excluded).
Table 2.7 Characteristics of countries with GER2 below 80 per cent –low unit costs at secondary
32
Financing secondary education in developing countries
Country or territory GNP per 0-14 year GER1 GER2 Females Education Education Unit cost capita dependency 1995 1995 as % expenditure expenditure of 1995 1995 % % males as % of as % of secondaryUS$ % secondary GNP public as % GNP
1995 1995 expenditure per capita1995 1995
Dominican Republic 1,460 58 103 41 101 1.9 13 5Guatemala 1,340 85 84 25 87 1.7 18 5Romania 1,480 30 100 78 98 3.2 9 7Zambia 400 97 89 28 93 1.8 9Chile 4,160 46 99 69 98 2.9 14 9Turkey 2,780 49 105 56 95 3.4 9Myanmar 59 103 30 97 1.3 14 10Paraguay 1,690 76 109 38 97 2.9 17 11Colombia 1,910 56 114 67 99 3.5 13 11Thailand 2,740 42 87 55 4.2 20 11Hong Kong 22,990 28 96 75 102 2.8 17 12Iran, IR 86 99 69 93 4.0 18 12Nepal 200 81 110 37 69 2.9 13 12Argentina 8,030 47 113 77 99 4.5 15 12Panama 2,750 54 106 68 5.2 21 13India 340 58 100 49 82 3.5 12 13China 620 39 118 67 98 2.3 14Ecuador 1,390 61 109 50 99 3.4 15Syrian AR 1,120 86 101 44 90 17Trinidad and Tobago 3,770 48 96 72 112 4.5 17Costa Rica 2,610 58 107 50 99 4.5 20 19Mexico 3,320 59 115 58 97 5.3 26 20Malaysia 3,890 65 91 57 101 5.3 16 22Honduras 600 83 112 32 101 3.9 17 22Benin 370 100 72 16 57 3.1 15 22Average 3,042 62 101.5 52.3 94 3.4 16.2 13

International Institute for Educational Planning http://www.unesco.org/iiep
The status of secondary schooling in developing countries
33
Table 2.8 Characteristics of countries with GER2 below 80 per cent – high unit cost at secondary
Country GNP per 0-14 year GER1 GER2 Females Education Education Unit cost or territory capita dependency 1995 1995 as % expenditure expenditure of
1995 1995 % % males as % of as % of secondaryUS$ % secondary GNP public as % GNP
1995 1995 expenditure per capita1995 1995
Albania 670 50 101 35 102 3.4 23Oman 4,820 94 80 66 95 4.6 15 23Tunisia 1,820 58 116 61 94 6.8 17 23Maldives 990 94 134 49 97 8.4 14 24Lao PDR 350 86 107 25 74 2.4 25Jamaica 1,510 51 109 66 99 8.2 8 25Gambia 320 73 73 22 86 5.5 16 28Swaziland 1,170 79 122 52 95 8.1 22 29Belize 2,630 77 121 49 95 6.1 21 29Mongolia 310 68 88 59 103 5.6 34Mali 250 95 32 9 64 2.2 35Guinea 550 94 48 12 54 38Comoros 470 91 78 19 84 3.9 21 39Zimbabwe 540 84 116 44 97 8.5 39Togo 310 90 118 27 69 5.6 19 42Namibia 2,000 79 133 62 102 9.4 21 44Kenya 280 90 85 24 100 7.4 47Morocco 1,110 61 83 39 76 5.6 23 51Lesotho 770 78 99 28 114 5.9 51Mauritania 460 80 78 15 85 5.0 16 59Ethiopia 100 90 31 11 62 4.7 13 62Burundi 160 92 70 7 82 2.8 69Malawi 170 93 135 6 90 5.7 15 145
Average 946 80 94 34 88 5.7 17.2 43
It is probable that some of the differences between the high- andlow-cost groups of countries are the result of different patterns offunding. GER2s in the low unit-cost countries can be relatively high if asubstantial proportion of the total cost of secondary-school places isbeing borne privately.14 There are no reliable data on the extent to whichthis is so, partly because patterns of public subsidy of private systems arecomplex and partly because data are often simply not collected.
14. In some countries national data do not adequately account for expenditure at the locallevel from local authorities, e.g. China. Where this is the case it will also be true thatGER2 can be higher than it would be if financed solely from national-level funding.

International Institute for Educational Planning http://www.unesco.org/iiep
There is food for thought in the observation that the high unit-costcountries do have lower GER2s, and have much lower GNP per capita,than the low unit-cost countries. Many of the highest unit-cost countriesare in Africa. High public-unit costs generally arise from relatively highsalary levels and from low PTRs. Salary levels in themselves must bejudged in relation to national labour markets and the cost of living. Itmay well be necessary to pay relatively high salary costs as a proportionof GNP per capita in countries where groups of teachers comparethemselves with those working in small, relatively well-paid modernsectors. Secondary-school teachers often have skills that qualify themfor alternative employment in such jobs. There may or may not be moreroom to manoeuvre in relation to PTRs. Secondary schools are run atteacher-per-class ratios that vary between about 1.5:1 and over 3:1. Inthe latter case, PTRs will be much lower than in the former, and unitcosts much higher. These will act as a brake on increased participation.
The discussion above does not explore the magnitude of privatecontributions or the relationships that may exist between public andprivate financing of secondary schooling. Clearly these can be verysignificant in determining levels of participation associated with givenlevels of public investment. In some countries the principle of privatecontributions is well established and a large proportion of total recurrentcosts may be met outside the public budget; in others, privatecontributions are neither expected nor offered, except on the margin. Itis unclear, and likely to be country specific, how the propensity tocontribute privately varies with changes in the level of public investment.It is probable that, other things being equal, the availability of privatefinance is likely to be most constrained in the low GNP-per-capitacountries, though of course part of the ability to contribute will bedetermined by patterns of income distribution.
The last issue regarding the status of secondary schooling indifferent countries relates to demography. Table 2.2 indicates thatdependency rates are highest in the low-GER2 countries and that mostof these countries are in Africa. Many countries in other parts of theworld have undergone demographic transitions to low growth, such thatthe school-age population is a small proportion of the working-agegroup and that the total number of school-age children is increasingslowly or not at all.
In some cases (e.g. Hong Kong, Taiwan, Republic of Korea, SriLanka, Singapore), the school-age population will decline. This will easethe burden of universal enrolments at primary and secondary as thedependency rate decreases. In the low-GER2 countries, population
34
Financing secondary education in developing countries

International Institute for Educational Planning http://www.unesco.org/iiep
growth of the school-age cohort has averaged around 3 per cent over thelast decade. If this continues, school populations will double in less than25 years and dependency rates will remain high.
Most critical to this prognosis is the impact on the school-agepopulation and dependency rates of high rates of HIV infection. Thereare no systematic and representative data that would enable accurateprojections to be made. However, there are many indications that thismay be the single-most serious problem that will affect the capacity tosustain and improve rates of schooling at primary and secondary levelsin some countries. The AIDS Assessment Study undertaken by the WorldBank in Malawi in 1988, indicated that by 1997 about 10 per cent of thecohort of education staff might have died from AIDS and that mortalitywould reach 40 per cent by 2005. The current Plan ImplementationFramework assumes teacher attrition of 11 per cent annually, much ofwhich is due to HIV/AIDS. In Francistown, Botswana, an HIV infectionrate close to 50 per cent has been reported and one-third of pregnantmothers tested in Zimbabwe in 1995 were HIV-positive (Cohen, 1999).
It is not necessary to have precise data to indicate the mostsignificant consequences of high rates of HIV. The first effects are todiminish the size of the teaching force and the effective length ofteaching careers, since rates of infection in Africa are typically highestamongst those in the 20-30 year-old age group. If attrition in this groupreaches 3 per cent, half will have died within 14 years. This carries verysignificant implications for teacher supply and training. Over time, itmay be that the rate of school-age population growth declines, sincethere will be fewer reproductively active adults and because a proportionof children will die from maternal transmission before reaching schoolage. It seems likely that in the short term, dependency rates will increasedramatically and that the proportion of orphaned children will increase.The following charts contrast the demographic situation in populationswith high growth population rates and increasing mortality amongst theaged (Chart 2.7), demographic transition to low population growth(Chart 2.8), and demographic collapse related to HIV (Chart 2.9). Theboxes on the charts show the size of the school-age population and theworking-age population.
35
The status of secondary schooling in developing countries

International Institute for Educational Planning http://www.unesco.org/iiep
Chart 2.7 Population pyramid – High growth – Low life expectancy
Chart 2.8 Population pyramid – Demographic transition to low growth
0 200,000 400,000 600,000 800,000 1,000,0001
10
19
28
37
46
55
64
73
82
91
Age
Number
Working Age
School Age
0 200,000 400,000 600,000 800,000 1,000,0001
10
19
28
37
46
55
64
73
Age
Number
School Age
Working Age
36
Financing secondary education in developing countries

International Institute for Educational Planning http://www.unesco.org/iiep
Chart 2.9 Population pyramid – Demographic contraction
From these charts it is evident that dependency rates could reach highlevels in countries where mortality is high amongst young adults. Theconstraints on expansion of primary and secondary schooling willbecome those of teacher supply. It remains unclear exactly how HIV andAIDS will have an impact on the demographic characteristics, since amyriad of parameters will affect how infection will spread and what itsconsequences will be. The latest United Nations estimates (UnitedNations, 1998) make this clear. There are considerable uncertaintiesabout the rate of infection, the level at which it may peak in differentcountries, and the length of time between infection and the developmentof full-blown AIDS.
It is possible that pessimistic projections of mortality rates willprove unfounded if health education campaigns are successful. However,in those countries worst affected, it is clear that significant demographicchanges are likely and are already happening. These will shape both thenature of the challenge of increasing secondary enrolments and themethods through which expansion can be sustained. They will alsochange important characteristics of secondary-school students, who aremore likely to be orphans and/or have family responsibilities towardssiblings.
The next chapter extends this descriptive analysis to considerwhether increased participation in secondary schooling is likely to befinancially viable in different countries.
0 200,000 400,000 600,000 800,000 1,000,0001
10
19
28
37
46
55
64
73
Age
Number
School Age
Working Age
37
The status of secondary schooling in developing countries

International Institute for Educational Planning http://www.unesco.org/iiep
This chapter looks forward to analyze the prospects for increasedsecondary participation. The first section models different types ofcountries in a generic way. The second part uses available data todevelop insights into the nature of the financial challenge in differentcountries. The concluding remarks outline the major factors that willdetermine progress over the next decade.
1. Some projections
Projections can be developed illustrating the challenge thatconfronts countries which have low GER2s and which wish to increasethem. An enrolment-driven projection model has been used to simulatevarious scenarios based on exemplary data derived from the UNESCOdatabase. Three variants – Simulations 1, 2 and 3 – have been createdwith the baseline characteristics shown in Figure 3.1.
Simulation 1 uses data typical of low-GER2 countries in sub-Saharan Africa, where GER1 is also low. In these countries, lowparticipation at primary and secondary is accompanied by high rates ofrepetition and drop-out, and low transition rates into secondary.Population growth is high and the ratio of secondary to primary unitcosts is typically over 3.5:1 – in some cases very substantially so.
Simulation 2 is illustrative of those countries which have nearlyreached GER1 = 100 per cent, but still have GER2s which are below40 per cent. These countries have somewhat lower repetition and drop-out rates, but many retain high population growth rates. This profile alsoresonates with a number of sub-Saharan African countries and some inother regions with low GER2s.
Simulation 3 uses data more typical of countries with higherGER2s around 65 per cent that have achieved GER1 of close to 100 percent. In these countries, population growth is usually lower, as arerepetition and drop-out rates. Most of these countries are outside Africa.
39
Chapter III
Are higher secondary enrolment ratesachievable?Keith M. Lewin

International Institute for Educational Planning http://www.unesco.org/iiep
The simulations have been run from these baseline data to explorethe behaviour of GERs and recurrent costs over a 15-year period undera number of different conditions. The basic assumptions are thatrepetition and drop-out rates can be halved over the next 10 yearsthrough measures to improve access and quality. Reduced repetitioncreates savings, since pupils spend less time enrolled to reach a givengrade. Reductions in drop-out create additional costs as a result ofgreater enrolment.
The model is configured with a six-year primary cycle and a six-year secondary cycle. This seemed the most straightforwardapproximation to make and represents the most common pattern. TheGERs calculated relate to these cycles. In principle, there are severaldifferent patterns that could exist at secondary level, depending on howenrolments are distributed between lower and upper secondary. Clearly,if enrolments at secondary are concentrated at lower secondary, and ifcosts at this level are lower than in upper secondary, higher GERs atlower secondary could be obtained than if enrolment is evenlydistributed across all secondary grades.
The model generates costs from the flow of students and estimatesof the cost per pupil at different levels. For ease of interpretation theresults are presented in terms of multiples of the recurrent cost in thebase year from which the model starts. Higher education allocations arenot included in the model.1
The implications for educational expenditure as a proportion ofGNP and as a proportion of total public expenditure will depend on hownational economies grow. If real GNP does not grow (implying adeclining GNP per capita as population increases), all the increase in realcosts would need to be found from an increase in the proportion of GNPallocated to education. If GNP grew at 3 per cent per year, the same aspopulation growth in the base model, then the national education budgetwould be 1.5 times larger in real terms after 15 years, assuming itretained the same share of public expenditure.2 This needs to be borne inmind when interpreting the results below. In sum, 3 per cent growthwould allow sustainable financing at current levels of allocation forgrowth in public costs of education of 1.5 times.
40
Financing secondary education in developing countries
1. Higher education costs could easily be included. The difficulty is to decide whatassumptions would be reasonable for a 15-year period given the widely different currentparticipation rates and investment levels.
2. Implicitly this assumes that government expenditure remains the same proportion ofGNP over the projection period.

International Institute for Educational Planning http://www.unesco.org/iiep
Are higher secondary enrolment rates achievable?
41
Figure 3.1 Baseline data for simulations
Parameter Simulation 1 Simulation 2 Simulation 3Low GER1 and low High GER1 and low High GER 1 and
GER2 (14%) GER2 (36%) middle-level GER2 (65%)
High population growth, High population growth, Low population growth,low primary and high primary GER, high primary GER,secondary GER; low secondary GER, middle-level secondary
high unit-cost ratio high unit-cost ratio GER, low unit-cost ratiosecondary primary secondary primary secondary primary
Population growth 3.0% 3.0% 2.0%Primary GER 63% increasing to 95% increasing to 97% increasing to
100% over 10 years 100% over 10 years 100% over 10 yearsInitial secondary GER 14% 36% 65%Unit cost ratio of secondary to primary 3.6 3.6 2.0PrimaryPrimary entry rate 70% 110% 110%Repetition 25% 15% 5%Promotion 66% 77% 90%Drop-out 9% 8% 5%Pupil/teacher ratio 50 36 32Teacher attrition 10% 10% 10%SecondarySecondary transition 50% increasing to 60% increasing to 80% increasing to rate 100% over 10 years 100% over 10 years 100% over 10 yearsRepetition 15% 10% 5%Promotion 65% 8% 90%Drop-out 15% 10% 5%Pupil/teacher ratio 28 22 19Teacher attrition 10% 10% 10%
In the case of Simulation 1, it is assumed that the GER1 will beincreased to reach 100 per cent over the next 10 years, implying thatenough places will be made available for the relevant primary age group.This has already been achieved in the other simulations. It is consistentwith the widespread acceptance of Education for All policy. It is furtherassumed that the transition rates into lower secondary are increased over10 years to reach 100 per cent to ascertain what the effect of this wouldbe on GER2s and costs.

International Institute for Educational Planning http://www.unesco.org/iiep
The resulting changes in GER1 and GER2, and of primary andsecondary recurrent expenditure, are shown below. Charts 3.1 and 3.2relate to Simulation 1 (Low GER1 and Low GER2 countries), Charts 3.3and 3.4 relate to Simulation 2 (High GER1 and Low GER2) and Charts3.5 and 3.6 relate to Simulation 3 (High GER1 and Medium GER2).
Simulation 1 shows primary GERs reaching 100 per cent afterabout 10 years and secondary GERs climbing to exceed 60 per cent after15 years. After six years, the costs of secondary schooling exceed thoseof the primary system. The costs of this rate of expansion in access areclearly unsustainable. Total recurrent expenditure for primary andsecondary would have to multiply by more than four times in real terms.If economic growth averaged an optimistic 3 per cent, and the educationbudget increased at this rate, the allocation for education would grow byonly 50 per cent.
In Simulation 2, secondary GERs reach 80 per cent after 15 years.At the end of this period, expenditure would have to increase by2.5 times in real terms. This also seems unrealistic. With 3 per cent realgrowth in the education budget, there would still be a shortfall inresources available, equivalent to the cost of the whole system in thebase year. In this simulation, the cost of the secondary-school system isalways more than that of primary, since the smaller numbers enrolled atsecondary are more than compensated for by the higher unit costs.
Simulation 3 illustrates situations which are likely to befinancially sustainable. In this case, GER2 reaches 80 per cent in lessthan 10 years. At this point, the increase in expenditure needed wouldonly be about 1.5 times current levels. The secondary-school system ismore expensive in total throughout the projection period, but thedifference is much less than in Simulation 2. If economic growth was ofthe order of 3 per cent and the education budget remained the sameproportion of public expenditure and GNP, the budget would balance.
42
Financing secondary education in developing countries

International Institute for Educational Planning http://www.unesco.org/iiep
Chart 3.1 Simulation 1: Gross enrolment rates at primary andsecondary
Chart 3.2 Simulation 1: Recurrent costs for primary and secondary as proportion of total base-year costs
0
1
2
3
4
2000 2002 2004 2006 2008 2010 2012 2014
Year
Rec
urre
nt c
ost a
s %
of
base
yea
r
Primary recurrent Secondary recurrent Total recurrent costs
0%
20%
40%
60%
80%
100%
120%
2000 2002 2004 2006 2008 2010 2012 2014Year
Gro
ss e
nrol
men
t rat
es
Primary GER
Secondary GER
43
Are higher secondary enrolment rates achievable?

International Institute for Educational Planning http://www.unesco.org/iiep
44
Financing secondary education in developing countries
Chart 3.3 Simulation 2: Gross enrolment rates at primary andsecondary
Chart 3.4 Simulation 2: Recurrent costs for primary and secondary as proportion of total base-year costs
0
1
2
3
4
2000 2002 2004 2006 2008 2010 2012 2014Year
Rec
urre
nt c
ost a
s pr
opor
tion
of b
ase
year
Primary recurrent Secondary recurrent Total recurrent costs
0%
20%
40%
60%
80%
100%
120%
2000 2002 2004 2006 2008 2010 2012 2014Year
Gro
ss e
nrol
men
t rat
es Primary GER
Secondary GER

International Institute for Educational Planning http://www.unesco.org/iiep
Are higher secondary enrolment rates achievable?
45
Chart 3.5 Simulation 3: Gross enrolment rates at primary andsecondary
Chart 3.6 Simulation 3: Recurrent costs for primary and secondary as proportion of total base-year costs
0
1
2
3
4
2000 2002 2004 2006 2008 2010 2012 2014
Year
Rec
urre
nt c
ost a
s pr
opor
tion
of b
ase
year
Primary recurrent Secondary recurrent Total recurrent costs
0%
20%
40%
60%
80%
100%
120%
2000 2002 2004 2006 2008 2010 2012 2014Year
Gro
ss e
nrol
men
t rat
es
GER Secondary
GER Primary

International Institute for Educational Planning http://www.unesco.org/iiep
It is evident that the more favourable starting conditions inSimulation 3 – lower population growth and relatively lower unit costsof secondary-school places – allow projected outcomes that providefairly universal secondary participation at sustainable cost. The questionis what might be done to allow countries with the characteristics ofSimulations 1 and 2 to improve participation at secondary at realisticcost levels? The cases are different, since Simulation 1 has the additionalburden of the need to increase gross enrolment rates at primary to moreacceptable levels.
Simulation 1 was re-run maintaining a commitment to reach GER1= 100 per cent over 10 years, restricting the increase in the transition ratefrom primary to secondary to an upper limit of 60 per cent after 10 years.The result was that recurrent expenditure on primary and secondary wouldhave to increase by a factor of three. GER2 would climb slowly to over 30per cent after 10 years as a result of the changes in the primary-completingcohort, arising from reduced repetition and drop-out. If the target forGER1 is reduced to 90 per cent over 15 years, the increase in recurrentcosts is 2.7 times, and GER2 remains below 30 per cent after 10 years.
If the unit costs of secondary relative to primary were reduced fromthe baseline value of 3.6:1 to a ratio of 2:1, this would not have mucheffect in Simulation 1. The multiplier for overall costs drops to about 2.7to 2.5 times current costs for the same gains in GER1 and GER2. Thereason is that secondary-school enrolments are so low that they accountfor a small proportion of total school recurrent costs. These costs remainabove the level that would seem achievable, except in countries where theproportion of GNP allocated to education is very low.
A similar series of changes were modelled using Simulation 2. Ifthe baseline version is modified to restrict the transition rate intosecondary to an upper limit of 80 per cent after 10 years, costs increaseby 2.2 times over the full projection period, and GER2 climbs to nearly65 per cent. If unit costs in this system developed in such a way that theratio of secondary to primary fell to 2:1, and GER1 = 100 per cent wereretained as a target, the result would fall to twice current costs.
In the long run, the rate of population growth in the school-agecohort will be the underlying determinant of growth in expenditure. It ispossible this may fall. A demographic transition has been occurring inmany developing countries outside Africa. This has seen growth ratesfall below 2 per cent on a declining trend and has dramatically reduceddependency rates. The effects of this can be projected. Populationgrowth was assumed to fall from 3 per cent to about 1.5 per cent over thenext 15 years for Simulations 1 and 2.
46
Financing secondary education in developing countries

International Institute for Educational Planning http://www.unesco.org/iiep
After reducing the GER1 target to 90 per cent and thesecondary/primary unit-cost ratio to 2:1, as described above, the resultfor Simulation 1 is that the increase in expenditure needed falls to 2.3times current expenditure. In Simulation 2, the effect is also marginal,reducing increased costs to just over 1.9:1. The main reason for the lackof impact of this change is that the effects of demographic transition arefelt over the long term. In Simulations 1 and 2, the effects of increasingGER1 and GER2 are dominant. As these approach high levels, theeffects of population growth will become the dominant influence ongrowth in expenditure. This occurs largely beyond the projection period.
If population growth fell rapidly there would be a greater effect oncost. If it is assumed that cohort growth falls from 3 per cent to 1 per centin the first five years, then the effect on Simulation 1 is that costs fallfrom 2.3 times to twice current costs. In Simulation 2, the effect is a fallto 1.7 times current costs.
It is clear that countries with the characteristics of Simulation 1face difficult choices and are those that are most in need of externalassistance. Even with such assistance their task is formidable. Sharplydefined choices have to be made. These include those concerned withsetting achievable targets for GER2, judging at which point to trade offthe rate of achievement of GER1 100 per cent against the need to increaseGER2 from exceptionally low levels; re-examining whether unit costs atsecondary can be reduced to allow expansion; and finding ways ofincreasing internal efficiency, especially through reductions in drop-out.
The situation in countries resembling Simulation 2 is moreoptimistic. Here, GER1 = 100 per cent has nearly been achieved and netenrolment rates are likely to continue to improve as a result of reductionsin repetition and drop-out. If a more modest target for GER2 wereadopted than GER2 = 100 per cent – say an increase from 36 per cent to70 per cent after 15 years – and unit costs at secondary fell to twiceprimary unit costs, the growth in total educational expenditure neededwould be adjusted downwards to less than twice current levels. Thiscould be in reach if economic growth is sustained and secondaryinvestment is emphasized. However, in many sub-Saharan Africancountries, growth in GNP per capita has been negative in the 1990s (seebelow). The outcomes from these simulations need to be adjusted torecognize this if it is thought that growth will remain elusive.
47
Are higher secondary enrolment rates achievable?

International Institute for Educational Planning http://www.unesco.org/iiep
2. An overview of the challenge
Some consolidation of the analysis is now needed. Participationrates in secondary schooling are determined by the extent to whichgovernments wish to prioritize investment at this level and by the extentto which they can. The basic parameters related to public expenditurewhich determine participation (as measured by GER2) are well known(Colclough with Lewin, 1993:45). They are:
• Public expenditure on secondary education as a percentage ofGNP (x);
• Public recurrent expenditure on secondary schooling per studentas a percentage of GNP per capita (c);
• The proportion of the population of secondary school age (a);• Thus GER2= x/ac.
The GER2 which is actually achieved will also depend on theproportion of GNP that private households spend on secondary schoolingand its interaction with public costs. This obviously varies widely, and isimpossible to incorporate into general modelling since no robust data areavailable across countries, as noted above. If it is assumed that the cost ofmost school places is largely borne by the state and that private householdexpenditure is largely allocated to other costs (additional private tuition,travel and food, additional learning materials, etc.), then this will not havea significant effect on the basic equation. Where fees and privatecontributions are a significant source of finance for school places this willnot be true. In the absence of any alternative, and because it is likely tobe true that the first set of assumptions holds in the majority of countrieswith low secondary GERs, we can proceed using the basic relationship.
The values of GER2, x, c, and a are shown below in Tables 3.1 and3.2 for countries with GER2 less than 40 per cent and between 40 per centand 70 per cent. We can note that low-GER2 countries have an averageGER2 of only 22 per cent. Public expenditure on secondary education (x)averages 0.86 per cent of GNP compared to 1.41 per cent in mid-rangeGER2 countries. Costs per secondary student as a percentage of GNP percapita (c) are typically twice as much in low-GER2 countries than in mid-GER2 countries. However, the proportion of secondary school age childrenin the population is similar between low- and mid-GER2 countries. It is clearthat in some cases low GER2 is associated with both low levels of allocationand high unit costs. There are also examples where one or the other is thedominant reason for low GER2. Chapter 11 explores the implications forpolicy of different combinations of the parameters that determine GER2.
48
Financing secondary education in developing countries

International Institute for Educational Planning http://www.unesco.org/iiep
Table 3.1 GER2, x, c, and a for countries with GER2 below 40 percent
49
Are higher secondary enrolment rates achievable?
GER2 x c aGross enrolment Public expenditure Public recurrent The proportion ofrate at secondary on secondary as expenditure on the population of
% of GNP secondary per secondary-schoolstudent as % of ageGNP per capita
Malawi 6 0.77 145 0.09Burundi 7 0.66 69 0.14Mali 9 0.40 35 0.13Chad 9 0.44 33 0.15Ethiopia 11 0.84 62 0.12Guinea 12 0.68 38 0.15Mauritania 15 1.24 59 0.14Benin 16 0.54 22 0.15Comoros 19 1.10 39 0.15Vanuatu 20 1.39 49 0.14Gambia 22 0.80 28 0.13Kenya 24 1.15 47 0.10Guatemala 25 0.17 5 0.14Lao PDR 25 0.79 25 0.13Togo 27 1.77 42 0.16Zambia 28 0.29 9 0.12Lesotho 28 1.57 51 0.11Myanmar 30 0.39 10 0.13El Salvador 32 0.13 5 0.08Honduras 32 0.78 22 0.11Nepal 37 0.47 12 0.11Paraguay 38 0.54 11 0.13Morocco 39 2.74 51 0.14Average 22 0.86 38 0.13

International Institute for Educational Planning http://www.unesco.org/iiep
Table 3.2 GER2, x, c, and a for countries with GER2 between 40and 70 per cent
50
Financing secondary education in developing countries
GER2 x c aGross enrolment Public expenditure Public recurrent The proportion ofrate at secondary on secondary as expenditure on the population of
% of GNP secondary per secondary-schoolstudent as % of ageGNP per capita
DominicanRepublic 41 0.17 5 0.08Zimbabwe 44 2.22 39 0.13Syria 44 1.14 17 0.15Belize 49 1.40 29 0.10India 49 0.94 13 0.15Maldives 49 1.81 24 0.15Costa Rica 50 0.99 19 0.10Ecuador 50 1.01 15 0.13Swaziland 52 1.79 29 0.12Thailand 55 0.72 11 0.12Turkey 56 0.69 9 0.14Malaysia 57 1.77 22 0.14Mexico 58 1.59 20 0.14Mongolia 59 3.25 34 0.16Tunisia 61 2.17 23 0.15Namibia 62 2.95 44 0.11Jamaica 66 2.39 25 0.15Oman 66 2.02 23 0.13Colombia 67 0.93 11 0.13China 67 0.74 14 0.08Panama 68 1.08 13 0.12Chile 69 0.43 9 0.07Iran 69 1.33 12 0.16Trinidad and Tobago 72 1.37 17 0.11Hong Kong 75 0.93 12 0.10Argentina 77 0.90 12 0.10Average 59 1.41 19 0.12

International Institute for Educational Planning http://www.unesco.org/iiep
Are higher secondary enrolment rates achievable?
51
It is possible to estimate what would be the costs of achievinghigher levels of GER2 in different countries using a simple model basedon existing unit costs and values for GER2. The procedure is as follows:
since GER2 = x/ac then x = GER2(ac)
Thus, x (the proportion of GNP spent on secondary schooling) canbe calculated from knowledge of GER2 (the secondary GER), a (theproportion of the population of secondary-school age) and c (publicrecurrent expenditure on secondary schooling per student as a percentageof GNP per capita). This will give the current value of x needed to supportthe existing secondary gross enrolment rate. We can then calculate whatvalue of x would be needed if secondary gross enrolment rates were to betargeted at 60 per cent, 80 per cent or 100 per cent by multiplying thecurrent value of x by the ratio of target to current GER2. The result willbe a series of values for x indicating what levels of allocation would beneeded to reach the target enrolment rates without changes in the coststructure of secondary provision. This gives an indication of themagnitude of the challenge faced by different countries.
Table 3.3 shows the results of undertaking these calculations onthe data available for African countries with GER2 below 70 per cent.Other regions are included in Tables 3.4 and 3.5.

International Institute for Educational Planning http://www.unesco.org/iiep
Table 3.3 Expenditure on secondary education as a proportion ofGNP needed to reach enrolment targets – Africa
52
Financing secondary education in developing countries
1 2 3 4 5 6 7 8 9 103
GER1 GER2 Popu- GNP/ Education x= % GNP % GNP % GNP % GNP% % lation capita expendi- GER2 (ac) needed needed needed needed
‘000 1995 ture as for for for forUS$ % GNP GER2 GER2 GER2 GER1
1995 60 80 100 100Tanzania 67 5 30,026 120Malawi 135 6 9,673 170 5.7 0.8 7.7 10.2 12.8 2.7Burundi 70 7 6,064 160 2.8 0.7 5.7 7.6 9.5 2.0Chad 55 9 6,335 180 2.2 0.4 2.9 3.9 4.8 1.6Mali 32 9 10,795 250 2.2 0.4 2.7 3.5 4.4 2.7Ethiopia 31 11 56,404 100 4.7 0.8 4.6 6.1 7.6 5.7Guinea 48 12 7,349 550 1.8 0.7 3.4 4.6 5.7 1.8Mauritania 78 15 2,274 460 5.0 1.2 5.0 6.6 8.3 1.9Benin 72 16 5,409 370 3.1 0.5 2.0 2.7 3.4 2.0Comoros 78 19 612 470 3.9 1.1 3.5 4.6 5.8 1.3Gambia 73 22 1,111 320 5.5 0.8 2.2 2.9 3.7 1.7Kenya 85 24 27,150 280 7.4 1.1 2.9 3.8 4.8 3.6Togo 118 27 4,085 310 5.6 1.8 3.9 5.2 6.5 2.0Lesotho 99 28 2,027 770 5.9 1.6 3.4 4.5 5.6 2.6Zambia 89 28 8,081 400 1.8 0.3 0.6 0.8 1.0 0.8Morocco 83 39 26,524 1,110 5.6 2.7 4.2 5.6 7.0 1.7Zimbabwe 116 44 11,190 540 8.5 2.2 3.0 4.0 5.1 4.9Swaziland 122 52 857 1,170 8.1 1.8 2.1 2.8 3.5 2.2Tunisia 116 61 8,987 1,820 6.8 2.2 2.1 2.8 3.5 2.5Namibia 133 62 1,536 2,000 9.4 2.9 2.9 3.8 4.8 4.1Average4 85.9 28.2 743.2 5.8 1.4 3.8 5.1 6.3 2.9
3. Column 10 represents the proportion of GNP that needs to be allocated to achieve GER1of 100 per cent. In cases where GER1 = 100 per cent has already been achieved, theproportion needed to sustain the current GER has been substituted for the calculatedvalue. If this adjustment were not included, the values for cases of GER greater than 100would be less.
4. Here and elsewhere averages are unweighted unless otherwise stated.

International Institute for Educational Planning http://www.unesco.org/iiep
Table 3.4 Expenditure on secondary education as a proportion ofGNP needed to reach enrolment targets – Central Americaand the Caribbean and South America
53
Are higher secondary enrolment rates achievable?
1 2 3 4 5 6 7 8 9 10GER1 GER2 Popu- GNP/ Education x= % GNP % GNP % GNP % GNP
% % lation capita expendi- GER2 (ac) needed needed needed needed‘000 1995 ture as for for for for
US$ % GNP GER2 GER2 GER2 GER11995 60 80 100 100
Guatemala 84 25 10,621 1,340 1.7 0.2 0.4 0.6 0.7 1.0El Salvador 88 32 5,662 1,610 2.2 0.1 0.2 0.3 0.4 1.3Honduras 112 32 5,654 600 3.9 0.8 1.5 2.0 2.4 1.8DominicanRepublic 103 41 7,823 1,460 1.9 0.2 0.2 0.3 0.4 0.7Belize 121 49 213 2,630 6.1 1.4 1.7 2.3 2.9 2.8Costa Rica 107 50 3,424 2,610 4.5 1.0 1.2 1.6 2.0 1.5Mexico 115 58 91,145 3,320 5.3 1.6 1.6 2.2 2.7 1.9Jamaica 109 66 2,468 1,510 8.2 2.4 2.2 2.9 3.6 1.3Panama 106 68 2,631 2,750 5.2 1.1 0.9 1.3 1.6 1.4Trinidad and Tobago 96 72 1,287 3,770 4.5 1.4 1.1 1.5 1.9 1.6Paraguay 109 38 4,828 1,690 2.9 0.5 0.9 1.1 1.4 1.2Ecuador 109 50 11,460 1,390 3.4 1.0 1.2 1.6 2.0 0.9Colombia 114 67 35,814 1,910 3.5 0.9 0.8 1.1 1.4 0.9Chile 99 69 14,210 4,160 2.9 0.4 0.4 0.5 0.6 1.5Argentina 113 77 34,768 8,030 4.5 0.9 0.7 0.9 1.2 1.4Average 105.9 53.4 2,436 4.1 0.92 1.01 1.35 1.68 1.42

International Institute for Educational Planning http://www.unesco.org/iiep
Table 3.5 Expenditure on secondary education as a proportion ofGNP needed to reach enrolment targets – Asia andOceania
54
Financing secondary education in developing countries
Tables 3.3, 3.4 and 3.5 are illustrative of the financial challenge.The results clearly have to be approached with caution, since there areuncertainties in the basic data used to create the key variables andcompute the proportion of GNP needed to finance different levels ofsecondary enrolment. The averages used for unit costs may not bereliable or an accurate indication of the cost of additional places. Whereprivate finance is a significant element in total costs at secondary level,the calculations assume that the cost of increased participation wouldcontinue to be shared in the same ways as is currently the case. This, ofcourse, may not be true if expanded access attracted those who were lesswilling or less able to pay substantial private costs.
1 2 3 4 5 6 7 8 9 10GER1 GER2 Popu- GNP/ Education x= % GNP % GNP % GNP % GNP
% % lation capita expendi- GER2 (ac) needed needed needed needed‘000 1995 ture as for for for for
US$ % GNP GER2 GER2 GER2 GER11995 60 80 100 100
Lao PDR 107 25 4,882 350 2.4 0.8 1.9 2.5 3.2 0.7Myanmar 103 30 45,106 1.3 0.4 0.8 1.0 1.3 0.5Nepal 110 37 21,456 200 2.9 0.5 0.8 1.0 1.3 1.1Syrian AR 101 44 14,203 1,120 1.1 1.6 2.1 2.6 1.5Maldives 134 49 254 990 8.4 1.8 2.2 2.9 3.7 2.4India 100 49 929,005 340 3.5 0.9 1.1 1.5 1.9 1.3Thailand 87 55 58,242 2,740 4.2 0.7 0.8 1.1 1.3 1.3Turkey 105 56 60,838 2,780 3.4 0.7 0.7 1.0 1.2 1.3Malaysia 91 57 20,140 3,890 5.3 1.8 1.9 2.5 3.1 1.4Mongolia 88 59 2,463 310 5.6 3.2 3.3 4.4 5.5 1.1Oman 80 66 2,207 4,820 4.6 2.0 1.8 2.4 3.1 2.3China 118 67 1,220,224 620 2.3 0.7 0.7 0.9 1.1 0.5Iran 99 69 68,365 4.0 1.3 1.2 1.5 1.9 1.0Hong Kong 96 75 6,123 22,990 2.8 0.9 0.7 1.0 1.2 0.5Vanuatu 106 20 169 1200 4.9 1.4 4.2 5.6 7.0 2.2Average 99.9 51.4 2,912 4.16 1.15 1.48 1.97 2.46 1.66

International Institute for Educational Planning http://www.unesco.org/iiep
Nevertheless, the results are instructive and provocative. Tosimplify matters this discussion focuses on Table 3.3 – the African case.Column 6 shows that average values of x are currently about 1.4 per centGNP. They are often below 1 per cent for the lowest GER2 countries. Itis immediately clear from column 7 that the proportions of GNP whichwould have to be allocated to secondary schooling to reach a target ofGER2 of 60 per cent are high, and in many cases unlikely to be feasible.The average amounts needed are 3.8 per cent of GNP across all thecountries. If targets are set at 80 per cent and 100 per cent (columns 8and 9), the average increases to 5.1 per cent and 6.3 per cent.
Column 10 shows the proportion of GNP needed to achieve GER1= 100 per cent, which in cases where GER1 is below 100 will representan increase over current levels. If these values are combined with thosein columns 7, 8 or 9 the sum will be the total allocation needed for theschool system. Clearly there are a number of countries where the sum ofcolumns 7 and 10 exceeds the current level of educational spending as aproportion of GNP (column 5). If this is low, there may be scope forincreased allocation. If this is high, then expansion is clearly cost-constrained.
The averages cited are probably underestimates. In the Africandata set, several of the countries with the lowest GER2s have beenexcluded as there are no data. Their inclusion would raise the averageamounts needed substantially. Second, the proportion of GNP actuallyneeded to achieve targets will depend partly on growth in GNP. If percapita GNP declines, the estimates of the proportions needed would needto be increased.
GNP per capita has not been growing in much of sub-SaharanAfrica. For the countries on which there are data, the average change inGNP per capita from 1990-1996 was -0.5 per cent. Charts 3.7 and 3.8show how GNP per capita growth rates are associated with 1995 GERsat primary and secondary. Chart 3.9 shows how GER2s have changedbetween 1985 and 1995 in relation to GNP per capita.
55
Are higher secondary enrolment rates achievable?

International Institute for Educational Planning http://www.unesco.org/iiep
Chart 3.7 GER1 1995 by growth in GNP per capita 1990-1996 –Africa
Chart 3.8 GER2 1995 by growth in GNP per capita 1990-1996 –Africa
40
60
10
30
40
50
60
70
-10 -5 0 5 10 15Growth in GNP per capita 1990-96
GE
R2
80
0
2020
120
20
40
60
100
120
140
-10 -5 0 5 10 15
Growth in GNP per capita 1990-96
GE
R1
0
160
8080
56
Financing secondary education in developing countries

International Institute for Educational Planning http://www.unesco.org/iiep
Chart 3.9 Increase in GER2 1985-1995 by growth in GNP per capita1990-1996
In Chart 3.7, nine out of 20 countries with negative growth haveGER1s over 80 per cent. Chart 3.8 indicates that 17 out of the 20 haveGER2s below 30 per cent. It also shows that growth in GNP per capitahas been disappointing and below that assumed initially in the baselineprojections (3 per cent). This worsens the prognosis for the countrieswith negative growth, should the future repeat the past. It means that theproportion of GNP which would have to be allocated to increasesecondary participation is greater than the estimates in Table 3.1 for thecountries where GNP per capita is likely to continue to decline. Chart3.9 confirms that increases in GER2 have been very modest, especiallyin countries where GNP per capita has shrunk.
-20
0
10
20
-5 0 5 10
Growth in GNP per capita 1990-1996
Incr
ease
in G
ER
2 19
85-1
995
-30
-10-10
30
15-10
57
Are higher secondary enrolment rates achievable?

International Institute for Educational Planning http://www.unesco.org/iiep
3. Concluding remarks
Clearly there are a number of limitations to the analysis presented.These include uncertainties in the population data used to calculate theproportion of the population of school age, the difficulty of establishingGNP and the proportion allocated to secondary education, the reliabilityof estimates of unit cost at secondary level, and the margin of error onclaimed GER2s.
Nevertheless, this first-order analysis is illustrative. It leads to theconclusion that there are no circumstances under which it is conceivablethat many African countries will reach GER2 levels of 80 per cent ormore with current cost structures; GER2 = 60 per cent is also beyond thereach of many. The proportions of GNP that would need to be allocatedare unrealistic, especially if coupled with a substantial burden arisingfrom the need to reach GER1 = 100 per cent. Though external budgetaryassistance may be helpful in the short term to those countries withinsight of a feasible target, it may not lead to sustainable outcomes withoutchanges in the structure of financing secondary schools.
However, the simulations suggest that progress can be made if dueconsideration is given to opportunities to increase internal efficiency andre-examine critical cost drivers. First, the targets for increases inparticipation (GER2) need to be tailored closely to current status, andavailable domestic and international resources. This could reduce thecosts in terms of the proportion of GNP needed below the levelsindicated in Table 3.1. It would make increased GER2 more affordableat the cost of lower achieved levels of GER2.
Second, in some cases the question has to be addressed as towhether targets for primary gross enrolment rates should be modified.The most obvious way of approaching this is to lengthen the time scaleover which GER1 = 100 per cent might be achieved without abandoningthe target. This would allow secondary GERs to grow more quickly thanwould otherwise be the case. This is a question that should not beavoided, however the presentation of its resolution is handled in specificcases. There are competing claims on public investment in education.There are likely to be different developmental benefits and costsassociated with a different prioritization of alternatives. It is also likelyto be the case that the marginal cost of further increases in primaryenrolment in some countries may increase as GER1 = 100 per cent orgreater is approached, especially if drop-out reduces. Enrolment in themost remote sites and of those pupils least convinced of the benefits of
58
Financing secondary education in developing countries

International Institute for Educational Planning http://www.unesco.org/iiep
schooling may be the most expensive to provide. If this investment is atthe cost of increased secondary GERs, the balance of net social andeconomic benefits needs to be assessed.
Third, there is scope to re-examine unit costs and the proportionof public expenditure allocated to secondary schools. The latter requiresjudgements about what are appropriate and sustainable levels given thestatus and nature of financing of educational services at all levels. Highunit and total costs at tertiary level may invite scrutiny to establish theextent to which they are justified. In some cases tertiary unit costs maybe more than 50 times greater than school costs. There are examples ofcountries which allocate more than 35 per cent of the education budgetto tertiary institutions with very low participation rates. However, itshould be remembered that where tertiary enrolment is small, theamounts that might be released by reducing tertiary subsidies are likelyto be marginal to the overall picture of school finance.
Where unit costs at secondary are relatively high, participationcould be increased and GER2 raised through reduction of these unitcosts. How this can be achieved depends on what the cost drivers are forrelatively high unit costs. It has been noted that there is a strongassociation between higher levels of GER2 and lower ratios of costsbetween primary and secondary. The arithmetic logic of the situation isobvious. Whether quality can be maintained at an appropriate level asunit costs fall depends on the reasons for high unit costs.
It may be that in some countries there is scope for increasing privatecontributions to the cost of secondary school places. There is no generalanalysis that can be offered which can establish the extent to which this ispossible. Where the effective demand for secondary schooling is high,income levels are sufficient to provide disposable income and the politicsof access to secondary schools permit higher levels of cost recovery, theremay be scope to reduce public unit costs without reducing overall unitcosts. This should allow an increase in GER2. The prospects for this in thepoorest countries with the lowest GER2s, which are most at risk from theeffects of recession, seem likely to be limited.
Fourth, external assistance could play a role in easing the financialburden of the transition to high levels of GER2. Sector support foreducation in partnership with donors and lenders could be directedtowards reconfiguring secondary-school systems in ways which wouldenhance both equity and efficiency. This would only result in sustainableoutcomes if unit costs were guided towards levels that could becontained within feasible projections of the domestic resources likely tobe available in the future.
59
Are higher secondary enrolment rates achievable?

International Institute for Educational Planning http://www.unesco.org/iiep
Fifth, demographic changes seem likely in a number of thecountries with the lowest GER2s. Where HIV infection rates are highand are not checked, attrition amongst teachers will be high and the sizeof the school-age group may drop. Dependency rates will almostcertainly increase and the prospects for economic growth will beseverely constrained by attrition in the labour force. It is too early toestablish how severe these effects will be, but for some of the worstaffected countries this may be the most important constraint onsustaining higher levels of participation in secondary schooling.
We will return to the questions raised by the general analysispresented here in the last chapters of this book. It is now time to moveon to consider a series of case studies which have been developed toilluminate problems associated with the financing of secondary schoolsin different countries at different levels of educational development.
60
Financing secondary education in developing countries

International Institute for Educational Planning http://www.unesco.org/iiep
Introduction
Zimbabwe achieved independence in 1980 and committed itself touniversalizing primary education. By 1985 primary gross enrolmentrates were over 130 per cent, indicating that this goal had largely beenachieved. At the same time, secondary gross enrolment rates climbedfrom below 15 per cent to about 42 per cent. Thus, despite being arelatively poor African country with a GNP per capita of only US$540($2,030 PPP) in 1995, Zimbabwe has managed to achieve and sustainrelatively high secondary enrolments, whilst simultaneously providingaccess to nearly all school-age children to primary schools.
These achievements are all the more impressive given that thetotal population has been growing at about 2.9 per cent per annumsince1980 and that the dependency rate remains high. In 1985, thedependency rate (0-14 year-olds as a percentage of 15-60 year-olds) was90 per cent; in 1995 it remained above 84 per cent. The gains inparticipation were achieved over a period where GNP per capita had notgrown in real terms. Zimbabwe has maintained a high level of publicinvestment in education – around 8 per cent of GNP and 14 per cent ormore of government expenditure. This has helped to provide theresources to support enrolment rates which are high by comparison withmany other sub-Saharan African countries. Initially, public resourceallocation favoured the primary sector. During the 1980s over 50 percent of the total investment was allocated to primary schools, and 26 percent to the secondary-school system. Public costs per student at
61
Chapter IV
Financing secondary education in Zimbabwe: access, equity
and efficiency revisitedJ. Manduvi-Moyo and Keith M. Lewin1
1. This chapter was originally drafted by J. Manduvi-Moyo in response to a frameworkdeveloped by K. Lewin. It has been revised and edited and simulations added forinclusion in this book.

International Institute for Educational Planning http://www.unesco.org/iiep
secondary appear to be less than twice those at primary. This has alsocontributed to the ability of the Zimbabwe Government to affordrelatively high secondary enrolment rates.
It is of interest to explore in more detail the features of the growthin participation in Zimbabwe that have made it possible to reachcomparatively high levels of enrolment and to assess the prospects forfuture gains. This case study is organized in several sections. The firstreviews general aspects of the education system and details key featuresof context, policy, recent growth, current enrolments, automaticpromotion and transition rates, pupil/teacher ratios, and schooladministration. The next section discusses aspects of educationalfinancing in more detail and illustrates how different types of schools aresupported, indicating the mechanisms and some of the problems raisedby existing patterns of financing. This section concludes with a summarydrawing attention to the factors which seem to have been mostinfluential in enhancing participation rates at secondary level. The thirdsection presents the results of a simulation based on data from theMinistry of Education and UNESCO, which are used to explore thefinancial constraints on growth in participation at secondary. The chapterconcludes with some comments on possibilities for the future.
1. Development and growth of the education system in Zimbabwe
(a) Context
The pre-independence colonial governments in Zimbabweintroduced and maintained a dual education system which wasconsistent with their objective of maintaining the political and socio-economic supremacy of a minority white settler community over themajority African population. The separate development policy was basedon racial segregation and was designed to favour the white, Asian andColoured children. Education for these minorities was compulsory andwholly funded by the government. Although the minority Asian andColoured communities received better treatment than the Africanpopulation, their status was that of ‘honorary whites’ for reasons ofpolitical expediency and their educational provision lagged behind thatavailable in white schools.
African education was not compulsory. Historically, educationalservices were left almost entirely in the hands of missionaries,particularly in rural areas. Some farms and mines supported elementary
62
Financing secondary education in developing countries

International Institute for Educational Planning http://www.unesco.org/iiep
Financing secondary education in Zimbabwe:access, equity and efficiency revisited
63
schools for workers from the resources they chose to make available.The government built and maintained a small number of schools inurban centres to cater for children of African workers working andresiding in towns. In rural areas the colonial government did not erectschool buildings, but did provide salary grants to the missionaries. As aresult the African child had very restricted access to education, whichwas typically of very low quality and conducted under impoverishedphysical conditions. The African education system was wasteful in thata majority of the few who managed to gain access were unable tocomplete their schooling. The level of school fees and the vagaries of theschool selection system created high rates of repetition and drop-out.Thus, the great majority of African children did not complete theprimary-school cycle. Participation in secondary schooling accountedfor much less than 10 per cent of the age group.
(b) Policy
After independence in 1980, the Government of Zimbabweembarked on the process of reforming the dual system of education. Itplaced particular emphasis on redressing the disparities and inequalitiescreated and maintained by successive colonial governments. The ‘catalyst’for this process was the declaration in 1980 by the ruling party (ZANU-PF) that education was a fundamental human right, and a basic need ofevery child of school-going age and of every adult outside the formalschool system. In summary, the new government committed itself to:
• free and universal participation in primary schooling; • access to secondary schools consistent with financial constraints; • automatic promotion through to Grade 11 (Form 4); • more equitable access; • curriculum development to stress relevance to occupations and
livelihoods; • access to English language; • the elimination of illiteracy;• efficient provision that would make the best use of scarce
resources.
Primary-school provision was declared tuition free. Thegovernment agreed to pay salaries of all teachers and contribute to othercosts. Secondary schooling was to be made available only to those whocould afford it, since constraints on the public budget would not allowmore generous support whilst primary was being universalized.

International Institute for Educational Planning http://www.unesco.org/iiep
However, in addition to a commitment to be the main provider ofsecondary education in urban centres throughout the country, thegovernment undertook to build at least one government rural daysecondary school in each of the 59 administrative districts. It also agreedto pay building grants-in-aid to all approved non-government secondaryschools to cover 5 per cent of the costs. Thus, government took up theresponsibility of constructing secondary schools in urban centres, and alimited number of rural day secondary schools in rural districts. This leftlocal authorities and communities with the task of constructing primaryschools and non-government rural day secondary schools. These policiesformed the framework for increases in enrolments throughout the schoolsystem during the 1980s.
(c) Growth
The level of commitment to the reform process was very high andis demonstrated by the quantitative growth of the system. The number ofprimary schools grew from 3,160 schools in 1980 to 4,630 in 1996, anincrease of 47 per cent. Enrolment in primary schools more than doubledfrom 1,236,000 in 1980 to 2,482,600 in 1996. The number of primaryteachers expanded from 28,500 in 1980 to 63,500 in 1995. The highestgrowth was between 1981 and 1985 with much lower rates in the 1990sas universalization was achieved (see Chart 4.1).
Chart 4.1 Enrolment growth primary and secondary 1978-1995
0
500,000
1,000,000
1,500,000
2,000,000
2,500,000
3,000,000
1978 1980 1982 1984 1986 1988 1990 1992 1994Year
Enr
olm
ent
Primary Secondary
64
Financing secondary education in developing countries

International Institute for Educational Planning http://www.unesco.org/iiep
Secondary-school enrolments grew from a small base with a timelag compared to the growth in primary enrolments. Enrolmentsincreased from 74,300 to 711,100 from 1980 to 1995, an increase ofmore than eight times. The number of secondary schools increased from197 to 1,525 and the number of teachers in secondary schools rapidlyexpanded from 3,700 in 1980 to 27,300 in 1995.
High growth rates were achieved without directly relatedincreases in the salary budget. Part of the reason was the deployment oflarge numbers of untrained teachers paid at lower rates than qualifiedteachers. The number of untrained teachers at secondary in 1980 wasonly 3 per cent of the total. This rose sharply to a peak at over 51 percent in 1990 before it started to decline to only 13 per cent in 1995. Inaddition to employing ‘O’ level school graduates with five ‘O’ levelpasses and university students on vacation as temporary teachers, theMinistry employed teacher trainees from various teachers’ colleges tomanage a full class for a whole year or two before the trainees completeda certificate/diploma course. At primary level, the proportions ofuntrained teachers were doubled (from about 28 per cent to 60 per cent)between 1980 and 1985. This strategy had an overall cost-saving effecton the education budget during the period of most rapid expansion (seeChart 4.2). Double shifting using existing school buildings was alsowidely used to reduce capital requirements during high growth.
Chart 4.2 Percentage of untrained teachers by year
0
20
40
60
80
1980 1982 1984 1986 1988 1990 1992 1994
Year
Perc
enta
ge u
ntra
ined
% untrained primary % untrained secondary
65
Financing secondary education in Zimbabwe:access, equity and efficiency revisited
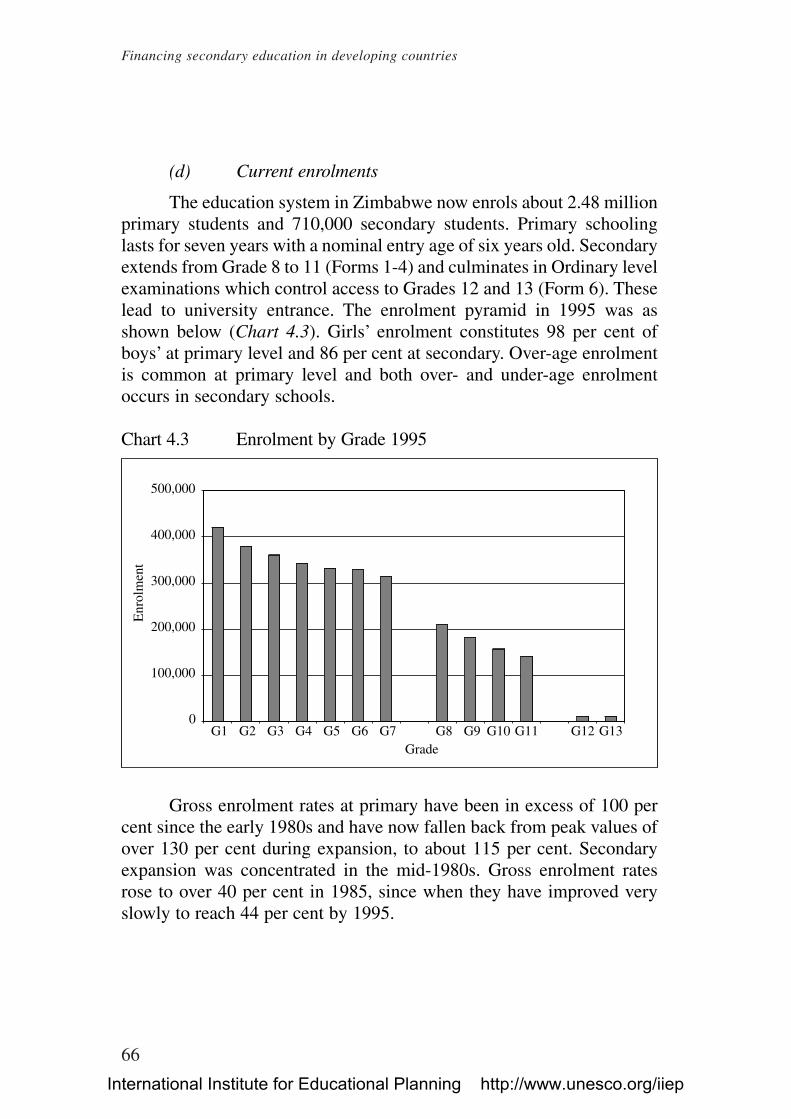
International Institute for Educational Planning http://www.unesco.org/iiep
66
Financing secondary education in developing countries
(d) Current enrolments
The education system in Zimbabwe now enrols about 2.48 millionprimary students and 710,000 secondary students. Primary schoolinglasts for seven years with a nominal entry age of six years old. Secondaryextends from Grade 8 to 11 (Forms 1-4) and culminates in Ordinary levelexaminations which control access to Grades 12 and 13 (Form 6). Theselead to university entrance. The enrolment pyramid in 1995 was asshown below (Chart 4.3). Girls’ enrolment constitutes 98 per cent ofboys’ at primary level and 86 per cent at secondary. Over-age enrolmentis common at primary level and both over- and under-age enrolmentoccurs in secondary schools.
Chart 4.3 Enrolment by Grade 1995
Gross enrolment rates at primary have been in excess of 100 percent since the early 1980s and have now fallen back from peak values ofover 130 per cent during expansion, to about 115 per cent. Secondaryexpansion was concentrated in the mid-1980s. Gross enrolment ratesrose to over 40 per cent in 1985, since when they have improved veryslowly to reach 44 per cent by 1995.
0
100,000
200,000
300,000
400,000
500,000
G1 G2 G3 G4 G5 G6 G7 G8 G9 G10 G11 G12 G13Grade
Enr
olm
ent
International Institute for Educational Planning http://www.unesco.org/iiep
Financing secondary education in Zimbabwe:access, equity and efficiency revisited
67
(e) Automatic promotion and transition rates
A policy of automatic promotion from Grade 1 up to Form 4 wasadopted in 1980 for two main reasons. Firstly, it was designed to removethe bottlenecks which existed prior to independence and thus equalizeopportunities for progression to the ‘O’ level/terminal examination inForm 4. Secondly, it was intended to reduce overall costs and maximizeopportunities to participate by increasing the flow of students throughthe school system. Without repetition more students could be enrolled atthe same cost than with repetition. This was seen as both more equitableand more efficient than the pre-existing system.
Enrolment data can produce crude estimates of promotion anddrop-out, assuming repetition is minimal. Drop-out is significant fromGrades 1-4, varying between about 12 per cent in Grade 1 and 2-3 per centfor the other grades. Above Grade 4 drop-out is small. In Grade 6 there issome evidence that a small proportion of pupils are held back to improvetheir chances of being promoted to secondary schools when they enterGrade 7. At secondary level, promotion rates are between 90 per cent and95 per cent up to Form 4. Drop-out averages about 7 per cent, concentratedin Forms 1 and 3. These rates suggest that automatic promotion is widelypractised. Repetition rates are consistently low, with the result that thenumber of places occupied by repeaters is modest. As a consequence,enrolment rates can be higher for the same overall commitment of publicfunds than would otherwise be the case. Gross enrolment rates havebenefited substantially from the increased flow of students through theschool system that automatic promotion has encouraged.
Primary/secondary transition rates have fallen from around 85 percent to about 70 per cent as primary enrolments have expanded touniversal levels. Though the numbers enrolled in Form 1 have continuedto increase, they have represented a smaller proportion of thosecompleting Grade 7 primary. Transition rates from Form 4 secondaryinto Form 6 have also fallen from about 19 per cent to less than 9 percent. Most of this fall took place in the early 1980s, since when thetransition rate has remained fairly constant. Transition rates for girls areconsistently below those for boys (Chart 4.4).

International Institute for Educational Planning http://www.unesco.org/iiep
Chart 4.4 Transition rates primary/secondary and secondary/Form VI, 1981-1996
In principle, no child should be denied access to a secondaryschool nearest his/her place of residence provided that he/she can affordthe school fees charged at that school. If a child fails to pay, the SchoolDevelopment Committee (SDC)2 or School Development Association(SDA) has the responsibility of recovering the money throughpersuasion or legal action. This can result in recovery of property to thevalue of the fees. As a result, selection of pupils into Form 1 is non-existent in the majority of school types, except in government andchurch boarding schools. These schools have excess demand for placesand selection is usually based on results in Grade 7 examinations. Inhigh-fee-paying Trust schools, the parent’s ability to pay the high fees isenough qualification to be selected into this school type. Transition ratesreflect the numbers of students willing and able to pay the fees charged.
At ‘A’ level, education is very competitive and entrance to Form 6is highly selective. Selection into ‘A’ level education was previously donecentrally, but for reasons of efficiency and effectiveness is now theresponsability of school heads, ‘A’ level schools remaining neverthelessnational schools enrolling students from all corners of the country. Of the1991/94 cohort, which initially totalled 129,500, only 10,500 wereselected into Form 5, a cohort selection ratio of 8 per cent. The ratio was
0
20
40
60
80
100
1980 1982 1984 1986 1988 1990 1992 1994 1996
Year
Tra
nsiti
on r
ates
Pri-sec male Pri-sec female
Sec-Form VI male Sec-Form VI female
68
Financing secondary education in developing countries
2. School Development Committees are in non-government schools; School DevelopmentAssociations in government schools.

International Institute for Educational Planning http://www.unesco.org/iiep
similar for the 1992/95 cohort and has been held at around this level sincethe mid-1980s. Typically, more than 85 per cent of those pupils selectedto proceed come from the high fee, church and government school types,especially boarding schools.
Government policy is that there should be at least one ‘A’ levelschool in every district. So far only the two districts of Seke and Mudzihave no ‘A’ level schools. Plans have, however, reached an advanced stageto establish ‘A’ level schools in these two districts by 2002. Districts thatalready have ‘A’ level schools can, subject to the Ministry’s approval,construct additional ‘A’ level schools without government assistance inaccordance with capital development regulations. Worsening financialconstraints have meant that government has been unable to develop itsown government rural day secondary schools in these districts into ‘A’level schools. Instead, it has chosen to encourage cost-sharingpartnerships with local communities and private responsible authorities.
(f) Pupil/teacher ratios
Pupil/teacher ratios (PTRs) favour secondary schools. Across thesystem, primary PTRs average about 40:1 and secondary about 30:1.Secondary PTRs increased during the period of rapid expansion in theearly 1980s, but have now stabilised (Chart 4.5). This allowed a rapidincrease in secondary enrolments to occur from 1981 in advance of theappointment of new teachers. Over time, the backlog created was overcome.
Chart 4.5 Pupil/teacher ratios at primary and secondary 1978-1995
0
10
20
30
40
50
1978 1980 1982 1984 1986 1988 1990 1992 1994
Year
Pupi
l/tea
cher
rat
io
PTR secondaryPTR primary
69
Financing secondary education in Zimbabwe:access, equity and efficiency revisited

International Institute for Educational Planning http://www.unesco.org/iiep
Currently, official teacher/pupil ratios for the secondary sector are1:33 for Forms 1 and 2; 1:30 for Forms 3 and 4; 1:20 for Forms 5 and 6.Staffing can be enhanced using a formula that allows school heads to bidfor additional practical-subject teachers at a ratio of 1:320 pupils. Thisrecognizes the need to teach split classes in practical subjects which canonly be taught effectively and safely to smaller classes. In addition, thereare allocations for approved slow learners at a ratio of 1:19; 1:7 for thehard of hearing and 1:10 for the visually disabled children.
In urban centres where demand for secondary education is usuallyhigher than in rural areas, the teacher/pupil ratio is usually higher thanthe national average. The non-government Trust schools employadditional teachers above the official allocation to achieve teacher/pupilratios which are far below official figures. In a small sample of60 schools on which data were available, PTRs varied as shown belowby school type (Table 4.1).
Table 4.1 Pupil/teacher ratio by school type
70
Financing secondary education in developing countries
Pupil/teacher ratio
Church 20
District Council 24
Farm 32
Government 23
Mine 39
Trust 15
Nominal teacher/pupil ratios are used by the Ministry to bid forteaching posts from the Treasury. On the basis of these, funds arereleased to support teachers’ posts and teachers are allocated to schools.In principle, these allocations should result in an equitable distributionof teachers according to the numbers of pupils. In practice, it is clearthere are wide deviations in PTRs from the norms established.
(g) Administration
After independence the government recognized that responding tothe huge demand for increased access would have to be tempered bybudgetary constraints. Part of its strategy was to devolve theresponsibility for providing capital infrastructure for schools to localauthorities and communities. Government retained the responsibility forauthorization, registration and payment of teachers’ salaries andprovided pupil per-capita grants to all registered schools. It continued to

International Institute for Educational Planning http://www.unesco.org/iiep
fully fund all government schools inherited from the pre-independenceera and agreed to part-fund the non-salary recurrent costs of non-government schools. Schools now fall under several different types ofadministrative arrangement. The main types are shown below along withthe source of their funding and perceived quality3 (Table 4.2).
Table 4.2 Types of school, responsible authority, funding andperceived quality
71
Financing secondary education in Zimbabwe:access, equity and efficiency revisited
The great majority of schools are in communal areas, formerlyreferred to as African Reserves or Tribal Trust Lands. Resettlement areasare locations acquired by government to resettle landless peoples fromcommunal areas. Government schools are overwhelmingly urban atprimary level. Rural District Councils are by far the most commonresponsible authority at both levels. Mission and church schools accountfor the next largest category.
The administrative system for schools that has emerged iscomplex in the sense that several different authorities takeresponsibilities for schools. Salaries of teaching staff are provided to allschools by central government. In non-government primary andsecondary schools, all other non-teaching staff are funded by theresponsible authority. All maintenance, equipment, learning materialsand other recurrent costs are met by government in government schools.In non-government schools these costs have to be funded by responsibleauthorities which receive small pupil per-capita grants from government.These amounted to about 4 per cent of the cost per pupil in government
3. As judged by the authors.
Type Responsible authority Funded by Perceived quality of schooling
Government Government Parents and government GoodRural District Council Rural District Council RDC/UDC, parents, Poor to averageor Urban District Council or Urban District government contributions,
Council donors and NGOsMission/church Church Church, parents, Good to very good
government contributions,donors and NGOs
Mine/farm Mine/farm Mine/farm, parents, Mine – average to government contributions, good donors and NGOs Farm – poor
Trust schools Trust governing bodies School fees and levies, Very goodprivate contributions,government contributions,fund raising

International Institute for Educational Planning http://www.unesco.org/iiep
schools in the early 1990s. Construction costs at primary are shared withthe community, often through provision of subsidized buildingmaterials. The expectation is that the community will provide labour andother inputs. The same is true for non-government secondary schools.Government secondary schools generally have buildings provided. Feesare charged in all schools and can vary widely.
The distribution of schools by authority and location is shown inTable 4.3. Only 6 per cent of primary schools and 13 per cent ofsecondary schools are government administered. This indicates theextent to which the responsibility for funding many elements of schoolbudgets falls on local authorities and the community.
Table 4.3 Primary schools by responsible authority and location1996
72
Financing secondary education in developing countries
Urban Communal Resettlement Communal Mines Totalfarms
PrimaryGovernment 251 3 0 10 2 266Rural District Council 33 3,225 111 237 5 3,611Mission or church 29 143 9 33 0 214Urban Council 84 1 0 5 0 90Mine 12 3 0 7 6 28Trust/Board of Governors 34 26 2 39 8 109Other 70 46 0 165 64 345Total 513 3,447 122 496 85 4,663SecondaryGovernment 128 59 0 6 1 194Rural DistrictCouncil 15 969 36 50 1 1,071Mission or church 20 115 0 39 0 174Urban Council 6 0 0 0 0 6Mine 3 0 0 0 8 11Trust/Board of Governors 15 8 0 7 0 30Other 21 8 0 12 2 43Total 208 1,159 36 114 12 1,529
Though salaries for teachers are met centrally up to agreed staffinglevels, many other costs in the majority of schools fall on the responsibleauthorities, who can raise money in a variety of ways, including fees andlevies and contributions in kind. This has mobilized additional resourcesto support expansion, which would not otherwise have been available.

International Institute for Educational Planning http://www.unesco.org/iiep
Financing secondary education in Zimbabwe:access, equity and efficiency revisited
73
The data indicate that whilst there has been a very substantialincrease in the number of schools and enrolments there are significantvariations in the spatial distribution of schools, in participation rates bygender, and by school across geographical areas, administrative andeconomic regions, and socio-economic and sociocultural groups. Thesefactors have resulted in a wide variation in the quality of educationoffered in Zimbabwean schools.
One tentative conclusion is that the inequalities in access and qualityinherited at independence have not been overcome. The existingarrangements have not adequately compensated for previousmarginalization. Thus differences in the quality of schools and their level ofper-capita costs continue to reflect historic patterns and correlate with thekind of responsible authority charged with running the different types ofschools (Colclough et al., 1990; Lewin and Bajah, 1991; Nyagura, 1992).Most expensive and most prestigious are the high-fee non-government(trust) schools and former Group A (government)4 schools, which havegenerous provision of classrooms and furniture, textbooks, library books,pens and pencils, chalk and paper, maps and charts, and dictionaries. Theseschools have effective administration and many extra-curricula facilities andcan attract and retain experienced and trained teachers. At the other extremeare rural district council schools and farm schools. These are seriouslyaffected by shortages of classrooms, classroom furniture and qualifiedteachers. In these schools there is an insufficient supply of textbooks, andother learning materials and inadequate or non-existent administration andextra-curricular facilities. Costs in these schools are much lower.
A small sample of 60 schools5 produced the following pattern ofaverage performance for ‘O’ level pass rates, illustrating how some ofthe differences in quality may be reflected in pass rates (Table 4.4).6
Table 4.4 Pass rates at different levels for different school types
4. Group A schools were urban low-density schools previously reserved for whites. GroupB were urban high-density schools intended for Africans.
5. Selected by the authors from a national sample.6. The sample may have included a disproportionate number of high-scoring schools since
the average pass rate nationally at this level is around 25 per cent.
Lower secondary % pass Upper secondary % pass Form VI % passChurch 84 75 84District Council 40 33 12Farm 47 43 0Government 43 38 64Mine 46 38 0Trust 79 73 65

International Institute for Educational Planning http://www.unesco.org/iiep
2. Aspects of educational financing
(a) Overall budgetary allocations
Zimbabwe has consistently allocated large proportions of GNP toeducational investment. Through the 1980s, 8-9 per cent of GNP wasdirected towards public expenditure on education. These levels areamongst the highest found throughout sub-Saharan Africa over thisperiod. This was accompanied by similarly high commitments as aproportion of the public expenditure budget. Up to 17 per cent of publicexpenditure was spent on education during the mid-1980s, falling backto the current levels of about 14 per cent (Chart 4.6).
Chart 4.6 Percentage of government expenditure on education byyear
There was therefore a sustained and high level of allocation ofpublic funds to support enrolment growth, without which gains inenrolment ratios are unlikely to have occurred.
(b) School financing
The main source of funding for government primary schools isthrough the ministry vote. Parents’ contribute through self-help schoolprojects, such as provision of additional classrooms, fencing or
10
12
14
16
18
1980 1982 1984 1986 1988 1990 1992 1994 1996
Year
Perc
enta
ge o
f go
vern
men
t exp
endi
ture
on e
duca
tion
74
Financing secondary education in developing countries

International Institute for Educational Planning http://www.unesco.org/iiep
dura7 walling, purchase of school buses, etc. The more funds the parent-teacher association of a government school (now legally named as theSchool Development Association (SDA)) can mobilize from its schoolcommunity, the more support it should be able to give to schooldevelopment. The level of fees (1997) at government primary schoolsare Z$315 for former Group A schools and Z$105 for former Group Bschools, per child per annum. Once this money is paid to the Treasury, itmay not be ploughed back to the education sector. There is no necessaryconnection between the amounts contributed and the amounts of supportfrom government each year. The main aim of the Education AmendmentAct of 1991 was to create corporate bodies to enable schools to retain allfees and levies collected for the specific purpose of developingindividual schools. Since the promulgation of the Act, schooldevelopment corporate bodies have been created, training has beenprovided in planning and financial management, and school bankaccounts have been opened. At the time of writing, funds for buildinggrants-in-aid and from school fees had not materialized in schoolbudgets.
Funding for non-government primary schools varies according tothe type of responsible authority. For all Trust schools, the main sources offunding are school fees and levies, share sales, donations from the privatesector and a wide variety of other forms of fund raising. The fee structurein these schools in 1997 ranges from Z$21,000 to Z$36,000 per annum foreach child. They also administer a variety of levies such as desk fees(about Z$5,000), voluntary levy (about Z$12,000 to Z$20,000 or more)per child and many other varieties of lesser levies. Mission (Church)schools are funded according to the same principles, except that theaverage fees and levies charged are much less than those charged by Trustschools. These average Z$9,000 and Z$4,500 per child, per annum,respectively. The rural district council schools are the most poorly fundedof the non-government schools. The main source of funding is throughparents’ labour (forming bricks, supplying river sand and water); abuilding levy of about Z$20 per family and some donations frominternational donors and non-governmental organizations. The school feescharged by these schools are collected by the responsible authorities(normally the RDC), which may not allocate all the money to supportschools in general, or specific schools in particular. Other types of non-government primary schools, such as farm, mine and parastatal are fundedalmost in the same way as district rural council schools, where parental
75
Financing secondary education in Zimbabwe:access, equity and efficiency revisited
7. Brick or concrete security fencing around schools.

International Institute for Educational Planning http://www.unesco.org/iiep
input is the most significant contribution, unless there is a significantcorporate contribution as in some mine schools. The EducationAmendment Act of 1991 created School Development Committees(SDCs) at non-government schools in parallel with the creation of SDAsin government schools in order to try and ensure that the money collectedwas allocated to school development. This has also yet to become a reality.
Fees were re-introduced at primary level in 1991. Primary schoolsin rural areas were exempted from paying the Z$4 school fee per child,per term, where there were persistent drought and very low cashincomes. The potential revenue base for many rural schools thus remainsvery small. All non-government schools do get financial assistance fromgovernment in the form of teachers’ salaries and modest per-capitagrants, which are skewed in favour of rural and disadvantaged schools.Thus, Z$88 per child, per annum, is provided for low-density urbanschools; $20 for high-density urban schools and $24 for rural schools.These grants are too low to have much impact on equity, since theyrepresent only a small proportion of total costs per pupil. Surprisingly,children in the non-government trust schools, which generally havesubstantial incomes and budgets, also benefit from government per-capita subsidy at a lower rate of Z$8 per child per annum. Parents areexpected to meet the costs of buying school uniforms, sports equipment,pens, rulers, exercise books and many other incidentals required by theschool. This is another area where the pattern of financing schools hasnot only maintained inequalities but widened them, since the ability tosupport such costs varies widely from community to community.
At the secondary level, government remains the main responsibleauthority for the construction of schools in all urban centres. It is alsocommitted to the construction of at least one government rural daysecondary school in each of the 59 administrative districts and it givessubsidies to local authorities for the construction of additional ruralsecondary schools. Public capital expenditure in government schoolsamounts to 94 per cent of the total, leaving a 6 per cent contribution byparents through self-help projects. In non-government schools, capitalsubsidies amount to approximately 27 per cent. The rest is provided byresponsible authorities and communities and by donors, who contributedabout 23 per cent of the total (1997 estimate).
Government pays salary expenditures for all teachers at bothgovernment and non-government schools. The non-salary expenditures
76
Financing secondary education in developing countries
8. The value of the Z$ has depreciated and now (1999) stands at about US$1 =Z$33. At thetime of this study, a $US was between Z$15 and Z$20.

International Institute for Educational Planning http://www.unesco.org/iiep
at government schools are provided for in full by government, whilenon-government schools receive subsidies in the form of per-capitagrants (currently at a rate of $7 per child, per annum, for low-densityurban schools; $10 for high-density urban schools; and $20 for ruralschools) to assist the responsible authorities with the school’s recurrentcosts. The policy on tuition grants is periodically reviewed upwards inline with the rising cost of living and is skewed in favour of the ruraldisadvantaged pupils, as the above figures show.
The main non-salary expenditure items of an average daygovernment school are textbooks, library and stationery; school runningcosts (miscellaneous); practical subjects; science; water, light and sanitaryexpenses; and post and telecommunication services. For a boardinggovernment school, in addition to the above list, there are substantialexpenditures on provisions; fuel; hostel running costs (miscellaneous) andlaundry, which are met by government. All these items are based on per-capita allocations, except water, lighting and sanitary charges, post andtelecommunication services and fuel, which are based on actualexpenditure and previous performance. Laundry is subject to contracts.These items are controlled by the Finance Division of the ministry.
The other main items of non-salary expenditures are subsistenceand transport; school services; school furniture and equipment; buildingand equipment grants and tuition grants. The average expenditure perpupil at a day government secondary school in terms of the votedprovisions translates to Z$200 per student per annum, and Z$4,000 perstudent per annum for a boarding government secondary school.
It is difficult to assess the non-salary expenditures per student fornon-government secondary schools because of the magnitude of thedifferences in facilities and services offered by different school types.The high-fee trust schools should have a higher fees and per-studentexpenditure than other school types because of the wide range offacilities and services offered at these schools.
Teachers’ salaries are determined by their qualifications, gradesand experience. The Public Service Commission determines the salariesand points at which teachers are employed. Temporary teachers are paidat lower rates than qualified teachers. It is estimated that there are about3,000 untrained temporary teachers at secondary level. As a result, thegovernment saves about Z$40,000,000 per annum in salaries over whatit would have to pay if all were qualified. The salary entry point for atemporary teacher is Z$26,500 p.a. College-trained teachers and
77
Financing secondary education in Zimbabwe:access, equity and efficiency revisited

International Institute for Educational Planning http://www.unesco.org/iiep
university graduates start at Z$38,230 and Z$44,090 respectively.9Teachers’ salaries appear to be over 8 times per-capita income, reflectingthe fact that they are relatively well paid compared to many other sub-Saharan African countries.
Average teacher salaries per student have increased steadily innominal terms since 1992, from Z$730 during the 1991/92 financial yearto Z$1,590 in 1994/95. These figures conceal the inequalities that exist inthe system, because the total salaries bill includes salary grants paid tonon-government trust schools for those teachers who have opted out of thecivil service. These teachers are about 1 per cent of the total teachingforce. Salaries in non-government (trust) schools are on average twice asmuch as the salaries of the ordinary teacher, who is a civil servant.Generally, the average teaching salaries per student in the secondary sectorare approximately twice as high as those in the primary sector. The non-teaching salaries and non-salary costs per student for government schoolshave increased from Z$320 in the 1991/1992 financial year to Z$750 in1994/1995 in the secondary-school sector. The level of non-salaryexpenditure is about five times more in secondary than in primary schools.
It is difficult to compare non-teaching salaries and non-salarycosts per student between school types because of the non-availability ofstatistical data and information by school type. Typically, non-government (trust) schools offer a wide variety of high-cost sportingactivities and social clubs such as horse riding, mountaineering, flying,hockey, tennis, basketball, cricket, rugby, athletics. At the other end ofthe spectrum, rural district council schools, at best, offer only soccer,netball and athletics. Subsidy of non-government trust schools maintainshistoric inequalities between rich and poor schools.
(c) Cost per student
The overall patterns of unit costs that have accompanied recentgrowth in enrolments are shown below (Table 4.5). Public unit costs atprimary have grown from about Z$450 in 1991/2 to Z$990 in 1995/6 incurrent dollars. At secondary the increase has been from Z$800 toZ$1,670. The overall ratio of secondary to primary costs per student hasvaried between about 1.7:1 and 2:1 over this period. It is worth notingthat during the 1980s unit costs in real terms were fairly stable at primaryand secondary, contributing to the ability of government to financeexpansion (Colclough et al., 1990).
78
Financing secondary education in developing countries
9. Some 15,000 primary teachers are untrained (1995) representing further gains of aboutZ$200 million over what would otherwise have to be found for salaries.

International Institute for Educational Planning http://www.unesco.org/iiep
Table 4.5 Estimated recurrent budget allocation, enrolment andexpenditure per pupil at secondary and primary andsecondary 1991-1996
79
Financing secondary education in Zimbabwe:access, equity and efficiency revisited
Primary 1991/1992 1992/1993 1993/1994 1994/1995 1995/1996Allocation Z$ million 1,046 1,288 1,499 2,056 2,478Enrolment million 2.30 2.37 2.50 2.42 2.49Expenditure per pupil (Z$) 454 543 600 848 995SecondaryAllocation Z$ million 547 661 794 1,028 1 271Enrolment million 68.4 6.48 6.50 6.84 7.61Expenditure per pupil (Z$) 800 1,020 1,221 1,502 1,672
Table 4.5 shows the variation in unit costs between primary andsecondary schools. The overall budget allocations for the financial years1991/1992 to 1995/1996 show that government spent between 70 per centand 100 per cent more on a secondary-school pupil than on a primary-school pupil.
These overall budget allocations and unit costs concealinequalities between school types that exist in the system. Total unitcosts for different types of school at different levels are shown below(Table 4.6). A recent survey carried out by the Ministry of Education in1996, based on estimated recurrent expenditures (school levies, schoolfees, teachers’ salaries, uniform costs, and any other financial inputsincluding per-capita grants) showed large variations in total unit costsper pupil among the various types of schools. These variations rangefrom Z$1,170 to Z$15,900 (a difference of Z$14,720) for primaryschools and Z$2,320 to Z$33,030 (a difference of Z$30,710) forsecondary schools.
Table 4.6 Estimated recurrent unit cost per year by type of school:1996 (Zimbabwe dollars)
Type of school Unit cost Z$ (primary) Unit cost Z$ (secondary)High fee (trust, etc.) 15,896 33,026Mission 3,271 6,344Rural District Council 1,174 2,318Urban local authorities 1,301 10,436Government ‘A’ 3,876 10,115Government ‘B’ 2,113 3,535Government rural 1,908 2,909
Source : Ministry of Education, 1996.

International Institute for Educational Planning http://www.unesco.org/iiep
It remains a concern of government that the high-fee-paying trustschools are in a class of their own in terms of resource endowment, whilerural district council schools are at the bottom. High-fee trust schoolsremain predominantly white schools, whose children have been removedfrom government former Group A schools. The schools include a verysmall number of black children whose parents are mostly companydirectors and/or hold executive positions in the private sector. The ruraldistrict council areas and those where schools were only started afterindependence are clearly the most disadvantaged, even though the per-capita subsides from government are skewed in their favour. Ifgovernment is to narrow the inequality between school types, there is aneed to increase unit costs in rural district council schools. This mightinvolve injecting more funds for teaching and learning materials andimproving the physical and social environment for the teachers. Thiswould go some way towards redressing the inequities suggested by theavailable data.
(d) Fee differentials
For most schools it is the non-budget contribution to schoolfinance (obtained from fees and levies) which is the major factor thatcauses variations in unit costs per pupil by school type. According to theEducation Act of 1987, and as amended in 1991, government determinesschool fees that are payable at government schools, while responsibleauthorities of non-government schools seek the approval of thePermanent Secretary for Education to charge the levels of school feesand levies they consider appropriate. As a general rule, SchoolDevelopment Associations (government schools) and SchoolDevelopment Committees (non-government schools) determine therange and level of levies they charge themselves at their annual generalmeetings or at extraordinary meetings. Once an agreement is reachedthey apply through the school head to the Permanent Secretary forapproval. The situation is not quite the same in high-fee trust schools,where the board of trustees, and not the school development committee,determines the level of fees and levies before seeking approval.Applications to raise fees and levies (which must not exceed 10 per centof current charges in any one year) by high-fee trust schools have notalways been successful, a situation that has constantly caused frictionbetween these schools and government. The actual fees and leviescollected may not be the same as those officially submitted to theministry for some schools. Since government auditors cannot audit their
80
Financing secondary education in developing countries

International Institute for Educational Planning http://www.unesco.org/iiep
financial books, the true figures may be higher than suggested in theavailable data.
From data obtained from a sample of school files, parents pay onaverage about Z$19,500 and Z$24,900 per child, per annum, in school feesfor a high-fee trust primary school day scholar and boarder respectively.At the secondary-school level, parents pay, on average, Z$27,000 andZ$34,500 per child, per annum, in school fees for a day scholar andboarder respectively. In addition to school fees, parents are required to payan assortment of other levies such as a desk fee (about Z$2,000 – Z$4,000)for the whole cycle, either primary or secondary; and voluntary levies,which can be anything up to Z$20,000. The building levies range fromabout Z$6,000 – Z$12,000 per annum. Parents may make many othercontributions in cash or in kind such as, provision of sports equipment andexpertise, vehicles for transportation of children and teaching and learningmaterials, graders for clearing sports fields, contracted labour, etc. Thejustifications given for these high fees and levies are that the schools needto employ more teachers to reduce teacher/pupil ratios. They also need topay their teachers above the government-scale salaries and offer otherincentives, such as free accommodation and education for teachers’children, in order to attract and retain the best teachers, and offer aneducation of the highest quality possible.
By comparison, parents who send their children to governmentprimary schools pay Z$320 (for primary schools in low-density urbancentres) and Z$110 (for primary schools in high-density urban centres)per child, per annum, while government boarding primary schoolscharge Z$2,000 per child per annum. Extra-territorial pupils payZ$1,400 and Z$3,960 per pupil for day scholars and boardersrespectively. Government primary-school levies on average range fromZ$600 – Z$1,000 per child, per annum. Occasionally, parents collectadditional levies for fixed periods if these are needed to carry outspecific projects, such as the purchase of a bus or the construction ofdura wall around the school.
Parents whose children attend government secondary schools payZ$630 (for low-density schools), $320 (for high-density schools) andZ$180 (for rural schools). Boarding fees in government secondaryschools are Z$2,400 per child, per annum. Extra-territorial pupils payZ$1,950 and Z$4,230 to attend day and boarding government secondaryschools respectively. There is a wide range of variations in the size oflevies charged by government secondary schools ($600 – $4,500) perchild, per annum, depending on the size and range of facilities offeredby each individual school.
81
Financing secondary education in Zimbabwe:access, equity and efficiency revisited

International Institute for Educational Planning http://www.unesco.org/iiep
On average, church secondary schools charge about Z$9,000school fees per child, per annum, for day scholars and Z$13,500 perchild, per annum, for boarders. Levies in these schools are charged inline with the guidelines given by government and are quite moderatewhen compared to the high-fee trust schools. The same is true with theurban councils’ schools, whose fees and levies are just a little abovegovernment fees and levies.
The non-budget community contributions in rural district councilschools are largely in kind. Communities in these areas are so poor thatgovernment continues to exempt primary students from tuition fees,while secondary schools charge modest fees, which on average are aboutZ$590 per child, per annum. Building levies average approximatelyZ$40 per child, per annum. The major contribution made by thecommunity is in the provision of bricks, river sand and water for theconstruction of schools, labour for digging trenches and foundations forthe construction of Blair toilets and construction of classroom blocks,office blocks, halls, etc. It is this meagre resource base that has made thistype of school poor and unattractive in both resource provision andacademic performance. It is important to note that academicperformance by Zimbabwean schools is highly correlated to levels ofresource allocation and availability, with the well-resourced schoolsperforming far better than the poorly resourced schools (Nyagura, 1992;Colclough et al., 1990).
(e) Summary observations from the analysis
Zimbabwe’s achievements in expanding educational participationare impressive. The analysis suggests that several factors havecontributed to the gains in participation which have occurred. These aresummarized below.
First, it is clear that there has been a high level of commitment ofpublic resources to education, which has been sustained over a longperiod. Few governments in sub-Saharan Africa have allocated suchlarge proportions of GNP to education or maintained higher levels of theproportion of public expenditure on education. Tertiary allocations wereheld to less than 10 per cent throughout the period of rapid expansionand now account for about 17 per cent. This indicates prioritization ofinvestment in participation in school. Over the period of most rapidgrowth, unit cost at primary and secondary remained stable in unit-costterms and this contributed to the financial sustainability of enrolmentgains.
82
Financing secondary education in developing countries

International Institute for Educational Planning http://www.unesco.org/iiep
Second, Zimbabwe has deliberately adopted a system of schooladministration that shares the costs of increased participation with local-level authorities, communities and community-based organizations. Thishas eased the burden of the costs of enrolment expansion on the publicbudget. Without this, it is unlikely enrolment growth would have been sorapid. It has been noted that this may have resulted in the perpetuationof existing inequalities, since resources available at the local level varywidely between communities. This problem still needs addressing asdistributional issues become prominent in the wake of increasedparticipation.
Third, the introduction of automatic promotion has evidentlymade it possible to reach higher gross enrolment rates at primary andsecondary than would otherwise have been possible. Repetition ratesthroughout primary are low and only reach modest levels in secondaryschools.
Fourth, during the periods of rapid expansion, large numbers oftemporary teachers were employed at lower costs than for qualifiedteachers. Pupil/teacher ratios were also allowed to increase. Over timethe proportion of temporary unqualified teachers has been reduced andthe pupil/teacher ratios have returned to levels comparable with historicnorms. Double shifting was also used to increase capacity in advance ofnew school buildings becoming available. If these strategies had notbeen adopted, the rate at which enrolment rates increased would havebeen slower.
Fifth, the pattern of financing secondary schools, with substantialcontributions from parents and communities, has meant that publicexpenditure per student has remained a small multiple of primary costsper student. If this had not been true, then secondary participation rateswould have been much lower for similar overall budgetary allocations.
(f) A simulation
It is possible to model how the costs of the Zimbabawe educationsystem might change under different scenarios over the next 15 years.Using the model described in Chapter III, a simulation was constructedwith the following baseline data taken from Government of Zimbabweand UNESCO statistics (Table 4.7).
83
Financing secondary education in Zimbabwe:access, equity and efficiency revisited

International Institute for Educational Planning http://www.unesco.org/iiep
Table 4.7 Simulation parameters
84
Financing secondary education in developing countries
Parameter Simulation 1
Population growth 2.9%Primary GER 117%Secondary GER 44%Unit-cost ratio of secondary to primary 1.7Primary entry rate 110%Repetition 1% rising to 2% in last gradePromotion 95% and above in all grades but Grade 1 (88%)Drop-out 11% in Grade 1 falling to 1% in Grade 7Pupil/teacher ratio 39:1Teacher attrition 10%Secondary entry rate 65%Repetition 1-2% except in Grade 11 (Form IV) where it is 8%Promotion 90-95%Drop-out Averaging 7%Pupil/teacher ratio 27Teacher attrition 5%
The simulation has been used to project how costs will increase ifthe gross enrolment rate at secondary were to be allowed to grow fromits current level to 70 per cent, assuming that primary gross enrolmentrates remain at their current level. Several assumptions have been madein Simulation 1 which should improve the efficiency of the system. First,it is assumed that drop-out in primary will be reduced to 2 per cent in allgrades over the next five years. This involves small adjustments, exceptin Grade 1 where the rate is currently 11 per cent. Second, drop-out atsecondary falls from 7 per cent to 3 per cent over the same period. Boththese developments would increase costs by retaining more students inthe system.
If the transition rate into secondary is increased from 65 per centto 90 per cent over 10 years, this leads to a gross enrolment rate atsecondary of 70 per cent in this simulation. The costs of the systemincrease by a factor of 1.8 over 15 years. This can be compared with thebaseline model without these changes, where costs increase by 1.5 timeson the assumption that GNP per capita remains constant in real terms.See Chart 4.7: Gross enrolment rates at primary and secondary;Chart 4.8: Recurrent costs for primary and secondary as proportion oftotal base-year costs, 1996-2010.

International Institute for Educational Planning http://www.unesco.org/iiep
Chart 4.7 Simulation 1: Gross enrolment rates at primary andsecondary
Chart 4.8 Simulation 1: Recurrent costs for primary and secondary as proportion of total base-year costs, 1996-2010
0
0.2
0.4
0.6
0.8
1
1.2
1.4
1.6
1.8
2
1996 1998 2000 2002 2004 2006 2008 2010
Year
Rec
urre
nt c
ost a
s pr
opor
tion
of b
ase
year
Primary recurrent Secondary recurrent Total recurrent costs
0%
20%
40%
60%
80%
100%
120%
140%
1995 1997 1999 2001 2003 2005 2007 2009Year
Gro
ss e
nrol
men
t rat
es
Primary
Secondary
85
Financing secondary education in Zimbabwe:access, equity and efficiency revisited

International Institute for Educational Planning http://www.unesco.org/iiep
In Simulation 2 (see Chart 4.9) further assumptions have beenmade. Here it is assumed that public secondary unit costs have beenallowed to grow to 2.5:1 those at primary from their current ratio of1.7:1. With appropriate distributional measures this should allowimprovements in quality and access to those currently attending lower-cost secondary schools in historically deprived locations. The result iscosts which increase by 1.9 times over the base year. In this case,expenditure on secondary schools starts to exceed the total cost of theprimary system after five years. Gross enrolment rates at primary andsecondary are unaffected.
Chart 4.9 Simulation 2: Recurrent costs for primary and secondary as proportion of total base-year costs, 1996-2010
In Simulation 3 (Chart 4.10) a higher target of gross enrolmentrate of 90 per cent at secondary has been set with the cost ratios ofSimulation 2. In this case, total costs rise to 2.2 times the base year andsecondary expenditure becomes much greater than that on primaryschools.
0
0.4
0.8
1.2
1.6
2
1996 1998 2000 2002 2004 2006 2008 2010Year
Rec
urre
nt c
ost a
s pr
opor
tion
of b
ase
year
Primary recurrent Secondary recurrent Total recurrent costs
86
Financing secondary education in developing countries

International Institute for Educational Planning http://www.unesco.org/iiep
Chart 4.10 Simulation 3: Recurrent costs for primary and secondary as proportion of total base-year costs, 1996-2010
Finally, it may be that the growth in the school-age cohort isconsiderably less than the historic population growth rates of 2.9 percent. If the school-age cohort were to grow more slowly at 1.5 per cent,the result is that total costs and GERs would fall below levels projectedin Simulation 3. Total cost would become about 1.9 times baseline costs,primary GERs would fall to around 100 per cent and secondary GERs toa little over 80 per cent. This is shown in Simulation 4 (Chart 4.11).
0
0,5
1
1,5
2
2,5
1996 1998 2000 2002 2004 2006 2008 2010
Year
Rec
urre
nt c
ost a
s pr
opor
tion
of b
ase
year
Primary recurrent Secondary recurrent Total recurrent costs
87
Financing secondary education in Zimbabwe:access, equity and efficiency revisited

International Institute for Educational Planning http://www.unesco.org/iiep
Chart 4.11 Simulation 4: Recurrent costs for primary and secondary as proportion of total base-year costs, 1996-2010
It should be noted that the simulations do not take account of theshort-term costs of training more teachers and eliminating untrainedteachers; they simply account for the additional salary bill which resultsfrom an increased number. Nor do they account for additional capitalcosts. The latter is important and could be simulated with cost data onbuildings. However, it is unlikely that this will be the defining constrainton growth in participation. External assistance is probably available tosupport capital costs and long-term borrowing would create manageablerepayment schedules if a priority were attached to expanding the stockof school buildings, using structures with appropriate costs.
If higher rates of gross enrolment at secondary are to be achieved,and costs per student are to rise in real terms, allowing improved qualityand better distribution, the simulations suggest that there is a new financialchallenge to be met. The simulation shows costs as a proportion of costs inthe baseline year. If GNP grows at the same rate as population (2.9 per cent)over the next 15 years, then the resources available will grow by 1.5 times.
Zimbabwe’s education budget is likely to remain constrained tolevels not very different from current levels. Few countries spend moreas a percentage of GNP; most spend less. Real per-capita growth in GNPover the period from 1980 has been negative (-0.6 per cent p.a.). GNPshrank over the period 1990-1996 by -1.1 per cent per annum. Unlessvery optimistic assumptions are made about economic growth, anincrease in the costs of the education system of as much as 1.5 times over
0
0.5
1
1.5
2
2.5
1996 1998 2000 2002 2004 2006 2008 2010Year
Rec
urre
nt c
ost a
s pr
opor
tion
of b
ase
year
Primary recurrent Secondary recurrent Total recurrent costs
88
Financing secondary education in developing countries

International Institute for Educational Planning http://www.unesco.org/iiep
the next 15 years in real terms would seem to be difficult to attain. Thiscould only be achieved with 3 per cent growth or an increase in theproportion of GNP allocated to education by 50 per cent from its currentlevel of about 8 per cent. Both of these seem unlikely. The simulationssuggest that if drop-out is to fall, and secondary participation to increase,more than a 1.5 times’ increase in expenditure would be needed. Theimpact of HIV/AIDS on these projections is uncertain but is likely tobe significant. Teacher attrition is rising and population growth isfalling. Economic growth is likely to be adversely affected.
This then is the challenge that confronts policy-makers. We nowturn to some concluding remarks.
3. Concluding remarks
This discussion illustrates how some policy initiatives haveinfluenced the development of education in general, and secondaryeducation in particular, in Zimbabwe since 1980. Important strategiesincluded the transformation of the colonial education systems into onesystem; unimpeded progress from Grade 1 up to Form 4; tuition-freeprimary education from 1980 to 1990; the use of temporary untrainedteachers to meet short-term needs; double-sessioning of school facilitiesin areas where enrolments grew fastest; and cost-sharing measures in thefinancing of education. Together these have enabled Zimbabwe toachieve universal access to primary schooling and high rates ofsecondary participation.
While it is clear that the policies adopted have helped to improveaccess, issues of quality, efficiency, relevance and equity have remainedproblematic. It has been argued that the school governance and financingsystem remains a source of fundamental inequalities in the provision ofquality education to the bulk of the population, especially at secondarylevel. Local authorities and communities have accepted the challenge ofproviding primary and secondary education in partnership withgovernment in an unusually effective way. However, a consequence hasbeen that great variations in the quality of schools remain associatedwith the resources that different communities have available. In somecases, inequalities may have increased. The quality of educationprovided by schools depends as much or more than it did previously onthe socio-economic status of the communities which support theschools. This is a predictable consequence of more emphasis on local
89
Financing secondary education in Zimbabwe:access, equity and efficiency revisited

International Institute for Educational Planning http://www.unesco.org/iiep
financing. Though there are some mechanisms which seek to provideenhanced subsidies and safety nets for those communities andresponsible authorities with fewest resources, these seem insufficient tocompensate for enduring variations in the quality of provision.
Since the early 1980s, the majority of primary-school children inrural areas have lived within five kilometres walking distance of aschool. Their secondary-school counterparts live within 10 kilometresdistance, though in remote and disadvantaged rural areas, pupils maywalk longer distances to school. The majority of secondary schools,which opened between 1980 to 1990, started by sharing facilities withhost primary schools, while their separate facilities were being providedfor at separate sites. Some of these secondary schools are still beinghosted at primary schools more than 10 years after they were opened. Inaddition, the overwhelming majority of these rural district councilsecondary schools have inadequate tutorial and sanitary facilities,teachers’ houses and learning/teaching resources. However, the story isdifferent when it comes to non-government trust, church andgovernment schools. In most of these, facilities are readily available.
The cost-recovery measures at the secondary-school level since1980 and the re-introduction of cost-recovery measures in primaryschools in 1991, also appear to have had the effect of increasing someinequalities. Given the social preferences of many parents to invest in theeducation of boys, this has been particularly relevant to the persistenceof gender differences in enrolment in secondary schools. Increases in thedirect costs of schooling to pupils and parents are likely to haveencouraged those with fewest home resources to drop outdisproportionately. This, taken with continued high unemploymentamongst ‘O’ level graduates, has not encouraged greater retention rates.Arguably, children are getting increasingly frustrated seeing theirbrothers and sisters, who successfully completed their ‘O’ level studies,doing nothing and/or working casually in informal-sector activities. Thisraises curricular issues and questions about the extent to which existingsecondary schooling constitutes an adequate and appropriate preparationfor the opportunities for work and livelihoods that are likely to exist. Itsuggests that further expansion of participation in secondary schoolingmust recognize needs to promote employable skills and address thelearning needs of those who will not continue to study and who willwork outside public-sector employment.
The use of untrained ‘O’ level graduates and teacher trainees asfull-time temporary teachers and the use of double-sessions using the
90
Financing secondary education in developing countries

International Institute for Educational Planning http://www.unesco.org/iiep
same school facilities was helpful in lowering the short-term costs ofexpansion. Double-session working in Zimbabwe does not save salarycosts, since additional teachers are employed. It does contribute to alowering of fixed costs per pupil and the more efficient use of the capitalstock of buildings, etc. It may be that the use of temporary teachers anddouble-session schooling has exacerbated problems with school quality,though empirical support for this proposition is not available. Withoutthese measures it is clear that enrolment gains would have taken longerto achieve. The scope for these strategies to support expansion in thefuture is limited, but should not be ignored. It remains attractive to useschool facilities as intensively as is feasible, whilst the stock of buildingsis gradually expanded. In principle there are many attractions tocontinuing to employ a proportion of temporary and untrained teachersprior to initial qualification as teachers. If such staff are mentored byexperienced teachers, serve for one to three years as teaching assistantsas a pre-qualifying period for training, and are paid at lower rates thanfully qualified teachers, there may be gains for all those involved. Morepupils can be enrolled at lower pupil/teacher ratios with lower costs thanwould otherwise be the case. Teaching assistants can acquire skills onthe job. Those who decide teaching is not their chosen vocation can altercareer pathways before the public expense of initial training is incurred.
If, as seems likely, the overall public resources allocated toeducation are unlikely to grow in real terms, then improvements inaccess, retention and quality have to be largely financed fromimprovements in distribution, more efficient use of existing resources,and the maximum use of alternative sources of funding. Taking these inturn, first the analysis raises distribution questions which require moredetailed data to explore than those available. Some gains are likely to beavailable from redistributing public subsidies towards thosecommunities with the least ability to locally finance improvements. Howmuch effect this would have could be ascertained from examining whichsubsidies might be re-profiled to favour the most disadvantaged. Second,efficiency gains are probably available from within the school system.Identifying where these opportunities lie depends on an analysis ofschool-level income and expenditure and, in particular, the deploymentand utilization of the most expensive resource-trained teachers. Third,the prospects for significant growth in alternative sources of funding donot seem extensive. The current climate of economic austerity is likelyto suppress incomes and may do so disproportionately amongst thepoorest. Where communities are willing and able to maintain and
91
Financing secondary education in Zimbabwe:access, equity and efficiency revisited

International Institute for Educational Planning http://www.unesco.org/iiep
increase levels of private and community-level subsidy, it would seemessential to continue to encourage this, despite possible consequencesfor equity. The alternatives, which might discourage such contributions,would simply increase pressures on the public budget or diminishquality, or both. More constructive responses would offer moreincentives for contributions through matching grants coupled with safetynets, which would work to diminish inequalities arising from variationsin community and private resources.
Seventeen years after the attainment of independence, thegovernment has carried out a major education review, includingrepresentation from government ministries, universities, the privatesector, other stakeholders and interest groups, and NGOs. The areasreviewed include financing of the education system; curricula relevance;equity and quality issues; conditions of service for teachers, schoolgovernance, other forms of education provision, such as out-of-schooldistance learning and/or single-teacher schools in sparsely populated,remote and isolated rural districts; and the vocationalization ofsecondary education.
Currently, the construction of new primary and secondary schoolsis being discouraged, except in newly settled areas, commercial farmingareas and those disadvantaged rural areas which still need thesefacilities. It is hoped that this will allow consolidation of gains inenrolment rates and permit additional funds to be allocated to improvethe facilities and learning materials in existing schools, especially thoseunder rural district councils. The policy is aimed at improving thequality of education offered at all schools, irrespective of type. It may bethat this is a precondition for the further expansion of secondaryenrolments, given the constraints on public-sector spending.
The secondary gross enrolment rate stands at about 44 per cent.This implies, at best, that about 30 per cent of Zimbabwean children arereaching ‘O’ level, of whom perhaps half fail to achieve pass grades.Thus, about 15 per cent of the age group appears to be entering the labourmarket with successfully completed secondary schooling. The inferenceis that the Zimbabwean labour force currently includes well below 10 percent of its workforce with successfully completed secondary schooling.The question is therefore posed whether this rate of output will besufficient in quantity and quality to increase the numbers of secondary-educated workers in the labour force to levels which will meet the futureneeds of the economy for middle-level personnel and those with abstractand analytical thinking skills, unlikely to be developed and consolidatedthrough completion of the primary grades alone.
92
Financing secondary education in developing countries
International Institute for Educational Planning http://www.unesco.org/iiep
In conclusion, it seems appropriate to suggest that it is important,to review how to make better use of existing capacity and extendopportunities to participate in secondary-level education withoutunsustainable cost burdens. A creative approach to this needs not only toexplore how schools can be more efficient working in conventional full-time class teaching modes, but also whether the resources available canbe used to contribute to less conventional modes of delivery. Distanceand mixed-mode education (formal/on-the-job/part-time, etc.) haveplayed a significant role in the development of secondary education. Thepotentialities of developing more flexible use of the resource thatsecondary schools represent are considerable. This would be one way ofincreasing both the quantity and quality of secondary-educated citizens,especially if teacher supply is adversely affected by HIV/AIDS. Withoutsome reconceptualization of this kind, it would seem likely thatenrolment growth and participation at secondary will stagnate at currentlevels.
93
Financing secondary education in Zimbabwe:access, equity and efficiency revisited

International Institute for Educational Planning http://www.unesco.org/iiep
Introduction
Malawi has some of the lowest enrolment rates at secondary levelin sub-Saharan Africa. The secondary gross enrolment rate wasestimated at about 4 per cent in 1985 and had only reached 6 per cent by1995 (UNESCO, 1998). Only one-third of those enrolled in governmentsecondary schools are girls. Over the past two decades the transition rateinto secondary schools from primary has remained low. In 1997 about147,000 pupils were in the final grade of primary school and werecompeting for about 11,000 new places in government secondaryschools. Correcting this for repeaters gives a nominal transition rate ofabout 10 per cent.1
Historically, low enrolment rates at secondary have beenassociated with low levels of participation at primary. Gross enrolmentrates at primary averaged about 65 per cent in the early 1990s andrepeaters occupied 15-20 per cent of all primary-school places. Itappears that as many as 20 per cent of Grade 1 pupils drop out beforereaching Grade 2.2 The number of pupils enrolled in Grade 8, the end ofthe primary system, is currently about 18 per cent of the number enrolledin Grade 1, giving some idea of the magnitude of the attrition resultingfrom drop-out.
95
Chapter V
Secondary schooling in Malawi:the challenge of financing enrolment
growthKeith M. Lewin
1. Excluding those enrolling in the Malawi College of Distance Education (see below).2. Official drop-out rates (up to 28 per cent from Grade 1 to Grade 2 in the 1997 school
census report) appear to exaggerate the magnitude of drop-out. Case-study data underdevelopment (Chimombo, 1999, personal communication) indicate that estimates maybe based on inflated enrolment figures for Grade 1 and are often unreliable.

International Institute for Educational Planning http://www.unesco.org/iiep
In 1994 the Malawi government adopted a policy of Free PrimaryEducation (FPE) designed to universalize access. This resulted in amassive increase in the number of primary students – from about1.9 million to over 3 million by 1995. Necessarily, the proportion of thenational education budget allocated to support primary schools hasincreased substantially. This has placed severe constraints on the financingof secondary schools, not least because the average cost of secondaryschool places remains relatively high. The cost per pupil of places innormal government secondary schools can be as high as seven or moretimes that in government primary schools and is higher in boardinginstitutions.
Given the very low secondary enrolment rates in Malawi3 thequestion is under what circumstances might it be possible to increaseparticipation at secondary level in a financially sustainable way? Thischapter explores this question by first outlining broad features of theMalawi education system. Second, it provides detailed insights into theprovision of secondary schooling in Malawi, discusses methods offinancing, and identifies costs per pupil related to different types ofschools. Third, the chapter develops a simulation of how resource needsare likely to grow under different plausible scenarios. Finally, the chaptersummarizes the issues for policy and practice that arise from the analysis.
1. Background
Malawi is one of the poorest countries in Africa with a GNP percapita of US$170 in 1995 (750 $PPP). Adult illiteracy is estimated at44 per cent and is much greater amongst women than men (58 per cent– 28 per cent). Child mortality is amongst the highest in the world(234/1,000 for children under five years). Malawi has a populationwhich the most recent estimates suggest is about 9.5 million, well belowpredictions of the last census (1987) which predicted over 11 million.The current growth rate in population has not been clearly determined,
96
Financing secondary education in developing countries
3. Malawi does have a long primary cycle (eight years), which in some countries wouldinclude lower-secondary grades. The enrolment of secondary-level pupils is very low bothbecause transition rates are small and because attrition through the primary grades is sohigh.

International Institute for Educational Planning http://www.unesco.org/iiep
Financing secondary education in Zimbabwe:access, equity and efficiency revisited
97
but it has probably fallen from over 3 per cent to not much more than2 per cent.4 Over 45 per cent of the population is under 15 years old. Mostof the population is rural (85 per cent) and agriculturally dependent.
Participation rates at primary and secondary level have beenamongst the lowest in Sub-Saharan Africa and repetition and drop-outremain at high levels throughout the education system. Malawi hasrecently emerged from a period of one-party government, during whichtime educational development was modest. The new government hasemphasized the importance of universalizing primary education,investing more in the development of secondary schooling, andmaintaining the higher education system. It has increased the proportionof the national budget allocated to education.
Structurally, Malawi’s school system consists of eight years ofprimary schooling followed by four years of secondary. In principle, allchildren are eligible for free primary schooling provided through morethan 3,700 primary schools. Progress through primary schools isdetermined by school promotion tests. In most grades, repetition exceeds15 per cent and can be as high as 25 per cent. Selection into secondaryschool is determined by the Malawi Primary School LeavingExamination, which allows less than 10 per cent of those who sit toobtain secondary-school places in normal government secondaryschools. Secondary schools are organized into junior and senior cycleswith a selection examination after the first two years (Junior SchoolCertificate, or JSC), which the great majority pass. At the end of thesecondary cycle, the Malawi School Certificate of Education (MSCE)examination controls access to post-school education and training. Passrates in these examinations vary between about 30 per cent and 60 percent. Those obtaining full certification in five subjects are a smallerproportion. Very small numbers (1,000-1,500 a year) are admitted intouniversity-level courses in the University of Malawi.
Primary-school enrolments increased from about 900,000 in 1984to about 1.9 million in 1994. After the introduction of free primaryeducation (FPE) in 1994, primary-school enrolments peaked at3.2 million in 1994/1995. Subsequently, enrolments fell back to2.9 million in 1995/1996 and diminished further to 2.8 million by 1998.
4. Preliminary results from the 1997 census are just becoming available. Though some ofthe difference in population size between this and the previous census may be accountedfor by refugees returning to Mozambique, not all of the shortfall can be explained thisway. No figures are available for the growth in the school-age cohort, but an informedguess might place this between 2 per cent and 2.5 per cent.

International Institute for Educational Planning http://www.unesco.org/iiep
Much of the expanded enrolment has been in Grade 1, which increasedfrom about 500,000 to over 1 million in the year of implementation ofFPE. In 1995/96 there were about 47,000 primary teachers in Malawi, ofwhom more than 30 per cent were unqualified. More than 20,000 newprimary teachers have been recruited – an increase in the total number ofprimary teachers by as much as 40 per cent – to meet the demand fornew teachers. These teachers are being paid at rates below those for fullyqualified teachers (until they qualify). Nevertheless, the budgetaryimpact of their salaries is substantial. All the direct costs of primaryschooling are met by the government. The growth of primary schoolenrolments is shown below in Chart 5.1.
Chart 5.1 Primary enrolments by year, 1974-1996
There are several recognized categories of secondary school –government boarding, where boarding is provided at nominal cost topupils; government day schools, where boarding is very common but ispartly financed from fees5; and grant-aided schools, which receive agovernment subsidy related to school size, have the salaries ofgovernment teachers paid, and charge fees to cover other costs.Government-supported schools are now all called conventionalsecondary schools (CSS). The Malawi College of Distance Education(MCDE) organizes a large number of schools in which teachers’ salariesare paid by the government and which charge fees to students. These
0
500,000
1,000,000
1,500,000
2,000,000
2,500,000
3,000,000
3,500,000
1974 1976 1978 1980 1982 1984 1986 1988 1990 1992 1994 1996
Year
Enr
olm
ents
98
Financing secondary education in developing countries
5. Fees probably account for about 10 per cent of boarding costs.

International Institute for Educational Planning http://www.unesco.org/iiep
schools are now designated Community Day Secondary Schools(CDSS). Private schools are growing in number. In these everything isfinanced from fees and contributions. There are four nationalgovernment boarding schools, 23 day CSS, 33 Boarding CSS, 27 grant-aided schools, and over 400 MCDE schools. At least 137 private schoolsexist and an unknown number are unregistered. Table 5.1 shows thenumber of schools by type and their enrolments.
Table 5.1 School type by number of schools and enrolments, 1997
99
Financing secondary education in Zimbabwe:access, equity and efficiency revisited
CSS CSS CSS G National Government MCDE Private Totalday boarding aided boarding total
Schools 23 33 27 4 87 401 137Enrolment 17,429 15,000 10,000 1,500 43,929 108,846 21,712 174,487
In 1997 all types of government and grant-aided schools enrolledabout 44,000 students, the Malawi College of Distance Education(MCDE) 109,000, and private schools about 22,000. In addition therewere about 1,000 students in technical schools. Government secondaryschools employ about 3,000 teachers; a further 2,500 are in the MCDEsystem. The growth in enrolments in secondary schools (government,maintained and private) and in the MCDE system is shown in Chart 5.2.
Chart 5.2 Enrolments in secondary schools and in MCDE schools,1975-1997
0
20,000
40,000
60,000
80,000
100,000
120,000
1975 1977 1979 1981 1983 1985 1987 1989 1991 1993 1995 1997
Year
Enr
olm
ent
Secondary MCDE

International Institute for Educational Planning http://www.unesco.org/iiep
100
Financing secondary education in developing countries
From Chart 5.2 it is clear that there has been a rapid increase inenrolments in the MCDE. In 1993/1994 the MCDE system enrolledabout 56,000 pupils; by 1997 this number had nearly doubled. Thenumbers known to be in private schools increased by about 50 per centover the same period.6 In contrast there was only a modest growth in thenumbers enrolled in government secondary schools.
In 1985, Malawi allocated about 3.5 per cent of its GNP toeducation. By 1998 this had risen to over 5.5 per cent. The proportion ofthe public expenditure budget allocated to education has grown fromabout 11 per cent in 1990 to 27 per cent in 1994/1995 and was projectedat about 30 per cent for 1997/1998. Within these amounts primaryeducation has seen its share increase from about 45 per cent in 1990 toaround 50 per cent in 1994 and over 60 per cent in 1997/1998. Chart 5.3shows these proportions. The effects of the recent emphasis on primaryschools is evident.
Chart 5.3 Recurrent allocation to education – Percentage of total
Chart 5.3 shows that allocations to the university are consistentlymore than those made to the secondary school system. Typically, twiceas much has been allocated to the university than to the secondaryschools in most recent years.
0
10
20
30
40
50
60
70
1989 1990 1991 1992 1993 1994 1995 1996 1997 1998
Year
Perc
enta
ge
Primary Secondary TTC University
6. The real increase was certainly more than this, but since many schools are not registeredthe actual numbers enrolled are not known.

International Institute for Educational Planning http://www.unesco.org/iiep
Financing secondary education in Zimbabwe:access, equity and efficiency revisited
101
The most recent official estimates of unit costs at different levelsof the education system are shown below (Table 5.2). These arecalculated simply by dividing the public recurrent expenditure at eachlevel by the numbers enrolled. Prices are in current Malawi Kwacha.
Table 5.2 Public unit costs of schools 1995/1996 (Malawi Kwacha)
1995/1996 1996/1997
Primary 195 244
Secondary 1,315 1,506
Secondary MCDE 170 83
Teacher training 10,510 5,200
University 42,790 42,915
Source: Government of Malawi Basic Statistics, Malawi, 1997 (Table 8.2).
Unit costs at secondary appear to be about six times those atprimary. University unit costs are over 150 times those at primary.MCDE unit cost appears to have fallen to about a third of those atsecondary as enrolments have expanded rapidly. These figures are basedon the MCDE budget, which does not include the salary costs of teachersand is therefore a significant underestimate of costs.
The amounts for Teacher Training only cover some of the costs ofthe system. The Malawi Integrated In-service Teacher Education Project(MIITEP) provides short residential periods of training coupled with in-service support (DSE, 1998). The unit costs reported do not represent thefull costs of training, since they do not include the non-College costs orthe externally financed elements, which are substantial (Kunje andLewin, 1999).
The Policy and Investment Framework (PIF) of the MalawiGovernment provides details of educational policy commitments whichrelate to secondary schools and this indicates commitments to:
• increase access to secondary schools by improving transition ratesfrom primary to secondary to 30 per cent. This will be achievedby a large expansion in the number of secondary schools. In thefirst phase it is planned to build 63 day schools in rural areas;
• encourage the development of private secondary schools;• reduce double shifting where this is feasible by opening additional
secondary schools;• undertake a curriculum review to support more equitable access
and improve quality;

International Institute for Educational Planning http://www.unesco.org/iiep
• increase the number of places in secondary schools for girls;• increase the number of secondary teachers in training and train
those who are unqualified;• establish a textbook fund to improve the supply of books.
Some of the implications of these commitments are explored laterin this analysis.
2. Characteristics of the secondary-school system
It is possible to profile key characteristics of the Malawisecondary-school system using data drawn from the 1996 school census.A data set was developed which included all the government,government-maintained and MCDE schools. Those private schoolsmaking returns to the census were also included, but this group may notbe representative of all private schools. Data on enrolments and staffingwere linked to financial information and to data on pass rates inexaminations. Table 5.3 shows how types of schools varied on basicparameters.
Table 5.3 Characteristics of Malawi secondary schools, 1995/1996
102
Financing secondary education in developing countries
School type Average Average Average Average Average Average MCSEnumber of enrolment pupil/ number of number of number of pass rateteachers teacher teaching pupils/ teachers/
ratio periods class class
Government boarding 25.8 427 16.4 22.0 34.8 2.1 53.7Government day 17.3 438 29.7 24.8 43.7 1.6 52.1Grant aided 16.4 388 24.2 24.1 44.1 1.8 64.1MCDE (day) 6.8 373 55.0 19.0 98.6 2.0 11.6Private 11.4 274 24.5 22.6 42.0 1.8 55.3
Boarding, government and grant-aided schools are similar interms of average size, with around 400 students. Amongst these75 schools, nine have enrolments below 300, and five have more than700 enrolled. Most schools are built for a three or four-form entry of40 pupils per class. MCDE schools enrolled about 350 pupils on averagein 1996.7 Private schools on which there are data tend to be smaller, withan average of about 270 enrolled.
7. Enrolments in the MCDE system appear to have been growing faster than the number ofschools. If this is true, average school size will have increased.

International Institute for Educational Planning http://www.unesco.org/iiep
103
Financing secondary education in Zimbabwe:access, equity and efficiency revisited
The pupil/teacher ratio is as low as 16:1 in government boardingschools, and between 25:1 and 30:1 in government day and grant-aidedschools, respectively. The figures for private schools are unlikely to berepresentative and are changing rapidly as this sector expands. It isprobable that pupil/teacher ratios are worsening and class sizes growing– there are certainly cases where over 100 pupils are enrolled in a classin private schools. This is not likely in government and government-aided schools. In some private schools, teaching loads may also berelatively light as a result of teaching large class groups together. In oneschool visited, teachers averaged about 14 periods per week, but taughtgroups in excess of 90 pupils. These teaching loads and class sizes arecomparable to MCDE schools.
Pupil/teacher ratios in MCDE schools are much higher than inother schools and average about 51:1 at this time. Overall, the number ofpupils per class group exceeds 90:1 in the MCDE system, compared toaverages of between 34 and 44 in government schools. The number ofteachers per class varies between 1.6:1 and 2:1. Notably, MCDEteachers average about 40 per cent fewer teaching periods per week thanteachers in other schools. Thus, very large class groups are organizedwhich allow low teaching loads. If teaching loads were similar to thoseof other teachers8, groups would be smaller. For example, in one MCDEschool visited the pupil/teacher ratio was nearly 60:1; there were 715pupils enrolled and teaching groups for Forms 1 to 4 respectively were91, 118, 102, 102.
In 1995, examination pass rates at the Malawi School Certificateof Education in government schools averaged around 53 per cent andreached about 64 per cent for the grant-maintained schools, many ofwhich are run by Missions. There was no clear relationship between passrates and the pupil/teacher ratio, which is the prime determinant of costper pupil. Chart 5.4 shows this.
8. MCDE schools tend to function as normal secondary schools, in the sense that pupilsattend (or board) on a regular basis and are taught each day by teachers presentingmaterial from specially produced collections of teaching material. These collections aremade up of learning material, some of which is reprinted from conventional textbooks.Unlike normal secondary schools, there is considerable study time available when formalteaching is not taking place, but this is often unsupervised. In many cases, the buildingfacilities are insufficient to house all pupils and classes are held outside.

International Institute for Educational Planning http://www.unesco.org/iiep
Chart 5.4 Pass rate at MSCE by pupil teacher ratio –Government and grant-maintained schools
Chart 5.4 illustrates not only that PTR is unrelated in any simpleway to examination performance, but also that PTRs vary over a widerange in these schools. Though the average is about 25:1 there are asignificant number of schools with ratios as low as 15:1 and others thatexceed 40:1. An increase in the lowest ratios to values closer to the averagewould lower average costs per pupil. It would seem unlikely that increasesof this kind would adversely affect the pass rate at MSCE, since these passrates varied widely in 1995 in ways which appear to be independent ofsimple relationships with PTR and costs per pupil (Chart 5.5).
During the same period the pass rates in MCDE schools were verylow and averaged around 11 per cent. These rates also do not appearsimply related to pupil/teacher ratios or to class size. Chart 5.6 illustratesaverage class sizes and performance on MSCE in 1995. The range ofpass rates is wide. Some schools have pass rates that exceed 25 per cent,but in many only less than 5 per cent of those who enter succeed inpassing. Class sizes exceeding 150 are not uncommon in these schoolsand this almost invariably means teaching taking place outdoors or inand around classrooms. MCDE are thus very inefficient if judged by thenumbers of students that successfully graduate.
0%
10%
20%
30%
40%
50%
60%
70%
80%
90%
100%
0 10 20 30 40 50 60Pupil teacher ratio
Pass
rat
e M
SCE
104
Financing secondary education in developing countries

International Institute for Educational Planning http://www.unesco.org/iiep
Chart 5.5 Pass rate at MSCE by cost per pupil – Government andGovernment-assisted schools
Chart 5.6 Pass rate at MSCE by class size – MCDE schools
Since 1995 pass rates have deteriorated. The most recent datafrom 1997 produce the pattern shown in Table 5.4.
0
5%
1O%
15%
2O%
25%
30%
35%
40%
0 50 100 150 200 250
Class size
Pass
Rat
e M
SCE
0%
10%
20%
30%
40%
50%
60%
70%
80%
90%
100%
0 500 1,000 1,500 2,000 2,500 3,000
Cost per pupil (MK)
Pass
rat
e M
SCE
105
Financing secondary education in Zimbabwe:access, equity and efficiency revisited

International Institute for Educational Planning http://www.unesco.org/iiep
Table 5.4 Pass rates (%) at MSCE by school type, 1997
106
Financing secondary education in developing countries
CSS day CSS boardCSS National Government
grant-aided type averageMCDE Private9
Pass rate % 28 33 60 55 36 8 34
9. Figures for private school costs are unreliable given the incomplete nature of data ontheir numbers and budgeting.
Average pass rates in all government schools have fallen to about36 per cent. MCDE pass rates are now below 8 per cent and havediminished as enrolments have rapidly increased. This indicates thatboth systems are deteriorating in internal efficiency and that the cost persuccessful completer will be rising as pass rates decline.
As noted above, the transition rate into secondary schools inMalawi is very low. This creates considerable pressure on entrance togovernment secondary schools. Those who do not get admitted have onlytwo options – the MCDE system, which has low quality and relativelylow public costs, or private schools, which have been developing rapidlysince 1994 to meet excess demand. It is apparently the case that manyprivate secondary schools are now setting their own entrance-examination tests to select new pupils. It is believed by some that this isa more reliable method than using the results of the Primary SchoolLeaving Certificate. It is also the case that some of the more popularMCDE centres operate selection tests of their own design to limit access.
Double shifting is not common in government and grant-aidedsecondary schools. Given the shortage of places in secondary schoolsthis is surprising. Four government day secondary schools have beeninvolved in an experimental period of double-shift schooling, wherebytwo shifts attend the schools each day. This results in slightly shorterschool hours for pupils and teachers. This system makes more efficientuse of the physical facilities and reduces overheads associated with thebuildings and equipment. Evaluation studies (Kadzimira et al., 1995)show no significant differences in the performance of pupils at MSCE asa result of double shifting when performance is compared with controlgroups. Some teachers are attracted by the shorter hours they arerequired to teach in these schools. Since teachers are not used moreintensively in these schools, savings are not produced in recurrentexpenditure on teachers’ salaries. The schools apparently remainrelatively unpopular with parents, since they have shorter school daysand longer periods when pupils are out of school, when one or bothparents may be working.

International Institute for Educational Planning http://www.unesco.org/iiep
Financing secondary education in Zimbabwe:access, equity and efficiency revisited
107
3. School finance and costs
Government schools are funded from the Ministry of Education(MOE) budget and estimates for each school were included in the Votefor the MOE until recently. Grant-aided schools receive incomeessentially on the basis of the number of students, the proportion ofboarders and other special features that they may have. These schoolsmay receive income from other sources and generally maintain their ownfinancial accounting and auditing systems. The MCDE system alsoreceives a budget directly from the MOE, but this does not include thesalary costs of teachers. An overall picture of income and expenditure istherefore not readily available.
Malawi has experienced considerable currency instability, boutsof high price inflation, and sporadic adjustments of salary levels ofteachers to respond to increases in costs of living. This means it isdifficult to trace patterns of expenditure year on year. It also means thatwhatever monies are allocated at the beginning of the financial year mayhave to be subvented during the year. The initial analysis here mostlyuses costs in Kwacha for 1995/1996. At this time the Kwacha was valuedat about US$0.07. Since 1996, there have been substantial furtherdevaluations.10
Since the advent of FPE in 1994, primary schools have notcharged school fees. Parents have to bear other direct costs in all or part– books, transport, food, uniforms etc. At secondary level fees continueto be charged at different rates for different schools. In governmentboarding schools a charge of MK125 was levied in 1995/1996 per term,along with a tuition fee of MK20 and a general fee of MK15. This feeincome is insufficient to provide an adequate operating budget. In thefour national boarding schools the difference between the fee incomeand related expenditure is met by additional subventions provided as andwhen needed. According to the principal of one of these schools a fee inexcess of MK400 per term would have had to be charged in 1995/1996(more than MK1,200 p.a.) to balance the budget in terms of directboarding costs. This is in addition to the salary costs of teachers whichare met by central government at generous pupil/teacher ratios of about16:1.
10. The Malawi Kwacha was substantially devalued around the period just before the newgovernment took office in 1994. From a value of about MK4 to the US$ in early 1994 itfell to about MK18 to the US$ by the end of 1994. It stabilized in 1995 at aboutMK15=US$1. More recently, currency fluctuations have driven the value of the Kwachadown to about MK45 to the US$ (1998).

International Institute for Educational Planning http://www.unesco.org/iiep
Government day schools are not officially boarding schools. Inpractice, almost all students board. Fees are charged at the same rate asin official boarding schools (a total of about MK160 per term), but thisis inadequate. In one of the government day schools visited, the revenuegenerated was sufficient to meet about half of the food bill for boarders.In 1994/1995 this school operated on a nominal expenditure of aboutMK1,070 per student, but this was subsequently supplemented byadditional payments and provision of free rice. Government-assistedschools charge boarding and tuition fees. In one school visited thesewere about MK300 per term in 1994/1995. The principal argued that thiswould have to rise to over MK500 per term in 1995/1996 if the budgetwere to balance.
Private schools vary in fee policy and it has not been possible toexplore the range of practice since data are not available. Some privateschools associated with Missions were charging fees of MK1,700 perterm or more in 1995, all but MK200 of which were attributed toboarding costs. Another private commercially run school visited in mid-1995 charged MK850 tuition and MK850 boarding fees per term.
MCDE fees are paid on entry to a two-year cycle leading to theJunior Certificate of Education (MK60) or the Malawi School Certificateof Education (MK50). These fees are therefore very low. Most of theMCDE centres charge an additional ‘Centre fee’ of around MK50, whichis used to cover operating costs. Boarding charges are also additionaland can be in the region of MK600 for 1995/1996. Boarding is organizedon a commercial basis and there appears to be no regulation of the feescharged.
The cost of school books can be a large indirect cost. Texts inmain subjects can cost MK50 or more for imported books. Up to eightdifferent books are needed for each class at a total cost of up to MK400for a complete range for a pupil. MCDE estimates the cost of productionof its learning ‘sets’ at about MK25 in 1995. These units are paper-covered booklets of about 40 pages. There are 45 units at JCE level (totalcost MK1,125) and 61 at MSCE level (total cost MK1,525). Enrolmentfees for MCDE recoup only a very small proportion of this – less than5 per cent. NGOs appear to be able to produce similar-quality materialsat significantly less cost per booklet. MCDE booklets used to have to becollected from printing units. Since 1995, distribution is supposed to bedirect to centres, but there remain problems with the supply and with latedelivery.
108
Financing secondary education in developing countries

International Institute for Educational Planning http://www.unesco.org/iiep
The costs of uniforms average about MK300. Othermiscellaneous costs for writing materials, pocket money, etc., probablyadd up to another MK300 over a year in addition to the costs oftextbooks. Private tuition is taken by some secondary pupils. The costsof this vary widely, but typically appeared to fall in the range of MK50-MK150 per month in 1995.
4. Patterns of expenditure per pupil
On the basis of budget data available in 1995, the unit expenditurein government boarding schools was calculated to be about MK2,240,and in government day schools about MK990 per pupil. This was likelyto be an underestimate of the actual expenditure. The most commonreason for this is the need to support additional boarding costs (in mostgovernment day schools many children board). In 1995, fees ingovernment schools (see below) generated a half, or less, of the moneyneeded to provide food for boarders, though this was during a period ofprice instability with rapid inflation. Free rice has been provided as partof emergency assistance to schools, in addition to supplementaryadditional payments to meet food bills. It seems probable that the actualunit cost of government schools in 1995 was up to MK1,500. Similarly,the unit cost of official boarding schools was probably significantlyhigher than the figures that can be derived from the budget statementsand may have exceeded MK3,000.
The public expenditure per pupil for government schools, usingthe raw MOE data from actual expenditure reported in the MOE Vote for1995/96, is as shown in Chart 5.7 below. The expenditure per pupilvaries from below MK500 to more than MK2,500. The highestexpenditures are in the government boarding schools. The range ingovernment day schools is still large, varying over a range of 3:1. Thismay indicate scope for increases in internal efficiency in schools whichhave high unit costs. It is noticeable that most schools are clusteredaround enrolments of 300-400 and 500-600 representing 3- and 4-formentry schools. Schools with a 5-form entry appear cheaper per pupil thansmaller schools (Chart 5.7).
109
Financing secondary education in Zimbabwe:access, equity and efficiency revisited

International Institute for Educational Planning http://www.unesco.org/iiep
Chart 5.7 Cost per pupil by school size – Government schools
Government day schools spent more on salaries than on non-salary expenditure. However, non-salary costs accounted for asurprisingly large amount - about 44 per cent of the total recurrent costs.In the boarding schools more was spent on non-salary expenditure, asmight be expected – as much as 60 per cent of recurrent costs. There isa general tendency for larger schools to have a higher ratio of salary tonon-salary expenditure, indicating that there are economies of scale. It isnoticeable that many individual schools spend more on non-salaryexpenditure than salaries, which is unusual in many secondary schoolsystems (Chart 5.8).
0
500
1,000
1,500
2,000
2,500
3,000
0 100 200 300 400 500 600 700 800 900 1,000
School size
Cos
t per
pup
il (M
K)
110
Financing secondary education in developing countries

International Institute for Educational Planning http://www.unesco.org/iiep
Chart 5.8 Ratio of salary to non-salary expenditure – Governmentschools
Public expenditure in grant-aided schools is made up of the salariesof government-supported teachers and the grant in aid. Schools receivegrants based on enrolments. This was about MK145 per pupil in 1994.The data show variations between MK100 and MK200 per student acrossgrant-aided schools for reasons that are not clear. The pupil/teacher ratioin these schools appears to average a little less than in governmentschools, making them more expensive. It would appear that public unitexpenditure in these schools was probably around MK750 in 1994.
Additional expenditure in grant-aided schools is met from othersources, usually fees, endowments or contributions. There is noconsolidated accounting system for grant-aided schools which canprovide aggregate data on the non-government expenditure in theseschools. From exemplary data on one established grant-aided school inZomba, it appears that total expenditure per student financed from thegrant, fees and other income was about MK670 in 1994, withoutincluding the salaries of government teachers or those contributing toteaching who are missionaries. Mission staff who teach were paid a flatrate salary (around MK1,600). Government teachers are paid at normalrates. If these teachers’ salaries were included in this schools’ budget, theoverall unit cost would be comparable with government schools andprobably averaged about MK1,500 in 1994. However, the cost togovernment is limited to the salary costs of the teachers supported andthe grant in aid, which together would total around MK750.
0.00
0.50
1.00
1.50
2.00
2,50
3.00
3.50
0 100 200 300 400 500 600 700 800 900 1,000School size
Rat
io o
f sa
lary
to
non
-sal
ary
expe
nditu
re
111
Financing secondary education in Zimbabwe:access, equity and efficiency revisited

International Institute for Educational Planning http://www.unesco.org/iiep
The MCDE school system is difficult to cost. This is because ofuncertainties in the number of pupils enrolled, the number of teachersemployed and the actual budget allocations. In 1994 Ministry of Educationstatistics claimed that 56,300 pupils were enrolled in the MCDE systemand that 405 teachers were employed. These teachers are primary-schoolteachers paid at rates comparable with other primary-school teachers. In theMCDE they teach at secondary level. MK6.7 million was listed as actualexpenditure in 1994, giving a cost per pupil of MK119. Other estimates byMCDE suggest that only 42,300 were enrolled in 1994, which would meanthe unit cost would rise to about MK160. As far as can be judged, thefinancial estimates omit teachers’ salaries from the calculation, since theseare paid from the primary education budget allocation. Assuming theMCDE teachers are paid about 20 per cent above the average for primary-school teachers (since they are relatively senior), this would add aboutMK70 per pupil to the public expenditure per pupil. This would bring totalunit expenditure up to an average of about MK230 in 1994.
Uncertainties continue about the numbers enrolled in the MCDEsystem. Estimates for 1996 suggested that there were 81,000 pupilsenrolled and about 2,000 teachers in the MCDE system. However, thenumbers successfully passing the Junior Certificate after two years wereonly 22,000, and those succeeding at the Malawi School Certificate levelafter four years were a little less than 1,300. Though it is possible that81,000 pupils were registered in some form, it seems unlikely that allattended consistently. If absenteeism was high, then cost per pupil will behigher than it would otherwise be. Private school costs are very variableand there is no way of analyzing what these are from any existing database.Expenditure and fees are unregulated and in many cases seem to beunaudited. A private school visited near Zomba with 365 pupils had a salarybill of around MK230,000 and a fee-based income of about MK390,000from which all additional expenses had to be found, including the cost offood for boarders (in 1995). The salary expenditure per pupil in this schoolwas about MK630 (mid-1995), suggesting that other expenditure mightraise the total to around MK1,000 per pupil. Total expenditure in all privateschools will depend greatly on the number of boarders, which is unknown.
It is possible to estimate how unit costs have changed over timebetween 1989 and 1998 in current and constant Malawi Kwacha. Table5.5 shows the result.11
112
Financing secondary education in developing countries
11. The patterns shown in Table 5.5 are not completely consistent with the estimates in thepreceding text. This arises because of discrepancies in enrolment data from differentsources, differences between budgeted and actual expenditure, and periods of highinflation and currency instability at different points in time.

International Institute for Educational Planning http://www.unesco.org/iiep
Table 5.5 Unit costs in MK in current and constant (1991) prices12
113
Financing secondary education in Zimbabwe:access, equity and efficiency revisited
From Table 5.5 it can be seen that real unit costs appear to haveremained fairly constant in real terms at primary, and have fallen atsecondary. On average, secondary unit costs remain about six timeslarger than those at primary. However, it appears that these figuresunderestimate secondary unit costs, since they include private studentsin the enrolments. These enrolments have become a significantproportion of the total. Thus, actual costs may be 30-40 per cent higher.University unit costs have remained over 150 times greater than those atprimary. The unit cost of trainees in teacher-training colleges has variedas the system of training teachers has changed. Since this has involvedchanges in the length of training and the form of its delivery, directcomparisons between years are not simple. Most recently, the drop inreal unit cost in 1997 reflects the introduction of the MIITEP trainingsystem. This annual unit cost applies to a programme that lasts for twoyears to produce a qualified teacher. It only reflects the costs of college-based work, not those of the field support system and thereforeunderestimates total costs. Neither does it include donor contributions,which are very substantial (Kunje and Lewin, 1999).
The estimates in Table 5.5 do not include the MCDE system. Thelatest data suggest that overall pupil/teacher ratios in MCDE schools areabout three times those in government secondary schools. Average salarycosts are lower, because most teachers are primary qualified. Thebudgeted cost of the MCDE system only includes the administrators andworkers and non-salary recurrent expenditure (primarily that on materials
12. Source: Ministry of Education with thanks to McPherson Jere and Mike Kiernan.13. The unit costs for TTCs only include college costs. Under the MIITEP training system,
where trainees are trained whilst teaching, there are substantial additional support costs. Weestimate these to result in actual unit costs of about MK20,000 (Kunje and Lewin, 1999).
Current prices1989 1990 1991 1992 1993 1994 1995 1996 1997 1998
Primary 30 39 39 37 70 84 81 195 244 344Secondary 345 425 435 441 592 706 828 1,315 1,506TTC13 1,573 1,886 1,432 1,880 2,119 3,178 5,547 10,510 5,200University 5,920 6,690 6,476 7318 11,199 14,990 22,622 42,793 42,915Constant prices
1989 1990 1991 1992 1993 1994 1995 1996 1997 1998Primary 40 43 39 33 52 49 32 45 43 56Secondary 458 472 435 387 436 410 321 307 263TTC 2,086 2,093 1,432 1,650 1,559 1,846 2,153 2,452 907University 7,853 7,423 6,476 6,424 8,242 8,708 8,782 9,984 7,484

International Institute for Educational Planning http://www.unesco.org/iiep
production). This gives a unit cost of MK83 if the latest enrolment figures(109,000 in 1997 statistics) are accepted. If teachers’ salaries wereincluded, the public unit cost can be estimated at about MK600 per pupilon 1998 salary rates and pupil/teacher ratios in MCDE. It needs to benoted that in the MCDE system, boarding and other costs are notsubsidized and fall on parents directly. Total costs per pupil are thereforeconsiderably greater than this estimate of MK600 for public costs.
A recent study (Conolly-Smith, 1999) provides estimates ofpublic and total costs for different school types. The result is shown inTable 5.6.
Table 5.6 Cost per pupil by school type (MK)14
114
Financing secondary education in developing countries
School typeCSS day
CSS CSS National boarding grant-aided boarding
MCDE Private15
Total cost per pupil 3,181 4,739 4,732 6,700 4,218 7,462MOESC cost 3,056 4,071 4,085 6,041 1,319 26Cost per successful graduate over 4 years 45,438 5,7448 31,545 48,730 212,299 87,037
14. These figures are much higher than previous estimates in this chapter, since they aremade after currency devaluation and inflation and reflect 1998/1999 prices.
15. Figures for private school costs are unreliable given the incomplete nature of data ontheir numbers and budgeting.
The figure for total costs includes estimates of donorcontributions, fee income, other parents’ contributions, supervision andexamination costs and development budget expenditure. This gives anaverage total unit cost for government schools of around MK4,000. Theaverage public cost is about MK3,500.
Table 5.6 confirms the picture portrayed by the earlier analysis ofcosts. It suggests that the public cost of the MCDE system is about35 per cent of the cost per student in most government schools. Its totalcosts per student are comparable or greater than in government schoolswith most of the burden being borne by parents. It also indicates that thecost per successful graduate in the MCDE system is extremely high as aresult of the very low pass rates.

International Institute for Educational Planning http://www.unesco.org/iiep
5. A simulation
It is clear that Malawi faces very considerable challenges insustaining the FPE programme and ensuring that GERs of over 100 percent are maintained for the primary cycle. If access to secondary schoolsis to be expanded, the additional costs will have to be financed over andabove the costs of maintaining FPE.
To explore the problems in more depth a simulation has beencreated using baseline statistical data from the most recent reports of theMinistry of Education. Enrolments, gross enrolment rates, andexpenditure have been projected over 15 years under a number ofdifferent assumptions. The most important of these are the following:• Baseline enrolment data for 1997 are used as a starting point.
Primary enrolments in Grade 1 (about 820,000) are inflated byover-age entrants responding to FPE policy, which hastemporarily created a bulge of new entrants who will movethrough the primary system over the next 10 years. As a result,gross enrolment rates at primary were probably about 120 per centin 1997, but will gradually fall. Initial transition rates intosecondary government schools and MCDE schools reflect thoseprevailing in 1997.
• Costs per pupil are based on the most recent estimates discussedabove for public unit costs. The model generates costs as amultiple of current expenditure.
• Population growth is initially set at 2.5 per cent to reflect whatappears to have been a decline from a historic value of about 3 percent.In summary, baseline data are as indicated in Table 5.7.
115
Financing secondary education in Zimbabwe:access, equity and efficiency revisited

International Institute for Educational Planning http://www.unesco.org/iiep
Table 5.7 Baseline data for Simulation 1
116
Financing secondary education in developing countries
The Policy and Investment Framework assumes that it will bepossible to increase the transition rate into secondary to 30 per cent fromits current low level with a pupil/teacher ratio of 30:1. Recent plansappear to include absorbing all or some MCDE schools into the regularschool system. It also assumes that primary GERs will be maintained atover 100 per cent and that the high rates of drop-out and repetition willbe reduced. Target pupil/teacher ratios at primary are 1:60. Recentestimates suggest that they are currently around 75:1 (Kunje and Lewin,1999).
The first simulation focuses on the cost implications of meetingthe requirements for maintaining FPE. In Simulation 1 the costs of asystem which achieves a pupil/teacher ratio of 60:1, with repetition anddrop-out falling over 10 years to maximum values of 5 per cent in eachgrade, except grade 8 (10 per cent), are shown. Chart 5.9 shows thisscenario.
Parameter Simulation 1Population growth 2.5%Primary GER 120%Secondary GER (government + grant-aided) 6%Secondary GER MCDE 13%Unit cost ratio of secondary to primary 7:1Repetition 15-12% depending on gradePromotion 70%-80% in all grades except Grade 1 (63%)Drop-out Average 10% and higher in early gradesPupil/teacher ratio 75:1Teacher attrition 5%Secondary entry rate (government + grant-aided) 7%Secondary entry rate (MCDE) 18%Repetition government 5%Repetition (MCDE) 10%Promotion government 98%Promotion (MCDE) 80% except from Grade 10-11 (40%)Drop-out government Averaging 1-2% initiallyDrop-out (MCDE) 10% except from Grade 10-11Pupil/teacher ratio 20:1Pupil/teacher ratio (MCDE) 50:1Teacher attrition 5%Teacher attrition 5%

International Institute for Educational Planning http://www.unesco.org/iiep
Chart 5.9 Primary costs as a multiple of base year – GER 100 andreduced repetition and drop-out
Over a 15-year period the total cost of the primary system wouldincrease by about 75 per cent. If there was significant investment toimprove quality which resulted in higher unit costs, this would inflatethe figure. Pupil/teacher ratios of 1:60 imply that class-size averages aresignificantly greater, since not all teachers teach all periods. If thepupil/teacher ratio were reduced to 1:45, as suggested as a long-termgoal in the PIF, costs would increase by a third to about 2.3 times currentcosts. Real increases in teachers’ salaries would also increase the costs.
In brief, the commitment to maintain FPE implies that recurrentexpenditure on primary alone will have to at least double in real terms ifmodest improvements in internal efficiency are to be achieved. This isthe context against which the problems of financing expanded secondaryschooling have to be considered.
The second set of simulations considers the costs of expanding theexisting government secondary-school system simplified into all normalgovernment schools, and MCDE schools. Gross enrolment rates atsecondary are about 6 per cent in normal government schools and 13 percent in the MCDE system. The long-term aim is to replace MCDEschools by government day secondary schools. MCDE schools arerecognized as inefficient, have very large class sizes and extremely lowpass rates. Most of the MCDE costs are borne by parents, with the publiccost averaging around a third of that in government schools. The keyquestions are on what basis could expansion be financed and what wouldbe the public costs?
0.8
1
1.2
1.4
1.6
1.8
1998 2000 2002 2004 2006 2008 2010 2012Year
Prim
ary
cost
sas
a m
ultip
le o
f ba
se y
ear
117
Financing secondary education in Zimbabwe:access, equity and efficiency revisited

International Institute for Educational Planning http://www.unesco.org/iiep
Chart 5.10 shows the result of progressively converting MCDEschools into normal government schools at existing levels of unit costsin government schools. The projection absorbs the consequences ofmaintaining FPE as described above in terms of the output of primarygraduates.
Chart 5.10 Secondary costs as a multiple of base-year costs
The result is an escalation by a factor of more than 3 in therecurrent costs of secondary schooling. This would result in a systemwhere the secondary gross enrolment rate remained about 20 per centand all schools operated at pupil/teacher ratios found in existinggovernment schools (20:1). It also assumes that drop-out and repetitionwould be about 5 per cent in the expanded system.
The estimates need further modification. They assume that thepupil/teacher ratio remains at about 20:1. If this were increased to 30:1at the secondary level, costs would fall. On the other hand, costs wouldincrease if the transition rate into secondary were to meet the statedtarget of at least 30 per cent of primary graduates by 2005. Further, if thetarget for secondary gross enrolment rate were set at 40 per cent after10 years (suggesting a net enrolment rate at secondary of perhaps 30 percent), then costs would increase further. If these modifications areincluded, Chart 5.10 is the result. This shows an increase in the cost ofthe secondary system by a factor of 4.5.
0
1
2
3
4
1998 2000 2002 2004 2006 2008 2010 2012Year
Cos
t as
a m
ultip
le o
f ba
se y
ear
Secondary govt Secondary MCDE Total
118
Financing secondary education in developing countries

International Institute for Educational Planning http://www.unesco.org/iiep
Chart 5.11 Secondary costs as a multiple of base-year costs
Several other issues are significant for these discussions. First, itmay be that the public costs of an expanded secondary-school systemcan be below those of existing government schools. The MCDE systemoperates at total costs which are comparable to those in governmentschools, but two-thirds of these costs are met by fees paid privately. Thequestion is if the schools are converted would it continue to be possibleto levy relatively high fees when fees in other government schools arelow? Government school fees are currently only 5 per cent – 15 per centof those in MCDE schools. Even if this were possible it is self-evidentthat the MCDE system makes poor use of amounts of per-pupilexpenditure similar to those in government schools. Teaching groups areoften over 100, much teaching takes place outside classrooms and withinadequate teaching materials, and teachers teach few periods per daycompared to those in ordinary secondary schools. Fee-paying aloneseems unable to create pressure for the more effective use of the incometo MCDE schools and this raises the question of what might happen in areformed system with high fees for normal government schools. Wouldsuch additional income be allocated to improved learning conditions?
Second, despite the problems noted above, it is possible toimagine a phased increase in fees for secondary schooling. Capacityclearly exists to make such contributions from private income. High feeshave not acted as a brake on either the rapid growth of the MCDE systemor that of private schools. Private schools have mushroomed in the years
0
1
2
3
4
5
1998 2000 2002 2004 2006 2008 2010 2012Year
Cos
t as
a m
ultip
le o
f ba
se y
ear
Secondary govt Secondary MCDE Total
119
Financing secondary education in Zimbabwe:access, equity and efficiency revisited

International Institute for Educational Planning http://www.unesco.org/iiep
since 1994 and now enrol about 22,000 students at fee levels which areabout twice the cost per pupil in government schools and MCDE. Theseschools operate at high pupil/teacher ratios (70:1), but appear to achievepass rates similar to those in government day schools. This is unlike theMCDE system, where high failure coexists with relatively high directcosts to parents. There would therefore seem to be critical policyquestions concerning how more fee income might be captured to assistin the public finance of secondary schools of higher quality. It is difficultto believe that the demand for MCDE enrolment will continue to growunless pass rates and performance increase. The very high costs ofprivate secondary schooling are likely to act as a constraint on itsgrowth, especially if the economy does not grow and real growth inincomes does not occur.
Third, the estimates generated take no account of the costs oftraining new teachers at primary and secondary level. These appearconsiderable. Our estimates suggest that a primary teacher trained underMIITEP costs at least MK22,500 (US$500) per trainee to train. Thisexcludes the start-up costs to develop materials and infrastructure andthe costs of expatriate advisers (Kunje and Lewin, 1999). Ministryestimates for conventional training of secondary teachers estimate that atleast MK45,000 (US$1,000) is needed for one year of training. Thedemand for new primary teachers generated by the FPE simulations isalmost certainly over 7,000 if targets for the pupil/teacher ratio are to bemet. This generates costs of at least MK158 million (US$3.5 million) towhich must be added the costs of training secondary teachers. Thedemand for these could rise to 1,500 to 2,000 per year, depending on therate of expansion, adding a further recurrent cost of MK90 million(US$2 million).
Fourth, these projections are sensitive to demographic changes. Inparticular, it seems that population growth may fall and attrition ratesamongst teachers appear to be rising as a result of HIV. In thesimulations, teacher attrition rates have been set at 5 per cent. Thesecould be exceeded through a combination of sickness and choice ofalternative career if remuneration does not match that available in theprivate sector. Either of these developments would have a major impacton teacher supply and costs to the extent that they might double. In thelonger term the prospects for economic growth will also be adverselyaffected by any rise in mortality rates amongst the economically active,which would then deplete the government budget further.
120
Financing secondary education in developing countries

International Institute for Educational Planning http://www.unesco.org/iiep
6. Some concluding observations
The simple story is therefore that to sustain FPE significantincreases in educational expenditure will be needed, which are unlikelyto be less than double current expenditure in 15 years’ time. Whateveramounts may be available from economic growth will be absorbed bythe demands of sustaining FPE, which is likely to remain high on thegovernment’s list of priorities. If growth is less than 3 per cent in thegovernment budget, FPE will be at risk without external assistance.
If secondary access were to be expanded at unit costs comparableto those in government schools, to achieve a gross enrolment rate of40 per cent after 15 years as much as five times current expenditure onsecondary would be needed. If this occurred, the total public cost of thesecondary system would be about half that of the primary system.Overall, the costs of primary and secondary together would approachfour times current levels. This is well beyond any conceivable growth inthe government budget for education, even assuming that the economygrows. Malawi spends close to 6 per cent of GNP on education and isunlikely to raise this by more than marginal amounts.
This then identifies the challenge, since it appears that anyincreases in secondary GERs are likely to need additional financing. Theannual amounts needed are large in terms of the Malawi economy andthe current education budget. However, they are relatively small in US$terms. The recurrent cost of the expanded system envisaged in Chart 5.11is about US$22 million. This relatively small amount reflects the factthat Malawi is one of the world’s poorest economies with very low wagerates. Clearly, different assumptions can be made about the costing ofgrowth in participation which would lead to larger sums being needed ona recurrent basis. Even if these were two or three times greater, theywould still fall well within the range of the resources available from thedonor community. This would however be a recurrent cost burden.
There would therefore seem no way of avoiding the conclusionthat a balance has to be struck between investment in sustaining FPE andsome expansion of secondary schooling, that neither are likely withoutexternal assistance, and that the key issues at secondary level revolvearound whether schooling of acceptable quality can be delivered atpublic costs that are any less than those currently incurred. The lattermight be possible if fee income was increased in government schools asthe MCDE system was absorbed.
121
Financing secondary education in Zimbabwe:access, equity and efficiency revisited

International Institute for Educational Planning http://www.unesco.org/iiep
In conclusion, a number of summary observations can be madefrom the analysis in this chapter.
First, Malawi has a very under-developed secondary-schoolsystem which provides opportunities for education beyond Grade 8 to avery small minority of children. Less than 10 per cent of those reachingsecondary entrance level find places in government secondary schools.Historically, those reaching this level are unlikely to represent muchmore than 30 per cent of those who originally enrolled in Grade 1. As aresult, Malawi has a very small proportion of its adults with successfullycompleted secondary schooling. The gross enrolment rate for thesecondary grades in government schools is currently not much morethan 7 per cent – one of the lowest enrolment rates in sub-SaharanAfrica. If MCDE schools are included, the rate is much higher, but theseschools have very high failure rates.
Second, the new government elected in 1994 committed itself touniversal and free primary schooling, unlike its predecessor. It allocatedresources to make this a reality and has drawn on the assistance of donorsfor support during the period of transition from a primary gross enrolmentrate of 60 per cent to one of more than 120 per cent. This has generatedvery substantial increases in the numbers of teachers and schools neededand the amount of recurrent finance. Primary schools now account formore than 65 per cent of the recurrent budget for education, leaving littlescope for expansion in participation at other levels.
Third, public expenditure per pupil in government secondaryschools is a large multiple of that in primary schools. Unit costs atprimary appear to have been rising faster than at secondary. Unit costsare still about seven times greater at secondary-school level. This placesconstraints on the rate at which secondary participation might grow.Though physical resources currently place limits on secondaryenrolment growth, the medium-term constraint is undoubtedly therecurrent cost burden it would generate.
Fourth, many government day schools (which are also de factoboarding schools) have high costs which arise largely as a result ofsubsidized boarding. Clearly, some secondary boarding schools arejustified by location and population density. It is not clear that allboarding is justified in this way. If non-essential boarding wasabandoned, or charged at the full rate, secondary enrolments might beincreased without additional expenditure on government schoolsthrough utilizing space released from hostels as teaching space and usingthe money saved to pay additional teachers.
122
Financing secondary education in developing countries

International Institute for Educational Planning http://www.unesco.org/iiep
Fifth, analysis of the average size of secondary schools shows thatmany are small. Secondary schools with an average of 400-500 pupilsare likely to suffer from dis-economies of scale. Larger average schoolenrolments could be encouraged through increasing the numbers of daystudents, since school size is partly limited by boarding facilities –increasing the number of day students should be seen as a priority.School size might also be increased through the admission of more girls.Boarding facilities in all types of government schools have typicallybeen provided in a ratio of 2:1, favouring boys. This should be revised toprovide equal numbers of places for girls in relation to pupils for whomboarding is essential. More use should be made of double-shiftschooling where population densities are high.
Sixth, the private secondary-school system places no directdemands on public expenditure, except that implied by teacher trainingand curriculum development and any subsidy of examination fees.Arguably, the examination performance of existing private schools,many of which are well established, has been comparable with that ofpublic schools. However, new private schools are growing very rapidly.Without effective controls on recognition and standards, commerciallymotivated private schooling may not maintain the same standards thathave existed in private institutions. There are signs that pupils are beingtaught in very large groups, with inadequate physical facilities in somenew schools. There appears little or no capacity to regulate the growth ofprivate schools such that they conform to minimum standards ofphysical provision, safety, hygiene and teaching quality.
Seventh, the Malawi College of Distance Education system isextensive, and relatively cheap, but it is also appears to be of poorquality. The MCDE enrols large numbers of post-primary students atcosts which are considerably lower than normal secondary schools. Theyare however greater than primary costs per pupil, despite utilizingprimary teachers at much higher pupil/teacher ratios. This arisespredominantly as a result of expenditure on printed ‘sets’. The cost ofproviding materials within this system is high and appears to beconsiderably greater than the cost per pupil for the MCDE that arisesfrom teachers’ salary costs. If these ‘sets’ are fully delivered at currentlyestimated prices, MCDE unit costs might approach the bottom range ofthose for ordinary secondary schools which do not provide subsidizedmaterials. It appears that often a sufficient number of ‘sets’ is neitherproduced nor delivered.
123
Financing secondary education in Zimbabwe:access, equity and efficiency revisited

International Institute for Educational Planning http://www.unesco.org/iiep
Conditions for teaching and learning are impoverished in much ofthe MCDE system, with many pupils being taught without adequateclassrooms and access to sufficient learning material. Pass rates atMSCE are very poor. Pass rates at JCE are better, but are not regarded asevidence of high levels of achievement, since pass rates are very high ingeneral and this examination has been discredited by widespreadcheating in the past. Examination pass rates at the MSCE suggest thatmost pupils learn little of what is intended. Expanding enrolments in theMCDE within existing assumptions and working practices would notseem to offer easily defended value for money and might well lead toeven lower average pass rates. Neither is it clear that the demand forMCDE places will continue at high levels if pass rates do not improve,given the high private costs of participation.
Eighth, the total secondary school budget accounts for less thanthe allocation made to higher education. The university was allocatedmore than twice as much as the entire government and grant-aidedsecondary school budget in 1995/1996. This was also the case in1994/1995. This seems paradoxical when secondary enrolment rates areso low.
Ninth, the financial challenge of expanded secondary schooling inMalawi is large in relation to the domestic budget, but modest in termsof donor resources. Some cost-saving measures could reduce the costsper pupil of secondary school places, but the scope for this is limited. Soalso are the prospects for significant cost recovery and increasedcontributions from communities and individuals, given the status andlikely growth of the Malawi economy. If secondary participation ratesare to increase to provide a greater supply of those with higher levels ofcompleted schooling than primary alone, complementary financialsupport could make very substantial differences in the rate of progress tothis goal. Maintenance of FPE and population-driven growth in theprimary cycle will absorb foreseeable increases in the education budget.Considerable increases in participation towards a gross enrolment rate of40 per cent at this level have a recurrent cost burden, which is large inbudgetary terms but small in US$ and comparable to imaginable levelsof donor support.
In conclusion, the policy commitment to universalize free primaryeducation in Malawi is well founded. However, it has to be interpretedin relation to needs at other educational levels. Publicly fundedsecondary education is available to a very small proportion of the agecohort in Malawi, yet it is from this group that the leaders of the next
124
Financing secondary education in developing countries

International Institute for Educational Planning http://www.unesco.org/iiep
generation are likely to emerge and that middle-level employees will berecruited. There is a risk that publicly financed secondary schooling willnot grow, or will grow but in a very unbalanced manner, if concertedefforts are not made to protect and develop quality secondary schooling.This suggests that achievable targets should be created for the growth ofthe government secondary-school system, along with realistic estimatesof the resources needed to support such balanced growth at a rate whichdoes not compromise quality. The MCDE system does not appearsustainable in its current form, nor would it appear attractive toencourage further expansion of enrolments in this system until questionsof quality and learning resources have been addressed. The best optionsappear to lie in a phased integration of the secondary schools into asingle system. To be affordable, opportunities to increase internalefficiency, make economies of scale, and find ways of increasingcomplementary funding need to be explored. The fee levels in theMCDE system and for private schools suggest that a proportion of thecost of secondary enrolment expansion can be financed from outside thepublic budget.
125
Financing secondary education in Zimbabwe:access, equity and efficiency revisited

International Institute for Educational Planning http://www.unesco.org/iiep
Francophone African countries have some of the lowest enrolment ratesin secondary education in the world. These low rates are due to lowenrolment rates at the primary level and to a selection at the entrance tosecondary education, as many governments faced with severe financialrestrictions have chosen to control enrolment expansion at the post-primary level. Most countries confirmed the priority granted to primaryeducation in 1990 in the wake of the World Conference on Education forAll, and indeed primary enrolment rates, although still low, rosesignificantly between 1985 and 1997. As the number of pupils enrolledin primary education increases, and the wave of pupils reaches the finalgrades of primary education, the pressure on secondary schools mountsand becomes more difficult to resist. Several countries are nowconsidering widening access to lower secondary.
The possibility of expanding secondary education, however, hasto be considered in a context of rapid demographic growth, relativelyhigh educational costs and limited state financial resources. Whateveradditional resources the state will be able to mobilize will notnecessarily be available for secondary education, as reaching universalprimary education still requires a large proportion of governmentresources, and a secondary education place costs at least two or threetimes as much as one in primary education.
This chapter will review the situation of secondary education infive selected countries of francophone Africa: three Sahelian countries(Burkina Faso, Mali, and Senegal), one country from the coast (Côted’Ivoire) and one from southern Africa (Madagascar), and discussalternative strategies for its expansion.
The education systems of these countries, greatly influenced bythe French one (France being the former colonial power), have similarfeatures and characteristics. They have an examination at the end of sixyears of primary education, where those who are to continue into thesecondary level are selected. Another common characteristic is their
127
Chapter VI
Financing secondary education in selectedfrancophone countries of Africa:
issues and perspectivesFrançoise Caillods

International Institute for Educational Planning http://www.unesco.org/iiep
relatively high educational unit cost, a feature that explains why theydevote a fair proportion of their budget, and of their GNP, to education,but only succeed in enrolling a limited proportion of their school-agepopulation. Côte d’Ivoire, for example, in the early 1990s spent nearly 8per cent of its GNP and 36 per cent of the government budget to enrolno more than 67 and 22 per cent of the relevant age groups respectivelyin primary and secondary education. The five countries differ, however,in their level of participation in primary education, in their recentpolicies with respect to access to lower secondary and in the role of theprivate sector in secondary school provision.
Data used in this chapter come from secondary sources, i.e.countries’ statistical yearbooks, EFA country reports, sector studiesundertaken by the IIEP and the World Bank, and education ministries.
Table 1 gives some background information on the five countries.Most of them are still experiencing very high rates of population growth,although lower than previously; as a result, the dependency ratio, i.e. theproportion of 0-14 year-olds, a proxy for the school-age population, overthe working-age population, is very high. This means that providingeducation to all youngsters from 6 to 14 or 15 years of age (correspondingto the nine years of basic education) will require a substantial effort fromthe working population and represents a heavy burden on the GNP. Threecountries (Burkina Faso, Mali and Madagascar) have very low GNP percapita, a low rate of urbanization (less than 27 per cent of the populationlive in the urban areas; more than 80 per cent of their active populationworks in agriculture), and a limited export industry. A high proportion ofthe population still lives below the poverty line in all countries (from 42per cent in Côte d’Ivoire to 56 per cent in Burkina Faso). Educationshould help in modernizing these countries’ economies and fightingpoverty. At the same time however, the fiscal base on which public fundsare drawn is very much restricted. In fact most government resources aredrawn from indirect taxes and import and export taxes.
All five countries suffered from a serious economic crisis in the1980s and throughout the mid-1990s, which resulted in a steep fall intheir GNP per capita over nearly two decades, as well as in governmentrevenues, leading subsequently to a budgetary crisis. Governments hadrecourse to structural adjustment programmes negotiated with the IMF,which were intended to restore the conditions for economic growth. Dueto these adjustment programmes, the proportion of GNP spent oneducation seriously declined in Mali, Madagascar, Senegal and Côted’Ivoire. After the devaluation of the CFA in 1994, which boosted theirexports, and the new economic policy put in place, the five countries
128
Financing secondary education in developing countries

International Institute for Educational Planning http://www.unesco.org/iiep
Financing secondary education in selected francophone countries of Africa:issues and perspectives
129
started enjoying faster economic growth. This has opened real prospectsfor mobilizing higher resources for education.
Table 6.1 Background information on the five countries
Source: World Education Report, 2000; World Bank, 2001.
Characteristics and development of secondary education in thevarious countries
In all countries but Mali, primary education is of six years’duration (five years in Madagascar), followed by four years of lower-secondary education and three years’ upper secondary. In Mali lower-secondary education is shorter (three years) and constitutes the secondcycle of the nine-year basic education (‘Ecole fondamentale’). Allcountries offer technical and vocational education at upper-secondarylevel: technical education prepares youngsters to enter higher technicaleducation while vocational education prepares them for entering theworld of work. In Burkina Faso, vocational education exists at the lower-secondary level as well.
Côte d’Ivoire is the country that enjoys the highest grossenrolment rates at secondary level: 23 per cent for both cycles on averagein 1995 and 1997. It is followed by Senegal and Madagascar (16 percent), Mali (13 per cent) and Burkina Faso (11 per cent) (see Table 2).The higher rate of development of secondary education in Côte d’Ivoireis justified by the somewhat higher level of economic development ofthe country and by the existence of a more diversified labour market.Nevertheless students’ participation at that level is limited. Given thehigh level of repetition and drop-out, the net enrolment rates are muchlower: they were estimated on the basis of household surveys at 5 percent in Mali, 15 per cent in Madagascar, and 18 per cent in Côte d’Ivoirearound 1994/95 (World Bank, 2001).
GNP Growth p.a. GNP Population Dependency Population Education Educationper capita GNP per per capita growth ratio below budget in budget in
US$ capita US$ $PPP 1990-97 0-14 poverty GNP (%) GNP (%)1997 1990-97 1997 line (%) 1990 1996
Burkina Faso 250 0.8 1000 2.5 95 56 3.6 3.4
Mali 260 0.3 720 2.8 95 55 3.1 2.5
Senegal 540 0.0 1341 2.7 86 45 4.1 3.7
Madagascar 250 -1.6 900 2.9 84 51 3.0 2.0
Côte d’Ivoire 710 0.9 1690 2.7 84 42 7.7 5.0

International Institute for Educational Planning http://www.unesco.org/iiep
Where it has been possible, an analysis by cycle has shown that theenrolment rates at lower secondary are nearly double those of uppersecondary. This is a result of the selection that takes place throughoutlower secondary and also by means of the examination at the end of lowersecondary: only a small proportion of students continue to uppersecondary. Another substantial selection takes place at the final secondaryexamination. In view of the low participation rate at primary, and theselection that takes place continuously afterwards, the proportion of an agecohort that leaves school with at least a secondary school diploma is wellbelow 10 per cent in all countries, even in Côte d’Ivoire. In the presentglobalized world where, in order to be competitive, countries have to havea fairly well-educated labour force to attract foreign investments, such lowparticipation, leading to a low educational level of the workforce, mayvery well jeopardize these countries’ long-term development prospects.
Table 6.2. Gross enrolment rate in primary and secondary education
*Including Medersas.1Source: Countries’ statistical yearbooks.
Year Primary Lower secondary Upper secondary% % %
Burkina Faso (lower and upper)90/91 31 794/95 35 896/97 38 10.697/98 41 11.098/99 n/a 11.1
Senegal 90/91 59 21 1095/96 57 22 1096/97 59 21 998/99 66 22 9
Mali 90/91 26 11 4.194/95 39 13.6 7.495/96 42* 14.5 7.697/98 50* 17.9 8.8
Côte d’Ivoire 91/92 71 30 1394/95 71 28 1495/96 71 31 1497/98 72 27 13
Madagascar (lower and upper)90/91 104 18.094/95 89 15.595/96 94 16.096/97 97 16.097/98 104 n/a
130
Financing secondary education in developing countries
1. Medersas are religious schools, which follow the normal curriculum of state schools withadditional religious courses. Teaching is done in Arabic.

International Institute for Educational Planning http://www.unesco.org/iiep
The reasons for such low enrolment rates are to be found first andforemost in the low coverage of primary education, due to both lowadmission rates and low levels of retention at that level. Madagascar isthe only country that has nearly achieved universal access to primaryeducation (104 per cent gross enrolment rate), but of those who startprimary education, no more than a third reach the last grade of primary.In Côte d’Ivoire, Senegal and Burkina Faso a relatively larger proportionof those who enter primary education finish the cycle (between 55 and60 per cent reach the final grade of primary), but the proportion of therelevant age group that enters primary is still far from 100 per cent;hence the gross enrolment rates at primary level were still low in 1997,respectively 72, 59 and 41 per cent. Mali succeeded in substantiallyincreasing its admission rates in primary education in recent years (from30 per cent in 1991/92 to 51 per cent in 1997/98) but the retention rateremaining low, the gross enrolment rate was still not higher than 50 percent in 1997/98. Thus, due to low admission rates and high drop-out atprimary, the number of potential candidates for entry in secondaryeducation is relatively limited in all countries: the number of pupilsreaching the last year of primary education as a proportion of therelevant age group, ranged from 20 per cent in Burkina Faso, 27 per centin Madagascar, 29 per cent in Mali, 33 per cent in Côte d’Ivoire and 37per cent in Senegal around 1997.2
The second reason for the low enrolment rate is the policy adoptedby countries concerning flow regulation. In spite of the enrolmentincrease at primary level, the secondary enrolment rate in almost all ofthe countries under consideration remained remarkably stable between1990 and 1997. Ministries of Education controlled the number of peopleadmitted into state schools at both lower- and upper-secondary level asa function of available school places. The number of governmentsecondary schools did increase, partly as a policy to reduce regionaldisparities, and partly to respond to the mounting pressure for secondaryschool places as more and more pupils reached the end of primaryeducation, but the number of school places has barely kept pace with theincrease in primary-school leavers. An exception is Mali, which hascommitted itself to eventually offering a nine-year fundamentaleducation, and where enrolment rates have increased at lower secondary(the second cycle of fundamental education) and upper secondary in themost recent years.
131
Financing secondary education in selected francophone countries of Africa:issues and perspectives
2. Source: for Madagascar, World Bank 2000; for other countries, author’s calculations.

International Institute for Educational Planning http://www.unesco.org/iiep
132
Financing secondary education in developing countries
The third reason is linked to the high cost of secondary schoolplaces, as will be discussed below.
Flow regulation
Access to state secondary education
Only those who have passed their end-of-primary-educationcertificate can, in principle, enter a secondary school. To enter a statesecondary school pupils may have to fulfil a certain number of additionalconditions. For example, in Senegal, only those who have the bestexamination scores and are below 15 years of age can be admitted to astate secondary school. In Burkina Faso only those who have a scoreabove a certain threshold are allowed to continue at secondary level.Those with the highest marks are admitted to a state secondary school,and another group with slightly lower marks are admitted into a privateschool with some government support. In Côte d’Ivoire, the primaryschool certificate is required to enter state schools and the cut-off point,i.e. what is required to enter secondary education, varies somewhat fromregion to region. Some private schools on the other hand accept pupilswithout the certificate.
In general the minimum score to enter a state secondary school isdetermined as a function of the number of places available in theseschools. The proportion of primary-school leavers selected to enter statelower-secondary schools was equal to 13.2 per cent in Burkina Faso, 22per cent in Senegal and 31.8 per cent in Côte d’Ivoire in 1996. In Mali,the proportion admitted to Grade 7 was higher (54 per cent) given thecountry’s policy. Both Côte d’Ivoire and Senegal are now consideringalso opening access to lower secondary. Consequently Côte d’Ivoirereformed its end-of-primary-education examination and the proportionof the pupils given passes increased to 50 per cent in 1997/98.
The overall transition rates are slightly higher than the figurementioned above since an increasing number of pupils enter privateschools. Transition rates equalled 27 per cent in Burkina Faso, 30 percent in Senegal, 33 per cent in Côte d’Ivoire and 56 per cent in Mali in1997. Madagascar is the only country where the transition rate fromprimary to secondary education actually declined, from 42.6 per cent in1990/91 to 39.5 per cent in 1994/95. This decline led to a fall in lower-secondary school intakes and a stagnation in enrolments as from1989/90, primarily in state schools. This trend is probably to be relatedto a decline in school demand, itself resulting from a deterioration in the

International Institute for Educational Planning http://www.unesco.org/iiep
Financing secondary education in selected francophone countries of Africa:issues and perspectives
133
quality of schooling and in families’ living conditions, which forcesmany youngsters to work.
Access to upper-secondary education is also controlled. To enterthe second cycle of secondary education it is necessary to have passedthe BEPC or DFEM or DEF (certificate of end of lower-secondaryschool studies). Again, minimum grade and age conditions can be addedto gain access to different streams at upper-secondary level. Access tothe science streams is generally more restricted and not all upper-secondary schools offer the stream specialized in mathematics andphysical sciences. The selection is more or less stringent according to thecountry; it is particularly severe in Burkina Faso and Madagascar. In1995/96, the proportion entering upper-secondary school varied from 21per cent in Burkina Faso and 27 per cent in Madagascar, to 46.6 per centin Côte d’Ivoire and 55 per cent in Senegal and Mali. Again inMadagascar, the transition rates from lower to upper secondary declinedfrom 34.1 per cent in 1989/90 to 27 per cent in 1995/96 for reasonssimilar to those given above for lower-secondary education, and this ledto a decline in upper-secondary school enrolments.
Internal efficiency
Many of those who fail the examination at the end of a cycle orwho fail to find a place in a state school choose to repeat so as to have asecond chance. The rate of repetition in the last year of every cycle(primary education, lower and upper secondary) is thus very high –between 30 and 40 per cent – in almost all countries, as can be seen inTable 3. A number of countries have started to limit repetition in stateschools: a slight decline in the repetition rate is thus apparent in the lastgrade of primary in Burkina Faso and Senegal and in Grade 9 in Mali.At secondary level, the repetition rates are much lower in Côte d’Ivoireand in Senegal than in other countries. Repetition however remains fartoo high and unnecessarily overburdens enrolments and the costs ofprimary and secondary education. Revising the procedures and contentof the end-of-primary-school examination, and opening access tosecondary education should contribute to reducing this phenomenon.The case of Mali, where access to Grade 7 is officially free of anyselection and where repetition in Grade 6 remains high, shows howeverthat the implementation of such measures is slow.
A high rate of repetition may of course be due to low levels oflearning achievements as a result of the insufficient quality of educationand absenteeism of students. Indeed, repetition rates are high throughout

International Institute for Educational Planning http://www.unesco.org/iiep
primary and secondary education, and not only for the last grade of eachcycle. While there is probably a problem of low quality, recent researchcarried out at the primary-education level shows, however, that decisionsregarding repetition can be fairly arbitrary, having more to do with theexistence of a culture of repetition than with an independent assessmentof pupils’ achievements (CONFEMEN, 1999; Eisemon, 1997). If this isthe case it is not easy to interpret the differences observed in therepetition rates between public and private schools, even more so as therepetition rate varies from one stream to another.3 In any case, repetitionrates can be quite high in private schools as well, and they are not alwayslower than in state schools.
Table 6.3 Rates of repetition in the last year of primary and secondary education (%)
*Proportion of repeaters.**According to the stream.Source: Countries’ statistical yearbooks.
Due to these repetition and drop-out rates, it takes an unduly highnumber of pupil-years to produce a graduate. In Senegal, of those whoenter the first year of secondary education (6e), 83.3 per cent reach thefinal grade of lower secondary, 47.2 per cent enter upper secondary, and34.8 per cent reach the last year of secondary (terminale). In the end,only 19 per cent of those who entered succeeded in obtaining abaccalaureate several years later. It thus takes 8.6 pupil-years to produce
End of End of lower secondary End of upper secondaryprimary % %
% public private public private
Burkina Faso 1993/1994 44 36.7 36.3* 33.6 34.6*1998/1999 35 43.5 44.0* 42.9 46.1*
Mali 1990/1991 34.8 49.6 n/a n/a1994/1995 34.4 41.3 n/a n/a1996/1997 37.4 35.0 n/a n/a
Senegal 1995 30.2 n/a n/a n/a n/a1997 28.7 24.4 n/a 27.7 n/a1999 28.6 n/a n/a n/a n/a
Madagascar 1992 32 37 28 41 311998 30 37 27 41 33
Côte d’Ivoire 1995/1996 40 16.2 44.3 16.5/34.6** 13.9/70.8**1997/1998 43 14.4 40.3 31.9 48.8
134
Financing secondary education in developing countries
3. It is lower in the highly selective streams such as the mathematics and physics stream,which is not always offered in private schools.

International Institute for Educational Planning http://www.unesco.org/iiep
135
Financing secondary education in selected francophone countries of Africa:issues and perspectives
a lower-secondary graduate, that is to say twice as many as istheoretically necessary; and a total of 28 pupil-years to produce onebaccalaureate holder for a theoretical duration of seven years ofsecondary education (Faye, 1998). In Côte d’Ivoire, it takes 15.5 pupil-years to produce a secondary graduate, twice as many as necessary. InBurkina Faso, it takes 9.5 years to produce a lower-secondary graduateand an additional 5.8 years to produce an upper-secondary graduate.
Inequalities in secondary education provision
Another characteristic of secondary education in the five countriesconcerned, is the existence of disparities of access between regions,urban and rural areas, among different social groups and betweengenders.
Regional disparities in access to the secondary level reflect thosethat exist at the primary level but are even more pronounced. In Senegal,57 per cent of all lower-secondary pupils are enrolled in schools locatedin only two regions: Dakar and Thies. In Burkina Faso the secondaryenrolment rate varies a great deal from one province to another: from amaximum of 33.8 per cent in the province of Kadiogo to a low 3 per centin some other provinces in the east. The government is trying to correctthese inequalities by creating a lower-secondary school in every‘département’ but this is not yet the case. Moreover, some of the newschools located in low-density areas remain very much underutilized.
Schools are generally located in urban areas and enrol studentsfrom the neighbouring rural areas. For pupils in the neighbouring ruralareas, the distances to be covered can be such that parents prefer not tosend their children, their daughters in particular. In the absence ofboarding schools, pupils are expected to find a tutor in the neighbouringcity and this is not always possible, nor can all parents afford it. Thisleads to large disparities between regions, as mentioned above, but alsobetween urban and rural areas. Related to these are the disparitiesbetween social groups. Children of civil servants and tradesman aregenerally over-represented among the students while children offarmers, artisans and self-employed workers are under-represented. Dataavailable for Burkina Faso for example indicate that children of farmersdo not represent more than 58 per cent of all students in state secondaryschools and 30.2 per cent in private secondary schools, although farmersand their families constitute more than 80 per cent of the population(MESSRS, Burkina Faso, 1999)

International Institute for Educational Planning http://www.unesco.org/iiep
Gender disparities are also considerable. Girls are seriouslyunder-represented in the secondary schools of all the countriesconcerned but Madagascar (see Table 4). They constitute less than 40 percent of enrolment at lower secondary in Burkina Faso, Senegal and Côted’Ivoire and this proportion decreases when one moves from the lowerto upper-secondary levels. Girls drop out in larger numbers. Threecountries have succeeded in improving their gender ratio at upper-secondary level (Madagascar, Mali and Senegal) but the objective fixedby the World Education Forum in Dakar to reach parity of enrolmentbetween boys and girls by 2005 is still far from being achieved.
Some of these disparities are linked to the characteristics of schoolsupply (lack of school places, the fact that schools are located in thebiggest urban centres, large distances to be covered in rural areas,insufficient quality of education, and lack of relevance of content) butthey are also related to demand. This leads to the question: is there ademand for secondary education?
Table 6.4 Proportion of female students in secondary education(1997/1999)
Source: Countries’ statistical yearbooks.
Social demand for secondary education
The social demand for secondary schooling is fairly strong but itis essentially an urban phenomenon. As the number of people withaccess to primary schooling increased, the primary-school certificatecompletely lost its value on the labour market. Having a secondary-school certificate is not a guarantee of gaining access to a public-sectorpost either, as it was in the past, but not having such a certificate is aguarantee never to have access to such posts. Thus families do theirutmost to obtain a place in a secondary school, particularly in a statesecondary school. There are several indications of this strong demand.
The high rates of repetition at the end of every cycle, discussedabove, constitute the first indicator of this strong social demand. The
Lower secondary Upper secondary
Burkina Faso 38.3 25.8
Mali 43.0 30.4
Madagascar 50.0 49.0
Côte d’Ivoire 35.1 30.5
Senegal 39.7 36.8
136
Financing secondary education in developing countries

International Institute for Educational Planning http://www.unesco.org/iiep
strategies developed by families to ‘bypass’ the selection examination isanother indicator of the strong demand.
In Burkina Faso, a parallel system of admission to governmentlower-secondary schools has developed. Pupils and families whosechildren have not passed the entrance examination may apply directly tothe heads of secondary schools or to the school committee. Children thusadmitted have to pay a fee (whereas tuition is free for those who havepassed the entrance examination). In 1993/94, the number of studentsactually entering the first grade of secondary education was double thefigure of those officially admitted through having passed theexamination. A similar parallel system existed in Côte d’Ivoire until1993. It was then stopped, as it led to overcrowding in the classrooms(nearly twice as many students were enrolled per class as the Ministryhad planned) and to a deterioration of educational quality. A limitednumber of admissions nevertheless continues to take place at the schoollevel outside those admitted through the examination. In Senegal,families who can afford to do so enrol their children in a privatesecondary school for one or two years and then transfer them to a stateschool in the 2nd or 3rd year, there again bypassing the entranceexamination. This practice is quite developed, although not officiallyallowed.
Another indication of the strong demand for secondary educationis the size of the private sector. Schools are considered private if they arenot directly run by government, even if they receive public grants.Table 5, which shows the proportion of pupils enrolled in private schoolsat the primary, lower and upper-secondary levels, illustrates a variety ofapproaches, policy orientations and traditions regarding privateeducation. The share of the private sector was relatively limited at theprimary level in all countries except Madagascar, but it has been slowlygrowing in recent years. It is much more important at secondary level,particularly at lower secondary where it has been growing since thebeginning of the 1990s. Presently the private sector enrols roughly onepupil out of three in Senegal, Burkina Faso and Côte d’Ivoire.Madagascar, where the private sector enrols nearly half the student bodyat the secondary level, is quite remarkable in this respect. In somecountries it enrols a higher proportion of pupils at lower secondary thanat upper secondary (Burkina Faso and Senegal), but the reverse is true inMadagascar and Mali and, recently, Côte d’Ivoire.
Private secondary schooling developed in most countriesprimarily (although not exclusively) as a result of the governments’incapacity to offer sufficient places in state schools. Its size depends on
137
Financing secondary education in selected francophone countries of Africa:issues and perspectives

International Institute for Educational Planning http://www.unesco.org/iiep
the regulation that exists, the financial support that the government mayprovide and on the parents’ capacity to pay fees. The latter is directlyproportional to the family’s income, the number of children and whetheror not they are already contributing to the cost of primary schooling.Private enrolment has significantly increased in the past five years inSenegal, Côte d’Ivoire and Mali, thanks to the new policy adopted in themid-1990s vis-à-vis the private sector (simplifying the procedures foropening a school, granting tax exemptions, subsidizing some of theschools, and deregulating fees for non-government-aided schools) and todemand from the urban middle class. In Burkina Faso, on the other hand,the share of the private sector in secondary schools seems to be decliningfrom its relatively high level in the 1980s, indicating a possible ceilingto its expansion and a limit to what families are able to pay at a time ofeconomic crisis.
The case of Madagascar illustrates another dimension of thedynamics of the private sector. It developed there essentially because ofparents’ dissatisfaction with the quality of public schools. As mentionedearlier, the enrolment at lower-secondary level stagnated in state schools,but the number of pupils in private schools increased. At the upper-secondary level enrolment declined in both private and public schools,but faster in public than in private schools. The demand for secondaryschooling of a higher quality exists, and is sufficiently high to allow atransfer from public to private schools, but the economic crisis and thelevel of poverty is also limiting how much money families can spend onsecondary education. The share of private education may thus havereached a limit as well.
138
Financing secondary education in developing countries

International Institute for Educational Planning http://www.unesco.org/iiep
Financing secondary education in selected francophone countries of Africa:issues and perspectives
139
Table 6.5 Share of the private sector in primary and secondaryenrolment
* Medersas includedSource: Countries’ statistical yearbooks.
Present in all countries is the phenomenon of parents that sendtheir children to a private school because they are dissatisfied with thequality of teaching in government schools. In Senegal, for example,enrolments in state schools declined in 1996 and 1997 while enrolmentin private schools increased. Another hint of this phenomenon is givenby the fact that many civil servants – teachers included – send theirchildren to private school. In Burkina Faso, for example, while 23 percent of students in state schools are children of civil servants, this is thecase of 56.5 per cent of pupils in private schools. Clearly parents wouldlike to offer a high-quality education to their children. However theycannot always afford it and the private sector is quite uneven in terms ofteaching conditions and quality of education. Thus while the first choiceof wealthier and informed parents is to place their children in one of aselect few private schools, government schools coming as a second
Country Date Share in primary Share in Share inenrolment lower-secondary upper-secondary
% enrolment enrolment% %
Burkina Faso 1983/84 8.2 56 (1980) n/a1992/93 7.1 36.3 26.91993/94 7.3 32.0 24.51998/99 11.0 31.0 24.3
Senegal 1985 8.8 32.0 17.61990 9.2 25.2 10.51995 9.8 24.9 13.21996 10.5 25.5 16.21998 12.1 31.0 19.41999 12.5 28.7 19.2
Mali 1990/91 3.9 14.0* n/a1994/95 8.3 13.9* n/a1995/96 8.0 13.9 231996/97 10.9 6.5 24
Côte d’Ivoire 1991/92 9.6 27.0 19.41994/95 12.0 34.2 35.81995/96 11.9 34.8 40.51997/98 12.0 34.0 42.11998/99 n/a 33.7 40.4
Madagascar 1991/92 22 38 441993/94 22 43 501994/95 22 45 511997/98 22 45 49

International Institute for Educational Planning http://www.unesco.org/iiep
choice, the majority of parents would choose to send their children to astate school. Those who cannot have access to such state schools thensend their children to a private one, if they can afford the fees. Henceprivate schools are both the first and the last choice of parents.
For obvious reasons, the demand for secondary schooling isstronger in large urban centres than anywhere else. In Mali, for example,two of the twenty-three private general upper-secondary schools arelocated in Bamako, the capital, while some state schools located in ruralareas operate below capacity (1999/2000). In Côte d’Ivoire, 57 per centof lower-secondary students and 60 per cent of upper-secondary studentsattending a private school live in Abidjan, the capital. The percentagesrise to 66 per cent and 82 per cent of enrolment if we consider bothAbidjan and Bouake. In Senegal, likewise, two-thirds of the students inprivate schools are enrolled in the city of Dakar. This is further proof ofthe fact that only middle-class families living in cities and receiving amonetary income can afford to pay the high fees that most privateschools request.
Thus if the share of private education continues to increase, this islikely to exacerbate the gap between urban and rural areas, betweenregions and between social groups. It is not clear however what the effectwould be on the gender gap. In fact private schools tend to enrol a higherproportion of girls than state schools. In Senegal, for example, girlsrepresent 47 per cent of the enrolment in private middle schoolscompared to 36 per cent in public schools. In Côte d’Ivoire, there are 40per cent girls in private secondary schools (41 per cent at lowersecondary and 40 per cent at upper-secondary level) compared torespectively 32.1 and 24.31 per cent in state schools. This phenomenonis due to the fact that private schools are located in big urban centres,while state schools are all over the country. One should not conclude thatopening more private schools will necessarily increase the proportion ofgirls, but opening more school places in big cities, whether in public orprivate schools, will. The challenge however is to enrol more girls inrural areas.
Parents are concerned by the type of schools their children attend,not only in terms of public/private but also in terms of the programmethey offer. In this respect the demand for technical and vocationaleducation seems to be quite high in several of the countries concerned,far exceeding the capacity of existing government schools. In a contextwhere large numbers of secondary and higher education graduates areunemployed, the chances of being employed are slightly higher if thestudent has a vocational certificate or diploma. Hence families want to
140
Financing secondary education in developing countries

International Institute for Educational Planning http://www.unesco.org/iiep
send their children to a vocational school in the hope that they will learna trade and acquire specific skills; some of them even keeping theirchances of continuing at higher levels of education (in technicalschools). Vocational and technical streams, which exist in parallel togeneral education, enrol only a small proportion of all secondarystudents however: 6.7 per cent in Senegal, 6.2 per cent in Côte d’Ivoire,6.5 per cent at lower-secondary level and 12.5 per cent at uppersecondary in Burkina Faso. Places in government schools being limited,private courses and schools have developed quickly. In Côte d’Ivoire,enrolment in private technical and vocational schools increased at ayearly rate of 8 per cent between 1991 and 1995. In Mali, 25 per cent oflower secondary school-leavers enter a vocational course, many ofwhich are run by a private institution. The quality of education in bothpublic and private institutions leaves much to be desired however.
Teaching conditions and quality of education
The teaching conditions vary quite a lot from one country toanother and from one type of school to another. Nevertheless the strategyfollowed by most governments has been to favour a high number ofpupils per class – even if pupil/teacher ratios are much lower – and arelatively high proportion of trained teachers. Teaching conditions are,however, often quite unsatisfactory.
All countries have an extremely high number of pupils per classin their government schools (see Table 6). Although the admission ratesat the different secondary levels are in principle fixed on the basis ofexisting school places, pressure to increase access and the parallelsystem of school entry have contributed to increasing the number ofpupils per class to very high levels in these schools. In Côte d’Ivoire,there were on average 73 pupils per class in lower secondary and 63.4 inupper secondary in 1993/94. This number fell to 56.5 and 45.9respectively in 1995/96 after parallel recruitment had been eliminatedand the ceiling of 66 pupils per class had been enforced. In Burkina Fasothe number of pupils per class was on average equal to 69 in state lower-secondary schools and 51 in state upper-secondary schools (1998). Thecorresponding numbers in Senegal were 51 and 42 (1997/98). In Mali,the number of pupils per class in public lower-secondary schoolsreached 56 on average (but interestingly enough 70 in schools whichoffer both primary and lower secondary). These figures are averages andthe number of students per class can vary considerably from grade tograde, as from school to school. It is obviously much higher in the first
141
Financing secondary education in selected francophone countries of Africa:issues and perspectives

International Institute for Educational Planning http://www.unesco.org/iiep
and last grade of a cycle than in the others. It can also reach 100 in someurban schools.
Unless the teachers are exceptionally good and skilful, and thereis no reason to believe that they are, not much learning can take place insuch large classes. Certainly not much homework is given norindividually marked and corrected, a factor that has been proven to havea high correlation with learners’ achievements.
Table 6.6 Number of pupils per class in public and privateschools, 1998
Source: Countries’ statistical yearbooks.
The educational level of teachers is not very high, not muchhigher than the level they are teaching at. In Burkina Faso 54 per centonly of the teachers are qualified; in Madagascar 70 per cent hadcompleted upper secondary and 14 per cent had only completed lowersecondary (World Bank, 2000). But in the other countries the majority ofteachers in public schools are trained permanent teachers (88 per centand 72 per cent in Mali in 1998 respectively for lower and uppersecondary; 92.6 per cent in Senegal). In view of the financial restrictionsand the limitation on teachers’ recruitment following the structuraladjustment programme, a growing number of temporary and contractualteachers are now being employed in these two countries. In Mali theynow represent 28 per cent of all teachers in upper-secondary schools.Senegal is the only country that has made it an official policy to appointmost new teachers as contract teachers. There is no such official policyin Burkina Faso but in practice contract teachers are recruited by theheadteachers if they do not have enough teachers to cover all subjects. InCôte d’Ivoire only municipal schools are supposed to employ them.Such teachers are paid much less than permanent teachers, although theymay have the necessary educational level (university degree). Some ofthem may have had some training but most of them have not.
Lower secondary Upper secondary
State Private Total State Private Total
Cote d’Ivoire 58.3 47.4 54.0 45.0 36.6 41.0
Burkina Faso 69 54 64 51 38 47
Mali 56 44 47.3 n/a n/a
Senegal 51 40.8 48.5 42 29.3 35.1
142
Financing secondary education in developing countries

International Institute for Educational Planning http://www.unesco.org/iiep
A serious problem is the lack of teachers in certain disciplines:teachers in mathematics, science and philosophy are often in short supply.An overall shortage combined with inefficient teacher deploymentprocedures – whereby more teachers are available in the capital city thanin the rural areas – has resulted in several schools not having enough, orindeed any mathematics and science teachers. Thus these subjects areeither not taught, or taught by a non-subject specialist (service teachers).
Teachers do not benefit from enough support from supervisors or,within the school, from headteachers or senior teachers. In Burkina Fasothere was one inspector on average for 179 teachers in 1998; one for 390teachers in French, and one for 636 in history/geography. Theirresponsibility is limited to visiting teacher trainees and confirming theirappointments. In Senegal there are no inspectors who are assigned thetask of visiting teachers and advising them on their teaching practices.Headteachers are often appointed more on the basis of their length ofservice rather than their management skills. They cannot offer muchsupport to teachers nor do they animate teaching teams.
Teachers’ teaching conditions have also deteriorated drastically inSenegal, Burkina Faso and Mali. There are not enough textbooks andteaching materials, either for the pupils or for the teachers (one book perthree or four pupils on average in Senegal, less in Burkina Faso wherethe state is no longer providing the books). Books are often tooexpensive for the children to buy and libraries are reduced to aminimum; there are also no photocopying facilities, which could havecompensated for the lack of materials.
Class disruption due to teacher strikes and/or absenteeism, as wellas students’ absenteeism, is responsible for the school instructional yearbeing much shorter than it is meant to be. This contributes to loweringthe quality of education.
The situation in terms of equipment is also below standard in mostschools. Tables and benches are available in insufficient number. Not allschools have laboratories: where there are some they are often emptyand the teachers do not have the necessary equipment and consumablesto do demonstrations, not to mention practicals. In Mali 6 out of the 33state upper-secondary schools do not have electricity and another 6 donot have water. The situation is generally better in Côte d’Ivoire, wherethe schools are relatively well equipped and furnished.
Technical schools, which exist at lower and upper secondary, donot have up-to-date equipment or raw materials. The absence of fencesand caretakers is also responsible for the disappearance of muchequipment and material from the schools.
143
Financing secondary education in selected francophone countries of Africa:issues and perspectives

International Institute for Educational Planning http://www.unesco.org/iiep
The situation regarding buildings is not much better. As the pressureof demand was being felt and insufficient numbers of schools were beingcreated, existing schools were asked to accommodate more pupils. Hence,the number of pupils per classroom has become very high. The size ofstate schools has increased, the length of the school day has been extendedor double-shift introduced. The average school size of a lower-secondaryschool is 676 pupils in Senegal, 1,267 for an upper-secondary school. Thisis an average: in Dakar, several upper-secondary schools accommodate upto 5,000 youngsters. In Côte d’Ivoire, the average size of a secondaryschool was 1,950 pupils in 1992/93. Such a size allows for economies ofscale but these schools may have real management problems and may notbe conducive to proper learning. Rural areas of Burkina Faso, Madagascarand Mali have smaller-sized schools at lower-secondary levels, thanks totheir governments’ respective policies of enforcing nine years of basiceducation (Mali), and of situating a lower-secondary school in everydepartment (Burkina Faso). Small schools are more likely to facilitateenrolment of rural pupils and of girls and they avoid having to organizeboarding facilities. Their disadvantage is that they are costly to run if thereare not enough pupils to ensure a good utilization rate of specializedteachers and facilities. But there are often few, if any, specialized facilitiesand teachers in such schools. Several government schools in the rural areasof Mali, Côte d’Ivoire and Burkina Faso are actually not operating at fullcapacity, either because their location was badly planned, their enrolmentwas overestimated, or because rural families cannot afford the cost ofschooling.
Last, but not least, a serious problem is that the buildings are notproperly maintained. This is due to government budget limitations, butalso to the lack of other partners willing to step in to contribute to thefinancing. There is still a fairly strong belief that investment insecondary-school buildings is the responsibility of the state. This may bedue to:1. historical reasons: i.e. the state has always financed the
construction of secondary schools, often with the help of aidagencies;
2. practical reasons: secondary schools have often been constructedaccording to high construction standards and cannot be easilymaintained by members of the community or other decentralizedagencies;
3. structural reasons: village communities have rarely developed afeeling of ownership towards a secondary school that serves notone but several communities.
144
Financing secondary education in developing countries

International Institute for Educational Planning http://www.unesco.org/iiep
The new decentralized bodies, which are created at regional ormunicipal level in the framework of the decentralization policy, are expectedto play a role in school construction and maintenance, but they need toreceive adequate resources from the central government to do so (local taxesare too limited). Several municipalities and regional authorities have startedbuilding schools or maintaining them in Senegal, Côte d’Ivoire and BurkinaFaso. It remains to be seen whether this will become a significant trend andwhether decentralization will allow to devote more funds to education.
The situation in private schools is not much better than that instate schools, rather the contrary. In fact, the private sector is quiteheterogeneous. It comprises religious schools – Islamic (Medersas),Catholic and Protestant – and a large number of non-religious, profit-making institutions, run by a variety of private providers, amongst whomretired teachers. The quality and the teaching conditions differ a lot fromone type of private secondary school to another. Catholic and Protestantschools are recognized as providing better-quality education in severalcountries: pupil/teacher ratios are lower, schools are smaller, equipmentand teaching materials are available in greater quantity – more is spenton non-salary costs -, the teaching-learning process (homework etc.) isbetter controlled and the discipline better enforced. This contributestowards making them popular with urban parents, who can afford to payfees – civil servants and teachers in particular. Many of them receivesubsidies from the government, as we shall see below. The profit-makinginstitutions are more heterogeneous: they include some very goodschools – which charge high fees – as well as some very poor ones.
In Senegal, Mali and Burkina Faso, Catholic schools employ amajority of trained permanent teachers with the status of private schoolteachers; profit-making (non-Catholic private) schools, on the otherhand, employ large numbers of qualified but untrained teachers (i.e.university graduates), who do not have a permanent status and whomthey pay less. They also make extensive use of state teachers whocomplement their salary by teaching a few periods in their schools.
One of the consequences of the poor teaching conditions are thehigh repetition rates as discussed above, and the low pass rates in theexaminations organized at the end of each secondary cycle. Pass ratesare low in the lower-secondary examination, lower in Burkina Faso andCôte d’Ivoire than in Mali and Senegal, but they have increasedeverywhere. These rates give an indication of the unsatisfactory level ofstudents’ learning and achievements but they also reflect governmentpolicies in terms of flow regulation: this is one of the reasons why thepass rates are higher in Mali (see Table 7).
145
Financing secondary education in selected francophone countries of Africa:issues and perspectives

International Institute for Educational Planning http://www.unesco.org/iiep
The percentage of pupils who pass the end-of-secondaryexamination (baccalaureate) is particularly low in Burkina Faso and inCôte d’Ivoire, although it did increase in the latter during the last year;in Senegal it is slightly higher. It depends on what is considered asatisfactory level of achievement in each country. The baccalaureate,however, not only certifies what students have learned at secondary, italso authorizes them to enter a university: it is therefore an importantpolicy variable for the development of higher education.
Pass rates are rarely published separately for private and publicschools. This information is available in Burkina Faso: it shows thatprivate schools have on average a lower pass rate than state schools. Thisis the proof that although some private schools are good schools, inBurkina Faso at least the majority are not as good as state schools.
Table 6.7 Pass rate in the lower-secondary and upper-secondaryexaminations
Source: Countries’ statistical yearbooks.
Cost of secondary education
Unit costs of education relative to the GNP per capita are high inthe francophone countries. As mentioned earlier, this is reflected in therelatively high proportion of GNP devoted to education, in spite of stillmodest enrolment rates at all levels (Table 2). The costs of secondaryeducation in particular are high. Table 8 indicates the unit costs ofsecondary education over those of primary education in the countriesstudied. It costs twice as much to enrol a student at lower secondarycompared to primary in Senegal and Mali, nearly four times as much inMadagascar. The cost differentials between primary and upper
BEPC/BFEM/DEF Baccalaureate
Total Private Total Public Private
Burkina Faso 96 25.8 n/a 43.4 44.9 40.298 37.5 n/a 25.0 29.9 25.6
Madagascar 98 26.1 n/a 29.6 n/a n/a
Côte d’Ivoire 94 7.9 n/a 13.2 n/a n/a96 24.8 n/a 30.1 n/a n/a98 35.6 n/a 35.9 n/a n/a
Senegal 98 55.1 n/a 45.5 n/a n/a99 55.6 n/a 44.3 n/a n/a
Mali 98 66.9 n/a 39.3 n/a n/a
146
Financing secondary education in developing countries

International Institute for Educational Planning http://www.unesco.org/iiep
secondary are even more substantial: a lycée student costs five times asmuch as a primary student in Senegal and eight times as much in Maliand Madagascar. These costs will make expansion difficult to achieve.
Table 6.8 The cost of secondary education over that of primaryeducation
* Lower- and upper-secondary schools together.** Catholic/non-religious schools.Source: Countries’ statistical yearbooks. For Madagascar: Péano and Rahaririaka (1997); WorldBank, 2000.
The reasons for such high costs relate essentially to high salarycosts per pupil. These in turn pertain to:
• The low rate of utilization of teachers: the pupil/class ratios maybe high, but not the pupil/teacher ratios (Table 9). This is due tothe relatively modest effective teaching load. A lower-secondaryschool teacher is generally expected to teach 22 periods and aqualified upper-secondary school teacher 18 periods: a number ofperiods far below what is foreseen for pupils by the curriculum. InSenegal, for example, secondary-school teachers are expected toteach 18 periods while the curriculum stipulates that students atlower secondary should have between 29 and 34 periods ofteaching a week. Thus to cover the curriculum it is necessary tohave at least 1.6 to 1.9 (full-time equivalent) teachers per class.But not all teachers teach a full load. In Madagascar the averageworkload for a teacher was 15 hours a week at lower-secondarylevel and 13 hours a week at upper secondary. In Mali, secondaryteachers teach 18 hours on average and not the 22 they are meantto teach. Consequently it is necessary to have on average 2teachers per class in lower-secondary and 2.6 in upper-secondary
Lower secondary/ Upper secondary/Primary Primary
Public Private Public Private
Madagascar 1993 4.4 1.6 6.6 2.91998 3.7 n/a 8.1 n/a
Côte d’Ivoire 1980 3.7 n/a n/a n/a1993 2.2 n/a n/a n/a1995 2.9* n/a 2.9* n/a
Senegal 1995 1.8 n/a 5.2 n/a
Mali 1994 1.7 1.77/3.58** 7.08 n/a1996 2.5 n/a 8.17 n/a
147
Financing secondary education in selected francophone countries of Africa:issues and perspectives

International Institute for Educational Planning http://www.unesco.org/iiep
state schools in Senegal, 1.7 in those of Côte d’Ivoire (where thenumber of teaching periods has been reduced at lower secondary)and 1.6 in Burkina Faso. At upper-secondary level, thediversification of streams and options contributes to the low rateof utilization of teachers.
Table 6.9 Pupil/teacher ratios in primary and secondaryeducation, 1998
Source: Countries’ statistical yearbooks.
• The high level of teacher salaries at the secondary level, measuredeither as a proportion of the salary at primary level or as aproportion of the national income per capita. In Madagascar,lower- and upper-secondary teachers cost respectively 1.8 timesand 2.1 times that of primary teachers in 1993 (Péano andRahaririaka, 1997). This was reduced to 1.5 in 1998 (World Bank,2000). In Côte d’Ivoire the ratios are respectively 1.2 and 2.1. InMali, total personnel costs per pupil are 2.5 times higher at lowersecondary than at primary. The salaries of secondary-schoolteachers are equal to 4 times the national income per capita inMadagascar, 9.5 times the national income in Côte d’Ivoire and10.4 times in Senegal.
• The use of non-teaching staff. There is an administrative staffmember for every five teachers in Senegal in state lower-secondary schools and for every two teachers in upper secondary.Similarly there is one for every two teachers at both lower- andupper-secondary levels in Madagascar.
In most countries, teachers’ salaries constitute by far the largestproportion of secondary-school costs: 81 and 80 per cent respectively inlower- and upper-secondary schools in Madagascar, 80 per cent inlower-secondary schools of Mali (to which should be added another 10per cent for non-teachers’ salaries). Schools are no longer offeringboarding facilities: pupils have to organize themselves informally, i.e. bystaying with relatives. Lunches are provided for some pupils, but are
Primary Secondary
Burkina Faso 46.5 28.2
Madagascar 53.3 16.4
Senegal 50.0 19.8
Côte d’Ivoire 41.3 30.9
148
Financing secondary education in developing countries

International Institute for Educational Planning http://www.unesco.org/iiep
financed by the families (Madagascar). Families have to buy textbooks.Thus teaching materials constitute in most countries – with the possibleexception of Côte d’Ivoire – a very small proportion of recurrent costs.
These unit costs are so high that some countries have started to takemeasures to reduce them. This is the case in Côte d’Ivoire, for example,where a secondary-school pupil used to cost, in 1980, 3.7 times as much asa primary-school pupil: this ratio came down to 2.2 times in 1993 thanks tothe reduction in the number of teachers per class, and the lowering of thesalaries of teachers who joined the civil service after 1991. Indeed, in 1991,the Government of Côte d’Ivoire, considering the relatively high salaries ofteachers as expressed in terms of GNP per capita, decided to cut by half thesalaries of all those who joined the civil service as teachers. The number ofpupils per class was also reduced thanks to a reduction in the number ofhours taught at lower-secondary level.
Countries like Senegal and Mali are increasingly using non-permanent and contract teachers: these represent now 11.2 per cent inmiddle schools in Mali; 28.2 per cent in general upper-secondary schoolsand 46 per cent in technical schools. This will eventually have an impacton unit costs. Mali also succeeded in significantly reducing the cost oflower-secondary school by making lower secondary part of basic(fundamental) education, simplifying the curricula, reducing the numberof years and lowering the building standards. As a result of these measures,in 1994 a lower-secondary pupil cost only 1.7 times as much as a primarypupil. This has since increased to 2.5 in 1997. But an upper-secondarypupil cost a lot more: 8.17 times what a primary-school pupil cost.
There is no clear indication as to whether or not private schoolscost less or more than government schools per pupil: it depends on thecountry and the type of private schools. In Madagascar, a secondarypupil mobilized, in 1993, 2.4/2.5 times fewer funds in a private than in astate school. In Mali, on the other hand, Catholic and non-religiousschools cost more (by a factor of 1.7 and 3.6 respectively) thangovernment schools in 1994. Their pupil/teacher ratios were lower; theyemployed more administrative staff. Catholic schools paid their teachersbetter. The non-religious schools, which constitute the majority ofprivate schools, paid their teachers less, but their expenditures onteaching materials were higher (Péano and Esquieu, 1996). Moreresearch would be required to find out whether private schools cost moreor less than government schools in the different countries, now that somany non-religious schools have been opened. It would also beinteresting to find out how much subsidized schools cost the state, ascompared to a government school, and with what effect.
149
Financing secondary education in selected francophone countries of Africa:issues and perspectives

International Institute for Educational Planning http://www.unesco.org/iiep
Financing of secondary education
In most countries government schools are heavily financedthrough the central government budget, even at the secondary level, butin view of the limitation of government resources families have beenasked to contribute to non-salary costs.
There are no fees at all in the public schools of Côte d’Ivoire, butpupils have to pay for their textbooks, uniforms, and transportation. InBurkina Faso, there are no fees either, in principle, for those studentswho have passed the common entrance examination, but a contributionhas to be made to the parents’ association, and pupils who have notpassed the entrance examination have to pay fees to the parents’association. This helps the school in buying materials or in paying thesalary of temporary service teachers.
In Senegal, on the other hand, fees have been introduced that serveto finance the purchase of didactic materials and other non-salary costs.The fees are regulated by a Ministry decree. In addition pupils have tocontribute to the parents’ association. This last contribution varies fromschool to school and may in some cases be as high as the fees.4 InMadagascar fees and other contributions are also collected in the publicschools.
The state also gives some limited contributions to registeredprivate schools. The policy in this respect varies from country to country;it also varies in time depending on the level of government resources.Direct contributions can take the form of direct grants to eligibleschools, subsidies to individual teachers, and/or scholarships to studentswho meet all the criteria but cannot find a place in a state school. InSenegal and Madagascar the state can in principle subsidize registeredprivate schools. This practice is not very common in Senegal but two-thirds of the schools in Madagascar receive such grants, however modestthey may be. Also in Madagascar, the state gives a small subsidy to40 per cent of all teachers in private schools (World Bank, 2000). InMali, on the other hand, the state finances 80 per cent of the teachers’salaries in Catholic schools, but profit-making institutions – the vastmajority – only receive some occasional help. In Burkina Faso and inCôte d’Ivoire the government increases the supply of publicly-financedplaces by buying places from private Catholic and Protestant schoolswith which they have a contract. The Ministry then pays the fees for
150
Financing secondary education in developing countries
4. Between 500 FCFA and 2,000 FCFA per year depending on the school, while fees amountto 1,500 FCFA.

International Institute for Educational Planning http://www.unesco.org/iiep
those pupils who have passed the entrance examination but could not beenrolled in any public school.5 In addition to offering direct subsidies thestate also contributes indirectly by training private school teachers, bysometimes allocating some of its own trained teachers, and of course byhaving some of its teachers give a few hours of teaching at lower rates inprivate schools.
All in all, governments spent from 25 per cent (Burkina Faso,Senegal) to 36 per cent (Côte d’Ivoire) of their education budget onsecondary education in 1996 (see Table 10). This share increasedsubstantially between 1990 and 1996 in Mali and Madagascar, while itremained fairly stable in the other countries. This is more than can besaid for primary education: in spite of all the commitments made inJomtien at the Education for All Conference, the share of primaryeducation declined in almost all countries except Burkina Faso. Theshare of higher education in the overall education budget also declined –except in Côte d’Ivoire – sometimes quite substantially, as in BurkinaFaso and Madagascar. In the meantime the share of education in theoverall budget increased everywhere except in Côte d’Ivoire andMadagascar, but its share in the GNP declined, as a result of theincreasing weight of the external debt, the implementation of variousadjustment programmes, and pressure to cut down on publicexpenditure. All in all, it can be said that secondary education has notlost its importance in the education budget in spite of the official priorityfor basic education. In some countries it even appears as being the mainbeneficiary of the reallocation of resources from higher towards basiceducation. Public resources are nevertheless quite limited: the proportionof the GNP that is spent on secondary education has declined in mostcountries except Mali. Will governments be able to spend more onsecondary education in the near future? This has to be seen in the contextof competing demands from other educational levels, particularlyprimary education. It is not sure that the past trend will continue if basiceducation for all is ever to be achieved.
151
Financing secondary education in selected francophone countries of Africa:issues and perspectives
5. Some 40,000 FCFA in Burkina Faso; some 120,000 FCFA for a lower-secondary studentand 140,000 FCFA for an upper-secondary one in Côte d’Ivoire.

International Institute for Educational Planning http://www.unesco.org/iiep
Table 6.10 Financing of secondary education
Source: World Education Report 2000 and EFA country reports 2000.
Why expand secondary education?
Is it in fact necessary and legitimate to expand secondaryeducation in the countries concerned while primary education for all isyet to be achieved and while many secondary-school leavers areunemployed? No precise statistics are available on the unemploymentrate by educational level, but it is a well-known fact that many secondaryand university graduates in these countries are available on the jobmarket, waiting for jobs. There are nevertheless several reasons thatmilitate in favour of expanding secondary education:
First, it is difficult to motivate children to complete primaryeducation if, beyond primary, opportunities for further studies aredrastically limited. As primary education has expanded, and the primaryeducation certificate has become the rule rather than the exception, itsmarket value has considerably decreased. The only chance for ayoungster to obtain access to a modern-sector job remains to enrol insome form of post-primary education, even if that chance is limited.
Second, levels of educational attainment after five or six years ofprimary education are unsatisfactory. Education can be expected tocontribute to economic growth and poverty alleviation only if pupils doindeed acquire the necessary knowledge, skills and values required:essentially mastering literacy, numeracy and having some understandingof the world around them. According to one evaluation of learningassessment conducted in a number of African countries, only 31 per centof Grade 5 pupils in Senegal attain the minimum level of mastery learningin a test measuring competences in literacy, numeracy and life skills; this
Education as Share of Share of Share of Education budget% of public primary education secondary education higher education in GNP
budget in government in government in governmenteducation budget education budget education budget
1990 1996 1990 1996 1990 1996 1990 1996 1990 1996 1998
Burkina Faso 16.7 18.3 41.7 56.6 25.8 25.1 32.1 18.3 3.6 3.4 n/a
Mali 25.0 25.2 46 40.9 24.2 32.5 18.1 16.4 3.1 2.5 n/a(94) (94)
Senegal 27.0 33.0 43.9 35.8 25.7 24.4 24.0 23.7 4.1 3.7 4.0
Madagascar 17.6 11.1 36.0 30.0 26.1 33.4 26.8 21.1 3.0 2.0 2.6
Côte d’Ivoire 35.6 24.0 49.7 45.2 35.6 36.2 14.6 18.6 7.7 5.0 5.0
152
Financing secondary education in developing countries

International Institute for Educational Planning http://www.unesco.org/iiep
proportion rises to 54.4 in Mali and 66.1 in Madagascar. The results aremuch lower if one looks at the proportion of pupils reaching the desiredlevel of mastery learning in the combined test, since only 2 per cent ofGrade 5 students reach that level in Senegal, 7 per cent in Mali and 11 percent in Madagascar (Chinapah, 2000).6 Similar results emerge from theanalysis conducted by the Programme of analysis of education systems infive countries of the ‘CONFEMEN7’ (PASEC). The average scores oncomparable standardized tests in French and in mathematics are not verysatisfactory in any of the countries: 35 per cent of correct answers onaverage in Senegal, 45 per cent in Burkina Faso and Côte d’Ivoire and 51per cent in Madagascar. The proportion of Grade 5 pupils with at least 40per cent of correct responses8 does not exceed 36 per cent in Senegal, 61per cent in Burkina Faso, 63 per cent in Côte d’Ivoire and 76 per cent inMadagascar (CONFEMEN, 1999). An additional four years of secondaryeducation would consolidate the basic knowledge of these youngsters andcontribute to strengthening the countries’ human and social capital.
There is no easy answer to the question: would additionalresources be better used in increasing quality at primary to improvepupils’ performance instead of lengthening the duration of basiceducation? The PASEC data however show that it is not in countrieswhere the proportion of GNP spent on primary education is the highest,conditions of teaching apparently the best and education spending perpupil the highest, that learning achievements are the highest.Econometric analysis of the determinants of these learning achievementsindicates that several factors that are important for the learning ofchildren, such as the availability of books or the language of instruction,are not very expensive to provide, whilst other factors that are morecostly, such as repeating, or a high education level of teachers, are notpositively correlated with pupils’ learning achievements (Michaelowa,2000). In other words it should be possible to improve learningachievements at the primary level using the existing amount of resourcesin a different way. On the other hand, providing secondary education andlengthening the duration of basic education would increase youngsters’opportunities to learn, and would do so at an age when they are morelikely to understand abstract concepts and to acquire higher-order skills.
153
Financing secondary education in selected francophone countries of Africa:issues and perspectives
6. Minimum level of mastery learning is attained when a student has 50 per cent correctanswers on the test. The desired level of mastery learning is attained when a student has 89per cent correct answers.
7. Conférence des Ministres de l’Education ayant le français en partage.8. Barely above chance level. A pupil answering at random could get 30 per cent of correct
answers.

International Institute for Educational Planning http://www.unesco.org/iiep
Third, given the current structure of the economy in most of thesecountries, the majority of secondary-school leavers are, at least in thecoming years, likely to join the informal sector. Several studies haveshown that the productivity and the income of the self-employed risewith their educational level, and that secondary-school leavers are morelikely to work in the most modern part of the informal economy, thuscontributing to overall economic modernization and the fight againstpoverty (Birks et al., 1994).
Fourth, it is not clear how HIV/AIDS will affect primary- andsecondary-school teachers in the countries concerned. The rate ofprevalence is quite high in countries such as Burkina Faso and Côted’Ivoire. It may very well be necessary in these two countries to trainmore students at secondary-school level so as to replace primary teachersthat are sick or dying. Moreover, the majority of present secondaryschools are concentrated in the urban areas. Just as to reach universalprimary education it will be necessary to increase coverage and teacherrecruitment in rural areas, it seems important to increase the coverage ofsecondary and to pay due attention to the spatial distribution of schools.
Fifth, francophone countries have typically lower enrolment ratesat secondary level than anglophone countries at an equal or even lowerlevel of economic development.
Different policy options could be considered by francophonecountries in order to finance a higher participation of their youngsters insecondary education:
• Increasing the share of the GNP and of the budget spent oneducation. In several of the countries concerned (e.g. Mali,Burkina Faso and Madagascar) the current level of spending oneducation expressed as a proportion of GNP is still relativelymodest compared to other low-income countries. It is to beremembered however that the fiscal base on which publicresources are drawn is relatively limited in many of thesecountries, that the share of government spending in the GNP hasbeen curbed by various adjustment programmes and that there aremany competing demands on the budget including servicing theexternal debt. In such a context, to increase the share of educationin the overall budget and in the GNP may not be so easy. It willrequire strong political will and a real commitment in favour ofeducation. Senegal seems to have taken that path as from 1996.Côte d’Ivoire, on the other hand, has had to reduce drastically theproportion of its yearly budget on education, from 35 per cent in
154
Financing secondary education in developing countries

International Institute for Educational Planning http://www.unesco.org/iiep
the early 1990s to 24 per cent. Hopefully, thanks to the more rapideconomic growth that countries started to enjoy in the late 1990s,more resources will be made available to both governments andfamilies to spend on education. Several of these countries will beentitled to debt relief within the Highly Indebted Poor Countriesinitiative of the World Bank and IMF (HIPC). The sums that willthus be released are likely to be important but the ministries ofeducation will have to compete with health and other socialsectors and many conditions may be posed before the money isavailable. Last but not least, within the education sector itselfthere are many competing demands on the budget.
• Increasing the share of the budget allocated to secondaryeducation in the overall education budget. Considering thatprimary education is still far from universal, and that much of theexpansion of primary schooling in recent years has been possiblethanks to a heavy mobilization of communities which build andmaintain schools, and recruit and pay voluntary teachers, it seemsdifficult to argue that funds should be taken away from primary tobe allocated to secondary, at least in the short run. Highereducation is also very expensive and takes a fair part of the budget,but this share has already declined in many of the countries. Theconditions of learning at that level are already also so critical thatcutting the sub-sector budget further might compromise theformation of a real human capital and the capacity to train themanagers, leaders, scientists and teachers that are needed forfuture development. Expenditure on vocational education has alsobeen considerably reduced, and development in that sector hastaken place very much through a higher participation from theprivate sector. Cutting much further on government expendituremight endanger the creation of a skilled labour force. It is difficultto establish how much should be spent on each educational leveland this has to be seen on a case-by-case basis, but, as mentionedabove, secondary education has not really suffered in the processof reallocation of resources in favour of basic education. Thus it islikely that in the coming years resources for secondary educationwill grow at the same speed as the overall education budget; morewill have to be achieved with the present level of resourcing.
• Increasing the efficiency of the education system. Reducingrepetition would decrease the number of years necessary to produce
155
Financing secondary education in selected francophone countries of Africa:issues and perspectives

International Institute for Educational Planning http://www.unesco.org/iiep
a graduate, and nearly twice as many graduates could be producedwith the same resources. Studies conducted on achievement levelsat primary have shown that repeating contributes to improvinglearning achievements for the lowest achievers only, and that evenfor them the effect is temporary, i.e. does not last more than oneyear. Repetition, on the other hand, does not contribute toimproving the achievements of middle achievers (CONFEMEN,1999). These studies also show that similar levels of repetition canbe observed in all schools independent of what pupils really know:some pupils are asked to repeat in one school who would not haveto repeat should they be enrolled in another school. This isindicative of a culture according to which teachers consider normalthat a certain proportion of their pupils, the weakest, repeat. Thesame culture of repetition probably prevails at the secondary leveland would explain the very high repetition rate observed at thatlevel. Repetition is however a curriculum issue: it depends on whatteachers and curriculum specialists have fixed as being essential toknow in order to go on to the next grade. This could be changed andadapted to the level of knowledge and the requirements of students.The implicit reference to the baccalaureate as the entry examinationto universities is a problem in this respect. What needs to be knownto pass first the lower-secondary certificate and, later, the upper-secondary school certificate constitutes an implicit norm, whichinfluences teaching throughout the whole of secondary education.Should the curriculum of secondary education be redefined so as toemphasize the acquisition of knowledge, competences and skills tobe used in day-to-day life as a citizen and as a worker, rather thanthe requirements to enter higher education, then achievement levelscould be improved and the number of pupils repeating could bereduced. Overall repetition rates could also be reduced, shoulddifferent measures be taken that aim at providing additional supportto slow learners and students who missed some lessons for onereason or another.
Another way of reducing repetition would be to limit it to certaingrades such as the end of a cycle. Mali has introduced such a policy inbasic education. Repetition rates have thus declined from 30 per cent in1990/91 to 13.6 per cent in 1996/97 in Grade 1, from 35 per cent to 26 percent in Grade 5 and from 49 per cent to 35 per cent in Grade 9. Theyremain very high however in the last grade of each cycle (37 per cent and35 per cent respectively in Grades 6 and 9).
156
Financing secondary education in developing countries

International Institute for Educational Planning http://www.unesco.org/iiep
Repetition rates at the last grade of a cycle are clearly linked to theexistence of a selective examination. Those who fail theexamination repeat in the hope that they will succeed a secondtime. Opening access to secondary should contribute to reducingthe numbers of repeaters in the last grade of primary (as occurredin Grade 5 in Mali). At one point or another however selection willbe necessary, be it at the end of lower secondary and/or at the endof upper secondary. Several options are available: one is to allowonly one repetition in state schools. Those who have not achieveda certain level when taking the examination the first time, or thosewho fail twice, would not be allowed to repeat in a governmentschool and would either have to stop their schooling, take theexamination again without having followed classes, or continue ina private school. Another complementary option would be tocompletely separate the examination(s) certifying the end of acycle from the selection examination to enter the next cycle/level:the baccalaureate would cease to be the passport for enteringhigher education and a higher education entrance examinationwould have to be organized. This debate is not new nor is itspecific to the francophone countries of Africa (Keeves, 1994);many suggestions have been made on how to do this as well. Thedecision is a political one. It is however an important issue totackle if secondary education is to be expanded in French-speaking countries. This would free a lot of places which could beoffered to others, and could also contribute to improving therelevance of secondary education.
• Curriculum reform. In most of the countries of the region, thecontent has not really been revised at secondary level.9 Apart fromthe necessary changes in history and geography, the curriculumcontinues to be very much influenced by the one used by theformer colonial power. Although the primary curriculum mayhave been revised, it has not been made terminal and continues toprepare for secondary education, which itself prepares for highereducation. The goals of the lower-secondary schools are not welldefined: which skills, which competences are they trying to
157
Financing secondary education in selected francophone countries of Africa:issues and perspectives
9. A movement of reform of content, covering most countries of French-speaking Africa, isunder way, conducted by curriculum specialists of the individual countries. The objectiveis to harmonize the curriculum in the region’s various countries. It should lead to thepreparation of textbooks.

International Institute for Educational Planning http://www.unesco.org/iiep
develop? What should the youngsters actually know when theyleave school? For what sort of adult life and working life shouldthey be prepared? Similarly, the objectives of general upper-secondary schools are not clear, apart from preparing foruniversities, the access to which will become more and morelimited. The lack of relevance of secondary education is whatexplains the relative demand for technical courses at post-primarylevel. These courses are, however, expensive and altogether notvery efficient.
Thus curriculum reform appears necessary to improve the qualityand relevance of secondary education: hopefully students would find iteasier to learn a programme which is of more direct concern to them;they might also be more prepared to take a job outside the formal sectorof the economy. This reform would obviously concern content andteaching methods but it could affect as well the weekly number of hoursand the number of subjects taught at different levels, which would havea consequence on unit costs. Presently in general lower secondary, someseven subjects are being taught that require specialized teachers. Manyteachers do not teach more than one or two subjects, as they have notbeen trained for more. Should the number of hours taught and thenumber of compulsory subjects in the curriculum be reduced, fewerteachers would be required to cover the whole curriculum of one class.Preparing teachers to be more versatile would also facilitate their fullutilization in small schools. Their average teaching load would beincreased, the number of teachers required per class would be lower andso would the cost. The reduction in the number of periods taught atlower-secondary level in Côte d’Ivoire has succeeded in reducing theteacher/class ratio, and hence the cost of secondary schooling, as wehave seen. A similar measure is considered in Senegal.
• Structural reform and school organization. Together with thecurriculum reform, a structural reform can be envisaged so as toreduce the number of years of secondary education, particularlylower secondary. In most countries in the world school education(primary plus secondary education) lasts 12 years: in several of thefrancophone countries of Africa it lasts 13 years. The number ofyears of lower secondary – four years – could be reduced so as tomake up, together with primary, a nine-year basic education (aswas done in Mali). Cutting one year would obviously reduce theoverall cost of secondary. Promotion to lower-secondary education
158

International Institute for Educational Planning http://www.unesco.org/iiep
could eventually be made quasi-automatic, saving on the cost ofrepetition and on that of organizing the examination. This of coursecould not be done without major structural and content revisionaffecting several aspects including teachers’ recruitment andpayment. This would form part of the curriculum revision asdiscussed above, defining in a realistic way what a youngster needsto know at the end of 9/10 years of basic education. An integratednine-year basic education could also help in providing secondaryeducation in the rural areas at a lower cost, with fewer teachers andless sophisticated equipment and buildings: with smaller schools,possibly attached to a primary school rather than to an upper-secondary school, and with fewer, more versatile teachers coveringseveral subjects in an integrated way.
Structural reforms can be costly to implement and take a long timebefore they are put in practice. Hence the need for such reforms has to becarefully assessed, taking into account several criteria, apart from costs.Even without such reform, however, a careful analysis of the spatialdistribution of institutions at all levels and of the criteria for opening newsecondary schools in rural areas could be done. The possibility ofcombining different levels of schooling under the same roof (primary andlower secondary; lower secondary and upper secondary) should beconsidered in rural areas so as to reduce drop-out from one level toanother, reduce distances and share certain costs such as administrationand maintenance. Most private schools do indeed offer different levels ofschooling, thus taking advantage of economies of scale.
• Reducing the cost of secondary schooling. As was seen above, notmuch saving can be expected from increasing the number ofpupils per class, which is already very high. No big economies canbe made on non-salary costs either, as teaching conditions havealready considerably deteriorated. While in some instancessavings could be made on non-teaching salary costs (onadministrative staff for example), other non-teacher unit costsmay have to be increased, so that schools can be equipped withfurniture, books and equipment of all kinds, facilities maintainedand teacher supervision and support organized.
Two measures may be considered that would help in reducing thesalary cost per pupil. One is to increase the proportion of qualified butuntrained teachers to be appointed as contractual teachers: they could be
159
Financing secondary education in selected francophone countries of Africa:issues and perspectives

International Institute for Educational Planning http://www.unesco.org/iiep
trained through on-the-job training and distance training. In themeantime they would be paid less than the present qualified permanentteachers. Similar teachers are already employed by private schools,receiving lower salaries, and it does not seem to be too much to thedetriment of the quality of schooling. Senegal and Mali have starteddoing so, making it an official policy in Senegal after several rounds ofnegotiations with the trade unions and other stakeholders. Such a policyalso enables jobs to be provided for a number of unemployed universitygraduates. The important thing is to pay them regularly (somethingwhich has not always been guaranteed in the past, even for civil servants)and to offer them the opportunity of eventually becoming part of the civilservice.
Another way of reducing the teaching cost per pupil would be toincrease both teachers’ effective teaching load and their official workingload (at present 18 or 22 periods). An increase in the average teachingload of four periods would allow for an increase in the number of pupilsenrolled by nearly 20 per cent for the same cost. To increase the effectiveteaching load would imply using more appropriate methods of teacherdeployment and a better human resource database. A better databasewould make it possible to identify the schools where teachers are under-used; it could also help assess the number of teachers who are presentlypaid on the secondary education budget although they have not taughtfor years (for example because they are seconded elsewhere). Areduction in the number of subjects taught at lower-secondary level, asdiscussed earlier, would also help increase the teachers’ rate ofutilization, provided not too many options are offered. Increasing theofficial teaching load may be a more difficult measure to implement.However many government teachers are now teaching additional periodsin private schools to supplement their salaries. They often end upinvesting more effort in teaching pupils in schools that pay them less andthat are not their main employer, probably because private schoolmanagers are more demanding in terms of quality and outcome andbecause the job is not guaranteed. The challenge is to re-motivateteachers to teach more periods in their own school with the same salary.This obviously depends on the specific situation in each individualcountry; it also requires serious negotiations. Different measures such asimproved teaching conditions, closer association in the renovation of thecurricula, involvement in the management of the schools, school-basedsupport and the existence of different training opportunities, eventuallyleading to promotions, could contribute to such mobilization.
160
Financing secondary education in developing countries

International Institute for Educational Planning http://www.unesco.org/iiep
• Reducing the costs of construction. The lack of buildings andclassrooms is a major stumbling block in the expansion ofsecondary education. Unlike what occurs in many English-speaking countries, few secondary schools have been built by thelocal communities. The tradition is for the state to build theschools, often with the support of international developmentbanks and bilateral agencies. As a result the standard of schoolbuildings tends to be high, higher than what a local communitycan support or maintain. The cost of school construction could beconsiderably reduced, were the construction standards to bemodified. This seems to be essential at lower-secondary level,providing for example schools with multi-purpose rooms andscience kits rather than laboratories and expensive science blocks(Caillods, Göttelmann-Duret and Lewin, 1997). Even at upper-secondary level, economies could be made on school facilitiesincluding on the type of laboratories built.
• Diversifying the source of finance for state schools. Fees could beraised in state schools and/or their level increased so as to allowindividual schools to purchase more equipment and materials, toemploy non-teaching staff and ensure maintenance. While poorfamilies, particularly rural families, contribute so much tofinancing primary education and non-formal educationprogrammes, it does not seem unfair to ask those who can affordit to contribute to the secondary education of their children. Thesemeasures would not necessarily lead to increased disparities iffees are waived for the most promising children who cannot affordthem. What seems important is that the product of the fees shouldremain at the school level, to be used at the school level in orderto improve the quality of education; another important point isthat there should not be a multiplication of the type ofcontributions and fees required (for the schools, for the pupil-teacher association). Certain expenses would be better financed bythe state, such as the teaching and non-teaching staff, andscholarships for poor but bright children. Some systems of needs-based formula funding could also be developed so that schools insmaller towns and in rural districts would be assured of the samelevel of resourcing as for those in richer areas.
161
Financing secondary education in selected francophone countries of Africa:issues and perspectives

International Institute for Educational Planning http://www.unesco.org/iiep
Another possibility would be to pass the responsibility for theconstruction and maintenance of schools to a decentralized level(regions or municipalities). This is already the case in Senegal andCôte d’Ivoire. The efficiency of the measure has to be assessed ineach national context: it depends on the resources that theseentities control or can raise and on whether it is less expensive forthe regional authorities to build and to maintain than for the state.Otherwise, decentralizing might simply end up in creatingexpensive bureaucracies, which do not necessarily have staff thatare more trained and more competent, while leaving the problemunchanged. In other words, it might be more efficient in themedium term, when the personnel at the different levels have beentrained, but not immediately.
A final solution would be to allow each school to enter intovarious partnerships with local associations, enterprises and NGOs:while this is more likely to happen in technical schools than in generalschools, it should not be altogether excluded for general schools. Itimplies changing the culture of many headteachers, who would have tobe trained to become real managers.
• Increasing the size of the private sector. This can be done throughmaking the creation of a secondary school easier in countrieswhere the share of the private sector is still limited. Most countrieshave simplified the procedure for opening a private school.Senegal, for example, is now authorizing the creation of privateschools as soon as an official file has been deposited, withoutwaiting for it to be approved. Côte d’Ivoire and Burkina Faso havereduced the pressure on state schools by sending pupils to privateschools, which are fully or partially subsidized. Madagascar has along tradition of private schools.
There may be a limit to the development of a totally self-financedprivate sector, given the fact that the income of parents has decreaseddrastically in recent years. The issue is then whether the state shouldfinance the private sector at all, on what criteria and to what extent.Obviously a situation where the state pays more for a pupil in a privateschool than in a state one is difficult to justify (as for certain Catholicschools in Mali), but a lower level of subsidies as a flat grant to theschool (financing a certain number of teachers), training its teachers orgiving scholarships to its neediest students would make sense on
162
Financing secondary education in developing countries

International Institute for Educational Planning http://www.unesco.org/iiep
economic as well as social grounds. It might actually be more efficientfor the state to subsidize private schools that meet certain criteria, on thebasis of a few teachers per school or matching grants, rather than favourpublic schools only and block the expansion of secondary educationbecause of lack of public funds. The amount to be spent on privateschools would depend on the resources that the state has at differentpoints in time, expanding the subsidies as more funds become available.
• International assistance is another option for financing theexpansion of secondary education. Many countries are alreadyfairly dependent on international assistance and loans to financetheir building costs. This will obviously continue, taking intoaccount what was said earlier on reducing construction costs.Beyond such expenditure, international assistance can be extremelyhelpful if it is focused on those areas where international experienceis most needed, such as curriculum development, teacher training,financing of textbook production, examination reforms etc. Thiswill be developed further in Chapter 10 of this book.
Final remarks
There is no magic formula that determines exactly how muchshould be spent on secondary education in the different countries. Whatis clear is that the present Malthusian policy, which implicitly restrictsaccess to labour market requirements, has succeeded neither in allowingthe necessary development of primary education nor in training thenecessary workforce to enter the twenty-first century. For the reasonsdeveloped in this chapter, lower-secondary education would best besubstantially developed so as to eventually become part of basiceducation for all. Several measures could be taken to do this, whichinvolve reducing teaching costs, using assistant and contractual teachers,limiting repetition, using existing resources more efficiently, andadopting a more liberal policy towards private education. What is moredifficult to define is how much upper-secondary education should beallowed to expand. Clearly the expansion of lower secondary will createadditional pressure on upper secondary. In view of the limited resources,during a first phase a severe selection process is likely to continue to takeplace at the end of lower secondary. How many will have access to uppersecondary will depend on each country, the social demand for such aneducation, and the willingness of families to pay for such an education.
163
Financing secondary education in selected francophone countries of Africa:issues and perspectives

International Institute for Educational Planning http://www.unesco.org/iiep
As long as an overproduction of graduates still prevails, it might not bejustified to substantially increase the public investment at that level. Butit will be necessary to guarantee that a minimum number of well-trainedgraduates reach the end of secondary education (and higher education)and to ensure equality of opportunity. It is at that level that a trade-offbetween quality and increased access will have to be found. This willprobably require reviewing the present financing policy of both publicand private schools.
164
Financing secondary education in developing countries

International Institute for Educational Planning http://www.unesco.org/iiep
Introduction
Sri Lanka provides high levels of access to primary and secondaryeducation to its school-age population. Though it is a low-incomecountry with a GNP per capita of about $740 (1996), it had grossenrolment ratios of 103 per cent at primary, 66 per cent at secondary and4 per cent at tertiary level by the mid-1980s. Primary gross enrolmentratios of more than 90 per cent were first achieved in the 1960s. By 1993participation rates for the population aged 5-14 had reached 93 per cent(rural) and 96 per cent (urban). In the labour force as a whole the meanyears of schooling reached over nine years in 1995, indicating success inachieving and maintaining high enrolment rates throughout primary andsecondary school. Overall, 4.1 million pupils are enrolled in school, ofwhom 1.8 million are in the primary Grades (1-5), 1.4 million in juniorsecondary (Grades 6-9), and 0.9 million in senior secondary (Grades 10-13). Thus, more students are enrolled in total at secondary level than inthe primary grades.
This impressive record of educational provision has been achievedwithout unusually large allocations of funds. The percentage of GNPinvested in education was below 3 per cent until the mid-1980s and hassubsequently averaged less than 3.5 per cent. The share of education ingovernment expenditure has typically been 7-8 per cent, peaking in 1994at 10.5 per cent, since when it has fallen back to below 8 per cent (ADB,1996). These levels are below many other Asian countries (Lewin,1998).
This case study offers some insights into the characteristics of theSri Lankan education system that have made it possible to providewidespread access to secondary-level schooling to a substantialproportion of the school-age population.
165
Chapter VII
Financing secondary schools in Sri Lanka:high participation and low costs
Keith M. Lewin and Sugath Mallawarachchi

International Institute for Educational Planning http://www.unesco.org/iiep
First, it describes salient features of the organization and recentdevelopment of the education system. Second, an overview is providedof characteristics of schools, enrolments, flows of pupils through theschool system. Third, the system of financing schools is described.Fourth, a series of analyses are presented, based on data from a sampleof 532 schools identified for this study, to establish the patterns of salarycosts and costs per pupil. Indicators of performance are also linked withthe size of enrolments and pupil/teacher ratios. Fifth, demographicprojections are presented. Sixth, changes in the budgetary system andproposed reforms are reviewed. Seventh, a simulation model is used toproject enrolments, costs and teacher demand under different scenarios.Finally, some emerging issues are discussed along with a summary ofthe conclusions from the analysis, including some which may havegeneral applicability to problems of financing secondary schools.
1. Basic features of the education system
Sri Lanka has a long educational history associated with Bhuddistpirivenas (temple schools), Hindu temples and mosques stretching backover many centuries. Portuguese and Dutch colonists organized parishschools in the areas they occupied. The British formally occupied theisland in the early nineteenth century and by 1868 there were nearly1,000 schools enrolling 35,000 children. Mission schools grew uprapidly alongside the government schools. Elementary educationbecame compulsory in the early twentieth century and by 1931 thenumber of schools had risen to over 4,000, of which about 1,500 weregovernment schools. Most of the remainder were government aided.These schools enrolled about 600,000 pupils. Nearly 6,000 schoolsexisted at the time of independence in 1947. Almost all schools becamegovernment schools after the takeover of the government-assistedschools in 1961.
In the recent past, total enrolments in the school system grew from2.8 million in 1971 to 3.9 million in 1988. The number of schools grewby about 10 per cent, whilst enrolments increased by about 40 per cent,thus increasing average school size. Primary enrolments (Grades 1-5)expanded slowly from about 1.8 million to 2 million over this period.Enrolments above Grade 8 increased from 378,000 to 985,000,representing 13.5 per cent of the total in 1971 and 25 per cent by 1988.Thus, recent enrolment growth has been concentrated above Grade 8, aswould be expected from the early progress made towards high gross
166
Financing secondary education in developing countries

International Institute for Educational Planning http://www.unesco.org/iiep
Financing secondary schools in Sri Lanka:high participation and low costs
167
enrolment ratios in primary grades. Higher education has remainedrelatively small in terms of total enrolments. Currently there are12 universities with a total of 32,000 students, reflecting an enrolmentof about 2.5 per cent of an age cohort.
Since 1987, responsibilities for education have been devolved toprovincial authorities. The school system, which now consists of about10,300 schools, is almost totally administered by the ProvincialCouncils. The exceptions relate primarily to about 270 ‘NationalSchools’, which are directly administered by the National Ministry ofEducation and Higher Education. School structure matters, provision offacilities (including teachers), implementation of curriculum andsupervision, and monitoring of performance are undertaken by theProvincial Authorities. The recruitment and posting of graduate andtrained teachers is a function of the Provincial Councils. Uncertificatedteachers are recruited by the National Public Service Commission andare subsequently offered opportunities to be trained. Curriculumdevelopment, the production of textbooks and teacher training are allresponsibilities reserved by the National Ministry.
The education system uses Sinhala or Tamil as the medium ofinstruction and schools are usually one or the other, with a small numberoperating in both media. Most schools are of mixed sex. A commoncurriculum exists throughout the primary grades, which includes firstlanguage (mother tongue), English, mathematics, beginning science,environmental activities, aesthetics. The secondary curriculum consistsof nine subjects: first language (mother tongue), English, mathematics,science, social studies, health and physical education, aesthetics, lifeskills/technical subjects, religion. Life skills is taught in years 7 and 8,while Technical subjects are included in the syllabus for years 9 to 11.The General Certificate of Education (GCE ‘O’ level) is held in Grade11 and determines access to advanced level classes. GCE advanced levelhas three main streams, arts, commerce and science in Grades 12 and 13.
Administratively schools are classified into types that do notexactly follow grade levels in a conventional sense. Most schools haveboth primary and secondary grades. The classification is:
Type 1AB Mostly providing Grades 1-13, but some only haveGrades 6-13; all subjects are offered at universityentrance levels, including science. National schools aresimilar to Type 1AB schools, but are administered bycentral government.
Type 1C Similar to Type 1AB without science at higher levels.

International Institute for Educational Planning http://www.unesco.org/iiep
Type 2 Schools offering Grades 1-11 or 6-11.Type 3A Schools with Grades 1-8.Type 3B Schools with Grades 1-5.
Type 3 schools account for about 41 per cent of the total numberof schools; Type 2 schools about 37 per cent; Type 1C, 17 per cent, andType 1AB about 6 per cent. The proportion of enrolment in the differenttypes of school is 18 per cent, 33 per cent, 29 per cent and 20 per centrespectively and the proportion of teachers 19 per cent, 29 per cent,35 per cent and 17 per cent.
The number of government schools, enrolments, number of teachersand pupil/teacher ratios for schools in 1991 are shown in Table 7.1. Inaddition to government schools, basic education continues to beprovided in pirivenas and in private schools, most of which cater tourban middle-class children. Collectively, these account for a very smallproportion of total enrolment.
Table 7.1 Number of schools, enrolments, number of teachers,pupil/teacher ratios by school type, 1991
168
Financing secondary education in developing countries
Pupil/teacher ratios do not vary widely between school types,though there is substantial variation between schools. In the early 1990sabout 45 per cent of teachers were trained, another 23 per cent weregraduate teachers and the remaining 32 per cent were untrained. Averagepupil per trained-teacher ratios appear to vary between about34:1 (Kegalle District) and 117:1 (Mullativu District) (ADB, 1997). Thevariation in overall pupil/teacher ratios is much less between districtsand varies from 19:1 (Kegalle) to 38:1 (Kilochchi). One response to thehigh ratios in some areas was the recruitment of nearly 70,000 teachersbetween 1988 and 1991 to fill vacancies in remote rural schools.
Urban Rural Total
Type Schools Pupils Teachers PTR Schools Pupils Teachers PTR Pupils Teachers’000 ‘000 ‘000 ‘000 ‘000 ‘000
1AB 196 378.2 14.2 26.5 317 458.8 18.3 25.2 836.9 32.41C 159 155.0 6.1 25.3 1,351 1,039.2 43.4 23.9 1,194.2 49.52 297 159.8 6.3 25.2 3,284 1,222.4 53.7 22.8 1,382.2 60.03 194 56.9 2.0 28.0 4,200 664.8 26.7 24.9 721.8 28.7Total 846 750.0 28.7 26.1 9,152 3,385.1 142.0 23.8 4,135.1 170.7
Source: Ministry of Education and Higher Education; Educational Statistics, 1992.

International Institute for Educational Planning http://www.unesco.org/iiep
The flow of students through the education system is unrestrictedby selection tests up to Grade 11. Data from 1992 indicated that about80 per cent of those who enter in Grade 1 proceed to junior secondarycycle (Grades 6-8). Repetition rates in the early 1990s were between5 and 9 per cent over the primary cycle and 1 per cent and 6 per cent inGrades 6-10. Grade 11 had very high repetition rates (32 per cent) drivenby re-sitting ‘O’ level examinations. Grade 12 has virtually no repetitionand Grade 13 high rates as a result of ‘A’ level re-sits. Drop-out wasestimated at around 2 per cent for most of the primary grades.
Teachers’ salaries are not linked to the level at which teachersteach, but to qualification and experience. The ratio between the highestand lowest paid is about 3:1. For trained teachers this ratio is only 2:1,independent of whether they are teaching at primary or secondary level.Table 7.2 shows the salary scales.
Table 7.2 Salary scales for teachers proposed in 1996, Rupees (Rps)
169
Financing secondary schools in Sri Lanka:high participation and low costs
Sri Lanka has a policy of free education from Grades 1 to 13.Schooling facilities are widely distributed throughout the island andprimary school-age children rarely have to travel more than 4 kms to thenearest school. The quality of education has been enhanced by a freetextbook scheme for all children in Grades 1 to 11 introduced in the early1980s. Textbooks at secondary level are not free, but are subsidized.Curriculum development has been institutionalized at all levels since the1960s, and there is an established infrastructure for teacher training andin-service programmes. Free uniforms are provided. These, along withfree textbooks appear to account for the bulk of non-salary expenditure(as much as 75 per cent of school level). Noon-time meals are alsoprovided as a universal benefit and these were costing amountsconsiderably more than the costs of uniforms or books. It has been
Qualification Salary range
Uncertificated teachers 32,520 – 57,120
Certified teachers 36,420 – 57,120
Two-year diploma holders 47,720 – 77,280
Trained teachers 45,120 – 83,400
Untrained graduates 48,720 – 101,400
Trained general graduates 51,120 – 101,400
Untrained Honours graduates 51,120 – 101,400
Trained Honours graduates 54,720 – 101,400
Source: World Bank, 1996:45.

International Institute for Educational Planning http://www.unesco.org/iiep
170
Financing secondary education in developing countries
estimated that subsidies (predominantly meals, scholarships, anduniforms) may account for as much as 30 per cent of recurrentexpenditure on education (ADB, 1997).
Small facilities fees are charged of about 5-10 Rps per month andare levied on a discretionary basis. Other contributions are made throughschool development societies and old students associations. These varywidely between schools and in only a few cases are these a substantialsource of additional funding. Taken together these contributions amountto no more than about 3 per cent of total government expenditure oneducation.
2. Characteristics of schools and flows of pupils
A basic profile of enrolments, teachers and administrative staff ina sample of 532 schools was developed. The sample was based on about10 per cent of Type 1AB schools and 5 per cent of other types. Thereason for weighting the sample this way was to ensure that there weremore than 50 Type 1AB schools, thus ensuring a large enough group forindicators to be representative of Type 1AB schools. This would nototherwise have been true. The data are for 1997 and are drawn from theschool census system.
Table 7.3 shows enrolments and Table 7.4 shows how trained anduntrained teachers and administrators are distributed across the schoolsin the sample.
Table 7.3 Average enrolment in different types of schools, 1997
School type Average primary enrolment Average secondary enrolment
1AB 458 948
1C 316 465
2 163 188
3 120 53

International Institute for Educational Planning http://www.unesco.org/iiep
Financing secondary schools in Sri Lanka:high participation and low costs
171
Table 7.4 Enrolments, teachers by qualification, and administrators in sample schools, 1997
Type 2 and 3 schools have the smallest average enrolments at bothlevels, as might be expected. Type 3 schools are not supposed to acquiresecondary grades, but some do. The average secondary enrolment inthese schools is therefore based on those Type 3 schools which havesecondary enrolments.
Table 7.4 indicates that in these sample schools there are 3,778primary teachers of whom about 36 per cent are untrained. A little lessthan 10 per cent are graduates. At secondary level, there are 6,860teachers of whom 20 per cent are untrained and 36 per cent aregraduates. About 5 per cent of all staff are administrative on thesefigures. Most untrained teachers are to be found in Type 2 and 3 schools.
The pupil/teacher ratios in different types of schools are shown inTable 7.5. The calculations are based on an aggregation of the number ofteachers and pupils in each type of school in the sample.
Table 7.5 Pupil/teacher ratios by school type for trained anduntrained teachers, 1997
School Enrol- Enrol- Primary Primary Primary Total Secondary Secondary Secondary Total Adminis- Pupils type ment ment teachers teachers teachers primary teachers teachers teachers secondary trative per admi-
primary secondary graduates trained untrained teachers graduates trained untrained teachers staff nistrative staff
1AB 26,544 54,962 98 503 177 778 1,238 1,216 335 2,789 193 3501C 28,116 41,382 86 469 340 895 758 922 409 2,089 126 3922 29,646 34,253 89 529 444 1,062 443 786 527 1,756 159 2713 24,238 3,448 97 537 408 1,042 48 84 72 206 101 142Total 108,544 134,045 370 2,038 1,369 3,777 2,487 3,008 1,343 6,838 579 115
School type PTR PTR PTR PTR PTR PTR Overall primary primary secondary secondary primary secondary PTRtrained untrained trained untrained
All 45.1 79.2 24.3 99.8 28.7 19.5 22.8Type 1AB 44.2 150.0 22.3 164.1 34.1 19.6 22.8Type 1C 50.7 82.7 24.6 101.2 31.4 19.8 23.3Type 2 47.9 66.8 27.8 65.0 27.9 19.5 22.6Type 3 38.2 59.2 26.8 48.5 23.2 17.2 22.2
Overall average pupil/teacher ratios do not vary much. At primary,the lowest ratio of pupils to trained teachers is in Type 3 schools. Thisgroup of schools also has the lowest overall average ratios at primary asthey do at secondary. Type 3 schools which enrol secondary pupils haveoverall average ratios about 14 per cent less than other schools.

International Institute for Educational Planning http://www.unesco.org/iiep
The range of pupil/teacher ratios and the associated standarddeviations are greatest in Type 2 and 3 schools. The spread should bereduced both on grounds of equity and efficiency and this is consistentwith current policy. The problem has however been long standing(Lewin and Berstecher, 1989).
The flow of students through the schools is illustrated in Table 7.7.This shows how secondary-level students are concentrated in Type 1 and2 schools.
Table 7.7 Enrolments by grade and school type – totals and averages,1997
These aggregate ratios do not indicate variations between schoolsof the same type. It is this that will determine how much contact pupilshave with teachers in particular schools. Some indication of the range ofvariation in pupil/teacher ratios by school type is given in Table 7.6,which is based on school-by-school ratios.
Table 7.6 Variation in pupil/teacher ratios by school type, 1997
172
Financing secondary education in developing countries
School type Primary pupil/teacher ratio Standard Secondary pupil/teacher Standard deviation ratio deviation
Min Max Min MaxType 1AB 18 58 8.5 7 41 6.3Type 1C 15 45 8.1 9 60 6.6Type 2 3 149 20.2 2 75 11.6Type 3 5 138 18.4 5 112 20.9
GradeSchool type 1 5 1-5 6 10 11 6-11 12 13 12-13EnrolmentAll 20,390 21,965 108,667 22,740 19,488 26,579 133,850 8,133 10,346 18,4791AB 5,030 5,130 26,006 7,244 8,712 12,218 54,066 6,817 8,968 15,7851C 5,380 5,931 28,918 7,199 6,238 8,591 42,538 1,288 1,360 2,6482 5,542 6,263 30,010 7,050 4,510 5,754 34,493 32 27 593 4,446 4,628 23,681 1,278 66 48 2,959 0 0 0Average enrolment1AB 44 45 228 64 76 107 474 60 79 1381C 30 33 161 40 35 48 236 7 8 152 15 17 81 19 12 16 93 0 0 03 11 12 59 21 0 0 7 0 0 0

International Institute for Educational Planning http://www.unesco.org/iiep
173
Financing secondary schools in Sri Lanka:high participation and low costs
The cohort in the sample schools remains fairly constant in sizefrom Grades 1 to 10. This is the result of the interaction of repetition,drop-out and the underlying growth in the size of the school-age cohort.Type 1 and 2 schools receive students from Type 3 schools, resulting intheir cohorts increasing in size above Grade 5. Grade 11 is artificiallyinflated by repetition for ‘O’ level.
Table 7.7 shows that some Type 3 schools are enrolling pupilsabove Grade 5. Some even remain above Grade 8. This is the result ofcommunity ambitions to have a Type 2 school providing secondarygrades. Though these enrolments are not formally permitted in Type 3schools, it is clear that they exist in significant numbers below Grade 8.The average level of enrolments suggests that this is an expensive option,since cohort sizes average less than 20 in the type of schools that havethese secondary enrolments. It is therefore a source of significant costinefficiency, especially if most pupils do not make the transition to ‘O’level and complete the secondary grades successfully.
The average cohort size across the sample schools at primary level(Grades 1-5) drops from 45 at primary in Type 1AB schools to only 12in Type 3 schools. For this to be consistent with pupil/teacher ratios, itmust be the case that multi-grade teaching is significant in Type 2 and 3schools or that classes are left without teachers during teaching time.Type 2 schools have low cohort sizes up to Grade 11. Type 1C schoolshave small average enrolments in ‘A’ level classes.
Repetition is a significant feature of enrolment flows. Table 7.8shows the incidence of repetition in the sample.
Table 7.8 Repetition rates by school type and grade (%), 1997
GradeSchool type 1 5 5 6 10 11 6-11 12 13 13
average average average
1AB 1.5 3.3 2.6 2.2 1.0 31.2 9.1 0.4 36.6 21.11C 2.8 2.4 3.3 2.7 0.8 35.3 9.1 0.0 26.7 13.72 4.7 5.0 5.9 3.7 1.4 33.8 7.9 0.0 27.8 16.73 8.2 6.1 8.0 4.0 0.0 4.1

International Institute for Educational Planning http://www.unesco.org/iiep
Repetition averages between 2.6 per cent in Type 1AB schoolsand as much as 8 per cent in Type 3 schools in primary grades. Atsecondary level, repetition reduces until Grade 11, where it reachesaround 35 per cent. Repetition in Grade 13 reaches similar levels. FromTable 7.8 it is clear that repetition is a substantial source of internalinefficiency at primary in Type 2 and 3 schools, but is much less of aproblem at secondary level, except at public examination points.Repetition at Grades 11 and 13 adds substantial numbers to totalenrolment.
Drop-out rates are thought to average about 4 per cent acrossgovernment schools up to Grade 9. Available data suggest that theyaverage about 1.6 per cent at primary and 6 per cent between Grades 6and 10. Rates of drop-out are highest in the Northern Provinces. It hasbeen estimated that in most of the country 95 per cent of those enrolledin Grade 1 reach Grade 5. No reliable data exist of drop-out thatadequately controls for school transfer and could provide a moredetailed picture of where drop-out rates were highest.
3. Financing of education
Public educational expenditure in Sri Lanka has fluctuated overthe past 15 years within a fairly narrow range. The proportion of GDPand the share of total government expenditure is as shown below. As aproportion of GDP the amounts have fluctuated around 3 per cent; as aproportion of government expenditure the amounts appear to have beenincreasing to around 10 per cent by 1995. Some of the fluctuations relateto the volume of external assistance, which in some periods hascontributed significantly to total government expenditure. Whenspending per pupil is computed at constant prices, it becomes clear thatreal growth in educational investment per pupil has been modest andappears to have been about 30 per cent since 1980 (ADB, 1997).Chart 7.1 shows this.
174
Financing secondary education in developing countries

International Institute for Educational Planning http://www.unesco.org/iiep
Chart 7.1 Expenditure on education as a percentage of GDP and oftotal government expenditure, 1980-1995
Source: Staff appraisal report for a teacher education and teacher deployment project: DemocraticSocialist Republic of Sri Lanka. 1996. Population and Human Resources Division, South AsiaRegion, World Bank, Washington D.C.
Currently it is estimated that about 47 per cent of total educationalexpenditure is on schools, somewhat less than 4 per cent on teachertraining, and about 8.5 per cent on the examination board. The rest isallocated to higher education and administration. Within the total forschools, between 75 per cent and 85 per cent of total expenditure isallocated to salaries, the lower range being found in Type 1AB schoolsand the higher in Type 3 (ADB, 1997).
Historically, Sri Lanka allocated small proportions of educationalexpenditure to higher education. Typically, these have been between0.45 per cent and 0.60 per cent of GNP and between 16 and 21 per centof total public expenditure on education from 1980 to 1993. Allocationsto the University Grants Commission, which funds higher education,have been increasing since then. About 94 per cent of all highereducation costs are publicly funded, with less than 3 per cent recoveredfrom fees from students. The underlying point here is that highereducation has only recently been absorbing more than about 20 per centof total public education expenditure, leaving most investment at schoollevel.
0
2
4
6
8
10
12
1980 1982 1984 1986 1988 1990 1991 1992 1992 1994 1995
Year
Perc
enta
ge
Education as a % of GDP Education as a % of govt expenditure
175
Financing secondary schools in Sri Lanka:high participation and low costs

International Institute for Educational Planning http://www.unesco.org/iiep
The school system is financed from several sources. The mainprovision of funds is from central government through the line ministriesand the Finance Commission. Together these account for the bulk of allspending. Provincial governments have access to additional funds overand above those they administer from central government to payteachers’ salaries, etc. However, five of the eight provinces allocate noadditional sums for education. The allocations of the remainingprovinces vary erratically (ADB, 1997).
In most schools, over 90 per cent of school income is governmentfinanced. In Type 2 and 3 schools the amounts exceed 97 per cent,making the school system fully financed publicly in terms of schoolexpenditures. Household expenditure on education, which is in additionto public expenditure, can be derived from the 1991 Income andExpenditure Survey. From this it appears that household expenditure iscomparable to the average per-pupil cost. Within this expenditure thelargest amounts are associated with uniforms (38 per cent), stationery(18 per cent) and private tuition (14 per cent). These averages concealthe fact that some households will have much higher outlays. Theuniform and stationery costs are additional to the public subsidy costs.
External assistance accounted for about 30 per cent of expenditureon education under the Public Investment Programme between 1990 and1994. The bulk of this was development expenditure for capital worksand equipment. Recent large projects include Vocational Training(World Bank), General Education 1 and 2 (World Bank), TeacherEducation and Teacher Development (World Bank), SecondaryEducation Development Project (ADB), Teacher Education (GTZ),Distance Education (Sida), Primary Education Planning Project (DFID),Teacher Training Facilities (JICA), Teacher In-Service (UNICEF). Sidahas also funded the Primary School Development Project and thePlantation Sector Education Development Programme.
Additional contributions are made to school budgets by facilitiesfees levied on pupils according to guidelines which allow discretion inpayment for those unable to pay. The nominal facilities fees are around7 Rps for primary and 14 Rps for secondary in Type 1AB schools andless in the other types of school. The amounts actually collected perpupil in different types of school are shown in Table 7.9. This analysiswas conducted on the collection of facilities fees based on 1997 datafrom schools selected from the national database to represent the mainschool types.
176
Financing secondary education in developing countries

International Institute for Educational Planning http://www.unesco.org/iiep
Financing secondary schools in Sri Lanka:high participation and low costs
177
Table 7.9 Facilities fees – income per pupil, Rps, 1997
School Average Average Amount Amount School type nominal fee nominal fee collected at collected at Development
primary secondary primary/pupil secondary/ Fund pupil Income/pupil
1AB 7.4 13.7 16.5 36.4 158.31C 4.6 6.0 7.9 8.8 24.32 3.3 3.8 4.8 4.6 5.03 1.9 0.6 3.1 2.4 3.0
School type Teachers’ Books Sports Stationery Repairs Tests Othersalaries items
1AB 2.42 4.07 12.8 2.17 2.68 2.37 10.55
1C 0.74 0.67 0.65 0.54 0.28 1.31 3.26
2 0.13 0.26 0.16 0.12 0.10 0.30 0.60
3 0.06 0.06 0.07 0.05 0.02 0.13 0.17
Type 2 and 3 schools therefore collect far less than type 1ABschools by a factor of 4 at primary level and 9 at secondary. Moreover,though facilities fees are collected in most Type 1AB schools, 44 percent of Type 2 and 72 per cent of Type 3 schools appear to collect noneat all. Estimates suggest that only about 20 per cent of primary andsecondary schools levy fees in excess of 20 Rps per annum. Schooldevelopment societies and parent-teacher associations make substantialcontributions in Type 1 schools. They collect about 160, 25, 5, 3 Rps perchild on average in Types 1AB, 1C, 2 and 3 schools respectively. Inaddition to the above, old students associations contribute about 16 Rpsper child in Type 1AB schools and little or nothing in other schools.Overall, fees and contributions account for about 5 per cent of totalschool income.
The largest amounts of school-fund expenditures are allocated tosports and books in Type 1AB schools (Table 7.10). Testing seems toabsorb disproportionate amounts of expenditures in other school types.Many Type 2 and 3 schools spend nothing in several of the categories,notably maintenance. Some teachers’ salaries are subsidized from schoolexpenditure, but these are additional teachers mostly in Type 1ABschools.
Table 7.10 Expenditure from school funds per pupil, Rps, 1997

International Institute for Educational Planning http://www.unesco.org/iiep
There is evidence that demand for high-quality schooling in SriLanka is strong and that households are willing to pay for participation.This demand is greatest amongst high-income households with educatedparents. However, it is argued that attempts to substitute householdexpenditure for government expenditure through increasing fees orreducing subsidies will be detrimental to household welfare in general,since they will have the greatest impact on the poor. The only viableoption would be systems targeted on households above a certain incomethreshold and this might prove difficult to administer (Aturupane, 1997).
4. Costs per teacher and per pupil
The sample data allow comparisons to be made on costs betweenprimary and secondary levels, with some constraints. Since most of thepublic costs in schools are in teachers’ salaries, only these costs areconsidered below. The schools in the sample either have only primarygrades or have both primary and secondary. A very small number onlyhave secondary grades and are not large enough as a group to treatseparately. Salary costs between primary and secondary grades areapportioned by the number of teaching periods teachers claim to teach atdifferent levels in school census returns. There is no other method ofestimating this in the data currently available.
The average annual salary costs per teacher in different types ofschools appear to be as shown in Table 7.11.
Table 7.11 Average salary costs per teacher by school type, Rps, 1997
178
Financing secondary education in developing countries
School type Average primary Average secondary Overall average teacher’s salary teacher’s salary teacher’s salary
1AB 58,070 64,660 63,2601C 52,860 58,260 56,5702 49,980 54,580 52,8603 50,800 53,620 51,360
This table shows that average salary costs per teacher vary byabout 16 per cent at primary and 21 per cent at secondary by school type.Type 1AB schools are more costly in average salaries per teacher thanType 2 and 3 schools. The underlying reason is that, as noted above,teachers are paid on the basis of qualification rather than the level atwhich they teach. Graduate teachers are paid more than those withcertificates and diplomas and are found teaching mainly in the secondary

International Institute for Educational Planning http://www.unesco.org/iiep
grades in Type 1 and 2 schools. Difficult posting allowances have beenpaid to teachers in rural and remote schools which are disproportionatelyType 3 and would have increased their salary costs by 10-15 per cent.Teachers in Type 1 schools are more senior, since these schools tend tobe more desirable postings and teacher turnover is likely to be lower thanin Type 3 schools, which almost certainly have younger teachers.
It is possible to separate out those schools in the data set whichonly have primary grades from those with significant numbers ofsecondary pupils (100 or more) to estimate salary costs in separateprimary schools. All these schools are Type 3 schools. When this is donethe average cost of primary teachers’ salaries is 52,950 Rps. There are 20schools in the sample which only have secondary enrolments fromGrade 6. All are Types 1 or 2. In these schools, teachers’ salary costsaverage 62,800 Rps/teacher. The small difference in average salary costsbetween primary and secondary is striking.
Salary costs per teacher in all schools with secondary enrolmentvary by school size, as shown in Table 7.12. Perhaps surprisingly, thelarger the enrolment in secondary grades the greater is the average salarycost at this level. This is also true for average primary teachers’ salaries.As noted above, larger schools (which tend to be Type 1) are much moreattractive postings for teachers, tend to have fewer unfilled vacancies,and retain teachers who have higher qualifications and acquire moreseniority. This is the probable explanation why average salary costs arehigher in larger schools.
Table 7.12 Average salary costs per teacher by school size andpupil/teacher ratios for all schools with secondaryenrolment, Rps, 1997
179
Financing secondary schools in Sri Lanka:high participation and low costs
Enrolments Average primary Average secondary Overall averageat secondary teacher’s salary teacher’s salary teacher’s salary
All schools 51,010 56,870 50,100
Less than 100 47,180 54,640 45,970
101-500 50,650 55,570 49,420
501-1000 55,930 60,970 55,500
More than 1000 57,300 63,720 56,900

International Institute for Educational Planning http://www.unesco.org/iiep
These patterns of relatively small cost variations in averagesalaries per teacher can be contrasted with those for salary costs ofteachers per pupil (Table 7.13). In all schools, teachers’ salary costsrepresent the great majority of public costs per pupil. They are thereforea good proxy for overall public unit costs.
Table 7.13 Average salary costs per pupil per year by type of school,Rps, 1997
180
Financing secondary education in developing countries
Enrolments Average Average Overall Pupil/teacher Pupil/teacher Overallat secondary salary costs salary costs average salary ratios at ratios at pupil/teacher
per pupil per pupilprimary secondary costs per pupil primary secondary ratios
All schools 2,270 3,660 2,950 29 20 23Less than 100 3,220 5,110 3,770 21 15 20101-500 2,040 3,220 2,700 31 20 23501-1000 1,630 2,990 2,540 37 23 27More than 1000 1,500 3,060 2,650 32 22 25
School type Salary costs Salary costs Overall salaryper pupil primary per pupil secondary costs per pupil
1AB 1,730 3,510 3,030
1C 1,820 3,370 2,710
2 2,390 3,630 2,950
3 3,350 3,350
Salary costs per pupil are greatest in Type 2 and 3 schools atprimary. At secondary, the pattern is not simple, though Type 2 schoolshave the highest costs (in principle Type 3 schools have no secondarypupils). The average pupil/teacher ratios across different types of schoolsat primary level vary from 34 (Type 1AB) to 23 (Type 3) (Table 7.5). Atsecondary level, the average pupil/teacher ratio is constant betweenschool types at about 20:1. The dispersion of values around the mean issignificantly larger for Type 2 and 3 schools than for Type 1 (Table 7.6).
When salary costs per pupil are examined by the size of secondaryenrolments, the results (Table 7.14) show that, as expected, schools withsmaller enrolments are generally the most expensive. This is consistentwith their lower pupil/teacher ratios.
Table 7.14 Average salary costs per pupil by school size for schools with secondary enrolments, Rps, 1997

International Institute for Educational Planning http://www.unesco.org/iiep
Chart 7.2 shows how costs decline with secondary enrolment(excluding extreme outlying cases) in Type 1AB and C schools. Chart7.3 shows the same for Type 2 schools.
Chart 7.2 Salary costs per secondary pupil by enrolment at secondary Type 1 schools, 1997
Chart 7.3 Salary costs per pupil by secondary enrolment at Type 2schools, 1997
0
3,000
6,000
9,000
12,000
0 100 200 300 400 500 600 700 800
Secondary enrolments
Sala
ry c
osts
per
sec
onda
ry p
upil
0
2,000
4,000
6,000
8,000
0 200 400 600 800 1,000 1,200 1,400 1,600 1,800 2,000
Secondary enrolments
Sala
ry c
osts
per
sec
onda
ry p
upil
181
Financing secondary schools in Sri Lanka:high participation and low costs

International Institute for Educational Planning http://www.unesco.org/iiep
Chart 7.2 shows that in Type 1 schools salary costs per secondarypupil stabilize above an enrolment of about 500. Above this level,reductions in average cost are very gradual. Chart 7.3 shows that in Type2 schools the enrolment level above which salary costs stablize is about400.
Chart 7.4 shows a similar exercise for primary schools using dataon schools with only primary grades and no secondary enrolments(excluding outliers). Primary schools with enrolments of more thanabout 150 have salary costs per pupil which can average around2,000 Rps. Above this size, cost per pupil falls very slowly.
Chart 7.4 Salary costs per primary pupil schools with only primaryby enrolment, 1997
None of these analyses take into account non-salary costs. Inprimary schools these are less than 5 per cent of the total recurrent costand in secondary less than 10 per cent. Including these would thereforenot dramatically alter the picture. The position may look different inrelation to capital costs, but it is beyond the scope of this analysis toexplore these. Capital costs are in any case amortized over a long period– the lifetime of buildings – so their impact on an annual basis should besmall.
The problems associated with small schools are long standing.They arise as a result of the history of the growth of the school system,variations in the density of the population, and in some cases the
0
3,000
6,000
9,000
12,000
0 50 100 150 200 250 300
Enrolment
Sala
ry c
ost p
er p
rim
ary
pupi
l
182
Financing secondary education in developing countries

International Institute for Educational Planning http://www.unesco.org/iiep
decision to maintain two language streams. Nationally, the proportion ofall schools with less than 50, 100 and 200 pupils was 9 per cent, 13 percent and 20 per cent respectively in 1991. At secondary level, 25 per centof schools have less than 100 secondary pupils and 22 per cent less than200 (Ministry of Education and Higher Education, 1992). In the sampleof schools analyzed, fully 32 per cent of the schools with primary haveenrolments below 100 and a further 27 per cent below 200. AmongstType 3 schools 75 per cent have less than 100 pupils.
It is clear that there are compelling reasons for the continuation ofsome small schools located in low population-density areas. However, itseems implausible that this is the case for all the small schools identified.Salary costs per pupil in primary schools with enrolments below 100 aredouble those in larger schools (Table 7.15). Where secondary enrolmentsare less than 100, salary costs are about 70 per cent greater than inaverage-sized secondary schools.
Appropriate school mapping is needed to identify where averageschool size might be increased without an adverse effect on access andquality. If half of the small schools could be merged or consolidated withothers without incurring substantial additional costs, substantialrecurrent savings could be released. Some of the savings could beallocated to improved conditions for teachers (e.g. subsidized housing)and greater investment in learning resources. Alternatively, morewidespread use of multi-grade teaching could bring down the salarycosts of small schools to nearer average cost levels.
5. Performance, enrolments and pupil/teacher ratios
The school data can also be analyzed in terms of pass rates at ‘O’and ‘A’ level. In this analysis, school types were kept separate and thesimple indicator of ‘O’ and ‘A’ level pass rates was plotted againstsecondary enrolments and the pupil/teacher ratio. The analysis indicatedthat there was no direct association of secondary enrolments with ‘O’and ‘A’ level pass rates, except in Type 1AB schools at ‘O’ level. In these,larger schools do seem to have higher pass rates (see Chart 7.5).
Type 1AB schools are selective. Characteristically they teachscience to ‘A’ level, and have more qualified staff than other schools.Their overall pass rates at ‘O’ level are high and average 43 per cent.Type 1C schools are less selective and average 23 per cent pass rates.Type 2 schools average only 21 per cent pass rate at ‘O’ level. At theselower pass rates, it is clear that small schools with enrolments at
183
Financing secondary schools in Sri Lanka:high participation and low costs

International Institute for Educational Planning http://www.unesco.org/iiep
secondary (Grades 6-11) of less than 300 can achieve pass rates of over30 per cent, as do some small Type 2 schools with enrolments of lessthan 200.
Chart 7.5 ‘O’ level pass rate by secondary enrolments Type 1AB,1997
At ‘A’ level, 53 per cent of ‘A’ level pupils pass in Type 1ABschools and 66 per cent in Type 1C. Since Type 1C schools are lessselective, this result may seem surprising. It arises partly because thereare many more Type 1C schools with small ‘A’ level enrolments (average57 students in Type 1C versus 281 students in Type 1AB). It is likely thatonly those with the best chance of passing are entered into the Type 1Cschools. It may be that pass rates in non-science subjects, in which Type1C schools specialize, are also higher. In both cases, high scoringschools can be found with very small ‘A’ level enrolments.
The data were processed to associate pass rates with pupil/teacherratios (PTRs) at secondary. PTRs are a reasonable proxy for costs perpupil. No clear relationships were apparent. Some Type 1AB schoolswith PTRs between about 17:1 and 35:1 achieved ‘O’ level pass ratesgreater than 50 per cent. In Type 1C schools, the range was from about15:1 to 30:1 for schools scoring more than 30 per cent pass. In Type 2schools, similar pass rates were achieved in schools with PTRs below 10and up to 30. At ‘A’ level a similar lack of association appeared, withPTRs in type 1AB schools mostly falling between 20:1 and 35:1 and, inType 1C, between 10:1 and 30:1.
0
30
60
90
120
200 400 600 800 1,000 1,200 1,400 1,600 1,800 2,000
Secondary enrolments
‘O’
leve
l pas
s ra
te
184
Financing secondary education in developing countries

International Institute for Educational Planning http://www.unesco.org/iiep
These results do not eliminate the possibility of relationshipsbetween achievement, enrolments and PTRs. With the data available it isnot possible to analyze this further in ways that would control for themost obvious possible confounding factors. However, it is clear thatlarge enrolments and higher PTRs do not preclude relatively high passrates within each type of school.
6. Some demographic considerations
Enrolment growth in Sri Lanka depends on the underlying rate ofpopulation growth, since enrolment ratios are high in primary andsecondary schools. Any projections of future costs must take these intoaccount. Unlike many African countries, the size of the school-age groupin Sri Lanka is shrinking, since a demographic transition to low growthhas been happening since the 1970s.
The present population of Sri Lanka is 18.1 million. The numberof 0-14 year-olds was projected to grow by 1.2 per cent until the year2000. Longer-term estimates show a decline in the number of 10-15 year-olds. The size of the school-age group is therefore beginning toshrink. This will reduce the demand for primary and secondary schoolplaces. Though drop-out rates may fall, slowing the decline inenrolments, they are currently at fairly low levels.
A recent projection (Aturupane and Abeygunewardena, 1997) illus-trates the likely effects on enrolments at different grade levels (Table 7.15).
Table 7.15 Projected enrolments by Grade, 1996-2000, and annualgrowth rates
185
Financing secondary schools in Sri Lanka:high participation and low costs
Year 1996 2000 2005 Growth Growth1996-2000 2000-2005Annual % Annual %
Grade
1 350,182 331,659 309,880 –1.06 –1.09
5 365,371 333,906 311,906 –1.72 –1.10
Sub-total 1-5 1,818,433 1,701,727 1,589,882 –1.28 –1.10
6 368,120 322,883 301,180 –2.46 –1.12
11 434,535 447,021 384,345 0.57 –2.34
Sub-total 6-11 2,103,775 1,930,421 1,730,742 –1.65 –1.72
Sub-total 12-13 226,621 238,417 250,648 1.04 0.86
Grand total 4,148,826 3,870,566 3,571,273 –1.34 –1.29
Source: Aturupane and Abeygunewardena, 1997.

International Institute for Educational Planning http://www.unesco.org/iiep
Table 7.16 shows primary enrolments shrinking by 230,000 overa ten-year period (13 per cent) and those at secondary (Grades 6-11) by370,000 or over 20 per cent. It is only at Grades 12 and 13 that someenrolment growth is anticipated. This is projected as an increase of24,000 (11 per cent). Thus, overall, the education system is likely to loseabout 576,000 places out of a 1996 total of 4.1 million (14 per cent). Theopportunities this creates are clear, since they will be reflected either inoverall cost saving or, preferably, in increased unit costs directedtowards improving retention and school quality. Most of the benefit willbe experienced at secondary level in Grades 6-11.
7. Changes in the budgeting system
In common with many other countries, the basis for fundingschools in the past has relied largely on historic budgeting, withincremental growth reflecting the availability of funds and the short-termpolitical priorities. This system was not sensitive to changing patterns ofdemand and tended to reinforce historic inequities between provinces,districts and schools. The advent of provincial devolution added a furtherstress to historic allocation patterns, since it encouraged the developmentof a more rational basis for the allocation of funds, which recognized theneed for more efficiency and equity.
It is suggested that Sri Lanka should move towards a norm-basedsystem of funding, which would reduce the variance in unit costsbetween schools and maintain differences by school type, which couldbe defended with reference to their different enrolment patterns (ADB,1997; World Bank, 1997, Component 7:1). The system which is beingdeveloped is therefore formula based and depends on enrolments. Majorcategories of expenditure are identified and associated with enrolment togenerate an overall unit cost which could provide the fundamental basisfor the allocation of recurrent funds. Thus:
Unit costs = (T+NT+Li+La+Ad+M+TX+U+Sc+Sp+Ma+Mi)/Ewhere:T = Teachers’ salaries NT = Non-teaching salariesLi = Libraries La = LaboratoriesAd = Admin. salaries M = Teaching and learning materialsTX = Cost of textbooks U = Cost of uniform subsidiesSc = Scholarships Sp = SportsMa = Maintenance Mi = Miscellaneous.E = Enrolments
186
Financing secondary education in developing countries

International Institute for Educational Planning http://www.unesco.org/iiep
Funding grants would then be based on the unit cost multiplied bythe enrolment. Norms could be established for different types of schooland different types of expenditure. Thus, one possible version of thisapproach currently projected would allocate funding based on 13 Rps/pupilfor administrative support, 228 Rps/pupil for supervision services, and37 Rps/pupil for teacher education in primary and secondary schools. Itwould allocate different amounts for textbooks at primary and secondary(76 Rps/211 Rps), uniforms (93 Rps/138 Rps) and learning materials(100 Rps/200 Rps), reflecting the different needs for these. The normscould be tuned to reflect judgements of what is required.
Systems of this kind have to be sensitive to the realities of currentpatterns of distribution of costs between schools. Teachers’ salaries haveto be paid in the short term, even if the distribution of teachers exceedsnorms established for pupil/teacher ratios. Overall, however, this kind ofsystem represents a considerable improvement on historic budgeting,since it is in principle more equitable and should encourage a moreefficient distribution of expenditure if coupled with action to reducedisparities in pupil/teacher ratios, etc. It does need to be coupled tosafeguards that ensure that small schools with diseconomies of scale arenot underfunded. It remains to be seen to what extent these procedureswill be operationalized.
8. Proposed reforms
Sri Lanka is in the process of transforming the long-standingsystem of school organization, with its many varieties of schoolscovering different grade ranges into a more conventional pattern withonly two types of school. These are intended to be Grade 1-9 JuniorSchools and Grade 10-13 Senior Schools. This process is accompanyingthe introduction of norm-based financial allocations. It is not yet clearwhat the financial implications of school reorganization are likely to beor what problems will be encountered in implementing these reforms.Some observations seem appropriate.
First, it ought to be the case that costs per pupil in Junior Schoolsshould approximate those in existing Grade 1-5 and Grade 1-8 schools.If, as a result of rationalization of small teaching groups in Grades 6-8,high pupil/teacher ratios in some schools are reduced, then costs shouldfall and efficiency increase. There is a risk that extending some Type 3schools up to Grade 9 will increase costs if small entry cohorts aresimply continued to higher grades without the use of multi-grade
187
Financing secondary schools in Sri Lanka:high participation and low costs

International Institute for Educational Planning http://www.unesco.org/iiep
teaching groups. It should be remembered that average intakes in theseschools are no more than 12 at primary and 15-20 at secondary.
Second, it remains unclear how the transition from junior to seniorschool will be managed. Grade 9 is not a formal selection point in thecurrent system. It has been suggested that junior school certificates willbe available to those who leave school at the end of this cycle, but thatpupils will retain the right to continue in senior secondary to ‘O’ level(Grade 11). The possible impact of this on increased repetition in Grade9 (to acquire better grades of certificates) and on transition rates into ‘O’level is uncharted.
Third, senior secondary schools will have smaller enrolments thanschools with senior secondary classes under the existing system, if thesame number of schools remain, since they will only contain fourgrades. ‘A’ level enrolments in Type 1 schools in the sample average 283in Type 1AB, and 30 in Type 1C, with an overall average of 126. In theseschools, Grade 9 and 10 enrolments average 366 and 162. Thus, thoughmany Type 1AB schools have existing enrolments large enough to createviable senior secondary schools with enrolments above 600, Type ICschools do not. They would need to acquire large numbers of pupils fromformer Type 2 schools to achieve viability. In the sample, which is notfully representative of all schools, redistributing all the secondary pupilsin Type 2 schools to Type 1 schools would provide an additional70 pupils per school. There are 64,500 pupils in the sample in Grades 10-13 enrolled in about 330 schools, which include 56 Type 1AB and 90Type 1C schools. If the average size of a senior secondary school wereto be 1,200, only about 50 such schools would be needed for currentenrolments compared to the 146 in the sample. It is unclear whether theimplications of the reduction in geographical access that this mightrepresent have been adequately considered. In the absence of a detailedplan it is also unknown what the cost implications will be.
9. Some projections
The education system in Sri Lanka has been modelled using anenrolment-driven simulation to chart the behaviour of costs underdifferent scenarios. The starting point here is to assume that keyparameters remain as they are currently configured. Specifically, initialenrolments, repetition, promotion and drop-out rates by grade have beenset at the best estimates available. So also have pupil/teacher ratios andoverall unit costs. The model does not attempt to treat school types
188
Financing secondary education in developing countries

International Institute for Educational Planning http://www.unesco.org/iiep
separately. To do so would introduce a high level of complexity againsta backdrop of policy which seeks to change the existing pattern of schoolorganization. It is therefore only practicable to generate an aggregatepicture, without entering into a major exercise which captures policyambitions which are yet to be detailed.
With this in mind the simulation has been run to establish howcosts may change over the next 20 years, assuming current demographicprojections remain valid. The first results show how the total costs ofprimary (Grade 1-5) and secondary (Grades 6-13) are likely to change inrelation to base-year costs. They also project the demand for newteachers in relation to a baseline which includes those who are untrained.Charts 7.6 and 7.7 show this.
Chart 7.6 Recurrent costs for primary and secondary as proportionof total base-year costs, 1996-2010
0
0.2
0.4
0.6
0.8
1
1996 1998 2000 2002 2004 2006 2008 2010
Year
Rec
urre
nt c
ost a
s pr
opor
tion
of b
ase
year
Primary recurrent Secondary recurrent Total recurrent costs
189
Financing secondary schools in Sri Lanka:high participation and low costs

International Institute for Educational Planning http://www.unesco.org/iiep
Chart 7.7 Demand for new teachers, 1996-2010
Total enrolments are projected to decline to below 3.5 millionfrom their current level of 4.2 million. Secondary enrolments will remaingreater in total than primary. The recurrent costs decline in sequencewith enrolments, since all key parameters are held constant in thebaseline model. Secondary takes about 66 per cent of the total recurrentcost of the school system and primary 33 per cent. Thus, unlike somecountries at an earlier stage in enrolment growth, Sri Lanka continues toinvest more in secondary than primary and maintain larger totalenrolments in secondary grades. Total recurrent costs fall by about 15per cent over the 15-year projection in real terms. The demand for newteachers in the baseline model peaks in the first three years and then fallsas enrolments decline, reflecting the contraction in the cohort. Thenumber of new secondary teachers needed is between three and fourtimes the number of primary teachers (not accounting for upgrading).
This projection does not include the short-term costs of upgradingthe existing cadres of untrained teachers. The upgrading of theseteachers is the subject of a current donor-financed project. Thisupgrading should be a one-off cost (World Bank, 1996). It is thereforenot included in these recurrent projections.
The assumptions of the model were changed such that repetitionand drop-out are halved through Grades 1-11 and all pupils are promotedfrom primary Grade 5 to secondary Grade 6. These changes are
0
1,000
2,000
3,000
4,000
5,000
6,000
7,000
1996 1998 2000 2002 2004 2006 2008 2010
Year
New primary teachers New secondary teachers Total number of new teachers
Num
ber
of n
ew te
ache
rs
190
Financing secondary education in developing countries

International Institute for Educational Planning http://www.unesco.org/iiep
consistent with government policy to increase internal efficiency andretention through organizational reform and quality improvementprogrammes. In this simulation, enrolments fall at about the same rate asin the first simulation. Reduced drop-out is compensated for by theincreased rate of flow associated with less repetition and higherpromotion rates. Recurrent costs continue to fall, but are only marginallyless than in the baseline model. Teacher demand is initially greater, butfalls slowly to levels similar to the baseline simulation over 10 years.
Finally, the model was used to simulate a 10 per cent increase inpupil/teacher ratios (through rationalization of small schools andexcessively low pupil/teacher ratios in other schools), a 16 per cent realincrease in teachers’ salaries, and an increase in expenditure on teachingmaterials of 95 per cent over the 15-year period. The result is shown inCharts 7.8 and 7.9. Enrolments remain unchanged. Recurrent costs atthe end of the plan period remain below existing levels at about 95 percent of baseline costs and teacher demand falls significantly as a resultof reduced pupil/teacher ratios.
Chart 7.8 Recurrent costs for primary and secondary as proportionof total base-year costs, 1996-2010
0
0,2
0,4
0,6
0,8
1
1996 1998 2000 2002 2004 2006 2008 2010
Year
Rec
urre
nt c
ost a
s pr
opor
tion
of b
ase
year
Primary recurrent Secondary recurrent Total recurrent costs
191
Financing secondary schools in Sri Lanka:high participation and low costs

International Institute for Educational Planning http://www.unesco.org/iiep
Chart 7.9 Demand for new teachers, 1996-2010
This last simulation suggests that considerable improvements inquality-related indicators (pupil/teacher ratio, teachers’ salaries,increased learning materials) may be available at close to existingrecurrent cost levels. If the education budget increases in real terms as aresult of real increases in GDP, the scope to increase per-pupilexpenditure in ways which would improve quality and result in higherlevels of achievement is even greater.
The resources available to the school system will depend in parton whether the planned expansion of enrolment rates in higher educationis allowed to absorb disproportionate amounts of public expenditure oneducation, as is planned. If higher education is not a disproportionatebeneficiary of funds, then there is considerable scope to increaseexpenditure per pupil at school level.
Thus, it will remain the case that secondary schools absorb thelarger part of school-level expenditure on education and the proportionallocated is likely to rise to about 70 per cent of all recurrent expenditureon schools. This is a consequence of the larger grade span of secondary(6-13 as opposed to 1-5 for primary), and the high enrolment ratesthrough to Grade 11. It is not primarily the result of high unit-cost ratiosbetween primary and secondary, since in Sri Lanka these are relativelylow. Most significant for the affordability of the secondary schoolsystem with near universal enrolment levels at least to Grade 9, is thedecline in the size of the age cohort as a result of demographic transition.
0
1,000
2,000
3,000
4,000
5,000
6,000
1996 1998 2000 2002 2004 2006 2008 2010
Year
Num
ber
of n
ew te
ache
rs
New primary teachers New secondary teachers Total number of new teachers
192
Financing secondary education in developing countries
International Institute for Educational Planning http://www.unesco.org/iiep
10. Some emerging issues
There are several issues that this analysis identifies as problematic.First, the majority of secondary pupils in Sri Lanka are taught in
schools which have both primary and secondary grades with someoverlap of teaching between the two. This should mean that secondaryunit costs are lower than they would be if primary and secondary schoolswere separated. In principle, it allows shared use of facilities andteachers and should result in more viable teaching group sizes. Problemsarise related to small school size and to enrolment in secondary gradesin Type 3 schools. The analysis shows that small primary and secondaryenrolments are costly and that they have a surprisingly high incidence.Consolidation into larger schools and/or more use of multi-gradeteaching could result in considerable cost savings and opportunities toinvest in quality improvements, accepting that this is not possible inrelation to all small schools.
Second, the analysis has not probed non-salary expenditure atschool level. This is partly because it is of relatively small magnitude.The secondary data that exist draw attention to the fact that about 75 percent of non-salary public expenditure is allocated to uniform subsidiesand textbooks, with a further 10 per cent to sports equipment andactivities. On average, between 5 and 10 per cent is spent on learningmaterials and library resources. The existence of a common curriculum,along with an effective national textbook subsidy scheme, reduces thecosts of providing learning material and simplifies its production anddistribution. This means that, despite the low levels of non-salaryrecurrent expenditure, basic textbooks, etc., are available in mostschools. However, only 11 per cent of schools have libraries housed inpermanent buildings. It is widely recognised that expenditure forlearning materials is inadequate to meet needs at both primary andsecondary level.
Some schools ameliorate deficiencies in the non-salary budget byusing income from facilities fees and from school development societyactivities and contributions. The amounts raised per pupil are modest inmost schools and in a substantial number of schools no money is raised.The tradition of free education is generally thought to preclude theoption of significant increases in facilities fees, which are in any caselevied on a discretionary basis. To make a significant difference toschool income they would in any case have to be raised to levels likelyto be politically intolerable. The possible exception to this is at the upperend of the secondary school and at ‘A’ level, where book subsidies are
193
Financing secondary schools in Sri Lanka:high participation and low costs

International Institute for Educational Planning http://www.unesco.org/iiep
already restricted to basic texts, where demand for schooling is strong,as evidenced by high rates of repetition, and where expenditure onprivate tuition is known to be substantial. The latter, therefore, providesevidence of disposable income available to support educational costs.
Third, repetition in primary grades and at public examinationpoints remains a source of internal inefficiency and increases total costs.The relationship between repetition and drop-out has not been clearlyestablished and is very complex to analyze since school transfers arecommon. It seems likely that early repetition is associated with laterdrop-out. If primary repetition could be decreased, especially in Type 3schools, significant resources would be released. High rates of repetitionaround public examinations is probably inevitable, but can be controlledby limiting the number of resits and/or age of candidates allowed to resitat public cost.
Fourth, this paper has not dwelt on distributional questions. Theseare important to consider at two levels: (a) the range of variation in keyschool parameters, e.g. the pupil/teacher ratio, is wide. In the sample,PTRs range from 3 to 140 in Type 2 and 3 schools, suggesting that thereis substantial scope to improve very low ratios and a priority to reduceexcessively high ones. Depending on how this is achieved it might bepossible to reduce unit costs whilst improving the quality of provision;(b) the distribution of investment in resources at school level may beproblematic. Class sizes in higher grades tend to be smaller and it islikely that disproportionate amounts of school expenditure are directedtowards the needs of children in higher grades. If so, this maydisadvantage both primary and lower-secondary pupils.
Conclusion
The purpose of this analysis was to profile the Sri Lanka schoolsystem and its financing in ways which would draw attention to the specialfeatures that have made it possible to achieve and sustain high levels ofparticipation at secondary-school level. The data highlight severalcharacteristics which are significant. These include the low levels of costsper pupil relative to GDP; the small ratio of teacher salary costs betweenschools and between primary and secondary levels; the focus on investmentin schools rather than higher education; and the benefits of demographictransition. It is useful to summarize aspects of each of these in turn.
First, the costs per pupil of providing primary and secondaryeducation in Sri Lanka are low relative to GDP per capita. Analysis of
194
Financing secondary education in developing countries

International Institute for Educational Planning http://www.unesco.org/iiep
the available data suggests that overall costs per pupil range from 0.09per cent of GDP per capita in Type 3 schools to 0.05 per cent of GDP percapita in Type 1 schools. Teachers’ salary costs per pupil in the sampleschools are about 0.06 per cent GDP per capita at primary and 0.1 percent of GDP per capita at secondary level. These levels are low by thestandards of many other developing countries. They also imply that ithas been possible to constrain the growth in teachers’ salaries to arelatively low proportion of GNP/capita over time.
Second, the ratio between primary and secondary costs per pupilis small by comparison with many other poor countries. Even when non-salary costs are taken into account, it is likely this ratio is less than 1:2.Taken together this makes high rates of secondary participationaffordable at sustainable (and relatively low) levels of educationalinvestment as a proportion of GDP and of public expenditure. Sri Lankais unusual in that the teacher cadre is not strongly differentiated intoprimary and secondary teachers. As a consequence, salary costs perteacher between primary and secondary schools do not vary widely andthis reduces the range in overall unit costs between the levels. It alsomeans that in principle teachers can be deployed more flexibly andefficiently than would be the case if they could only teach in primary orsecondary schools.
Third, higher education has not until recently begun to absorblarge proportions of public expenditure on education. This has meantthat investment could be focused on the school system as participationgrew to high levels. It may be that historically schools with secondary-level grades benefited disproportionately from this, since they havealmost certainly received greater subsidies and capital investment thanhave primary schools.
Fourth, the demographic transition to low growth has undoubtedlymeant that high enrolment rates at secondary have been more affordablethan they would otherwise be. The shrinkage in overall enrolments iscontinuing and will be greatest over the secondary grades. This shouldallow full enrolment through secondary grades without significantincreases in cost, providing repetition is reduced and measures are takento improve quality and retention.
Fifth, on balance, the unusual organization of Sri Lankan schools,where secondary grades are often integrated in one school with primarygrades, has contributed to the ability of the system to sustain highsecondary enrolment rates at affordable levels of cost.
195
Financing secondary schools in Sri Lanka:high participation and low costs

International Institute for Educational Planning http://www.unesco.org/iiep
Introduction
China formally committed itself to universalizing access to basiceducation with the announcement of the Nine Year CompulsoryEducation Law in 1986 (Lewin et al., 1994). Now, in most city areasvirtually all school-age children attend primary school and enrolmentrates at junior secondary are high. The underlying demographic trendsare such that the number of school-age children is growing slowly as aresult of the one child policy.
Since the late 1970s when China began its major economicreforms, there has been a rapid expansion in the development ofsecondary schools, both in terms of students’ enrolment and governmentfunding. The number of students studying in secondary schools has morethan doubled since 1970 at lower-secondary level, from about 23 millionto over 43 million. Because of this growth and because policy hasrecently favoured increasing the responsibilities of local governmentsfor financing secondary schools, much greater proportions of the costsof secondary schools have had to be financed from non-budget income.The range of methods is varied.
There are three main reasons why the financing of secondaryschools is becoming problematic.
First, growth in enrolment rates is now concentrated at secondarylevel. The number of new entrants to regular secondary schoolsexpanded at an annual rate of over 5 per cent between 1990 and 1995
197
Chapter VIII
Secondary school financing in China:the new economics of schooling
Keith M. Lewin with Qu Heng Chang, Zeng Xiao Dong,Wang Zhan Rei, Wu Hua and Wang Libing1
1. Keith M. Lewin wrote the Beijing case study with Qu Heng Chang, Zeng Xiao Dong,and Wang Zhan Rei and the Wenzhou case study with Wu Hua and Wang Libing. WuTing, Zheng Shaoai, and Wu Jianjun acted as researchers in Wenzhou, collecting data.

International Institute for Educational Planning http://www.unesco.org/iiep
nationally. Some categories of enrolment grew particularly fast –specialized schools by 14 per cent, technical schools 16 per cent,teacher-training institutions 6 per cent and vocational schools 9 per cent.
Second, alongside general growth in secondary enrolments,urbanization has been occurring rapidly. It seems probable that rates ofurbanization are between 5 and 10 per cent a year in China, as economicgrowth attracts workers into cities. Unlike in the past, workers are freeto move, since residence requirements have been relaxed and the flow oflabour is now largely market driven. This has the effect of increasingsecondary enrolment growth in and around cities, both because ofincreased population and because of a preference amongst rural parentsto gain access to secondary schooling in towns and cities. Many schoolsnow accept students from outside their residential catchment areas onpayment of additional fees.
Third, city schools only have a proportion of their recurrent costspaid by city and district governments. Typically, only one-half to one-third of the salary bill for secondary schools in many parts of Beijing ismet from central funds. The remainder must be financed from fund-raising activities at the school level. This is necessary to pay competitivesalaries sufficient to attract and retain teachers. It seems probable thatenrolments are growing faster than the publicly funded elements of thebudget. Economic development has proceeded at a high rate and taxrevenues have not grown as fast as incomes. Periodic bouts of inflationhave also adversely affected school financing and the value of teachers’salaries. There is therefore a growing gap between the ability to financesocial-sector expenditure and the revenue stream. The gap is currentlybeing met through increasing the proportion of off-budget incomederived from a wide range of sources.
The problems of financing schools in China are very sensitive.There are a number of reasons for this that make data collection andanalysis difficult. First, financial data are usually regarded asconfidential and subject to special restrictions on access. This isespecially so as local autonomy has begun to lead to growing differencesin income and unit costs between areas. Second, custom and practiceoften means that there are significant differences between what mayappear in accounts which are consistent with official guidelines, andactual incomes and expenditure. There may be many reasons for this thatvary from pragmatic decisions to reallocate funds to areas of greatestneed that may not be recognized in general guidelines, to subtlereinterpretation of what is and what is not permissible. Third, accounting
198
Financing secondary education in developing countries

International Institute for Educational Planning http://www.unesco.org/iiep
Secondary school financing in China:the new economics of schooling
199
systems are complex and easy to misinterpret in a system where there aremany levels of government and a long history of ad hoc reform. Fourth,data collection and aggregation vary considerably in quality andreliability, and contain many inconsistencies that are difficult to resolve.
This chapter presents two contrasting cases which illustratedevelopments which are occurring in many parts of China. Beijing waschosen for the first of the case studies. This provides an insight intochanges which have taken place in the capital city. Beijing is theadministrative centre of China and national policy on schooling israpidly translated into practice. It has many features in common withdevelopments in other major metropolitan centres in China which arelocated in rapidly growing parts of the country with high levels ofurbanization and inward migration.
The second case study was located in Wenzhou in ZhejiangProvince. Wenzhou has a reputation for a range of economic reforms thatconstitute the ‘Wenzhou Model’, which has promoted local initiativesand entrepreneurial activity. It contrasts with Beijing, in that it is a muchsmaller centre of population, has different traditions of localgovernment, and different patterns of economic activity centred ontrading and small-scale manufacturing.
The picture that emerges cannot be representative of China as awhole. No case studies could meet this ambition. Educationaldevelopment in other parts of China lags considerably behind that foundin the cities (Lewin and Wang, 1994) and conditions vary enormously.Nevertheless, over 30 per cent of the population is now urbanized and amuch larger number live around cities and are influenced by educationaldevelopments in the centres of population. The developments that havebeen taking place provide a radical point of comparison both with thepast and with educational financing in other countries.
A. Case study 1 – Beijing
The evolution of some basic indicators of schooling is shownbelow for Beijing, and for two districts where data were collected, i.e.Haidian and Shunyi. Table 8.1 shows that total enrolments in Beijing atprimary level have been falling. This is a consequence of demographictrends which have resulted in a decline in the size of the school-agepopulation. This fall is occurring in most districts including Haidian,which is a fashionable district in the north-east of the city. In Shunyi,which is north-east of the city, enrolments have been rising as industry

International Institute for Educational Planning http://www.unesco.org/iiep
develops and there is some inward migration for employment from morerural areas further from Beijing.
At secondary level, the increases in enrolments are striking – anaverage of around 8 per cent at junior secondary and 12 per cent atsenior secondary per year. As noted above, the main reasons for this aregrowth in the enrolment rate and an inward flow of students forsecondary schooling into districts of the capital city. Average school sizeis increasing at both primary and secondary in Shunyi, but only atsecondary level in Haidian.
Table 8.1 School enrolments in Beijing, 1993-1995
200
Financing secondary education in developing countries
Beijing Haidian ShunyiDistrict District
Primary Schools Enrolments Schools Enrolments Schools Enrolments1995 2,867 1,007,301 164 105,427 175 73,7731994 3,035 1,024,503 176 106,800 184 69,4011993 3,190 1,022,166 131 107,369 191 63,849
Annual growth % -0.7 -0.9 7.5Average school size
1995 351 643 4221994 338 607 3771993 320 820 334
Junior secondary1995 710 525,724 71 58,013 37 27,9691994 693 497,174 64 53,958 35 26,5761993 680 444,934 64 47,745 35 24,672
Annual growth % 8.7 10.2 6.5Senior secondary
1995 102,522 22,816 4,5561994 86,584 19,386 3,9781993 78,261 17,626 4,064
Annual growth % 14.5 13.8 5.9Average school size (all)
885 1,138 879842 1,146 873769 1,021 821

International Institute for Educational Planning http://www.unesco.org/iiep
Table 8.3 Junior secondary PTRs, class size, teachers/class andteachers/non-teachers, 1995
201
Secondary school financing in China:the new economics of schooling
Table 8.2 Primary PTRs, class size, teachers/class and teachers/non-teachers, 1995
Tables 8.2 and 8.3 show pupil/teacher ratios (PTRs), average classsizes, teachers/class and the ratio of teaching staff to non-teaching staff.PTRs average between 16:1 and 21:1 at primary and are about 14:1 atjunior secondary. For Beijing as a whole the PTR for senior secondary is11.7:1. Average class size at primary is between 33 and 37, and at juniorsecondary 40 to 44. The number of teachers per class is about 2.1 atprimary and 3.1 at junior secondary. The ratio of teachers to non-teaching staff is much greater at primary (5.1:1) than at junior secondary(1.9:1).
As the number of primary students has fallen the PTR hasdeclined. The proportion of non-teaching staff has increased. Atsecondary level, growth has been accompanied by an increase in thePTR, the average class size, and the proportion of non-teaching staff.
Costs per student are difficult to calculate reliably, sincebudgeting practices are inconsistent, data are incomplete and the volumeof non-budget income is uncertain. The data available produce thefollowing estimates.
Beijing Haidian District Shunyi District
Pupil/teacher ratio 16.5 16.6 20.8
Average class size 33.4 36.9 35.6
Teachers/class 2.0 2.2 1.7
Teachers/non-teachers 5.1 4.5 8.9
Beijing Haidian District Shunyi District
Pupil/teacher ratio 13.6 13.5 13.5
Average class size 41.6 41.9 44.2
Teachers/class 3.1 3.1 3.3
Teachers/non-teachers 1.9 2.1 3.4

International Institute for Educational Planning http://www.unesco.org/iiep
202
Financing secondary education in developing countries
Table 8.4 shows that public expenditure per student at juniorsecondary is higher than for other levels of schooling in Beijing (as it isin the rest of the country). This is a result of deliberately transferringmore of the total costs of senior secondary schooling to non-budgetincome raised from other sources. Haidian is a relatively high-cost area,as the unit costs of primary illustrate, and Shunyi is a low-cost area. Theoverall cost of general secondary is skewed by the proportion of juniorto senior secondary schools (not shown), which varies between districtsand is greater in Shunyi than Haidian. Salary costs appear to representbetween 75 and 80 per cent of the total budget income.
1. Schools’ financing in Haidian District
Haidian is a district which runs to the north-west of Beijing. Itcontains almost all of the city’s universities and many other post-schoolinstitutions. Some well-known schools have special associations withthe universities. The district is generally regarded as having a highquality of educational provision. The area has been rapidly growing,with much new residential construction, reflecting inward migration.The best schools are very much sought after and significant numbers ofpupils in the school system originate from outside the district. Recentestimates suggest that many schools enrol between 15 and 20 per cent of
2. 7 Yuan = US$1 at the time of this study.
Table 8.4 Unit costs based on budget expenditure (Yuan)2 in primaryand junior secondary schools in Beijing, Haidian andShenyui, 1994 and 1995
1994 1995
Beijing
Primary 617 789
Junior secondary 2,001 2,657
Senior secondary 1,238 1,407
Haidian
General secondary 1,733 2,006
Primary 778 1,029
Shunyi
General secondary 1,136
Primary 446

International Institute for Educational Planning http://www.unesco.org/iiep
Secondary school financing in China:the new economics of schooling
203
‘choice’ students (Beijing Year Book of Basic Education, 1996), whosefamilies are resident outside Haidian.
Beijing city formally claimed to have achieved the goals set by thenine-year compulsory education policy in 1994. This is intended toensure that virtually all resident children of the appropriate age range areenrolled in school up to the end of lower secondary. In Haidian it isclaimed that between 90 and 94 per cent of students continue into upper-secondary grades in general or vocational schools.3
Enrolment patterns in Haidian follow those for Beijing as a whole.Early years’ enrolment in primary schools averages about 18,000 for thecohort for each grade. In the middle grades this falls to about 16,000 andrises to 18,000 again by Grade 6. Junior secondary schools enrol about20,000 in each of the first two years and about 17,000 in the final year.These patterns suggest that the population of school-age children is fairlyevenly distributed. The fact that junior-secondary entrants are more thanthose enrolled in the last year of primary indicates some inward migrationfor secondary schooling. The growth in enrolments reflected in theexpansion of secondary numbers (Table 8.1) is most likely to be the resultof migration, since it is occurring in all grades simultaneously and is notevidently the result of a growing cohort flowing through from primaryschool. This is consistent with the rapid rate of urbanization that can beobserved in Beijing and in China more generally.
The number of general secondary schools in Haidian grew from64 in 1993 to nearly 80 in 1996. General secondary schools are thosewhich follow an academic curriculum leading to the university entranceexamination at Grade 12. There are no junior secondary schools asseparate institutions without higher grades. In addition, there are about20 combined schools. These have vocational streams at upper secondaryrelated to particular occupations. The number of combined schools hasfallen slightly, apparently because they are not as popular with parentsand students as the general secondary schools which follow an academiccurriculum. Typically, they are small institutions. Table 8.5 showsenrolments and staffing data for Haidian schools for 1993-1995. Thenumber of students enrolled at secondary level has increased by morethan 15 per cent over two years.
3. This seems an overestimate. Grade 9 enrolments in 1995 appear to have been 20,860.General senior secondary in the same year (Grade 10) enrolled 8,775. Two-, three- andfour- year vocational schools enrolled a total of about 4,000 students, leaving a further7,000 + unaccounted for (Beijing Educational Statistics, 1995).

International Institute for Educational Planning http://www.unesco.org/iiep
Table 8.6 profiles average school size, the PTR and theteaching/non-teaching staff ratios for the district based on district data.4From this it is clear that general secondary schools average around1,000 students and combined schools less than 500. The number ofteachers averages about twice the number of non-teaching staff ingeneral secondary schools and about the same number as teachers incombined schools. The number of teachers employed has not grown atthe same rate as the number of students. This is part of a deliberatepolicy to allow the PTR to increase from its relatively low levels.Pupil/teacher ratios still appear generous. These have risen from around10:1 to 14:1, with the greatest increases in the combined schools.
Table 8.6 Haidian average school enrolments, PTRs and teacher/non-teacher ratios, 1993-1995
Table 8.5 Haidian enrolments and staffing, 1993-1995
204
Financing secondary education in developing countries
1993 1994 1995
Number of general secondary students 65,371 73,344 80,829
Combined secondary students 4,960 6,550 8,737
Number of general secondary teachers 5,749 5,838 3,066
Number of combined secondary teachers 514 541 561
Number of non-teaching staff general secondary 3,304 3,066 2,889
Number of non -teaching staff combined secondary 664 722 553
1993 1993 1994 1994 1995 1995General Combined General Combined General Combined
secondary secondary secondaryAverage school enrolment 1,021 236 952 297 1,036 485
Pupil /teacher ratio 11.4 9.7 12.6 12.1 13.5 15.5
Teacher/non-teacher ratio 1.7 0.8 1.9 0.8 2.1 1.0
The claimed pattern of educational expenditure for the districtover two years is shown below in Table 8.7.
4. Small differences between this and previous data may be the result of differentconventions used at district and city level in aggregating data.

International Institute for Educational Planning http://www.unesco.org/iiep
205
Secondary school financing in China:the new economics of schooling
1994 1995
Planned budget expenditure 170,300 222,116
Total budget expenditure (including capital) 221428 292,350
Education allocation from enterprises 20,140 20,720
City allocation 7,628 87,340
Educational fund raising 43,500 61,500
Expenditure per student (Y) 2,772 3,264
Percentage increase over previous year 26.2 15.1
Budget income per student (Y) 2,132 2,480
Percentage increase over previous year 24.8 14.0
District per-student costs appear higher than the earlier quotedunit costs, since district expenditure includes all educational costs,including teaching and research institutes, inspection, centraladministration, etc., which are not included in school-level unit costs.
The greatly increased allocation from the city arises because ofthe choice of Haidian for special interventions to improve the quality ofbelow-average schools. Income from educational fund-raising by theschools appears to be growing and case-study data suggest this is likelyto be the case. Educational fund-raising is achieved through a variety ofmethods, which include fees and other contributions from students andtheir families. The rapid growth in fee levels, both for students from thecatchment areas of school and from additional students accepted fromoutside Haidian, has been a matter of concern. These issues are exploredin more detail in the concluding section.
2. Four Haidian schools
The next section describes characteristics of the four schoolsincluded in the Haidian case studies. The subsequent section offers anoverview of the schools visited in Shenyi.
Xiyi secondary school (Haidian)
This school is a general secondary school of average size on theedge of Beijing city. It is in the second quartile in terms of achievementwhen compared to all the schools in Haidian. It has a small site withthree buildings. Its intake consists of students who fail to make the
Table 8.7 Haidian budget and non-budget income and expenditureper student, 1994-1995 (‘000 Yuan)

International Institute for Educational Planning http://www.unesco.org/iiep
cut-off grades for Beijing or Haidian key schools, but it is neverthelessattractive in terms of its location and relatively good standing. Theenrolment profile of this school is given in Table 8.8. Total schoolenrolments have grown about 15 per cent in the past three years.
Table 8.8 Enrolments by Grade, Xiyi, 1996
206
Financing secondary education in developing countries
Enrolment Classes Average class size
Grade
7 256 6 42.6
8 231 6 38.5
9 281 6 46.8
10 151 4 37.7
11 132 4 33.0
12 90 4 22.5
Total 1,141 30
Xiyi has 110 staff, of which 80 are teachers, giving a PTR of 14.3,and a class/teacher ratio of 2.7. Nineteen staff are on administrativegrades. The ratio of teachers to non-teaching staff is therefore 2.7. ThePTR has risen from about 1:10 to approach the Beijing guidelines of1:12 for senior secondary and 1:14 for junior secondary.
The bulk of budgeted expenditure from the district authority isallocated to salaries. The budget for 1996 was Y1,294,000 for personneland Y200,000 for operating expenses. Around Y400,000 of the salarybudget was allocated to pensions for retired teachers. Between 1995 and1996 the proportion of the budget allocated to salaries increased from 85to 87 per cent. Apart from a small additional subsidy of about Y20,000,the remainder is found from off-budget income. Around half of teachers’entire income is paid from budget income and half from non-budgetsources (amounting to about Y1.5 million from each in 1996).
Budgeted recurrent expenditure per child was about Y1,300 peryear in 1995. Students in Xiyi do not board and this means its level ofsubsidy is lower than the other case-study schools. It also has relativelynew buildings and receives less in maintenance subsidies, as a result,than do older schools.
Off-budget income that Xiyi receives comes from several sources:
(i) The school has nine school-run businesses which are thought togenerate about 25 per cent of total recurrent expenditure,amounting perhaps to Y400,000. These business are sub-

International Institute for Educational Planning http://www.unesco.org/iiep
contracted to managers who are not on the school payroll. Theypay a flat rate each year to the school, independent of theirprofitability.
(ii) Some space is rented for commercial use. One of the schoollaboratories is let for Y100,000 per year. A further Y300,000-Y500,000 (1995,1996) in rental income is derived from an officebuilding on the school site which was commercially funded. Nightschools occupy classrooms in the evening, yielding about Y50,000per annum. Xiyi school management has invested Y1 million inland outside the city on which it intends to build a conferencecentre and summer-school facilities. This should generate revenuein the future. It also has plans to merge with the adjacent primaryschool, which has additional land, some of which may beconverted into space for rent.
(iii) A significant source of income is from the ‘model bilingualschool’, which is effectively a quasi-private activity incollaboration with a foreign-language school organization. Thischarges high fees to students who can afford to pay. This ‘schoolwithin a school’ has four classes – two at junior-secondary leveland two at senior secondary. It generates about Y26,000 per monthor about Y300,000 per year. It is not clear what the costsassociated with this venture are. The four classes are taught bysenior-grade teachers who are already employed by the school.They appear to be paid extra for this work. Other overheads arealso largely accommodated within the infrastucture. This ventureis seen by the school as valuable both for its income and as acentre for the development of effective teaching practices. Itprobably generates an additional Y200,000-Y250,000 per annumin income after costs have been met.
(iv) Xiyi also has a class of 30 for students who come from outside itscatchment area. These ‘choice’ students pay a variable fee betweenY1,000 and Y9,000 per term and an entrance fee. This raises aboutY100,000 per annum. New Beijing regulations suggest guidelinesof fees of Y12,000 for junior secondary and Y18,000 for seniorsecondary per term and payments at this level are already beingmade. This will increase the income from this source.
(v) All junior school students apparently pay Y48 per term (1996) inofficial school fees and senior school students somewhat more(Y200), adding perhaps another Y50,000 in income.5 Students pay
207
Secondary school financing in China:the new economics of schooling
5. It is clear that some schools charge more than the official rates.

International Institute for Educational Planning http://www.unesco.org/iiep
a food-cost fee of between Y200 and Y400 per term, which maygenerate a small surplus.
Taken together, the additional income represented by the range ofactivities identified above amounts to about Y1.3 million, the equivalentof an additional Y1,150 per student over and above the budgetedexpenditure. It is likely that this is an underestimate of additionalincome.
The main capital investment in 1996 was Y1 million from theDistrict Education Bureau for a new teaching block. Like many cityschools, Xiyi has to provide benefits to teaching staff to retain theirservices. The funds from the bilingual school are predominantlyallocated to bonus payments and other benefits. Increasingly teachers arefrom outside Beijing (currently 10 per cent of the staff) and this iscreating an accommodation problem, which the school cannot easilysolve without building new quarters for which there is currently nosource of funding other than off-budget revenue.
No. 101 secondary school (Haidian)
This school contrasts with Xiyi. It is located adjacent to theGarden of Perfect Brightness near the summer palace on the outskirts ofBeijing, a few miles to the north-west. It is one of seven Beijing city-level key schools and attracts additional support for this reason. It has along history and a reputation for high quality similar to the schoolsaffiliated with Beijing and Beijing Normal Universities.
The profile of enrolments in this school is shown in Table 8.9.
Table 8.9 Enrolments by grade – No. 101 school, 1996
208
Financing secondary education in developing countries
Enrolment Classes Average class size
Grade
7 408 7 58.3
8 432 8 54.0
9 432 8 54.0
10 338 7 48.3
11 333 7 47.6
12 367 7 52.4
Total 2,310 43

International Institute for Educational Planning http://www.unesco.org/iiep
Secondary school financing in China:the new economics of schooling
209
The staff total 267, of whom about 100 are non-teaching (1:2.7teaching staff to non-teaching) and 44 are administrative. The ratio ofteachers to non-teachers is 1.7, reflecting the additional complement ofstaff key schools receive. Class sizes are larger than in Xiyi and are over50 because of the popularity of the school. There are 3.8 teachers perclass in this school – a ratio typical of prestigious key schools. The PTRin this school appears to be about 13.9.
School income for 1995 from the district budget was aboutY2,656,000. This is equivalent to about Y1,150 per student, which isless than for Xiyi school.
Off-budget income is derived from several sources.
(i) School 101 has two economic enterprises associated with it. One isa wholesaler for ice cream and drinks, the other produces plastics.About 45 per cent of the profit of these enterprises is allocated tothe school. In 1995/1996 this contribution was around Y350,000.
(ii) As a prestigious key school, Beijing No. 101 is in a position toattract students from outside its catchment area who are feepaying. At junior-secondary level, the fee is Y30,000 in total andat senior high-school level Y50,000. In 1994, the school raisedmore than Y2 million in this way (enrolling about 50 of these fee-paying students). This kind of income is held in separate accountsand may be used for any purpose.
(iii) Beijing No. 101 school also receives between Y1.5 and Y2 millionper year in subsidy from the large government departments thatsurround it and which provide students for the school. This moneyis in the form of special grants. This is additional income and isover and above what it would otherwise receive. It has no rentalincome as its position is not attractive to commercial interests.
In total, in School 101 off-budget was estimated at aboutY4,479,000 in 1995, fully 1.7 times more than budget income. About33 per cent of this income was spent on maintenance, 26 per cent onsalaries, and a further 12 per cent on new facilities.
No. 19 secondary school (Haidian)
No. 19 secondary school has a long history and was formerlyassociated with Yanjing University. Physically, it has a large andattractive campus for a school close to the city. Academically, it is oneof the best ordinary schools without key-point status. It has beenidentified as one of 10 schools in the Joint Innovation Programme

International Institute for Educational Planning http://www.unesco.org/iiep
supported by the State Education Commission and is a pilot school forcomputer education.
The enrolment profile of the school is shown in Table 8.10:
Table 8.10 Enrolments in No. 19 school, 1996
210
Financing secondary education in developing countries
Enrolment Classes Average class size
Grade
7 404 8 50.5
8 468 10 46.8
9 466 10 46.6
10 182 4 45.5
11 171 4 42.7
12 192 4 48.0
Total 1,883 40
There are 170 staff in the school, of which 53 are non-teaching,giving a teacher/non-teacher ratio of 2.2:1. The teacher/class ratio is2.9:1. There are about 30 administrative staff. The PTR for this schoolis 16.1. About 5 per cent of students board at Beijing No. 19 school.6
The school receives Y2,883,200 from the district government,divided between personnel expenses, operational expenses and subsidiesfor food and travel in 1996. This is about Y1,532 per student.7
Significant sources of non-budget income are:
(i) The Beijing Municipal Government standard fee is Y32 per monthper junior-secondary student per term and Y200 per term forsenior-secondary students. In School 19, Y700 and Y900 areactually charged, since the guidelines are regarded as ‘out ofdate’. This generates about Y2.8 million annually.
(ii) School fund contributions from fund-raising activities amount toabout Y700,000 to Y800,000 per year.
(iii) School-run enterprise contributions account for Y300,000 toY500,000 per year from 10 activities which are used to generateincome and provide some employment for surplus staff and thechildren of staff members. These activities include a taxicompany, several shops, oven and switch manufacture, interiordecorating and printing training.
6. This is charged at Y250 per term. In addition, students have to pay for their food costs.7. In this school 80 retired teachers are on the payroll. Since they are not counted as
teachers, this inflates the apparent unit cost.

International Institute for Educational Planning http://www.unesco.org/iiep
(iv) Contributions are received from individuals and work unitsassociated with the school who want their children enrolled,despite not being in the official catchment area. Y700,000 is raisedfrom this source. About 50 students are enrolled in normal classes.
(v) The school runs a special unit which houses visiting Koreanstudents, who pay around US$2,200 per annum. This appears togenerate income of between Y500,000 and Y1 million.
(vi) Other ‘invisible’ (i.e. on-budget) income is raised from variousproperty-related arrangements. These have resulted in substantialphysical improvements and are thought to have saved over Y9million in capital costs that could not otherwise have beenafforded. These arrangements include:
• No. 19 school has shared its sports track with the BeijingMunicipal Authority. A deal was arranged whereby theMunicipal Government built residential flats on school landand upgraded the track at no cost to the school.
• No. 19 schools’ administration block has been reconstructed incollaboration with another work unit, which paid the costs ofreconstruction and now shares the new larger premises.
• The school’s assembly hall was refurbished by another workunit at no cost with an agreement for shared use.
• The school receives over Y2 million a year in rental fromvarious arrangements to sub-let and share its facilities.
Teachers’ accommodation is problematic in No. 19 school.However, new accommodation is now been financed with contributionsfrom those who will benefit and 50 new units are to be built next year.This school seems to generate in excess of Y5 million annually beforeaccounting for rental income.
Huacheng private school
Huacheng private school is a boarding school which was openedin 1993 after new regulations were introduced. It covers Grades 1-9 andis in the process of building up its enrolments. There are now 36 privateschools of a similar kind in Beijing. They are characterized by boarding(from Grade 1), high fees, and intakes of students from rich familieswhose academic scores are not sufficient to enter prestigious stateschools.
Enrolments in Huacheng are shown below in Table 8.11.
211
Secondary school financing in China:the new economics of schooling

International Institute for Educational Planning http://www.unesco.org/iiep
Table 8.11 Enrolments in Huacheng school, 1996
212
Financing secondary education in developing countries
The school has 56 primary-school staff, of whom 29 are non-teaching, and 40 secondary staff, of whom 19 are non-teaching. ThePTR is 8:1 in primary and 4.3:1 in secondary. Class sizes are between 17and 24 at primary and 10 and 13 at secondary and teacher/class ratios are2.4:1 and 3:1 respectively. Twenty-nine staff are on administrativegrades (60 per cent of the number of teachers). Teachers in the school arepaid a basic salary of Y800 and with bonuses can reach Y2,000 permonth. This is comparable with the best-paying state schools. However,there are no ancillary welfare benefits.
The school receives no state income as a private school. Fees areunregulated. In this school the fees charged are between Y4,500 andY6,000 for tuition, Y1,500 for food, Y500 for boarding and Y300 foradministrative expenses. These total between Y6,800 and Y9,100depending on the grade. In addition, there are supplementary fees. Theseinclude semester fees of Y300-Y400 per semester for clothing, Y150 forhealth care, Sunday residence supplements of Y1,000, and Y500 forsundries. These fees total about Y4,000 per year. An entrance fee ofY30,000 is payable (less if students enter above Grade 1). Other costsmay also fall on parents. Summer camps abroad may cost Y40,000.Those who want their children to take part in the joint arrangement witha local football club would need to pay Y6,000 per semester and Y30,000to enrol. Average total costs per child are reckoned to be Y80,000-Y100,000 over five years, or about Y20,000 per year.
Expenditure in this school is mainly allocated to salaries, therental of buildings, and the cost of facilities. Buildings rental costs about
Enrolment Classes Average class size
Grade
1 17 1 17
2 35 2 18
3 51 3 17
4 73 3 24
5 42 2 21
6
7 22 2 11
8 40 3 13
9 30 2 10
Total 310 18

International Institute for Educational Planning http://www.unesco.org/iiep
Y1.5-Y2.0 million per year. New construction is funded from student-fee income. Substantial expenditure is allocated to equipment, especiallycomputers and laboratories.
In summary, the four Haidian schools can be compared as followsin Table 8.12.
Table 8.12 Four Haidian schools, 1996
213
Secondary school financing in China:the new economics of schooling
Xiyi No. 101 No. 19 Huacheng
Teachers 80 167 117 48
Non-teachers 30 100 53 48
Administrators 19 44 30
Students 1,141 2,310 1,883 310
Classes 30 43 40 18
Pupil/teacher ratio 14.2 13.8 16.1 6.5
Teacher/non-teacher ratio 2.6 1.7 2.2 1.0
Teacher/class 2.6 3.9 2.9 2.7
2. School financing in Shunyi County
Shunyi County is one of the eight affiliated counties of the Beijingadministration and is located to the north-east of the city. It is a plainarea with relatively low land and labour prices and intensive agriculture.It has attracted a number of joint-venture manufacturing companies. Thedemand for schooling in this area is growing as industries develop. Thecounty economy is much more buoyant than those of the surroundingmountainous counties. Educational provision is, however, much lessdeveloped than in the urban areas of Beijing. The rural area of Shunyihas seen an increase in enrolments, which is best explained by increasedretention and progression with possibly some inward migration frommore distant rural areas.
Primary enrolments are increasing in Shunyi and the growth ratehas been averaging over about 8 per cent a year. Secondary enrolmentshave grown more slowly at around 6 per cent. The number of secondaryschools remained the same between 1993 and 1995 constrainingenrolment growth. Most schools are junior secondary only (39 out of 46)(Table 8.13).

International Institute for Educational Planning http://www.unesco.org/iiep
Table 8.13 Shunyi enrolments and staffing, 1993-1995
214
Financing secondary education in developing countries
Year 1993 1994 1995
Number of general secondary students 28,736 30,554 33,186
Combined secondary students 1,296 1,708 2,500
Number of general secondary teachers 2,195 2,282 2,105
Number of combined secondary teachers 118 102 143
Number of non-teaching staff general secondary 672 648 988
Number of non-teaching staff combined secondary 80 54 109
Table 8.14 shows the average school size, the PTR and theteaching/non-teaching staff ratios for the district. General secondaryschools average around 850 students and combined schools about 350.The number of teachers averages about three times the number of non-teaching staff in general secondary schools, but the ratio appears to befalling. PTRs have risen to nearly 16:1 and are greater than in Haidian.
Table 8.14 Shunyi average school enrolments, PTRs and teacher/non-teacher ratios, 1993-1995
1993 1993 1994 1994 1995 1995
General Combined General Combined General Combinedsecondary secondary secondary
School enrolment 736.8 185.1 804.0 284.7 850.9 357.1
Pupil/teacher ratio 13.1 11.0 13.4 16.7 15.8 17.5
Teacher/non-teacher ratio 3.3 1.5 3.5 1.9 2.1 1.3
Shunyi allocated about 20.5 per cent of its revenue to educationalexpenditure in 1995, an increase from the level of the previous four yearsof about 18 per cent. The township level government plays a moreimportant role in financing schools in Shunyi than in Haidian.Townships provide most of the resources to purchase equipment and forschool maintenance because schools tend to be more dependent onbudget income than those in the city. School-run businesses are lesscommon. Educational taxes on enterprises generate far less, since thereare relatively few to tax. The public budget has been growing strongly.(Table 8.15).

International Institute for Educational Planning http://www.unesco.org/iiep
215
Secondary school financing in China:the new economics of schooling
1991 1992 1993 1994 1995
Recurrent budget/student 364 416 590 616 727
Growth 13.0 14.3 22.4 21.0 18.0
Operating costs/student 135 147 157 160 186
Growth 27.3 8.8 7.2 1.8 16.3
Average staff income 2,776 3,385 4,965 6,208 7,772
Growth in percentages 4.3 22.0 46.7 25.0 25.2
Table 8.15 Recurrent budget per student (all levels), 1991-1995Growth in budgeted educational expenditure has been
concentrated in personnel costs. Salaries now account for about 80 percent of total costs, compared to 73 per cent in 1991. The recurrent budgetper-student allocations were Y1,650 for vocational schools, Y1,136 forgeneral secondary, and Y446 for primary in 1995. The proportionallocated to salaries was about 74 per cent in general secondary and 83per cent at primary.
Three Shunyi schools
The main characteristics of the three schools are shown in Table8.16.
Beiwu Chengguan Niulushan
Teachers 53 110 125
Non-teachers 33 90 135
Administrators 19 46 38
Students (total) 862 1,887 1,721
Junior 580 893 795
Senior 282 994 926
Classes (total) 19 35 33
Junior 13 17 15
Senior 6 18 18
PTR (average) 16.3 17.1 13.8
Teacher/class ratio 2.8 3.1 3.8
Average class size 45.4 53.9 52.1
Junior 44.6 52.5 53.0
Senior 47.0 55.2 51.4
Teachers/non-teachers 1.6 1.2 0.9

International Institute for Educational Planning http://www.unesco.org/iiep
Table 8.16 Characteristics of Schools in Shunyi, 1996Beiwu school
Beiwu is the smallest of the three schools. Its public budget wasY759,000 in 1995 and the cost per student rose from Y758 in 1993, toY881 in 1994 to Y1,035 in 1995. Of this about 25 per cent was for non-salary expenditure.
The additional sources of revenue that Beiwu mobilizes includethose listed below:
(i) Fees are charged to students who fall below the examinationentrance level set. These students pay up to Y7,000 forregistration for three years. Currently, the numbers are small, butseem likely to grow as demand for secondary schooling increases.
(ii) The school fund is supported by local benefactors. The sum ofY490,000 was raised from this source in one year, but this incomeis irregular.
(iii) The local village government donates some free space in anunused building.
(iv) Extra fees of Y60 for junior students and Y200 for senior studentsare charged each year. The boarding and food fees (Y100) are,though, both too small to cover costs and have to be subsidized.
Teachers’ salaries in Beiwu range from Y450 to Y700 and arealmost entirely provided from the budget income. Married teachers aregiven free housing and utilities and all teachers receive benefits in kind,e.g. food from the school. Only Y20,000 was available in 1995 to spendon teaching resources. In sum, this school is largely dependent on budgetallocations to meet its costs.
Chengguan No. 1 school
Chengguan is a county key school. It is located in Shunyi city andis a complete school with fairly good facilities. The school has 1,800students and provision for 600 boarders. This school receives much moreincome than Beiwu from a wider range of sources, as can be seen fromTable 8.17.
216
Financing secondary education in developing countries

International Institute for Educational Planning http://www.unesco.org/iiep
Table 8.17 Income for Chengguan school, 1993-1995
217
Secondary school financing in China:the new economics of schooling
1993 1994 1995
Financial allocation 1,488,400 2,605,100 2,465,400
Social donations 550,500 697,500 1,326,800
School factories 62,270 101,000 205,300
Tuition 65,000 211,000 356,400
Boarding fees 37,200 72,700 78,700
Total 2,203,360 3,087,300 4,432,600
The cost per student in this school was about Y1,370 in 1995,based on budget allocation alone. The budget was almost doubled by theother sources of income. The result is a relatively well-resourced schoolwith ‘three machines in every room’ (video, TV, projector), a cable TVstation, and a new library. Many of the county leaders’ children attendthis school and their parents arrange materials and assistance formaintenance and school improvement.
Teachers’ salaries vary between about Y460 and Y800 per monthand are based on the structured salary system. Some teachers are allowedto buy houses at subsidized rates as an incentive to stay. Chengguanreceives support from the Beijing Education authority, since it is a keyschool. Most of the building costs are met from this source – overY10 million in the past two years.
Niulushan school No. 1
This school is in a suburban area and has a long history. It has alow PTR and high teacher-per-class ratio, reflecting its key school status.Over 80 per cent of students are boarders. The school is intending toincrease its focus on upper-secondary students and allow the juniorstreams to decline. In this school there are more non-teaching staff thanteaching staff, partly because of the level of boarding and partly becausethis includes some staff in school-run factories. In 1995, Niulushanreceived about Y2,690,000 from budgeted funds, giving a unit cost ofaround Y1,563.
The fairly modest amount of about Y400,000 was raised by theschool in 1995 from fund-raising activities and donations. Fees paid byboarders from outside the catchment area are the other source of income.There are over 300 of these students paying Y3,000 per term, thusgenerating about Y900,000 per year. School-run factories make smallcontributions to the operating costs.

International Institute for Educational Planning http://www.unesco.org/iiep
3. Issues arising from the Beijing case study
School funding in Beijing is essentially based on a historicalbaseline from which each year an increase is agreed. Thus each year anincrease, typically between 5 and 10 per cent (except in times of highinflation), has been agreed. The total amount available is then distributedaccording to various formula that link staffing to student numbers, etc.,with the proviso that the salary budget will be paid as a first call on themoney available. Salaries are ‘the tractor that pulls the budget’, sincethese have to be paid. Current policy creates an obligation to respond tothe ‘three growths’ expected in fund allocation. Local authorities areencouraged to meet these expectations. The ‘three growths’ are that:
(i) education should grow as a percentage of the public budget of thedistrict;
(ii) operating costs should increase as a percentage of the total;(iii) educational allocations should increase at more than the rate of
increase in prices.
Various methods are used to raise educational funds. Theseinclude:
• People’s Education Fund – Organizations and individuals areencouraged to make contributions to the People’s Education Fund,which is used to support capital works.
• Education taxes – A 2 per cent education tax is levied on allsalaried employees by Beijing city government. This is paid intoa central fund which is drawn on for capital works. The revenuegenerated by the levy is substantial, but it is also likely that the fullamounts are not collected, since tax enforcement is veryproblematic, especially outside state enterprises. Currentregulations of the Beijing Municipal Government specify that aneducational tax is payable by building contractors constructingresidential blocks (Y10 million per 80,000 sqare metres ofaccommodation), to be used for school improvement andconstruction.
• Enterprise taxes – State enterprises and other production units aretaxed on turnover or profits at between 2 and 5 per cent togenerate revenue for the education budget.
• School-run businesses – Many Beijing schools have school-runbusinesses associated with them. These often have a fixed feearrangement negotiated each year and contribute to school
218
Financing secondary education in developing countries

International Institute for Educational Planning http://www.unesco.org/iiep
budgets on this basis. They are usually largely autonomousenterprises located at the school, but possibly sharingmanagement staff.
• Rental of assets – Rental of land and buildings can be a substantialsource of income for schools on prime sites in the city.
• School fees – Most schools charge modest fees to local residentsin the range of Y30 per term. In addition, supplementary fees arebecoming common, e.g. for laboratories, computing, sports,uniforms, military training, and many schools appear to chargemore than the statutory minimum fee. Entrance-fee payments arealso becoming common on first enrolment to secondary school,though these are often described as contributions to school funds.
• Fees for ‘choice’ students – Students from outside the catchmentarea of schools can be charged fees. Officially these are limited toY12,000 and Y18,000 at lower and upper-secondary school.These limits are widely disregarded and higher fees are charged ifdemand is strong enough.
• Fee for overseas students – Some schools run special units whichattract overseas Chinese and other school-age students at high feerates.
The case studies above draw attention to the extent to whichschools in Beijing are financing themselves through income fromoutside the public budget. In most cases, this appears to have beengrowing much faster than public funding. A number of issues emergefrom the case-study data. These relate to teachers’ salaries, the numbersof non-teaching staff, teaching loads and internal efficiency, the growingdirect costs of schooling, increasing enrolment of ‘choice’ students, andthe largely unregulated growth of school-run businesses.
4. Teachers’ salaries
Teachers’ salaries in Beijing have been paid according to scaleswhich partly take into account increases in the cost of living. Theappropriation from public funds only covers a proportion of the total costof a teacher. The public component has reduced in size since 1994, withthe result that schools have had to meet an increasing proportion of thetotal. This new scheme gives an incentive to schools to employ staffaccording to need and reduce the numbers of non-teaching staff (thoughthis has yet to appear in the statistics on those employed). It should alsoencourage PTRs to rise and might reduce teacher-per-class ratios.
219
Secondary school financing in China:the new economics of schooling

International Institute for Educational Planning http://www.unesco.org/iiep
The disadvantage is that it may encourage or require more and more timeto be invested in fund-raising activities at the expense of attention toeffective school management.
The structured salary scale for teachers in Beijing combines a basicsalary and several performance-related elements. The approximate incomesfor different grades of teacher are shown below in Table 8.18. Teachers’grades are determined primarily by seniority and length of service.
Table 8.18 Teachers’ salaries in Yuan by level of appointment, 1996
220
Financing secondary education in developing countries
Probationer Grade 3 Grade 2 Grade 1 Grade 1a Non-teaching
Salary (Y) 700-800 800-1,000 900-1,000 1,200-1,400 1,500-1,600 800-1,000
These salaries are made up of a basic component, which is paid bythe city government. The remainder of the salary is determined by acomplex set of rules that vary in different parts of China. In Beijing, thecity contributes a further 30 per cent above the basic salary. In the case ofa Grade 2 teacher, the basic is about Y230. With 30 per cent addition thisreaches about Y300. Subsidies for teachers’ food and travel account forabout Y150. The remainder of the ‘structured salary’ is paid by the school.This is made up of a variety of performance-related components, e.g.:
• Y200 per month for a teacher in charge of a class;• Y12 per teaching hour, Y6 per teaching plan for Grade 1a
teachers; Y9 and Y5 for Grade 1 teachers; and Y8 and Y4 forGrade 2 teachers (more senior teachers are therefore rewarded ata higher rate);
• Y400 for teachers’ festival; Y150 for autumn festival; Y600 forspring festival.
A Grade 2 teacher teaching 10 periods and writing 6 lesson plansa week, who is a class teacher, would therefore receive (10 × 8 + 6 × 4)× 4 + 200 = Y616 per month in addition to the basic plus subsidies ofY450, thus earning about Y1,050. Teachers’ incomes in the case-studyschools in Haidian appear to vary between about Y700 and Y1,400depending on experience, seniority and workload.
The ‘structured salary scheme’ has the effect in practice that oftenhalf or more of teachers’ total income has to be raised by the school. Thisis clearly easier in some schools than in others. It also means thatincomes of teachers vary considerably between schools, with theconsequence that the best teachers have an incentive to move to wherereal incomes are greatest. True teaching costs per student are difficult to

International Institute for Educational Planning http://www.unesco.org/iiep
compute as a result. Though the state-funded element of the salary canbe identified reliably, the rest of the salary may only be known locally.In Beijing it appears that total income is usually between double andtriple the state-funded element, and may in some cases be more. Itappears that most city schools can meet the obligations they have tocomplement the basic salary. The largest differences between schoolsarise from the additional benefits they can provide in terms of housing,health care and educational benefits for staff.
Teachers may make additional income over and above theirofficial income. Common arrangements include additional weekend orevening tuition classes for payment, often run on school premises.Teachers may also be acting as private tutors in the evenings. Oneestimate suggests that in the case-study schools this may enhanceincome by Y200-300 per month. Teachers may have other ‘second jobs’.No systematic information is available on this.
5. Teaching loads
Secondary school curriculum guidelines provide for about30 teaching periods per week for 42 weeks. Typically, there are sixteaching periods in the school day for five days a week, taught betweenabout 7.30 a.m. and 3.00 p.m. Each 45-minute period is treated as a‘teaching hour’. A normal teaching load is considered to be about12 teaching hours per week. This time may include lesson preparationand marking time. It is therefore not uncommon to find teachers whoteach about two periods of class contact each day.
In addition to the teaching periods, most secondary schools haveadditional activities after school hours, which are necessary to meet theprescribed guidelines for extra-curricular activity. These add one to twohours on to the school day.
The staffing of the schools we have examined suggests thattypically there are between two and three teachers per class. A schoolwith an 8-form entry might therefore be staffed along the following lines(Table 8.19).
221
Secondary school financing in China:the new economics of schooling

International Institute for Educational Planning http://www.unesco.org/iiep
Table 8.19 Teaching loads in Beijing schools, 1996
222
Financing secondary education in developing countries
Number of students 8 × 45 × 6 2,160
Number of classes 8 × 6 48
Number of teachers 8 × 6 × 2.5 120
Number of taught periods per day 8 × 6 × 6 288
Number of periods taught per teacher per day 288/120 2.4
In effect this implies about 1.5 hours actual face-to-face contactper day. In addition, teachers will be expected to complete lesson plans– possibly one per day, but these may repeat from year to year. They willalso have marking to undertake for two classes, assuming they have settasks that require this.
Chinese schoolteachers have pastoral responsibilities that mayextend beyond those familiar in other countries. Visiting parents at homeis common, pressures from parents (especially in urban areas) requireconsistent setting and marking of homework, and many extra-curricularactivities are organized. Both parents usually work. There is someexpectation that schools will provide additional classes and clubactivities after school hours so that children only return to the homewhen their parents do.
In summary, teaching loads are light in terms of contact hours, andteacher/class ratios are high by international standards – sometimesmore than 3:1. This relative inefficiency leads to higher unit costs thanwould otherwise be the case.
6. Non-teaching staff
The ratio of teaching to non-teaching staff in the case-studyschools is between 2:1 and 3:1. The majority of these staff are describedas administrative. They include the principal and vice-principals, theparty secretary, accounts staff, directors of teaching programmes,directors of services, librarians and other minor staff. In addition, mostsecondary schools have drivers, cleaners, cooks and a variety of othernon-administrative staff. These staff may be shared to some extent withother activities associated with the school – e.g. school-run business, etc.Their basic salary costs appear to fall on the school budget.
Schools are staffed like other state-run organizations in China.Zhou Enlai’s principle that “three people should eat two people’s food”(i.e. employment should be distributed to ensure all are in work, even ifthis means they are under-employed) remains influential. This may be

International Institute for Educational Planning http://www.unesco.org/iiep
changing as China modernizes. Clearly, there are limits to the rate atwhich considerations of efficiency may come to have more weight thanconcerns for distribution.
A variable proportion of staff on the payroll will be retired teachers.The general practice is that when teachers retire, their school budgetcontinues to include their basic salaries and associated allowances (withoutthe performance-related enhancements). This is factored into the formulaused to provide the base salary budget from public funds. It has the effectof increasing the apparent unit costs in old schools with many retired staff.
7. Direct costs to parents
The direct costs to parents of school attendance are difficult toestablish and, in any case, will vary considerably between schools. Someindication of the kind of costs parents bear can be illustrated from thecase of Li Ang, a 13 year-old attending a secondary school in Beijing.
Overall, the costs to the parents of attending this school appear toaverage between Y1,300 and Y2,000 per year, depending on the gradethat the student attends. This is comparable to the expenditure perstudent from the budget income.
Private tuition is becoming widespread in urban areas. Familytutors (often university students) are employed for several hours a weekin key subjects. This is concentrated around the beginning of primary,the end of primary for selection to junior secondary and at the end ofjunior secondary. Tutors typically cost around Y20 an hour and a childmight receive 4-6 hours a week, totalling about Y400 a month.
The case of Li Ang
Three months before the entrance examination held by the school to select newentrants his parents employed two family tutors. Li Ang was told to concentrateon his studies and was prevented from watching television. Li Ang’s father is afactory worker and his mother a kindergarten nurse. The family income is aboutY2,000 per month. The family tutors cost Y400 per month. Unfortunately, LiAng’s results were two points less than the entrance level required. In order togain entry to the school they favoured, Li Ang’s parents were asked to pay Y6,000to the school’s work unit and another Y6,000 as a contribution to the non-budgetincome of the school. On entering the school several other expenses wereincurred. The uniform cost Y200, a military education fee of Y50, Y150 forbooks, Y32 for term fees, Y25 for laboratory fees, Y100 a month for food, andY400 for a bicycle to travel to school. On top of this, his parents are expected topay Y150 a month to the school as a regular fee.
223
Secondary school financing in China:the new economics of schooling

International Institute for Educational Planning http://www.unesco.org/iiep
8. ‘Choice’ students
The competition for access to key schools and others with a goodreputation for academic results in the university entrance examinationshas become intense in and around Beijing. Since many of the universitiesin Beijing are located in Haidian, this has meant that many of its schoolsare seen as desirable. This has created opportunities for schools toincrease off-budget contributions, especially from students who wouldnot qualify to attend on residential grounds and/or from those who havescores below the normal entry level for the school. Schools have beencharging fees of around Y30,000 for junior secondary and Y50,000 tosuch students (‘choice’ students) to allow enrolment. On top of this,additional term fees are charged.
Official policy on fees is complex to interpret. There are nationalguidelines, but these are interpreted in different ways by lower-levelauthorities. Practice clearly varies widely even within Beijing. In 1996,fees for students from outside the catchment area of schools associatedwith Beijing Normal University were supposed to be abolished. Parentswere given the choice of reimbursement of their fees and withdrawal oftheir students, or continuing with previous practice, which most chose todo. These schools receive public grants, which only cover about 25 percent of their running costs. After a decision was made to focus on schoolactivities and abandon school-run businesses, the main source ofadditional financial support has been students’ fees (Y60,000 as anadmission fee and additional term fees) and rental of space. It is nowproposed that all fees should be phased out. There is no obvious way inwhich these schools will be able to meet their recurrent expenses in thefuture without the income from fees.
The practice of charging high fees for ‘choice’ students has beencriticized by a Vice-Minister and the State Council. Guidelines inBeijing suggest that a maximum fee of Y12,000 for junior secondary andY18,000 for senior secondary for ‘choice’ students will be enforced fornext year in line with State Council pronouncements. However, it isalready true that this maximum is being exceeded by some schools,apparently without penalty. The fear is that, increasingly, access toprestigious secondary schools is being rationed by price. Some studiessuggest that educational expenditure now ranks third behindaccommodation and food as a concern for household expenditureamongst families in Beijing.
224
Financing secondary education in developing countries

International Institute for Educational Planning http://www.unesco.org/iiep
9. School-run businesses
School-run businesses are not new in China. They first appearedin 1958 during the ‘Great leap forward’ as a way of introducing thelinking of work and study skills and relating theory and practice. Theywere also encouraged during the cultural revolution to dignify labour. Inthe 1980s, school-run businesses started to become more and moreimportant in the financing of education as the responsibility system gavemore control to the local level and the state to shift more of theresponsibilities for financing education to the local level. In the 1990s itbecame unambiguously clear that the main function of school-runbusinesses is to generate additional income to cover the runningexpenses of schools.
School-run businesses in Beijing are attractive for several reasons.Enterprises organized under the umbrella of schools enjoy a three-yeartax holiday and have a very favourable tax regime subsequently, whencompared to free-standing enterprises. In addition, those that manage thebusinesses are not personally responsible for their liabilities. Theytherefore take no risk, unlike more commercial ventures. Schools aslegal entities can also borrow capital without the need for collateral thatmay be forfeited if a default occurs.
In the schools in our case study, flat-rate contracts appear to bewritten on an annual basis for transfer payments from school-runbusinesses to the school budget, rather than as a percentage of turnoverof profits. This may also be favourable to managers and employees ofschool-run businesses. Surpluses generated may be retained within thebusiness and used to pay enhanced salaries to staff.
The staffing of school-run businesses is very varied. In somecases, some of the costs may be marginal. Where surplus staff areredeployed (whose salaries would be paid in any case), additional staffcosts may be minimal.
Schools in China are part of larger social and productionorganizational units (danwei – work units), which have broad socialresponsibilities for the welfare of their members. This helps explain someof the economic differences between schools in China and in othercountries. Thus, staffing and work responsibilities recognize that there isan obligation to support the welfare of the community as a whole, schoolexpenditure will include a subsidy of health care and other living costs forstaff, accommodation costs are frequently heavily subsidized and theirassets are available to support the range of activities of the work unit.
225
Secondary school financing in China:the new economics of schooling

International Institute for Educational Planning http://www.unesco.org/iiep
Arguably, the economic relationships between schools and theircommunities have been changing. Relaxation of constraints onenterprises and accountability, the encouragement of local responsibility,and more generally a climate in which deregulation has occurred defacto or de jure, have resulted in new roles becoming apparent. In somerespects, school organizations are acting as intermediaries betweensources of finance and productive enterprise - their legal status and riskprotection enables them to lend capital to businesses at favourable rateswith little tax obligation on profits. They are therefore attractive sheltersfor small businesses in which individuals can prosper and enjoy much ofthe benefits of their commercial success.
In effect, school management can occupy a kind of ‘rentierposition’ in which the assets they control (physical (space andbuildings), human (staff), and financial) can be made available forincome-generating purposes for a rent. The assets are given as gifts toschools (the land they control is of no direct cost to them, staff can beseconded at no additional cost, and the financial rents arise fromlegislation and custom and practice). This does represent a novel way ofraising finance for schooling which is generally not significant in othercountries.
The State Council indicated that it was its intention to phase outschool-run businesses by 1999. Although it is thought they have playedan important role, there is now some feeling that they should beseparated from schools and cease to enjoy the special privileges thatmake them attractive (e.g. tax incentives). It is clear that they canbecome a distraction to school management and they constitute anuncertain source of financing that is concentrated in areas where there iseconomic growth which is largely absent elsewhere. The preferenceseems to be to favour concentration on educational activities in thefuture and find other ways of solving financial problems. It remains tobe seen whether this will become a reality, since many schools willexperience a dramatic drop in income if school-run businesses are nolonger allowed.
226
Financing secondary education in developing countries

International Institute for Educational Planning http://www.unesco.org/iiep
B. Case study 2 – Wenzhou
In Wenzhou, the general research design included for datacollection included two key schools, two ordinary schools and two averageschools located in Lucheng District of the central city of Wenzhou and inthe suburban county of Pingyang. Wenzhou is a prefectural city governingthree districts in the central city, two county cities, and six counties. It liesin the south-east of Zhejiang Province with a total area of 11,784 squarekilometres and a population of 7 million people . In the early 1980s, therapid economic growth in Wenzhou was summarized in China as the‘Wenzhou Model’, and contrasted with the ‘Zhujiang Delta Model’ inGuangdong Province and ‘South Jiangsu Model’ in Jiangsu Province. Themain features of the ‘Wenzhou Model’ are:
(i) household-based production and private enterprise; (ii) a strong market-oriented system of distribution;(iii) a decentralized economic management system featured by ‘small
government, big market’ and ‘wealth lies in the private sector’.
During the 1980s, Wenzhou was famous for its production ofillegal copies of manufactured products as the first stages of rapideconomic growth took place. Subsequently, local government has begunto emphasize the need to develop new products and put quality high onthe agenda to start a new phase of local economic development.Educational investment in secondary schools is regarded as importantfor this reason.
In the 1990s, schools were encouraged to generate more and more‘non-budget’ income. This is consistent with more general changes inthe Wenzhou economy that have allowed more autonomy to individuals,and organizations to take advantage of the opportunities provided by the‘socialist market economy’. The case studies show how this is affectingsome schools in Wenzhou.
Lucheng District
Lucheng District is in the centre of Wenzhou city. It has an area of88 square kilometres, 8 per cent of the total city area, and a populationof 477,000 (43.5 per cent of the total for the city). In 1994, its GNP wasY3,350 million, 30 per cent of the total GNP in the whole Wenzhou area;public revenue was Y303 million, (9 per cent of the total GNP), of whichabout 50 per cent was distributed for use by district governments.Primary industries accounted for about 2 per cent of GNP,
227
Secondary school financing in China:the new economics of schooling

International Institute for Educational Planning http://www.unesco.org/iiep
manufacturing production 54 per cent and service-sector activity 44 percent. Little manufacturing is state owned. Most (74 per cent) iscollectively owned, with about 25 per cent in the hands of individualsand private ventures. There are few joint ventures. Over 40 per cent ofservice-sector activity is individually owned and 19 per cent collectivelyowned. The non-state-owned economy is therefore the dominant force inits economic life.
There are two types of school in Lucheng District. Some schoolsare controlled by the city government; the others are district schoolsunder the district authorities. Table 8.20 profiles the school system.
Table 8.20 Profile of Lucheng school system, 1993, 1994, 1995
228
Financing secondary education in developing countries
Number Classes Enrolment Graduates Total Teachers Pupil/ Average Teachers of staff teacher class per
schools ratio size class
1993
Senior 1 6 235 156 39.2Junior 4 95 4,728 782 355 268 17.6 49.8 2.8Primary 64 948 46,107 6,268 1,896 1,726 26.7 48.6 1.81994Senior 1 6 217 63 36.2Junior 5 95 4,947 1,352 383 268 18.4 52.1 2.8Primary 63 962 47,645 7,270 1,848 1,726 27.6 49.5 1.81995Senior 1 6 219 67 30 22 9.9 36.5 3.7Junior 4 99 5121 1,539 389 306 16.7 51.7 3.1Primary 62 960 47,427 8,932 1,872 1,731 27.4 49.4 1.8
Primary pupil/teacher ratios (PTR) average 28:1 and juniorsecondary about 17:1. Class sizes are around 50, except at seniorsecondary, where they are about 35. Teacher/class ratios are 1.8:1 inprimary and over 3.0:1 in junior secondary. PTRs have been decreasing,as have class sizes. The pattern of enrolments by grade for primary andsecondary schools is as shown in Table 8.21 for Lucheng.
Table 8.21 Enrolments by grade – Lucheng, 1995
Grade1 Grade 2 Grade 3 Grade 4 Grade 5 Grade 6 Staff TeachersPrimary enrolment 8,870 8,689 7,788 7,802 7,538 7,038 1,872 1,731Junior secondary Grade 7 Grade 8 Grade 9
1,148 1,733 1,568 389 306Senior secondary Grade 10 Grade 11 Grade 12
288 277 107 30 22

International Institute for Educational Planning http://www.unesco.org/iiep
229
Secondary school financing in China:the new economics of schooling
These enrolment figures indicate that numbers enrolled fall byabout 20 per cent from Grade 1 to Grade 6. Secondary entrants are about16 per cent of those completing primary. The numbers enrolled at seniorsecondary are very small – about 3 per cent of the cohort. Theimplication is that for this city area many pupils undertake secondaryschooling outside the district.
Pingyang County
Pingyang County is an agricultural county in Wenzhou with anarea of 1,050 square kilometres and a population of 780,000. It consistsof 16 townships (zhen) and 18 sub-districts (xiang). In 1994, its totalGNP was Y2,269 million. Public revenue was Y171 million (7.5 per centof the total GNP), of which 44 per cent was allocated to the county.Primary production accounted for 15 per cent of GNP, manufacturing56 per cent and service-sector activity 29 per cent. Collectively owned(47 per cent) and individually owned (49 per cent) enterprises controlmost production.
Shuitou Township and Aojiang Township, where sample schoolsare located, are ranked as the top two areas in total revenue, and third andfifth respectively in per-capita income. In 1994, the industrial output ofShuitou was 20 per cent of the county total and in Aojiang 26 per cent.Table 8.22 profiles the school system.
Class sizes in secondary schools are around 50:1 and at primaryabout 38:1. Class sizes are significantly smaller in rural primary schools.The number of non-teaching staff was not available for Pingyang, so itis not possible to calculate PTRs and teacher/class ratios, except usingthe number for all staff. When this is done it seems that PTRs declinedand teacher/class ratios increased between 1993 and 1994. Table 8.22profiles the system.

International Institute for Educational Planning http://www.unesco.org/iiep
1. The case-study schools
The overall enrolments and staffing of the case-study schools aregiven below in Table 8.23. All the schools are general secondary schoolswith junior and senior secondary grades, except school D, which hasjunior secondary enrolments only. Schools E and F are in semi-rurallocations. Enrolment rates are claimed to be well over 90 per cent forboth primary and junior secondary schools. Schools A, B, C and D arein Wenzhou and schools E and F are in Pingyang.
Table 8.23 Enrolments, staffing and pupil/teacher ratios, 1995
Table 8.22 Profile of Pingyang school system, 1993, 1994
230
Financing secondary education in developing countries
Schools Classes Enrolment Enrolment Grades New Total PTR Average Teacher/ total girls enrolments staff (total class class ratio
staff) size (all staff)
1993Generalsecondary 46 572 29,480 12,625 7,753 11,166 2,251 14.0 51.5 3.9Town 35 474 24,661 6,765 9,223 52.0Rural 11 98 4,819 988 1,943 49.2Primary 372 2,025 77,532 35,784 13,445 13,580 3,225 24.0 38.3 1.6Town 22 1,370 55,352 9,846 9,606 40.4Rural 150 655 22,179 3,599 3,974 33.91994Generalsecondary 47 622 32,549 14,011 8,239 13,474 2,521 12.9 52.3 4.0Town 35 516 27,320 7,070 11,077 52.9Rural 12 106 5,229 1,169 2,397 49.3Primary 344 1,995 76,035 34,972 14,763 13,960 3,463 21.9 38.1 1.7Town 214 1,354 54,415 10,898 10,029 40.2Rural 130 641 21620 3,865 3,931 33.7
School Enrolment total Total staff Retired staff Students/total staff
A 1,754 146 69 12.0
B 1,668 138 71 12.1
C 1,096 91 17 12.0
D 1,348 120 2 11.2
E 1,446 13.1
F 1,608 15.5
From Table 8.23 we can see that average pupil to total-staff ratios inthese schools are between 11:1 and 16:1. Three of the case-study schools

International Institute for Educational Planning http://www.unesco.org/iiep
231
Secondary school financing in China:the new economics of schooling
have experienced falling enrolments and three have seen increases. Totalenrolments increased by about 6.2 per cent between 1993 and 1995. Whatwill happen to secondary enrolments in future is uncertain. If fee-payingexternal students are encouraged, or at least left to the market to decide ontheir volume, Wenzhou’s geographic and economic position will probablyensure that numbers grow, since the schools are very attractive to outsidersin areas where secondary schooling is restricted in access and poor inquality. If enrolment is restricted to the local population, then growth innumbers is likely to be slow, except perhaps at upper secondary.
2. The education financing system
The administration of public schools is based on local-levelauthorities, with prefectural, county and district government (in thecentral city); and township and xiang government (in the countryside)sharing the responsibility of financing and management of the schools.There can be various types of school located in one area. In LuchengDistrict, there are prefectural city schools and district schools. They arefinanced and managed by different levels of government.
The funding process for public schools is essentially as follows:first, the Education Commission in each level of government submits aneducation service budget to the Bureau of Finance at the samegovernment level every year. This includes a staff budget, a non-salarybudget and a development budget. The Bureau of Finance submits therevised budget to the People’s Congress at the same level for approval,after considering whether it meets criteria for balanced investment andcan be afforded. Once the budget is approved by the Congress, the finalbudget will take effect with the Education Commission responsible fordistributing the money to each school.
3. Income
Currently, it is normal for publicly funded schools in Wenzhou toreceive only 50-60 per cent of their total incomes from the public budget.The public budget for each school is decided according to estimatesmade for a number of categories, which include salaries; salarysupplements; staff welfare; pensions8; student-support allowances; a
8. Retired teachers remain on the payroll of the school which provides their pensionpayments.

International Institute for Educational Planning http://www.unesco.org/iiep
non-salary component; and various earmarked grants for specialpurposes. Salaries and salary supplements normally account for over70 per cent of the budget income, and pensions for most of theremainder. About 15 per cent is allocated to non-salary categories.
Education authorities are partly funded by tax levies onbusinesses, turnover taxes on enterprises and payroll taxes. These arecollected centrally and a proportion of total revenue is earmarked foreducational support. This appears to be around 5 per cent of the totalrevenue in Wenzhou. Different systems operate in rural and urban areaswhich provide the ‘additional educational expenses allowance’, whichsupplements the main education budget. In the past two years this hasadded about 12 per cent to the allocations made. In practice, rural areastend to generate less through this route, since it is difficult to tax all butstate organizations effectively. Urban areas probably benefit more, bothbecause they have much greater economic levels and because revenuecollection can be more efficient. There does not appear to be mucheffective cross-subsidy of poor areas by rich areas under the existingsystem. This is consistent with policy which currently encouragesdifferentiation between areas as part of growth strategies that permitgrowing inequalities.
Non-budget income arises from tuition fees and other charges;income from school-owned enterprises and contributions from schoolbusinesses (to which students may contribute through their labour, butwhich usually have employees); donations; and other income sources,including rental charges and various fees for services; and interest onbalances. These together provide the non-budget income categories.
Charts 8.1 and 8.2 show the growth of incomes from budget andnon-budget sources in five of the six sample schools for which data areavailable over the period 1993 to 1995.
232
Financing secondary education in developing countries

International Institute for Educational Planning http://www.unesco.org/iiep
233
Secondary school financing in China:the new economics of schooling
Chart 8.1. Income from budget sources in sample schools, 1993-1995 (Yuan)
Chart 8.2 Income from non-budget source in sample schools, 1993-1995 (Yuan)
Growth in budget income slowed in 1994/1995 when compared to1993/1994. A significant pay award was responsible for some of theincrease in 1993/1994. On average, the increase in budget income inthese schools was about 42 per cent 1993-1995. Non-budget income
0
50,000
100,000
150,000
200,000
250,000
300,000
A B C D E
1993 1994 1995
0
40,000
80,000
120,000
160,000
200,000
A B C D E
School
Yua
n
1993 1994 1995

International Institute for Educational Planning http://www.unesco.org/iiep
grew differently, with substantial increases in 1994/1995. This hasenabled further growth in staff incomes, as more of the salary costs havebeen transferred to non-budget income. Average increases over theperiod were about 133 per cent.9 Non-budget income thus represents agrowing proportion of total income. It is now the major component inthese schools and was more than 58 per cent of the total in 1995.
Budget income is largely fixed by a formula-funding allocation. Thisis interpreted when an overall increase has been decided on for the educationbudget each year. The formula is driven essentially by the number of staff(including pensioners) and the school enrolments. The rate of increase in themultipliers has been held stable over the last year, thus contributing to theshift in income between budget and non-budget expenditure.
As noted above, the non-budget income is derived from severalmain sources – tuition fees, contributions from enterprises and schoolbusinesses, donations, and balances and interest payments on thesebalances. Tuition-fee income is regulated by district, city and countyguidelines. It varies between places. According to a document issued byWenzhou Price Control Bureau, Bureau of Finance and EducationCommission in August 1996, the official criteria of tuition fees and othercharges for the Wenzhou area were as follows:
Yuan/per student per term:Primary 35 20 (for students from poor xiang)Junior secondary 60 40 (for students from poor xiang)
General senior secondary schools’ tuition fees and other charges:Wenzhou secondary school (high status) 260Wenzhou No. 2 secondary school and Ouhai Key School 240Ordinary senior secondary schools 180
Much higher fees are charged to students from outside Wenzhou.Most urban schools are able to attract these students as there isconsiderable excess demand. In one of the case-study schools, forexample, between 10 per cent and 15 per cent of all students are fromoutside the catchment area. These students pay on average Y5,600 to beenrolled for three years as an entrance fee and this generates aboutY1 million per year in this case-study school – by far the largest part ofthe non-budget income. In Wenzhou city, entrance fees as high as
234
Financing secondary education in developing countries
9. This average, which excludes one outlying school, biases these results upwards. Withthis school the rate of growth of budget income was about 68 per cent and of non-budgetincome 211 per cent.

International Institute for Educational Planning http://www.unesco.org/iiep
Y100,000 are not unknown for entry to the most prestigious schools.This practice is formally illegal, but nevertheless widespread. Incomefrom this source therefore tends to be reclassified as donations ratherthan tuition, or under a miscellaneous category. It is the major source ofnon-budget income for most of the schools in this case study.
Only one of the schools in the sample in Wenzhou has a school-run business. Most schools in this area have decided that it is difficult torun competitive businesses that are profitable, since they are surroundedby a very entrepreneurial community. The hypothetical benefits – e.g.tax-free status, ability to borrow money, etc. – are not compelling inWenzhou, since the large informal economy effectively provides thesame benefits to many household businesses. Unlike Beijing, rentalincome in the case-study schools is small. Most have very limited landand buildings available. Demand for space is much weaker than inBeijing and high rents are generally not available.
The balances held by schools appear to be growing. On the basis ofthe data available, income exceeded expenditure in the case-study schoolsby 12 per cent, 15 per cent and 29 per cent in 1993, 1994 and 1995,respectively.10 In 1995, total balances accounted for about 13 per cent oftotal recurrent expenditure at the end of the fiscal year. The fiscal year doesnot coincide with the school year and income tends to be greatest at thebeginning of the school year. Expenditure, on the other hand, is distributedthroughout the year. Minimum balances may therefore be smaller thanthey first appear. Nevertheless, fiscal-year balances are increasing. Interestis earned on school-fund balances and contributes to income, thoughinterest rates for short-term deposits are small.
4. Expenditure
There are two main classifications of school expenditure in China:staff expenditure on salaries, and non-salary expenditure. Non-salaryexpenditure is mainly used for general school running costs. Schoolfinancial returns to the superior authorities distinguish between budgetexpenditure and non-budget expenditure under both these categories.The appendix contains details of sub-categories used. Chart 8.3 showsbudget expenditure by category and Chart 8.4 non-budget expenditure.
235
Secondary school financing in China:the new economics of schooling
10. Fiscal year.

International Institute for Educational Planning http://www.unesco.org/iiep
Chart 8.3 Budget expenditure by category, 1993-1995
Thus budget expenditure is overwhelmingly salary related, withsmall amounts available for other purposes. The growth of salarycontributions dominates this expenditure.
Non-budget expenditure can be classified under four overall headings– salary supplements and staff-welfare payments; school-improvementcosts; administration and professional development; and othermiscellaneous expenditure. The result of recent trends is shown in Chart 8.4.Non-budget expenditure is also predominantly concentrated on salaries andother benefits for teachers. The growth in salary subsidies in 1995 is evident.
Chart 8.4 Non-budget expenditure, 1993-1995
0
50,000
100,000
150,000
200,000
250,000
Welfare+Sals Sch. Improvement Admin. + prof. dev. Others
Non-budget expenditure
Yua
n
1993 1994 1995
0
50,000
100,000
150,000
200,000
250,000
Salary Sal. subsidy Welfare Pensions Studentsupt
Admin. Equip. Repairs Prof. devt Other
Budget expenditure
Yua
n
1993 1994 1995
236
Financing secondary education in developing countries

International Institute for Educational Planning http://www.unesco.org/iiep
Chart 8.5 Total income and total expenditure, 1993-1995
A school-by-school analysis reveals that total income exceededexpenditure in all the case-study schools on which there were adequatedata in every year (see Chart 8.5). It is also true that the amount of surpluswas growing from around 11 per cent to as much as 30 per cent in 1995.11
Salary expenditure appears to account for between 56 per cent and81 per cent of total expenditure in the case-study schools and theproportion has been growing. It is clear that the bulk of salary increaseshave been funded from non-budget income. Most schools have seen thenon-budget contribution to salaries grow by more than 100 per cent overtwo years. Expenditure on salaries from non-budget sources in five ofthe six schools was between 36 per cent and 45 per cent of totalexpenditure in 1995 and has probably risen since. Conversely, non-salary expenditure from budget sources fell sharply in most schools as aproportion of budget expenditure to between 5 per cent and 15 per cent.
Staff income as opposed to salary is available for four schools.The highest average income per teacher is over Y14,000 per annum permonth, and the lowest Y8,600. Some of the difference is explained bythe distribution of teachers according to seniority. The largest part of thedifferences arises from the amount of non-budget income to subsidizesalaries. It is clear that these differences have been growing rapidly. Theratio of total income to budget income for salaries is over 1.8:1 in someschools, illustrating how much they have come to depend on non-budgetincome to supplement salaries in the past three years. Table 8.24 shows
0
50,000
100,000
150,000
200,000
250,000
300,000
350,000
400,000
450,000
500,000
1993A
1994 1995 1993B
1994 1995 1993C
1994 1995 1993D
1994 1995 1993E
1994 1995
School
Yua
n
Expenditure Income
237
Secondary school financing in China:the new economics of schooling
11. Noting that this is a fiscal-year surplus not a school-year balance.

International Institute for Educational Planning http://www.unesco.org/iiep
income from different sources for four case-study schools. These figurescan be compared with the average public-sector salary (Y6,296 in 1994)and the average salary of education-sector professional staff (Y6,197 in1994).
Table 8.24 Average incomes from budget and non-budget sources inYuan, 1993-1995
238
Financing secondary education in developing countries
School Year Average annual income Average annual Ratio of total average of all professional total income from income to budget
staff from the budget and non- income for salariesbudget budget sources
A 1993 4,284 5,186 1.2
1994 7,009 7,639 1.1
1995 8,077 14,705 1.8
B 1993 4,272 5,538 1.3
1994 6,868 8,048 1.2
1995 7,068 12,924 1.8
C 1993 4,470 6,869 1.5
1994 6,153 9,514 1.5
1995 6,750 13,350 1.9
D 1993 3,394 5,215 1.5
1994
1995 5,488 8613 1.6
In principle, there is a limit to the amount of non-budget incomethat can be used to supplement salaries. The equivalent of an additionalthree and a half months’ basic salary can be paid if the income is availableto support it. Above this, a 66 per cent tax is supposed to be levied withthe proceeds to the relevant administrative level. As with other taxlegislation it is not clear that this is widely and effectively enforced.
In Wenzhou, costs per student are measured by four differentmethods:
(i) annual recurrent unit costs/student = (total annual expenditure –capital expenditure)/No. of students;
(ii) annual budgetary expenditure/student = expenditure (budget)/No.of students;
(iii) annual recurrent non-salary expenditure/student = non-salaryexpenditure/No. of students;
(iv) annual recurrent non-salary expenditure (budget)/student = non-salary expenditure (budget)/No. of students.

International Institute for Educational Planning http://www.unesco.org/iiep
Table 8.25 shows the unit costs of six sample schools for 1995.Overall unit costs per student vary from Y1,992 to Y1,010.12 Non-salaryexpenditure is between 19 per cent and 43 per cent of the total. Non-budget expenditure can be as much as 64 per cent of the total.
Table 8.25 Unit costs of six sample schools by type in Yuan, 1995
239
Secondary school financing in China:the new economics of schooling
(1) (2) (3) (4)Total recurrent Total recurrent Total non-salary Total non-salary Percentage Percentage
expenditure budgeted recurrent budgeted non-salary non-budgetper student expenditure expenditure expenditure expenditure expenditure
per student per student per student 3/1 (1-2)/1
A 1,992 1,090 496 145 25 45
B 1,660 1,012 310 147 19 39
C 1,526 735 312 69 20 52
D 1,010 608 243 119 24 40
E 1,805 648 780 13 43 64
F 1,083 522 438 30 40 52
5. Issues arising from the Wenzhou case study
A range of issues are raised by these case-study data. First, theyconfirm that two trends appear to be gathering momentum. Non-government funding is growing in importance as a source of secondary-school finance, and salary payments are occupying a greater share oftotal expenditure. The former may lead to greater disparities in incomeand expenditure per student between schools. The majority of schools inWenzhou do seem to have benefited from the mobilization of increasedresources. However, more remote schools and those in poor areas areunlikely to have improved their conditions relative to schools withaccess to substantial sources of additional revenue. A general increase independence on non-budget income has to be considered problematic forschools if they are located in areas where surplus income is scarce andeconomic activity relatively sluggish.
Drift towards greater proportions of salary expenditure may resultin poorer rather than better learning conditions. If the consequence issmaller allocation to learning materials and to other inputs to the qualityof the school environment, this is likely. Some safeguards are in place,which are designed to protect expenditure on learning quality.
12. School D only has junior secondary students and this is why its costs are low. School Fhas upper-secondary grades.

International Institute for Educational Planning http://www.unesco.org/iiep
In Lucheng in 1994, all schools were required to transfer 40 per cent ofnon-budget income to the District Education Commission, which wasreturned as earmarked grants under different categories. The remaining60 per cent was directed to be split between improving teachingconditions (60 per cent) and staff welfare (40 per cent). The arrangementin 1996 was that 10 per cent of non-budget income was to be passed onto the District Education Commission for earmarked allocation and theremaining 90 per cent allocated 60:40 to teaching conditions and staffwelfare. In Pingyang the proportions are 70:30.
The State Council, State Education Commission, State PlanningCommittee and Ministry of Finance have jointly issued regulationsconcerning the charges that can be levied in different types of school.For the compulsory education period up to Grade 9 no tuition fees arepermitted. The condition for other charges is that they should berestricted to a proportion of the school’s non-salary budget as approvedby the Provincial Government. It is intended that income from othercharges should only be used to complement deficits in the school’s non-salary expenditure. In general, senior secondary schools’ and vocationalschools’ tuition fee rates should be fixed as a proportion of the unit costper student and should be subject to the approval of ProvincialGovernment. Thus, the tuition fee for an upper-secondary student isintended to be no more than 25 per cent of the unit cost per student.Students from poor families should be offered remission of tuition feesand other charges.
Second, the greatest proportions of non-budget income inWenzhou arise from payments by students from outside schoolcatchment areas. These payments are often classified as donations ratherthan tuition fees. Control over the level of these donations appears adhoc as legislation is apparently ineffective. This clearly has someimplications for access to secondary schools and patterns of futureenrolment rates. In principle there is no direct link between higherpayments by outside students and the achievement of universal accessfor all students, because primary and junior secondary are compulsoryby law. The existence of outside students means that students fromwealthy families can choose their schools by paying more money andstudents from poor families have no choice but to stay in local schools.
In Wenzhou, there is an informal understanding that only schoolsthat enrol all local students first are allowed to take outside students. Thepermitted proportion is three classes for local students and one class foroutside students. Schools in central city districts attract students from
240
Financing secondary education in developing countries

International Institute for Educational Planning http://www.unesco.org/iiep
suburban towns and town schools take students from rural areas. This isdue to the difference in quality between schools. Though unit fundingfrom the government is approximately the same at the local level, otherincome and expenditure are not. It is clear that students with a poorfamily background and/or from remote rural areas in disadvantagedplaces are not likely to be enrolled as ‘choice students’. This would seemto violate the principle of ‘equal opportunity for all students’.
Third, government policy stipulates that compulsory educationexpenditure should increase faster than government recurrent incomeand budgetary expenditure per student should increase year on year.However, at the school level, government budget funding essentiallydepends on an incremental approach in which schools are guaranteed theprevious year’s funding, supplemented by an appropriate increase. Therate of increase is basically in line with the average rate of increase ofthe general government education budget. There is no direct linkbetween school efficiency and government funding decisions. Thegovernment’s control of school efficiency through the fundingmechanism is still weak, except insofar as it places more and more of theburden on local communities to make up the difference between thebudgeted contributions and actual expenditure.
Fourth, it is clear that the schools in the sample are unlikely to betypical of the broader range of schools. The case-study schools aretypical of urban schools, most of which derive much of their off-budgetincome from ‘choice’ students and appear to enjoy a surplus of incomeover expenditure. Even poorer-quality urban schools attract ‘choice’students from rural areas where there is a shortage of places at secondarylevel, especially for the upper-secondary cycle.
Fifth, the State Education Commission has issued a note on theprinciples of compulsory education provision, which makes it clear thatthe implementation of compulsory education is firstly the responsibilityof the local government, which has a duty to provide adequate resources,including financial support and qualified teachers, for schools. All publicschools within the compulsory education cycle are expected to adhere tothe principles of ‘free of tuition-fee charges’, ‘proximity enrolments’ and‘equal opportunity’. The note suggests that no clear or disguised form ofoutside students are to be allowed at this level in the future and that therewill be a deadline for schools which have outside students, to stop thisarrangement in future. The suggestion is that if there are students whostill want a choice of school, their options will lie in the private schoolsystem.
241
Secondary school financing in China:the new economics of schooling

International Institute for Educational Planning http://www.unesco.org/iiep
These case-study accounts from Wenzhou draw attention to someof the main dilemmas invoked by recent changes in policy and practice.The success of policy changes in increasing school income is evident inthe schools studied. The disadvantages arising from increased emphasison non-budget income are recognized. So also are the problems thatarise from increased numbers of ‘choice’ students. Whether the proposednew conditions will succeed in providing secure and equitable fundingfor all schools remains to be seen. The immediate consequence for someschools which have enjoyed considerably enhanced funding may be areduction in income as ‘choice’ students are reduced. It is not clear howthe revenue foregone will be replaced in more equitable ways whichbenefit all schools.
6. Summary conclusions
The major benefits associated with the new systems of financingof secondary schools in China can be summarized under a number ofdimensions. Schools which have some or all of the followingcharacteristics are able to increase their income considerably: favourablelocation; land/buildings which can be rented; excess demand for places;and entrepreneurial management. This has resulted in substantialincreases in expenditure per student in these schools. It has also meantthat public funding has diminished as a proportion of the total, to theextent that off-budget revenue can be larger than that provided by thestate. Amongst other things, this has enabled these schools to enhanceteachers’ total income, albeit that pensionable salaries have not increasedmuch. It is argued that this enables these schools to attract and retain themost qualified and experienced teachers. The additional income raised ispartly allocated to improve educational quality through greater spendingon learning materials and classroom environment, though the largerproportion seems to go towards improving conditions for teachers. Thenew arrangements seem to have intensified competition between schoolsto attract students, since this has a direct effect on school income. It mayhave increased pressure on schools to improve quality in order not tolose students to other schools. It is clear that the emerging practice ofrecruiting students from rural and semi-rural areas into city schools isgenerating substantial amounts of income for some urban schools. It alsoseems to be the case that the ability of the local authorities to regulatefee payments by local and out-of-area students is limited.
242
Financing secondary education in developing countries

International Institute for Educational Planning http://www.unesco.org/iiep
The new freedoms to finance secondary schools from a variety ofsources have resulted in several problems emerging. There are growingdisparities in funding between schools which arise from location,inherited physical assets, academic reputation, and management quality.This means that the gap in expenditure per child at secondary level israpidly widening. There is also concern that direct costs to parents arerising as schools charge higher fees and these are consuming risingproportions of family income. This also has an effect on the compositionof enrolment and persistence in school. Access to secondary school,especially at the upper-secondary level, is becoming more and morelinked to the ability of parents to pay. There is concern that schools thatare not favourably located and cannot attract fee-paying students, maysuffer deteriorating quality. Their ability to improve learning conditionsis constrained by growth in public funding alone. There is a risk thatsome of their most effective teachers will move to schools that can offergreater rewards.
Other difficulties which have been noted are that some schoolleaders may overemphasize revenue generation at the expense oflearning conditions, e.g. where sports facilities and buildings are leasedout or sold, resulting in overcrowding, and where school run businessesbegin to occupy much of the time of senior management. Similarlystructured salary schemes that are related to teaching hours may bethought to encourage teachers to maximize income at the expense ofquality. Lastly, there are concerns that auditing procedures are weak andthat financial contributions may be being used to gain advantages inaccess to schools outside the regulations that have been established.
In conclusion, it can be seen from the case studies that an unusualdegree of freedom has been given to schools to raise revenue andmanage the resources of schools. The range of mechanisms adoptedprovides an illustration of what is possible. However, this system seemsto have benefited institutions with entrepreneural leadership andfavourable conditions. It may have done little to extend access tosecondary schooling to the majority.
243
Secondary school financing in China:the new economics of schooling

International Institute for Educational Planning http://www.unesco.org/iiep

International Institute for Educational Planning http://www.unesco.org/iiep
Introduction
Costa Rica has been able to provide high levels of access toprimary education for several decades. It also has a well-developeduniversity education system. Paradoxically, enrolment rates in secondaryschooling are not high compared to other countries at comparable levelsof development and improved access to secondary schooling hasstagnated. There are several reasons for the low enrolment rates at thesecondary level. It appears that policy and budgeting choices have beenmade, especially during the economically strained 1980s, that have ledto constraints on access and participation.
Costa Rica provides an interesting case to study in more detail,because it has a tradition of high performance on most social indicatorsand is widely regarded as an example of good government directedtowards meeting developmental needs. It also confronts a challenge ofhow to increase secondary enrolment rates to similar levels to those inother developing countries with which it is competing for foreigninvestment.
This chapter analyzes the development of the secondary-schoolsystem to provide a fuller understanding of the factors that haveinfluenced the evolution of secondary schooling. It is divided into fiveparts. The first will discuss the current Costa-Rican context and theimportance of education in terms of the country’s development. Thesecond will explore how participation in secondary schooling has grown
245
Chapter IX
Secondary education financing in Costa Rica: recovering the initiative
Francis Hutchinson with Keith M. Lewin1
1. This chapter was drafted by F. Hutchinson along the lines suggested by K. M. Lewin. Ithas been adapted and simulations added for inclusion into this book.

International Institute for Educational Planning http://www.unesco.org/iiep
since 1950 and how key indicators of performance have evolved. Thethird section analyzes data on educational finance and expenditure todevelop a picture of recent trends and constraints. The fourth examineswhat options are available which might lead to higher secondaryparticipation rates and identifies some of the cost implications that mightarise. The fifth presents the results of a simulation that projects forwardeducational costs for 15 years, on the basis of a number of differentscenarios, to establish which alternatives might be financiallysustainable.
1. The Costa-Rican secondary education system
Primary and secondary education is free in Costa Rica andguaranteed by the state to all citizens. The secondary-school system hastwo main streams – academic with about 80 per cent of the students, andtechnical with the remaining 20 per cent. Both streams have a set of corecourses, and then complementary courses specific to each. Thesecondary cycle is divided into two parts. Lower secondary covers thefirst three years of secondary for pupils with a nominal age range of 12-15 years. Enrolment is obligatory, but in practice attendance is notenforced. Students must successfully complete the third and final year inorder to proceed to upper secondary, which is not obligatory.
Upper-secondary schooling takes place over two or three years,depending on the stream. Academic schools enrol pupils over years fourand five of secondary; technical schools over years four to six. Pupils arenominally 16-18 years old, though significant numbers are over age as aresult of repetition.
The major objectives of upper-secondary schooling are seen asbeing both to prepare graduates to study at university level and to equipschool-leavers for the labour market. All students from the academicschools, and those from the technical stream, who wish to go touniversity, have to pass a set of nationally administered examinations,called the ‘Bachillerato’, at the end of their last year.
During the past 50 years, the state has provided the bulk of theeducation offered to its citizens and has met most of the costs frompublic funds. Private education is permitted and has grown during thepast 15 years. It now provides school places for about 10 per cent ofpupils at secondary level and is funded through tuition fees.
246
Financing secondary education in developing countries

International Institute for Educational Planning http://www.unesco.org/iiep
Secondary education financing in Costa Rica:recovering the initiative
247
2. General context
Costa Rica’s social development achievements are well knownand the country stands out as one that has achieved high levels ofperformance on development indicators (e.g. the UNDP HumanDevelopment Index) at income levels below those of a significantnumber of other developing countries in the Americas. Literacy, lifeexpectancy and income-distribution indicators suggest that Costa Ricahas managed the development process effectively. The basis for CostaRica’s development strategy was established in the late 1940s and isasserted to depend upon an enlightened political leadership, a competentpublic sector, and an established consensus on key elements of socialdevelopment. Garnier et al. (1994) argue that: ‘social development wasnot seen by government authorities as an automatic result of economicgrowth or as something subordinate to it. Nor was social developmentseen as an end in itself, but as a necessary condition for consolidatingeconomic growth and as a central characteristic of the type of societythat they sought to build’.2
Access to education has always been seen as an integral part of thedevelopment process, both as an indication of successful developmentand as an investment for economic growth. It has consistently featuredas a priority in government policy. Primary education was declared freeand compulsory as early as 1869 and the state has made largelysuccessful efforts to extend provision of basic educational services to allparts of the country. An indication of the historic commitment toeducation is that during the period of sustained economic growth from1950-1979, the proportion of the government budget allocated to theeducation sector grew continuously and reached an impressive 5.7 percent of GDP by 1979.
This has resulted in a relatively well-educated population, and thisis demonstrated by various performance indicators. In 1995, the adultliteracy rate was 95 per cent and the gross enrolment ratio in primaryschool was over 100 per cent (Human Development Report, 1998). Thegross tertiary enrolment rate, at 32 per cent, is one of the highest in LatinAmerica (World Education Report, 1998).
As the education system has developed, the economic base ofCosta Rica has evolved and the characteristics of the labour force thatschool-leavers enter have changed substantially. Although the country is
2. Author’s translation.

International Institute for Educational Planning http://www.unesco.org/iiep
still reliant on traditional export crops like coffee and bananas forforeign exchange, industry and manufacturing have become increasinglyimportant. In 1997, agriculture accounted for 18 per cent of GDP, andindustry and services represented 29 per cent and 54 per cent of GDPrespectively. Costa Rica is now the most industrialized country inCentral America, with industry accounting for about half of allemployment. Agricultural employment decreased to about 20 per cent in1995 from 47 per cent in 1965.
The relatively high levels of educational attainment of the workforceand the country’s social stability have begun to attract inward foreigninvestment. Thus: ‘the relatively skilled labour force, easy access to thePacific and Caribbean coasts and political and social stability have attractedmultinational corporations producing pharmaceuticals, textiles, plasticgoods, electronics, beverages, and even computer services’ (EIU, 1997a).
The government has courted skill-intensive investment toencourage export-led growth based on high value-added (and usuallyknowledge-intensive) products. During the past three years, computercompanies such as ACER, Microsoft, and Intel have made sizeableinvestments in Costa Rica. Intel invested in a US $500 million microchipplant with the capacity to manufacture a third of the company’s globalproduction (EIU, 1997b).
However, future growth and a transition towards greater value-added production in the Costa-Rican economy could be constrained bysubstantial bottlenecks in the education system. While primary andtertiary enrolment rates are comparatively high, secondary enrolmentrates are lower than those in many other countries at similar levels ofdevelopment. Growth in industrial and service-sector employment,especially in jobs which depend on abstract thinking skills andknowledge most likely to be acquired from post-primary schooling, maybe limited if participation in secondary is not increased. The World Bank(1993) argues that increasing the availability of secondary education, inaddition to basic education, was a key part of East Asia’s success inattaining high stocks of human capital. In addition, further expansion inhigher education could be limited by the number of students succeedingin completing secondary schooling.
There may also be adverse consequences for equity and incomedistribution. Costa Rica is one of the more equitable societies in LatinAmerica. However, if a large part of the population fails to completesecondary education, inequalities may widen. CEPAL (1996) argues thatin Latin America it is necessary to acquire 10 or more years of educationin order to have a better than 90 per cent chance of escaping poverty.
248
Financing secondary education in developing countries

International Institute for Educational Planning http://www.unesco.org/iiep
Several conclusions can be made from Table 9.1. First, it can beseen that the majority of the countries in the group have GNP per-capitalevels that range between US$ 1,900-2,500, with Costa Rica at the lowerend. There are two outliers as Guatemala’s income, at US $900, isconsiderably below this, and Korea’s, at US $5,400, is considerablyhigher.
Second, with respect to average years of education, Costa Ricahas a relatively less educated population than most of these countries.Costa Ricans have on average 5.6 years of schooling. Most countries inthis group have between 6 and 7 years of education. Korea and Argentina
249
Secondary education financing in Costa Rica:recovering the initiative
Table 9.1 illustrates some comparisons between Costa Rica andother countries. Argentina, Chile, Mexico, and Uruguay were includedin order to compare Costa Rica’s performance with other Latin-American countries that have well-developed education sectors and areat a comparable income level. Guatemala was chosen to give anindication of the educational attainments in the other Central-Americancountries, and Korea and Malaysia were included to give an idea of theeducational endowments of East-Asian countries that have been able toattract sizeable quantities of skill-intensive foreign investment.
Table 9.1 GNP per capita, percentage completing different levels ofeducation and average years of schooling – selectedcountries, 1990
GNP per Completed levels of education among Average
Country capitathe population aged 15+ (%) years of
(current schoolingUS $)
No school Primary Secondary Tertiary
Argentina 2,370 4.8 51.2 30.7 13.2 8.1
Chile 1,940 6.1 50.1 33.7 10.1 6.7
Costa Rica* 1,900 11.1 59.8 16.1 13.0 5.6
Guatemala 900 44.7 40.5 11.1 3.7 3.0
Mexico 2,490 13.7 42.8 35.0 8.5 6.7
Uruguay 2,560 4.6 49.6 35.5 10.4 7.1
Korea 5,400 8.0 16.1 61.9 13.9 9.9
Malaysia 2,320 19.4 45.4 31.8 3.3 6.0
Median 2,345 9.6 47.5 32.8 10.3 6.7
World Development Report (1992-) and Barro and Lee (1997).*This is also largely consistent with data obtained from the UNESCO Statistical Yearbook (1996-).

International Institute for Educational Planning http://www.unesco.org/iiep
Financing secondary education in developing countries
250
have considerably more, and Guatemala considerably less. However,Costa Rica’s average educational attainment is closer to the groupaverage of 6.7 years than it is to Guatemala’s endowment of 3 years. Ifforeign investment is to be attracted - which assumes higher rather thanlower levels of educational endowment - then it is the countries withhigher average levels of education in the labour force which are potentialcompetitors, all other things being equal.
Third, Costa Rica has an atypical structure of educational output.It has the highest proportion of the population completing primaryeducation (59.8 per cent), and a very high proportion of people whocomplete tertiary education (13 per cent). Only Argentina and Koreahave a greater proportion of people who complete tertiary education. Yet,Costa Rica has the smallest percentage with complete secondaryeducation (16 per cent), except for Guatemala, which has the lowestperformance on this indicator. Costa Rica’s rate is half of the medianvalue of 32 per cent. Most countries in the group have the highestproportion completing primary, less completing secondary, and the leastcompleting higher education. Korea has reached a higher level ofparticipation, where most complete secondary.
It would also appear that Costa Rica invests at or above averagelevels of resources in education. With regard to public educationexpenditure as a percentage of GNP, it spent 4.5 per cent in both 1985and 1995, versus a regional average of 3.9 per cent and 4.5 per centrespectively. In terms of public spending on education in relation togovernment expenditure, Costa Rica spent 22.7 per cent and 19.9 percent of its budget in 1985 and 1995. This is significantly more than theregional average of 15.5 per cent and 14.5 per cent for those two years(calculated using World Education Report, 1998).
This implies that in spite of substantial public investment, theexpected development is not occurring evenly at all levels of the system.Most worrying perhaps is the fact that progress in increasing secondaryparticipation in Costa Rica has not been consistent. Secondaryparticipation actually decreased during the 1980s. The gross enrolmentrate fell from 62 per cent in 1980 to 49 per cent in 1988.3 It also fellrelative to progress in other countries in the region. Out of 17 Latin-American and Caribbean countries, Costa Rica was only one of threethat experienced a decline in secondary enrolment ratios during the1980s (Maldonado, 1994).
3. This topic has been the subject of some research. See: Reimers, 1990; Carnoy and Torres,1992; and Montiel et al., 1997.

International Institute for Educational Planning http://www.unesco.org/iiep
Secondary education financing in Costa Rica:recovering the initiative
251
There is an obvious association of the setbacks in enrolment-ratiogrowth with the economic austerity which affected Costa Rica in the1980s. However, it is not obvious why secondary-school participationshould have been affected more than other parts of the education system.In a more general sense, the Costa-Rican social model has proven to bequite robust. Indeed, indicators of development such as literacy and lifeexpectancy kept improving during the period of recession.
The next section examines the development of secondaryenrolment rates in more detail and relates these to other key educationindicators in order to deepen understanding of the patterns observed.
3. Enrolment indicators
Chart 9.1 shows the development of gross enrolment rates (GERs)since 1950. From this it is clear that 100 per cent primary GER wasreached by 1960 and exceeded this value up until the early 1980s. It fellback to around 100 per cent by the mid-1980s and then recovered. Thesecondary GER grew quickly and consistently from around 6 per cent to62 per cent by 1980. This positive trend ended abruptly. Between 1980and 1988, the rate fell steadily to 48.6 per cent before stabilizing andthen growing again during the 1990s. By 1997, the GER had recoveredto 60.9 per cent, which is considerably above 1988 levels, but still not atthe level attained in 1980.
Chart 9.1 Primary and secondary enrolment rates, 1950-1997
Author’s calculations based on MEP 1998b, 1991, 1969; Torres, 1974; and Expansión del sistemaeducativo en Costa Rica, 1997-.
0
20
40
60
80
100
120
1950 1954 1958 1960 1966 1970 1974 1978 1982 1984 1990 1994 1998
Year
Gro
ss e
nrol
men
t rat
es
Secondary Primary

International Institute for Educational Planning http://www.unesco.org/iiep
It is clear that the systematic progress in increasing secondaryenrolment rates from 1950-1980 was interrupted for a decade duringwhich participation diminished. The growth trend was reversed. Ifgrowth had continued after 1980 along the trend established, thesecondary GER would have reached 80 per cent by 1997 – a level similarto those found in Argentina and Uruguay.
It is very significant that Costa Ricans have had nearly universalaccess to primary education since 1960, but that after nearly 40 moreyears, much less than half of all students complete secondary school.Secondary school enrolment rates have grown with a lag over those atprimary, as might be expected. However, growth in secondary enrolmentrates appears to have stagnated for nearly 20 years. This suggests thatstructural factors may be significant, and that a bottleneck is emergingthat will restrict the numbers of secondary-qualified leavers entering thelabour market and continuing to study at higher levels.
Some insight into where the constraints lie can be obtained froman analysis of enrolment rates by grade. Chart 9.2 shows these rates forthe last year of primary (6th grade), and the 1st and 5th year4 ofsecondary. Two things are striking. First, the gap between enrolmentrates in 6th grade and the 1st year narrows and actually disappears byabout 1990. From then on, enrolments in the first year of secondary aregreater than they are in the last year of primary.5 When there was a gap,this could have signalled the existence of a capacity and/or accessproblem. This now seems unlikely to provide much of an explanation forcurrent patterns of enrolment rates.
Table 9.2 shows how growth rates in the secondary grossenrolment rate have fluctuated since 1950.
Table 9.2 Growth rates (%) in secondary GER over five-year periods
252
Financing secondary education in developing countries
4. Since 80 per cent of students finish secondary school in 5 years, this is taken as the lastyear of secondary.
5. This could result from more repetition in the first year of secondary than in the last yearof primary, or a result of primary school-leavers returning to enter secondary schools asover-age pupils. However, the fact that more are enrolled in the first year of secondarythan the last year of primary suggests that availability of places in the first year ofsecondary is not a significant problem.
1950-1954 1955-1959 1960-1964 1965-1969 1970-1974 1975-1979 1980-1984 1985-1989 1990-1994 1995-199719.0 9.7 3.0 7.1 9.3 2.8 –2.9 –1.1 3.1 1.7

International Institute for Educational Planning http://www.unesco.org/iiep
253
Secondary education financing in Costa Rica:recovering the initiative
Second, there is a huge gap between the GERs for the 1st and 5thyears of secondary school. This means that a large part of the populationthat enrols in the 1st year never reaches the 5th year. The chart showsthat enrolment rates in the different years of secondary school increaseat similar rates from 1950 to 1980. From then on, they diverge rapidly.By 1996, 95 per cent of those completing primary were enrolled in thefirst year of secondary. Only about 30 per cent of the relevant groupsucceeded in reaching the fifth year of secondary school.
Chart 9.2 Enrolment rates, 1957-1996
Author’s calculations based on MEP 1998b, 1991, 1969; and Expansión del sistema educativo enCosta Rica, 1997.
The data imply that the main problem of secondary enrolment inCosta Rica is essentially one of retention rather than access. Thequestion is what are the factors that might be associated with attritionduring the secondary-school years and why does it appear to havereached higher levels than in some periods in the past? A possibleexplanation is that education in secondary schools is of doubtful quality.If this were true, and quality was thought to be declining, this might havean adverse impact on effective demand.
Some indicators of efficiency, which are proxy indicators ofaspects of quality, seem to indicate deteriorating performance. In 1980,about 47 per cent of students completed their secondary education infive-eight years and over half of them dropped out – usually beforecompleting lower secondary. In 1994, the percentage of childrencompleting their secondary education fell to 41 per cent and thosedropping out climbed to almost 60 per cent (MEP, 1996).
0
20
40
60
80
100
120
1957 1961 1965 1969 1973 1977 1981 1985 1989 1993Year
Gro
ss e
nrol
men
t rat
e
1st year 5th year 6th Grade

International Institute for Educational Planning http://www.unesco.org/iiep
Data on pass rates (Table 9.3), repetition (Table 9.4), and drop-out(Table 9.5) provide insights into other aspects of effectiveness andquality. First, it can be seen that performance is problematic on mostindicators. The pass6 rate has rarely climbed above 70 per cent and isoften below 50 per cent. This suggests that the performance of up to ahalf of all pupils falls below acceptable levels. If this is so, it implies thatschool quality is insufficient to assure many learners succeed inmastering the competences the curriculum specifies. Repetition anddrop-out rates average over 10 per cent in each year of secondary school.The drop-out from the first year often exceeds 20 per cent, suggesting amismatch between the expectations and capabilities of pupils and theability of schools to successfully manage learning.
Second, performance has deteriorated, most strikingly during the1980s. The 1970s appears to have been the period when most indicatorsshow the highest performance. In general, the levels achieved then donot appear to have been reached in either the 1980s or 1990s. Theaverage pass rate exceeded 70 per cent7 in the early 1970s and has sincedeteriorated to around 50 per cent. The greatest decline occurredbetween 1975-1979 and 1985-1990, when it fell from 66 per cent to54 per cent. The repetition rate has climbed from 10 per cent (1980-1984) to 13 per cent (1995-1997). Drop-out has increased from 12 percent in the late 1970s to 15 per cent in 1995-1996.
There is a common pattern across these indicators when analyzedby academic year. Generally, the first year has had the highest rates ofrepetition and drop-out and the lowest pass rates. The poor values ofperformance indicators in the first year are closely followed by thesecond year and then the fourth year. The third and fifth years havetypically had the best performance indicators. This is not accidental. It issignificant that the first and fourth years are the beginning of lower andupper secondary respectively. The statistics show that in 1996, almost aquarter of all students in the first year dropped out, and almost a fifth ofthem repeated. This further illustrates the seriousness of the retentionproblem.
254
Financing secondary education in developing countries
6. The pass rate used in this article refers to those students who have passed the requisitecoursework and examinations by the end of the academic year. It does not include thosestudents who re-take examinations and then pass.
7. The surge in pass rates during the 1970s was the result of a policy to eliminate abottleneck in the system by pushing people through rapidly (Dengo, 1995). Once thiswas done, the standards were raised again, as evinced by the fall in the pass rate.

International Institute for Educational Planning http://www.unesco.org/iiep
Table 9.3 Average pass rates over five-year periods for differentgrades in secondary school
255
Secondary education financing in Costa Rica:recovering the initiative
1967-1969 1970-1974 1975-1979 1980-1984 1985-1989 1990-1994* 1995-1997*Overall 56.2 74.2 66.2 59.7 53.6 55.6 50.11st year 55.6 82.6 95.0 70.2 49.6 49.2 42.52nd year 53.5 80.3 50.6 51.2 52.1 54.8 49.03rd year 53.4 62.5 56.9 57.4 56.4 61.9 55.74th year 56.9 58.4 51.4 50.8 47.4 50.3 45.15th year 68.2 76.0 69.1 67.1 62.5 71.4 65.8
MEP, 1994, 1991; and Aplazados, aprobados, y reprobados en el sistema educativo, 1997.*Academic Day Schools only.
Table 9.4 Average repetition rates over five-year periods fordifferent grades in secondary school
1980-1984 1985-1989 1990-1994 1995-1997
Overall 10.2 11.9 12.4 13.0
1st year 6.9 15.7 16.2 17.5
2nd year 15.4 14.7 12.8 13.3
3rd year 10.4 11.9 9.7 9.3
4th year 11.3 14.0 12.4 13.2
5th year 5.0 6.9 5.1 5.3
Source: MEP, 1994, 1991; and Repetición en el sistema educativo, 1997.
Table 9.5 Average drop-out rates over 5-year periods for differentgrades in secondary school
1964-1969 1970-1974 1975-1979 1980-1984 1985-1989 1990-1994 1995-1996
Overall 12.4 13.2 11.5 14.1 15.2 14.0 14.5
1st year 19.2 16.4 15.1 20 22.6 21.9 24.4
2nd year 9.6 10.8 14 17 13.6 11 10.9
3rd year 7.4 14.2 9.3 11.5 11.8 8.5 8.4
4th year 8.3 11.7 9.7 12.7 14.5 13 13.7
5th year 5.2 9.4 4.6 6.4 7.7 7.2 7.6
Source: MEP, 1994, 1991, 1968; and Deserción en el sistema educativo, 1998, 1997.
Third, it is plausible that there is a link between low performanceand propensity to drop out. At secondary level, there may be significantopportunity cost to remaining in school and there are certainly directcosts which fall on pupils and their families. If pupils’ performance ispoor and the chances of successful secondary completion low, drop-out

International Institute for Educational Planning http://www.unesco.org/iiep
may become more likely. Over 40 per cent of those who start do notcomplete the first three years of secondary (Table 9.5). This suggests thatthe system is very inefficient and that pupils are inadequately preparedand supported to meet the demands of secondary schooling. Researchdone by Solís and Rodríguez (1995) shows that there could be problemswith the current structure. Interviews with drop-outs revealed that theythought there were too many subjects and that the workload wasexcessive. Teachers also cited too much coursework as a factor instudents deciding to drop out. Clearly, if some part of the problem is dueto low pupil performance exacerbated by poor school quality, attemptsto reduce attrition in secondary schools must address issues of qualityand the appropriateness of the curriculum. Effective demand may alsodiminish if perceptions of declining quality have a basis in fact.
4. Educational financing and expenditure patterns
This section explores how government investment in educationhas developed. It is important to remind the reader of the wider contextin which the education system has evolved in Costa Rica. Thisconditions the factors that are likely to influence decisions made bystudents to enter and remain in secondary schools.
In brief, Costa Rica enjoyed a long and sustained period ofeconomic growth from 1950 to 1979. Between 1980 and 1982, thecountry experienced a serious economic crisis and GDP per capita lostabout 20 per cent of its value (DGEC, 1997). Recovery began in 1983,but the levels of GNP attained in 1979 were not surpassed until 1993.
This economic crisis had a number of direct social consequences.Poverty more than doubled between 1977 and 1983 and climbed from 13per cent to 30 per cent8 (World Bank, 1990). Similarly, theunemployment rate also increased from 4.5 per cent in 1978 to 9 per centin 1982 (DGEC, 1998). As a result, disposable incomes fell in manyhouseholds during the recession.
Reimers (1990) suggests that the decline in the number of studentsin secondary education and in the secondary enrolment rate may havebeen due to more adolescents entering the labour market earlier,attempting to supplement declining family income. It appears that non-heads of household increased their participation in the labour forceduring 1979-1982. During 1981-82 double the amount of people wereentering the labour force for the first time as compared to 1979-1980.
256
Financing secondary education in developing countries
8. Calculated in terms of access to the basic consumer bundle.

International Institute for Educational Planning http://www.unesco.org/iiep
Secondary education financing in Costa Rica:recovering the initiative
257
Public expenditure on education in Costa Rica has generally beenhigh compared to similar countries in the region. Chart 9.3 shows howeducational expenditure as a proportion of GDP has varied over the past40 years. In summary, spending increased consistently from 1950 to1979, growing from 1.3 per cent to 5.7 per cent of GDP, coinciding withthe country’s prolonged economic growth. Concurrent with theeconomic crisis, expenditure fell to around 4.2 per cent during 1979-1982. Thereafter it remained stagnant until 1996, when it began to riseagain, reaching 6 per cent in 1998.
In terms of educational expenditure as a proportion of the totalpublic budget, spending on this rubric was above 25 per cent during mostof the 1970s – reaching nearly 30 per cent in 1979. It then fellcontinuously until 1986, with the exception of a brief recovery in 1981-1982, to stabilize at around 20 per cent (MEP, 1991; CONARE, 1998).
These patterns indicate that, overall, the Costa-Rican Governmenthas prioritized educational expenditure. It has allocated relatively largeshares of GDP comparable with the highest levels found elsewhere. Theproportion of the government budget has fallen, but remains highcompared to most countries in the same region.
Chart 9.3 Educational expenditure as a percentage of GDP, 1970-1998
Montiel et al., 1997; Chavarría et al., 1998.
2
2.5
3
3.5
4
4.5
5
5.5
6
6.5
1970 1974 1978 1982 1986 1990 1994 1998Year
Perc
enta
ge
Ed % GDP

International Institute for Educational Planning http://www.unesco.org/iiep
5. Expenditure by level
It is of interest to investigate how allocations by level havechanged.9 These are shown in Chart 9.4, which illustrates howsecondary investment has fluctuated. During the 1960s, primaryeducation10 dominated educational expenditure, accounting for anaverage of 67 per cent of the budget. Secondary and tertiary levels bothreceived around 17 per cent of the total. Secondary-educationexpenditure began to grow and by 1967-1969 it received 21 per cent ofthe total. This trend continued until 1980 when secondary was 33 percent of the total, outstripping university expenditure and approaching theamounts allocated to primary. Tertiary education also grew as aproportion and reached over 20 per cent. As a consequence, primaryeducation spending decreased to 50 per cent of the whole.
The 1980s tell a different story. Secondary education’s share fellconsistently from 1981-1986 and levelled off at 22 per cent for the restof the decade. Primary education spending continued to decline until itdiminished to 38 per cent of the total in 1984, where it remained until1988-89. In contrast, tertiary education spending grew tremendously,outstripping secondary education in 1981 and primary education in1985. By 1986, it was 40 per cent of total expenditure.
During the 1990s, primary education again accounted for thelargest proportion of the budget, averaging 43 per cent. Secondaryeducation received 22-25 per cent until 1997, when it jumped to 29 percent – accounting for more than tertiary education for the first time since1980. University education, for its part, fell from 33 per cent in 1990 to27 per cent in 1997.
258
Financing secondary education in developing countries
9. Financial data are very irregular, thus this section depends on a variety of sources, mostlyprimary but some secondary.
10. This also includes pre-school, which does not receive a significant portion of the budget.It grew from 2 per cent to 4 per cent of the total budget during 1980-1996. For moredetails see Montiel et al., 1997.

International Institute for Educational Planning http://www.unesco.org/iiep
Chart 9.4 Educational expenditure by level, 1960-1997
Author’s calculations based on Torres, 1974; CONARE, 1998; and Memoria anual: liquidacionescruzadas ajustadas, 1970-➝1997-.Deflator: Central Government Expenditure from Banco Central de Costa Rica, 1997, 1995, 1986.
The fortunes of the different educational levels have varied.Primary education has been historically prioritized, on average receivingthe bulk of education spending. Secondary education enjoyed its highestproportion of funding during the 1970s, only to suffer large cuts duringthe early 1980s and a stagnant level of funding until 1996. Spending ontertiary education climbed rapidly in the late 1970s and even more soduring the 1980s. It then fell in relative terms in the 1990s.
There are many reasons for the patterns identified above. The firstis the impact of different political priorities at different points in time.Over most of the period, primary has been regarded as a priority andfunds have been allocated accordingly. During the 1970s, secondary wasfavoured for a period and its share increased. Second, the effects ofrecession and cuts in public expenditure in the 1980s were influentialand particularly affected pre-university education and new public works(Montiel et al., 1997). Third, higher education has benefited from anearmarked source of funding reliant on proceeds of a specific tax, whichhas shielded it from budget cuts. In addition, the demand for funds forfurther education increased during the 1970s, as the number ofuniversities grew from one to four.
0
40
80
120
160
200
1960 1964 1968 1972 1976 1980 1984 1988 1992 1996
Year
Rea
l col
ones
(19
66)
mill
ions
Primary Secondary Tertiary
259
Secondary education financing in Costa Rica:recovering the initiative

International Institute for Educational Planning http://www.unesco.org/iiep
6. Expenditure per capita
Expenditure per student has also been changing in ways that haveimplications for participation in secondary schooling. Chart 9.5 shows theevolution of per-capita expenditure at the primary, secondary and tertiarylevels since 1980. Expenditure per student at pre-university level fellsteadily during the 1980s and early 1990s. During this period, it lost around25 per cent of its value in the case of primary and academic secondary and45 per cent in the case of technical secondary. In contrast, university per-capita spending climbed quickly during the early 1980s, reaching 120 percent of 1980 levels in 1984. Higher education spending per capita wasbetter protected from reductions than other levels in the 1990s.
Chart 9.5 Per capita spending by level relative to 1980
Montiel et al., 1997.
It is important to note that unit costs at secondary and primary levelsstand in a low ratio to each other of 1.5:1.11 Secondary-school places arenot relatively much more expensive than primary places. Excessive unitcosts at secondary are therefore not an obvious constraint on highersecondary participation. Higher-education places are about 5.6:1 timesmore expensive than primary-school places, a ratio which is above averagefor Central and South America, but much lower than in Africa.
0
20
40
60
80
100
120
140
1980 1981 1982 1983 1984 1985 1986 1987 1988 1989 1990 1991 1992 1993 1994 1995
Year
Perc
enta
ge
Primary Sec. Acad. Sec. Tec. Univ.
260
Financing secondary education in developing countries
11. Calculated for 1995 on the basis of enrolment rates (Expansión del sistema educativo enCosta Rica, 1997-) and expenditure by programme (Memoria anual, 1995-).

International Institute for Educational Planning http://www.unesco.org/iiep
7. Recurrent expenditure
Costa Rica has traditionally spent a high proportion of resourceson recurrent expenditure at the expense of capital expenditure at the pre-tertiary level. During the period 1974-1997, recurrent expenditureconsistently represented between 90-95 per cent of the total budget(Memoria anual, 1974, 1997). Capital spending averaged about 4.6 percent, but shrank over time.
High levels of recurrent spending are visible before the 1980sbudget cuts, with very modest proportions allocated to capital spendingand to educational materials. The crisis of 1980 made the situationworse. Predictably, capital spending shrank relative to current spendingat the same time as the overall education budget shrank. These budgetingdecisions had a definite impact on the quality of the education in thepublic system. Sanguinetty (1988) notes that the budget cuts weredesigned so as not to affect employment levels. As a result, cuts felldisproportionately on the infrastructure and facilities that teachers had towork with and adversely affected their motivation. While few staff werefired, real salary levels went down considerably.
Chart 9.6 depicts the evolution of primary and secondaryteachers’ wages as well as those of the average government employee inreal terms during 1975-1990. Several observations can be made. First, allgroups suffered a substantial decline in their wages in 1982. However,teachers’ wages, unlike those of other government employees, did notbegin to recover immediately. Their wages remained stagnant until 1989,when they began to rise. Second, the wages of primary and secondaryteachers converged over time. In 1978, secondary teachers were thebetter-remunerated group, and they earned some 24 per cent more thanprimary teachers. By 1990, the difference was only 7 per cent.
261
Secondary education financing in Costa Rica:recovering the initiative

International Institute for Educational Planning http://www.unesco.org/iiep
Chart 9.6 Teachers’ salaries, 1975-1990
Carnoy and Torres, 1992.Note: Salary for average government employees extrapolated for years 1976-1979 by author.
The decline in wages relative to pre-crisis levels, and also relativeto other professional groups, seems to have been translated into ashortage of qualified teachers. Hernández states that: ‘different problemssuch as low salaries, the loss of prestige relative to other professions, de-motivating working conditions, and the possibility of early pensions,have resulted in a shortage of teachers from the 1980s to the present’(author’s translation, 1998:18). In order to compensate for this,unqualified staff have been hired.12 From 1984 to 1993, the number ofunqualified teachers rose from 15 per cent to 25 per cent (Personal totalque labora en instituciones de educación regular, 1997).
The increase in unqualified teachers has been accompanied by anotable shortening of the academic year, which shrank by 16 per cent in1981, falling to 177 days from 211 days in 1980. During the 1981-1995period, the length of the school year oscillated between 167 and 181 days(MIDEPLAN, 1998a). This shortening of the school year may have had amarginal effect on some non-salary and non-teaching salary expenditure,but this is unlikely to be substantial. It may have had a significant effect onquality, or at least outcomes, since students experience more than 20 percent less active school days now than in the past.
6,000
8,000
10,000
12,000
14,000
16,000
18,000
20,000
1975 1977 1979 1981 1983 1985 1987 1989Year
Con
stan
t col
ones
(19
85)
Primary Secondary Gov’t
262
Financing secondary education in developing countries
12. This may also be done in order to hold down recurrent costs, as unqualified teachers arecheaper. See Carnoy and Torres, 1992.

International Institute for Educational Planning http://www.unesco.org/iiep
The shrinking amount of resources for non-salary spending hasalso meant shortages in teaching materials. A report from the WorldBank (1991) indicated that only 50 per cent of students in primaryschool and lower secondary had textbooks. Basic teaching materialswere in short supply, and there was an ‘almost total lack of modernequipment’ in upper secondary.
Expenditure on maintenance and infrastructure also sufferedduring the 1980s (ibid.). Chart 9.7 below shows the number of schoolsbuilt during each administration. There was a trend of sustainedconstruction of schools from 1950-1970, which shot up in 1971-1974.This decreased during the late 1970s, before falling into a tremendoustrough during the 1980s. It began to recover in the early 1990s, and therewas a huge increase from 1995-1998.
Chart 9.7 Secondary schools built by administration
MIDEPLAN, 1998a
Part of the explanation for changing patterns in participation maybe related to the extent to which the financing of secondary educationhas become more dependent on the private resources of families. Carnoyand Torres attribute the decline of secondary education participationduring the early 1980s to ‘the relatively high fraction of total schoolingcosts borne by parents at this level of education’ (1992:34). Theirresearch found that the high direct costs such as uniforms, textbooks,stationery, contributions for teachers’ supplies, and transport wereonerous. The authors calculate that a family, even without transport
0
20
40
60
80
1950-54 1955-58 1959-62 1963-66 1967-70 1971-74 1975-78 1979-82 1983-86 1987-90 1991-94 1995-98Administration
Num
ber
of s
choo
ls
263
Secondary education financing in Costa Rica:recovering the initiative

International Institute for Educational Planning http://www.unesco.org/iiep
costs, would have to spend almost as much as the public spending perstudent in academic secondary education and that the private direct costsfor one student could represent 44 per cent of an average monthlyincome. This is compounded for families with more than one childand/or with scarce resources. This is supported by evidence from Solísand Rodríguez (1995), who found that 77 per cent of drop-outs cited thedistance to the nearest school as a factor in their decision to leave school.
Before proceeding to assess the options for increasing participationat the secondary level, it is useful to recapitulate the findings discussed upto this point. It would appear that secondary education has often beenunderfunded. The priority, in a financial sense, was primary education upuntil 1980. Since then, university education has come to absorbproportionately greater amounts of the education budget.
This situation was made worse during the 1980s by factors bothexternal and internal to the education system. In terms of externalphenomena, poverty and unemployment increased substantially duringthis period. This could have affected the access of certain socio-economic groups to the education system by making the incomeforegone unaffordable. This period was accompanied by larger numbersof adolescents entering the labour market.
In terms of factors endemic to the education system, the generalbudget cutbacks were associated with policy choices that appear to haveaffected performance and access. In the first instance, a significantamount of direct educational costs were transferred to families at a timewhen disposable income was reduced. Concurrently, the quality offeredby the education system appears to have suffered from budgetreductions. This resulted in less availability of pedagogical materials,reduced class-time, and greater numbers of unqualified and demotivatedteachers. The internal efficiency of the system decreased and this mayhave lessened the attractiveness of secondary education as aninvestment.
8. Options to increase participation
This section examines a range of options which might have apositive effect on the participation rate in secondary schools andexplores some of their cost implications.
In principle, more resources to increase secondary participationcan come from four main sources. These are increased overall budgetaryprovision, a redistribution within the education budget, improved
264
Financing secondary education in developing countries

International Institute for Educational Planning http://www.unesco.org/iiep
internal efficiency and restructuring of provision to allow moreparticipation for similar resource commitments, and greatercontributions from private and community resources outside the publicbudget.
The first and last of these options are constrained. Overall,educational expenditure is high. Costa Rica has a long tradition of highlevels of social spending. Most recently, the government has promoted achange in the Constitution, which was put into effect in 1998. Thisunusual clause stipulates that the state must spend a minimum of 6 percent of GDP on education every year. This should result in raisingspending to historically unprecedented levels that are about 33 per centhigher than the Latin-American average. This is probably close to theupper limit that is feasible, since few countries spend more. Thus,though additional small increases in overall expenditure as a percentageof GNP are possible and could be targeted on increasing the resourcesfor secondary schools, large increases are not likely to come fromchanges in overall allocation.
In the case of the last option, expenditure at the secondary levelcould be increased through various kinds of cost recovery. However, theConstitution stipulates that the state has to provide education free ofcharge. This clearly puts political and practical constraints on the kindsof contributions that may be invited. It is also plausible that any rise inthe direct costs of secondary education would affect participationnegatively. This is most likely amongst students with the least householdresources, who will constitute the majority of those who currently fail tocomplete secondary schooling. It is possible that modest increases mayoccur in the proportion of private schooling at secondary level. If thishappened there would be some savings for the public budget that couldbe used to improve participation and quality in public secondary schools.However, it is not clear how much scope there is for such developments.
9. Redistribution
There may be more scope for various kinds of redistribution of theresources available to support educational growth. It is evident from theanalysis above that public subsidies for education are unusually skewedtowards higher education. In contrast, per capita and total expenditure onsecondary-school students is relatively low. To shift some resourcestowards expanded secondary schooling should have positive effects onboth equity and efficiency. In terms of equity, secondary education
265
Secondary education financing in Costa Rica:recovering the initiative

International Institute for Educational Planning http://www.unesco.org/iiep
expenditure is more progressive than university spending. Tertiaryexpenditure has been very regressive. The richest 20 per cent of familiesbenefited from 43 per cent of public spending at the tertiary level in the1980s. Conversely, the poorest 40 per cent received only 13.5 per cent ofthis kind of subsidy support. Secondary education seems to have beencomparatively neutral, although the middle 60 per cent of familiesbenefited at the expense of both the poorest and the richest by 20 percent (Table 9.6). Primary education is very progressive in terms of thebenefits to the relatively poor. However, the GER is already over 100 percent at primary. More expenditure at this level to improve quality couldbe beneficial for both primary (improved quality and outcomes) andsecondary (less need for remedial work in secondary and lower drop-outrelated to poor achievement). With low and static enrolment rates at thesecondary level, there clearly is a case for directing any redistribution ofthe education budget towards secondary expansion and qualityimprovement.
Table 9.6 Distribution of government education spending by familyincome (1986)
266
Financing secondary education in developing countries
Total Primary Secondary Tertiary
20% poorest families 24.4 30.1 17.8 9.5
2nd quintile 22.7 27.0 21.4 5.0
3rd quintile 20.9 21.5 23.1 13.5
4th quintile 17.4 13.5 21.2 28.9
20% richest families 14.7 7.9 16.5 43.0
Trejos and Sauma, 1986, in Garnier, 1991.
The ratio of unit costs of university to secondary places is about1: 3.9, indicating that each university student consumes as much publicsubsidy as approximately four secondary students. If half of the tertiaryeducation budget were redirected to secondary education, this wouldresult in a 65 per cent increase in spending at this level – or, put in otherterms, funding for an additional 118,000 secondary-school students ataverage unit-cost levels13.
At present, government funding accounts for 80 per cent of thetotal revenue of the public universities, and the remaining 20 per centcomes from fees and the sale of services to third parties. There is
13. Possibly more, to the extent that marginal costing applies. The total secondary school-age cohort was about 360,000 in 1995 (World Education Report, 1998-).
International Institute for Educational Planning http://www.unesco.org/iiep
probably scope for reducing the level of public subsidy over a period oftime without necessarily damaging quality or access. In 1988, no coursesin the biggest public university had fees that covered costs (Montiel etal., 1997). The private demand for further education is booming and in1996 this sector catered for 29 per cent of students.
However attractive reductions in public subsidy to highereducation may be, university spending has been constitutionallyguaranteed and financed for some time through the proceeds of specifictaxes. Any change to the current structure of education financing wouldhave political and legal implications that might make for a protractedprocess. The underlying point, namely, that secondary participation islow and that the public costs of the secondary-school system have beenless than those of the public-university system, poses a challenge. Theexisting balance of public investment, which is regressive in terms offamily income, and which appears to be constraining supply, may notrepresent the most appropriate allocation of resources.
10. Internal efficiency
Increases in internal efficiency of various kinds offer scope tomeet the resource implications of secondary expansion in Costa Rica.First, there is the issue of teachers’ salaries. In this case, the evidencesuggests that secondary-school teachers are suffering from a loss ofprestige and a decline in salary levels relative to other professions. In1978, average secondary teachers’ salaries were 24 per cent above thoseof primary teachers. By 1990, this difference had narrowed to 7 per centand the salaries of both were significantly below those of otherprofessional groups. There would seem no scope for a real reduction insalaries and a case for their enhancement if secondary school quality andassociated retention rates are to improve. If qualified secondary-schoolteachers’ salaries were increased to their pre-crisis level in relation toprimary teachers, this would entail an increase of about 12 per cent in thebudget. One way of covering this cost would be to allow thepupil/teacher ratio to increase from 19.4, which is quite low byinternational standards, to around 23. This would generate a saving ofaround 15 per cent, essentially cancelling out the cost of the salary rise.
It is also attractive to increase the proportion of qualified teachers,on the assumption that they are more likely to have a long-termcommitment to secondary school improvement and more competence inteaching effectively. Unqualified teachers are paid approximately 15 per
267
Secondary education financing in Costa Rica:recovering the initiative

International Institute for Educational Planning http://www.unesco.org/iiep
cent less14 than those with the appropriate qualifications. They representabout 25 per cent of the teaching staff. This translates into a saving ofaround 4 per cent over the salary bill for a fully qualified teaching force.This seems a small cost saving for such a large proportion of untrainedand unqualified teachers. If trained teachers are more efficient and as aresult repetition falls, the benefits of ensuring all teachers are qualifiedcould easily outweigh the additional salary costs.
Currently, repetition rates average 17 per cent in the first year ofsecondary, and are above 10 per cent in most subsequent years. Thisentails a significant expense as these repeating students must passthrough a failed year at least twice. It is unclear what educationalbenefits accrue where repetition exceeds 20 per cent of the students, asit must do in many schools in the first year of secondary. If repetitionwere to be abolished, this would translate into a saving of around 12 percent of the budget at the same enrolment level. This, in turn, would allowmore students to proceed to higher grades, assuming an appropriatecurriculum was available for their tuition.
Several other types of intervention would increase costs, but couldbe seen as cost-effective if they produced benefits in achievement andreduced drop-out. These mostly involve reducing the direct costs ofparticipation. It is clear that high direct costs of secondary schooling canact as a disincentive for significant numbers of students. These costscome in several forms. Buying textbooks has traditionally been in thehands of parents. Existing studies indicate that shortages of textbooksare widespread. There is much evidence of the effects of textbookprovision on achievement. It seems probable that an investment of 2-4 per cent15 of the current secondary school budget would be enough toprovide textbooks in all the main subjects in each year. If this resulted inhigher levels of achievement and less repetition, this would cover muchof the cost.
Generally, transport to and from school must be paid for bystudents’ families, though the state provides transportation for somestudents in rural areas. Excessive distance to school was the most citedreason among drop-outs for their decision to leave the system (Solís andRodríguez, 1995). A larger proportion of these costs might be bornepublicly in areas where distances are substantial and where drop-outseems closely associated with distance.
268
Financing secondary education in developing countries
14 Based on the difference between a qualified and unqualified primary-school teacher,Carnoy and Torres, 1992.
15. Calculated on the basis of five textbooks for each student at US$5 each.

International Institute for Educational Planning http://www.unesco.org/iiep
Scholarships are provided for students from lower socio-economic backgrounds. The government recently increased the numberof scholarships for primary and secondary students to 28,000 in 1998(MIDEPLAN, 1998b). This is approximately 4 per cent of the totalstudent population. Given that the number of families living in povertyis approximately 20 per cent, this number may need to be increased andthe proportion targeted on secondary students increased.
11. Some restructuring opportunities
Notwithstanding the historic underinvestment in secondaryeducation, there may be room for significant cost-reduction within theschool system. Using primary data from 350 day secondary schoolsfrom the academic and technical streams (out of 354 in reality),Table 9.7 was compiled. The table includes data regarding the relativeper capita cost, the pass rate, the PTR, the percentage of qualifiedteachers, the ratio of administrative staff to teaching staff, andindications of the relative importance of each type of school. In addition,statistical analyses were carried out between the different types ofindicators to try to establish the relationships between them.
Table 9.7 Analysis of school characteristics (1997)
269
Secondary education financing in Costa Rica:recovering the initiative
Type Number Number Ave- Cost Relative Pass PTR % of Admin.of of rage per cap. cost rate*** qualified Teachers
schools students size Colones teachersTotal 350 191,480 606* n.a. n.a. 0.51 15.4 0.74 0.16Public 234 161,353 776* 122,256 1.29 0.43 17.8 0.70 0.15Urban 121 114,108 979* 94,621 1.00 0.40 22.9 0.79 0.17Rural 113 47,245 497* 144,400 1.53 0.44 15.0 0.60 0.14Academic* 117 112,147 959* 101,215 1.07 0.40 21.4 0.76 0.15Urban 82 92,743 1,131 94,539 1.00 0.40 23.0 0.83 0.16Rural 35 19,404 554 121,272 1.28 0.41 17.9 0.61 0.13Lower secondary 34 6,956 205 139,016 1.47 0.40 15.6 0.42 0.15Scientific** 6 225 38 1,112,845 11.77 0.86 2.0 1.00 0.12Technical 77 42,025 546 229,767 2.43 0.45 14.7 0.70 0.13Private 97 18,607 192 n.a. n.a. 0.66 9.3 0.83 0.21Semi-private 19 11,520 606 n.a. n.a. 0.65 18.5 0.78 0.17
*Does not include lower secondary schools.**Four of these schools were created during 1995-1998, which may account for the very smallnumber of students.***These are preliminary pass rates, and do not include re-sits.Author’s calculations based on MEP, 1998a.

International Institute for Educational Planning http://www.unesco.org/iiep
The schools were divided into the public, private and semi-privatesectors. The latter two were included in order to be to able gauge therelative performance of the public sector. The public-sector schools werealso divided into their various types. academic schools, which are themost common, were divided into those located in rural and urban areas.Technical schools were also included, as were a number of lower-secondary schools that only have the first three years of secondary.Finally, the small number of highly selective special science schoolswere integrated into the sample.
An analysis of pass rates shows that there is substantial differencebetween the public-sector schools and those in the private and semi-private sector. Forty-three per cent of students in the public system passtheir courses, versus 66 per cent in the private and 65 per cent in thesemi-private. Among the public-sector schools, the academic urban,rural, and lower-secondary schools have similar pass rates of around40 per cent. The technical schools perform slightly better with a pass rateof around 45 per cent, and the scientific schools have the highest passrates of all types of school of 86 per cent, as might be expected fromtheir selective nature.
The pupil/teacher ratios in the schools vary significantly amongthe different schools. The urban academic schools have PTRs of 23:1,the rural schools of 17.9:1, and lower-secondary schools of 15.6:1.Technical schools also have quite low PTRs of 14.7:1 and scientificschools have ratios of only 2:1. Private schools and semi-private schoolshave PTRs of 9.3:1 and 18.5:1, respectively.
The percentage of qualified teachers also varies widely. Eighty-three per cent of the teachers in urban academic schools are qualified,compared with 61 per cent in rural academic schools and only 42 percent in lower-secondary schools. Seventy per cent of teachers intechnical schools are qualified, as are all teachers in a small number ofspecial science schools. The values for the private and semi-privateschools are 83 per cent and 78 per cent.
Administrators in academic urban and lower-secondary schoolsrepresent 15-16 per cent of teaching staff. In academic rural, technical,and special science schools the corresponding figure is 12-13 per cent ofteachers. Private and semi-private schools have the highest proportion ofadministrators, as they represent 21 per cent and 17 per cent of teachingstaff respectively.
Approximate costs were estimated for the different types of publicschools using the existing pupil/teacher ratios (on the assumption thatPTR is the main determinant of unit costs). This shows that the urban
270
Financing secondary education in developing countries

International Institute for Educational Planning http://www.unesco.org/iiep
academic schools with the highest PTRs are the cheapest. These wereused as a benchmark from which to measure the relative expense of theother types of school. Rural academic schools cost about 28 per centmore than their urban counterparts and lower-secondary schools almost50 per cent more. Technical schools are quite expensive as they costalmost 2.5 times an academic urban school. Special science schools arevery expensive, costing almost 12 times more than an academic urbanschool. However, there are only six of these schools.
Regressions were run between each of the different types ofindicator for the public-sector schools to test their interrelationships (seeTable 9.8). There is a minuscule, but statistically significant and negativerelationship between school size and the pass rate. The adjusted R-square value of 0.02 means that only 2 per cent of the variance in thepass rate can be explained by school size. Thus, in effect, school size hasno systematic effect on the pass rate.
Table 9.8 Regression results
271
Secondary education financing in Costa Rica:recovering the initiative
Dependent Independent variable Slope coefficient Adjustedvariable Constant term R-squared
Pass rate School size 0.463 30.01 –4.50E-05 –2.51 0.02
PTR School size 11.91 26.21 0.009 16.39 0.53
Pass rate PTR 0.58 21.42 –0.008 –5.81 0.12
Pass rate Qualified 0.43 9.04 0.145 2.44 0.02Teachers
The numbers in italics are T ratios, values greater than 2 are considered significant.
There is a very strong, positive, and statistically significantrelationship between the PTR and school size (adjusted R-square, 0.53),meaning that as schools grow in size, so too does the PTR.
The pass rate and the PTR have a small negative but significantrelationship. The adjusted R-square shows that 12 per cent of the variancein the pass rate can be explained by the PTR. The fact that it is negativeis logical, as it shows that a lower PTR can help raise pass rates. However,the relationship, while statistically significant, is not very strong.
The pass rate and the percentage of qualified teachers have asmall, positive, and significant relationship (adj. R-square, 0.02). It issurprising that the relationship is not stronger, as it might be thought thatmore qualified teachers would have a very important effect onperformance. It may of course be that the relationship is confounded bymany other factors that influence achievement as measured by pass rates.

International Institute for Educational Planning http://www.unesco.org/iiep
When put together these results suggest a number of options. Thefact that there is a very strong relationship between school size and thePTR means that bigger schools require fewer teachers pro rata and arethus cheaper to operate. While the PTR does seem to affect the pass rate,this relationship is not strong and the relationship between school sizeand the pass rate is of negligible importance. Thus, the data support theview that larger schools are more cost-effective and have similar resultsto smaller ones.
Charts 9.8 and 9.9 show the pupil/teacher ratios and the per-capitacost of different sizes of schools. As can be seen, those with populationsbelow 500 are the most expensive to operate. The schools becomecheaper as they increase in size, although this is less visible for schoolswith more than 1,000 students.
Chart 9.8 School size and pupil/teacher ratios
Author’s calculations based on Table 9.7.
0
5
10
15
20
25
30
0-499 500-999 1,000-1,499 1,500-1,999 2,000-2,499 2,500+
School size
Pupi
l/tea
cher
rat
ios
272
Financing secondary education in developing countries

International Institute for Educational Planning http://www.unesco.org/iiep
Chart 9.9 Per-capita cost and school size
Author’s calculations based on Table 9.8.
Increasing average school size would reduce unit costs. However,it would be difficult to advocate closure of schools that have alreadybeen built. Schools are usually built upon request by the communities,which then finance the purchase of the land. Rural schools are oftensmall and thus likely to be more costly per student. Nevertheless, it maybe that some small schools could be merged, that further expansion incapacity could be based on existing infrastructure rather than openingnew small schools and that more and cheaper transport could be offeredto students if this gave access to superior facilities concentrated on fewersites.
Should half the student population in schools smaller than500 students be relocated to schools with 500-1,000 students, this wouldrepresent a saving of around 1.2 per cent of the budget. Similarly, shouldhalf of the students in schools with 500-1,000 students be moved tobigger schools (1,000-1,500), this would represent savings of 2.2 percent of the budget.
The existing distribution of teachers and the ensuing costdifferentials between schools suggest several areas where detailedanalysis would be worthwhile. The special science schools cost twelvetimes as much as an academic urban school. However, the studentpopulation involved in each is very small (less than 250), so the savingscreated by reducing these costs would be minimal. The government has
0
20,000
40,000
60,000
80,000
100,000
120,000
140,000
160,000
180,000
0-499 500-999 1,000-1,499 1,500-1,999 2,000-2,499 2,500+
School size
Cur
rent
col
ones
per
cap
ita
273
Secondary education financing in Costa Rica:recovering the initiative

International Institute for Educational Planning http://www.unesco.org/iiep
recently opened several additional ‘elite’ schools. If this is the beginningof a trend, then the cost implications could become substantial. Highcosts per student might be justified in a few highly specializedinstitutions. However, it remains unclear whether it is essential for thespecial science schools to operate with such small numbers of students.This implies that the utilization of expensive facilities is unlikely to beefficient.
More significant savings could probably be obtained throughreforms in the technical school system, which caters for around 25 percent of students in the public sector. These schools cost 2.5 times asmuch as an urban academic school. The pay-offs for these additionalcosts are not very clear. Large numbers of those who completesecondary education in the technical stream continue to universityalongside those graduating from cheaper academic secondary schools.This may imply that the additional costs of providing technical-schoolcurricula are largely wasted. It is also argued that many employers preferto hire graduates from the National Training Institute (INA), who havesimilar technical knowledge but no academic qualifications and are thuscheaper.16
The demand for technical secondary education may actually belower than is thought. Only 17 per cent of students in urban schools arein the technical stream, compared with 48 per cent of those in ruralschools. In many cantons17 in rural areas there are only secondarytechnical schools. In some cases there are three or four technical schoolsin the same area, each catering to a particular specialization, the result ofwhich is smaller school size and higher costs than would otherwise bethe case. There may be possibilities for school consolidation, and for thedevelopment of schools that offer both academic and technical streamsin the same institution. If half of the student population in the technicalstream were taught at similar costs to the academic stream, this couldresult in savings of approximately 8 per cent.
Another source of some inefficiency lies with the lower-secondaryschools. These schools have low pupil/teacher ratios and are on average1.5 times as expensive as the urban academic schools. Were it possibleto reorganize these schools such that they had similar costs to ordinaryurban academic secondary schools, about 1 per cent of the educationbudget would be saved.
274
Financing secondary education in developing countries
16. Interview with Orlando Morales, Director of the National Training Institute, July 1998.17. The smallest political and administrative division of the country.

International Institute for Educational Planning http://www.unesco.org/iiep
12. Some simulations
Having looked at the various options for reducing costs and areasthat could benefit from additional investment, several possible scenarioswill be looked at to evaluate their impact on enrolment rates and theirpossible costs. The Costa-Rican education system was modelled usingcurrent data to create a baseline simulation. The basic parameters usedto configure the baseline simulation were as shown in Table 9.9.
Table 9.9 Baseline parameters, Costa Rica simulation
275
Secondary education financing in Costa Rica:recovering the initiative
Parameter Simulation 1
Population growth 2.0%
Primary GER 107%
Secondary GER 61%
Unit cost ratio of secondary to primary 1:1.5
Primary entry rate 110%
Repetition 7-13% depending on grade
Promotion Between 83%-88%
Drop-out Average 5%
Pupil/teacher ratio 30.6:1
Teacher attrition 5%
Secondary entry rate 86%18
Repetition 5-17% depending on grade
Promotion 60-90% depending on grade
Drop-out 9-25% depending on grade
Pupil /teacher ratio 19.4:1
Teacher attrition 5%
Simulation 1 was run for Costa Rica to project forward expenditurefor 15 years. In the baseline version, costs grow at the rate of populationgrowth so that at the end of the 15-year period the education budget wouldhave to have increased to about 1.3 times its current value to maintain grossenrolment rates of over 100 per cent at primary and 61 per cent at secondary.This unreformed system would remain very inefficient in the sense thatrepetition and drop-out rates would remain high, especially in the secondarygrades. Since enrolment rates are not varied, the proportions of the totalschool-system costs taken by primary and secondary remain the same.
18. Calculated on the basis of the student population in 6th grade in 1994 and 1st year in1995, taking repetition into account.

International Institute for Educational Planning http://www.unesco.org/iiep
Simulation 2 shows the effects on costs and GERs of allowing therepetition rate to halve over the first five years and halve again from itsnew value over the next five years. Drop-out is also decreased to half itscurrent value in primary and to 25 per cent of its value in secondary. Asa result, GERs at secondary increase to over 86 per cent (Chart 9.10) andcosts rise for the school system to 1.5 times their current values. The costof the secondary-school system increases faster than the primary andsecondary begins to occupy a greater share of the budget (Chart 9.11).
Chart 9.10 Simulation 2: Gross enrolment rates at primary andsecondary
0%
20%
40%
60%
80%
100%
120%
1995 1997 1999 2001 2003 2005 2007 2009
Year
Gro
ss e
nrol
men
t rat
es
Primary
Secondary
276
Financing secondary education in developing countries

International Institute for Educational Planning http://www.unesco.org/iiep
Chart 9.11 Simulation 2: Recurrent costs for primary and secondary as a proportion of total base-year costs, 1996-2010
Simulation 3 explores the cost of moving to a GER at secondary of100 per cent over 10 years. This is achieved by increasing the transition rateinto secondary, so that all those who complete primary enter secondary, andby retaining the reductions in repetition and drop-out included insimulation 2. The result is that total school-system costs would have to riseby 1.6 times over 15 years (Chart 9.12). In this case the secondary systembegins to approach the same total cost as the primary system.
Chart 9.12 Simulation 3: Recurrent costs for primary and secondary as a proportion of total base-year costs, 1996-2010
0
0.4
0.8
1.2
1.6
2
1996 1998 2000 2002 2004 2006 2008 2010
Year
Rec
urre
nt c
ost a
s pe
rcen
tage
of
base
yea
r
Primary recurrent Secondary recurrent Total recurrent costs
0
0.4
0.8
1.2
1.6
1996 1998 2000 2002 2004 2006 2008 2010
Year
Rec
urre
nt c
ost a
s pe
rcen
tage
of
base
yea
r
Primary recurrent Secondary recurrent Total recurrent costs
277
Secondary education financing in Costa Rica:recovering the initiative

International Institute for Educational Planning http://www.unesco.org/iiep
In Simulation 3, unit costs at secondary remain at 1.5 times thoseat primary. When 100 per cent GERs are reached at both primary andsecondary, the secondary system as a whole remains a little below thecost of the primary system, not more, as might be expected. This ismainly because total enrolments in secondary remain less than those inprimary (the age cohort is pyramid-shaped, and most students areenrolled for five and not six years).
Simulation 4 shows the effects of allowing the salaries ofsecondary teachers to increase in real terms and as a ratio of those ofprimary teachers. If this were undertaken to restore differentials betweenprimary- and secondary-school teachers to the extent that unit costs atsecondary were about twice those at primary19, and if the averagepupil/teacher ratio at secondary was allowed to increase from about19.4:1 to 23:1 (through increases in average school size, etc.), theoutcome would be an overall cost increase of 1.85 after 15 years(Chart 9.13). In this simulated system, more has to be spent on thesecondary than primary school-system. Repetition and drop-out arerelatively low and GERs at primary and secondary level are both over100 per cent.
Simulation 4 is cost sustainable if economic growth averages over3 per cent over the next 15 years. Three per cent growth would producea 50 per cent increase in the budget over the projection period. It ispossible that the difference between this growth (1.5:1) and the 1.85:1required, could be found from a mixture of modest increases in theproportion of GDP allocated to education, gains arising from moreefficient utilization of resources, redistribution of some subsidies fromother parts of the education system towards secondary, and fromincreases in community contributions and private donations.
278
Financing secondary education in developing countries
19. This implies a smaller increase in average salaries, since PTRs at primary are higher thansecondary.

International Institute for Educational Planning http://www.unesco.org/iiep
Chart 9.13 Simulation 4: Recurrent costs for primary and secondary as a proportion of total base-year costs, 1996-2010
The simulations therefore lead to the conclusion that all thedevelopments modelled could be achieved given appropriate choices ofpolicy and realistic shifts in the allocation of the education budget.
13. Concluding remarks
This chapter has explored aspects of secondary enrolment andenrolment growth in Costa Rica. Participation rates in the fifth year ofsecondary schooling remain low, at no more than 30 per cent, and theproportion of those in the labour force who have completed secondaryschooling is small. The country’s development strategy seeks toencourage inward foreign investment, especially in sectors that havehigh levels of value-added and in areas where production is more ratherthan less knowledge based. If the proportion of those with successfullycompleted secondary education does not grow, it seems likely that abottleneck will develop that could mean an insufficient supply ofsecondary-educated school-leavers into the workforce and/or towardshigher levels of education and training, which could damagecompetitiveness.
Participation rates at secondary have only recently begun to growagain after a period of decline and stagnation starting in the early 1980s.
0
0.4
0.8
1.2
1.6
2
1996 1998 2000 2002 2004 2006 2008 2010
Year
Rec
urre
nt c
ost a
s pe
rcen
tage
of
base
yea
r
Primary recurrent Secondary recurrent Total recurrent costs
279
Secondary education financing in Costa Rica:recovering the initiative

International Institute for Educational Planning http://www.unesco.org/iiep
The secondary-school system suffers from high repetition rates and highdrop-out and is thought to have declined in quality. In addition, highereducation is especially protected by a constitutional clause whichguarantees the proceeds of an earmarked tax. Partly as a result, a largerproportion of the education budget has been spent on higher educationthan on the entire secondary-school system.
The analysis in this chapter suggests that the question ofsecondary school enrolment growth needs re-examining. If Costa Rica isto develop an educational profile more like those of the countries itcompetes with, it will need to find ways of supporting growth inparticipation rates at secondary. It appears that virtually all those whocomplete primary have the opportunity to enrol in the first year ofsecondary. The problem of low enrolment rates at secondary appears tobe one of retention rather than an absolute shortage of places. This, inturn, may be linked to a range of factors - school quality, teachers’remuneration and motivation, proportions of unqualified teachers,repetition policy and curriculum standards, rising direct costs to pupilsand parents – which are more or less under the control of the Ministry ofEducation.
The projections of expenditure associated with various types ofstructural reforms suggest that Costa Rica can afford higher levels ofsecondary participation. If economic growth averages 3 per cent over thenext 15 years, the costs of near universal secondary enrolment withimproved levels of quality would seem largely supportable fromdomestic resources. The data suggest that significant economies couldarise from various structural changes that would ease the financialburden of enhanced participation. These include discouraging thegrowth of enrolments in small enrolment secondary schools, phasing outrelatively expensive three-year secondary schools, reconsidering therationale for secondary technical schools and the need for their relativelyhigh costs per pupil, and setting minima on permissible pupil/teacherratios.
Alongside these measures there are others that are desirable andwhich increase costs. These costs might be justified by their impact onimproved quality and performance. The 25 per cent of teachers who areunqualified represent salary savings of only about 4 per cent. Ensuringall teachers are trained could have a positive effect on pupils’performance and promotion rates without generating unsustainablecosts, although some of the data reviewed suggest that the links betweenthe number of qualified teachers and academic performance are not
280
Financing secondary education in developing countries

International Institute for Educational Planning http://www.unesco.org/iiep
281
Secondary education financing in Costa Rica:recovering the initiative
clear-cut. Teacher salaries have declined in real terms and differentialsbetween secondary and primary teachers have diminished. Recruitmentof new secondary teachers is problematic. Some real increase insecondary teachers’ salaries may be necessary to improve motivation andcommitment. Provision of learning materials is widely regarded asinadequate and likely to impair learning. Many more textbooks andteachers’ guides could be provided at costs which are a small proportionof the recurrent budget.
Costa Rica has the opportunity to reverse the decline in secondaryenrolment of the 1980s and invest in measures to improve retention andparticipation through to the end of the secondary cycle. To do so willrequire some political will to make this goal a priority. It will also needsuccessful interventions to improve internal efficiency and enhanceschool quality so that demand does not falter. Such a strategy wouldseem needed if growth dependent on more knowledge-based industriesis to be realized.

International Institute for Educational Planning http://www.unesco.org/iiep
This chapter seeks to develop an analysis of the main options available togovernments seeking to finance increased access to and participation insecondary schooling. The first section summarizes findings from the case-study data. The next sections move to an analysis of the options under fivedifferent categories. These are: increasing the allocation of public budgetsto secondary schooling, shifting resources between educational levels,reducing unit costs and increasing internal efficiency, identifying newsources of support from community and private sources, and mobilizingexternal assistance for secondary education.
Lessons from case-study data
The first group of case studies explored the development ofsecondary schooling in Zimbabwe and Malawi and developed asynthetic overview of five francophone countries – Burkina Faso, Mali,Senegal, Madagascar and Côte d’Ivoire. The subsequent summariesrelate to the two Asian cases of Sri Lanka and China, and to Costa Rica.
Zimbabwe achieved independence in 1980 and immediatelycommitted itself to universalizing primary schooling and providing moreaccess to secondary schools. Secondary participation grew from a grossenrolment rate of below 15 per cent to over 40 per cent by the early1990s. Since then this level has been maintained but not improved.Transition rates from primary to secondary initially fell, but from the late1980s onwards remained fairly stable at around 65 per cent. During theperiod of rapid expansion at secondary, pupil/teacher ratios increased toover 40:1, but then fell back to between 25:1 and 30:1. Untrainedteachers were recruited in large numbers and trained whilst they wereworking to achieve this result.
283
Chapter X
Financing increased access and participation at secondary level:
main policy optionsFrançoise Caillods and Keith Lewin

International Institute for Educational Planning http://www.unesco.org/iiep
Several factors appear to have contributed to Zimbabwe’s successin expanding secondary provision. First, there has been a high level ofcommitment of public resources. As much as 8 per cent of GNP and 17per cent of public expenditure have been allocated to the educationbudget as a whole. The allocation of resources to tertiary institutions hasbeen limited to a small proportion of the total. Allocations to secondarylevel reached between 2 per cent and 2.5 per cent of GNP, well above theaverage for sub-Saharan Africa. Second, the costs per student atsecondary appear to average about twice those at primary, a low ratio bysub-Saharan African standards. Part of the reason is the extent to whichthe public finance is supported by fees and other contributions. Thesystem of school administration shares costs with local authorities andcommunity-based organizations, though teachers’ salaries are paid bythe government. Fees appear to range between virtually full-costrecovery to about one-third of the cost per pupil.
Third, automatic promotion at primary has reduced repetitionrates to low levels, thereby increasing participation at the same level ofcost. Fourth, double shifting has also made a contribution to increasedcapacity, thus saving on capital costs. This, and the savings fromemploying substantial numbers of untrained teachers, who are paidbelow the rates for qualified teachers, eased the short-term burdencreated by expansion.
The analysis also draws attention to some of the problems thathave been associated with expansion. Attrition throughout secondaryschooling remains significant, especially amongst the poor and for girls.The most common explanation relates to the relatively high costs thatfall on parents. Fee levels are correlated with the quality of provision.Efforts made to diminish differences between school types do not seemto have been effective. Differences in public subsidy remain skewedtowards the more advantaged schools.
Simulations show that GER2 could be increased at sustainablelevels of cost if repetition fell and drop-out were reduced, especially ifpopulation growth slowed down as is predicted. The major policyquestion appears to be whether labour-market signals, which suggesthigh levels of unemployment amongst secondary leavers, indicate thatfurther expansion of secondary schooling should not be prioritized. Analternative would be to invest more in democratizing access to existingschools (e.g. through scholarships and fee waivers to poor households),improving quality to reduce repetition and drop-out, and reducing thedifferences that persist between school types.
284
Financing secondary education in developing countries

International Institute for Educational Planning http://www.unesco.org/iiep
Financing increased access and participation at secondary level:main policy options
285
Malawi has faced a much more difficult state of affairs. Nearuniversal free primary education has been achieved without significantexpansion of the public secondary-school system. Secondary GERsremain very small in the normal public-school system, at around 7 percent. Fees in government schools are small and represent 5-15 per centof actual costs, with all other costs being borne publicly. Enrolments inthe Malawi College of Distance Education (now Community DaySchools) have grown rapidly since 1994 to over 100,000 students,equivalent to a GER2 of about 13 per cent. This system is of low qualitywith pass rates of less than 10 per cent. The expansion was madepossible by the low public costs of the MCDE system and the fact thattwo thirds or more of total costs are paid by parents through fees. Fullyprivate schools have also developed rapidly, and now account for around15 per cent of total enrolment.
The difficulties in improving access to and quality in secondaryschooling arise from several sources. First, the overall budgetaryposition is constrained by a lack of economic growth and the fact thatabout 6 per cent of GNP is already allocated to education. Within thistotal more than 65 per cent is needed to support free primary education.Of that which is left, more is allocated to support tertiary institutionsthan to the entire public secondary-school system. Second, costs perstudent in normal secondary schools are high and average about seventimes those in primary schools. This in itself constrains growth since,ceteris paribus, the costs of the secondary system will grow rapidly inrelation to the overall budget if participation increases.
Third, government secondary schools are typically small (400-500),suffer dis-economies of scale, and are usually operated at relatively lowpupil/teacher ratios of 15-20:1. Fourth, boarding is widespread and is thepreferred method of schooling of many parents. It is heavily subsidized ingovernment schools. Not all the boarding appears justified by location,though some is as a result of the low enrolment rate and large catchmentareas of schools. Fifth, a further constraint on secondary expansion isteacher supply. If all secondary teachers are to be graduates, as is nowintended, it is likely to prove difficult to attract enough graduates intoteaching because of the small output of secondary schools and the highereducation system.
The magnitude of the financial challenge is considerable.Simulations suggest that merely to sustain the free primary educationenrolment gains will generate costs that are likely to exceed imaginablegrowth in the education budget, even if repetition and drop-out fall fromhigh levels. Any expansion of secondary represents an additional cost.

International Institute for Educational Planning http://www.unesco.org/iiep
Increasing participation to the levels found in Zimbabwe (GER 40 percent) with current cost structures in government schools would requireup to four times current spending on education in Malawi. The onlypossible source of much of this would be external assistance.
The Malawi Government is committed to expanding access tosecondary schools and there would seem to be compelling reasons whythe participation rate should be increased from its very low base. Insummary, it is possible to imagine modest and sustainable growth insecondary schools of reasonable quality, financed by a mixture ofincreased private contributions, efficiency gains, and strategic donorassistance. However, realistically even this will result in a gradual ratherthan a rapid increase in participation, unless costs per student aresubstantially reduced and/or private contributions raised.
The francophone African countries analyzed are ones wheresecondary GERs remain small, the highest being 23 per cent in Côted’Ivoire. The difficulties in improving access to and quality of secondaryschooling arise from several sources. First, universal primary educationis far from being attained in all of these countries and competition forscarce resources is fierce. Second, the overall budgetary position isconstrained by a lack of economic growth, a limited fiscal base andheavy commitments to debt servicing and reimbursement. Côte d’Ivoirealready allocates 5 to 6 per cent of its GNP to education and it seemsdifficult to go much beyond this level. Third, costs per student insecondary schools are high and average several times those in primaryschools. Fourth, the problem of unemployment of secondary-schoolgraduates is already serious. Selective rather than general expansion ofparticipation at secondary is the most attractive option until economicgrowth returns.
Several of these countries have committed themselves explicitlyto expanding access to a nine-year basic education which entails primaryand lower-secondary education (e.g. Mali, Senegal and Côte d’Ivoire).The magnitude of the financial challenge is daunting. Measures that arebeing considered include reducing the length of secondary education(Mali), encouraging the development of the private sector (Côte d’Ivoire,Madagascar, Mali) and introducing cost sharing. The full range of policyoptions will be discussed below. What proportion of public resourcesshould be devoted to secondary education is perhaps the key issue untila better coverage at the primary level is achieved.
Sri Lanka has achieved high levels of secondary enrolment at lowcost and is a low-income country. By the mid-1980s gross enrolmentrates at secondary exceeded 65 per cent. Primary GERs had been over
286
Financing secondary education in developing countries

International Institute for Educational Planning http://www.unesco.org/iiep
Financing increased access and participation at secondary level:main policy options
287
100 per cent for a decade. Sri Lanka has managed to achieve this whilstconsistently investing around 3.5 per cent of GNP in education, and notmuch more than 10 per cent of government expenditure.
The main factors that have contributed to Sri Lanka’s success are:first, that the unit costs of schooling are relatively low and typicallyaverage about 10 per cent of GDP per capita. This is not becausepupil/teacher ratios are unusually high, since they average about 26:1,but arises primarily from the fact that salary levels relative to GDP arelower than in many other countries. Second, Sri Lanka has an unusualpattern of open access to schooling without selection through to Grade10. Many secondary schools include primary sections and benefit fromthe economies of scale that this can yield on fixed costs. They may alsoshare staff across grades. Teachers are not as strongly differentiated intoprimary and secondary as in many other countries. As a result, the costsof secondary-school places are on average no more than twice those ofprimary.
Third, higher education has only recently begun to absorbsubstantial proportions of the education budget. Whilst secondaryenrolments were growing, higher education typically accounted forabout 15 per cent of the budget. Fourth, enrolment gains have beenachieved in a context of demographic transition to low growth. Thegrowth in the school-age cohort is about 1.2 per cent and is projected tofall further. This has reduced the demand for new teachers and buildingsconsiderably. Fees and other community contributions have not beensignificant in financing expanded access in Sri Lanka. Fees generate nomore than about 3 per cent of recurrent costs.
Problems remain which include the fact that a substantial numberof schools in rural areas have under-enrolled lower-secondary grades.Primary schools have been allowed to expand to acquire lower-secondary grades with small numbers of pupils. If more use was madeof multi-grade teaching and minimum class sizes were introduced,considerable benefits in terms of savings would be available. Inequalitiesbetween schools persist, especially between those secondary schoolsthat have university entrance grades and those that do not. Most of thedifferences in public expenditure per child can be traced to thedeployment of teachers.
In summary, Sri Lanka has achieved high secondary-enrolmentrates at low costs and is able to sustain these. The main reasons relate tolow teacher costs, patterns of school organization which link primaryand secondary schools, and low population growth.

International Institute for Educational Planning http://www.unesco.org/iiep
288
Financing secondary education in developing countries
China has had a very diverse experience in expanding access tosecondary schools. Conditions vary widely across this vast country.Liberalization and the development of a socialist market economy haveresulted in a great range of financing mechanisms. These havecomplemented certain long-standing structural features of schoolfinancing that are uncommon outside China. Schools are integral partsof local economic and political organization and teachers are membersof work units (danwei), which have a range of economic and socialresponsibilities. Local school financing is dependent on the activities ofthese groups and systems of local taxation.
Common arrangements include earmarked local taxation foreducation levied on business turnover and payrolls; allocation of a shareof the profits of school-run businesses (these are enterprises in commonownership); and different forms of collective work-unit support forschools based in the community (in cash from fund-raising and in kindfrom labour, etc.). Other significant elements that sustain relatively highsecondary enrolment rates include low population growth; effectivecompulsory attendance legislation backed by sanctions on employers;and performance-related structured salary schemes, which provide basicsalaries enhanced by productivity-related payments for teachers.
Case-study data from a rapidly developing urban coastal area notethat schools have a high level of dependence on work-unit-relatedincome from activities unrelated to schooling. Entrepreneurial use ofschool assets (e.g. renting space and buildings) is widely practised.Some urban schools generate substantial income from fee-payingstudents from outlying areas. One consequence has been thedevelopment of large differentials between teachers’ income, andbetween unit costs, in urban and rural schools. Large differences haveemerged between teachers’ (publicly funded) salaries and teachers’ totalincome as a result of non-budget contributions from fund raising.
These developments have created a number of tensions. It is notclear how increased participation can be financed in poorer areas, whereopportunities to generate off-budget income are extremely limited. Thereare few effective mechanisms to limit the growth in inequality in schoolfinancing. As financial autonomy has developed alongside greaterdegrees of decentralized control, procedures to assure quality andcompliance with national legislation on standards and performance havebeen slow to develop. There appears to be a growing problem ofensuring an adequate supply of competent teachers in areas where basicsalaries cannot be substantially enhanced.

International Institute for Educational Planning http://www.unesco.org/iiep
Financing increased access and participation at secondary level:main policy options
289
China can support high levels of secondary enrolment in urbanareas at low costs through a combination of relatively low budgetedsalary costs, high levels of additional school income from revenueraising, work-unit subsidies, fee-paying students from outlying areas,and because low population growth has resulted in a shrinking agecohort.
Costa Rica has had a consistent development strategy favouringinvestments in the social sector. It achieved relatively high levels ofsecondary participation more than two decades ago. Recession in the1980s was accompanied by a decline in enrolment rates at secondaryfrom about 62 per cent to 49 per cent. Though participation remainssubstantial, there are concerns that the relatively small proportion ofsecondary graduates in the labour force may hinder competitiveadvantage in attracting foreign investment.
Costa Rica invests heavily in education and is unlikely to increasethe amounts allocated as a proportion of GDP, which are around 6 per cent.However, pass rates, as well as repetition and drop-out rates in secondaryschools, are indicative of problems with quality and fragile effectivedemand. The proportion of those completing secondary education is notmuch higher than for those with tertiary qualifications. Unusually, thetertiary budget is constitutionally protected, as is the proportion of GNPspent on education as a whole. This currently results in more being spenton tertiary-level subsidies than on the secondary-school system. The ratioof costs between primary and secondary is close to 1:1.
If secondary retention and success rates are to improve, and ifparticipation rates are to reach levels in countries with which Costa Ricacompetes for inward foreign investment, reform is needed to increaseefficiency, encourage retention to the end of the secondary cycle, andallow growth in participation within sustainable financial allocations.Several measures could contribute to this.
The case study suggests the need for consideration of an increasein secondary teachers’ salaries to make the profession more attractive tohigh-quality graduates. If this were coupled with rationalization of thecurriculum to bring the cost of technical schools closer to those ofacademic schools, some of the costs could be offset. In addition, it mightbe possible to increase the average school size to generate economies ofscale and reduce the number of expensive three-year secondary schools.Earmarked funding for secondary-school development, similar to thatconstitutionally prescribed for higher education, could also be helpful.Other desirable developments include measures to improve quality to

International Institute for Educational Planning http://www.unesco.org/iiep
make secondary schooling more attractive (e.g. curriculum reform,scholarships for students from low-income households, subsidies toensure the availability of learning materials, the providing ofopportunities for all untrained teachers to be trained).
Options available to finance increased participation in secondary schooling
The options available to increase access to and participation insecondary schooling in developing countries fall into five groups. It maybe possible to adopt strategies based on one or more of these options.First, the overall allocation of public investment to education could beincreased and used to enhance investment in secondary schooling.Second, resources allocated to other levels of education might beredirected towards investment at secondary level. Third, existing publicresources could be utilized more efficiently and unit costs could bereduced so as to provide more access. Fourth, new national sources offinance could be identified through greater private and communitycontributions. Fifth, external assistance could be re-profiled to yieldmore benefits for the development of secondary education. Theremainder of Chapter 10 will present these various options and discusstheir advantages and disadvantages.
Option 1: Increase overall allocations to the education sector
The room for manoeuvre to increase overall expenditure oneducation, and that on secondary in particular, is constrained in differentways in different countries and therefore no general prescription ispossible. The analysis in Chapter 2 showed that countries with lowGER2s (below 40 per cent) were spending on average about 4 per centof GNP on education and allocated about 18 per cent of governmentexpenditure. These figures appear to have increased modestly from 1985to 1995. It was noted that the macro-economic situation in many of thesecountries with low enrolment rates has been disappointing and GNP percapita has often not grown. Indeed, many African countries with lowGER2s have experienced negative growth. In these cases, although theproportion of the public budget allocated to education may have beenincreasing, the real value it represents may have declined.
Countries with higher levels of GER2 typically allocate 5-6 percent of GNP to education as a whole. It would seem reasonable to arguethat countries that currently allocate less than 5 per cent of GNP to
290
Financing secondary education in developing countries

International Institute for Educational Planning http://www.unesco.org/iiep
Financing increased access and participation at secondary level:main policy options
291
education should raise their commitment to the levels found in the higherGER2 countries. This could release more resources for secondaryschooling. Two elements should however be kept in mind. First, the statefinancial support for education is constrained by the amounts that thestate can levy through taxes on economic activity and by the share ofpublic resources that can be devoted to education. There are manycompeting demands. In most of the low GER2 countries, the size of themodern sector from which government can draw taxes is very limited1
Educational investment has to be balanced against demands from othersocial sectors, such as health, agriculture and manufacturing, and frompublic works for infrastructure. Debt servicing also drains substantialproportions of revenue in the highly indebted poor countries. Second, inmany of the low GER2 countries primary enrolment rates are also lowand improvements in access and retention at the first level are beingaccorded priority. Thus, even if the overall proportion of GNP allocatedto education could be increased, much of the benefit might be absorbedby the financial demands of expanded primary schooling in thesecountries2. Where there are high levels of primary enrolment andrelatively low GER2s, it is more likely that an increased allocation of upto 5-6 per cent of GNP could be directed towards expanding access tosecondary schooling. It would seem clear that, aside from a fewexceptional cases, if secondary enrolment is to expand, it is not likely tobe financed from large increases in public education budgets as a whole.
Option 2: Shift resources from other levels within the education sector
A second possibility is that additional resources for secondaryschooling can be mobilized through a redistribution of current patterns ofallocation between levels. The data in Chapter 2 show that low GER2countries do not on average allocate disproportionate amounts to highereducation when compared to countries with higher GER2s. However, thisoverall observation conceals the fact that in some countries, e.g. Malawiand Costa Rica, more public funds are allocated to tertiary level than to theentire secondary-school system. In these cases there clearly is an argumentfor a shift in the balance between levels in favour of secondary schooling.
It is the case that unit-cost differentials between levels (primary,secondary, and tertiary) are much greater in low GER2 countries.Secondary unit costs average 3.5 times those at primary in low GER2
1. Most of the taxes are indirect taxes and taxes on imports and exports.2. Debt forgiveness has changed the short-term circumstances of those countries that have
benefited from recent polic changes by lending agencies and governments.

International Institute for Educational Planning http://www.unesco.org/iiep
countries (and much more in some cases), but less than double primary inother groups of countries with higher GER2s. Higher-education unit costsfollow the same pattern with a much stronger skew towards relativelyhigh values in low GER2 countries (more than 30 times primary costs).This suggests that the relative level of unit costs at secondary is aconstraint on enrolment growth in many low GER2 countries.
The next section discusses the problem created by relatively largedifferences in unit costs between secondary and primary and the highlevel of secondary costs in relation to GNP. If overall public budgetallocations to education are unlikely to grow substantially, if the balanceof investment between education levels is not unduly skewed, and if theunit costs of secondary are relatively high, then reforms have to beconsidered that will reduce the relative unit costs of secondary in lowGER2 countries and permit greater participation and access.
Option 3: Reduce unit costs at secondary level and/or produce moregraduates with existing resources
A third option is to find ways of reducing the unit costs ofsecondary schooling so as to enrol more students and produce moregraduates with the same amount of resources. Option 3.1 discusses thevarious measures that would allow reductions in unit costs. Theseinclude: structural reforms (e.g.: reducing the length of secondaryschooling); curriculum re-organization (e.g. restricting the number ofunduly expensive options); changes that would improve teacherutilization (e.g. increasing pupil/teacher ratios); and reductions inaverage salary and non-salary costs (e.g. increasing pupil/teacher ratiosand changing the profile of the teaching cadre). Option 3.2 reviewsmeasures aimed at improving efficiency, i.e. increasing the number ofstudents enrolled and graduates produced at the same level of cost(which may also incidentally reduce unit costs). Option 3.3 exploresways of reducing capital costs and Option 3.4 considers alternativedelivery systems.
Option 3.1: Reducing unit costs
• Structural issues – modifying the length of secondary schooling
First, it is necessary to consider some structural issues, the mostprominent of which is the length of secondary schooling. Most developingcountries inherited the structure of their education systems from formercolonial powers. Over time, some have diverged from their original form
292
Financing secondary education in developing countries

International Institute for Educational Planning http://www.unesco.org/iiep
and have varied the number of years in different educational cycles and therange of types of schools. The reasons for change are numerous and rangefrom equity considerations (e.g. increasing the number of years of basiceducation available to all), to cost concerns and political factors (e.g.shorter cycles have lower costs; some countries have changed to reflectpatterns common to neighbouring countries). It should be noted howeverthat no research is available that establishes the effectiveness of one typeof structure over another as far as pupils’ achievements are concerned andthat although this is sometimes asserted, it has yet to be demonstrated.
Currently there is a wide range of variation in the structure ofsecondary provision. This is illustrated in Table 10.1. Pattern 1corresponds to the traditional structure of the French education system,with two relatively long secondary cycles after a short primary course.This pattern has influenced many francophone countries in Africa(Pattern 6). Pattern 2, with three short cycles at secondary level,corresponds to the education system that existed in many former Britishcolonies in Asia and Africa. Pattern 9 is increasingly found in countriesthat have integrated primary and lower-secondary education into onebasic education cycle. The other patterns listed illustrate most of thepossible ways of dividing secondary education into one, two or threecycles, with or without selection from one to the other and with differentlengths of lower- and upper-secondary cycles.
Table 10.1. Structure of secondary provision
293
Financing increased access and participation at secondary level:main policy options
Pattern Years Years Years Years Description Primary Lower Upper Total
Secondary Secondary
1 5 4 3 12 Long lower secondary; upper-secondary selective2 5 3 2-2 12 Average lower secondary, 2-stage selective upper secondary3 6 3 3 12 Equal-length secondary cycles; upper-secondary selective4 6 2 4 12 Short lower secondary; long upper secondary;
upper-secondary selective5 6 4 2 12 Long lower secondary; short upper secondary;
upper-secondary selective6 6 4 3 13 Long lower secondary; lower- and upper-secondary selective7 6 5 2 13 Long lower secondary; short very selective upper-secondary 8 8 2 2 12 Long first cycle; short equal-length lower and upper secondary9 9 3 12 Long first cycle; short equal-length lower and upper secondary
10 10 2 12 Long first cycle; selective upper secondary 11 7 5 12 Long first cycle; non-selective lower and upper secondary12 6 6 12 Non-selective lower and upper secondary13 8 4 12 Long first cycle; non-selective lower and upper secondary14 10 2 12 Very long first cycle; non-selective lower and upper secondary

International Institute for Educational Planning http://www.unesco.org/iiep
Each pattern has to be seen in relation to the length of primaryeducation and the total number of years of schooling available. Pre-university education lasts 12 or 13 years in almost all systems. A trendis for it to become 12 years, excluding early childcare and pre-schooleducational arrangements.
The longer the primary education cycle and the shorter secondaryeducation, the cheaper it is to finance the same overall length of schooleducation. This follows from the fact that the costs of primary educationare almost everywhere lower than those of secondary education3.Primary teachers are paid less than secondary teachers4; they tend toteach most or all subjects and are therefore less likely to be under-utilized than specialist secondary teachers. It is also true that non-salarycosts are lower, since the equipment and the facilities required inprimary are relatively simple. Other advantages advanced for longerprimary cycles are that these may encourage enrolment and retentionamongst children from rural areas and girls. The distance from home toa primary or upper-primary school is likely to be less than that for asecondary school and drop-out is often high at the point where pupilstransfer from one school to another. When these factors are taken intoconsideration, systems which offer 8 years of primary education,followed by 4 years of secondary education, are likely to be easier tofinance than systems of the 5-4-3 or 6-3-3 type, assuming similar levelsof participation.
The drawbacks of long primary cycles and shorter secondary arethat they may be seen as offering a lower-quality education. Non-specialist teachers may not be able to teach all the subjects effectively inthe higher grades of primary, e.g. mathematics, a foreign language,science, technology, or they may not teach them at all. In many countriesthat have long primary cycles, specialist teachers do teach upper-primaryclasses. However, they tend to be less qualified than specialist teachersat lower-secondary level. Another possible disadvantage is that althoughin principle pupils can be enrolled in the same local school through along primary cycle, this may not always be feasible in low population-density areas. Systems are not uncommon where children may have togo through a variety of types of primary school to finish the first cycle,
294
Financing secondary education in developing countries
3. The only exceptions for the public sector are where the public/private mix of funding isvery different at secondary level, such that a great part of the total secondary-schoolcosts are borne privately. This does not apply in most low GER2.
4. Secondary-school teachers’ salaries are invariably greater than those of primary-school teachers. Primary-school teachers tend to have greater teaching loads thansecondary-school teachers and often work at higher pupil/teacher ratios.

International Institute for Educational Planning http://www.unesco.org/iiep
Financing increased access and participation at secondary level:main policy options
295
e.g. satellite school, lower-primary school, upper-primary school. Inthese cases, long primary cycles lose the benefits associated withcontinuous attendance at the same school. Systems which privilege levelof achievement over access may favour earlier transition to secondary onthe grounds that specialist teaching can be made available sooner, albeitto fewer pupils.
Most countries continue to divide secondary schooling into twocycles: junior and senior or lower and upper. Increasingly, the firstsecondary cycle is based on a core curriculum which leads to selectionand more diversified upper-secondary schooling. Lower-secondaryschooling is likely to be cheaper to provide than upper secondary forreasons similar to those that result in overall cost differences betweenprimary and secondary. The trend at lower secondary is to have fewcurriculum options and little specialization, allowing high rates ofteacher utilization. The equipment required is simpler than that at higherlevels and specialized rooms are infrequently needed. In science, one ofthe most expensive subjects, the provision of kits can help in the supportof teachers’ demonstrations and multi-purpose rooms can be builtinstead of expensive specialized laboratories. The qualifications andsalaries of lower-secondary teachers are usually lower than those foundin upper secondary. In addition, boarding facilities (a major cost wherethey exist) are less likely to be necessary at lower-secondary level – ifenrolment rates are higher at this level, the area from which the studentpopulation is drawn should be smaller. It may on the other hand be morenecessary to maintain boarding facilities at upper-secondary levels toensure equitable access.
For these kinds of reasons, and because class sizes, pupil/teacherratios and teaching loads are all typically higher at lower rather thanupper secondary, longer lower-secondary cycles might be thought to beeconomically attractive. It may be possible to provide lower-secondaryplaces for half or less than the cost of upper secondary (excluding theissue of boarding). Naturally, where lower- and upper-secondary coursesare offered in the same school and where pupils from both levels mayshare the same facilities and teachers, differences in costs between levelsought to be less.
As a result of this difference in cost, for the same overall durationof secondary education, systems where lower secondary is longer andwhere upper secondary – the specialization phase – is short, may appearcheaper to organize. If, however, a severe selection occurs at the end ofthe first cycle, a short lower-secondary cycle may appear, to start with,

International Institute for Educational Planning http://www.unesco.org/iiep
to be a more feasible solution as far as resources are concerned5. For thisand other considerations some of the anglophone countries of Africahave postponed high levels of specialization to the post-secondary orpre-university level.
It should be remembered that the length of primary and secondaryschooling in particular countries is embedded in the fabric of theireducational history and infrastructure. Curricula, examination systems,points of selection and transition to specialized courses and institutions,systems of teacher qualification and deployment, and buildings are alllinked to current patterns. Also relevant to the length of the differentcycles will be the legal age at which employment is allowed. To changethe length of an educational cycle may therefore have ramifications thatare far-reaching and involve substantial transitional costs. Curricula andexaminations may have to be revised, teachers retrained6, and buildingsreconfigured or replaced. This is not an argument for maintaining thestatus quo regardless of its characteristics. It is an argument forconsidered judgements about whether the benefits of change comparewell with the costs.
Decisions on the length of the different cycles of schooling are notusually made primarily on economic criteria. Nor should they be. However,it is clear that there are balances to be struck which have consequences forthe utilization of the resources available and ultimately for the extent towhich access to and participation in secondary level can be supported.There are circumstances where it is advisable and feasible to reschedule thebreak between primary and lower secondary, or change the balance of timebetween lower and upper secondary. If these offer the opportunity ofincreased internal efficiency and greater participation at sustainable levelsof cost that do not undermine quality, they should be considered.
• Curriculum issues
In many developing countries secondary-school curricula havebeen derived from learning needs originally identified for the minoritythat would continue to study through to higher education. Few systemshave developed curricula that favour the needs of those who leavesecondary school over those who continue. This is understandable, given
296
Financing secondary education in developing countries
5. Some countries have indeed changed the duration of their lower cycle several times toadjust for their human and financial resources, e.g. Bostwana.
6. Bearing in mind that it is almost certainly easier to retrain primary teachers to teach atlower-secondary level (and lower-secondary teachers to teach at upper-secondary level)than to contemplate any changes in structure that would require shifting lower-secondaryteachers to primary level.

International Institute for Educational Planning http://www.unesco.org/iiep
the historic origins of most systems and the selective character ofsecondary schooling which restricts access to a small minority of thepopulation. And, indeed, those who succeeded in completing secondaryoften did continue to higher levels and became members ofadministrative, professional and managerial elites. As access andparticipation expand, however, the characteristics of the secondary-school population change. Thus, while systems with small secondaryenrolments are generally populated by relatively homogeneous membersof a selected group, often endowed with substantial cultural capitalarising from relatively privileged home backgrounds, in expandedschool systems, secondary students are likely to be more heterogeneoussocially, ethnically, culturally and economically. Their occupationalfutures are also likely to cover a much wider range. Curricula contentand teaching methods have to recognize the characteristics of this newpopulation of students in ways that ensure motivation and relevance andyet control costs to sustainable levels.
Decisions therefore have to be taken about curricular organizationand specialization that recognize the diversity of student needs, wantsand capabilities. The options available include: the provision of a corecurriculum, where all pupils study the same subjects; streaming systems,which track different groups of students along different curriculapathways, and modular or option systems, which allow many differentcombinations of subject matter and learning activities to be integratedinto the curriculum experience of different students.
As noted above, the first option, offering a core curriculum, isincreasingly becoming the norm at lower-secondary level. Lowersecondary is seen as a consolidation of basic skills and a deepening ofthe foundations for future learning. Where a consensus on curriculaareas to be prioritized can be reached, e.g. national and foreignlanguages, mathematics, science and health, social studies, sports,aesthetic subjects, a common curriculum can be offered quite efficiently.The conditions are that the number of subjects provided should not betoo large, teachers should cover several subjects, and teaching andlearning should be managed in whole class groups.
A growing tendency is to specify curricula in terms of outcomesand levels of achievement rather than content. This invites the definitionof a common core of educational outcomes that are thought to beessential for all those completing the cycle. Adopting a common core ofoutcomes at this level does not preclude variation in the content anddelivery of the curriculum to recognize heterogeneity in the student
297
Financing increased access and participation at secondary level:main policy options

International Institute for Educational Planning http://www.unesco.org/iiep
population. In addition, minimum target levels of achievement, valid forall, should not be taken as maxima. Many outcomes can be achievedthrough different routes with different content. In many subject areascommon tasks can be set where different levels of achievement areexpected.
At upper secondary, on the other hand, some degree ofdiversification is considered a necessity. Differences in capability arelikely to be most marked in some subjects like mathematics andlanguages, making whole class teaching of the full range of studentsimpracticable. Students’ preferences and dispositions become moremanifest. And, once basic skills have been consolidated, the case forallowing differentiation to make better use of students’ potentialbecomes stronger. Some also argue in favour of the study of fewersubjects in depth, rather than more in breadth. The policy choices thatemerge are between tracking into different streams, or allowing studentsto choose from a variety of options or curriculum modules that can beaccumulated in many different ways to build up a programme of study.
Streaming is widely practised at upper-secondary level. Mostcommonly there are variations of traditional arts and science, socialsciences, commercial studies and a range of other possibilities, includingtechnical subjects. If schools are large enough, streaming can be plannedand managed efficiently, providing group sizes do not fall to smalllevels. Over-specialization can be ameliorated by retaining some coresubjects and general studies offered across specializations. Also,electives may be offered within streams. Simple streaming systems limitchoices to a narrow range and require that the flow of students bemanaged to match facilities and teaching resources available. Restrictedchoice can be seen as a disadvantage to the extent that it makes itdifficult to subsequently change track. The fact that different streams areoften also not given the same level of academic, cultural or economicrecognition may also be considered problematic.
The main alternative to streaming is to organize the curriculumaround options, usually supported by a common core which occupies aminority of teaching time. This can respond more flexibly to thediversity of pupils’ interests and capabilities and allows an element ofsampling of specializations without full commitment to a stream. If thechoice of the options is left to schools, there will be variation betweenschools that will create differences in opportunity depending on theschool attended. However, this does allow curricula specificity to thelocal environment and the characteristics of students. If the number of
298
Financing secondary education in developing countries

International Institute for Educational Planning http://www.unesco.org/iiep
options offered and assessed in examinations is high, teaching groupsare likely to be small and costs high. There are cases where, in sciencealone, as many as 12 options can be offered and examined, which raisesquestions as to whether such diversity is necessary (Caillods,Göttelmann-Duret and Lewin, 1997). It is certainly expensive.
Option and module systems can be complex to design, timetableand assess. They often carry higher overhead costs than streaming,precisely because they allow more choice. They can create difficultiesfor staffing, because demand for options may fluctuate widely from yearto year and the substitutability of teachers between specialist optionsmay be low. Wider choice also brings with it problems related to thebasis on which such a choice should be made. If it is the students whomake the choice, it may happen that young students and poorly educatedparents make decisions based on idiosyncratic criteria – perceived easeor difficulty of the subject, personality of the teacher, friendship group.These choices may turn out not to be in their best interests, neither forfuture studies nor in terms of work opportunities. If it is the school thatmakes the decision, there may be a danger that the choice is made on thebasis of the teachers available rather than on students’ interests andrelevance to the local community.
Whichever pattern of curriculum organization is chosen, a finalconsideration should be how secondary curricula can be designed inways that maximize the chances of successful completion, and thusimprove internal efficiency. Traditionally, curricula have been developedthat assume continuous attendance and progression through gradesdependent on mastery of previous material. Both these assumptions maybe flawed, especially in low GER2 countries. If, in fact, attendance isirregular, e.g. for economic reasons, then learning will not be continuousand cumulative, but episodic during periods of relatively continuousattendance. If this is true then, to the extent that it is possible, curriculashould be segmented into coherent learning sequences that do notdepend entirely on what was learned before. This would increase theprobability that those who attend irregularly could still make sense of theparts of the curriculum they experience. It is also possible to conceive ofpatterns of curriculum organization that deliberately include revisitingcore material to increase the probability that all pupils will have a chanceto achieve key learning outcomes even if they attend irregularly. This iseasier if curricula are conceived more according to outcomes rather thanto content.
299
Financing increased access and participation at secondary level:main policy options

International Institute for Educational Planning http://www.unesco.org/iiep
The last curriculum issue is the question of diversificationbetween general education and technical, vocational or other kinds ofspecialized provision. The costs of technical and vocational educationcan be notoriously high. This is usually due to the need for specializedequipment and facilities and constraints on teaching-group size inpractical subjects. Costs per pupil may be several times greater than ingeneral secondary schools. Yet there are indications that quality is oftenquestionable and competences relevant to employment are notnecessarily acquired. Some economists argue that for cost-effectivenessreasons, technical and vocational education should take place outside theschool system in enterprises or in specialized centres and be managed byspecialized agencies geared to meet anticipated labour-marketrequirements (Middleton et al., 1993). Funding from the World Bankand bilateral agencies for school-based technical and vocationaleducation in the 1990s was modest as a result of doubts about itseffectiveness. Nevertheless, the size of enrolment in such streams has notdeclined significantly, except in the poorest countries in Africa, whichindicates that there can be a strong demand from students and familiesfor such courses (Atchoarena and Caillods, 1999).
The policy on diversification related to technical and vocationaleducation has to be different in economies at different levels ofdevelopment. Knowledge and the variety of skill requirements increasewith the development of the industrial base and the growth of the servicesector employment. In sophisticated economies the trend is to reinforcethe scientific and technological content of vocational courses offered atthe upper-secondary level and to promote flexible specialization, sincespecific skills rapidly become outdated by changes in technology. Thenumber of specialities offered is often reduced, specialization isapproached by grouping large families of occupations around keycompetences and further specialization introduced through modules andoptions towards the end of the secondary course or at post-secondarylevel (Atchoarena and Caillods, 1999). The strategy to be adopteddepends on the nature of the learning required (general and transferable,specific and complex, high or low levels of collateral knowledge andskills, rapidly changing or slowly evolving, etc.) and on how demand forknowledge and skills expresses itself in the labour market.
Resource-poor countries, on the other hand, may be better advisedto match enrolments in specialized vocational schools to meet existingor foreseeable work opportunities, to find appropriate mechanisms tofinance them with contributions from employing organizations, and to
300
Financing secondary education in developing countries

International Institute for Educational Planning http://www.unesco.org/iiep
support a variety of non-formal training programmes that can be offeredto secondary-school leavers, and to workers in the formal and informalsector of the economy.
As an alternative to traditional technical and vocational streaming,various pre-vocational subjects have been introduced into juniorsecondary-school curricula as electives, e.g. in Ghana, Kenya, Nigeria,Zimbabwe. These have as an objective the orientation of pupils towardsself-employment and viable livelihoods, teaching them skills that couldbe useful for further training or income-generating activities (McGrathand King, 1995). These programmes have a mixed history. Where theyare well organized, adequately resourced and have carefully thought-outcurricula complementing other school subjects, they can make avaluable contribution to preparation for life after school. If theseconditions are not met, they may end up being low-status costlycurricula with low levels of commitment from staff and students. Manylong-standing and expensive courses on bricklaying, carpentry andmetal-work have thus been provided in several African schools withlimited impact. As an alternative, a more imaginative approach to thedevelopment of mathematics, science and related curricula could beconsidered. Teaching applied mathematics (relating it to the day-to-dayoperations), and technologizing science education to place more stresson application could offer an opportunity to provide skills andconceptual frameworks which overlap with those provided byconventional technical and vocational education without necessarilyincreasing costs disproportionately (Caillods, Göttelmann-Duret andLewin, 1997). In addition, the possibility of part-time or day-releaseexperience in artisan workshops or in small businesses could be exploredand encouraged (Hoppers, 1996).
In summary, curricula patterns do have cost implications. Whatthese are depend partly on the structural features that are embedded incurriculum design, e.g. teaching-group size, teaching time, specializedfacilities, learning materials. They also depend on how the curriculum isimplemented (timetabling, management of option choice, placement ofstudents to make efficient use of scarce facilities for particularspecializations). Generally diversified and specialized curricula havehigher costs than their alternatives and should therefore only be offeredwhere they have clear benefits.
General conclusions are difficult to reach, partly because labourmarkets vary so widely. Adequate basic education is a prerequisite foreffective vocational education and training. This favours delaying
301
Financing increased access and participation at secondary level:main policy options

International Institute for Educational Planning http://www.unesco.org/iiep
school-based specialization until after lower secondary has beensuccessfully completed. Subsequent tracking into technical andvocational programmes must recognize the realities of current and futurelabour market demand and the attractiveness or otherwise of graduatesof such programmes to employers. Choices have to be made which linkspecialized educational provision to effective demand and whichconsider the costs and advantages of other delivery systems (non-formaleducation and training, apprenticeship and other vocational courses).Given the importance of other delivery systems in providing thenecessary skills to primary and lower-secondary school-leavers,youngsters who follow such courses should not be denied access to someform of secondary education later on if they meet the requirements.
• Increasing pupil/teacher ratios and class size
The overall pupil/teacher ratio in secondary schools is the maindeterminant of recurrent costs7. Increasing the average number of pupilsper teacher is an option in some systems but not in others, depending onthe existing pupil/teacher ratio, the distribution of pupils, teachers andschools, and the organization of the curriculum. Pupil/teacher ratios atsecondary level average around 25:1 in the lowest GER2 countries andare 20:1 or less in those countries with higher GER2s (see Chapter 2).Though the pupil/teacher ratio is most significant for costs, it is the classsize that is likely to be most significant for learning. The relationshipbetween the two is not linear. It is determined by the teacher/class ratio(and how this is reflected in the detailed organization of teachinggroups). Teacher/class ratios at secondary tend to vary between about1.5:1 and over 3:1, largely independent of the pupil/teacher ratio.
Several analyses of test results within countries or acrosscountries indicate that achievement is not easily associated with classsize unless the differences are enormous. A plausible implication is thatwhat matters is not so much the size of the class as what takes placewithin it, which is determined at least in part by the quality of teachers(Hanushek and Kim, 1996; Hanushek, 1998). In some countries, e.g.Japan and Korea, average secondary class sizes are large (over 40), andyet their achievement results in the IEA Third International Mathematicsand Science Study in 1994-1995 are amongst the highest8. This can beinterpreted as leading to the conclusion that in countries where the
302
Financing secondary education in developing countries
7. Except in those systems where other salary and non-salary costs represent more than50 per cent of total recurrent costs. This can be true where boarding is prevalent.
8. Ninety per cent of Korean students are in classes of more than 40 students.

International Institute for Educational Planning http://www.unesco.org/iiep
average class size is less than 40, increases are possible withoutdiminution in performance. However, the maximum desirable number ofpupils per class in a particular system is in reality constrained by anumber of factors. These include a teacher’s ability to manage learningin large classes, availability of learning material, classroom size andfurniture, and patterns of curriculum organization. Though effectiveteaching may be achievable in some countries with class sizes of over50, this may not be the case elsewhere.
One attractive approach to answering the question as to whetheraverage class size can be increased within a system is to identify schoolswith large classes which are thought to be functioning effectively interms of appropriate indicators of performance. In many countriessuccessful schools can be found which operate at above-average classsizes. Where this is true there is a case to consider measures to increaseaverage class size and, ceteris paribus, reduce pupil/teacher ratios andcosts. Considerable benefits could arise from this for access andparticipation – increasing the pupil/teacher ratio by 20 per cent from25:1 to 30:1 could allow increases in participation of 10 per cent or moreat no extra cost.
Low pupil/teacher ratios can coexist with large class sizes, as inChina. This is possible where teaching loads in terms of hours per weekare low. This in turn may be due to the existence of pedagogical activitiesoutside of the classroom, an officially low teaching load or to asignificant under-utilization of teachers. It is characteristic of high GER2systems that teacher-per-class ratios are usually much lower than in lowGER2 systems. Where teacher-per-class ratios are high (between 2:1 and3:1), the issue this raises should not be avoided. The price of highteacher-per-class ratios is restricted access to secondary schooling.
In principle, reducing the number of teachers per class shouldreduce the number of teachers that need to be employed. It does implythat teachers carry out their teaching requirements, possibly that theirofficial workload be increased. This is both a school management issue(how are teaching groups organized in relation to staffing?) and aworkload issue (how many hours a week do teachers teach?).
• Improving teacher utilization
Teaching loads vary widely between systems. More importantly,available data suggest that average teaching loads often conceal widevariation from the mean. Specialized teachers restricted to particularsubjects may or may not be able to fill their timetable with full class
303
Financing increased access and participation at secondary level:main policy options

International Institute for Educational Planning http://www.unesco.org/iiep
groups. Electives that require specialized teachers may be taught tosmall groups by teachers with few classes. If teachers are paid by thehour, as in many Latin-American countries, it may not be thatimportant9, but where teachers are paid a full salary, even if they teachonly a few hours, this is a real issue. There may be several reasons forunder-utilization. The average size of schools may be too small to allowfull teaching loads across a broad pattern of curriculum specialization,option patterns may make it difficult to provide enough work for full-time specialized teachers, legal and practical impediments to teachertransfer from school to school may result in under-staffing of someschools coexisting with over-staffing in others. The solutions to theseproblems are often not easy to negotiate. Not to address them is to acceptthat opportunity to participate will be constrained by apparent shortagesin teacher supply, when in reality redistribution and reorganization couldsignificantly reduce such apparent shortages. In general, the training ofteachers to teach several secondary-level subjects, coupled with thedevelopment of curriculum materials that can be taught by non-specialists (adequate teachers’ guides, etc.), should increase theefficiency with which teachers can be deployed. We shall return belowto the question of improved teacher deployment.
Increasing the teachers’ workload
Decisions about whether teachers’ time on task can be increaseddepend on judgements of whether workloads are in fact low. Decisionshave to made at a system level about what constitutes normalexpectations of teachers’ work in terms of numbers and size of classestaught for a given number of weeks. Somewhat paradoxically, in severalfrancophone countries of Africa, the more qualified the teacher, thehigher the salary and the lower the teaching load. A teacher qualified toteach at upper-secondary level teaches fewer periods than a teacherqualified to teach at lower-secondary level, who in turn teaches fewerhours than a primary-school teacher. This also occurs in anglophonecountries, but is not as formally regulated. There may be legitimatereasons for this in terms of additional responsibilities of senior staff. It isattractive to propose norms for workloads that encourage more evendistribution of teaching loads and increase the average rate of utilizationof teachers. This could be achieved whilst retaining pay differentials
304
Financing secondary education in developing countries
9. It creates however other problems such as the teachers rushing from one school to anotherin order to accumulate teaching hours and income.

International Institute for Educational Planning http://www.unesco.org/iiep
related to qualification and expertise. It is also possible to contemplateextending the school year in terms of number of days of teaching. Theofficial school year can vary from under 170 to over 220 days. Withinthese totals many teaching days may be lost to periods of registration,special events, teacher absenteeism and in-service training andexamination periods. Where the total number of effective teaching daysis low, and teachers have excessive vacation time compared to otherprofessionals, both organizational and contractual reforms may benecessary.
• Reducing average teaching costs
An alternative approach to reducing the unit cost of secondaryschooling to make expansion of access more sustainable, is to diminishthe average teaching costs. This could be done in several ways. Not allof these involve loss of income for individuals. If the proportion ofuntrained or assistant teachers is increased, average salaries will decline.This will also be true where the average age of teachers is reduced as aresult of large-scale recruitment. Incomes of existing teachers will beunaffected. It should be remembered that in many countries in sub-Saharan Africa average teachers’ salaries have declined in real terms asa result of pay adjustments falling behind inflation and because of thegeneral deterioration in public-sector budgets arising from poor macro-economic performance. Where teachers’ salaries are inadequate toprovide incentives to teach effectively (to the extent that second jobsbecome common and teacher attendance problematic), cost savingsarising from real reductions in salaries cannot be seriouslycontemplated. Reductions in average costs arising from making moreefficient use of the time of trained teachers (working with teachingassistants, developing pedagogical methods that allow some periods ofself-instruction and peer learning, etc., in addition to increasing teacherutilization) are more attractive.
An illustration of some of the problems is provided by thefrancophone countries of West Africa. Expressed in terms of GDP percapita, secondary-school teachers’ salaries are relatively high in many ofthese countries: four times the income per capita in Madagascar, 9.5 timesin Côte d’Ivoire and 10.4 times in Senegal. Reducing average salarieswould go a long way towards reducing the unit costs. Côte d’Ivoire, forexample, decided to cut the salaries of all newly recruited teachers in1996, and has introduced a new salary scale for the new recruits. Mali andSenegal are now employing large numbers of ‘volunteers’ at the primary
305
Financing increased access and participation at secondary level:main policy options

International Institute for Educational Planning http://www.unesco.org/iiep
level, who are untrained graduates or fully trained teachers who could notbe recruited because of budgetary restrictions. These teachers earn asalary that is less than half that of a normal teacher. Recently, it has beenmade possible for these teachers to integrate into the civil service in aseparate category after having worked for four years as volunteers. At thesecondary level, no similar scheme exists, but several countries aremaking extensive use of ‘contractual’ teachers. These are untraineduniversity graduates who are appointed on a yearly basis and who receivea salary well below that of trained teachers. Most of these measures havebeen introduced in a context where governments could no longer recruittrained teachers at the prevailing rate due to stringent budgetaryrestrictions. They are possible where large numbers of unemployeduniversity graduates are ready to work at lower salary rates than those forexisting teachers. The long-term effect of such measures on teachers’motivation and on learners’ achievements is still to be assessed. Providedteachers do receive effective in-service support, quality should notnecessarily deteriorate. If such teachers are integrated into the civilservice after a number of years in a separate lower-paid category, theeffect on the unit cost will be significant.
Limiting non-salary costs
Non-salary costs vary widely at secondary level. Typically, non-salary costs represent a higher proportion of school expenditure atsecondary level than at primary. To the extent that this reflects the needfor more expensive equipment and learning materials, this is to beexpected. Where non-salary costs are more than 20-30 per cent of salarycosts in non-boarding institutions, it may be thought that the balanceneeds questioning. It is particularly difficult to generalize about this area,because so much depends on how curricula are organized and what kindsof institutional arrangements are made to run secondary schools (foodsubsidies, security, site management, provision for learning materials,etc.). The most obvious source of non-salary costs that may be reducedrelates to boarding, where this is not essential.
Increasing school size
School size is an important determinant of cost per student. Smallsecondary schools are likely to suffer diseconomies of scale (leading toa low pupil/teacher ratio, and high administration costs) and are oftenassociated with lower performance on achievement tests. However, theymay be necessary as a result of population distribution or ethnic,
306
Financing secondary education in developing countries

International Institute for Educational Planning http://www.unesco.org/iiep
religious, language or other segmentation within the school population.Judgements have to be made about the extent to which smallness isjustified and where preferential subsidy of more expensive school placesis defensible in relation to other needs. In each system there is a size ofsecondary school above which economies of scale cease to be attractive.Where analyses have been undertaken, they often produce results thatsuggest that secondary-school enrolments much below 1,000 areassociated with rising costs, and that above this level costs per studentfall slowly until they reach a plateau. Increasing average school sizewhere it is small requires school-mapping exercises and setting normson the minimum and optimum size of (lower and upper) secondaryschools. The effect that the merging of schools and increasing thedistance from home to school may have on rural pupils’ enrolment, andon girls’ enrolment in particular, has to be assessed and balanced withthe possible savings that can be made on teachers and buildings. Longdistances or boarding may deter some families from sending theirchildren to school.
Option 3.2: Increasing efficiency
Improving efficiency in secondary education is an essentialelement in making expansion of secondary education affordable. Thereare a number of ways of achieving this goal. First, repetition and drop-out rates can be reduced so that a larger number of youngsters can beenrolled and a higher number of graduates produced with the same levelof resources. Second, teacher-management procedures can be improvedand more of the existing teachers who presently do not teach can beinvited to do so. Third, measures could be taken to reduce teacherabsenteeism. Fourth, mechanisms could be put in place to increase theefficiency of school management.
• Reducing repetition and drop-out rates
High repetition and drop-out rates have cost implications. Highlevels of repetition inflate enrolments and add to total costs withoutnecessarily leading to an improvement in pupils’ achievements.Comparative studies indicate that repetition is high in some countriesand low in others with otherwise comparable characteristics. It has beensuggested that this is indicative of cultures of repetition10 (Eisemon,
307
Financing increased access and participation at secondary level:main policy options
10. Repetition tends to be much higher in francophone and Latin-American countries than incountries influenced by Anglo-Saxon tradition (the UK and northern Europe).

International Institute for Educational Planning http://www.unesco.org/iiep
1997), where it is anticipated that each year a significant proportion ofpupils will fail to be promoted. However, reducing repetition is not asimple matter of an administrative decision to introduce automaticpromotion. To be successful, policy has to be based on an understandingof the causes and consequences of the phenomenon. Repetition mayresult from poor-quality learning and teaching provided by schools,irregular attendance, poor mastery of the language of instruction,inappropriate selection, or many other factors. Much repetition ought tobe seen as a curriculum problem. Students are being taught material inways that result in them failing to meet promotion criteria. If there aredifferent ways of organizing learning and teaching that are under thecontrol of schools and would result in more pupils succeeding, thenthese should be encouraged. If this option does not exist, then questionshave to be asked about whether the standards expected for promotion areunrealistic and unattainable. If so, curricula should be adjusted to reflectthe needs and capabilities of students so that most can succeed in beingpromoted. To allow high rates of repetition to persist is to denyopportunity to those who are excluded as a result of school places beingoccupied by repeaters. High repetition rates around secondary selectionexaminations raise slightly different issues. However, even in this case,it seems reasonable to place limits on the number of times repetition ispermitted at public expense.
Drop-out has a different impact on costs. Where drop-out is high,total costs are reduced. However, the costs per successful schoolgraduate will be high. Many of the reasons for drop-out are external toschool systems. Those factors that are located in schools should be thesubject of policy interventions, since wastage is a source of inefficiency.Depending on the system, these factors are likely to include the level ofthe direct costs of attendance, policy on promotion from grade to grade,the quality and relevance of the curriculum, and the conditions underwhich learning and teaching take place.
• Improving teacher management
The second consideration concerns teacher management issues.Attempts to improve patterns of resource allocation imply thatheadteachers and administrative officers at central and regional levelmay have to be trained to become more resource-sensitive andaccountable. Procedures for transferring teachers may have to be revisedand regulations concerning appointment, transfer and dismissal changed.Decentralized recruitment of teachers by headteachers or school boards
308
Financing secondary education in developing countries

International Institute for Educational Planning http://www.unesco.org/iiep
is often suggested as a way of increasing efficiency and effectiveness.However, there is no clear evidence that such systems necessarily resultin efficiency gains. Where there is a weak infrastructure and ineffectivechecks and balances on procedure, individual and group self-interestmay not produce more equitable and efficient staffing of schools ifdecision-making is decentralized.
Audits undertaken in some countries show significant numbers ofteachers who continue to be paid on the budget of an establishmentwithout actually teaching there. This may be because some are workingat the regional or central level of administration, others are held inreserve and supposed to be available to replace teachers on long sickleave. Some may have been transferred to another part of the publicadministrative service or work at the political or community level. Somemay simply be ghost workers on the payroll but not available to work.Some estimates suggest that the number of teachers who do not teach,although they are paid on a school budget, can vary between 5 and 20per cent, depending on the country and the level of education. Knowinghow many teachers are in which category would help in estimating whatscope there is for adjustment. Correcting these kinds of anomalies inteacher employment would make it possible to expand access tosecondary education without increasing the budget.
• Ensuring effective school management
Effective school management is central to the control of costsdesigned to generate best value for money for public investment insecondary schools. Where historic rather than formula-based funding isemployed to determine school staffing, imbalances in staffing (andpupil/teacher ratios and hence costs) are likely to persist. High ratios ofcosts between secondary and primary-school systems have their originsin different staffing and working practices, as discussed above. Some ofthese practices are difficult to defend, except on a historical basis. It oughtto be possible to organize secondary schooling, especially at the lower-secondary level, in such a way that levels of cost per student are less thantwice those of primary. This is the case in most high GER2 countries.
The introduction of manageable needs-based formula-fundingsystems may help redistribute and reduce costs arising from an unevendistribution of teachers. Unless and until administrative systems whichprovide resources to schools are regulated by cost-sensitive proceduresand there are incentives for decision-makers to favour cost-savingoptions, access will continue to be constrained by costs higher than they
309
Financing increased access and participation at secondary level:main policy options

International Institute for Educational Planning http://www.unesco.org/iiep
might otherwise be. Needs-based resource allocation is increasinglypractised in developed countries (Ross and Levacic, 1999). Itsattractions are that it does allow transparency and monitoring of resourceallocation and should result in more equitable levels of cost per studentacross systems than other methods. It can be tailored to direct resourcesto areas of special need and to compensate for relative deprivation. Somecaution is needed in adopting the more complex forms of formulafunding. These depend on robust and effective data collection andinformation-management systems that are not available in manydeveloping countries. However, simple forms of formula-funding areviable and can be adopted. Various other approaches to budgetingsystems that offer improvements over historic or incremental approachesare reviewed in Penrose (1993).
• Various measures to improve efficiency
Other measures aiming at improving efficiency within the samelevel of costs can be listed. It is important to reduce teacher absenteeismwhere it is high through better supervision, either by the principal or thecommunity. This should increase school effectiveness and henceefficiency. Increasing the number of hours of teaching in the year, thusraising students’ opportunities to learn, has already been mentioned as anoption. Increasing pupils’ time-on-task (the amount of time within aclass period which is devoted to actual teaching and learning) is anotherattractive possibility. This may require changes in the way teachersstructure their teaching time (Anderson, 1990). It thus has to besupported by initial and in-service teacher training. Offering teachersincentives to improve student performance is another line of actionworth investigating. Some systems already provide bonus payments tothose who demonstrate the most effective performance. It has also beenargued that private schools can perform more effectively than publicschools although they may not necessarily have better resources, morequalified teachers or lower pupil/class ratios (Jimenez et al., 1991). Ifthis is true, it is possible that this is because they organize school andteaching more efficiently, and because teachers have other incentives toperform than those offered in public schools.
In conclusion, all of the measures suggested above requireeffective management of school systems, at central, regional andinstitutional level. Better school leadership in particular can help addressmany problems of low school efficiency and higher-than-necessarycosts. Postlethwaite and Ross (1992) have argued that more effective
310
Financing secondary education in developing countries

International Institute for Educational Planning http://www.unesco.org/iiep
schools have principals who are able to gain students’ and parentalsupport for school goals and who place emphasis on staff developmentand accountability. Other data (Jimenez and Sawada, 1998) suggest thatinnovations that involve communities in school management canimprove attendance rates amongst pupils and teachers and do not affectpupil performance adversely. Problems of under-utilization of teachers’equipment and facilities, lack of discipline and lost learning time,teacher absenteeism, poor curriculum co-ordination, and ineffectivesupervision, may be best addressed by focusing on the quality of schoolleadership and the skills and incentives that might make schoolmanagement more efficient and cost-conscious.
Option 3.3: Reducing capital costs
The preceding analysis has not considered capital costs. Thecapital costs of financing and equipping new secondary schools arewidely seen as a constraint on the expansion of secondary schooling.Typically, secondary-school building costs are much higher than thosefor primary schools. There are several reasons for this.
First, the design of conventional secondary schools includescommon and specialized facilities and space not usually provided atprimary level. In addition to the ordinary teaching space, such schools oftenhave administration blocks, service areas, boarding hostels, specializedteaching rooms, workshops, science laboratories, language laboratories,libraries, kitchens, assembly halls, staff rooms, and sports facilities.Available data suggest that the area per pupil required at the secondary level(for one shift) ranges from 4 to 8 square metres, compared to 1.5 to 3 squaremetres at the primary level. Since secondary schools are often built in urbanor semi-urban areas, the cost of land can be substantial. Whilst primaryschools are often constructed using local materials, this is rarely the case forsecondary schools. In towns where land is scarce, multi-storey buildingshave to be constructed which make the use of steel and concrete necessary.
Second, it is estimated that more than half of the new primaryclassrooms built every year in Africa or South Asia are community-supported, using local labour and raw materials. The same sense ofcommunity identification does not necessarily exist for a secondaryschool located in an urban area enrolling children from wide catchmentareas that extend over several communities. It is the case in severalfrancophone countries of Africa that until recently most of the lower-and upper-secondary schools had been built by the state. The new policyemphasis on decentralization gives more responsibility in respect of
311
Financing increased access and participation at secondary level:main policy options

International Institute for Educational Planning http://www.unesco.org/iiep
school construction to districts and departments, but the funds still haveto be transferred from the central level. The tradition of communitiesbuilding their own secondary schools is much more widespread inanglophone Africa and some lessons can be drawn from the experiencesof Zimbabwe, Kenya and Botswana.
Third, the amount of equipment, learning materials and teachingaids needed to furnish a conventional secondary school is much greaterthan in a primary school in total and per student. These also carry highermaintenance and replacement costs.
Fourth, in many countries external assistance was used to financesecondary-school building before the shift in emphasis to primaryschooling after the Jomtien conference. Often the designs chosenreflected a combination of the characteristics of the first generation ofsecondary schools established by colonial governments (boarding,extensive sports facilities, large assembly halls), overlaid by theinfluence of more recent developments in metropolitan countries(language laboratories, computer lounges, etc.). The image of what asecondary school should look like is still very much influenced by normsthat reflect those used in developed countries, reinforced by the type ofconstruction that foreign loans and grants have been used to finance. Theforeign exchange component of construction is often high given thematerials used and the nature of the equipment chosen.
Some indication of the magnitude of costs is given in a recentanalysis of science laboratories in different countries (Caillods,Göttelmann-Duret and Lewin, 1997). This suggests that fully equippedphysics laboratories can vary in cost from around US$20,000 toUS$144,000, depending on the country and standard of construction.The average for the African countries in the sample was overUS$60,000. These costs can be 500 times or more greater than therecurrent per capita cost of a secondary-school place.
Expansion of access to secondary schooling is likely to requiresome reconsideration of capital costs. In the long term this problem isless significant than the recurrent cost burden of expansion, sincebuildings and other infrastructure should have a long lifetime.Nevertheless, in the short term, high capital costs will place stress ondevelopment budgets. There appear to be several options in consideringhow to reduce the capital costs of expanding access to secondaryschooling. These include the following options.
In some countries it is feasible to consider adding buildings toalready well-constructed primary school facilities. This could allow
312
Financing secondary education in developing countries
International Institute for Educational Planning http://www.unesco.org/iiep
lower-secondary grades to be accommodated at lower cost than with theconstruction of a new facility. Economies would be made through accessto existing site services and infrastructure and the sharing of their costs.Depending on the nature of the lower-secondary curriculum, the additionof classrooms and some special facilities could provide a cost-effectivealternative to high-cost secondary-school construction.
Community-based organizations do finance school building insome countries. It may be possible to encourage this further. Religiousbodies, self-help groups, and other NGOs have all constructed secondaryschools with and without subsidy in anglophone Africa and in parts ofAsia. Communities in Kenya, Botswana, Nigeria, Cameroon, Zimbabweand in Nepal have undertaken to raise funds to build junior secondaryschools when faced with the government’s inability to provide schools inparticular locations (Bray, 1996). Financial and other resources areraised by groups in different ways, which include donations, fixed leviesand fund-raising events, and which have been used to create newschools, or to extend existing ones. Some governments have a laissez-faire approach to community mobilization, while others offerencouragement and direct support. Laissez-faire approaches can produceinefficient patterns of school location and organization, especially wherethe recurrent cost is borne from central funds. This is the case where itis assumed that if a school is built it will be staffed no matter how smallor close to another school. In the absence of compensatory policies,laissez-faire approaches will benefit richer and more cohesivecommunities able to mobilize resources. Poor and disorganizedcommunities will fail to do so and have reduced access to secondaryschools as a result. Governments can stimulate and support communityfinancing through tax exemption, provision of materials, buildingcomponents and technical advice, through per capita grants, as inZimbabwe, or through matching grants.
School premises are rented in a number of countries, especially inLatin America and the Middle East and this strategy has been used toexpand secondary-education facilities. However rents can be high andbecome a burden on the recurrent budget. They necessarily include anelement of profit for the landlord which could otherwise be retained andinvested in school quality. There can also be a major drawback in thatrented property is often not designed for school use, having aninappropriate disposition of space. If the state is not the owner, buildingmodifications may not be possible. Hence, where feasible, rentingpremises should be considered as a short-term option.
313
Financing increased access and participation at secondary level:main policy options

International Institute for Educational Planning http://www.unesco.org/iiep
Double-shifting schools can enable considerable savings in landand building costs. Where schools are double-shifted, capacity can bedoubled at marginal additional cost. Double-shifting is only feasible infairly high-density population areas and in cities where the cost of land ishigh. In rural areas the school-age population may not be sufficientlyimportant to allow such practice. There are many different ways oforganizing double-shifting and the benefits as well as the drawbacksdepend on which mode is chosen. Some common critiques are thatstudents become tired during afternoon sessions and do not benefit asmuch as morning-shift students (but shifts can be alternated); the officialteaching time may have to be shortened to allow the second group ofstudents to leave before nightfall (this depends on the actual length of theschool day and breaks); the timetable may preclude any tutorial andextra-curricular activities taking place after school (though if separatestaff are involved in each shift, scope still exists); facilities and equipmentget run down much more quickly and maintenance may become a realissue (though the per capita cost of maintenance is likely to fall);morning-school youngsters are left by themselves in the street and cancreate social problems. On the other hand, youngsters from the pooresthouseholds who can generate family income may benefit from half-dayschooling; it may also allow others to complement their general schoolingwith vocational courses (as is envisaged in Argentina and Brazil).
If expanded access is prioritized and capital is a constraint, doubleshifting is attractive in resource-poor countries. It can be managed inways that reduce its disadvantages, especially if increased funds areallocated for maintenance and replacement of equipment, a separatevice-principal is appointed for each shift, and teachers are not teachingthroughout both shifts (Bray, 2000). Double-shifting can be used duringthe period of rapid expansion in access to secondary schooling and bereplaced later on by single-shift secondary schooling, as was done inMalaysia.
The design of secondary-school buildings is central to the capital-cost problems of expansion. It is widely recognized that adoptingmetropolitan standards of design and construction produces excessivebuilding and maintenance costs. Where finance has been providedexternally through loans and grants, costs for secondary schoolssometimes escalate to levels that are as much as eight times the cost ofa local construction, especially where contractors are internationallybased companies (Beynon, 1997). It ought to be possible to continue toencourage lower-cost design and construction, suited to an environment
314
Financing secondary education in developing countries

International Institute for Educational Planning http://www.unesco.org/iiep
with low maintenance costs. Recurrent costs for maintenance have to besustainable in any effective building programme designed to extendaccess. In part, this implies developing standardized building designs,components, as well as equipment and furniture. This should result inbetter-quality buildings, and better cost control (Beynon, 1997).
Option 3.4: Alternative modes of delivery
Even with some or all of the measures discussed above, expandedaccess to secondary schooling will remain problematic in the low GER2countries. In these countries and some others, imaginable cost reductionswill not be enough to create access to secondary schooling for themajority, nor will the effects of cost reductions be felt immediately.Expanding secondary education in low population-density rural areas inlow- and middle-income countries is also difficult if it requires themaintenance of high-cost boarding facilities. Offering suitable andflexible schooling alternatives to secondary-age youth who are workingis another challenge.
In such circumstances alternative delivery systems to expandaccess become an attractive option. Examples exist of experiments usingconventional mail-based distance education, radio- and television-basedsystems, part-time and evening study, self-financing community schools,non-formal programmes for working children, and various kinds ofmixed-mode systems combining individual learning with residentialtutoring. Information technology and the development of the Internet israpidly opening up other possibilities. Many of these systems are able toprovide access both to primary-school leavers and young working adultswho have left school and require study at the secondary level to obtain abetter job, or to acquire particular skills.
Night schooling is one of the main alternatives used. It is commonpractice in Latin-American cities. Schools offer working adults thepossibility of attending classes late in the evening, following thesecondary programmes in an accelerated fashion (four years instead ofsix). Lately, these programmes seem to be increasingly attended byyoungsters of secondary-school age who have to work during the day tomake a living11. However, such programmes have a reputation of lowquality, and suffer from high attrition and low pass rates. Evening classesare also widespread in China and are directed towards those wishing to
315
Financing increased access and participation at secondary level:main policy options
11. Sixty-six per cent of secondary-school students in Brazil attend night schools(Leonardos, 1999).

International Institute for Educational Planning http://www.unesco.org/iiep
upgrade their qualifications at secondary level and above. Clearly thesekinds of system offer a second chance to those who fail to completesecondary schooling and have to work, whatever their age may be. Butthey cannot be considered as a long-lasting alternative to day schoolingfor school-age children.
Self-financing community schools are another alternative form ofsecondary-school provision. Communities generate funds to construct aschool and recruit their own teachers. This can create a cost burden thatis difficult to sustain after the initial enthusiasm has disappeared,especially if the establishment of such institutions is closely associatedwith charismatic leaders who then move on to other activities. Many ofsuch schools provide curricula which shadow those in public schools andprepare students for the same examinations; sooner or later communitiespress for them to be integrated into the state system (as the Harambeeschools were in Kenya).
Several experimental programmes in the past have tried to prepareyoungsters for secondary-school examinations at the same time asdeveloping work-related skills (e.g. the Youth Polytechnics in Kenya, theBrigades in Botswana in the 1970s). Their record of success has beenmixed; running such programmes has turned out to be quite expensiveand many of them have remained limited in scale (Bray and Lillis,1988). These kinds of post-primary initiatives seem to have become lesscommon in Africa. Related programmes exist in several Latin-Americancountries, often run by religious organizations and other NGOs. Theycan succeed in educating and training youth from marginalized groups,but again most operate on a limited scale.
Secondary radio- and TV-based programmes exist in developedcountries, with a few in middle-income countries such as Colombia,Mexico (Telesecundaria), and Brazil (Telecurso). The potential of suchprogrammes is vast for older students and as a support and complementto schooling. They work best in countries where the mail is functioningproperly, and where TV and radio are widespread. However, their utilityappears more limited if they are used as a sole medium of instruction foryounger students of lower-secondary age who require more structuredsupport and contact with adults to learn effectively. Several televisionprogrammes therefore combine individual learning with tutoring. TheTelesecundaria in Mexico is a good example. It has been in operationsince the mid-1960s and enrols nearly a million youngsters in the ruralareas. Teaching and learning takes place combining the uses of TV,teaching materials and a tutor, who is a primary-school teacher. Each
316
Financing secondary education in developing countries

International Institute for Educational Planning http://www.unesco.org/iiep
learning session starts with a 15-minute TV programme followed by adiscussion with the tutor. Results seem quite encouraging: althoughretention rates are lower than in conventional schools, achievementlevels in reading and mathematics in the third grade seem to be identical.
Programmes that combine individual learning with systematictutoring have obvious attractions whether they use the television or not.If self- and peer-group study can be alternated with more conventionalface-to-face tuition, costs should be lower and access easier. Severalcountries as diverse as Indonesia, Argentina, Mexico and Zambia haveexperimented with various kinds of distance-education systems,combining a distance course with tutoring. The Open Junior Secondary-school system in Indonesia enrols 400,000 of the 13 to 18 year-olds whoare out of school. It is expected to expand to up to 2.5 million. Thelearner receives a set of teaching materials and studies eitherindividually or in a learning group under the supervision of a facilitator,normally the headteacher of a local primary school. In addition, thelearner is expected to go once or twice a week to the nearest junior-secondary school to study with the various subject teachers. The passrates observed so far are similar to those in conventional secondaryschools, but the unit costs are roughly half of those in the conventionalsystem (Sadiman, 1999).
In remote rural areas of Argentina where a similar approach isused, students meet in their primary school under the supervision of atutor who is a primary-school teacher. They learn from specially preparedteaching materials and receive visits from a subject teacher in the schoolonce a week. In this case the cost is higher than in a conventional daysecondary school. This is because the pupil/tutor ratio can be extremelylow and is often below 10. The costs are nevertheless lower than theywould be if boarding facilities were to be provided (Golzman and Jacinto,1999). Innovative approaches to learning and teaching are used whichinclude multi-grade teaching at secondary level, co-operative teaching,and programmed learning. The impact on learning achievements is notyet known. However, the effect on retention appears positive.
All programmes are not equally successful. Advantages anddisadvantages, as well as costs, have to be weighed carefully beforeadopting alternative delivery systems on a large scale in a resource-poorcountry. The example of the Malawi College of Distance Education iswell known and cited in the case study in this book. In this system untilrecently pupils attended distance-learning centres under the supervisionof tutors, who were generally promoted primary teachers. Packs of self-
317
Financing increased access and participation at secondary level:main policy options

International Institute for Educational Planning http://www.unesco.org/iiep
study learning materials were made available to pupils. Early evaluationsof this system suggested that it was an attractive alternative to normalgovernment secondary schooling and that costs were much lower(Murphy, 1988). By the late 1990s the character of the MCDE hadchanged. Study centres were designated as community day secondaryschools, reflecting the reality that they were functioning more likenormal schools than self-study centres, albeit with very highpupil/teacher ratios and class sizes often exceeding 100. It had alsobecome clear that though the public cost of the MCDE system was about35 per cent of the cost per student in most government schools, its totalcosts per student were comparable or greater than those in governmentschools. In this system most of the cost burden is being borne privatelyby parents. Most worryingly, the cost per successful graduate in theMCDE system was extremely high as a result of the very low pass rates,which were between 5 and 10 per cent for the secondary school leavingexamination. In this case it seems that it has proved impossible to sustainon a large scale the original idea of delivering secondary schoolingeffectively using a mixed-mode approach.
Reviews of distance and mixed-mode learning programmes atsecondary level indicate that costs and efficiency are not always lowerthan those found in conventional systems (Rumble, 1997). They canprovide expanded opportunities at lower costs than conventionalschooling, but may deliver less than they promised in this respect. Thesekinds of initiatives often make assumptions about infrastructure,motivation and methods of learning that prove difficult to realize inpractice. They also seem to many consumers of educational services assecond-best alternatives to conventional schooling. They appear to workbetter in middle-income countries where it is possible to provide tutors,technology and teaching materials in sufficient numbers, than incountries that do not even have enough resources for their ownconventional school system.
This brief review of some of the most commonly discussedalternative modes of delivery of secondary-level educational servicesdoes not immediately point to radical solutions to problems of access inlow GER2 countries. More research may still be needed to ascertain thevalidity of some of these models before diverting many resources fromimpoverished secondary-school systems towards insufficiently testedpatterns of delivery which have high start-up and infrastructure costs.There is nevertheless scope for thinking creatively about thedevelopment of secondary schooling in ways which do take advantage of
318
Financing secondary education in developing countries

International Institute for Educational Planning http://www.unesco.org/iiep
Financing increased access and participation at secondary level:main policy options
319
some of the opportunities offered by different modes of delivery.Expensive teacher time can be complemented and extended by use ofself-instructional material, radio, video and television programmes aswell as Internet services, where these are available. Out-of-schoolpopulations can be reached through mass media and non-formal learningcentres. But the real challenge seems to remain as to how to bring downto a sustainable level the costs of delivering secondary schooling of abroadly conventional kind to the majority of the population. The fact thatsome relatively poor countries have achieved this (Sri Lanka and Chinain the case studies) illustrates that this is possible. Alternatively it will benecessary to mobilize some new sources of funding.
Option 4: Cost recovery and community contributions
One of the implications of the analysis of the policy frameworkfor expanded secondary schooling is that the public resources availableare severely constrained where GER2s are lowest. We have consideredthe scope for redistribution within the education budget and forefficiency savings. An additional option is to encourage non-governmentcontributions to costs and other resource needs. There is an extensiveliterature that explores the possibilities and analyzes the characteristicsof different approaches (e.g. Thobani, 1984; World Bank, 1986;Colclough, 1991, 1996; Woodhall, 1991; Hinchliffe, 1993; Lewin, 1995;Bray, 1996). These include various kinds of tuition fees, loans,community-based contributions in cash and kind, and the developmentof private schooling. All of these have the potential to complementpublic expenditure and support secondary expansion. Each has specificadvantages and disadvantages, which can vary from system to system.
There are three main arguments advanced to justify increasedlevels of subsidy for educational services from outside the publiceducation budget. These are first that post-primary education is oftenassociated with high rates of private returns. It is reasonable to expectthose who benefit most to share the costs. Second, cost-recoverymechanisms can be used to increase total expenditure at little or noadditional public cost and/or substitute private spending for publicfunding. Third, charging for services will increase accountability,improve quality, and enhance the value for money obtained from publicinvestment.
The first point is widely made. It is generally true that privatereturns for secondary schooling are greater than social returns. Thosewho participate at secondary level are also likely to come from families

International Institute for Educational Planning http://www.unesco.org/iiep
with above-average incomes. However, the detailed argument about theextent to which this alone justifies particular policies of cost-recovery,loans, etc., is complex, particularly if participation of students fromlower socio-economic backgrounds is to be encouraged.
On the second point, charging for educational services mayincrease total educational expenditure over what it would otherwise be.Thus, where private schooling is encouraged, and is genuinely private inthe sense that the bulk of the costs are met from private resources, it istrue that this reduces the demand on public funds and public schoolplaces. If significant fee income can be raised in public schools withoutadverse effects on participation, more students can be enrolled at a givenlevel of public unit costs. There is an assumption that public and private(or community-based) financing are largely independent of each otherand that increased private costs will not be accompanied by reducedpublic subsidy.
Charging those who benefit directly for educational services,rather than financing them indirectly through the public taxation system,is the most common form of cost recovery. It is usually argued thataccountability of the providing agencies (schools, training colleges,tertiary institutions) to their students, parents and, occasionally,employers, is improved. Parents and students are expected to valueschooling more, and exert pressure on schools and teachers to maintainquality, if they are made aware of the costs and pay part of these on acurrent or deferred basis. They become more directly concerned with‘value for money’, since it is clear how their money is being spent.
There are a number of critiques of these presumed advantages.First, it is supposed that parents and students will be prepared to paymore of the direct costs of education than they currently accept if by sodoing they obtain some benefit. In a simple world these benefits wouldbe reflected in the expected returns to individuals in income and socialstatus from additional schooling of higher quality. The problem is thatthe benefit is more obviously individual rather than collective. There isno necessity for cost recovery to result in pressure to make decisions inthe collective interest. An obvious example relates to the education ofgirls. Decreasing public cost, by partial recovery through the payment offees, is likely to suppress enrolments, despite the well-knownexternalities associated with increased schooling for females (e.g.improved child nutrition, reduced infant mortality, reduced populationgrowth). Rates of private return would be perceived to be lowest inprecisely those communities which educated girls least. Similarly,
320
Financing secondary education in developing countries

International Institute for Educational Planning http://www.unesco.org/iiep
though the economic returns to achieving universal literacy amongst thelast 10 per cent of a population are likely to be low, the social utility maybe high. Attempts to recover these kinds of costs may simply be counter-productive.
Of course, there will be cases where parents and students willhappily, or at least willingly, pay additional costs if these appear to offersome comparative advantage in the race for selection that many formaleducation systems have become. Private tuition fees offer the mostobvious example of how educational markets may emerge and how theymay behave if they are unregulated. The rationale for paying tuition billsis rarely expressed in terms of a search for knowledge andenlightenment; its purpose is to gain an advantage for individual studentsover others in the competition for the highest grades (or at least to reducethe probability of starting with a disadvantage if most other studentshave tuition).
Second, a belief that recovering costs can increase accountabilityusually assumes that parents and pupils can discriminate between high-and low-quality educational services and have a real choice. This isunlikely to be true in the rural areas of countries where GER2s are verylow and the choice may be to attend one school or none, and wheredistance, cost, ethnic and religious criteria may restrict access todifferent institutions. Poorly educated parents seem unlikely to be in aposition to judge school-effectiveness. Even the well educated may nothave the time, energy or insight to be well informed about what arethought to be the most effective methods of teaching different curricula.They will find it difficult, unless they themselves have had someexperience of trying to teach children of different ages. Access toinformation (and the ability to interpret it) may also be problematic. Themost elementary information needed in order to be able to compare theperformance of schools is often lacking.
Third, equity may suffer if the direct costs of attendance increase.However, enrolments from amongst the poorest households may bediscouraged. Those who are enrolled may characteristically be malerather than female, and higher costs may skew the social composition ofthose who proceed through secondary schooling. If this is so, efficiencymay also suffer in the sense that students are selected from a restrictedgroup which excludes those who may have similar capabilities, on thebasis of ability to pay. It is also probable that differences in standards ofprovision between relatively rich and poor communities will increase,the greater the proportion of costs financed by those communities.
321
Financing increased access and participation at secondary level:main policy options

International Institute for Educational Planning http://www.unesco.org/iiep
These problems have different levels of significance for the policydebate in different countries about the extent to which expandedsecondary schooling can be financed from outside the public budget. Itis useful to review the range of possible mechanisms that are identifiedin the case studies and the literature. Table 10.2 classifies the mainmethods of capturing additional finance and non-monetary resources tosupport schooling.
Table 10.2. Examples of cost-recovery mechanisms
322
Financing secondary education in developing countries
Description Comment
Tuition fees Many countries have nominal fees in public schools thatrepresent a small part of the total costs. Fees are generallyhigher in private schools, even in those which aregovernment aided. Fees can be quite low in non-government aided schools and at tertiary levels. Fees maybe coupled with loan schemes and scholarships/bursariesfor low-income students.
Fees for textbooks/learning materials Charging for textbook loans; reducing/eliminatingsubsidies to commercial publishers; charging for materialconsumed, e.g. in domestic science; charging for writingmaterials (exercise books/slates).
Payments for school feeding programmes Reducing/eliminating subsidies on school meals.Charges for the use of facilities Sports facilities fees; music tuition; school visits;
fieldwork trips; charges for use of school premises forprivate tuition, rental of premises to businesses.
Boarding fees Reducing/eliminating subsidies for boarding, especially athigher levels.
Sale of goods and services Agricultural production; workshop production. School-run businesses Substitution by staff/students of self-help for previously
commercial services; association of schools withproductive enterprises, e.g. as in China; charging for pre-school.
Contributions of labour Parental/community contributions of labour time forconstruction and maintenance.
Contributions of materials Parental/community/local business contributions ofmaterials for construction/maintenance/library, etc.
Local educational taxes Taxes on salaried employees; taxes on local production,marketing, sales.
Taxes on the educated or their employers Graduate taxes on individuals; levies on employers ofeducated workers.
PTA levies Funds raised by PTAs (parental membership).Old Student Associations Funds raised by OSAs (alumni).School Development Societies Funds raised by SDSs (community membership).Other voluntary fund-raising NGOs, local welfare clubs, churches, etc.

International Institute for Educational Planning http://www.unesco.org/iiep
The case studies give some indication of current practice and theopportunities and constraints that affect each mechanism. Consideringeach of these in turn we note that:
Tuition fees vary from being a small proportion of total costs, e.g.in Malawi and Sri Lanka, to being very significant (Zimbabwe and, forsome students, China). Where there is evidence of excess demand andincome levels are high enough, the case for increasing fee contributionsfor secondary schooling seems convincing. The experience of the rapidgrowth of the MCDE system in Malawi suggests that even in this pooreconomy many parents are willing to pay high fees for the chance ofattending poor-quality secondary schools. If this source of income couldbe directed towards supporting more efficient schools of higher quality,it seems likely the public interest would be better served. In general, it isclear that fee levels have to be affordable and that some system ofexemption, subsidy or scholarship is needed to ensure participation ofthe poorest.
It should be noted that on average about 10 per cent of secondaryschooling is provided privately (World Bank, 1998). The share is muchhigher in several of the French-speaking African countries where thestate has proven unable to provide enough school places (25 per cent oflower-secondary enrolments in Senegal, 32 per cent in Burkina Faso, 38per cent in Côte d’Ivoire). The share is even higher in Madagascar, butthere it reflects more of a distrust in the quality of public secondaryschools. James (1993) has argued that the proportions of enrolments inprivate schooling can be linked to combinations of the existence ofexcess demand, differentiated demand in heterogeneous communitiescompeting for educational opportunity, non-profit entrepreneurship, andgovernment policies. Her analysis supports these propositions, but it isclear that the weighting of these factors as explanations must differconsiderably between countries. Government policies can clearlyencourage or discourage growth in private schooling through subsidiesand tax regimes. When there is some private schooling, enrolments arehigher where government allocations to education are lower. James’ datado not show clear links with income distribution, although this may be afactor in some countries (ibid.). Where public schooling is of poorquality and income distribution skewed, those with sufficient resourcesare more likely to opt out of state education. Cummings (1995) arguesthat most East-Asian countries that have grown rapidly have substantialprivate school provision and that this has contributed to their ability toprovide access to most students without unsustainable growth of public
323
Financing increased access and participation at secondary level:main policy options

International Institute for Educational Planning http://www.unesco.org/iiep
educational expenditure. He also notes that private supplementaryprovision is widespread and culturally familiar. Most of the countriesthat raise more than 10 per cent of the cost of higher education fromstudents are in Asia. In many of these countries, parents and students areboth willing and able to allocate substantial amounts of money and timeto tuition that complements schooling rather than replaces it andprobably improves achievement levels. Private tuition costs paid by largenumbers of parents in some of these countries almost certainly exceedthe level of investment per student made by the state (Bray, 1999).
Similar arguments apply to fees for textbooks and learningmaterials. Free textbook systems, which deliver sufficient books to allchildren, are unusual. Sri Lanka is one case where this is possible. In mostothers, books are purchased by students in the market, sometimes at asubsidized price. The issue here would seem to be: what is the most cost-effective way of ensuring that most pupils have access to the necessarylearning materials? Where government production and distributionsystems appear unable to deliver sufficient quantities of books, etc., itmay be preferable to encourage the market to produce materials for saleand to facilitate individual and school block purchases. Clearly, therecurrent budgets available at school level should be sufficient to providea basic stock of learning material. Schools can operate textbook loanschemes with discounted payments for returned books.
School feeding programmes can be very expensive if they arenon-selective. The costs often exceed those for salaries. The case forparental contribution to the cost of food is strong, except where levels ofpoverty and cash income are very low. Obviously, adequate nutrition isessential, but this would seem to be an area where selective rather thangeneral subsidy is appropriate.
Income generation from the use of school facilities is a marginalsource of funds in all the case studies, except in China. Significant numbersof schools in China generate large sums from deployment of school assets(buildings and land). But these schools are typically urban and in areaswhere property rents are high. There may also be some problems, whicharise from the degrading of school facilities (e.g. loss of space) as a resultof commercial use. Nevertheless, where it is possible to make more use offacilities in a cost-effective way, this would seem desirable, given that aschool should not remain unoccupied for many weeks in the year.
Boarding costs exceed those of teaching students, as in Malawi.Unless boarding is essential (population density, access to schools),there is a strong case for reductions in the proportion of boarders, in
324
Financing secondary education in developing countries

International Institute for Educational Planning http://www.unesco.org/iiep
favour of expanded access. It also seems appropriate to encourageparental contribution where boarding is necessary and where there isevidence of ability to pay.
The other possibilities fall into four areas. The first, sale of goodsand services produced by schools. This can make a contribution tosecondary-school financing (through cash income, the production offood for sale or consumption, etc.). However, in most cases, thecontributions are likely to be small. What can be achieved is partly aquestion of the resources available (land, workshops, etc.), and of skill,organization and enthusiasm. It is also a question of whether it is anappropriate use of the time of students to devote energy to productiveactivities that may distract from other forms of learning. School-runbusinesses in China can generate substantial incomes, but these areusually unrelated to the process of schooling – they are better thought ofas subsidiary companies associated with the school. The exception iswhere external students are accepted for fee payments, and thesestudents are taught by teachers in the school.
Second, the encouragement of community contributions to schoolconstruction in the form of labour and materials is widely advocated.This is often more difficult at secondary level than primary. The mainreasons are that secondary schools often require higher standards ofconstruction, especially for specialized facilities. They also often servewider catchment areas than primary schools and there may therefore beless of a sense of a school belonging to a particular community.Nevertheless, such contributions can be significant as they have been inKenya (Harambee schools) and in Zimbabwe. Where they are organized,they can however result in differences emerging between schools whichreflect the relative wealth and willingness of different communities tosupport education.
Third, local taxes are levied in different forms. They are widelyused in China, and to a lesser extent in Zimbabwe (in the sense thatresponsible school authorities collect and disburse money). There is nolocal taxation of this kind in Sri Lanka or Malawi. Fourth, parent-teacherassociations, alumni groups and other voluntary fund-raisers do makecontributions. These vary greatly between schools and are anunpredictable source of funding.
Five issues concerning cost recovery and the state policy seem tostand out. First, a view has to be taken of the role the state plays inlimiting inequality and promoting equity in educational provision. Thegreater the commitment to equity the less attractive many forms of cost
325
Financing increased access and participation at secondary level:main policy options

International Institute for Educational Planning http://www.unesco.org/iiep
recovery will be if applied to the basic education cycle (which mayinclude lower secondary). Equity will demand that access to educationwill not be rationed by price. The most common way to ensure this is tointroduce means-tested fee waivers, scholarships, etc. These will all beless efficient than simply financing school places out of the general taxrevenue. Above the basic education cycle the balance of advantage maychange and some forms of cost recovery become more attractive withoutdiminishing equity.
Second, the impact of cost-recovery reforms on efficiencyrequires careful consideration. If participation is limited by fees,efficiency may suffer. Some types of investment in education may not bemade by individuals if costs are increased, even though at the social levelthe benefits may appear substantial. The education of girls andparticipation in teacher training are particular cases that illustrate this.
Third, the justification for introducing cost recovery will varyfrom country to country. The case that can be made will depend on amixture of considerations that include: the availability of public fundsand the willingness to allocate them to education; the magnitude anddistribution of disposable income; the level of private contributions tototal educational costs; and the quality of the infrastructure needed. It isparticularly important to consider how private expenditures may changeas and when public expenditure patterns are shifted. It is also importantto establish whether cost recovery actually increases total investment ineducation. Some analyses suggest (Penrose, 1998) that cost sharinghelps to conceal inefficiencies and rigidities in public finance systems,infrequently results in transfers which favour more participation by thepoor, and can have negative consequences for demand.
Fourth, states face a kind of paradox in judging appropriate levelsof cost recovery. If these are small, and represent only a small percentageof total costs, they will only make a marginal impact on the financing ofthe system. Moreover, small levels of contribution may not engender thekind of accountability that would make a difference to educationalstandards and value for money. If the levels are high, the possibleadverse effects on equity and efficiency may be substantial. The logic ofthe situation will lead to an erosion of state control in favour of controlby those who pay or their representatives. If this is resisted, then thebenefits attributed to greater local accountability will be lost. If it isaccepted, the state has to consider how to react to local policies thatdiverge from national ones, be they on admissions, staffing, curriculum,or facilities for different students.
326
Financing secondary education in developing countries

International Institute for Educational Planning http://www.unesco.org/iiep
Finally, the arguments for and against different forms of costrecovery have an ideological dimension. They are intimately bound upwith views on the role of the state in providing social services, and ininvesting in human resource development for the future. They also takeinto account the behaviour of individuals, the extent to which theypresume their behaviour is motivated by economic considerations, andthe degree to which educational services can be subjected to market-likeinfluences. Clarifying the empirical basis for these suppositions indifferent societies is a good starting point for deciding what role the statecan and should play in cost recovery to finance education.
Option 5: Call on external assistance
A last possibility for financing the development of secondaryeducation is external assistance. In the decade since the WorldConference on Education, many bilateral donors and the developmentbanks have encouraged governments to place a high priority on theEducation for All agenda. This has led to increased support forexternally assisted primary and basic education programmes, especiallyin those countries where GER1 has been low. By 1995 it was estimatedthat an additional $1 billion was being allocated by leading donors tobasic education projects when compared to 1990. Though substantial,this fell short of the target set, which was closer to $2 billion neededannually, to achieve the goal of schooling for all (Colclough with Lewin,1993). It would be difficult to show that the emphasis on basic educationhas ‘crowded out’ allocation to other levels, not least because many basiceducation projects have begun to include lower-secondary grades.However, it is clear from recent policy statements on assistance thatsecondary education has yet to be placed in the foreground as a criticalarea of need. It is also the case that most low GER2 countries have large-scale externally supported basic education programmes (often withsupport from several sources), and relatively few complementaryinvestment programmes focused on secondary.
Sector-Wide Approaches (SWAs) are increasingly being favouredfor support to the education sector. The logic of SWAs is, at least in part,that governments can define priorities and request assistance over themedium term. If this tendency becomes a reality in most developingcountries, and if the concern for low participation in secondaryexpressed in this book is shared by recipient governments, then the SWAprocess will ensure that this emerges as an important arena forassistance. It will not be possible to focus on Education for All issues to
327
Financing increased access and participation at secondary level:main policy options

International Institute for Educational Planning http://www.unesco.org/iiep
the exclusion of problems at other educational levels, as hypotheticallycould be the case with project-based approaches. It is therefore possibleto contemplate forms of general recurrent budgetary support, at leastduring periods of transition, provided that these hold out the expectationof sustainable financing in the long run. This is an area where the specialneeds of secondary schooling may find expression in SWAs, along withstrategies to limit the growth of recurrent costs to manageable levels.
In the past, most external assistance to education supporteddevelopment budgets, which financed school building and otherinfrastructure projects. Without adequate financing of development costsit is obvious that the capacity and the quality of available facilities will beconstrained. The discussion above outlines some of the considerationsthat need to be recognized in supporting new building and equipmentpurchases. The extent to which these require foreign exchange should beone of the considerations. Appropriate building design and associatedmaintenance costs should be another, suitably differentiated to reflectdecisions about the structure of secondary schooling (location and lengthof lower- and upper-secondary cycles, etc.).
It should be noted however that capital constraints are unlikely tobe the most important limiting factor for strategies of growth in accessand participation at secondary level. It is the recurrent cost burden thatwill normally place an upper limit on what is sustainable. In whichparticular areas would it be especially appropriate or inappropriate tocall on external assistance in addition to that related to SWAs throughrecurrent and development budgets? Several factors have to be taken intoconsideration:
First, in the past a significant proportion of support for secondaryschooling, especially in sub-Saharan Africa, was linked to subsidies andsalary enhancements for expatriates working at school level. This isincreasingly anachronistic. The costs of this kind of support can beexcessive and represent many times those for local staff. Where a largenumber of expatriates continue to be employed, the reasons why alocalization policy has failed need to be established. So also does thequestion of the long-term impact of a changing cadre of non-nationalteachers, often drawn from a variety of countries without a conspicuousconcern for continuity.
Second, curriculum development in those areas of the curriculumthat are most internationalized (mathematics, science, internationallanguages) can benefit from a cross-fertilization of ideas, materials, andexpertise embedded in skilled and motivated professionals. Networks
328
Financing secondary education in developing countries

International Institute for Educational Planning http://www.unesco.org/iiep
allowing different countries to share their experience in curriculumdevelopment need to be supported. In addition, strategically locatedexperts could still have a role to play. The effectiveness of such staffwould depend on whether sufficient infrastructure exists to translateideas into educational materials. Their costs, which usually requireforeign assistance to support foreign exchange costs, should be justifiedby the quality of their contributions and the extent to which they cancatalyze the development of high-quality curricula that might otherwisetake much longer to be developed. Such international experts wouldneed to work very closely with national experts and contribute to thestrengthening of national institutions that would continue the work andmonitor its implementation.
It should be noted that globalization is beginning to redefine thelabour markets that secondary students enter. There is some evidence ofconvergence in the range of skills and competences that are valued byemployers trading internationally. Increasingly, school-leavers wantqualifications that are recognized internationally. Where thesedevelopments lead to the introduction of new areas into the curriculumwhich have little or no local history, external assistance can be useful insupporting the first phase of development.
Third, agencies can assist more directly with the production anddistribution costs of learning materials, as distinct from their design(which is a curriculum development issue). As the costs of productionfall it may be more viable to print materials of high quality where costsare most competitive internationally, and ship books into local markets.At the same time, a real interface between pedagogical needs andtextbook publishing can only take place where an industry exists locallyor regionally. This may or may not be possible in the short term,depending on the existence of local production and on the capacity,using newer technologies, to produce learning material locally in a cost-effective way. Where it exists and there are foreign exchange costsrelated to paper, etc., external assistance can be very helpful. Where itdoes not exist, long-term strategies for improving the provision of booksare needed which could be supported this way.
Fourth, teacher training is an area that is frequently under-theorized and poorly resourced in countries with low GER2s. Yet thisactivity is critical to attempts at reform. If training colleges and theuniversity departments that train secondary teachers are not themselvesexamples of best practice and developmental centres for the areas theyserve, there will be few other sources of professional advice and
329
Financing increased access and participation at secondary level:main policy options

International Institute for Educational Planning http://www.unesco.org/iiep
leadership available to guide and support new practice. Where there is arealistic prospect of training institutions adopting an expanded role insecondary education development, the case for external assistanceshould be considered. In these institutions it may well be appropriate tocontemplate supporting costs that provide a working environment whichcan inspire trainee teachers, generate learning materials, formativelyevaluate practice, and provide career opportunities for the most capablesecondary teachers. Initial training institutions generally account for asmall proportion of the education budget and relatively small amounts ofexternal assistance can have a substantial impact on their quality. Theirstaff ought to be aware of the most recent developments in their fields ofstudy elsewhere and be able to adapt and develop these sensitively andrealistically for local use. This implies suitable staff developmentprogrammes as well as adequate learning and teaching resources.
Fifth, much evidence indicates that, especially at secondary level,curricula in action are heavily influenced by the form and content ofpublic examinations. These examinations often allocate life chances andare typically regarded as ‘high stakes’ examinations. The quality ofexaminations varies widely. In many cases, examination systems havehistoric external links with examination boards in developed countries.In some countries substantial transfer payments continue to be madeexternally to set, administer, ensure quality of, and process examinationpapers. External assistance can and should make a direct contribution tothe development of reliable and valid examination systems with theobjective of ensuring curriculum relevance, technically robust selection,and cost-effective assessment.
Sixth, there is a growing amount of expertise available on schoolmanagement and on management information systems. Our researchshows that not much information is available on secondary education indifferent countries. More needs to be known on the number of teachersteaching what and where, on the teaching/learning conditions, on theperformance of students in different types of schools (public, communitybased, fully private, distance courses etc.). Evaluation and monitoring atdifferent levels (school, district, region) require technical expertisewhich can be acquired through training. The results of the analysis of thedata it can produce are very useful in determining the impact of previouspolicy and support and identifying what is worth developing further andwhat is relatively ineffective. It can also draw attention to differencesbetween schools that can lead to the diffusion of best practice and thereduction of inequalities between schools.
330
Financing secondary education in developing countries

International Institute for Educational Planning http://www.unesco.org/iiep
Secondary schools are increasingly complex institutions whichrequire sophisticated management if they are to be effective andefficient. To what extent school-management expertise, procedures andsystems can be transferred across systems is yet to be fully determined.But some can and should. It has become usual to devolve financialresponsibility to school level in several developed countries. It is arguedthat locating control and accountability closer to the point of deliveryshould enhance efficiency and effectiveness. Decentralization isfavoured as a development strategy by many agencies and governments.In those developing countries where centralized systems have been thenorm and infrastructure is weak, making a reality of decentralizedadministration and finance is a major undertaking. It requires muchcareful planning and execution, the training of staff to take on newresponsibilities, and enough checks and balances to discourage abuse ofthe opportunities that decentralization may provide for individuals todevelop idiosyncratic practices contrary to national policy. Byencouraging exposure to and experience of systems of decentralizationelsewhere, agencies may assist with the development of viable strategiesthat are grounded in the administrative and financial realities ofparticular systems.
Seventh, funding new initiatives is likely to be most problematicwhere resources are scarcest, yet this may be precisely where needs aregreatest. External assistance can be crucial to develop work that wouldotherwise not occur. It can and does also support experiments withinnovative curricula and alternative delivery systems of secondaryschooling which promise cost-effective methods of meeting expandeddemand and the needs of those who have missed secondary schoolingaltogether. This should be development support for limited periodsbeyond which such innovations need to become self-sustaining. If this isnot so, then such assistance begins to resemble recurrent budgetarysupport, which needs a different kind of justification.
This list of opportunities for assistance would not be completewithout some caveats. It has been noted that subvention of expatriatesworking at school level has ceased to be attractive, except perhaps in themost unusual cases. This may also apply to the use of expatriates in thedirect delivery of teacher training both at INSET and PRESET levels.Other areas where foreign assistance to the development of secondaryschooling may be thought problematic include innovations in teachingmethods, learning materials, and patterns of organizing learning andteaching that depend on levels of resources unlikely to be available
331
Financing increased access and participation at secondary level:main policy options

International Institute for Educational Planning http://www.unesco.org/iiep
across the school system. This is even more the case insofar as advocacyof new methods developed elsewhere is not based on demonstrated andeffective practice within a particular country.
In conclusion
To finance the expansion of their education systems, policy-makers in different countries will have to adopt one or several of thepolicy options outlined above and choose those which appear mostappropriate under their national circumstances. Clearly, there are trade-offs and balances of costs and benefits to be considered which varybetween systems. There are also limits to the scope and rate of reform.Thus, it would be unwise to raise the number of pupils per class andincrease the teaching load of teachers at the same time as allowingsalaries to decline in real terms over a short period. Some options mayallow for an increase in participation without endangering the quality ofeducation. This would be the case for those measures that aim atincreasing the share of education in the overall budget and those that aimat improving the efficiency in the management of schools and systems.But these measures may not be enough to support a substantialexpansion in participation where this is desirable. Some options mayhave to be considered that would be justified in terms of the balance ofadvantage in expanding participation at the price of acceptablereductions in quality. The alternative may be to continue to restrictsecondary access to small proportions of the population in low GER2countries. Chapter 11 summarizes the main findings of the research anddevelops a framework for the analysis of investment decisions forsecondary education.
332
Financing secondary education in developing countries

International Institute for Educational Planning http://www.unesco.org/iiep
Since the World Conference on Education for All, many developingcountries have succeeded in increasing participation rates at primarylevel. The success of the EFA initiative has meant that the numbers ofqualified adolescents aspiring to enter secondary education have grownmore rapidly than have educational opportunities at that level. In most ofthe countries with a secondary Gross Enrolment Rate of less than 40 percent, participation rates have not increased significantly over the pastdecade. In countries with secondary GERs between 40 per cent and 70per cent, the average GER has increased from 49 per cent to only 56 percent. The analysis has shown that most, but not all, of the low GER2countries are in sub-Saharan Africa, have low GNP per capita and low ornegative economic growth. They also have high population growth anddependency ratios for the school-age population. Consequently, theabsolute number of those without access to secondary schools isincreasing, especially in the poorest developing countries. Where GER2is less than 40 per cent the data suggest that the labour force oftencontains fewer than 10 per cent with successfully completed secondaryschooling. This raises critical questions for development strategies thatdepend on investment in human resources and knowledge and skillsacquired above the level of basic education.
In most developing countries the bulk of secondary education ispublicly financed. Low and negative rates of economic growth, as wellas high costs, have squeezed the public resources available for financingexpanded secondary schooling. At the same time, external assistance hasfavoured support for basic education. Grant aid and lending targeted atsecondary level has represented a declining proportion of total assistancein the poorest countries. Much of what has been made available has beenallocated to higher GER2 countries. It is therefore possible that without
333
Chapter XI
Overview and conclusionsKeith Lewin and Françoise Caillods

International Institute for Educational Planning http://www.unesco.org/iiep
considered strategies to protect current levels of secondary participationin the countries with the lowest GER2s, secondary enrolment rates andquality will decline from already inadequate levels.
This concluding chapter has four purposes. First it revisits keyfeatures of the rationale for investment at secondary level and commentson their implications in different country contexts. Second, it reviewsdata on the status of secondary education, presents the results of ananalysis of the financial challenge and develops a framework for policyanalysis. Third, it summarizes country experiences reported in the casestudies. Finally, it outlines policy options for sustainable growth.
There are five main reasons for reconsidering approaches toinvestment at secondary level. First, this book has argued strongly thatsecondary-school participation is likely to be central to future prospectsfor development and growth. Secondary education provides theopportunity to acquire skills and competences that are unlikely to bedeveloped over the primary grades. Students in secondary schools areyoung adolescents acquiring access to abstract reasoning and the kind offlexible thinking skills that are useful in adult life and in employment.These competences provide access to the global economy and thepotential that this offers for economic growth. The ‘digital divide’ in theimpact and assimilation of information and communication technology isa problem partly located in the quality and content of secondary schooling.Where the share of an age group successfully completing secondaryschooling is small, the educational profile of the working population willhamper attempts to attract direct foreign investment, develop knowledge-based economic activity, and raise international competitiveness.
Second, there is evidence that investment in secondary schoolingcontributes to differences in growth between countries. Several studieshave shown that secondary education has played a pivotal role in theeconomic growth of East-Asian countries. One of these studies (WorldBank, 1993) suggests that Japan’s growth after 1960 was especiallyinfluenced by the early achievement of high enrolment rates at secondary.Another (World Development Report, 1998) notes that Korean economicgrowth from 1960 was accompanied by heavy investment in post-primaryschooling, which contributed to the development of a more educatedworkforce able to adapt flexibly to rapid innovation in production andproducts. Recent analysis of economic growth and transformation in Asia(ADB, 1997) indicates that whilst secondary-school investment (in termsof enrolment rates and numbers of years of schooling) was associatedwith higher economic growth rates in Asia between 1970 and 1990, this
334
Financing secondary education in developing countries

International Institute for Educational Planning http://www.unesco.org/iiep
Overview and conclusions
335
was not true for primary school investment. Longitudinal data onenrolment growth suggest that participation in secondary schooling is nowwhat differentiates the faster- and slower-growing Asian countries (Lewin,1999). Countries that have higher levels of participation in technical andscientific education have higher levels of growth (World DevelopmentReport, 1998). The foundations for this are laid in secondary schools.
Third, the way secondary schooling is organized in manydeveloping countries with low GER2 may be neither equitable norefficient. Those who participate are often drawn disproportionately fromwealthier households. Gender gaps are typically greater in secondaryschooling than in primary in low secondary-enrolment countries.Countries with high levels of GER2 are more likely to have a genderbalance in enrolments in favour of girls. Secondary schooling is muchmore available in urban than in rural areas, to high-density populationsthan to low density, and to wealthier rather than less well-off families.The utilization of teaching staff, as indicated by pupil/teacher andclass/teacher ratios, is often much less intensive in secondary than inprimary-school systems. Public subsidy therefore favours higher levelsof schooling where participation may be skewed towards the alreadyadvantaged. Patterns of access and participation in secondary schoolingmay be as much a source of inequality as a vector in its reduction.Expanded access should reduce these inequalities.
Fourth, where primary enrolments have been low and areincreasing rapidly as a result of EFA commitments, constraints areappearing in the supply side of teachers. Secondary-school systems mustsuccessfully graduate sufficient numbers to provide entrants to primaryteacher training. Where GER2 is low this is problematic. So also is thesupply of qualified applicants to higher education.
Fifth, some countries are being seriously affected by HIV/AIDS.The implications of this are complex and still poorly understood.However, it is clear that teacher attrition rates are rising to unprecedentedlevels and that labour forces are being degraded by sickness andincreased mortality. What evidence there is draws attention to the oftenhigh rates of infection amongst middle-level professionals who havecompleted secondary schooling. If the numbers of teachers and middlemanagers are being seriously depleted, there may be a need to expandthe output of secondary schooling to renew the cadres. Secondarystudents are in or are approaching the age groups most at risk. Increasedparticipation at that level would allow more effective and widelydisseminated health education.

International Institute for Educational Planning http://www.unesco.org/iiep
These observations suggest that national development strategiesneed to identify levels of investment in secondary schooling that arelikely to contribute to growth. What these levels are is obviously adifficult question. The answer will be conditioned by the way individualeconomies are structured and by the identification of areas where there ispotential for development. However, a general case is being made that inthose countries with the lowest secondary enrolment rates the argumentfor some expansion is compelling. In such countries less than 10 per centand often less than 5 per cent of the labour force has completed secondaryschooling. No country can be expected to achieve a transition fromsubsistence agriculture to higher value-added agriculture, more industrialmanufacturing and competitive service industries, without a larger supplyof new entrants to the workforce who have completed more than primaryeducation. This is even more the case if part of the development strategyis to be related to internationally traded goods and services withincreasing knowledge content. In many types of production and service-sector activity low labour costs are not sufficient to yield comparativeadvantages which outweigh the benefits associated with a more educatedlabour force. In the global economy, investment flows to whereproductivity is greatest and competences exist which allow flexibleadaptation to new production processes, as well as rapid assimilation ofnew ideas. Under such circumstances a critical mass of secondary-schoolgraduates is an important asset.
Clearly, however, country circumstances differ. Most obviouslysome countries have low primary and secondary enrolment rates, othersare approaching universal participation in primary but have lowsecondary enrolments, and a further group have achieved massparticipation at both levels. In the first case, where both primary andsecondary enrolment rates are still low, it is important to ensure that anexpansion of secondary enrolment does not take place to the detrimentof investment at the primary level, through the choice of an appropriatefinancing policy. A balance has to be struck between the need touniversalize primary, which should not be seen as simply takingprecedence over all investment at other educational levels, and the needto support post-primary education and training. If indeed a critical massof secondary-school graduates is required to support any viabledevelopment strategy, then an upper limit may have to be defined for theproportion of public resources allocated to primary.
Where primary enrolment is nearly universal and secondaryenrolment is low, the case for a shift towards supporting growth at
336
Financing secondary education in developing countries

International Institute for Educational Planning http://www.unesco.org/iiep
Overview and conclusions
337
secondary level is clearer. Though it may well be that further investmentin quality improvement in the first cycle is still needed, the questionbecomes one of priorities related to whatever development strategy isadopted. Some increases in access and participation at secondary maywell have a higher marginal utility for development.
Where secondary enrolment rates are low or approaching middlelevels, and there is evidence of oversupply of secondary graduates, thearguments may be different. The level of unemployment may be relatedto the short-term impact of structural adjustment programmes madenecessary by inappropriate macroeconomic or social policy. It may alsobe that there are problems with the quality of secondary schooling andthe relevance of the knowledge and skills it promotes. In suchcircumstances further expansion of secondary enrolment may not beseen as a priority, at least until employment improves and reforms havetaken place. Paradoxically, tight labour markets may increase demandfor secondary schooling if the opportunity cost is low. Political andsocial pressures may promote expanded access. These kinds ofconditions suggest that policy should be based on an understanding oflikely employment growth, reforms to increase relevance and utility, andconsidered strategies to increase cost recovery with safeguards to protectbalanced participation.
Is higher secondary enrolment achievable?
The status of secondary enrolments in different countries isoutlined in Chapter 2. The data set1 on 150 countries was divided intofour groups: those with GER2 between 7 per cent and 40 per cent, 41 percent and 70 per cent, 71 per cent and 90 per cent, and above 90 per cent.Forty-four countries have GER2s below 40 per cent. Fully two thirds ofthese are in sub-Saharan Africa, five are in central and South Americaand six are in Asia. There are systematic differences between high andlow GER2 countries.
When GER1 and GER2 are compared it is clear that where GER1is below 80 per cent, GER2 is almost always below 30 per cent. Abovethis threshold, GER2 varies across a wide range. This reinforces theview that levels of GER2 in most countries result from policy choicesand investment preferences, not simply resource constraints.
The data also show that on average low GER2 countries allocateless to secondary education as a proportion of GNP than those with
1. UNESCO data set 1998.

International Institute for Educational Planning http://www.unesco.org/iiep
338
Financing secondary education in developing countries
higher GER2s (0.86 per cent compared to 1.41 per cent) and that unitcosts as a proportion of GNP are higher in the low GER2 countries.
The comparison of public unit costs between primary andsecondary is striking. In very low GER2 countries this ratio averages3.5:1; in high GER2 countries the public unit cost of secondary is only1.3:1 times greater than primary. Part of the reason for this lies indifferences in pupil/teacher ratios. These average 37 per cent less thanthose at primary in low GER2 countries, but only 18 per cent less in highGER countries. Secondary teachers’ salaries also tend to be a greaterratio of primary teachers’ salaries in low GER2 countries. We can alsonote that class/teacher ratios can exceed 3:1 at secondary level in lowGER2 countries, compared to not much more than 1:1 in most primarysystems. Though this does not have a direct effect on unit costs sincethese are determined by the pupil/teacher ratio, it does indicate thathigher costs are not necessarily buying more teaching time. Whereclass/teacher ratios are high this implies that student contact time is lowor teaching group size unjustifiably large.
We can conclude that secondary schooling is relatively mostexpensive in relation to national resources where enrolment rates arelowest. Where the relative cost of secondary-school places is high,increased participation will be more cost constrained than where it islow. If higher levels of participation are to become a reality, then the totalcost of secondary-school systems will quickly exceed that of the primarysystem, unless unit costs are reduced.
In many developing countries with low participation rates insecondary schooling, the character and organization of secondaryschools have their origins in elite institutions designed beforeindependence to cater to a small minority of students destined to entergovernment employment. Most secondary systems have been highlyselective, have teaching and curricula traditions that reflect normsinherited from elite schooling traditions, and have been relatively wellresourced. Simple replication of existing institutions and practices toaccommodate larger numbers is neither affordable nor appropriate. Highcost, strongly selective and academically orientated secondary schoolingis inconsistent with substantially enlarged participation.
We can explore the challenge created by low participation rates insecondary through projections of the costs that would need to be met toachieve different levels of GER2. An enrolment-driven model has beenused to simulate the various scenarios based on data derived from theUNESCO database. Simulations have been run that explore the

International Institute for Educational Planning http://www.unesco.org/iiep
Overview and conclusions
339
behaviour of GERs and recurrent costs over a 15-year period fordifferent countries with GER2 below 40 per cent and between 40 percent and 70 per cent.
Table 11.1 provides a regional perspective using UNESCO data(World Education Report, 1998). Country-by-country estimates can befound in Chapter 3. The results suggest that in sub-Saharan Africa, onaverage, countries would need to allocate nearly 4 per cent of GNP tosecondary schooling alone to achieve GER2 of 60 per cent (column 5).Over 5 per cent of GNP would be needed to achieve GER2 of 80 per cent(column 6) with current cost structures. This is clearly unlikely tohappen, especially when the amounts needed to sustain GER1 100 percent are added (column 8). The figures for other regions are within arange that suggests that if such targets were priorities they could beachieved except in the lowest GER2 countries.
Table 11.1. The financial challenge of increased secondary enrolment2
1 2 3 4 5 6 7 8
GER1 GER2 Education % Education % GNP % GNP % GNP % GNPas % GNP expenditure needed needed needed needed
on for for for forsecondary as GER2 GER2 GER2 GER1
% GNP 60% 80% 100% 100%
Africa 85.9 28.2 5.8 1.4 3.8 5.1 6.3 2.9
CentralAmerica,Caribbean 104.1 49.3 4.3 1.0 1.1 1.5 1.9 1.5
SouthAmerica 108.8 60.2 3.5 0.7 0.8 1.0 1.3 1.2
Asia and Oceania 99.9 51.4 4.2 1.2 1.5 2.0 2.5 1.7
The results in Table 11.1 assume that current cost structures areretained. If these could be changed then expanded access might becomemore feasible and affordable. In addition it would be necessary toincrease private contributions to the cost of secondary-school places, orto envisage alternative forms of delivery. External assistance could alsoplay a role in easing the financial burden. In all cases a new investmentstrategy for the secondary education sub-sector is needed.
2. These unweighted averages are illustrative and are based on the countries for which dataare available.

International Institute for Educational Planning http://www.unesco.org/iiep
Parameters influencing policy options on secondary participation
The main structural determinants of the gross enrolment rate atsecondary can be summarized as follows:
GER2 = x /ac wherex = public expenditure on secondary education as a percentage
of GNPc = public recurrent expenditure on secondary schooling per
student as a percentage of GNP per capita a = the proportion of the population of secondary-school age
The determinants of GER2 have different characteristics. Thevalue of x can be varied up or down within the total expenditure foreducation. Its magnitude can be anything from below 0.5 per cent to over3 per cent. Clearly if it is varied upwards this implies a diminution,ceteris paribus, in the allocation to other parts of the education budget(primary, tertiary, administration, etc.). Shifting the balance of allocationto favour secondary might be a reasonable policy goal where more isspent on the tertiary level than on the total secondary system (e.g.Malawi, Costa Rica). This could release resources to support increasedsecondary participation. What is possible will depend on the initial valueof x, the amount of GNP allocated to education, and the case made todefend the current distribution of public funds between levels. The effectwill also depend on whether the economy as a whole is growing orshrinking.
The value of c is determined by the unit cost of a secondary-school place as a percentage of GNP per capita. Its value varies over avery wide range from 5 per cent to over 100 per cent. It is determinedmainly3 by a combination of pupil/teacher ratios and teachers’ salaries inrelation to GNP per capita. Where pupil/teacher ratios are low and canbe increased, the value of c will fall and allow more secondary studentsto be enrolled at the same total cost. The same outcome could beachieved by reducing average salary costs (e.g. by employing a greaterproportion of younger teachers or increasing the proportion of teachingassistants). Where the value of c is very different to the average ofcomparable groups of countries, the reasons behind this invite scrutinyand might suggest policy options.
340
Financing secondary education in developing countries
3. Except where teachers’ salaries are not the dominant recurrent cost, e.g. in someboarding-school systems.

International Institute for Educational Planning http://www.unesco.org/iiep
Overview and conclusions
341
The value of a varies between less than 5 per cent and nearly20 per cent. Its magnitude cannot be changed through educationalpolicy, except through varying the length of the secondary cycle. It arisesfrom the historic rate of population growth. It will change ifdemographic transitions occur. The change will however take some timeto have an effect on the enrolment rates, since there will be a lag of anumber of years between changes in, for example, fertility, and thearrival of students in the secondary-age range.
Strategic distinctions can be made between countries where theproblems of expanded access to secondary schooling are locatedprimarily in the need to increase overall enrolment and those where thepriority is to increase internal efficiency. In the former, increased accessrequires pro-rata increases in public expenditure; in the latter, increasedaccess can be achieved by reducing repetition and other sources ofinefficiency (poor teacher deployment, low teaching loads etc.) withoutnecessarily increasing costs. Countries which fall more or less into thesecategories can be identified.
Table 11.2 outlines a variety of country cases for values of x, c andGER2 with a tentative interpretation of their significance. Where both xand c are low, and GER2 is low (1), the implication is that there is notmuch commitment to expanding participation in secondary and that theeducation budget as a whole is a small proportion of GNP. The mostobvious way of expanding access is likely to be to give education ingeneral and secondary in particular more budgetary priority. Wherebudgetary allocation is low and unit costs high (2), participation will bevery low. The implication is that small numbers of students arebenefiting from secondary schooling, which ought to be of relativelyhigh quality given its costs. Expansion will be constrained by high unitcosts. Where budgetary allocation is high and costs are high (3)participation will also be constrained by costs which need to fall ifaccess is to be expanded. Countries with low allocations to secondaryand low public unit costs (4) can have relatively high participation iflarge proportions of costs are met outside the public budget fromcommunity support and through private schooling. This may have equityimplications. Where budgetary allocations are high and unit costs low(5), participation should be high but its quality may be questionable.

International Institute for Educational Planning http://www.unesco.org/iiep
Table 11.2. Framework of parameters influencing policy options onsecondary participation
342
Financing secondary education in developing countries
Public expenditure Public unit costs GER2 Implied Possible policyon secondary of secondary as commitment implications
education as % a % of GNP to secondaryof GNP (x) per capita (c) schooling
1 Low Low Low No priority given Increase % budgetto secondary to secondary,
allow unit costs toincrease if quality
is low and low unit costs are a cause
2 Low High Very low Low priority to access Reduce public unitand constrained by costs and increase
high costs budget for secondary3 High High Low Low priority for Reduce public unit
mass access, which is costs to increase accessconstrained by high costs
4 Low Low High Poor quality and/or Improve quality iflargely privately low; consider access
financed and equity implicationsof private funding
if prevalent5 High Low High High priority Quality may be low
given to access and unit costs mayto secondary need enhancing
This framework for analysis provides some insights that could beapplied to specific country cases. Five points should be noted.
First, public expenditure on secondary education as a proportionof GNP has to be considered along with the overall allocation toeducation and the balance between different levels of education (e.g.primary, tertiary) and administration. It should also take into accountsecondary-level allocations that may be channelled through trainingbudgets of ministries other than the Ministry of Education.
Second, whether GER2 is regarded as low or not depends partlyon its absolute value, and partly on labour market signals andmacroeconomic development strategy. It also depends on whatjudgements are made about the relative importance of increasing GER1,the primary enrolment rate. If this is already high, the case for increasingGER2 as a priority may be greater than where GER1 is low. If increasedresources for secondary schooling were to draw investment away fromprimary schooling to the extent that participation diminished, it isunlikely to be the best option.

International Institute for Educational Planning http://www.unesco.org/iiep
Third, the relationship between expenditure and enrolment rateswill be modified if there are significant amounts of private schooling orprivate contributions. Practice varies so widely that these cannot beincluded in this framework explicitly.
Fourth, unit costs depend mainly on teachers’ salaries and howteachers are deployed. Differences between countries will partly dependon salaries of comparable groups in the rest of the economy, and on thecost of living for such groups. They will also depend on what are thoughtto be appropriate and necessary levels for the pupil/teacher ratio atsecondary and on patterns of school organization (curricula constraintsmay lead to large numbers of teachers in small schools to cover allsubjects, boarding costs may be substantial etc.).
Fifth, this framework cannot help make firm judgements aboutschool quality and of the value for money currently delivered bysecondary schooling. It is implied that these judgements must feature inany realistic policy analysis since expanding enrolments or allocatingmore resources to already inefficient or ineffective school systems isclearly not desirable. Thus where class/teacher ratios are unacceptablyhigh, they should be encouraged to fall; where indicators of achievementfor particular types of school are unsatisfactory they should not beexpanded until the causes are understood and addressed.
One last issue needs to be raised in relation to a policy framework.The size of the secondary-school-age population is normally stable overthe short term and is not a policy variable under the control of Ministriesof Education. However, the possible impact of HIV on dependency ratesand the size of the school-age population is substantial. Modelling theimpact of HIV is complex since it depends on the patterns and rates of newinfection, the progression from HIV to AIDS, and from adult AIDS todeath. All of these vary between countries and over time. The populationsof five African countries on which data are available (UN Secretariat,1998) are projected to grow by between 10 per cent and 20 per cent lessthan they would have done without HIV by 2015. Put differently,population growth rates are projected to fall dramatically. In Botswana thepopulation growth rate of 2.9 per cent (1990-95) could fall to 1.2 per cent,in Zimbabwe it fell from 3.3 per cent in the 1980s to 2 per cent (1990-95),and it is projected to decline to less than 1 per cent (2000-2005). In SouthAfrica a decline is anticipated from 1.9 per cent to 0.3 per cent.
The implications are that the size of the secondary-school-agegroup will decline as fertility rates drop and family size falls.Dependency rates are likely to increase in the first instance, with fewer
343
Overview and conclusions

International Institute for Educational Planning http://www.unesco.org/iiep
adults relative to children. How dependency rates behave subsequentlyis difficult to establish. At some point a new equilibrium is likely to bereached within a smaller total population. The consequences of HIV arethus very important for problems of financing secondary-school growth.Much more work is needed to project and monitor what effectspredominate in the short and long term (Barnett and Whiteside, 1999).
Lessons from country data
A number of case studies have been undertaken in selected countriesof Africa, Asia, and Latin America. They provide some illustration of themagnitude of the problems and some of the approaches that differentcountries have employed to support growth in secondary schooling.
Several factors enabled Zimbabwe to expand its secondaryschooling quickly after independence. The main factor appears to havebeen a high level of commitment of public resources. As much as 8 percent of GNP and 17 per cent of public expenditure were allocated to theeducation budget as a whole. The second factor is that the public costsper student at secondary appear to average about twice those at primary,which is low by sub-Saharan African standards. During the period ofmost rapid expansion, the pupil/teacher ratio increased rapidly; so didthe number of untrained teachers. Since then, the pupil/teacher ratio hasfallen back to historic levels and untrained teachers have been trainedwhilst working in schools. Part of the reason for the present relativelylow costs is the extent to which the public financing of secondaryschools is supported by fees and other contributions. Third, automaticpromotion at primary has reduced repetition rates to low levels. Fourth,double shifting has also made a contribution to increased capacity andhas made savings in capital costs.
The analysis however draws attention to some of the problems thathave been associated with expansion. Attrition throughout secondaryschooling remains significant and the most common explanation points tothe relatively high costs that fall on parents. Since drop-out is concentratedamongst the poor and amongst girls, secondary schooling tends toreproduce existing social and gender inequalities. A growing problem isthe high level of unemployment of secondary-school graduates.
Sri Lanka has achieved high levels of secondary enrolment at lowcost, in spite of being a low-income per capita country. Sri Lankaachieved this result whilst consistently investing around 3.5 per cent ofGNP in education and not much more than 10 per cent of its government
344
Financing secondary education in developing countries

International Institute for Educational Planning http://www.unesco.org/iiep
Overview and conclusions
345
expenditure. The main reason for such low costs stems from the fact thatsalary levels relative to GNP are lower than in many other countries.Second, Sri Lanka has an unusual pattern of open access to schoolingwithout selection through to Grade 11. Many secondary schools includeprimary sections (or vice versa) and benefit from the economies of scalethat this can yield on fixed costs. They share staff across grades andteachers are not as strongly differentiated into primary and secondaryteachers as in many other countries. As a result, the costs of secondary-school places are on average no more than twice those of primary.Finally, enrolment gains have been achieved in a context of demographictransition to low growth. Currently, the growth in the school-age cohortis about 1.2 per cent. Several problems persist, such as inequalitiesbetween schools, especially between those secondary schools that haveuniversity entrance grades and those that do not.
China has had a very diverse experience in expanding access tosecondary schools. Liberalization and the development of a socialistmarket economy since the mid-1980s have resulted in a great range offinancing mechanisms to support growth in enrolment. These havecomplemented long-standing structural features of school financing thatare peculiar to China and former communist countries. Conditions varywidely across this vast country, but common arrangements include:earmarked local taxation for education levied on business turnover andpayrolls; allocation of a share of the profits of school-run businesses(these are enterprises in common ownership, but not usually usingschool staff or students as employees); and different forms of collectivework-unit support for schools based in the community (in cash fromfund-raising and in kind from labour, etc.).
In the two areas studied in China, low population growth hasresulted in a shrinking age cohort, but there is also a high level ofdependence on work-unit related income from activities unrelated toschooling. It is common to find that financing of school development isachieved from entrepreneurial use of school assets (e.g. renting spaceand buildings). A significant proportion of urban schools generatesubstantial income from fee-paying students from outlying areas. Oneconsequence has been the development of large differentials betweenunit costs in urban and rural schools. It is also true that teachers’(publicly funded) salaries and teachers’ total income have divergedwidely as a result of non-budget contributions from local fund-raising. Itremains to be seen how the tensions that have developed as participationgrows will be resolved.

International Institute for Educational Planning http://www.unesco.org/iiep
Costa Rica illustrates a different case. The country has followeda consistent development strategy to favour investments in the socialsector and achieved, more than two decades ago, relatively high levels ofsecondary participation. Recession in the 1980s was howeveraccompanied by a decline in enrolment rates at secondary from about 62per cent to 49 per cent. Existing pass rates, repetition and drop-out ratesin secondary schools are indicative of problems of insufficient qualityand fragile effective demand. The unit cost of secondary education islow, as shown by the ratio of costs between primary and secondary,which is close to 1:1. This has been made possible by the relatively lowlevel of salaries, although that may have had a demoralizing effect onteachers. Measures are needed to improve quality and to make secondaryschooling more attractive to students from rural and peri-urban low-income households (e.g. curriculum reforms, distribution of learningmaterials, retraining of teachers, increase in teacher salaries). Severalcost-rationalizing measures have been proposed that could offset someof the planned increase in expenditures. Some reallocation of fundsbetween levels may have to be considered, since the country is unlikelyto increase significantly the amount allocated to education as aproportion of GDP, which is already around 6 per cent.
Malawi and the francophone African countries considered inour study face a much more difficult state of affairs. Secondary GERsremain very small in these countries, ranging from 6 per cent in Malawiin normal government secondary schools to 25 per cent in Côte d’Ivoire.The difficulties in improving access to and quality of secondaryschooling arise from several sources. First, universal primary educationis far from being achieved in all of these countries and competition forscarce resources is fierce. Second, the overall budgetary position isconstrained by a lack of economic growth, a limited fiscal base andheavy commitments to debt servicing and reimbursement. Malawi andCôte d’Ivoire allocate 5 to 6 per cent of their GNP to education and itseems difficult to go much above this level. Third, costs per student innormal secondary schools are high and average several times those inprimary schools. Fourth, unless some expansion of the universities takesplace at the same time, a further constraint on secondary expansionmight be located in teacher supply.
Several of these countries are committed to expanding access tosecondary schools (Malawi, Mali, Senegal and Côte d’Ivoire). Themagnitude of the financial challenge is considerable. Measures are beingenvisaged which range from reducing the length of lower-secondary
346
Financing secondary education in developing countries

International Institute for Educational Planning http://www.unesco.org/iiep
education (Mali), reducing the number of boarding schools andexpanding day secondary schools (Malawi), increasing privatecontributions (Malawi) and encouraging the development of the privatesector (Côte d’Ivoire, Madagascar, Mali). How great a part of publicresources is to be devoted to secondary education remains a difficultissue. Universal primary schooling is far from being achieved and, todiffering degrees, unemployment of secondary-school graduates isappearing.
Meeting the challenge: policy options for growth
The main options in addressing the challenge of increasedparticipation at secondary level revolve around increasing the proportion ofGNP allocated to education in general and secondary in particular, and inreducing unit costs, increasing efficiency and exploring opportunities toincrease cost sharing. The options, and some of their implications, aresummarized in the following Tables 11.3 to 11.6.
Table 11.3. Options which would increase public spending onsecondary schools
347
Overview and conclusions
Action Comment
Increase education budget Where the percentage of GNP allocated to education isas % of GNP less than 6% there may be scope for an increase;
Where debt forgiveness is considered, more resourcescould be allocated to education in general and tosecondary education in particular.
Increase education budget Where the percentage of budget is less than 20% thereas % of government may be scope for an increase; if GNP growth has beenexpenditure negative allocations should be increased to maintain
the real value of educational spending;Where debt forgiveness is considered, more resourcescould be allocated to secondary education.
Increase spending on Shift allocations in favour of secondary, depending onsecondary as a % of enrolment and costs at other levels. Earmark agovernment educational proportion of funding for secondary.expenditure
Require decentralized Municipalities and local authorities may be asked toauthorities to finance finance school building and contribute to somesome of the costs recurrent costs.

International Institute for Educational Planning http://www.unesco.org/iiep
The analysis data in Chapter 3 (Tables 3.1, 3.2 and 3.3) haveshown the scope for overall increases in allocation to education indifferent countries and the extent to which there may be room to increasethe current level of spending. It appears that for many low GER2countries the increases needed in the proportion of GNP allocated tosecondary education for significant expansion are unrealistic. Wheremore than 5 per cent of GNP is already committed to the educationbudget as a whole, significant increases are unlikely. Redistribution tofavour secondary may be difficult where universal basic education hasyet to be achieved.
There are cases where more could be allocated, and where moreis spent on higher education than all of secondary education. Heredifferent policy priorities are an option. Where there are high levels ofprimary enrolment and relatively low GER2s, it is more feasible tosuggest that any increases in allocation up to 5 or 6 per cent of GNPshould be directed towards expanding access to secondary schooling.The debt forgiveness schemes that are under consideration could changethe circumstances of the most indebted countries and release additionalresources. This would only benefit secondary schooling if sector-wideapproaches recognize the importance of a balanced approach tofinancing both primary and secondary. Increased public finance couldalso come from decentralization where this enables local authorities toraise revenue that can be channelled into educational support.
There may be scope for re-examining the length of secondaryschooling and how it is segmented into more and less specialized cycles.Policy on curriculum options, selection and tracking, and specializedprovision all carry cost implications that may need reappraisal in thelight of new circumstances that make it inappropriate to simply expandexisting provision. Where there are insufficient resources to expandaccess, choices have to be made between sustaining high-cost provisionand finding ways of reducing costs through rationalizing option choiceand limiting selection into high-cost specializations. Alternative deliverysystems that make more use of peer learning, self-instruction anddistance methods could all reduce unit costs without necessarilydiminishing quality. They offer possible strategies for expanding accessto those currently out of school as well as lower unit costs for thoseenrolled.
High public unit costs generally arise from high salary levels, lowpupil/teacher ratios and boarding costs. Salary levels have to be judgedin relation to national labour markets and the cost of living. They do vary
348
Financing secondary education in developing countries

International Institute for Educational Planning http://www.unesco.org/iiep
Table 11.4. Options that would reduce unit costs of secondary schools
349
Overview and conclusions
Action CommentReduce the length of Where secondary cycles are over long, reduce in favour secondary schooling of greater participation and completion
Lower unit costs of Extending enrolment to include some or all lower secondarysecondary by combining grades in primary schools should reduce costs of provision lower secondary and primary and increase retention. Transitional costs have to be weighedschool grades against benefits.
Limit enrolment in high-cost Restrict enrolment in high-cost specialist schools and technical and vocational streams. ‘Technologize’ the school science curriculum.streams Introduce vocational subjects with average costs.
Adopt a core curriculum Organize learning around a common core with polyvalentwith limited options at lower teachers managing whole class teaching.secondary
Restrict option choice at Establish minimum group sizes for options. Limit the upper secondary number of options available in each school.
Include periods of self- Adopt more flexible learning strategies especially for olderinstruction, distance and students which would include peer learning, materials-mixed-mode delivery based self-instruction, and conventional and information
technology distance-based programmes.
Increase pupil/teacher ratios Where pupil/teacher ratios are low increase to maximadetermined by physical constraints and demonstrated goodpractice; 40:1 may be feasible.
Reduce class/teacher ratios Establish class/teacher norms suited to curricula organizationand appropriate teaching loads. Class/teacher ratios could be maintained below 2:1.
Increase average secondary- Use school mapping and economic analysis to establishschool size minimum secondary-school size. Profile of economies of
scale. Enrolment of 1,000 may be a benchmark. Allow special cases to reflect demography etc.
Increase teaching hours Review teaching workloads. If low identify new norms.worked Profile workloads of more and less qualified and experienced
teachers. Distribute loads more evenly.
Increase the proportion of Encourage recruitment of lower-cost teachers within career teaching assistants, structures that allow development and promotion.temporary teachers and Extend use of experienced teachers using team teaching,younger teachers parallel classes, common lesson planning. Use experienced
to support inexperienced.
Reduce average teachers’ If teachers’ salaries are substantial multiples of GNP persalaries capita, and above levels for comparable groups, consider pay
restraint and increases below the rate of inflation. If salariesare low and result in widespread second jobs, increase salaries and non-salary benefits.
Reduce non-essential Sustain boarding only where population density/ transport/ boarding special needs justify costs. Otherwise switch to day schools
and/or increase cost recovery.
Reduce non-salary costs Review non-salary costs. Protect learning-materialexpenditure. Review flat-rate subsidies for food, books etc. in favour of needs-based subsidies.

International Institute for Educational Planning http://www.unesco.org/iiep
considerably between countries as a percentage of GNP. Significantreduction in teacher salaries where these are judged high may or may notbe feasible. Where they are low, any further reductions would havenegative consequences for teachers’ motivation and performance. It maybe attractive to consider whether there are ways of recruiting moreassistant teachers so as to reduce average salary costs, if this can beachieved in ways that complement the work of highly paid and fullytrained teachers.
Where pupil/teacher ratios are low these can be increased. Oneindicator of whether this is possible is the class/teacher ratio. Where thisis more than 2:1 lower pupil/teacher ratios (and therefore unit costs)could be achieved through increases in teacher productivity. Otheroptions include exploring the economies of scale that might result fromincreases in average school size where this is low, reducing non-essentialboarding and/or associating it with cost recovery, and economizing onnon-salary costs where this does not reduce the supply of learningmaterials.
There are options to increase efficiency in many secondary-school systems. Drop-out is inefficient if it results in incomplete masteryof competences associated with secondary schooling. It increases thenumber of years of investment needed to produce a successfulsecondary-school graduate. Repetition is inefficient (and probablyinequitable) if it results in many places being occupied by thoserepeating at the expense of those out of school. The level of repetition isitself some indication of the effectiveness of learning and teaching. It canbe reduced if this is prioritized as a goal since it is largely under thecontrol of Ministry of Education policy. Rates of repetition may bereduced through action to reduce the variation between schools inpupil/teacher and class/teacher ratios, reduce teacher absenteeism, adaptcurriculum to local circumstances, and increase students’ time on task.
Other areas where efficiency might be increased includeeliminating ghost teachers from payrolls, providing incentives toimprove learning outcomes and student throughput, and improvingteacher deployment. Where teachers are trained to teach several subjects,utilization is generally higher than where teachers specialize in only onesubject. Lastly, one or other of the many systems of double shifting canbe introduced where conditions are appropriate. This saves on capitalcosts and can save on some recurrent costs, depending on how it isconfigured.
350
Financing secondary education in developing countries

International Institute for Educational Planning http://www.unesco.org/iiep
Overview and conclusions
351
Table 11.5. Options that would increase efficiency in secondaryschools
Action Comment
Reduce drop-out Establish reasons for drop-out. Where these are underthe control of the Ministry and schools, deviseinterventions and curriculum modifications to reducedrop-out.
Reduce repetition Establish reasons for repetition. Where these are underthe control of the Ministry and schools, deviseinterventions and curriculum modifications to reducerepetition.
Reduce variation in pupil/ Monitor variation in school inputs and performanceteacher ratios and class/ indicators. Use formula funding to reduce varianceteacher ratios between schools on key indicators.
Eliminate ghost workers Audit payroll against validated school census data.on the salary payroll
Provide incentives to Review national, regional, district and school-levelincrease efficiency of allocation and spending procedures. Developschool management incentives for budget holders to increase efficiency,
especially in relation to teacher deployment and othermajor cost drivers.
Train teachers to teach Increase teacher utilization by ensuring teachers canseveral subjects generate full teaching loads, teaching across several
subjects if necessary.
Double-shift schools Double-shift schools where population density allows if this increases capacity at marginal cost.
Reduce teacher absenteeism Review conditions of service; limit penalty-free casualleave; reward continuous attendance with bonuses.
Adapt curriculum to Consider curriculum development designed toseasonality and patterns recognize irregular pupil attendance and modularizeof attendance learning.
Increase time on task Increase student learning time through better classroommanagement and pedagogy; reinforce through schooland district supervision systems.

International Institute for Educational Planning http://www.unesco.org/iiep
352
Financing secondary education in developing countries
Action Comment
Tuition fees Consider the scope for contributions to costs throughtuition fees in public schools.Encourage the multiplication of private institutionswithout or with partial government support.
Learning-materials fees Consider learning-material fees and subsidized loansschemes.
Food and boarding fees Collect contributions to food costs and boarding feesfrom those who can pay.
Rent premises Rent unused space and facilities where practicable.
Community contributions Offer incentives and matching grants for communityin cash and kind assistance.
Local educational taxes Levy earmarked taxes on employees and businesseslocally with appropriate accountability.
Fund-raising incentives Offer incentives and matching grants for fund-raisingby PTAs etc. Scale to reflect wealth of community.Offer tax incentives.
Tuition fees are an obvious way of recovering some of the costs ofsupporting access to expanded secondary schooling. Differentdeveloping countries have very different practices concerning the extentto which secondary schooling is free for the student. Most anticipatesome contributions, but often these are a small proportion of actual costs.Some recover substantial proportions of costs. Since secondary-schoolfinancing takes so many forms, it is difficult to generalize. However,where there is evidence that incomes are high enough to permitsignificant fee-paying, this option should be considered, along withsafeguards to subsidize access for those from low-income families.Where participation is low and private demand exceeds the capacity ofthe public-school system, the balance of advantage would seem toindicate a positive policy climate for the growth of private provision. Ifthis succeeds in increasing enrolment at no additional public cost, it canbe seen as a net benefit.
Contributions towards the costs of learning materials are feasibleand widely requested. Schemes have to recognize that pricing must beappropriate or availability will suffer. Where schools have some autonomyover the funds they generate, they can reduce operating costs by requestingsupport for food and boarding costs, and generate income from rentingfacilities. Cost sharing with communities is possible, both for capital andrunning costs, where this is expected and encouraged. Matching grants,
Table 11.6. Options emphasizing cost sharing

International Institute for Educational Planning http://www.unesco.org/iiep
tax incentives and local fund-raising can all be significant in increasing theflow of resources. It has to be recognized that the capacity of families andcommunities to contribute is dependent on their level of income. This maybe very limited where there is little economic growth, poverty iswidespread, and opportunities for income generation are scarce. Ifcommunities are already heavily engaged in financing primary education,cost recovery for secondary schooling adds a further burden on scarceresources. The potential of cost recovery to finance expanded participationis therefore closely bound to particular country contexts.
The last option for increasing the resources available to stimulatesecondary education in developing countries is to invite externalassistance. In the countries with the lowest GER2s and the fewestprospects of financing expansion domestically, this option should beseriously considered. Chapter 10 details areas in which such assistancemay be most effective. These include appropriate capital investment inbuildings and equipment; support for curriculum development instrategic areas that include mathematics, science and technology,information and communication technology and language; productionand distribution of learning materials; teacher education; assessment;and school management.
We have noted that support for the development of secondary-school systems has not been favoured by donors and lending agenciesover the past decade. This book has argued that investment at secondarylevel appears more and more as a missing link in human resourcedevelopment strategies. It carries consequences both for future economicgrowth and for the achievement of social goals, not least those definedby commitments to Education for All. If this is true then some re-profiling of external assistance is timely.
Concluding remarks
It is clearly not possible to end this book with a single list of clear-cut recommendations. Whether different countries will be able toincrease the share of government resources for secondary education,reduce the cost per pupil to allow expansion, increase internal efficiencyto allow greater access, or develop cost-sharing mechanisms to co-finance more enrolment is a subject for country-level analysis. Whateffect these various options will have and which are practicable alsodepends on projections of resource flows and on qualitative judgementsof political, professional and structural feasibility.
353
Overview and conclusions

International Institute for Educational Planning http://www.unesco.org/iiep
What can be said is that the analysis here draws attention to a setof concerns that are likely to be prominent in education and developmentpolicy over the next decade. As the Education for All agenda gatheredmomentum during the 1990s, issues of access, participation, andfinancing of secondary schooling were not the subject of the mostprominent policy debates. In the majority of developing countries, whereprimary gross enrolment rates are approaching 100 per cent or more, thescene is set for attention to shift from primary to higher levels. In thosecountries with low primary enrolments and the lowest secondaryparticipation, this analysis places in sharp focus questions of how best todecide the level of priority that should be given to investment insecondary schooling as part of a coherent medium-term developmentstrategy. It is not obvious that the pattern of the past ten years, which hasseen secondary enrolment growth stagnate or decline in low GER2countries, is the best way forward. It is clear that without more efficientdelivery at lower cost per student and greater availability of financing,secondary-school participation will not increase. Where developmentstrategy assumes improvements in the quality of the labour force basedon attributes acquired and consolidated through secondary schooling,the consequences of under-investment may be felt acutely. So also maybe the social and political consequences of restricted access andoutmoded curricula which fail to address the needs of the nextgeneration entering a rapidly changing social world.
This book has analyzed the financing of education at secondarylevel. It has developed theoretical insights and case-study material thatpresent a portrait of current status, contemporary issues and emergingproblems. This kind of analysis will be familiar to economists andplanners of education. For other readers it is appropriate to emphasizethe fact that no planner or economist conducts an analysis in a vacuum.Issues of resource allocation for secondary schooling are importantbecause they determine how many students can participate and underwhat kind of learning and teaching conditions. Ultimately, however, theeffect of investment in education will be determined by both the quantityand the quality of what can be provided. Improved financing canenhance the former and create the conditions under which the latter canbe realized.
Appropriate levels of investment in secondary schooling arecritical to development. Secondary-level education can and should offerlearning that is qualitatively different to that at primary level. Effectivesecondary schooling introduces students to formal reasoning, problem-
354
Financing secondary education in developing countries

International Institute for Educational Planning http://www.unesco.org/iiep
solving skills, and occupationally relevant content and applications ofknowledge. It develops competences that provide access to the globaleconomy and the potential that this offers for economic growth. It is thearena from which many of the next generation of leaders will be drawn.Expanding access can contribute to equity, can be organized in wayswhich are pro-poor and contribute to poverty reduction, and can enhancethe capabilities on which development depends. The challenges areclear. The strategies that are needed have been identified. There aretrade-offs and balances of costs and benefits to be considered. Policy onfinancing is at the heart of new approaches to enhanced provision. Thetask is now for governments, planners, educational stakeholders, andagencies to identify those approaches that will succeed in improvingparticipation, achievement and quality at secondary level in theparticular circumstances of different developing countries.
355
Overview and conclusions

International Institute for Educational Planning http://www.unesco.org/iiep
General
Anderson, C.A. 1990. The social context of educational planning.Fundamentals of Educational Planning series, 5. Paris: InternationalInstitute for Educational Planning/UNESCO.
Asian Development Bank. 1997. Emerging Asia: changes andchallenges. Manila: Asian Development Bank.
Atchoarena, D.; Caillods, F. 1999. “Technical education: a dead end oradapting to change?” In: Prospects, XXIX(1), March, 1999.
Barnett, T.; Whiteside, A. 1999. “HIV/AIDS in Africa: Implications fordevelopment and major policy implications”. Fourth SCUSAInter-University Colloquium, University of East Anglia, Norwich,U.K., September 1999.
Barro, R.; Lee, J. 1997. “International comparisons of educationalattainment”. In: Journal of Monetary Economics, 32(3) pp. 363-94 (http://www.worldbank.org/research/growth).
Bennell, P.; Furlong, D. 1997. Has Jomtien made any difference? Trendsin donor funding for education and basic education since the late1980s. IDS Working Paper 51. Sussex: Institute of DevelopmentStudies.
Beynon, J. 1997. Physical facilities for education: what planners need toknow. Fundamentals of Educational Planning series, 57. Paris:International Institute for Educational Planning/UNESCO.
Bray, M. 1996. Decentralization of education: community financing.Washington DC: World Bank.
357
References

International Institute for Educational Planning http://www.unesco.org/iiep
Bray, M. 1999. The shadow education system: private tutoring and itsimplications for planners. Fundamentals of Educational Planningseries, 61. Paris: International Institute for Educational Planning/UNESCO.
Bray, M. 2000. Double-shift schooling: design and operation for cost-effectiveness. London: Commonwealth Secretariat; Paris:International Institute for Educational Planning/UNESCO.
Bray, M.; Lillis, K. 1988. New resources for education: issues and policyimplications for less developed countries. Oxford: Pergamon Press.
Bredie, W.; Beeharry, G. 1998. “School enrolment decline in sub-Saharan Africa: beyond the supply constraint”. World BankDiscussion Paper 395. Washington DC: World Bank.
Caillods, F.; Gottelmann-Duret, G.; Lewin, K.M. 1997. Scienceeducation and development; planning and policy issues atsecondary level. Oxford: Pergamon; Paris: International Institutefor Educational Planning/UNESCO.
Caillods, F.; Maldonado-Villar, M. 1997. “Secondary education issues inLatin America”. In: Bulletin. The major project of education inLatin America and the Caribbean, 42.
CEPAL. 1996. “Invirtiendo más y mejor en educación media”. In: Notassobre la economía y el desarrollo, No. 592-593. Santiago: CEPAL.
Cohen, D. 1999. The HIV epidemic and the education sector in sub-Saharan Africa. World Bank staff refresher course, AfricaDivision. Institute of Development Studies. June, 1999.
Colclough, C. 1991. “Who should learn to pay? An assessment of neo-liberal approaches to education policy”. In: Colclough, C. andManor, J. (Eds.) States or Markets? Neo-liberalism and thedevelopment policy debate. Oxford: Clarendon Press.
Colclough, C. 1996. “Education and the market: which parts of the neo-liberal solution are correct?” In: World Development, 24(4) pp.589-610.
Colclough, C.; Al-Samarrai, S. 1998. Achieving schooling for all:budgetary expenditures on education in sub-Saharan Africa andSouth Asia. Institute of Development Studies. Mimeo.
358
Financing secondary education in developing countries

International Institute for Educational Planning http://www.unesco.org/iiep
References
359
Colclough, C.; Lewin, K.M. 1993. Educating all the children: strategiesfor primary schooling in the South. Oxford: Clarendon Press.
Cummings, W. 1995. Private education in the new Asia (unpublisheddraft).
Department for International Development (DFID). 1999. Learningopportunities for all: a policy framework for education. London:United Kingdom Government
Eisemon, T.O. 1997. Reducing repetition: issues and strategies.Fundamentals of Educational Planning series, 55. Paris:International Institute for Educational Planning/UNESCO.
Garfield, R.; Holsinger, D.; Ziderman, A. 1994. The costs of secondaryexpansion. ESP Discussion Paper Series, Education and SocialPolicy Dept. Washington DC: World Bank.
Golzman, G.; Jacinto, C. 1999. El desafío de la extensión de laescolaridad en el medio rural: el programa Tercer Ciclo de laEducación General Básica en Escuelas Rurales en Argentina.Paris: International Institute for Educational Planning/UNESCO.Mimeo.
Hanushek, E. 1995. “Interpreting recent research on schooling indeveloping countries”. In: The World Bank Research Observer, 10(2) pp. 227-246. Washington DC: World Bank.
Hanushek, E. 1998. “The evidence on class size”. University ofRochester (USA). W. Allen Wallis Institute of Political Economy.Occasional paper, 1.
Hinchliffe, K. 1993. “Neo-liberal prescriptions for educational finance;unfortunately necessary or inherently desirable?” In:International Journal of Educational Development, 13(2) pp. 183-187.
Hoppers, W. 1996. Searching for relevance: the development of workorientation in basic education. Fundamentals of EducationalPlanning series, 52. Paris: International Institute for EducationalPlanning/UNESCO.
Human development report. UNDP. 1998-. New York: OxfordUniversity Press.

International Institute for Educational Planning http://www.unesco.org/iiep
James, E. 1993. “Why is there proportionately more enrolment in privateschools in some countries?” Policy Research Working Papers,Country Economics Department, WPS 1069. Washington DC:World Bank.
Jimenez, E.; Sawada, Y. 1998. “Do community managed schools work?An evaluation of El Salvador’s EDUCO program”. Working paperseries on impact evaluation of Educational Reforms, 8.Development research group. Washington DC: World Bank.
Jimenez, E.; Lockheed, M.; Paqueo, V. 1991. “The relative efficiency ofprivate and public schools in developing countries”. In: WorldBank Review Research Observer. Washington DC: World Bank.
Kelly, J. 1998. Primary education in a heavily indebted country: thecase of Zambia in the 1990s. London: Oxfam.
Knight, J.B.; Sabot, R.H. 1990. Education, productivity and inequality:the East African natural experiment. Oxford: Oxford UniversityPress.
Leonardos, A.C. 1999. Secondary education and distance learning: theBrazilian case. International Institute for EducationalPlanning/UNESCO. Mimeo.
Lewin, K.M. 1987. Education in austerity: options for planners.Fundamentals of Educational Planning series, 32. Paris:International Institute for Educational Planning/UNESCO.
Lewin, K.M. 1995. Education and development: the issues and theevidence. Overseas Development Administration, EducationResearch Series No 6. London: ODA, UK government.
Lewin, K.M. 1998. “Education in emerging Asia: patterns, policies andfutures into the 21st century”. In: International Journal ofEducational Development, 1(1), pp. 81-119.
Lewin, K.M. 1999. “Educational development in Asia: issues inplanning, policy and finance”. In: Asian Development Review.Manila: Asian Development Bank.
Lewin, K.M.; Berstecher, D. 1989. “The cost of recovery; are user feesthe answer?” Institute of Development Studies, Bulletin, Vol. 20,No. 1, January, pp. 59-72.
360
Financing secondary education in developing countries

International Institute for Educational Planning http://www.unesco.org/iiep
Linden, T. 1999. Issues in secondary education. Position Paper: Inter-Agency Consultation Meeting on Secondary Education. June,1999. Paris: UNESCO.
McGrath, S.; King, K.; Leach, F.; Carr-Hill, R. 1995. Education andtraining for the informal sector (Ed. Leach, F.). Vol. 2: “Countrystudies; Africa, Asia, Latin America”. Serial no. 11, March, 1995.London: ODA.
Middleton, J.; Ziderman, A.; Van Adams, A. 1993. Skills forproductivity: vocational education and training in developingcountries. New York: Oxford University Press.
Murphy, P. 1993. “Costs of an alternative form of second leveleducation”. In: Malawi Comparative Education Review, 37(2).
Nelson, R.; Pack, H. 1998. “The Asian miracle and modern growththeory”. Policy Research Working Paper 1881. Washington, DC:World Bank.
Penrose, P. 1993. “Planning and financing sustainable education systemsin sub-Saharan Africa”. Education research paper, 7. London:Department for International Development, UK Government.
Penrose, P. 1998. “Cost-sharing in educational research: public finance,school and household perspectives”. Education research report,27. London: Department for International Development, UKGovernment.
Postlethwaite, T.N.; Ross, K. 1992. Effective schools in reading;implications for educational planners. Hamburg: IEA.
Psacharopoulos, G. 1995. Building human capital for better lives:directions in development. Washington, DC: World Bank.
Reimers, F. 1990. A new scenario for educational planning andmanagement in Latin America. IIEP Research Report No. 81.Paris: International Institute for Educational Planning/UNESCO.
Ross, K.; Levacic, R. (Eds.) 1999. Needs-based resource allocation ineducation via formula funding of schools. Paris: InternationalInstitute for Educational Planning/UNESCO.
Rumble, G. 1997. The costs and economics of open and distanceeducation. Kogan Page.
361
References

International Institute for Educational Planning http://www.unesco.org/iiep
Sadiman, A. S. 1999. Open junior secondary school: contribution forsuccessful universal nine-year basic education. InternationalInstitute for Educational Planning/UNESCO. Mimeo.
Thobani, M. 1984. “Charging user fees for social services: Education inMalawi”. In: Comparative Education Review 28(3) pp. 402-423.
UN Secretariat. 1998. “The demographic impact of HIV/AIDS”. UNSecretariat, Population Division, Dept. of Economic and SocialAffairs. Report of a Technical Meeting New York, November.
UNESCO. 1996a. Education for All, achieving the goal. Statisticaldocument. Paris: UNESCO.
UNESCO. 1996b. Statistical yearbook. Paris: UNESCO.
Wood, A.; Ridao-Cano, C. 1996. “Skill, trade and internationalinequality”. IDS Working Paper 47. Sussex (UK): Institute ofDevelopment Studies.
Woodhall, M. 1991. Student loans in higher education: Asia. Paris:International Institute for Educational Planning/UNESCO.
World Bank. 1986. World bank financing education in developingcountries: an exploration of policy options. Washington DC:World Bank.
World Bank. 1991. Informe de evaluación al personal, proyecto derehabilitación de la educación básica. Washington DC: WorldBank.
World Bank. 1993. The East-Asian miracle. Washington DC: WorldBank.
World Bank. 1995. Priorities and strategies for education: a World Bankreview. Washington DC: World Bank.
World Bank. 1998. World development indicators (CD-ROM).Washington DC: World Bank.
World development report. 1992-. Washington DC: World Bank.
World education report. 1998-. Paris: UNESCO.
362
Financing secondary education in developing countries

International Institute for Educational Planning http://www.unesco.org/iiep
By country
Zimbabwe
Colclough, C.; Lofstedt, J.-I.; Manduvi-Moyo, J.; Maravanyika, O.;Ngeata, W. 1990. Education in Zimbabwe: issues of quantity andquality. A Joint Swedish/Zimbabwe Education Sector Study.
Lewin, K.M.; Bajah, S. 1991. Teaching and learning in environmentaland agricultural science: meeting basic needs in Zimbabwe.Bonn: Deutsche Stiftung für Internationale Entwicklung.
Ministry of Education, Zimbabwe. 1980-1995. Secretary’s annualreports. Harare: Ministry of Education.
Ministry of Education, Zimbabwe. 1997. Primary Education IndicatorsReport. Harare: Ministry of Education.
Ministry of Education, Zimbabwe. 1991/1992-1994/1995. Estimates ofexpenditures reports. Harare: Ministry of Education.
Ministry of Education, Zimbabwe. 1990-1996. School file records.Harare: Ministry of Education. Mimeo.
Nyagura, L.M.; Mupawaenda, A.C. 1992. A study of the factors affectingthe education of women and girls in commercial farming areas ofZimbabwe. (Unpublished.)
Malawi
Conolly-Smith, C. 1999. Secondary school financing issues. Report toMalawi Ministry of Education, Sports and Culture and DANIDASupport Programme to Education. Lilongwe.
DSE. 1998. Report on the Project Progress Review, Malawi IntegratedIn-service Teacher Education Programme (MIITEP). Bonn: DSE.
Government of Malawi. Basic education statistics, Malawi1996/1997/1998. Lilongwe: Government of Malawi.
Kadzamira, E.C.; Chonzi, R.; Hiddleston, P. 1995. An evaluation of thesecondary school double-shift pilot schools. Zomba: Centre foreducational research and training, Chancellor College.
363
References
International Institute for Educational Planning http://www.unesco.org/iiep
Kunje, D.; Lewin, K. 1999. The costs and financing of education inMalawi. Discussion Paper No. 2, Centre for InternationalEducation, University of Sussex, Brighton.
Ministry of Education, Malawi. 1995. A policy and investmentframework for education in Malawi, 1995-1999. Lilongwe:Government of Malawi.
UNICEF. 1998. Malawi experience in free primary education. UNICEFOffice Malawi. April, 1998.
World Bank. 1998b. AIDS assessment study – Malawi. Washington DC:World Bank.
Francophone Africa
Birks, S.; Fluitman, F.; Oudin, X.; Sinclair, C. 1994. Acquisition decompétence dans les micro-entreprises : leçons tirées de l’Afriquede l’Ouest. Paris: International Institute for EducationalPlanning/UNESCO.
Chinapah, V. 2000. With Africa for Africa, towards Quality Educationfor all. 1999 MLA project. Paris: UNESCO.
CONFEMEN. 1999. PASEC: Les facteurs de l’efficacité dansl’enseignement primaire : données et résultats sur cinq paysd’Afrique et de l’Océan Indien. CD-ROM.
Faye, C. 1998. L’enseignement secondaire au Sénégal: élémentsd’analyse et de stratégie. IIEP Terminal Paper 1997/1998. Paris:International Institute for Educational Planning. Mimeo.
Keeves, J.P. 1994. National examinations: design, procedures andreporting. Fundamentals of Educational Planning series. Paris:International Institute for Educational Planning/UNESCO.
Michaelowa, K. 2000. Dépenses de l’éducation, Qualité de l’éducationet pauvreté : l’exemple de cinq pays d’Afrique Francophone.Document technique N° 157. Paris: OECD Development Centre.
Ministère de l’éducation de base, République du Mali. 1997. Annuairedes statistiques scolaires de l’enseignement fondamental.Bamako: Ministère de l’Education de Base.
364
Financing secondary education in developing countries

International Institute for Educational Planning http://www.unesco.org/iiep
Ministère de l’éducation de base, République du Mali. 1998 Indicateursdu système éducatif 1998. Bamako: Ministère de l’Education deBase.
Ministère de l’éducation de base, République du Mali. 1999a.Indicateurs du système éducatif du Mali, synthèse. Bamako:Ministère de l’Education de Base.
Ministère de l’éducation de base, République du Mali. 1999b. Tableaude bord du système éducatif du Mali. Bamako: Ministère del’Education de Base.
Ministère de l’Education Nationale, République de Côte d’Ivoire.1999a. L’état de l’école. 1997-1998. Abidjan: Ministère del’Education Nationale.
Ministère de l’Education Nationale, République de Côte d’Ivoire.1999b. Tableau de bord. 1997-1998. Abidjan: Ministère del’Education Nationale.
Ministère de l’Education Nationale, République de Côte d’Ivoire.1999c. Indicateurs du secteur éducation/formation, Côte d’Ivoire1997-1998. Institut des statistiques de l’UNESCO. Abidjan:Ministère de l’Education Nationale.
Ministère de l’Education Nationale et de la Formation de Base,République de Côte d’Ivoire. 1996. L’état de l’école: annéescolaire 1995-1996. Abidjan: Ministère de l’Education Nationaleet de la Formation de Base.
Ministère de l’Education Nationale et al., République de Côte d’Ivoire.1998. Indicateurs du secteur Education/Formation, Côte d’Ivoire1997-1998. Abidjan: Ministère de l’Education Nationale et de laFormation de Base; Institut des Statistiques de l’UNESCO.
Ministère de l’Education Nationale, République du Sénégal. 1998.Statistiques scolaires et universitaires 1997/1998. Dakar:Ministère de l’Education Nationale.
Ministère de l’Enseignement de Base et de l’Alphabétisation, BurkinaFaso. 1998. Statistiques scolaires 1997/1998. Ouagadougou:MEBA, Direction des Etudes et de la Planification.
365
References

International Institute for Educational Planning http://www.unesco.org/iiep
Ministère de l’Enseignement de Base et de l’Alphabétisation, BurkinaFaso. 1999a. Statistiques scolaires 1996/1997. Ouagadougou:MEBA, Direction des Etudes et de la Planification.
Ministère de l’Enseignement de Base et de l’Alphabétisation, BurkinaFaso. 1999b. Tableau de bord de l’enseignement primaire,1997/98. Ouagadougou: MEBA.
Ministère des Enseignements Secondaire, Supérieur et de la RechercheScientifique, Burkina Faso. 1994a. Enseignement secondaire:diagnostic et plan d’action (tome 2). Paris: UNESCO.
Ministère des Enseignements Secondaire, Supérieur et de la RechercheScientifique, Burkina Faso. 1994b. Bulletin des statistiquesscolaires et universitaires 1993-1994. Ouagadougou: M.E.S.S.R.S.
Ministère des Enseignements Secondaire, Supérieur et de la RechercheScientifique, Burkina Faso. 1996. Bulletin des statistiquesscolaires et universitaires, 1995-1996. Ouagadougou:M.E.S.S.R.S.
Ministère des Enseignements Secondaire, Supérieur et de la RechercheScientifique, Burkina Faso. 1999. Bulletin des statistiquesscolaires et universitaires 1998-1999. Ouagadougou: M.E.S.S.R.S.
Péano, S.; Esquieu, P. 1996. Fonctionnement et financement del’enseignement fondamental malien. Paris: International Institutefor Educational Planning/UNESCO.
Péano, S.; Rahaririaka, R. 1997. Financement de l’enseignementprimaire et secondaire malgache. Paris: International Institute forEducational Planning/UNESCO.
UNDP. 2000. Human Development Report 2000. New York: OxfordUniversity Press.
UNESCO. 2000. World Education Report. Paris: UNESCO.
UNESCO Section for General Secondary Education, Division ofSecondary, Technical and Vocational Education. 2001. GeneralInformation Note for International Expert Meeting on GeneralSecondary Education in the Twenty-First Century: Trends,Challenges and Priorities. Paris. Mimeo.
366
Financing secondary education in developing countries

International Institute for Educational Planning http://www.unesco.org/iiep
World Bank. 2000. Education in Madagascar, policy for the next decade.Washington DC: World Bank.
World Bank. 2001. African development indicators 2000. WashingtonDC: World Bank.
Sri Lanka
Asian Development Bank. 1996. Emerging Asia; changes andchallenges. Manila: Asian Development Bank.
Asian Development Bank. 1997. Study on financing of social servicesproject Sri Lanka TA 2441-Sri, November, 1996. Manila: AsianDevelopment Bank.
Aturupane, H. 1997. The demand for schooling and the willingness topay for educational quality in Sri Lanka. Working Paper 9704.University of Colombo.
Aturupane, H.; Abeygunewardena, B. 1997. Master plan for educationin Sri Lanka: enrolment, cost and financing issues in primaryeducation. Master Plan Conference, October, Colombo, 1997.Mimeo.
Department of Census and Statistics, Ministry of Finance, Planning,Ethic Affairs and National Integration. 1994. Demographic Survey1994. Colombo: Ministry of Finance.
Government of Sri Lanka. 1993. National household survey indicatorson selected world summit goals for children and home. Colombo:Government of Sri Lanka.
Ministry of Education and Higher Education. 1992. EducationalStatistics of Sri Lanka. Colombo: Ministry of Education andHigher Education.
World Bank. 1996. “Staff appraisal report. Democratic Socialist Republicof Sri Lanka for a teacher education and teacher developmentproject”. Population and Human Resources Division, World BankReport. May, 1996. Washington DC: World Bank.
World Bank/Government of Sri Lanka. 1997. Second General EducationProject; Appraisal Mission Report, World Bank. Washington DC:World Bank.
367
References

International Institute for Educational Planning http://www.unesco.org/iiep
China
Beijing Year Book of Education. 1996. Beijing: Beijing MunicipalAuthority.
Lewin, K.M.; Wang Ying Jie. 1994. Implementing basic education inChina: progress and prospects in rich, poor and national minorityareas. Paris: International Institute for Educational Planning/UNESCO.
Lewin, K.M.; Little, A.W.; Xu Hui; Zheng Jiwei. 1994. Educationalinnovation in China: tracing the impact of the 1985 reforms.Harlow: Longman.
Costa Rica
Aplazados, aprobados, y reprobados en el sistema educativo. Ministeriode Educación Pública (MEP). 1997-. San José: MEP.
Banco Central de Costa Rica. 1986. Estadísticas 1950-1982. San José:BCCR.
Banco Central de Costa Rica. 1995. Cuentas Nacionales de Costa Rica.San José: BCCR.
Banco Central de Costa Rica. 1997. Libro Negro. San José: BCCR.
Carnoy, M.; Torres, C. 1992. Educational change and structuraladjustment: a case study of Costa Rica. Operational Policy andSector Analysis Division, working documents. Paris: UNESCO.
Chavarría, S.; Paniagua, M.; Quesada, S. 1998. La política educativahacia el siglo XXI: propuestas y realizaciones. San José: MEP.
CONARE. 1998. Comparación de producto interno bruto, presupuestonacional, presupuesto del gobierno central y el presupuesto paraeducación. Mimeo.
Dengo, M. 1995. La educación costarricense. San José: UNED.
Deserción en el sistema educativo. Ministerio de Educación Pública(MEP). 1997-, 1998-. San José: MEP.
368
Financing secondary education in developing countries

International Institute for Educational Planning http://www.unesco.org/iiep
Dirección General de Estadística y Censos (DGEC). 1997. Productointerno bruto, población, PIB per cápita, cambio, e IPC promedio1950-1996. Mimeo.
Dirección General de Estadística y Censos (DGEC). 1998. Tasa dedesempleo abierto, por zona, según año, 1976-1997. Mimeo.
Economist Intelligence Unit (EIU). 1997a. Costa Rica country profile1996-1997. London: EIU.
Economist Intelligence Unit (EIU). 1997b. Costa Rica country report,2nd Quarter. London: EIU.
Expansión del sistema educativo en Costa Rica. Ministerio deEducación Pública. 1997-. San José: MEP.
Garnier, L. 1991. Gasto público y desarrollo social en Costa Rica.Cuadernos de Politica Económica 3. Heredia: UNA.
Garnier, L.; Grynspan, R.; Hidalgo, R.; Monge, G.; Trejos, J. 1994. Eldesarrollo social de Costa Rica durante la segunda mitad delsiglo veinte. Mimeo.
Hernández, A. 1998. Calidad de la educación: un derecho de la niñez yla adolescencia. Mimeo.
Memoria anual: liquidaciones cruzadas ajustadas. Contraloría Generalde la República. 1970-‡1997-. San José: Contraloría.
MIDEPLAN. 1998a. Gobernando en tiempos de cambio. San José:MIDEPLAN.
MIDEPLAN. 1998b. Panorama nacional 1997. San José: MEP.
Ministerio de Educación Pública (MEP). 1968. El problema de larepitencia, deserción, y promoción escolar. San José: MEP.
Ministerio de Educación Pública (MEP). 1969. La educación en CostaRica, 1957-1968. San José: MEP.
Ministerio de Educación Pública (MEP). 1991. La educación en cifras:1967-1990. San José: MEP.
Ministerio de Educación Pública (MEP). 1994. Indicadores económicosy estadísticos de la educación en Costa Rica. San José: MEP.
369
References

International Institute for Educational Planning http://www.unesco.org/iiep
Ministerio de Educación Pública (MEP). 1996. Estadísticas del sistemaeducativo 1980-1996. San José: MEP.
Ministerio de Educación Pública (MEP). 1998a. Approval, pass, andrepetition rates and number of qualified teachers by school(primary data). San José: MEP.
Ministerio de Educación Pública (MEP). 1998b. Interpolated populationby age group 1950-2000 (primary data). San José: MEP.
Montiel, N.; Ulate, A.; Peralta, L.; Trejos, J. 1997. La educación enCosta Rica: un sólo sistema?. Serie de Divulgación Económica,28. San José: IICE.
Nómina de centros educativos. Ministerio de Educación Pública (MEP).1997-. San José: MEP.
Personal total que labora en instituciones de educación regular.Ministerio de Educación Pública (MEP). 1997-. San José: MEP.
Ministerio de Educación Pública (MEP). 1994-, 1996-, 1997-, 1998-.Repetición en el sistema educativo. San José: MEP.
Sanguinetty, J. 1988. La educación en Costa Rica: la crisis y susposibles soluciones. San José: MIDEPLAN/World Bank.
Solís, N.; Rodríguez, R. 1995. Repitencia y deserción en la educaciónsecundaria pública en Costa Rica. San José: MEP.
Torres, O. 1974. Los niveles de matrícula y las necesidades de recursoseconómicos en el sistema educativo de Costa Rica. Master’sThesis, Faculty of Economic and Social Sciences. University ofCosta Rica.
World Bank. 1990. Costa Rica: public expenditure/investment review.Washington DC: World Bank.
370
Financing secondary education in developing countries