Embed Size (px)
Citation preview

Financing Local GovernmentNo.1 2010
EditorialContents
Editorial 1
Introduction 2
Local Government – local democracy & local services 2
Levels of local government 3
Size of municipalities 4
Services provided by municipalities 5
Approaches to reorganisation 5
Revenue of Irish local government 7
Income streams 9
Future of local government finance in Ireland 11
Conclusion 12
“Ireland is one of the most centralised states in Europe with local government having few responsibilities and commensurate resources (2.2 % of tax revenues).” (EC 2006 p147).
The reform of local government finance has been a constant policy issue since the 1960s. There have been at least 16 reviews of local government since the 1962 Economic Research Institute report entitled LocalGovernment Finance in Ireland: A Preliminary Survey.
This Spotlight looks at some of the issues surrounding the size and power of Irish local government. It places these issues in the context of OECD comparative research and contrasts our system with those of our European neighbours. It also looks at the future financing of local government,.
February 2010 No liability is accepted to any person arising out of any reliance on the contents of this paper. Nothing herein constitutes professional advice of any kind. This document contains a general summary of developments and is not complete or definitive. It has been prepared for distribution to Members to aid them in their Parliamentary duties. Authors are available to discuss the contents of these papers with Members and their staff but not with members of the general public.
Economic & Environment Science and Parliamentary Affairs teams Library & Research Service
Central Enquiry Desk: 618 4701/ 4702

There is a commitment to reform local government in the Revised Programme for Government 2009. The programme anticipates a new system for financing local government,. It also specifies that regional authorities should have greater powers in the areas of planning, transport, water and waste management. Local government reform in the 2007 Programme for Government focused on a directly elected Mayor of Dublin, balancing the power between councillors and managers, and the establishment of new town councils among other things.1 2 The Green Paper: Stronger Local Democracy – Options for Change (Department of Environment, Heritage and Local Government 2008) stressed the need for improved local democracy and efficiencies.
A key part of the reform of local government is the revision of funding sources. As Keogan argues “Local government finance is the litmus test for central government’s commitment to local government” (Callanan & Keogan, 2003, 96). A further impetus for reform of local government financing has been the economic downturn and thus the decline in resources that central government can make available for local government.
In Ireland there are five city councils, 29 county councils, 80 town authorities (75 town and five borough councils3) and eight regional authorities. There are 883 elected councillors at city and county level and 744 on town
1 The legislation to provide for a directly elected Mayor of Dublin is expected shortly with elections planned for later in 2010. 2 De Bréadún, Deaglán, ‘Draft Law to elect Dublin Mayor approved’ Irish Times 10 February 2010. http://www.irishtimes.com/newspaper/ireland/2010/0210/1224264112200.html 3 The functions of Town and Borough councils are very limited with most services provided by county councils. They promote community interests, provide minor amenities, exercise a representational role and make local bye-laws.
authorities.4 The budgets of these councils varied in 2009 from €929 million in Dublin City to €45 million in County Leitrim (Department of Environment Heritage & Local Government, 2009).
Introduction
Across Europe the size and structure of local government varies and the functions of local government also vary. By comparison to the situation in Ireland, local government across Europe has more fiscal and policy setting autonomy.
Political theory does not pinpoint an optimal level for local government because different factors influence size in different ways. Local democracy highlights the need to have smaller local governments, though larger local governments are often more efficient. This is before the interaction of local and central government is taken into account.
This Spotlight looks at some of these issues.
Most countries have a system of local government for two reasons: as a manifestation of local democracy and a provider of local services. As an instrument of local democracy, councils of elected politicians make decisions on behalf of local communities, thus serving to safeguard against central government domination (Weeks, 2009). The strengths of local government as a democratic instrument are its closeness to the population, its elected status, its accessibility and the opportunity it provides for public participation in the democratic process (Callanan & Keogan, 2003). The European Charter on Local Self-Government (Council of Europe, 1985) signed by most European countries including Ireland (1997) recognises local government as an integral part of a democratic regime.
Local Government – local democracy & local services
4 Local Government Act 2001. http://www.oireachtas.ie/documents/bills28/acts/2001/a3701.pdf

Local government is also a provider of public services on a localised basis, developing models of service provision appropriate to specific areas. The provision of services is probably the most visible function of local government. Notwithstanding the localised nature of services these should be delivered as efficiently as possible.
Figure 1: Influences on the size of local government
Source: Oireachtas Library & Research Service
These two functions of local government can be contradictory. Efficient delivery of services can require larger or different geographic areas (sometimes these can be tied to specific geographies such as water catchment areas) but local democracy requires smaller units which facilitate citizen participation. There can also be conflict between national and local democracy (central control versus local autonomy). The 2008 Green Paper described the inherent conflict between the theory of local democracy (involving local decision-making and priority setting) and the expectation of the public that local charges and service provision will be consistent across the country (Department 2008, 85-85). Therefore, there is not an optimum size of local government – rather a confluence of different factors and tensions. Local government reform is often focused on improving either the efficiency of service provision or the democratic regime.5 5 Hendriks & Tops (1999).
Local government is the generic term used to describe all levels of government lower than central government in countries. ‘Municipality’ is generally used to describe the lowest level of political authority. The municipalities provide basic services such as housing and other social services, water and waste collection. However, the form local government takes varies considerably across EU countries in terms of the levels of government, the services provided and the average size of municipalities (Table 1).
Levels of local government
Table 1: EU sub-national governments
Country 1st Tier 2nd Tier 3rd TierAustria 2357 9 Belgium 589 10 6 Bulgaria 264 Cyprus 524 Czech Republic 6249 14 Denmark 98 5 Estonia 227 Finland 348 2 France 36682 100 26 Germany 12379 301 16 Greece 1034 54 Hungary 3175 19
Ireland 114 8 Italy 8101 110 20 Latvia 118 Lithuania 60 Luxembourg 116 Malta 68 Netherlands 441 12 Poland 2478 314 16 Portugal 308 2 Romania 3180 42 Slovakia 2891 8 Slovenia 210 Spain 8115 50 17 Sweden 290 18 2 UK 406 28 3
Source CEMR-Dexia (2009) (with 2008 figures).
3

In Ireland the 1st Tier refers to the 80 town authorities, 29 county councils, and five city councils and the 2nd Tier to the eight regional authorities (Dublin, Mid-East, South-East, South-West, Mid-West, Midlands, West and Border).6
Eight countries including Estonia, Finland, Luxembourg, Malta, and Cyprus have only one level of local government, that of municipality. These countries tend to be geographically small or have a small population. Twelve, mostly medium sized countries have two levels of local government: municipalities and an intermediary level (typically counties or provinces). Although a small country in population and size, Ireland also has two tiers. The remaining eight countries, including Germany, France, Italy and the UK, have three levels of local government.
6 The Regional Authorities promote the co-ordination of public service provision and monitor the delivery of EU Structural Fund assistance in the regions. For further detail see Irish Regions Office website http://www.iro.ie/. See http://www.environ.ie/en/LocalGovernment/LocalGovernmentAdministration/ for further details about local authorities in Ireland.
There is a wide variation of size in terms of population and geographic area covered by local government across municipalities in EU countries, illustrated by Graph 1.
Size of municipalities
The average population in local authority areas across the countries listed is 5,530 inhabitants per area with an average size of 49km2.
The average municipal size in Ireland is 38,975 inhabitants and an average geographical area of 612 km.
Source CEMR-Dexia (2009).
Ireland with 38,975 inhabitants per municipal area and an average geographical area of 612 km2 is high on both counts compared to other European countries. However, the
4

figures for Ireland are slightly misleading as they include the 80 town authorities which do not provide the full range of services that the city and county councils provide.
Approaches to reorganisations
Determining the right size to ensure local democracy and economic efficiency in the delivery of local public services has been a theme in local government reorganisations during the twentieth century. Various models have been developed to meet these two, often contradictory, demands including the merger of municipalities into bigger units and inter-municipality cooperation (CEMR 2009).
Concentrating on just the 34 city and county councils in Ireland, they have an average population of 128,149.4 and a geographical area of 2,052.8km2. By either measure Ireland could be said to have some of the largest local government units across Europe. Only Lithuania, Denmark the UK, and Sweden have more inhabitants per local government area, while Finland, and Lithuania have larger geographic areas. Municipal merger policies which
originally started in the 1950s resulted in a significant reduction in the number of municipalities in Austria, Sweden, Denmark, Finland, Belgium, the Netherlands, Finland, Lithuania and Greece. This kind of reorganisation was ongoing in Latvia and Denmark in 2009 (CCRE, 2009:5). These policies seek to compensate for the economic disadvantages experienced by small municipalities. After the reorganisation, Denmark and Latvia will have the third and fourth biggest local governments in terms of population, after UK and Lithuania.
Services provided by municipalities
Table 2 overleaf looks at the main areas of local government expenditure across Europe. Local government can spend in areas where it has no control of policy, e.g. Irish local government expenditure on education. It is interesting to consider the expenditure details along with details of the most common services provided by municipalities cited on the website of the Council of European Municipalities and Regions (CEMR)7 The most common services are culture, sport and leisure (22 countries), education (20 countries) planning (19 countries), social services (19 countries), water (17 countries), waste (15 countries) and housing (12 countries). The actual services delivered under these headings vary widely. For example, education services vary from the provision or maintenance of school buildings, to the provision of primary education, to provision of all education from child care to upper secondary level schooling.
In contrast, France, Spain, Portugal and Italy followed an inter-municipal cooperation model. This form of cooperation allows municipalities to pool their resources to improve the management of local public services, to attain the size required to carry out certain responsibilities yet also maintains their own municipal structure. A number of countries with large municipalities (including Portugal, UK and Lithuania) have an infra-municipal level in the form of localities (villages, parishes, city districts etc.). These historical subdivisions reinforce local democracy and delivery of community services without the splintering of municipalities. They can also have elected representatives and their own specific responsibilities and budgets.
5
7 Details of service provision from Council of European Municipalities and Regions (CEMR) website http://www.ccre.org/membres_en.htm
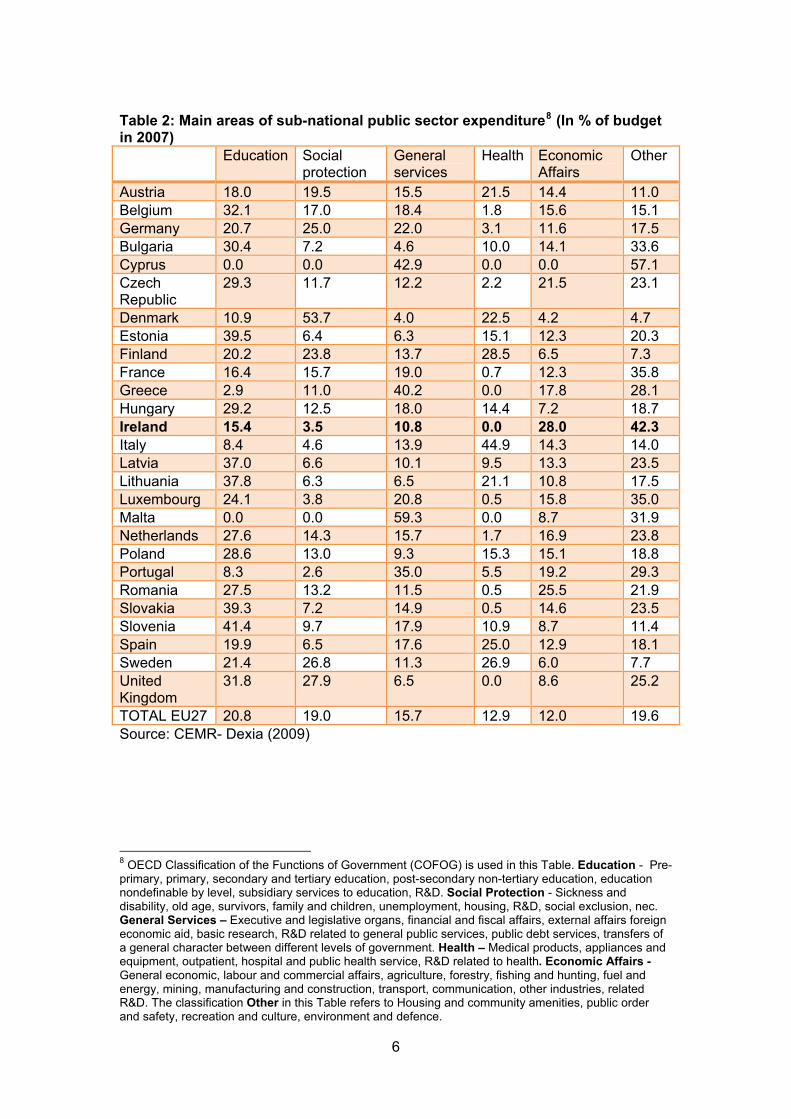
Table 2: Main areas of sub-national public sector expenditure8 (In % of budget in 2007) Education Social
protection General services
Health Economic Affairs
Other
Austria 18.0 19.5 15.5 21.5 14.4 11.0 Belgium 32.1 17.0 18.4 1.8 15.6 15.1 Germany 20.7 25.0 22.0 3.1 11.6 17.5 Bulgaria 30.4 7.2 4.6 10.0 14.1 33.6 Cyprus 0.0 0.0 42.9 0.0 0.0 57.1 Czech Republic
29.3 11.7 12.2 2.2 21.5 23.1
Denmark 10.9 53.7 4.0 22.5 4.2 4.7 Estonia 39.5 6.4 6.3 15.1 12.3 20.3 Finland 20.2 23.8 13.7 28.5 6.5 7.3 France 16.4 15.7 19.0 0.7 12.3 35.8 Greece 2.9 11.0 40.2 0.0 17.8 28.1 Hungary 29.2 12.5 18.0 14.4 7.2 18.7 Ireland 15.4 3.5 10.8 0.0 28.0 42.3 Italy 8.4 4.6 13.9 44.9 14.3 14.0 Latvia 37.0 6.6 10.1 9.5 13.3 23.5 Lithuania 37.8 6.3 6.5 21.1 10.8 17.5 Luxembourg 24.1 3.8 20.8 0.5 15.8 35.0 Malta 0.0 0.0 59.3 0.0 8.7 31.9 Netherlands 27.6 14.3 15.7 1.7 16.9 23.8 Poland 28.6 13.0 9.3 15.3 15.1 18.8 Portugal 8.3 2.6 35.0 5.5 19.2 29.3 Romania 27.5 13.2 11.5 0.5 25.5 21.9 Slovakia 39.3 7.2 14.9 0.5 14.6 23.5 Slovenia 41.4 9.7 17.9 10.9 8.7 11.4 Spain 19.9 6.5 17.6 25.0 12.9 18.1 Sweden 21.4 26.8 11.3 26.9 6.0 7.7 United Kingdom
31.8 27.9 6.5 0.0 8.6 25.2
TOTAL EU27 20.8 19.0 15.7 12.9 12.0 19.6 Source: CEMR- Dexia (2009)
8 OECD Classification of the Functions of Government (COFOG) is used in this Table. Education - Pre-primary, primary, secondary and tertiary education, post-secondary non-tertiary education, education nondefinable by level, subsidiary services to education, R&D. Social Protection - Sickness and disability, old age, survivors, family and children, unemployment, housing, R&D, social exclusion, nec. General Services – Executive and legislative organs, financial and fiscal affairs, external affairs foreign economic aid, basic research, R&D related to general public services, public debt services, transfers of a general character between different levels of government. Health – Medical products, appliances and equipment, outpatient, hospital and public health service, R&D related to health. Economic Affairs - General economic, labour and commercial affairs, agriculture, forestry, fishing and hunting, fuel and energy, mining, manufacturing and construction, transport, communication, other industries, related R&D. The classification Other in this Table refers to Housing and community amenities, public order and safety, recreation and culture, environment and defence.
6

A third approach has been to create a regional tier of local government (Czech Republic, Slovakia, Denmark and Slovenia) for the delivery of certain services which require a large population base, e.g. health care, economic development and planning. In some cases where a regional layer already existed, its responsibility and autonomy has been increased, e.g. Germany, Spain, Italy, France, Sweden and Finland.
Local government revenue is relatively low in Ireland.9 In 2008 (the latest year available), it accounted for approximately 7.7% of GDP (Graph 2).
Source: Eurostat (2010)
In contrast, central government revenue was 27.2% of GDP. Thus, central government revenue was four times greater than local government revenue. Indeed 44% of local government’s revenue comes from central government (see below).
Looking at the trend in the revenue of local and central government, three periods are discernable. Between 1996 and 2000, local government revenue was, in comparison to central government revenue, relatively stable. Central Government raised
9 This section refers to revenue; however a similar pattern is noticeable if we look at expenditure.
approximately 2.5 times as much as local Government. Between 2001 and 2004, local government revenue increased and central government revenue declined as a proportion of GDP; so that central government was less than twice local government revenue. There was a sharp turnaround in 2005 and local government revenue fell from 14.5% of GDP 6.6% of GDP. At the same time central government revenue rose from 26.8% in 2003 to 30% in 2006. This meant that the ratio of local to central government revenue widened to over four times.
Revenue of Irish local government
This last sharp change needs some explanation: the reform of the health care system of the 1st January 2005 meant the reclassification of a number of units previously classified in the Local Government sector, (Eurostat 2006 p5). The local health boards were under local government but with the creation of the HSE local government lost the oversight capacity for elements of the local health boards. Therefore this ‘break’ in the data reflects a change in the role of local government and not a statistical anomaly.
Source: Eurostat (2010)
7
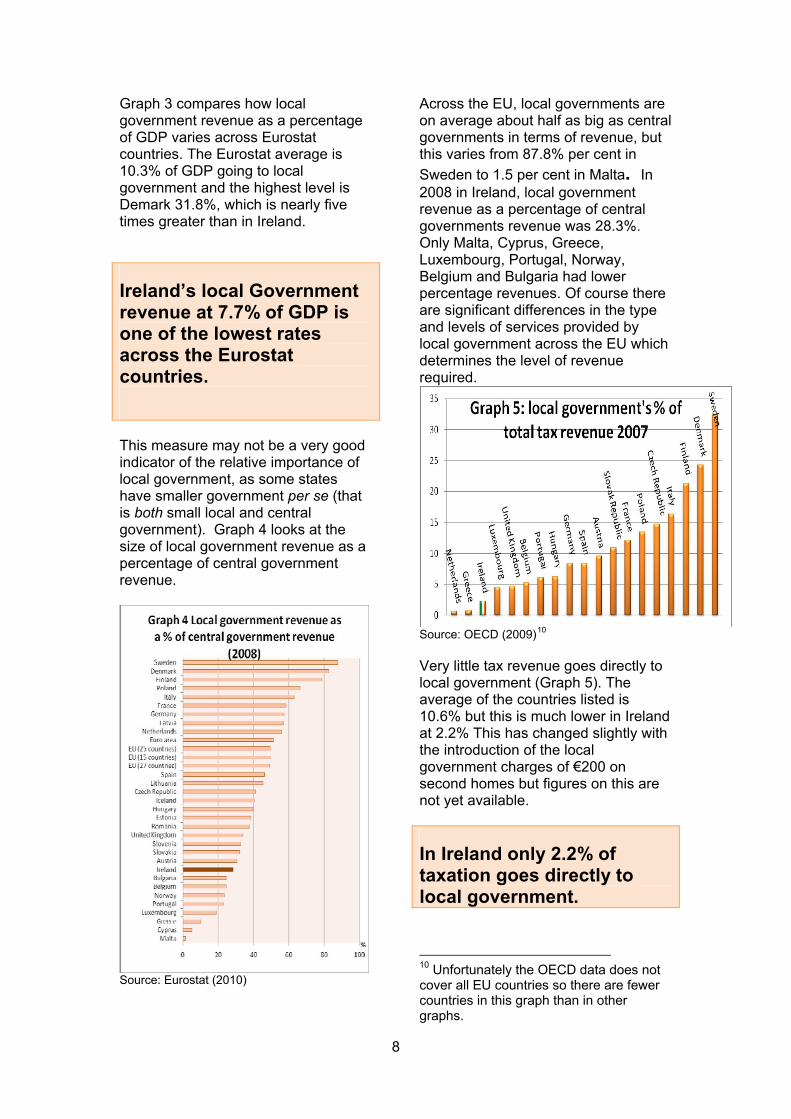
Graph 3 compares how local government revenue as a percentage of GDP varies across Eurostat countries. The Eurostat average is 10.3% of GDP going to local government and the highest level is Demark 31.8%, which is nearly five times greater than in Ireland.
Ireland’s local Government revenue at 7.7% of GDP is one of the lowest rates across the Eurostat countries.
This measure may not be a very good indicator of the relative importance of local government, as some states have smaller government per se (that is both small local and central government). Graph 4 looks at the size of local government revenue as a percentage of central government revenue.
Source: Eurostat (2010)
Across the EU, local governments are on average about half as big as central governments in terms of revenue, but this varies from 87.8% per cent in
Sweden to 1.5 per cent in Malta. In 2008 in Ireland, local government revenue as a percentage of central governments revenue was 28.3%. Only Malta, Cyprus, Greece, Luxembourg, Portugal, Norway, Belgium and Bulgaria had lower percentage revenues. Of course there are significant differences in the type and levels of services provided by local government across the EU which determines the level of revenue required.
Source: OECD (2009)10
Very little tax revenue goes directly to local government (Graph 5). The average of the countries listed is 10.6% but this is much lower in Ireland at 2.2% This has changed slightly with the introduction of the local government charges of €200 on second homes but figures on this are not yet available.
In Ireland only 2.2% of taxation goes directly to local government.
10 Unfortunately the OECD data does not cover all EU countries so there are fewer countries in this graph than in other graphs.
8

and other grants (Figure 6). However that masks the fact the just over half (51%) of the income of county councils comes from central government. City and town councils have more scope to raise revenue from commercial rates and charges than county councils which are more reliant on central government funding. Graph 7 illustrates the fact that the extent to which local authorities are self financing varies across Ireland. Leitrim gets only 15% of its funding from the provision of goods and services, the majority of the rest is made up of central government transfers (through Government grants/subsidies and the General Purpose Grant). In contrast Cork County Council gets 53% of its funding from the provision of goods and services.
Income streams
Graph 6 examines where the revenue for Irish local government actually comes from. The biggest contributor to local governments budget is central government through the general purpose grant and the government grants and subsidies, followed by commercial rates.
Unfortunately comparable international detail on the sources of local government revenue is not available. The Commission on Taxation (2009) commented that an international comparison of the balance between central and local sources of local government funding is difficult because of the different models of local government and different services provided. Further it said that the absence of any local tax on domestic property in Ireland makes such comparison less meaningful.12
Source: Local Authority Budgets 2009 (Department of the Environment, Heritage and Local Government, 2009).
Therefore, the biggest source of local government funding is national government followed by revenue from goods and services.
The biggest expenditure of local governments is capital investments, followed by salaries of employees and intermediate consumption.11
On a national basis the Exchequer provides 44% of the funding for local government, made up of the General Purpose Grants as well as subsidies
11 Intermediate consumption consists of the value of the goods and services consumed as inputs by a process of production, excluding fixed assets whose consumption is recorded as consumption of fixed capital. The goods and services may be either transformed or used up by the production process. http://circa.europa.eu/irc/dsis/nfaccount/info/data/ESA95/en/een00129.htm
12 Commission on Taxation, 2009 p428
9

Source: Dept of Environment Heritage and Local Government 2009 Note: contributions from other authorities are indicated by the distance from the 45% line.
10

Reflecting changing policies toward local government and economic circumstances, there have been at least 16 reviews of local government finance since the 1960s.13 The two most recent reviews - Indecon (2005) and the Commission on Taxation (2009) – both recommended local funding of local services and specifically a property tax and the introduction of water charges. The 2009 OCED review of the Irish public services commented on how small the room for manoeuvre is for local governments given their lack of fiscal autonomy.
The Renewed Programme for Government 2009 includes a commitment to reform local government, and specifically finance, starting with the publication of a White Paper on Local Government Reform which is to be followed by an extensive consultation process. The central theme of the Green Paper, Stronger Local Democracy – Options for change (Department of Environment, Heritage and Local Government, 2008, 6) was that “local government can deliver more if it is equipped to do so”. The five guiding principles of the Green Paper (listed below) reflect the two reasons for local government - local democracy and local provider of public services:
Appreciation of the importance of local democratic institutions;
Decision-making at the lowest appropriate level (subsidiarity);
Democratic responsibility and accountability;
Proper balance between the number and functions of local
13 Dollard, Gerard ‘Local Government Finance: The Policy Context’ in Callanan & Keogan (2003)
government structures and the requirements of coherence, value for money and efficient delivery of service; and,
Future of local government finance in Ireland
Continued focus on quality customer service.
The Commission on Taxation (2009) was asked to examine various options for the future financing of local government in the context of the 2008 Green Paper. Its recommendations seek to change the balance between nationally provided and locally collected sources of income from the current 45:55 ratio to a ratio of 25:75. Taxation of property (domestic and commercial) was recommended as the key source of local government income. It envisaged an annual property tax, with rates set by local authorities, to be in place by the next local elections in 2014 and an extension of the commercial rates base to include additional types of buildings/structures. Other financing measures included water and waste charges, a new system of planning fees and a review of housing rents. The Commission rejected various other local taxation measures including: local income tax, poll taxes/community charges or local sales taxes because they would be inconsistent with national employment policies and increase the burden on labour income, or be inequitable and unacceptable to the public, or be inconsistent with harmonisation of VAT laws in EU. The Commission also rejected local bed taxes as a source of local government finance but suggested further examination in areas with tourism activity with the revenue used to enhance tourism facilities.
Although expenditure on local government was not within the remit of the Special Group on Public Service Numbers and Expenditure Programmes ( ‘McCarthy Report’ 2009), the Group did recommend that local government be self financing in the long term. It recommended that
11

exchequer support should be replaced with increased revenue generation from local sources and cost recovery for certain services for instance domestic water. The Group also recommended the rationalisation of the structures of local government by abolishing both regional authorities and town councils to provide a single local authority tier with a reduced number of local authorities (from 34 to 22). This would increase the average population under the remit of local authorities from approximately 39,000 to 200,000 and the average area covered from 612 km2 to 3173 km2 – both the largest figures for any EU country. Literature cited above indicates that this should increase efficiency. However this proposal is contrary to the Programmes for Government 2007 and 2009 which respectively envisaged additional town councils and increased powers for regional authorities.
Irish local government appears to be poorly funded in comparison to other EU countries and the average administrative size and geographic area are high by EU standards. However, local government in Ireland has fewer functions than other European counties. Amalgamating local authorities might increase efficiency but political theory suggests that it would be at some cost to local democracy.
Callanan, Mark & Keogan, Justin F (Eds.) (2003) Local government in Ireland. Inside out. Dublin IPA
Council of Europe (1985) European Charter on Local Self-Government. Strasbourg, Council of Europe. http://conventions.coe.int/Treaty/EN/Treaties/Html/122.htm
Council of European Municipalities and Regions (CEMR) website http://www.ccre.org/
Council of European Municipalities and Regions (2009) Balancing democracy, identity and efficiency. Changes in local and regional structures in Europe. Brussels, CCRE & CEMR
http://www.ccre.org/docs/changes_in_local_and_regional_structures_web_EN.pdf
Council of European Municipalities and Regions & Dexia (2009) EU sub-national Governments 2008 Figures. Brussels, CEMR http://www.ccre.org/docs/nuancier_2009_en.pdf
Commission on Taxation (2009) Report 2009,Dublin, Stationery Office. http://www.taxcommission.ie/downloads/Commission%20on%20Taxation%20Report%202009.pdf
Department of the Environment, Heritage and Local Government (2010) Local Authority Budgets 2009. Dublin, The Department.
Department of Environment, Heritage and Local Government (2008) Stronger Local Democracy – Options for change. Dublin, Stationery Office http://www.environ.ie/en/LocalGovernment/LocalGovernmentReform/PublicationsDocuments/FileDownLoad,17134,en.pdf
European Commission (2006) Structures of the taxation systems in the European Union http://ec.europa.eu/taxation_customs/resources/documents/taxation/gen_info/economic_analysis/tax_structures/Structures2006.pdf
Eurostat (2006) EDP dialogue visit to Ireland, 4-5 July 2006, Final Findings-http://epp.eurostat.ec.europa.eu/pls/portal/docs/PAGE/PGP_DS_GFS/PGE_DS_GFS_9/FINAL%20FINDINGS_EDP%20MISSION%20TO%20IRELAND_4-5%20JULY%2006.PDF Conclusion
Eurostat (2010a) Government Statistics http://epp.eurostat.ec.europa.eu/portal/page/portal/government_finance_statistics/data/main_tables
Eurostat (2010b) Eurostat 2010 epp.eurostat.ec.europa.eu/.../government_finance_statistics/.../GFSTRTE_SS-website_11-09.xls
Government of Ireland (2009) Renewed Programme for Government http://www.taoiseach.ie/eng/Publications/Publications_2009/Renewed_Programme_for_Government,_October_2009.pdf
Government of Ireland (2007) Programme for Government http://www.taoiseach.ie/attached_files/Pdf%20files/CommunityEnglish.pdf
Hendriks, F & Tops, P (1999), ‘Between democracy and efficiency: trends in local government reform in The Netherlands and Germany’ Public Administration, 77,1, 133-153.
References
OECD (2008) Toward an Integrated Public Services. Paris, OECD
Special Group on Public Service Numbers and Expenditure Programmes (2009) Report, Dublin, Stationery Office. http://www.finance.gov.ie/viewdoc.asp?fn=/documents/PressReleases/2009/bl100vol1fin.pdf
Weeks, Liam & Quinlivan, Aodh (2009) All politics is local. A guide to local elections in Ireland. Cork Collins Press
12