Embed Size (px)
Citation preview

FINANCING GRADUATE AND PROFESSIONAL EDUCATION:
How Students PaySandy Baum, Ph.D., and Patricia Steele, Ph.D.
January 2018
Financing Graduate and Professional Education: How Students Pay2
About the AuthorsSandy Baum, Ph.D., is a fellow in the Education Policy Program at the Urban Institute.
Patricia Steele, Ph.D., is founder and principal consultant of the research and evaluation firm Higher Ed Insight.
AcknowledgmentsThis brief was funded by AccessLex Institute. AccessLex is a nonprofit organization that fosters broad-based access to quality legal education for talented, purpose-driven students and works to maximize the value and affordability of a law degree through research, policy advocacy and student-focused initiatives.
Financing Graduate and Professional Education: How Students Pay 3
Thirteen percent of adults in the United States ages 25 and older hold advanced degrees—master’s, doctoral or professional degrees.1 The first brief in this series reported that bachelor’s degree recipients from low-income households are less likely than other graduates to pursue advanced degrees and are less likely than students from more affluent backgrounds to complete them. High tuition prices and living expenses may provide one explanation for these unequal outcomes.2
This brief examines how students finance their graduate and professional education. It summarizes the sources of funds used to cover the tuition and fees universities charge, as well as living expenses. Institutions set a “cost of attendance” (COA) for students, estimating the average budget for one academic year (fall through spring). COA includes tuition and fees, books and supplies, room and board, transportation, and other living expenses, and it establishes the maximum amount students can borrow in federal student loans to attend a particular school. These official budgets serve as the foundation for the discussion that follows about how graduate and professional degree students pay for their education.
It is critical to understand that COA is subjective. Since most graduate students do not live in campus housing, actual living expenses depend on local prices for food and housing, as well as the lifestyle choices students make. As the data below reveal, the budgets institutions set for graduate and professional students are frequently quite generous relative to budgets set for undergraduate students and living standards set by the federal government.
Many students use earnings from employment and federal loans to fund their graduate and professional education. But financing patterns differ a great deal across and within types of programs. This brief explores these patterns by describing average budgets for graduate and professional degree students and the funding sources used to cover these budgets.
1 U.S. Census Bureau, Current Population Survey (2017), Educational Attainment of the Population 18 Years and Over, by Age, Sex, Race, and Hispanic Origin, Table 1, https://www.census.gov/data/tables/2016/demo/education-attainment/cps-detailed-tables.html. 2 Sandy Baum and Patricia Steele (2017), The Price of Graduate and Professional School: How Much Students Pay. AccessLex Institute and Urban Institute, https://www.accesslex.org/the-price-of-graduate-and-professional-school.
Focusing on Full-Time Students
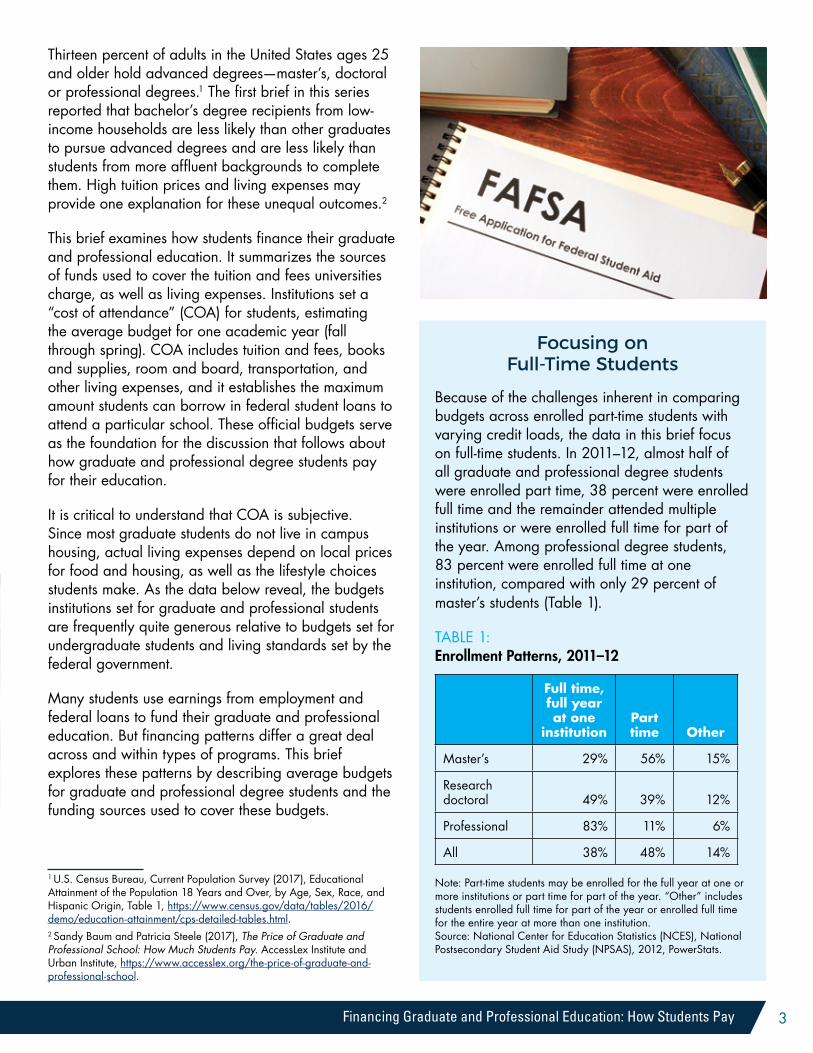
Because of the challenges inherent in comparing budgets across enrolled part-time students with varying credit loads, the data in this brief focus on full-time students. In 2011–12, almost half of all graduate and professional degree students were enrolled part time, 38 percent were enrolled full time and the remainder attended multiple institutions or were enrolled full time for part of the year. Among professional degree students, 83 percent were enrolled full time at one institution, compared with only 29 percent of master’s students (Table 1).
TABLE 1: Enrollment Patterns, 2011–12
Full time, full year at one
institutionPart time Other
Master’s 29% 56% 15%
Research doctoral 49% 39% 12%
Professional 83% 11% 6%
All 38% 48% 14%
Note: Part-time students may be enrolled for the full year at one or more institutions or part time for part of the year. “Other” includes students enrolled full time for part of the year or enrolled full time for the entire year at more than one institution.Source: National Center for Education Statistics (NCES), National Postsecondary Student Aid Study (NPSAS), 2012, PowerStats.

Financing Graduate and Professional Education: How Students Pay4
budget, or COA, is determined. Tuition and fees are required payments to universities, but other expenses, such as those for course materials and living expenses, vary across students. Most graduate and professional degree students do not pay room and board to their institutions. Instead, the financial aid office estimates graduate students’ costs for books and supplies and expenses for housing, food, transportation and other basic needs.
Average budgets set by universities for research doctoral degree students include higher living expenses than budgets for master’s degree students. Living expenses for professional degree students (those studying chiropractic medicine, dentistry, law, medicine, optometry, osteopathic medicine, pharmacy, podiatry and veterinary medicine) are even higher. In 2011–12, public universities budgeted an average of almost $20,000 for books and other course materials and living expenses for master’s degree students, just over $27,000 for research doctoral degree students and about $29,000 for professional degree students (Table 2).4 Private nonprofit institutions had larger student budgets, with research doctoral students receiving slightly higher cost-of-living allowances than professional degree students.
4 In some cases, the median price is significantly lower than the averages reported in Table 2. For example, at public universities, mean tuition and fees were $13,510 for research doctoral programs and $15,510 for professional degree programs in 2011–12. But the published prices for the median students in these programs were $10,850 and $12,310, respectively. This occurs when a fraction of students are in programs charging much more than average. In contrast, in the private nonprofit sector, median prices were similar to the means cited: $29,580 versus $28,490 for research doctoral programs and $26,390 versus $27,550 for professional degree programs (NCES, NPSAS 2012, PowerStats).
Student Budgets
Published tuition and fees for graduate and professional study vary considerably across and within sectors and fields. Average 2011–12 tuition and fee prices ranged from $11,120 for master’s degree programs at public universities to $28,490 for research doctoral programs at private nonprofit universities (Table 2).
But analyzing how graduate and professional students cover their expenses involves much more than knowing tuition and fee charges. The funding picture is complicated by the lack of precision in how a student’s
The average nontuition expense component of student budgets exceeds the average tuition and fees for graduate and professional students in all sectors. Setting appropriate living expenses for students is subjective. Budgets can be based on prior year figures, local housing costs, programmatic costs, surveys of students or simply educated guesses by university staff.3
3 See Federal Student Aid Handbook, Chapter 2 for discussion of estimating cost of attendance, https://ifap.ed.gov/sfahandbooks/attachments/0809FSAHbkVol3Ch2Oct14.pdf.
TABLE 2: Average Annual Budgets for Graduate and Professional Degree Students: Institutional Estimates of Housing, Food, Transportation, Books and Supplies, and Other Expenses, 2011–12
Nontuition expense budget Tuition and fees
Master’sResearch doctoral Professional Master’s
Research doctoral Professional
Public $19,690 $27,360 $29,140 $11,120 $13,510 $15,510
Private nonprofit $21,940 $31,270 $31,040 $20,570 $28,490 $27,470
For-profit $15,890 $26,180 NA $13,730 $14,830 N/A
Note: Nontuition expense budgets include allowances for books and supplies, which average about $1,300 for master’s and doctoral students and $1,700 for professional degree students.Source: NCES, NPSAS 2012, PowerStats.

Financing Graduate and Professional Education: How Students Pay 5
For reference, in the same year, the average nontuition expense budget for full-time undergraduate students was $13,700, with prices ranging from $13,510 for dependent students to $14,150 for married independent students with no dependents.5 Moreover, the federal poverty level in 2011 was $10,890 for single people, $14,710 for two-person households and $22,350 for four-person households. Nontuition expense budgets assume undergraduates will maintain minimal standards of living but are set higher for graduate students, presumably to accommodate a wider range of circumstances, such as supporting families and other lifestyle choices.
5 NCES, NPSAS 2012, PowerStats.
Piecing Together the FundsThe most straightforward picture of advanced degree student funding emerges from looking at the average full-time, full-year budgets of master’s, research doctoral and professional degree students, and describing the resources they use to meet their expenses.
Full-time master’s degree students in all sectors and research doctoral students enrolled at for-profit institutions cover most of their tuition and living expenses with a combination of federal student loans and earnings while enrolled. Professional degree students rely more heavily on loans, while research doctoral students at public and private nonprofit universities are more likely to receive institutional grants and assistantships.
FIGURE 1: Average Annual Budgets and Funding Sources, Full-Time Master’s Degree Students, 2011–12
Source: NCES, NPSAS 2012, PowerStats.
Private nonprofit (40% enrolled)
$3,130$4,230
$19,150
$1,120
$14,880
$42,510
$20,570
$21,940
$42,510
For-profit (16% enrolled)
$180$340
$12,830
$40
$16,230
$29,620
$13,730
$15,890
$29,620
Public (44% enrolled)
$2,300 $850
$11,590
$2,830
$12,810
$430
$30,810
$11,120
$19,690
$30,810
$10,000
$20,000
$30,000
$40,000
$50,000
Federal loans
Assistantships
Institutional grants
Earned income
Other grants
Other resources
Tuition and fees
Nontuition budget
Funding sources Budget components
Master’s Degree StudentsFor master’s degree students in all sectors, federal loans and earned income cover most expenses (Figure 1). In 2011–12, full-time master’s degree students took federal loans to cover amounts ranging from 38 percent of the $30,810 average annual budget at public universities to 45 percent of the
Financing Graduate and Professional Education: How Students Pay6
Private nonprofit (39% enrolled)
$14,570
$2,810$6,170
$11,900
$12,430
$11,880
$59,760
$28,490
$31,270
$59,760
Public (53% enrolled)
$5,410$1,650
$5,320
$13,080
$6,040
$9,370
$40,870
$13,510
$27,360
$40,870
For-proft (8% enrolled)$660$400
$19,590
$20,360
$41,010
$14,830
$26,180
$41,010
$10,000
$20,000
$30,000
$40,000
$50,000
$60,000
$70,000
Federal loans
Assistantships
Institutional grants
Earned income
Other grants
Other resources
Tuition and fees
Nontuition budget
Funding sources Budget components
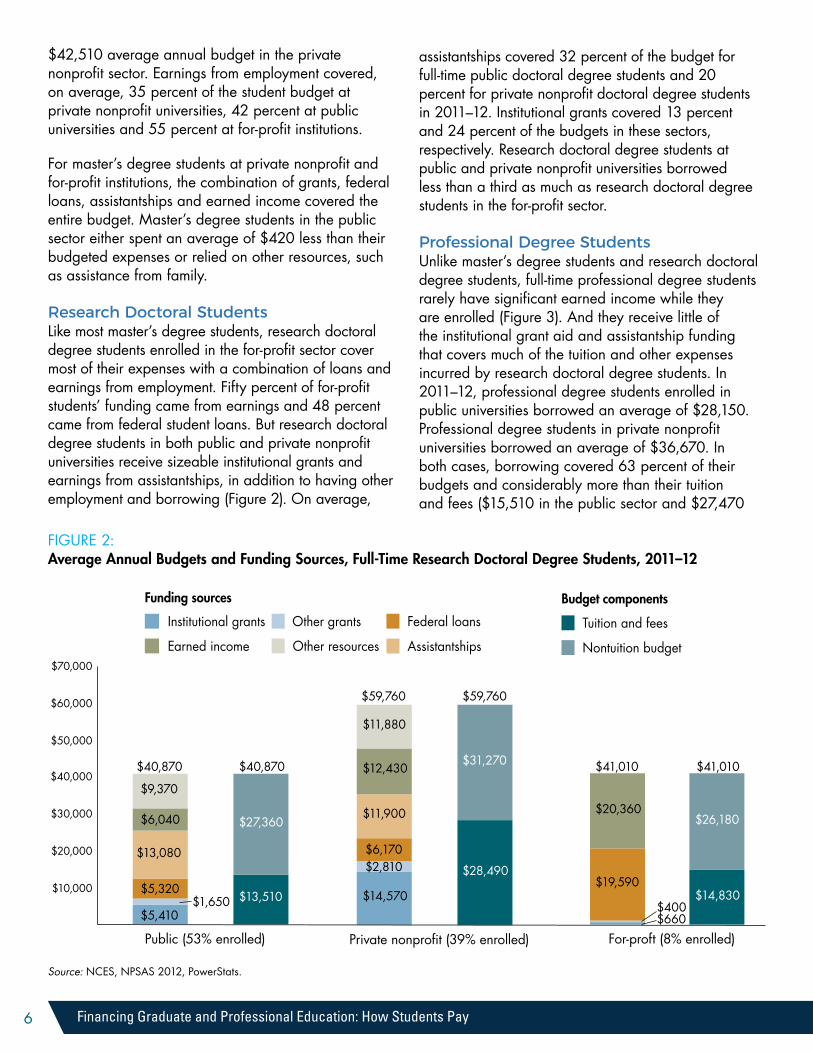
FIGURE 2: Average Annual Budgets and Funding Sources, Full-Time Research Doctoral Degree Students, 2011–12
Source: NCES, NPSAS 2012, PowerStats.
$42,510 average annual budget in the private nonprofit sector. Earnings from employment covered, on average, 35 percent of the student budget at private nonprofit universities, 42 percent at public universities and 55 percent at for-profit institutions.
For master’s degree students at private nonprofit and for-profit institutions, the combination of grants, federal loans, assistantships and earned income covered the entire budget. Master’s degree students in the public sector either spent an average of $420 less than their budgeted expenses or relied on other resources, such as assistance from family.
Research Doctoral StudentsLike most master’s degree students, research doctoral degree students enrolled in the for-profit sector cover most of their expenses with a combination of loans and earnings from employment. Fifty percent of for-profit students’ funding came from earnings and 48 percent came from federal student loans. But research doctoral degree students in both public and private nonprofit universities receive sizeable institutional grants and earnings from assistantships, in addition to having other employment and borrowing (Figure 2). On average,
assistantships covered 32 percent of the budget for full-time public doctoral degree students and 20 percent for private nonprofit doctoral degree students in 2011–12. Institutional grants covered 13 percent and 24 percent of the budgets in these sectors, respectively. Research doctoral degree students at public and private nonprofit universities borrowed less than a third as much as research doctoral degree students in the for-profit sector.
Professional Degree StudentsUnlike master’s degree students and research doctoral degree students, full-time professional degree students rarely have significant earned income while they are enrolled (Figure 3). And they receive little of the institutional grant aid and assistantship funding that covers much of the tuition and other expenses incurred by research doctoral degree students. In 2011–12, professional degree students enrolled in public universities borrowed an average of $28,150. Professional degree students in private nonprofit universities borrowed an average of $36,670. In both cases, borrowing covered 63 percent of their budgets and considerably more than their tuition and fees ($15,510 in the public sector and $27,470

Financing Graduate and Professional Education: How Students Pay 7
FIGURE 3: Average Annual Budgets and Funding Sources, Full-Time Professional Degree Students, 2011–12
Note: One percent of full-time professional degree students were enrolled in for-profit institutions.Source: NCES, NPSAS 2012, PowerStats.
Public (39% enrolled) Private nonprofit (60% enrolled)$2,400
$980
$28,150
$240$3,840
$9,040
$44,650
$15,510
$29,140
$44,650
$3,660 $990
$36,670
$310$5,060
$11,820
$58,510
$27,470
$31,040
$58,510
$10,000
$20,000
$30,000
$40,000
$50,000
$60,000
Federal loans
Assistantships
Institutional grants
Earned income
Other grants
Other resources
Tuition and fees
Nontuition budget
Funding sources Budget components
in the private nonprofit sector). This indicates that professional degree students borrow to cover a significant amount of their living expenses while they work toward their degrees. Even so, given the living expense levels incorporated into expenses in the official COA, they need funding from other sources if they expect to live at the standard allowed in these budgets. Average nontuition expenses allowed were $29,140 and $31,040 in the public sector and private nonprofit sector, respectively (Table 2).
Net PricesThe published tuition and fees cited for graduate and professional programs can be misleading for many students because of grants, tuition waivers and fellowships that reduce the prices charged to students—the net institutional price.
Although the median published tuition and fee price for full-time research doctoral degree students in 2011–12 was about $15,000, 36 percent of these students paid no tuition and fees, and half the students in these programs paid a net price of less than $5,000
after grant aid from all sources. Grant aid for master’s and professional degree students is less generous, but 15 percent of full-time master’s and 22 percent of full-time professional degree students paid a net price of less than $5,000 in tuition and fees. At the other end of the spectrum, published tuition and fees exceeded $40,000 for 16 percent of full-time professional degree students. However, grant aid reduced the net price below this level for all but 10 percent of professional degree students (Figure 4).
Research doctoral degree students receive more institutional grant aid, more assistance from employers and more earnings from university assistantships than master’s and professional degree students. For one-third of full-time research doctoral degree students, tuition and fees are entirely covered by these funding sources.

Financing Graduate and Professional Education: How Students Pay8
Comparing Funding Sources
Institutional Grant AidAbout one-third of graduate and professional degree students received institutional grant aid from tuition waivers or fellowships in 2011–12 (Table 3). Institutional grants are most common among research doctoral degree students; 57 percent received institutional aid in 2011–12, with 23 percent receiving more than $20,000. In contrast, only 27 percent of master’s degree students received institutional aid, and most of those who did received less than $10,000. Professional degree students received the smallest amount of institutional grant aid, with only 11 percent
Students in master’s degree programs are more likely than others to have outside employment and significant earnings. Professional degree students borrow at higher rates and accumulate larger amounts of debt than other graduate students.
receiving institutional grant aid totaling more than $10,000 in 2011–12.
The average institutional discount rate for full-time research doctoral degree students in 2011–12 was 44 percent—the institutional grant aid awarded to these students was 44 percent of the gross tuition and fees charged. In contrast, the discount rates for master’s and professional degree students were 15 percent and 14 percent, respectively. For-profit institutions rarely offer this aid, but the discount rate for research doctoral degree students was 40 percent at public universities and 51 percent at private nonprofit universities.6 In sum, research doctoral degree students pay lower net tuition prices than either master’s or professional degree students.
Other Grant Aid, 2011–12Graduate and professional degree students receive almost no state or federal grant aid, but in 2011–12, 14 percent of full-time graduate and professional degree students received tuition assistance from employers (Table 4). Employer tuition assistance is most prevalent among research doctoral degree students, of whom 20 percent benefited from this funding source.
6 NCES, NPSAS 2012, PowerStats.
FIGURE 4: Distribution of Published Tuition and Fees and Net Prices for Full-Time Graduate and Professional Students, 2011–12
0% 10% 20% 30% 40% 50% 60% 70% 80% 90% 100%
Professional 8% 26% 26% 19% 12% 10%
Master’s 36% 41% 12% 8% 3%
Professional 21% 30% 19% 14% 16%
Research doctoral 24% 36% 20% 13% 6%
Net
tu
ition
and
fees
Tuiti
on a
nd fe
es
Research doctoral 36% 26% 24% 9% 4%1%
Master’s 7% 41% 35% 10% 5%
1%
$0 $1–$10,000 $10,001–$20,000 $20,001–$30,000 $30,001–$40,000 More than $40,000
Source: NCES, NPSAS 2012, PowerStats.

Financing Graduate and Professional Education: How Students Pay 9
Five percent of research doctoral degree students received employer assistance totaling more than $20,000. In contrast, only 5 percent of professional degree students received any employer assistance at all to finance their education.
Earned IncomeEmployers provide assistance with tuition payments for 14 percent of full-time advanced degree students (Table 4). But many more students work while pursuing advanced degrees, using their earnings to help cover tuition and living expenses. Fifty-three percent of full-time graduate and professional degree students had earned income other than assistantships or federal work-study in 2011–12. Master’s degree students were more likely than research doctoral or professional degree students to be employed. Thirty-one percent of full-time master’s degree students earned more than $20,000 during the academic year (Figure 5), whereas two-thirds of full-time professional and research doctoral degree students reported no earnings from outside employment in 2011–12.
The contrast between the earnings of full-time and part-time students provides important insight into how students fund their education. Most master’s degree students do not enroll full time for the full year. Twenty-eight percent of part-time research doctoral degree students, 21 percent of part-time master’s degree students and 17 percent of part-time professional degree students earned $50,000 or more during the 2011–12 year. Thirty percent of part-time professional degree students reported no earnings while they were enrolled (Figure 5).
AssistantshipsSome graduate students have the opportunity to teach or serve as research assistants at their universities while they are pursuing their degrees. These assistantships replace outside employment for many students. Unlike fellowships, grants and tuition waivers, they do not reduce the tuition prices students pay. For-profit institutions do not generally provide this opportunity,
TABLE 3: Distribution of Average Annual Institutional Grant Aid for Full-Time Graduate and Professional Students, 2011–12
No aid$1–
$10,000$10,001–$20,000
More than
$20,000
All 68% 20% 6% 6%
Master’s 73% 19% 5% 3%
Research doctoral 43% 24% 10% 23%
Professional 68% 20% 7% 4%
Note: Components may not sum to 100 percent because of rounding.Source: NCES, NPSAS 2012, PowerStats.
TABLE 4: Distribution of Average Annual Employer Grant Aid for Full-Time Graduate and Professional Students, 2011–12
No aid $1–
$10,000$10,001–$20,000
More than
$20,000
All 86% 12% 1% 1%
Master’s 85% 13% 1% 1%
Research doctoral 80% 12% 4% 5%
Professional 95% 4% 1% 1%
Note: Components may not sum to 100 percent because of rounding.Source: NCES, NPSAS 2012, PowerStats.
and very few students in professional degree programs in any sector have assistantships. But more than half of full-time research doctoral degree students had assistantships in 2011–12, with earnings averaging more than $20,000. These earnings covered a significant portion of living expenses for the average recipient (Table 5).
Loan FinancingFederal loans tell almost the whole story of graduate student borrowing because the Grad PLUS program allows graduate and professional degree students to borrow up to the COA less other aid received. (See box on page 15 for more information on loans available for graduate and professional study.) Only 6 percent of graduate and professional degree students

Financing Graduate and Professional Education: How Students Pay10
FIGURE 5: Distribution of Average Annual Earnings From Employment for Full-Time and Part-Time Graduate and Professional Degree Students, 2011–12
0% 10% 20% 30% 40% 50% 60% 70% 80% 90% 100%
15% 15% 12% 13% 13% 11% 21%
25% 9% 9% 7% 10% 11% 28%
30% 19% 12% 10% 7% 6% 17%
37% 23% 9% 8% 7% 7% 9%
63% 14% 5% 4% 3%3% 8%
64% 24% 4% 3%
2% 2% 1%
Professional
Master’s
Professional
Research doctoral
Part-
time
Full-
time
Research doctoral
Master’s
No earnings $1–$10,000 $10,001–$20,000 $20,001–$30,000
$30,001–$40,000 $40,001–$50,000 More than $50,000
Source: NCES, NPSAS 2012, PowerStats.
TABLE 5: Assistantships: Average Annual Earnings From Teaching and Research for Full-Time Graduate and Professional Students, 2011–12
Percentage receiving assistantships Average earnings per recipient
Master’sResearch doctoral Professional Master’s
Research doctoral Professional
All 15% 57% 3% $11,367 $20,282 $8,895
Public 24% 70% 4% $11,931 $18,683 $6,856
Private nonprofit 11% 51% 3% $10,194 $23,281 $10,539
For-profit N/A N/A N/A N/A N/A N/A
Source: NCES, NPSAS 2012, PowerStats.

Financing Graduate and Professional Education: How Students Pay 11
relied on private loans in 2011–12, and less than 2 percent borrowed more than $10,000 from private lenders.
Advanced degree students rely heavily on federal student loans (Figure 6). Sixty-nine percent of all graduate and professional degree students borrowed in 2011–12, including 86 percent of professional degree students and 70 percent of master’s degree students. In contrast, only 35 percent of research doctoral degree students borrowed that year. Professional degree students tend to borrow larger amounts—22 percent of professional degree students borrowed more than $50,000 in 2011–12, compared with just 4 percent of master’s degree and 1 percent of research doctoral degree students.
Other ResourcesTo fully understand how graduate and professional students meet their expenses while they are in school, it is important to note other forms of federal assistance some use to help meet their living expenses. Eight percent of advanced degree students received federal benefits such as the Supplemental Nutrition Assistance Program (formerly known as Food Stamps) or Temporary Assistance for Needy Families in 2011–12. These benefits are more common among master’s degree students than among other graduate and professional degree students.
Additionally, 3 percent of full-time master’s and research doctoral degree students and 6 percent of professional degree students received federal work-study funding in 2011–12. Nearly all earned less than $4,000 from their work-study jobs.
Differences by Gender, Race/Ethnicity and Undergraduate Pell StatusLimits on available data make it difficult to gain much insight into how graduate and professional school financing differs across student demographics. It is possible, however, to gain some perspective on borrowing and earnings from employment among master’s degree students.7
Because of the differences across sectors discussed above, it is important to look separately at students enrolled in public, private nonprofit and for-profit institutions. In 2011–12, 44 percent of full-time master’s degree students attended public universities, 40 percent were enrolled in the private nonprofit sector and 16 percent were at for-profit institutions. But enrollment patterns across sectors vary by gender, race/ethnicity and whether students received Pell grants as undergraduates—an indicator of growing up in a low-income family. In particular, women, black students and Pell recipients are overrepresented in the for-profit sector (Table 6).
7 Sample sizes are too small to allow meaningful analysis for subgroups for research doctoral and professional degree students.
0% 10% 20% 30% 40% 50% 60% 70% 80% 90% 100%
All 31% 10% 16% 20% 8% 7% 8%
Master’s 30% 11% 23% 24% 5% 3% 4%
Professional 14% 6% 6% 16% 17% 19% 22%
Research doctoral 65% 10% 10% 10%
2%2%1%
No loans $1–$10,000 $10,001–$20,000 $20,001–$30,000
$30,001–$40,000 $40,001–$50,000 More than $50,000
FIGURE 6: Distribution of Average Annual Federal Loans for Full-Time Graduate and Professional Degree Students, 2011–12
Source: NCES, NPSAS 2012, PowerStats.

Financing Graduate and Professional Education: How Students Pay12
TABLE 6: Enrollment Distribution Across Sectors: Master’s Degree Students, 2011–12
TotalPublic (44%)
Private nonprofit
(40%)
For-profit (16%)
Male 38% 40% 39% 29%
Female 62% 60% 61% 71%
White 66% 69% 70% 46%
Black 13% 10% 11% 27%
Hispanic 10% 10% 9% N/A
No Pell 61% 63% 67% 44%
Pell 39% 37% 33% 56%
Note: Sample size is too small to estimate Hispanic students as a share of for-profit enrollment. Students identified as Asian or Other are not included because of small sample sizes.Source: NCES, NPSAS 2012, PowerStats.
FIGURE 7: Average Annual Borrowing and Earnings From Employment, Full-Time Master’s Degree Students by Gender, 2011–12
Total loans Earnings Total loans Earnings Total loans Earnings
$5,000
$15,000
$25,000
$35,000
$13,500$13,000 $12,200
$13,200
$20,600 $21,000$17,900 $16,700
$10,100
$15,100
$31,500 $29,700
Public (44% enrolled) Private nonprofit (40% enrolled) For-profit (16% enrolled)
Male Female
Source: NCES, NPSAS 2012, PowerStats.
Average annual borrowing differed by only $500 between full-time male and female master’s degree students in both the public and private nonprofit sectors in 2011–12. However, women who were enrolled in for-profit master’s degree programs borrowed an average of $15,100 compared with $10,100 for men (Figure 7).
Both men and women in the for-profit sector had higher earnings than full-time master’s degree students enrolled in other sectors. Men in the for-profit sector borrowed less than other men, but women borrowed more, on average, than those attending public universities.
Black students in public university master’s degree programs borrowed more, on average, than other students in 2011–12, but the pattern was not the same in private nonprofit and for-profit institutions (Figure 8). All groups borrowed more at private nonprofit universities than at other types of institutions.
Full-time master’s degree students at public and private nonprofit universities who received Pell grants as undergraduates had higher average earned income than non–Pell recipients in 2011–12, but the reverse was true among the 16 percent of master’s degree students attending for-profit institutions. Twenty-three percent of full-time master’s degree recipients who were Pell grant recipients were pursuing their graduate studies at for-profit institutions compared with just 11 percent of non–Pell recipients. The relatively high average earnings of $41,400 per non–Pell recipient suggests that these may be full-time workers who find it convenient to enroll at for-profit institutions to earn the credentials needed to advance in their careers.

Financing Graduate and Professional Education: How Students Pay 13
FIGURE 8: Average Annual Borrowing and Earnings From Employment, Full-Time Master’s Degree Students by Race and Ethnicity, 2011–12
Source: NCES, NPSAS 2012, PowerStats.
Priv
ate
nonp
rofit
(40%
)Fo
r-pro
fit (1
6%)
Publ
ic (4
4%)
White Black Hispanic Asian
$5,000 $10,000 $15,000 $20,000 $25,000 $30,000 $35,000
Earnings
$28,900$13,300
$20,000$17,400
Total loans
$23,200
$25,200$24,200
$19,700
Total loans $12,600$14,100
N/AN/A
Earnings $24,100$28,900
N/AN/A
Earnings$13,600
$16,700$12,600
N/A
Total loans
$11,200$11,200
$13,000$18,100
Pell recipients borrowed more in all sectors, but the difference was just $600 at private nonprofit universities, where average loans were larger for both groups than in the other two sectors (Figure 9).
ConclusionThe data in this brief highlight the wide range of funding patterns for students enrolled in different types of programs and institutions. Master’s degree students
in all sectors and all advanced degree students attending for-profit institutions tend to pay for their own education. They are employed while they are enrolled and take advantage of federal student loan programs, which enable them to borrow up to the full COA less financial aid received.
Many students in research doctoral programs at public and private nonprofit universities are subsidized through institutional grants and fellowships and

Financing Graduate and Professional Education: How Students Pay14
FIGURE 9: Average Annual Borrowing and Earnings From Employment, Full-Time Master’s Degree Students by Undergraduate Pell Status, 2011–12
Source: NCES, NPSAS 2012, PowerStats.
No Pell Pell
$5,000 $10,000 $15,000 $20,000 $25,000 $30,000 $35,000 $40,000 $45,000
For-p
rofit
(16%
)
Earnings
Total loans
$21,400$41,400
$16,700$9,600
Priv
ate
nonp
rofit
(40%
)
Earnings
Total loans
$19,400$16,000
$21,200$20,600
Publ
ic(4
4%)
Earnings
Total loans
$15,300$11,400
$15,700$11,800
generate earnings through research and teaching assistantships on campus.
Professional degree students rely heavily on borrowing. On average, they borrow more than enough to cover their tuition and fees. Most are not employed while they are enrolled and use loans to help cover their living expenses.
In addition to tuition and fees, students must buy books and supplies and pay for housing, food and other expenses. Institutions’ financial aid offices provide a COA for each student that accounts for the full academic year, but the cost-of-living allowances are high for graduate and professional degree students. Some may include unusual expenses, such as travel for interviews. However, the standard of living
incorporated into the estimates is highly subjective and might raise questions about whether institutions provide reasonable estimates of the funds students really need to make ends meet. As a result, it is difficult to know exactly how much students actually spend and how much discretion they have over their spending.
Some graduate and professional degree students borrow large sums while they are pursuing their degrees. For many, expected earnings will be high enough to repay this debt without significant strain on their personal budgets. But the variation across programs, institutions and individual circumstances means that some of this debt is likely to be a burden for borrowers, taxpayers or both. The next brief in this series will delve further into graduate and professional degree student debt.

Financing Graduate and Professional Education: How Students Pay 15
About AccessLex InstituteAccessLex Institute®, in partnership with its nearly 200 nonprofit and state-affiliated ABA-approved Member law schools, has been committed to improving access to legal education and to maximizing the affordability and value of a law degree since 1983. The AccessLex Center for Legal Education Excellence® advocates for policies that make legal education work better for students and society alike, and conducts research on the most critical issues facing legal education today. The AccessLex Center for Education
and Financial Capability® offers on-campus and online financial education programming and resources to help students confidently manage their finances on their way to achieving personal and professional success. AccessLex Institute is a nonprofit organization with offices in West Chester, Pennsylvania, and Washington, D.C. and field offices throughout the U.S.
About the Urban InstituteThe nonprofit Urban Institute is dedicated to elevating debate on social and economic policy. For nearly five decades, Urban scholars have conducted research and offered evidence-based solutions that improve lives and strengthen communities across a rapidly urbanizing world. Their objective research helps expand opportunities for all, reduce hardship among the most vulnerable, and strengthen the effectiveness of the public sector.
Federal Loans for Graduate StudentsGraduate and professional students are eligible for two types of federal student loans: Direct Unsubsidized Loans and Direct PLUS Loans. Both loans are available through the William D. Ford Federal Direct Loan Program.
The program also provides Direct Subsidized Loans—on which the government pays the interest while the student is in school—only to undergraduates with documented financial need. But all undergraduate, graduate and professional degree students are eligible for Direct Unsubsidized Loans, on which interest accrues from the time the loans are disbursed. Graduate and professional degree students pay a 6 percent interest rate plus applicable fees on loans made for the 2017–18 academic year, and can borrow up to $20,500 a year under this program. The total amount a student can borrow in Direct Subsidized Loans and Direct Unsubsidized Loans for undergraduate and graduate education combined is $138,500.
Graduate and professional degree students can also borrow the Direct PLUS Loan. For the 2017–18 academic year, borrowers pay 7 percent interest plus applicable fees. Students can borrow up to the full COA, less other aid received, for as many years as they are enrolled.
All federal student loans are eligible for income-driven repayment plans. Monthly payments are limited to 10 or 15 percent of discretionary income beyond 150 percent of the federal poverty level. Unpaid balances are forgiven after 20 or 25 years of payments.1
1 Multiple federal loan repayment programs base monthly payments on borrowers’ earnings. Each has its own provisions. For example, the Income-Based Repayment plan caps borrowers’ monthly payments at 10 or 15 percent of their discretionary income depending on when they borrowed. Any remaining loan balance is forgiven after 20 or 25 years of qualifying payments. The Revised Pay As You Earn plan caps borrowers’ monthly payments at 10 percent of their discretionary income. Any remaining loan balance is forgiven after 20 years of qualifying payments for undergraduate students or after 25 years of qualifying payments for graduate students (U.S. Department of Education, Federal Student Aid. (2017), Repayment Plans, https://studentaid.ed.gov/sa/repay-loans/understand/plans/income-driven).

2100 M Street NWWashington, DC 20037
www.urban.org
© 2018 AccessLex Institute and Urban Institute. All rights reserved. (1/18)
Corporate Office:10 North High Street, Suite 400West Chester, PA 19380
Washington, D.C., Office:440 First Street NW, Suite 550Washington, DC 20001
AccessLex.org