Embed Size (px)
Citation preview
Financing Entrepreneurial Ventures
William D. BygraveBabson College
GEM2004 ConferenceLondon Business School
January 20, 2005
Copyright © 2005 Babson College & London Business School
Sources of startup financing
• Entrepreneurs themselves
• Informal investors
• Venture capitalists

Prevalence Rate of Informal Investors, Adults 18-99 years old
0.00
5.00
10.00
15.00
20.00
25.00Br
azil
Cro
atia
Japa
nPo
rtuga
lN
ethe
rland
sU
KBe
lgiu
mFr
ance
Pola
ndH
unga
rySl
oven
iaSw
eden
Gre
ece
Italy
Sing
apor
eSp
ain
Hon
g Ko
ngIre
land
Isra
elAu
stra
liaD
enm
ark
Arge
ntin
aFi
nlan
dC
anad
aG
erm
any
Sout
h Af
rica
Nor
way
USA
New
Zea
land
Icel
and
Ecua
dor
Peru
Uga
nda
Jord
an
Pre
vale
nce
rate
, pe
rcen
t of
adu
lts
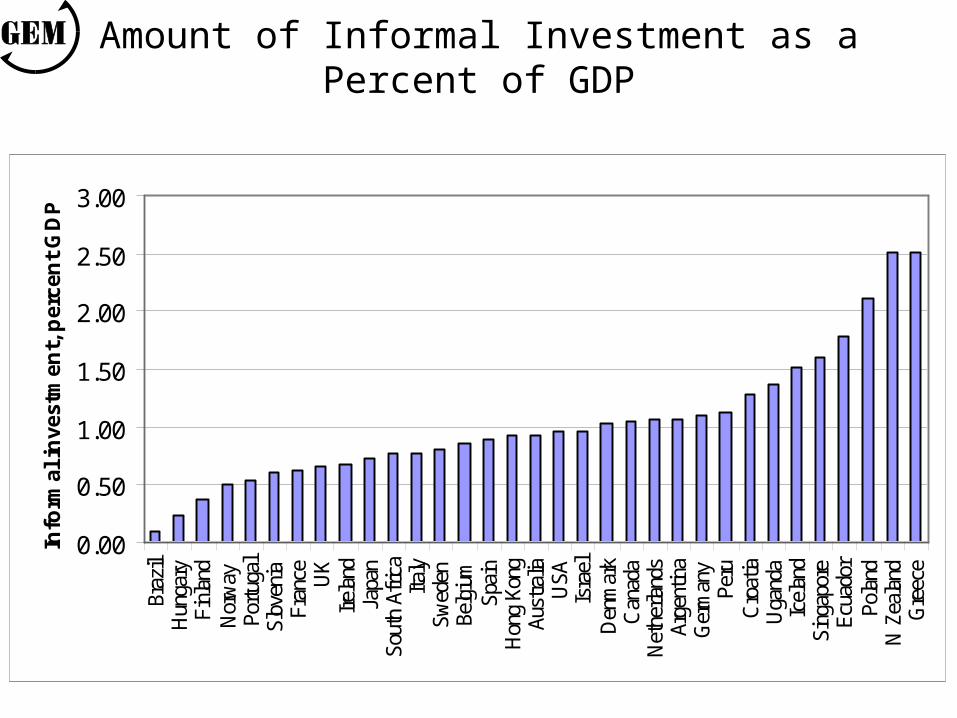
Amount of Informal Investment as a Percent of GDP
0.00
0.50
1.00
1.50
2.00
2.50
3.00
Braz
ilH
unga
ryFi
nlan
dN
orw
ayPo
rtuga
lSl
oven
iaFr
ance UK
Irela
ndJa
pan
Sout
h Af
rica
Italy
Swed
enBe
lgiu
mSp
ain
Hon
g Ko
ngAu
stra
liaU
SAIs
rael
Den
mar
kC
anad
aN
ethe
rland
sAr
gent
ina
Ger
man
yPe
ruC
roat
iaU
gand
aIc
elan
dSi
ngap
ore
Ecua
dor
Pola
ndN
Zea
land
Gre
ece
Info
rmal
inve
stm
ent,
per
cen
t G
DP

Annual Amount per Informal Investor vs GDP per Capita, US$
y = 0.3558x1.0234
R2 = 0.7785
0
5,000
10,000
15,000
20,000
25,000
30,000
35,000
0 10,000 20,000 30,000 40,000 50,000 60,000GDP per Capita, US$
An
nu
al a
mo
un
t p
er i
nfo
rmal
in
vest
or,
US
$
NO
USA
DK
IE
JPNL
IS
SE
UK
BE
FI
FRDE
CA
IT
AU
HK
NZ
SG
GR
ILPT ES
SI
HR
PL
HU
JO
SAAR
BRPEUG
EC
R2 is the proportion of the variation that is explained by the trend line. An R2 of .7785 indicates that 77.85% of the variation in annual amount per informal investor is explained by GDP per capita.
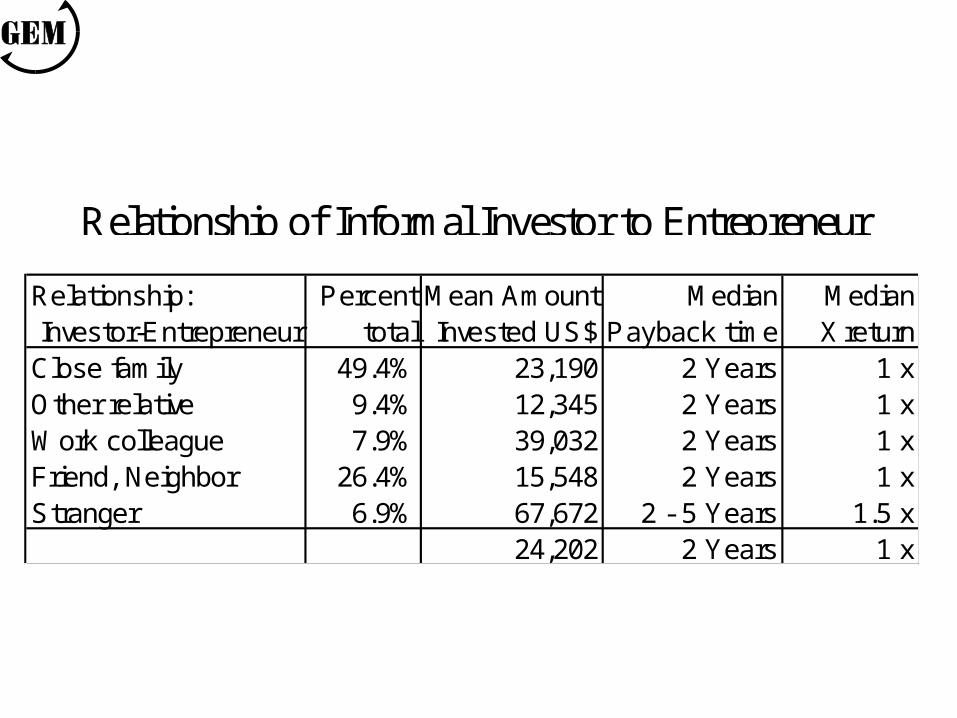
Relationship: Percent Mean Amount Median MedianInvestor-Entrepreneur total Invested US$ Payback time X return
Close family 49.4% 23,190 2 Years 1 xOther relative 9.4% 12,345 2 Years 1 xWork colleague 7.9% 39,032 2 Years 1 xFriend, Neighbor 26.4% 15,548 2 Years 1 xStranger 6.9% 67,672 2 - 5 Years 1.5 x
24,202 2 Years 1 x
Relationship of Informal Investor to Entrepreneur

Self-Funding by Entrepreneurs
• Entrepreneurs themselves provide 65.8% of the capital for their new ventures.
• Total capital needed to start a new venture is $53,673.
• Entrepreneurs provide $35,317.
• External informal investors provide $18,356.

Expected IRR forInformal Investors
0%
10%
20%
30%
40%
50%
60%
≤0% 0 - 10% 10 - 20% 20 - 40% 40 - 100% ≥100%
Expected IRR
Per
cen
t o
f E
ntr
epre
neu
rs &
Info
rmal
Inve
sto
rs
Entrepreneurs
Informal Investors

Expected IRR for Entrepreneurs
0%
10%
20%
30%
40%
50%
60%
≤0% 0 - 10% 10 - 20% 20 - 40% 40 - 100% ≥100%
Expected IRR
Per
cen
t o
f E
ntr
epre
neu
rs &
Info
rmal
Inve
sto
rs
Entrepreneurs
Informal Investors

Expected IRR for Entrepreneurs &Informal Investors
0%
10%
20%
30%
40%
50%
60%
≤0% 0 - 10% 10 - 20% 20 - 40% 40 - 100% ≥100%
Expected IRR
Per
cen
t o
f E
ntr
epre
neu
rs &
Info
rmal
Inve
sto
rs
Entrepreneurs
Informal Investors

Startup Funding per Company vs GDP per Capita
y = 5.1083x0.9644
R2 = 0.8571
0
50,000
100,000
150,000
200,000
250,000
0 10,000 20,000 30,000 40,000 50,000 60,000
GDP per Capita, US$
Sta
rtu
p f
un
din
g/c
om
pan
y, U
S$
NO
DK
IE
USA
SE
NL
IT
FRDE
UKBE
AU
CA
SGES
NZGR
ILHUPL
SAARBRPE
ECUG
R2 is the proportion of the variation that is explained by the trend line. An R2 of 0.8571 indicates that 85.71% of the variation in startup funding is explained by GDP per capita.
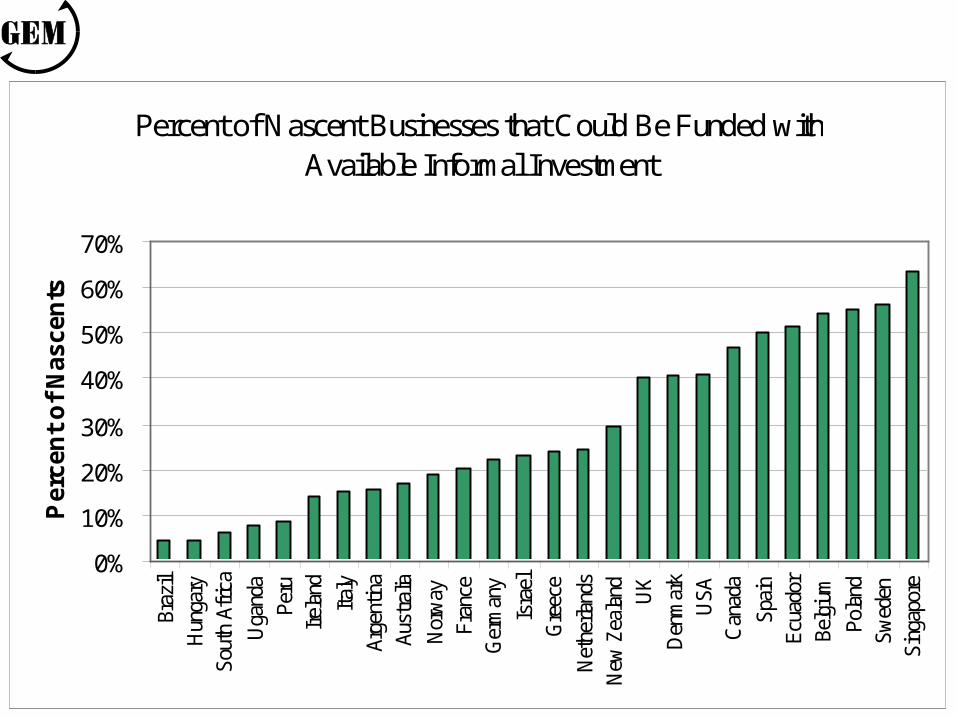
Percent of Nascent Businesses that Could Be Funded with Available Informal Investment
0%
10%
20%
30%
40%
50%
60%
70%
Braz
ilH
unga
rySo
uth
Afric
aU
gand
aPe
ruIre
land
Italy
Arge
ntin
aAu
stra
liaN
orw
ayFr
ance
Ger
man
yIs
rael
Gre
ece
Net
herla
nds
New
Zea
land UK
Den
mar
kU
SAC
anad
aSp
ain
Ecua
dor
Belg
ium
Pola
ndSw
eden
Sing
apor
e
Per
cen
t o
f N
asce
nts
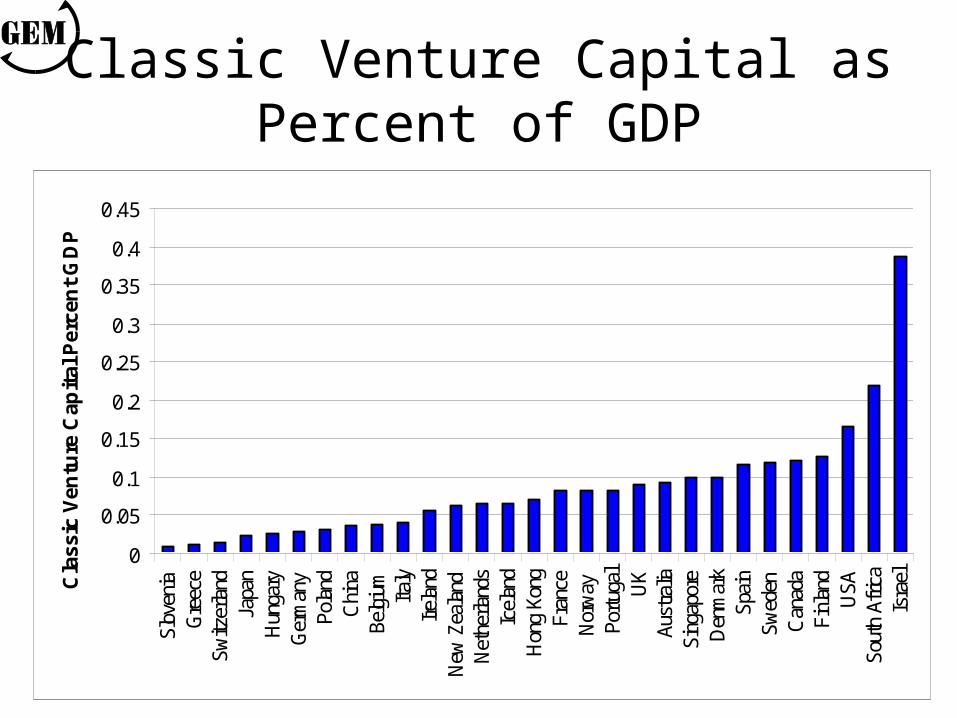
Classic Venture Capital asPercent of GDP
0
0.05
0.1
0.15
0.2
0.25
0.3
0.35
0.4
0.45
Slov
enia
Gre
ece
Switz
erla
ndJa
pan
Hun
gary
Ger
man
yPo
land
Chi
naBe
lgiu
mIta
lyIre
land
New
Zea
land
Net
herla
nds
Icel
and
Hon
g Ko
ngFr
ance
Nor
way
Portu
gal
UK
Aust
ralia
Sing
apor
eD
enm
ark
Spai
nSw
eden
Can
ada
Finl
and
USA
Sout
h Af
rica
Isra
elCla
ssic
Ven
ture
Cap
ital
Per
cen
t G
DP

Other GEM nations
$11.1 billion 38%
USA$18.07 billion 62%
Amount of Classic Venture Capital USA and Other GEM nations

USA2,22719%
Other GEM nations
9,269 81%
Number of Companies Receiving Classic Venture Capital
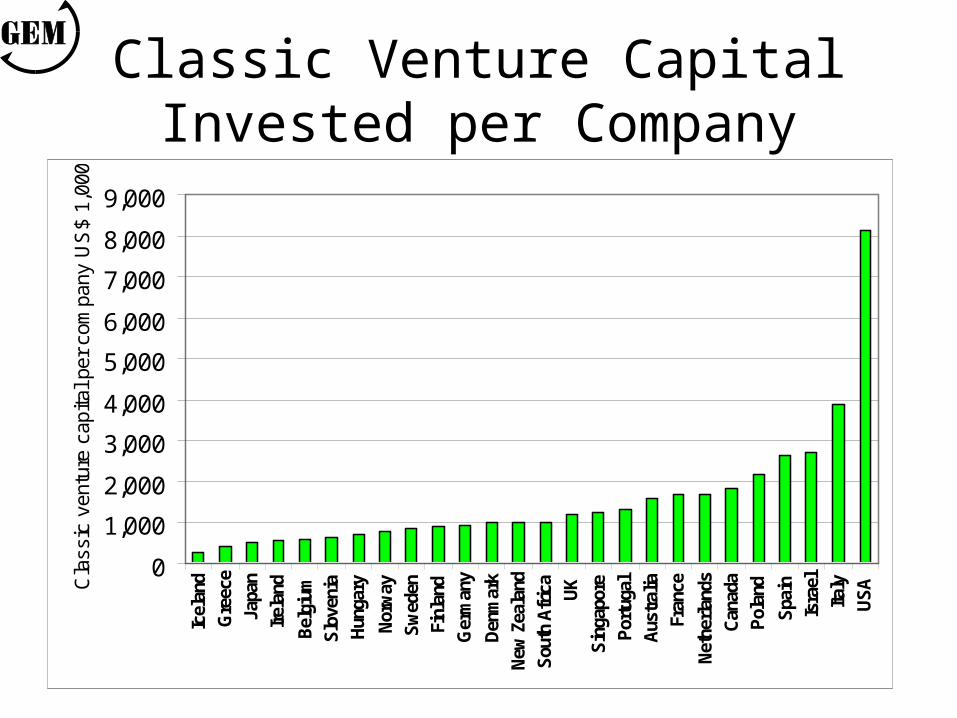
Classic Venture Capital Invested per Company
0
1,000
2,000
3,000
4,000
5,000
6,000
7,000
8,000
9,000Ic
elan
d
Gre
ece
Japa
n
Irel
and
Bel
gium
Slo
veni
a
Hun
gary
Nor
way
Sw
eden
Finl
and
Ger
man
y
Den
mar
k
New
Zea
land
Sou
th A
fric
a
UK
Sin
gapo
re
Por
tuga
l
Aus
tral
ia
Fran
ce
Net
herl
ands
Can
ada
Pol
and
Spa
in
Isra
el
Italy
US
ACla
ssic
ven
ture
cap
ital p
er c
ompa
ny U
S$
1,00
0

0
1
2
3
4
5
6
7
Biotechnology ComputerSoftware &Hardware
Communications
Cla
ssic
ven
ture
cap
ital,
US
$ bi
llion
Other GEM nations
USA
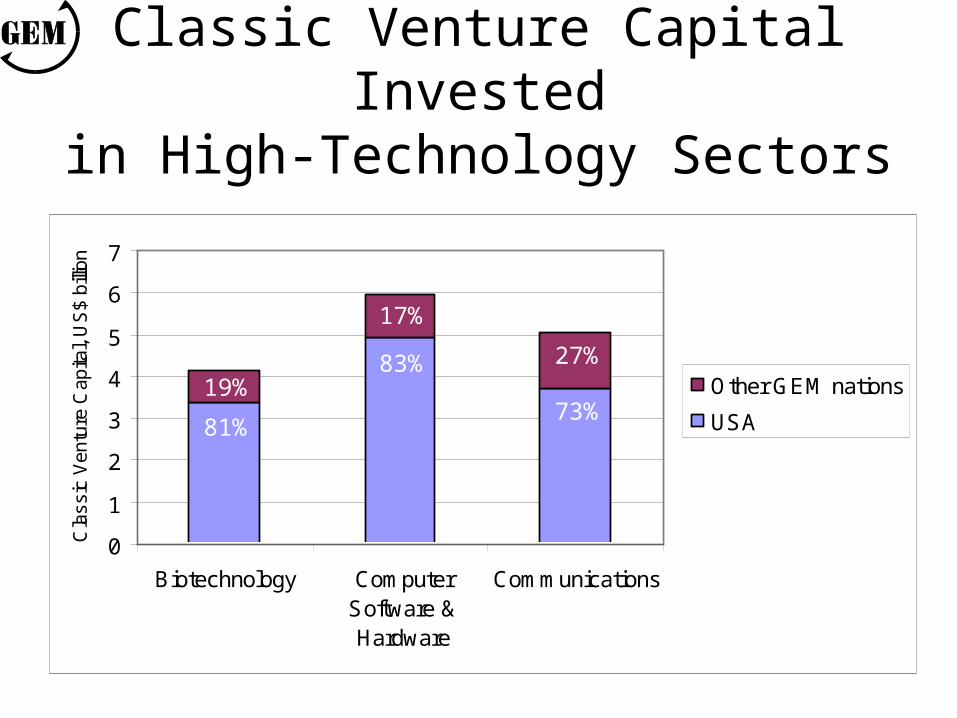
Classic Venture Capital Investedin High-Technology Sectors
0
1
2
3
4
5
6
7
Biotechnology ComputerSoftware &Hardware
Communications
Cla
ssic
Ven
ture
Cap
ital,
US
$ bi
llion
Other GEM nations
USA81%
83%
73%
Classic Venture Capital Investedin High-Technology Sectors
19%
17%
27%

Trend in Domestic Investment of Classic Venture Capital 1999-2003
$0
$20,000,000
$40,000,000
$60,000,000
$80,000,000
$100,000,000
$120,000,000
1999 2000 2001 2002 2003
Denmark
Ireland
Finland
Norway
Belgium
Sweden
Australia
Spain
Italy
Israel
Japan
France
Germany
UK
Canada
USA
USA82%
USA83%
USA77%
USA70%
Ven
ture
Cap
ital
Inv
estm
ent (
1,00
0)
USA66%
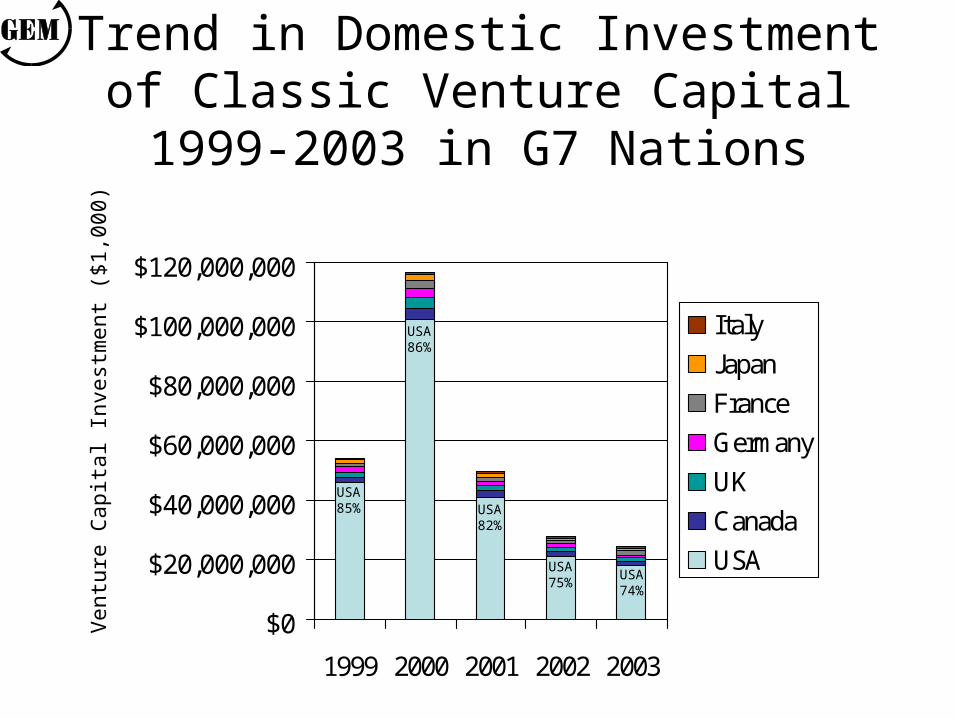
Trend in Domestic Investment of Classic Venture Capital 1999-2003 in G7 Nations
$0
$20,000,000
$40,000,000
$60,000,000
$80,000,000
$100,000,000
$120,000,000
1999 2000 2001 2002 2003
Italy
Japan
France
Germany
UK
Canada
USA
USA85%
USA86%
USA82%
USA75%
Ven
ture
Cap
ital
Inv
estm
ent (
$1,0
00)
USA74%
Implications & Recommendations
• Self-financing and informal investment are far and away the most important sources of startup financing.
• If self-financing and informal investment dried up,
entrepreneurship would wither and die.
• On the other hand, if classic venture capital dried up, entrepreneurship in general would continue to flourish.
• Classic venture capital is primarily an accelerant in the commercialization of new products and services. It seldom funds revolutionary research.

• Get your initial financing from yourselves, family, friends, work colleagues, and strangers (4Fs).
• Don’t even think about classic venture capital at the seed-stage. The odds on raising venture capital for a seed-stage company are worse than the odds on becoming a professional athlete!
Entrepreneurs:
Policy Makers:
• Give entrepreneurs and informal investors a tax break and other incentives.
• Let classic venture capital take care of itself. Just treat classic venture capital as an asset class from the point of view of investors and pension funds.

Educators & Trainers:
• Pay much, much more attention to self-funding and informal investment as sources of startup capital.
• Pay much less attention to classic venture capital as a source of startup capital.
• Put much less emphasis on business plans and business plan competitions that target venture capital.

Researchers
• Conduct far fewer studies of classic venture capital and public stock markets as sources of financing for entrepreneurs.
• Conduct far more studies of funding by informal investors and self-funding by entrepreneurs themselves.

Founding and Supporting InstitutionsBabson College and London Business School