Embed Size (px)
Citation preview
Financial Support and Institutional
Environment on Resource Actions by
SMEs The effect of public and private financial support on implemented resource actions by
SMEs across Europe
Author: Thomas Steenbrink
Student number: 1047740
Supervisor: A.U. Saka-Helmhout
Co-reader: M. Wierenga
Date: 9-8-2021

1 Thomas Steenbrink – Radboud University – 2021
Abstract This study looked into the effect of public and private financial support on the resource actions
implemented by European SMEs. The process of finding an answer to this relation, the database
of Flash Eurobarometer 456, Kantar TNS Political & Social has been used. After a missing data
analysis and scoping down the irrelevant cases, the dataset remained of 2719 valid cases. The
theorised relations were tested through a multiple regression analysis. The results showed that
public, as well as private financial support, positively increase the implemented resource actions
by SMEs. The theorised moderation effect of the institutional environment showed an
insignificant result on the direct relations.
Keywords: Resource Actions, Public Financial Support, Private Financial Support, Institutional
Environment.
Paper type: Master Thesis

2 Thomas Steenbrink – Radboud University – 2021
Table of content Abstract.................................................................................................................................1
Chapter 1: Introduction .......................................................................................................4
1.1 Background ...................................................................................................................4
1.2 Problem statement .........................................................................................................5
1.3 Objective and research question ....................................................................................6
1.4 Relevance......................................................................................................................7
1.5 Outline ..........................................................................................................................8
Chapter 2: Theoretical framework ......................................................................................9
2.1 The Adoption of Resource Actions ................................................................................9
2.2 Financial support ......................................................................................................... 11
2.3 Institutional environment............................................................................................. 13
2.4 Conceptual model ....................................................................................................... 19
Chapter 3: Methodology .................................................................................................... 20
3.1 Dataset and sample ...................................................................................................... 20
3.2 Variables ..................................................................................................................... 21
3.2.1 Dependent variable ............................................................................................... 21
3.2.2 Independent variable ............................................................................................. 22
3.2.3 Moderating variable .............................................................................................. 22
3.2.4 Control variables................................................................................................... 23
3.3 Analytical technique .................................................................................................... 23
3.4 Research ethics............................................................................................................ 26
Chapter 4: Results .............................................................................................................. 27
4.1 Descriptive statistics .................................................................................................... 27
4.2 Assumptions ............................................................................................................... 29
4.3: Regression analysis .................................................................................................... 36
Chapter 5: Discussion ......................................................................................................... 41
5.1: The impact of financial support on SMEs resource actions ......................................... 41
5.2: The effect of the institutional environment ................................................................. 42
5.3: Control variables ........................................................................................................ 43
Chapter 6: Conclusion ........................................................................................................ 46
6.1: Findings of the study .................................................................................................. 46
6.2: Implications ............................................................................................................... 48
6.3: Limitations ................................................................................................................. 49

3 Thomas Steenbrink – Radboud University – 2021
6.4: Directions for future research ..................................................................................... 50
References ........................................................................................................................... 51
Appendix ............................................................................................................................. 57
Appendix 1: Total list of countries Flash Eurobarometer 456 ............................................ 57
Appendix 2: Descriptive analysis ...................................................................................... 58
Appendix 3: Missing value analysis .................................................................................. 62
Appendix 4: Normality test ............................................................................................... 66
Appendix 5: Boxplot SME_RA ......................................................................................... 69
Appendix 6: Multiple regression analysis .......................................................................... 70
4 Thomas Steenbrink – Radboud University – 2021
Chapter 1: Introduction This chapter will provide a first overview of the investigated topic. It starts with describing the
background of the problem, continuing with the problem statement. This will result in the
problem statement together with the research question. After, the relevance of this study will
be given, and the chapter ends with the outline of the paper.
1.1 Background
Across the globe there is a growing concern regarding sustainability practices. Since the Paris
Climate Agreement in 2015, 197 countries agreed to reduce their carbon emission to stop the
rise of the global temperature by 2 degrees Celsius (United Nations Framework Convention on
Climate Change, 2018).
Countries translated the United Nations Framework Convention on Climate Change
(UNFCCC) agreement towards legislation to meet the goals set in the Paris Climate Agreement.
This newly defined legislation is aimed at making the step towards sustainability practises more
attractive for firms by giving grants or subsidies and benefits for pursuing sustainability
practises (Rijksoverheid, 2020).
Looking at the sustainability issue on a corporate level, it is obvious that some firms are
currently following a proactive environmental strategy, while others wait for government
regulations regarding resource actions (Reilly & Weirup, 2012). Previous research in the field
of environmental strategy is predominantly addressing the focus on MNEs, while more recent
literature is currently aimed at the relation between SMEs and environmental strategy (Spence,
1999) (Jenkins, 2004) (Perrini, Russo, & Tencati, 2007) (Kusyk & Lozano, 2007) (Reilly &
Weirup, 2012). The focus on resource actions from a MNE view is mostly because of the greater
visibility of MNE practises in a physical sense compared to the small visibility of SMEs
(Perrini, Russo, & Tencati, 2007). As a result, governments, NGO’s and other stakeholders are
more inclined to question and exert pressure on MNEs than on SMEs (Lynch-Wood,
Williamson, & Jenkins, 2009). The institutional pressures MNEs face, are also applicable to
SMEs, however, SMEs do not experience these pressures as important as MNEs do, due to the
lack of urgency in their local environment (Perrini, Russo, & Tencati, 2007) (Lynch-Wood,
Williamson, & Jenkins, 2009). Within SMEs, sustainability practises are dependent on the
beliefs and values of the people managing the SME (Jenkins, 2004) (Perrini, Russo, & Tencati,

5 Thomas Steenbrink – Radboud University – 2021
2007) (Nejati, Quazi, Amran, & Ahmad, 2017). Therefore, these practises are based upon the
relationships between the managing director of the SME and the various stakeholders and local
environment.
1.2 Problem statement
The research conducted in the field of MNEs is helpful in explaining the pressures for resource
actions, however, the response of SMEs regarding these pressures greatly differs. The focus on
SME resource actions is becoming more important since SMEs account for 99% of all European
businesses and the impact of the institutional environment differs among SMEs. Moreover,
Nejati et al. (2017) looked into the relation between resource actions and performance. They
found that a long-term strategic approach towards a proactive environmental strategy results in
an increase in financial performance. Furthermore, they found that SME managers are
precautious in investing in environmental strategies, which raises the question why SMEs still
want to pursue environmental strategies (Nejati, Quazi, Amran, & Ahmad, 2017).
As addressed in the paragraph before, Nejati et al. (2017) stated that SME managers are
precautious in investing in socially responsible actions, however, the literature fails to explain
how these barriers can be circumvented. Since they state that SME managers are careful in
making financial investments, it is important to look into how financial hurdles can be solved
to help SMEs pursue environmental strategies. Complementary, Clement and Hansen (2003)
investigated public financial incentives and the effect on SMEs environmental performance
(Clement & Hansen, 2003). They found that public subsidies are an important element for
SMEs to start with environmental strategies. However, they conducted their research only in
the Nordic European countries, Denmark, Finland, Norway, and Sweden and did not take
institutional factors into account which may influence this relationship. In addition, Clement
and Hansen (2003) state that little is known about how these financial incentives have
stimulated the development of environmental strategies and that this requires further
investigation (Clement & Hansen, 2003). Moreover, Kuskys & Lozano (2007) found that SMEs
have smaller resources which constrain them to invest in resource actions, since SMEs are risk
averse (Kusyk & Lozano, 2007). This means that SMEs experience less pressure, and when
they do experience pressure, it is harder to comply to these pressures due to the scarce resources
they possess.

6 Thomas Steenbrink – Radboud University – 2021
Looking at the different pressures SMEs face, Clement and Hansen (2003) stated that the
institutional environment of the firms could influence the relationship between the financial
incentives by the government and the implemented resource actions. Different scholars came
up with several results regarding the institutional environment on the resource actions by SMEs.
Perrini et al. (2007) found that the larger a firm, the more inclined the firm is in executing
environmental strategies. Furthermore, they state that the level of importance of environmental
pressures differ between MNEs and SMEs, however, that the current understanding why this
differs is worthwhile looking into (Perrini, Russo, & Tencati, 2007). In addition, they failed in
explaining why and how larger firms differ compared to SMEs. Furthermore, Lynch-wood et
al. (2009) noted that voluntary resource actions differ between MNEs and SMEs, where SMEs
experience little pressures from stakeholders to go beyond the legal environmental requirements
inclined by the government. They state that future research should investigate the differences
in the institutional environment and the adoption of resource actions by SMEs (Lynch-Wood,
Williamson, & Jenkins, 2009). Kusyk and Lozano (2007) extended the stakeholder theory on
SMEs resource actions, by looking into barriers and drivers of social performance (Kusyk &
Lozano, 2007). They looked into how SMEs face pressure of stakeholders and to what extent
this resulted in different drivers and barriers of resource actions. In addition, Raza et al (2019)
investigated different stakeholder pressures, market orientation and CSR commitment and the
influence of these three on organisational competitive differentiation (Raza, Liu, & Usman,
2019). In their paper they state that CSR commitment of SMEs only result from stakeholder
pressure. To conclude, the addressed scholars have different arguments regarding the pressures
SMEs encounter to pursue environmental strategies.
Extending the research provided by Perrini et al. (2007) Lynch-wood et al. (2009) Kusyk and
Lozano (2007), Raza et al. (2019) and Clement and Hansen (2003), will deliver further
understanding on which financial support and institutional factors influence SMEs in
implementing resource actions considering the scarce resources they possess naturally.
1.3 Objective and research question
The gap found, about how institutions influence the relation between financial support and the
environmental strategies by SMEs in Europe, will provide a broader understanding how
financial support influence SMEs resource actions and how this is affected by the institutional
environment. While Perrini et al. (2007) Lynch-wood et al. (2009) and Kusyk and Lozano
(2007) explained differences between environmental strategies by MNEs and SMEs, a broad

7 Thomas Steenbrink – Radboud University – 2021
understanding why the adoption of environmental strategies differs among SMEs is lacking.
Furthermore, the results by Raza et al. (2019) show how institutions matter, however, this study
was applied in a different environmental context namely, Pakistani SMEs. Moreover, Clement
and Hansen (2003) explained the effect of financial incentives on environmental performance
in the Nordic European countries. Applying the findings of Raza et al (2019) and Clement and
Hansen (2003) into the context of SMEs in the Europe business environment extends the
understanding of SMEs environmental strategies (Raza, Liu, & Usman, 2019). Therefore, the
objective of this master thesis is to fill the research gap how institutions influence the relation
between financial support and the pursued environmental strategies by SMEs in Europe.
‘’To what extent is the relation between financial support and resource actions influenced by
the institutional environment among SMEs?’’
1.4 Relevance
The scope of SMEs is rather important since 99% of all European businesses are defined as
SMEs (European Commission, 2018). Furthermore, since 2013, 85% of new employment was
coming from SMEs, this means that SMEs have a large share in the total employment and
business environment in the European Union (European Commission, 2018). Also, the
characteristics of SMEs differ greatly compared to MNEs, which is assumed by early CSR
literature. This resulted in false assumptions that MNE resource actions can be reapplied to
SMEs (Jenkins, 2004) (Spence, 1999) (Lynch-Wood, Williamson, & Jenkins, 2009). In
addition, SMEs individually do not account for a big share of environmental impact, however,
their cumulative impact on the environment is remarkable which requires further attention
(European Commission, 2018) (Stoian & Gilman, 2017). These facts highlight the importance
of research in the field of SMEs.
The relevance of this master thesis consists of two parts, theoretical relevance, and practical
relevance. This master thesis tries to explain the resource actions applied by SMEs. It broadens
the understanding how financial and institutional factors influence these resource actions. It is
considered important to find the relations between the financial support and implemented
resource actions since governments are using tax money to fund and help SMEs to go for more
sustainable solutions. Moreover, institutions play a role, however, there is no consensus reached
about how institutions influence the relation between financial support and resource actions by
SMEs.

8 Thomas Steenbrink – Radboud University – 2021
As stated in paragraph 1.2, early academic research is dominant in the field of MNEs, while to
date more research is done in the context of SMEs. However, the gap found leaves room for
further research into the field of resource actions and SMEs. Given previous addressed studies,
this study changes the perspective and context and looks at resource actions from an SMEs
perspective which reflects the theoretical relevance. Furthermore, this thesis helps policy
makers, SMEs owners and managers, and other institutional stakeholders in understanding the
driving factors behind the resource actions of SMEs. This contributes to the practical relevance
since it gives answers how resource actions can be influenced, and which factors help the best
for conducting and improving resource actions by SMEs.
1.5 Outline
This research is going to continue as follows. In the second chapter more detailed descriptions
will be given about the main concepts, namely, resource actions, financial support and the
institutional environment. The theoretical framework in chapter 2 enables prior information to
be mapped into a visual conceptualization of the various topics of this analysis and how they
contribute to each other. This results in a conceptual model. The third chapter discusses the
methodology used, and the operationalisation of the main concepts. Chapters 4 will elaborate
on the quantitative analyses, while chapter 5 covers the discussion. The thesis concludes with
chapter 6 elaborating the conclusions of the whole study, addressing implications, and possible
directions for further research.

9 Thomas Steenbrink – Radboud University – 2021
Chapter 2: Theoretical framework In this chapter, the main concepts that are being investigated in this study will be provided.
First, the main concepts of resource actions will come forward. Second, the theory of financial
support is addressed and how this relates towards resource actions. Finally, the institutional
environment will be explained, also related towards resource actions as well as the moderating
effect on financial support. Based upon the explained main concepts, several hypotheses are
defined. The chapter concludes with a conceptual model, which graphically shows the main
concepts and their relationships.
2.1 The Adoption of Resource Actions
Resource actions are stemming from the overall concept of corporate social responsibility
(CSR). The origin of CSR is coming from the definition of Freeman’s stakeholder theory, he
defines stakeholders as; ‘’any group or individual who can affect or is affected by the
achievement of the firm’s objectives.’’ (Freeman, 1984, p. 216). He argued that firms need to
be more aware of their external environment since they are sensitive to influences of this
external environment (Freeman, 1984). Elkington (1997) described that companies struggled to
adopt resource actions since they were only going to cost money. He argued that corporate
social responsibility is a three-dimensional concept, consisting of social, economic, and
environmental aspects, also known as the Triple Bottom Line (Russo M. V., 2008). Firms
should not be focussing on one of these dimensions at once, but rather see it as a complementary
concept. Once firms see it as a unified concept, they can benefit from the framework related to
implementing corporate social responsibility actions. It must be seen as a triangle of economy,
society and environment, also known as people, planet and profit (Elkington, 1997). Firms need
to find a balance between these concepts.
The theory of Elkington (1997) and his view on the Triple Bottom Line is since then widely
applied in the field of business and social studies (Alhaddi, 2015). The Triple Bottom Line is
mostly used in studies regarding sustainability and resource actions. A more specific aspect of
CSR is addressed by Guillamon-Saorin et al. (2018), who state that firms distribute resources
in an efficient way to add value for both the company and society, this relates to the profit and
planet aspect of the Triple Bottom Line (Guillamon-Saorin, Kapelko, & Stefanou, 2018)
(Alhaddi, 2015). They state that CSR is aimed at improving society, while adding value for the
company. This connects to the definition of resource efficiency, which is aimed at reducing the

10 Thomas Steenbrink – Radboud University – 2021
resources needed by the firm to diminish its environmental impact (European Commission,
2021). The European Commission (2011) stresses the importance of mutual value between
businesses and society and sees that the CSR mechanism remains informal for most SMEs
(European Commission, 2011).
Resource efficiency can be translated into several specific practises, resource actions aimed at
reducing the impact of the firm on the environment. To be more specific, resource actions are
measures or actions to reduce the environmental impact of the firm’s operations in different
areas under their direct control (European Commission, 2021). This means that resource
activities are geared at lowering the business's resource usage while the firm has direct influence
on the reduction of this resource utilisation. Neves et al. (2014) defined 12 resource actions that
firms have implemented within the food sector (Neves, Drohomeretski, da Costa, & de Lima,
2014). Neves et al. (2014) argued that the resource actions are aimed at reducing the utilisation
of resources, simultaneously with adding value to the company by achieving their goals. So, it
can be argued that implementing resource actions is a double-edged sword, reducing the impact
on the environment while achieving added value for the company.
There are more incentives that influence firms to implement resource actions besides the
benefits of resource efficiency. Rademaekers et al. (2012) investigated the most used incentives
by policy makers and came up with three dimensions of incentives; Administrative, Economic
and Reputational incentives (Rademaekers, et al., 2012). They found that economic and
reputational incentives were the most effective. Economic since this kind of incentive reduces
the barrier of short-term benefits and potential investment risk for firms. Reputational was
found as a very effective incentive for firms to implement resource actions, this is the case since
these kinds of benefits do not cost great efforts of financial resources to obtain. Moreover, since
SMEs are embedded into the local context, this increases their local responsiveness and
improves the reputation of the SME. However, the authors stated that the governmental quality,
like regulations, can obstruct the influence of the financial incentives since these governmental
systems can vary in their financial priorities (Rademaekers, et al., 2012). The authors only
looked into incentives applied by policy makers, not to other financial resources that can
stimulate firms adopting resource actions, this is being discussed in the next paragraph.

11 Thomas Steenbrink – Radboud University – 2021
2.2 Financial support
Literature to date shows that provided financial support takes on different forms (Clement &
Hansen, 2003) (Kaya, 2014) (European Commission, 2018) (Oguntoye & Quartey, 2020). A
distinction can be made between public financial support and private or market-based financial
support. Public support consists of government institutions providing capital or tax incentives
to help or reinforce the financial state of SMEs. Private or market-based support incorporates a
more diverse set of different parties that provide financial support. This can be a bank, financial
equity provider, sponsor, investors, or relatives. The effect of these two different forms on the
implementation of resource actions will be discussed from here onwards.
Public financial support
Public financial support is a type of policy instrument by governmental institutions to direct
capital to firms, who need to apply for this support under certain conditions (Wang & Zhang,
2020) (Dvouletý, Srhoj, & Pantea, 2020). Providing capital is a direct measure by the
government, however, the government can also take indirect measures to help firms like
lowering tax rates to persuade and help firms (Lee, Walker, & Zeng, 2017) (Wang & Zhang,
2020) (Dvouletý, Srhoj, & Pantea, 2020). Both ways of support, direct and indirect measures,
will be discussed in this section.
Overall, Wang and Zhang (2020) and Dvouletý et al. (2020) found that public financial support
enhances firm survival and performance. Moreover, in the available literature about public
financial support, a consensus is reached on how this financial support also affects resource
actions by firms, namely, public financial support helps and motivates SMEs in pursuing
environmental strategies (Wang & Zhang, 2020) (Dvouletý, Srhoj, & Pantea, 2020). However,
there is no broad understanding on which kind of support helps best. For instance, Wang and
Zhang (2020) looked into the effect of state subsidies by the Chinese government on the
environmental spending by state-owned and non-state-owned enterprises. They found a positive
effect between the public subsidies and the environmental spending by state-owned as well as
non-state-owned firms. This means that firms who receive public financial support will behave
more environmentally responsible in contrary to the firms who do not receive the public
subsidies. This is also in line with the results of the research executed by Lee et al. (2017), who
also found a positive relationship between voluntary CSR disclosure and governmental
subsidies (Lee, Walker, & Zeng, 2017). This result was stronger for direct, non-tax-related
subsidies. Moreover, Yang et al. (2021) found that firms obtaining public subsidies, participated
12 Thomas Steenbrink – Radboud University – 2021
more in technological innovation aimed at resource actions compared to firms that did not
obtain public financial support (Yang, Tang, & Zhang, 2021).
The addressed literature of Wang and Zhang (2020), Dvouletý et al. (2020) and Lee et al. (2017)
are comprising SMEs as well as MNEs in emerging economies. However, the research context
of this paper is looking into the SME context in Europe. Looking into the literature about the
European SME context provides evidence that the previous relation found in emerging
economies can also be applied to the European SME context. Rademaekers et al. (2012),
Blundel et al. (2013) and Cecere, Corrocher and Mancusi (2020) looked into the European SME
context of financial support to implement resource actions. Rademaekers et al. (2012) found
that SMEs mostly react to public financial support to implement resource actions
(Rademaekers, et al., 2012). This is supported by Blundel et al. (2013) who found that direct
financial support from governments stimulates SMEs in implementing resource actions
(Blundel, Monaghan, & Thomas, 2013). Moreover, Cecere et al. (2020) support the claims
made by Rademaekers et al. (2012), Blundel et al. (2013). They also confirm that public
financial support is the most effective in stimulating SMEs to adopt resource actions (Cecere,
Corrocher, & Mancusi, 2020).
Following the previous reasoning, it can be concluded that public financial support enhances
resource actions implemented by SMEs. This results in the following hypothesis:
H1a: Public financial support positively impact SMEs’ resource actions.
Private and market-based financial support
SMEs mostly rely on private forms of financial support (Kaya, 2014) (European Commission,
2018) (Bakos, Siu, Orengo, & Kasiri, 2019). The reason behind this is that governments are
spending taxpayer’s money to financially support privately owned businesses and are therefore
hesitant in giving direct subsidies to SMEs.
The private and market-based financial sector consists of a diverse set of institutions,
Investment Banks, Commercial Banks, Internet Banks, Retail Banking, Insurance companies,
and Mortgage companies. These different institutions can provide loans, equity, or other
financial resources for companies (EDUCBA, 2021). To obtain financial support, SMEs mostly
rely on regular bank loans (van der Wiel, Dubovik, & van Solinge, 2019) (Kaya, 2014). The

13 Thomas Steenbrink – Radboud University – 2021
choice for regular bank loans is because of the strict financial regulations and risk prevention
that other financial institutions apply to SMEs. However, banks are also conservative in
granting SMEs a loan, due to the organizational structure of SMEs. Normally, SMEs do not
publish business strategies or annual reports, which makes SMEs less transparent compared to
large multinational firms. This informal nature of the SMEs makes it harder for banks to assess
the SMEs’ business and financial state. This results in limited access to financial support from
banks (Kaya, 2014) (Abraham & Schmukler, 2017). There are more factors that enable or
constrain SMEs in their search for financial support. Bakos et al. (2019) described barriers and
drivers for SMEs pursuing resource actions. They found that it is harder to obtain loans and
public support for SMEs (Bakos, Siu, Orengo, & Kasiri, 2019). This is in line with the results
found by Zhu et al. (2012), who also found that access to finance is the main obstacle for SMEs
(Zhu, Wittmann, & Peng, 2012). This barrier of obtaining financial support results in the shift
of financial support towards family members or other relatives (Hussain, Millman, & Matlay,
2006) (Bakos, Siu, Orengo, & Kasiri, 2019). Furthermore, Forkuoh et al. (2015) address that
the shift towards private external finance is due to the limitations with bank-based external
finance (Forkuoh, Li, Affum-Osei, & Quaye, 2015). Therefore, based upon the arguments
brought by Bakos et al. (2019), Zhu et al. (2012), Forkuoh et al. (2015), the following
hypothesis is derived:
H1b: Private financial support positively impacts SMEs’ environmental practices.
An influencing factor on the availability and adoption of financial support is brought to light
by Bakos et al. (2019). They found that a lack of governmental legislation is a barrier for SMEs
in implementing sustainable practices. Moreover, Rademaekers et al. (2012) found that
legislation is an improving factor in increasing resource actions by SMEs (Rademaekers, et al.,
2012). In addition, Cungu et al. (2008) found that the weak institutions in Hungary constrained
the availability of investments for SMEs (Cungu, Cow, Swinnen, & Vranken, 2008). Therefore,
it can be concluded that institutions can play a vital role in the implementation of resource
actions by SMEs, this is being elaborated in the next paragraph.
2.3 Institutional environment
The institutional environment is part of the institutional theory that has been thoroughly
researched. The institutional theory originates from 1991, when the American economist North
defined the institutional theory (North, 1991). He described institutional theory from an

14 Thomas Steenbrink – Radboud University – 2021
economic perspective as humanly devised constraints that influence the interaction of people,
this could be, political, social, or economic. These constraints could be formal, as well as
informal. Formal constraints are established to work out trust problems and provide protection,
informal constraints include cultural traditions. Formal institutions are regulations and laws,
whereas informal institutions consist of codes of behaviour and norms and values (North, 1991).
Formal and informal institutions are built upon broad agreements about how people or
organisations should behave, and these are transferred over time through culture (Van
Kranenburg & Voinea, 2017). This means that institutions can change the behaviour of people
as well as that people and culture change institutions.
There are more views on Institutional Theory. Scott (2001) took a more social point of view on
the institutional theory, he saw institutions more as social structures which consist of regulative,
normative, and cultural-cognitive elements that direct actions of behaviour (Scott, 2001). He
divided the institutional theory into three pillars, the regulative, the normative and the cognitive
pillar. The regulative pillar consists of laws, regulations, and rules, this is coercive. The
normative pillar consists of norms and values. The last pillar, the cognitive pillar, consists of
culture and religion, also defined as the cultural pillar (Van Kranenburg & Voinea, 2017). The
main argument of Scott (2001) is that the regulative pillar is expressed into written laws and
regulations to which a society should comply, while the normative and cultural-cognitive pillar
is not formalised by law, but by norms and values expressed by individuals in a certain culture.
The definitions of the institutional theory by North (1991) and Scott (2001) slightly differ,
however, both institutional views are broadly applied in management science (Kostova, Roth,
& Dacin, 2008). Kostova et al. (2008) found that organizations need to adhere to the
institutional environment they operate in, this gives organizations legitimacy to operate in this
environment. This means, that for firms, it is important to understand the environment you are
in to secure organizational survival. Bruton et al (2010) found three pathways in the current
business literature regarding the institutional environment (Bruton, Ahlstrom, & Li, 2010). The
first is based upon the ‘’institutional setting’’, which means that firms can be either constrained
or empowered by the institutions located in their environment. The second comprises
organizational legitimacy, which gives firms the right to operate in a certain institutional
environment. The third pathway is institutional entrepreneurship, which states how
organizations develop the institutional framework to alter and adapt their organizational
structure towards better collaboration within the institutional framework. The aim of this

15 Thomas Steenbrink – Radboud University – 2021
research is focussed on the first stream defined by Bruton et al. (2010), the institutional setting
which either constrains or empower firms.
The influence of institutional quality on resource actions
The effect of the institutional context as a constrain or empowerment is broadly investigated.
For instance, Zhu et al. (2012) found that lack of institutional support counted as a main barrier
in the SME context, this stresses the importance for SMEs to adhere to the institutional
environment (Zhu, Wittmann, & Peng, 2012). They also stated that a lack of institutional
knowledge and regulations hamper SMEs’ performance and innovation. Lynch-wood et al.
(2009) found that not every firm experiences the same external pressures from stakeholders
which is related to the size of the firm (Lynch-Wood, Williamson, & Jenkins, 2009). They
found that SMEs operate in a rather small and simple context, which results in the feeling of
less pressures from the external environment. However, this can change if these customers and
institutions act cooperatively (Lynch-Wood, Williamson, & Jenkins, 2009). This is also found
by Kuskys & Lozano (2007), who states that SMEs are embedded into a local context with
fewer demanding customers and institutions (Kusyk & Lozano, 2007). Moreover, they stated
that SMEs have smaller resources which constrain them to invest in resource actions since
SMEs are risk averse. This means that SMEs experience less pressure from the external
environment, and when they do experience pressure, it is harder to comply due to the fewer
resources they possess (Perrini, Russo, & Tencati, 2007). In addition, Raza et al. (2019) found
that external pressures result in more resource actions implemented by SMEs, this emphasises
the role those formal institutions need to take to influence SMEs’ environmental behaviour
(Raza, Liu, & Usman, 2019). Moreover, Bakos (2019) identified barriers and drivers for SMEs
in adopting resource actions. They found that the main driver of resource actions for SMEs is
governmental regulations. One of the main barriers identified was a lack of environmental
legislation. These stress the importance of strong formal institutions in the implementation of
resource actions (Bakos, Siu, Orengo, & Kasiri, 2019). To conclude, it can be stated that strong
formal institutions have a positive effect on the implementation of resource actions by SMEs.
This results in the following hypothesis:
H2: Strong formal institutions positively impact SMEs’ environmental practices.

16 Thomas Steenbrink – Radboud University – 2021
Institutional environment as a moderator between financial support and resource actions
Given the barriers and drivers defined by Bakos (2019), governmental legislation results as the
main driver for resource actions. The absence of environmental legislation was found to be the
main barrier for SMEs pursuing resource actions, so, it can be expected that weak formal
institutions negatively influence resource actions. Also, as addressed in the previous paragraph,
public financial support enhances SMEs in pursuing environmental strategies. However, if the
formal institutional environment is weak, because of a lack of legislation, it will negatively
influence the availability of financial support towards SMEs (European Commission, 2018)
(Bakos, Siu, Orengo, & Kasiri, 2019). Moreover, Luca (2016) found that self-interested weak
governmental institutions constrain the effectiveness of governmental investments (Luca,
2016). He found that the complex nature of governmental institutions had a negative effect on
the support firms received. This means that weak institutions negatively influence the
availability and distribution of public financial support towards firms. The study by Luca (2016)
was conducted in the institutional environment of Turkey, therefore, in this research it will be
investigated if this relation holds in the institutional context of Europe.
The relation between weak institutions and private or market-based financial investments is
also investigated. Rodrik (1991) found that policy uncertainty results in a withhold of private
investments due to the risk that could occur for the investors (Rodrik, 1991). Furthermore, Feng
(2001) looked into three political determinants that may influence property rights and private
investment. The three political determinants were political freedom, political instability, and
policy uncertainty (Feng, 2001). The results found, showed that political instability, as well as
policy uncertainty has a negative effect on private investments. These two concepts result in
fear and refrain from private parties to invest in firms. This means that the weak institutional
environment has a negative effect on the carried out private investments. Moreover, Svensson
(1998) investigated why domestic private investment rates differ greatly between countries. He
found that countries with an unstable legal system and unreliable governmental structure result
in lower domestic investments (Svensson, 1998). In addition, Shanmugam (2020) dived into
the topic of financial development. He applied several governance indicators on the concepts
of Foreign Direct Investment and Domestic Private Investment (Shanmugam, 2020). Looking
at domestic private investment, he has found that political instability has a negative significant
effect on the level of domestic investment, while rule and law have a positive effect. Iheonu
(2019) looked into the effect of governance on domestic private investment in the geographical
context of Africa (Iheonu, 2019). The effects found by Iheonu (2019) support the work by the

17 Thomas Steenbrink – Radboud University – 2021
previously addressed scholars, low quality of governance and an unstable political environment
have strong negative effects on the decision for domestic investments.
Looking more closely into the European research context, it can be said that within Europe,
some countries have weak institutions. For instance, Marinescu (2013) conducted a comparison
study of the differences in institutional quality across Europe (Marinescu, 2013). He made two
groups of countries, one from Central and Eastern Europe, and one from Western European
countries. He found that there are significant institutional differences between the regions in
Europe. The most significant difference was found in the institutional quality indicator of
institutional constraint regarding investments and trade (Marinescu, 2013). This highlights the
fact that also within the European institutional context, differences occur between states that
affect the financial institutional landscape, which in turn can affect the investments from SMEs
in resource actions. This is supported by Mc Namara and O Donohoe (2013), who conducted
research about the role of institutional environments on SME credit availability in European
countries (Mc Namara & O Donohoe, 2013). They found that judicial, bankruptcy, and social
environments of the European countries are highly influencing the availability of credit for
SMEs. Again, this stresses the influence of the institutional environment on financial support
towards SMEs. Moreover, Sun, Edziah, Sun, and Kporsu (2019) looked into institutional
quality, green innovation and energy efficiency in 71 countries, developed countries as well as
developing countries (Sun, Edziah, Sun, & Kporsu, 2019). The results showed that reliable
governmental institutions and funding lead to an increase in investments by firms in energy
efficiency. Furthermore, they found that weak governmental institutions hinder this
relationship.
Zooming in on the relationship of institutional quality and financial support, Arbolino and
Boffardi (2017) found that the quality of the institutions in Europe have a significant effect on
the availability and the effectiveness of public financial support (Arbolino & Boffardi, 2017).
They found that the quality of the institution is necessary to obtain the highest return of public
financial support. Moreover, the OECD conducted research investigating the current state of
knowledge about SMEs and their contribution to social and economic well-being (OECD,
2017). They identified challenges and opportunities for SMEs in the European business context.
The OECD also investigated the institutional environment of SMEs and found evidence that an
inefficient institutional environment makes it difficult for SMEs to obtain and effectively
deploy public financial support (OECD, 2017). Spoz (2014) found that SMEs face barriers in
18 Thomas Steenbrink – Radboud University – 2021
obtaining public financial support, the two major barriers identified were excessive bureaucracy
and strict procedures (Spoz, 2014). This is in line with the findings by Arbolino and Boffardi
(2017) and the barriers found by the OECD (2017).
Focussing on the influence of institutional quality on the availability of private support to
enhance and stimulate resource actions, Lindenberg (2014) found that there needs to be a
favourable institutional environment (Lindenberg, 2014). This means, that the institutional
environment should be structured to provide the right conditions for private investors to
improve their green investments. This in line with the findings by Polzin, Flotow and Klerkx
(2016) who found that governmental institutions should strengthen and provide financial
support for firms adopting resource actions (Polzin, Flotow, & Klerkx, 2016). Moreover,
institutions should reduce the barriers firms face when acquiring private capital for
implementing resource actions. Polzin (2017) found that institutions can influence the private
financial investment environment, which in turn leads to more private investments towards
firms implementing resource actions (Polzin, 2017).
Following the previous reasoning about the influence of institutional quality on public and
private financial support, it can be stated that a weak institutional environment has a negative
effect on investments. Therefore, a weak institutional environment makes it harder for SMEs
in general to obtain financial support. Given the fact that financial support positively improves
the ability for SMEs to implement resource actions, a weak institutional environment negatively
moderates this relationship. It is also found that clear legislation and a stable institutional
environment have a positive effect on domestic financial support. This results in the following
hypothesis:
H3a: Strong formal institutions positively moderate the effect of public financial support on
SMEs’ resource actions.
H3b: Strong formal institutions positively moderate the effect of private financial support on
SMEs’ resource actions.

19 Thomas Steenbrink – Radboud University – 2021
2.4 Conceptual model
The theoretical framework considering resource actions, financial support and the institutional
environment resulted in the aforementioned hypotheses. The outcome of this is represented in
the following conceptual model as shown in Figure 1:
H1a Public financial support positively impacts SMEs’ resource actions.
H1b Private financial support positively impacts SMEs’ resource actions.
H2 Strong formal institutions positively impact SMEs’ resource actions.
H3a Strong formal institutions positively moderate the effect of public financial support
on SMEs’ resource actions
H3b Strong formal institutions positively moderate the effect of private financial support
on SMEs’ resource actions
Table 1 Hypotheses table overview
Figure 1 Conceptual model

20 Thomas Steenbrink – Radboud University – 2021
Chapter 3: Methodology The following chapter will elaborate more on the data used in this study. The chapter starts by
explaining the sample and dataset. After, the variables, dependent, independent, moderation,
and control variables will then be presented. Following the variables, the analytical techniques
that are being used in the analysis will be presented. The chapter will conclude with a
declaration on research integrity.
3.1 Dataset and sample
The Flash Eurobarometer 456 of the European Commission is being used in this study to answer
the formulated hypotheses in Chapter 2. The Flash Eurobarometer 456 study is called ‘’SMEs,
resource efficiency and green markets’’ and investigates the current resource efficiency actions
by European SMEs. This is the most recent Flash Eurobarometer from 2018, older surveys
conducted into the field of SME resource efficiency are not being taken into account since they
make use of different variables, questionnaires, and datasets. The Flash Eurobarometer 456
looks at the current and planned resource actions taken by SMEs and their reasons behind them.
The Flash Eurobarometer 456 also dives into barriers SMEs face when implementing resource
efficiency actions. Also, the role of supporting policy is addressed when SMEs implement
resource efficiency actions. The study was published in January 2018 and executed by Kantar
TNS Political & Social network (European Commission, 2018). The researchers conducted
telephone interviews via landline and mobile phones, with 15,019 different enterprises. Kantar
TNS Political & Social conducted the survey for the European Commission, Directorate-
General for Internal Market, Industry, Entrepreneurship and SMEs.
A SME can be defined based upon two requirements, headcount and turnover or balance sheet
total. This definition has also been used in the Flash Eurobarometer 456 (European
Commission, 2020). The staff headcount should not cross the upper limit of 250 employees.
The turnover cannot exceed the boundary of 50 million euros, or the balance sheet should be
equal of less than 43 million euros. However, there is a differentiation made in the definition of
SMEs, as the abbreviation already states, Small and Medium Enterprises. This differentiation
is made in three groups; micro, small and medium and has corresponding values for headcount
and turnover or balance sheet total. The overview of the SME definition can be seen in Table
2: SME definition (European Commission, 2020).

21 Thomas Steenbrink – Radboud University – 2021
As stated in the paragraph before, the dataset of the Flash Eurobarometer 456 consists of 15,019
different enterprises and is of quantitative nature. The countries where these enterprises are in,
are the total of 28 member states of the European Union. Also, SMEs from Albania, the Former
Yugoslav Republic of Macedonia, Montenegro, Serbia, Turkey, Iceland, Moldova, Norway,
and the United States were considered (European Commission, 2018). After the data cleaning
process, the number of enterprises will be different as well as the countries. This will come
forward in Chapter 4.
The main concepts, as stated in Chapter 2, are investigated based on data available by the Flash
Eurobarometer 456. The next paragraph goes through how these concepts were defined.
3.2 Variables
This section will address the variables that are used in this study and how they will be measured.
3.2.1 Dependent variable
The dependent variable is based upon the main concept of SMEs resource actions. This is
derived from the theory about CSR based upon the Triple Bottom Line by Elkington (1997). A
more specific aspect of CSR is addressed by Guillamon-Saorin, Kapelko, & Stefanou (2018),
who stated that firms distribute resources in an efficient way to add value for both the company
and society, which related to the profit and planet aspect of the Triple Bottom Line (Guillamon-
Saorin, Kapelko, & Stefanou, 2018) (Elkington, 1997). This distribution of resources is also
found in the Flash Eurobarometer 456, by the resource efficiency actions executed by SMEs.
These actions were: (1) minimising waste, (2) saving energy, (3) saving materials, (4) saving
water, (5) recycling, (6) design modifications, (7) selling scrap material, and (8) using
renewable energy.
SME category Staff headcount Turnover Balance sheet totalMedium < 250 ≤ 50 million ≤ 43 millionSmall < 50 ≤ 10 million ≤ 10 millionMicro < 10 ≤ 2 million ≤ 2 million
Table 2 SME definition (European Commission, 2020)

22 Thomas Steenbrink – Radboud University – 2021
All eight resource efficiency actions will be analysed by making 1 variable out of these eight
actions. This means that for the dependent variable, all eight resource efficiency actions will be
used in the analysis by calculating a sum score. This will be created to get a scale level variable
which can be used in a linear regression analysis. Not all SMEs in the dataset did implement
environmental actions, the analysis by the Flash Eurobarometer 456 showed that around 15%
did not implement any environmental actions. This indicates that the dataset is skewed; so, this
should be considered when drawing conclusions from the data.
3.2.2 Independent variable
The independent variable is defined based upon the concept of financial support. As stated in
Chapter 2, this is divided into public and private financial support. Public financial support is
defined as public financial support, and private financial support is defined as financial support
by family or friends. The Flash Eurobarometer 456 also makes this distinction between public
financial support and support from family and friends (European Commission, 2018). The Flash
Eurobarometer 456 defines this as Public funding such as grants guarantees and loans, and
Private funding from friends and relatives.
3.2.3 Moderating variable
The concept of the moderating variable is based upon the institutional environment. As Sun,
Edziah, Sun and Kporsu (2019) found that a strong institutional environment leads to an
increase in investments into efficiency practises (Sun, Edziah, Sun, & Kporsu, 2019). The Flash
Eurobarometer 456 investigated the main barriers SMEs bump into when implementing
resource efficiency actions. They found eight main barriers for SMEs: (1) complexity of
administrative or legal procedures, (2) cost of environmental actions, (3) difficulty to adapt
environmental legislation, (4) lack of specific environmental expertise, (5) technical
requirements of the legislation not being up to date, (6) difficulty in choosing right efficiency
actions, (7) lack of demand for resource efficient product, (8) lack of supply of required
materials. The results of the Flash Eurobarometer 456 showed that the main barrier is a weak
institutional environment, namely, complexity of administrative or legal procedures. This is
used as a proxy for the institutional environment as q7.1 ‘’Complex procedures’’. Considering
the theoretical background regarding the barriers for implementing resource actions as
described in Chapter 2, this is taken as a proxy for the institutional environment used as
moderating variable.

23 Thomas Steenbrink – Radboud University – 2021
3.2.4 Control variables
A control variable is a variable that is being held constant during the analysis (Hair, Black,
Babin, & Anderson, 2019). This variable is not the main interest of the study; however, it could
influence the main investigated relationship. Mc Namara & O Donohoe (2013) argued that firm
size could be of influence on the main relationship between financial support and resource
actions. They claimed that smaller businesses had greater difficulty acquiring financial help
than larger businesses which is also supported by the theoretical framework (Mc Namara & O
Donohoe, 2013). Stoian and Gilman (2017) used firm age, since they discovered that older
firms had more established firm capabilities to acquire capital and invest firm resources more
efficiently than newly established firms (Stoian & Gilman, 2017). Moreover, they used the
sector of the company as a control variable, since they found that this could influence the
relationship as well. This is also found by Perrini, Russo, and Tencati (2007) and Russo and
Tencati (2008), they discovered that resource actions differ among firms in different sectors
(Perrini, Russo, & Tencati, 2007) (Russo & Tencati, 2008). In addition, it is argued that SMEs
face difficulties in attracting financial resources due to the resources SMEs naturally possess
and the credit risk that is linked to this (Bakos, Siu, Orengo, & Kasiri, 2019) (Cecere, Corrocher,
& Mancusi, 2020). Thus, it is argued that the current financial state of a SMEs can influence
the attraction of financial support. Therefore, looking at the database, turnover is taken into
account as the last control variable. To conclude, Marinescu (2013) conducted a comparison
study within the geographic context of Europe (Marinescu, 2013). He found significant
differences between the institutional regions that influence the business environment.
Therefore, the institutional regions of Europe are considered as a control variable.
This results in the following control variables:
- Firm size
- Firm age
- Industry
- Turnover
- European country clusters
3.3 Analytical technique
To test the formulated hypotheses, an appropriate analytical technique should be picked. Based
on the available dataset, a multiple regression analysis will be conducted. Multiple regression
analysis is a statistical method used to examine the relationship between a single dependent

24 Thomas Steenbrink – Radboud University – 2021
variable and several independent variables in a general linear model (Hair, Black, Babin, &
Anderson, 2019, p. 260). So, there is a criterion variable (dependent variable) and several
predictors (independent variables) that are used to predict the dependent variable. The
regression analysis weights the different independent variables to find the maximal prediction
of the dependent variable. This results in different weightings, which display the individual
contribution to the prediction of the dependent variable by every independent variable. The
complete set of weightings are called the regression variate, which is a linear combination of
all independent variables that best predict the dependent variable. The general form of the
multiple regression equation for a total population is as followed (Hair, Black, Babin, &
Anderson, 2019, p. 260):
The dependent variable Y in this equation is predicted by the intercept β0 and the independent
variables are represented by the different X’s. The ε stands for the error term.
There are some assumptions that need to be addressed when conducting a multiple regression
analysis, these assumptions are evaluated in Chapter 4 and modifications are made when
needed:
- Variables are metrical measured,
- Linear relationship between dependent and the independent variables,
- Residuals are normally distributed,
- No multicollinearity,
- Homoscedasticity.
As addressed in the previous section, the dependent variable in this study is calculated by taking
the sum of q1.1 to q1.8 into a new variable named SME Resource actions (SME_RA). For the
independent and moderating variables, the dataset measured it on a dichotomous scale, yes or
no, on the questions regarding public or private financial support. For the analysis, independent
variables q6.1 ‘’Public financial support’’ and q6.3 ‘’Private financial support’’ are used.
Variable q7.1 is used as moderating variable ‘’Complex procedures’’.
The control variables are measured on different scales. Firm size is measured on an ordinal
scale representing the different levels of SME size, ranging from micro ‘’1 to 9 employees’’, to
small ‘’10 to 49 employees’’ up until large SME ‘’50 to 249 employees’’ and one category up

25 Thomas Steenbrink – Radboud University – 2021
‘’more than 250 employees’’. The latter category is excluded since this represents firms that lie
outside the definition of SMEs. This control variable is recoded into dummy variables Micro,
Small, and Medium. Firm age is measured on an ordinal level, asking in what year the company
was established categorized in 4 different categories. This is also recoded into a dummy
variable, for firms founded before 2010 and firms founded after 2010. This is based on a data
driven explanation. The 4 categories are not evenly distributed, since the first category ‘’firms
established before 2010’’ accounts for 84.5% of the cases. The second category enhances firms
between 2010 and 2013, the third is between 2013 and 2017, and the fourth 2017 and up. So,
these unevenly distributed answer categories together with the skewness of firms founded
before 2010, resulted in the two dummies as described above.
The sector variables are on an ordinal scale, ranging in four categories, which are also recoded
into four dummies, namely, Manufacturing, Retail, Services, and Industry. These four
categories are based upon the definition from the Statistical Classification of Economic
Activities in the European Community, mostly referred to as the NACE codes (Commission of
the European Communities, 2008). This is a widely used industry standard classification
scheme. The sector Manufacturing comprises NACE code C: Manufacturing. The sector Retail
covers NACE code G: Wholesale and Retail Trade. The sector Services comprises NACE codes
H: Transportation and Storage, I: Accommodation and Food Service Activities, J: Information
and Communication, K: Financial and Insurance Activities, L: Real Estate Activities and M:
Professional, Scientific and Technical Activities. The sector Industry contains NACE codes B:
Mining and Quarrying, D: Electricity, Gas, Steam and Air Conditioning Supply, E: Water
Supply; Sewerage, Waste Management and Remediation Activities and F: Construction.
Turnover is measured on an ordinal scale, from ‘’100 000 euros or less’’ up until ‘’More than
50 million euros’’. This resulted in a variable with 5 levels. If companies exert the upper
boundaries of the definition regarding SMEs, they will be excluded from the sample since this
is out of the scope of this thesis.
The European regions are used as control variables and included as dummies. This is based on
the geographical regions by the UNSD (UNSD, 2020). The institutional regions are West
Europe, Central Europe, North Europe, East Europe, South Europe, and Southeast Europe.

26 Thomas Steenbrink – Radboud University – 2021
All these variables are made applicable for using multiple regression analysis. However, for
conducting multiple regression analysis, some assumptions should be met which will be
addressed in the following Chapter 4: Results (Hair, Black, Babin, & Anderson, 2019).
3.4 Research ethics
This research is carried out adhering to the main principles that are defined by the Netherlands
Code of Conduct for Research Integrity (2018). This institute defined five principles that
researchers should follow when conducting research, these five principles are: (1) honesty, (2)
scrupulousness, (3) Transparency, (4) independence, and (5) responsibility (KNAW; NFU;
NWO; TO2-federatie; Vereniging Hogescholen; VSNU, 2018). This research followed these
five principles with great care.
The data that has been used in this report is derived from the database belonging to the Flash
Eurobarometer, Kantar TNS Political & Social. The Kantar TNS Political & Social conducted
this research on behalf of the European Commission. The researchers of Kantar TNS Political
& Social assures their research integrity, and their analytical process and findings are closely
monitored by the European Commission. The validity of their research is guaranteed since they
conduct around 1000 interviews per country via the telephone, nevertheless, it should be noted
that the sample sizes for the smaller European countries were less, which necessitates caution
when interpreting the results (European Commission, n.d.). In Chapter 4, after the missing data
analysis and descriptive statistics, these considerations will be further elaborated.
As previously addressed, the data has already been gathered by Kantar TNS Political & Social
which means that the researcher had no influence on the data gathering process. The dataset is
made freely available by the European Commission. The researcher can assure that the data
analysis and the results and conclusions that follow have not been harmed nor manipulated. It
can be guaranteed that the data has not been distorted according to the ethics of the researcher.
The dataset that has been used in the analytical process will be stored online and made freely
available for interested parties via www.researchgate.net.
27 Thomas Steenbrink – Radboud University – 2021
Chapter 4: Results The analysis' findings will be presented in this chapter. First, some descriptive statistics are
presented, and then the chapter moves on to evaluating the regression analysis' assumptions.
The chapter concludes with a test of the hypotheses that have been proposed.
4.1 Descriptive statistics
The total questionnaire of the Flash Eurobarometer is conducted among 15,019 companies. The
analysis started with excluding the companies that were out of the boundaries regarding the
definition of an SME, and countries that were out not of European origin. So, cases that exerted
the boundary of 250 employees or more than 50 million in turnover or were not of European
origin have been deleted. This resulted in a total dataset of 14,401 valid cases to conduct the
analysis with. From the dataset, a subsample is taken. This is done to only include cases that
have a score on the independent variables. This is executed since the analysis should only
incorporate the cases that have gotten external support, to compare the effect from private or
public entities on SME Resource Actions. By this alteration, the subsampled dataset is reduced
to N = 2744 cases. The following analysis has been conducted through this subsample dataset.
The dataset comprises 36 different European countries. The countries are not evenly divided
throughout the sample, all the descriptive analysis dataset can also be found in Appendix 2:
Descriptive analysis. The companies in these countries were divided into four different sectors,
this was quite evenly distributed from 18% in the sector Industry, 26.2% in Manufacturing,
27.2% in Services towards 28.7% in sector Retail. Moreover, the size of the companies in the
dataset is divided into the grouping related to the SME definition, here, the category of Small
has a share of 40.5% whereas Micro and Medium have a share of 29.2% and 30.3%.
To continue the analysis, the SME Resource Actions need to be summed up into one variable
as stated in Chapter 3: Methodology. It is determined whether this is achievable by calculating
the Cronbach's alpha for all eight elements. The Cronbach's alpha output is relatively low;
nevertheless, this is not a concern since the eight items are all responses to potentially
implemented resource actions and clearly indicate the construct. By taking the sum score of the
eight items, a more reliable test can be conducted via multiple regression analysis. The Inter-
Item Correlation Matrix shows exclusively positive and significant scores, and the Item-Total

28 Thomas Steenbrink – Radboud University – 2021
Statistics show that no item will significantly increase the Cronbach’s alpha when deleted.
These different tables are shown in Appendix 2: Descriptive analysis.
Table 3 Reliability Statistics, Cronbach's Alpha
After the alteration of the variable SMEs Resource Actions (SME_RA), a missing value
analysis has been conducted. The missing value analysis takes into consideration all of the
original variables that were applied in this study. The used variables were:
• TNS COUNTRY ID (tnscntry)
• Employee size (scr10t)
• Industry sector (nace_b)
• Turnover (scr14)
• SME_ResourceActions
• Public financial support (q6.1)
• Private financial support (q6.3)
• Complex procedures (q7.1)
The output of the missing value analysis showed that the missing values were not missing
completely at random, Little’s MCAR test results were χ2 = (20, N = 2352) = 60.909, p < 0.001.
As a result of this significant finding, the missing value analysis was carried out more precisely
to determine which variables were missing. The variable Turnover (scr14) was missing in
14,1% of the cases, which exceeds the boundaries of 10% missing’s that are neglectable.
Crosstabulations were made to see if scr14 is missing at a specific group of variables. The
analysis of the crosstabulation resulted that younger companies, founded after 1 January 2017,
had more missing values on average since only 15.8% of these cases had a score on turnover.
This has some consequences for the multiple regression analysis interpretation; what these
consequences are will be discussed when evaluating the multiple regression analysis results.
The regression analysis has been executed with listwise deletion; this is done since the missing
values were for the nominal variable Turnover. For this variable, the missing values could not
be replaced by an imputation score since the variable was neither metric nor ordinal. The tables

29 Thomas Steenbrink – Radboud University – 2021
and outcomes of the missing value analysis can be found in Appendix 3: Missing value analysis.
By using listwise deletion, the multiple regression analysis has been executed with 2719 valid
cases.
4.2 Assumptions
In order to execute a multiple regression analysis, it is necessary to examine certain elements
of the data that will be used. Hair, et al. (2019) defined four key aspects that need to be addressed
beforehand: 1) normal distribution of variables, 2) potential outliers, 3) adequate sample size
and 4) presence of multicollinearity (Hair, Black, Babin, & Anderson, 2019). After these
assumptions, the four regression assumptions will be checked.
Normal distributions of variables
Within SPSS, it can be checked if the variables that are being used are normally distributed.
Hair, et al. (2019) state that normality of the variables can be checked via the skewness and the
kurtosis values of the variable. However, in the current analysis, only the dependent variable is
of continuous nature, all other variables are dummified or binary variables. Therefore, only the
variable SME_RA will be checked for normality. Looking at the skewness- and kurtosis values
and their corresponding standard error values, it can be concluded that SME_RA is not normally
distributed. The values of normality lie beyond the boundaries of two times the standard
deviation, moreover, the Kolmogorov-Smirnov linearity test is found significant which means
that the data is not normally divided. The Kolmogorov-Smirnov test indicates that SME_RA is
not normally distributed, D (2744) = 0.947, p < 0.001.

30 Thomas Steenbrink – Radboud University – 2021
Table 4 Descriptives SME_RA
Table 5 Test of Normality, Kolmogorov-Smirnov test
This conclusion is also confirmed by the histogram, it shows that it is slightly skewed towards
the right. The output and graphic results can be found in Appendix 4: Normality test. The
variable SME_RA is transformed into different variables to check if the test of normality
changed towards a normal distribution. SME_RA is transformed by taking the inverse, square,
square root, and the log transmission. The results showed that the test of normality remained
significant, therefore, still no normality is found in the variable. Moreover, taking the skewness
and kurtosis and their standard errors into account of the transformed variables, the test of
normality remained exceeding the boundaries of two times the standard deviation. Therefore,
the original variable SME_RA will remain in the analysis since this increases the power and
interpretability of the outcomes compared to the transformed variables.
Potential outliers
To see if there are any outliers in the data, a boxplot is made. This is only done for the dependent
variable SME Resource Actions since all other variables are dummified. Because the boxplot
for SME RA shows no outliers, the conclusion is that there are no significant outliers in the

31 Thomas Steenbrink – Radboud University – 2021
dataset that might impact the results of the multiple regression analysis. The boxplot is shown
in Appendix 5: Boxplot SME_RA.
Adequate sample size
To conduct a multiple regression analysis, there is the assumption that every independent
variable should have at least 10 observations, 15 or 20 is most desired (Hair, Black, Babin, &
Anderson, 2019). These numbers of observations boost the strength and generalizability of the
findings. In this analysis, there are five independent variables, therefore, a sample of 5 * 20 =
100 should be sufficient. The total dataset comprises 2719 valid cases, so it can be concluded
that the size of the sample is adequate for conducting a multiple regression analysis.
Presence of multicollinearity
When a multiple regression analysis will be executed with more than 2 independent variables,
multicollinearity must be absent in the direct and indirect variables. SPSS can compute several
collinearity statistics, VIF-values, and tolerance statistics. The VIF-value shows if there is a
strong linear relationship with the other variables and should be < 10 (Hair, Black, Babin, &
Anderson, 2019). The tolerance statistics should not exceed > 1 and be > .10. The output of
SPSS showed that multicollinearity is absent. The VIF-value of q6.1 and q6.3 were 1.054 and
1.029 with the corresponding tolerance statistics of .948 and .972. The output can be checked
in Appendix 6: Multiple regression analysis. The conclusion is drawn that there is no presence
of multicollinearity.

32 Thomas Steenbrink – Radboud University – 2021
Table 6 Descriptive statistics all included variables.

33 Thomas Steenbrink – Radboud University – 2021
Table 7 Pearson's correlation

34 Thomas Steenbrink – Radboud University – 2021
After that, the correlations will be examined to see if any relationships can be found. Pearson
Correlation is used to see the relations between the variables and the dependent variable
SME_RA. The results show that q6.1 ‘’Public financial support’’, have a positive weak
correlation r (2718) = 0.070; p < 0.001, whereas q6.3 ‘’Private financial support’’, do not show
any significant correlation r (2718) = 0.012; p = 0.517. The moderating variable q7.1 ‘’Complex
procedures’’, showed a positive significant result on SME_RA (r (2718) = 0.139; p < 0.001).
These previous four assumptions are evaluated before the analysis, the multiple regression
analysis also comprises four assumptions these are discussed from now onwards. The following
assumptions need to be checked before the regression output can be interpreted: 1)
homoscedasticity, 2) linearity, 3) independence of error term, and 4) normality of the error term
distribution (Hair, Black, Babin, & Anderson, 2019).
Homoscedasticity
The assumption of homoscedasticity is checked via the scatterplot. In this plot, the predicted
value and residual values are displayed. The scatterplot should not contain a funnel or pattern,
in this analysis this is not the case. All dots are evenly dispersed, and no pattern is found. The
conclusion is made that there is no sign of homoscedasticity, and therefore, the data is
heteroscedastic.
Figure 2 Scatterplot

35 Thomas Steenbrink – Radboud University – 2021
Linearity
The previously used scatterplot is also used to check the data for linearity. If there is a
systematic pattern between the predicted values and the residuals, the data is not linear. The
data is linear because there is no pattern found and the data is evenly distributed around the zero
value on the y-axis.
Independence of error term
The statistics of the error terms are being used to check whether the errors in the analysis are
not related. This is checked in Table 8: Residuals Statistics, the values for the standardised
predicted value should show a mean of 0 and a standard deviation of 1. The output shows these
values; therefore, the error terms are independent in this regression analysis.
Table 8 Residuals Statistics
Normal distribution
The last assumption before the interpretation of the multiple regression analysis is the normal
distribution. This can be checked in two ways, P-P plot, and looking at the skewness and
kurtosis. The P-P plot shows the probability that the used dataset is normally distributed, which
is checked by looking at the dots following the straight black line. When the dots follow the
line, normality is checked in the data. Looking at the P-P plot, it goes in the beginning a bit
below the line, where in the end it goes on top of the line. However, the deviations are not that
significant. The second option is to calculate if the kurtosis divided by the standard error of the
kurtosis lies within +3 or -3, this is done in paragraph 4.2: Assumptions.

36 Thomas Steenbrink – Radboud University – 2021
Figure 3 Normal P-P Plot
Since all assumptions are checked and proven sufficient, the multiple regression analysis can
be interpreted.
4.3: Regression analysis
To see how the correlations are related to the dependent variable SME_RA, a multiple
regression analysis is executed. This is done via several blocks, to see how the models change
when additional variables are added. In the first model, all control variables are added. After,
in model two, the direct effect is added. So, q6.1 and q6.3 are added. The third model comprises
the previously added variables as well as the moderating variable q7.1. For the fourth and last
model, the interaction terms are added of q7.1 on q6.1 and q6.3.
The ANOVA table shows that all four models are significantly better in predicting regression
outcome (F (11, 2707) = 12.955; p < 0.001). The model summary indicates how much of the
whole model is explained by the various building blocks, as well as if the differences between
the models are significant.

37 Thomas Steenbrink – Radboud University – 2021
Table 9 ANOVA table
Table 10 shows that the first three models are significant while the fourth is not (F (2, 2702) =
0.041, p = 0.960). This result means that the first three models can be used for interpretation
and for further interpretation the fourth is left out of the analysis. Moreover, in the first model,
with only the control variables, the predictive capacity is 9.1% (R2 = 0.091). When adding the
direct effects, the predictive capacity slightly increases towards 9.6% (R2 = 0.096). In the third
model, the moderators are added, this results in an increase of 2% towards an overall predictive
capacity of 11.6% (R2 = 0.116).
Table 10 Model Summary multiple regression analysis
The regression coefficients are interpreted from the third model since this model has the highest
predictive capacity F (16, 2702) = 22.190, p < 0.001, R2 = 0.116.

38 Thomas Steenbrink – Radboud University – 2021
Variable Model I Model II Model III Model IV
Regression coefficient (std error)
Regression coefficient (std error)
Regression coefficient (std error)
Regression coefficient (std error)
(Constant) 5,412 5,295 5,115 5,116
(0,000) (0,000) (0,000) (0,000) Founded_before_2010 0,083 0,099 0,106 0,106
(0,396) (0,314) (0,276) (0,0275) Sector_Retail -0,320 -0,301 -0,291 -0,291
(0,001) (0,002) (0,002) (0,002) Sector_Service -0,576 -0,559 -0,548 -0,548
(0,000) (0,000) (0,000) (0,000) Sector_Industry -0,257 -0,253 -0,289 -0,289
(0,015) (0,017) (0,006) (0,006) SizeMicro -0,509 -0,490 -0,483 -0,483
(0,000) (0,000) (0,000) (0,000) SizeSmall -0,216 -0,210 -0,193 -0,194
(0,014) (0,018) (0,027) (0,027) Central_Eu -0,234 -0,265 -0,300 -0,300
(0,033) (0,015) (0,006) (0,006) Northern_Eu -0,378 -0,353 -0,342 -0,342
(0,001) (0,001) (0,001) (0,001) Eastern_Eu -0,868 -0,897 -0,978 -0,978
(0,000) (0,000) (0,000) (0,000) Southern_Eu -0,178 -0,150 -0,163 -0,162
(0,118) (0,185) (0,148) (0,149) South_East_Eu -1,182 -1,192 -1,224 -1,224
(0,000) (0,000) (0,000) (0,000) Turnover_Mic -0,285 -0,309 -0,307 -0,307
(0,002) (0,001) (0,001) (0,001) Turnover_Small -0,168 -0,185 -0,208 -0,208
(0,082) (0,056) (0,030) (0,030) q6.1 Public financial support 0,272 0,201 0,195
(0,000) (0,008) (0,054) q6.3 Private financial support 0,304 0,263 0,275
(0,029) (0,056) (0,138) q7.1 Complex procedures 0,547 0,545
(0,000) (0,000) PublicSup X ComplexProc 0,013
(0,931) PrivateSup X ComplexProc -0,025
(0,927) R Square 0,091 0,096 0,116 0,116 (0,000) (0,000) (0,000) (0,992)
Table 11 Coefficients model 3

39 Thomas Steenbrink – Radboud University – 2021
The first model contained the control variables. The direct and moderation effect are added later
to see how this affect the relation while the control variables are in place. The control variables
gave some interesting results. The sectors Industry (B = -.289, p < 0.01), Retail (B = -.291, p <
0.01) and Service (B = -.548, p < 0.001) all had negative coefficients in comparison with the
reference sector Manufacturing which is let out of the analysis. The age of the firms did not
have any influence, since the variable ‘’Founded before 2010’’ showed no significant result in
reference to younger firms founded after 2010 (B = 0.106, p = 0.276). The size of the companies
did influence the prediction, Micro size firms had a lower score for SME_ResourceActions (B
= -.483, p < 0.01) in comparison with Medium sized firms. The category Small sized firms had
also a significant negative effect (B = -.193, p < 0.05). This means, that smaller firms have
fewer resource actions implemented in comparison to medium sized firms.
Looking at the different European regions, South-East Europe (B = -1.224, p < 0.001) and East
Europe (B = -.978, p < 0.001) both had a significant negative regression coefficient compared
to the reference dummy West Europe. The region North Europe (B = -.342, p < 0.01) had a
significant negative result in reference to West Europe. Moreover, Central Europe also had a
significant negative effect (B = -.300, p < 0.001). Taking a look at the turnover, the dummies
Turnover Micro (B = -.307, p < 0.01) and Turnover Small (B = -.208, p < 0.05) both had
negative significant regression coefficients compared to firms with Turnover Medium. The
table corresponding to these statistical outcomes of model 3 can be found in Appendix 6:
Multiple regression analysis.
The direct effect was found significant for variable q6.1 ‘’Public financial support’’, with an
unstandardized regression coefficient B = .201, p < 0.01. This means that hypothesis H1a is
accepted, public financial support positively impacts SMEs’ resource actions. The second direct
effect of q6.3 ‘’Private financial support’’ also significantly predicts the dependent variable
SME_ResourceActions, B = 0.263, p < 0.05. This conclusion is based upon the fact that the
hypothesised direction is one-tailed. In the case of a one-tailed hypothesis, the significance
should be divided by two (2) since the regression output is two-tailed. Therefore, private
financial support does positively impact SMEs’ resource actions. Moreover, the second
hypothesis H2 is accepted. This is based upon variable q7.1 ‘’Complex procedures’’ which is
used as a proxy for the institutional environment, B = 0.547, p < 0.001. So, a more complex and
institutionalised environment results in more implemented resource actions at SMEs in Europe.

40 Thomas Steenbrink – Radboud University – 2021
The moderation effect had no effect given the insignificance of the fourth model where the
interaction terms were included. This means that hypothesis H3a and H3b are both rejected.
The following hypotheses are accepted and rejected based on the drawn hypotheses:
Hypotheses B Sig (p - value) Accepted/ Rejected Direct effect H1a Public financial support 0,201 < 0,01 Accepted H1b Private financial support 0,263 < 0,05 Accepted Direct moderator effect H2 Complex procedures 0,547 < 0,001 Accepted Moderation effect
H3a Public financial support X Complex Procedures No significant model Rejected
H3b Private financial support X Complex Procedures No significant model Rejected
Table 12 Hypotheses overview after multiple regression analysis

41 Thomas Steenbrink – Radboud University – 2021
Chapter 5: Discussion This chapter will discuss the hypotheses that were formulated and the results of the multiple
regression analysis. Furthermore, the findings are compared to theoretical findings, and
interpretations for the results are provided.
5.1: The impact of financial support on SMEs resource actions
The direct effects that are tested in this study were public financial support and private financial
support that positively impacts SMEs resource actions.
Throughout the years, several scholars have investigated the relation of public financial support
on the adoption of resource actions by SMEs. The main findings were that public financial
support increases the adoption and implementation of resource actions (Wang & Zhang, 2020)
(Blundel, Monaghan, & Thomas, 2013) (Clement & Hansen, 2003) (Lee, Walker, & Zeng,
2017) (Rademaekers, et al., 2012). However, these previous studies had a slightly different
research context, this study was focused on SMEs within Europe. After the analysis, the results
showed that there was a significant relationship between public financial support and the
implemented resource actions by SMEs. This indicates that the findings of the multiple
regression study matched the theoretical framework on this relationship that has been identified.
Zooming in on the second direct effect, that of private financial support. Research showed that
based on barriers that SMEs face when applying for public or bank based external financial
support, these firms shift towards private forms of support (Zhu, Wittmann, & Peng, 2012)
(Hussain, Millman, & Matlay, 2006). Due to this shift, SMEs are relying on different sources
of financial support to implement resource actions. The studies found, provide evidence that
this private form of financial support results in resource actions implemented by SMEs (Bakos,
Siu, Orengo, & Kasiri, 2019) (European Commission, 2018) (Forkuoh, Li, Affum-Osei, &
Quaye, 2015). The results of this study were in line with the reasoning of these aforementioned
scholars, therefore, the theory regarding the effect of private financial support on resource
actions is confirmed.

42 Thomas Steenbrink – Radboud University – 2021
5.2: The effect of the institutional environment
The moderation effect is split up in two, a direct effect on SME resource actions and a
moderation effect on the previously described main effects. First, the direct effect will be
elaborated and after, the moderation effects will be discussed.
The direct effect is based upon evidence that Sun et al. (2019), Arbolino et al (2017) and
Marinescu (2013) found. These scholars argued that strong institutions positively influence the
availability and implementation of resource actions by SMEs. These strong institutions make it
easier for SMEs to obtain financial support and helps them to implement resource actions.
Based upon this reasoning, it was expected that the institutional environment increases the
implemented resource actions by SMEs. The analysis showed that the direct effect of the
institutional environment positively influenced the implemented resource actions by SMEs and
is therefore in line with the theoretical reasoning.
Taking a look at the indirect moderation effect, the literature clearly showed that the theorised
direct relations are influenced by strong formal institutions. Marinescu (2013), Mc Namara &
O Donohoe (2013), and the OECD (2017) found that unstable, unreliable, and a weak
institutional environment negatively influence the availability of financial support towards
SMEs (Marinescu, 2013) (Mc Namara & O Donohoe, 2013) (OECD, 2017). Besides,
Lindenberg (2014), Polzin et al. (2016), Polzin (2017) and Arbolino & Boffardi (2017) have
found that a strong institutional environment enhances the availability of private as well as
public financial support towards SMEs in implementing resource actions (Lindenberg, 2014)
(Polzin, Flotow, & Klerkx, 2016) (Polzin, 2017) (Arbolino & Boffardi, 2017). This means that
the main effects of public and private support are moderated by the institutional environment.
Surprisingly, the results of the analysis did not show this theorised effect. The fourth model
showed that this moderation effect was insignificant, and, therefore, could not be interpreted.
The theorised relations were based upon the theory brought up by Lindenberg (2014), Polzin et
al. (2016), Polzin (2017) and Arbolino & Boffardi (2017), however, in the analysis, this is
reflected as complex procedures. This is based upon the reasoning by Shanmugam (2020), who
found that governmental rules and law had a positive effect on the availability of domestic
investment, public as well as private (Shanmugam, 2020). Within the analysis, this is reflected
by variable q7.1: Complex procedures. However, complex procedures could also constrain
SMEs in obtaining financial support, which is in turn found by Luca (2016), who found that

43 Thomas Steenbrink – Radboud University – 2021
complex and bureaucratic institutions constrain the availability and distribution of financial
support towards SMEs (Luca, 2016). This reasoning contradicts the previously found
moderating relationship which is tested in the analysis. Moreover, Skjærseth, Stokke &
Wettestad (2006) found that soft law is more successful in encouraging firms to implement
resource actions, instead of hard law (Skjærseth, Stokke, & Wettestad, 2006). More recently,
this is also found by Pickering, McGee, Karlsson-Vinkhuyzen and Wenta (2018). They found
that softer norms and regulations stimulate firms to increase their environmental expenditures
and initiatives. Also, they found that strict norms and law enforcement require long and hard
negotiations which result in a decrease in resource actions since all parties need to agree with
the targets set by the governments (Pickering, McGee, Karlsson-Vinkhuyzen, & Wenta, 2019).
This counter the arguments brought up by the earlier scholars that stated that more strict laws
and regulations increase resource actions, which explains the insignificant effect of the
moderation relation.
Furthermore, the insignificant effect could also be explained by a more data driven argument.
The insignificant effects could be explained by the fact that all variables were binary measured.
This made calculating the interaction terms exceedingly arbitrary, leaving little opportunity for
interpretation as to how hard the legal or administrative procedures were for the companies.
Only when a company answered yes on the question if they encountered complex procedures
when setting up resource actions, they were included in this analysis. This made it harder to
examine possible issues and limited the interpretation.
5.3: Control variables
The control variables showed some interesting results. All control variables were included in
the multiple regression analysis via dummies. The first control variable was based on the
theoretical grounds brought up by Stoian and Gilman (2017), they found that compared to
newly founded firms, older firms have more established internal skills and processes to attract
capital and divide company resources more efficiently (Stoian & Gilman, 2017). The output
showed that there was an insignificant result, therefore, there is no difference found between
the age of the firms and the implemented resource actions. This can be ascribed to the fact that
the population of companies that were founded after 2010, was very small. The dummy founded
before 2010 consisted of 2012 cases, while the dummy related to the firms founded after 2010,
so the younger firms, only had 337 cases. This overrepresentation of older firms could have led
to an insignificant result.

44 Thomas Steenbrink – Radboud University – 2021
The sectors where the firms are operating in were added as a second control variable. This was
based upon the theoretical foundation by Perrini, Russo, and Tencati (2007), and Russo and
Tencati (2008). They found that resource actions differ among firms in different sectors
(Perrini, Russo, & Tencati, 2007) (Russo & Tencati, 2008). The dataset contained four different
sectors, manufacturing, retail, services, and industry. Manufacturing was taken as the reference
category. All three sectors that were included in the regression model, showed significantly
lower values for implemented resource actions compared to the reference group of
manufacturing. These differences can be contributed to the nature of the sectors. It may be
easier to deploy more and diverse resource actions in a manufacturing environment. In the
manufacturing sector, for example, it may be easier to change the manufacturing process to
save water and materials than in the retail sector, where such changes are not feasible. This
denotes that this result should be regarded with caution.
Furthermore, the size of the companies could be influencing the resource actions taken by
SMEs, this is based upon the study by Mc Namara & O Donohoe (2013). They claimed that the
link between financial support and environmental practices might be influenced by the size of
the company. They believe that smaller businesses have greater challenges in receiving
financial backing than larger businesses, which is also supported by the theoretical framework
in Chapter 2 (Mc Namara & O Donohoe, 2013). In the regression model, this is divided upon
the categories belonging to the SME definition of micro, small and medium firms. In this case,
size medium is taken as the reference category. The results of the analysis showed that both
micro and small sized firms have a lower score on de resource actions taken by SMEs, which
is in line with the reasoning by Mc Namara & O Donohoe (2013). This result is also in line with
the reasoning brought up by Adomako (2019), who calls this the liability of newness (Adomako,
Amankwah‐Amoah, Danso, Konadu, & Owusu‐Agyei, 2019). Younger firms have fewer
resources and internal processes in place due to their limited experience. This causes that it is
harder for these younger firms to apply for financial support as well as to implement resource
actions.
In contrary to the moderating variable, the control variables of the five institutional regions of
Europe did show some interesting results. To include the institutional regions of Europe is based
upon work by Marinescu (2013), who conducted comparative research in the context of
Europe's institutional regions. He investigated the differences between the Central, Eastern and
Western European business environment. The findings showed considerable disparities in the

45 Thomas Steenbrink – Radboud University – 2021
institutional areas that have an impact on the business climate (Marinescu, 2013). These
differences are also seen after the regression analysis. All four regions showed a negative result
compared to the reference category Western Europe. This is in line with the findings by
Marinescu (2013), where the business environment of West Europe showed significant
differences with the other regions. This means that the institutional environment in West Europe
is the most favourable for implementing resource actions, while the institutional context of
Southeast Europe is the least favourable. The reason why the dummy did show significant
results, while the moderating variable q7.1 Complex procedures did not show any result could
be explained by the institutional theory brought up by North (1991) and extended by Scott
(2001). They both conceptualise the institutional context as a mix of formal as well as informal
rules and ways to behave. This is much broader than the formal concept that is taken by q7.1
Complex procedures. The dummy variable of the European regions is much broader and
exceeds the formal part that is captured by variable q7.1 Complex procedures.
At last, turnover is used as a control variable. Based upon arguments brought up by Bakos et
al. (2019) and Cecere et al. (2020), it is harder for SMEs to attract financial support (Bakos,
Siu, Orengo, & Kasiri, 2019) (Cecere, Corrocher, & Mancusi, 2020). This is because SMEs
have a unique organizational structure. SMEs, overall, do not disclose company strategies or
annual reports, making them less transparent than multinational corporations. After the
analysis, the same outcome is found for the dummy micro turnover and the dummy small
turnover. These dummies are related to the SME turnover definition of micro and small size
firms. These dummies showed a significantly lower score for implemented SMEs resource
actions in comparison with the reference category medium sized firms which is in line with the
theoretical findings.

46 Thomas Steenbrink – Radboud University – 2021
Chapter 6: Conclusion This chapter examines the entire study, as well as the results reached and the consequences for
theory and practice. Furthermore, the limitations will be discussed, and the chapter will
conclude with recommendations for further research.
6.1: Findings of the study
Given the growing pressures towards governments to meet the climate agreement of Paris,
incentives are brought up by governments to steer companies to implement sustainable
practises. One of the incentives that are proven effective is that of financial incentives.
However, up to date, most research is focused on how MNEs experience these pressures and
incentives instead of SMEs. This focus is mainly due to the greater physical visibility of MNEs
in comparison with SMEs. Nonetheless, SMEs account for 99% of the business environment in
Europe, which makes the scope of SMEs rather important considering the cumulative amount
of impact on emissions. Furthermore, the characteristics of SMEs greatly differ compared to
MNEs, which is assumed by early CSR literature. This resulted in false assumptions that MNE
sustainability practises can be reapplied to SMEs (Jenkins, 2004) (Spence, 1999) (Lynch-
Wood, Williamson, & Jenkins, 2009). These facts highlight the importance of research in the
field of SMEs and provide the gap on which financial pressures and institutional factors
influence SMEs in pursuing environmental practices considering the scarce resources they
possess naturally.
This study focussed on the financial support that governments place to influence SMEs to
implement resource actions. The theoretical framework dived into the topics of the adoption of
resource actions, financial support, and the influence of the institutional environment. The
concept of resource actions is based upon the stakeholder theory of Freeman (1984). Nowadays
this is transformed into the Triple Bottom Line, which is a three-dimensional concept,
consisting of social, economic, and environmental aspects (Russo M. V., 2008). This concept
can be translated into several specific practices, resource actions, aimed at reducing the impact
of the firm on the environment. These are measures or practises to reduce the environmental
impact of the firm’s operations in different areas under their direct control (European
Commission, 2021). Neves et al. (2014) argue that resource actions are aimed at reducing the
utilisation of resources, simultaneously adding value to the company by achieving its goals. So,
it can be stated that implementing resource actions is a double-edged sword, reducing the

47 Thomas Steenbrink – Radboud University – 2021
impact on the environment while achieving added value for the company (Neves,
Drohomeretski, da Costa, & de Lima, 2014). The following eight resource actions were
evaluated in this study:
- Saving water
- Saving energy
- Using predominantly renewable energy
- Saving materials
- Minimising waste
- Selling your scrap material to another company
- Recycling, by reusing material or waste
- Design sustainable products
There are more incentives that influence firms to implement environmental practices besides
the benefits of resource efficiency. Rademaekers et al. (2012) looked into the most used
incentives by policymakers and came up with three dimensions of incentives; administrative,
economic and reputational incentives (Rademaekers, et al., 2012). They found that economic
and reputational incentives were the most effective. Looking at the financial incentives, it can
be said that there are different forms of incentives. A distinction can be made between public
financial support and private or market-based financial support (Clement & Hansen, 2003)
(Kaya, 2014) (European Commission, 2018) (Oguntoye & Quartey, 2020). Public support
consists of governmental institutions providing capital or tax incentives to help or reinforce the
financial state of SMEs. Private or market-based support incorporates a more diverse set of
different parties that provide financial support. This can either be a bank, financial equity
provider, a sponsor, investors, or relatives. The study found that public financial support
significantly enhances the implementation of resource actions by SMEs (Rademaekers, et al.,
2012) (Blundel, Monaghan, & Thomas, 2013) (Cecere, Corrocher, & Mancusi, 2020).
Moreover, it is also found that due to the limitations SMEs have in obtaining public support,
they shift towards private forms of financial support. To obtain financial support, SMEs mostly
rely on regular bank loans (van der Wiel, Dubovik, & van Solinge, 2019) (Kaya, 2014). The
choice for bank loans is because of the strict financial regulations and risk prevention that other
financial institutions apply to SMEs. However, banks are also conservative in granting SMEs a
loan, due to the organizational structure of SMEs. This barrier of obtaining financial support
results in the shift of financial support towards family members or other relatives (Hussain,
Millman, & Matlay, 2006) (Bakos, Siu, Orengo, & Kasiri, 2019). This other usage of financial

48 Thomas Steenbrink – Radboud University – 2021
support is furthermore investigated in this study, the results showed that also private financial
support by friends and family enhances the resource actions implemented by SMEs.
However, the theory showed that this relationship is influenced by a lack of governmental
legislation. Bakos et al. (2019) and Rademaekers et al. (2012) investigated that legislation is an
improving as well as limiting factor in increasing or decreasing resource actions by SMEs
(Rademaekers, et al., 2012). This is conceptualized as the institutional environment, which is
founded by North (1991) and extended by Scott (2001). The definitions of the institutional
theory by North (1991) and Scott (2001) slightly differ, however, both institutional views are
broadly applied in management science (Kostova, Roth, & Dacin, 2008). Raza et al. (2019)
found that external pressures result in more resource actions implemented by SMEs, this
emphasises the role those formal institutions need to take, to influence SMEs’ environmental
behaviour (Raza, Liu, & Usman, 2019). Moreover, Bakos (2019) identified barriers and drivers
for SMEs in adopting resource actions. They found that the main driver of resource actions for
SMEs is governmental regulations. One of the main barriers identified was a lack of
environmental legislation. This stresses the importance of strong formal institutions in the
implementation of resource actions. However, contrary to the theory, this study showed that
this moderation effect was insignificant. Surprisingly, the dummy variables showed that there
are differences between the European regions that have been controlled for. These dummies
reflected the institutional regions of Europe, which influenced the implemented resource actions
taken by SMEs. The dummy showed that the institutional context of Western Europe is the
most favourable to implement resource actions, while the institutional context of Southeast
Europe is the least favourable.
6.2: Implications
This study has some theoretical and managerial implications for the field of International
Business.
This research is constructed from three different angles, that of resource actions, financial
support, and the institutional environment, all three in the context of European SMEs. The
research concludes that public, as well as private financial support enhances the resource actions
taken by European SMEs. This study puts the focus on two financial support possibilities and
looked at the effects on the implemented resource actions. Given the recent research in the field
of financial support and MNEs, this study has changed the perspective and looked to the matter

49 Thomas Steenbrink – Radboud University – 2021
within the SME European business context. This changes the current perspective while taking
both financial support possibilities into account is a unique contribution to the literature. Also,
this study looked into 8 different general resource actions all across different sectors, while
most literature is focussed on resource actions based on the sector the firms are operating in.
Moreover, adding the institutional environment into the relationship of financial support
broadens the understanding of how SMEs could be influenced and what factors limit or
strengthen them in implementing resource actions.
Furthermore, the study's managerial implications provide that policymakers can now focus on
how to efficiently assign financial support to SMEs in order to meet the Paris climate
agreement's objectives. Policymakers can best assist SMEs in making the transition to more
sustainable practices by adopting the conclusions of this study. Furthermore, SMEs' managers
are aware of which kind of financial support will best assist them in undertaking resource
actions. It supports SMEs in deciding between different sorts of support while keeping in mind
that both types assist them in accomplishing their objectives.
6.3: Limitations
There are certain limitations to this research. These are an important aspect of this study since
this has implications for the interpretation of the methodology and results.
The most prominent limitation of this study was that all variables were datafied into binary
variables. This made it harder to interpret the outcomes clearly since the questions were coded
into yes and no answers instead of continuous variables. All used variables were made into
dummies to conduct a regression analysis, however, due to the binary variables not the full
advantages of the multiple regression analysis could be made. As an example, the binary data
made it unclear how much financial support a company has gotten from a public institution, the
data only showed that a company got support or not. A second limitation was that this thesis
only investigated both public and private financial support, it did not investigate which of the
two options is the most effective. So, this study did not execute a comparison study, no
conclusions are drawn on which type of financial support is the most effective in stimulating
SMEs to implement resource actions. Moreover, the third limitation is the scope of this study.
The scope was SMEs within Europe, however, the Western European countries were overly
represented in the data, while the Eastern European countries were less represented. This
resulted in slightly skewed data however, the countries were taken into account via dummies
50 Thomas Steenbrink – Radboud University – 2021
as control variables. Still, this overrepresentation must be considered. Fourth, the concept of
the institutional environment that has been used as moderator was not included in the analysis
as theorised by North (1991) and Scott (2001). The dataset only contained the variable q7.1
‘’Complex procedures’’, which is used as a proxy for formal institutions, while the informal
institutions that are addressed by these scholars are not included. Moreover, looking at the
statistical limitations, the assumption of normality has not been met for the dependent variable.
The dependent variable is transformed by taking the inverse, square, square root, and the log
transmission. The results showed that the test of normality remained significant, therefore, still
no normality was found in the variable. Since the dependent variable remained skewed, the
original data has been used.
6.4: Directions for future research
Following up on the limitations, various research directions are suggested for future study.
Future research should analyse the found relationships with more continuous data. By
reanalysing the main findings with data that is from a higher measurement level, the main
findings of this study could be confirmed as well as extended by diving into how SMEs use the
different financial support to implement their resource actions and to what extent this is
influenced by the institutional environment. Furthermore, this study dived into two different
forms of financial support, this could be extended by taking a comparison on which type of
financial support works best. This broadens the current knowledge about the prosperity of
financial support from private as well as public institutions. Finally, future research should look
at how much the informal institutional context influences the main relationships.
51 Thomas Steenbrink – Radboud University – 2021
References Abraham, F., & Schmukler, S. L. (2017). Addressing the SME Finance Problem. Malaysia:
Development Research Group, the World Bank.
Adomako, S., Amankwah‐Amoah, J., Danso, A., Konadu, R., & Owusu‐Agyei, S. (2019).
Environmental sustainability orientation and performance of family and nonfamily firms.
Business Strategy and the Environment, 1250-1259.
Alhaddi, H. (2015). Triple Bottom Line and Sustainability: A Literature Review. Business and
Management Studies, 6-10.
Arbolino, R., & Boffardi, R. (2017). The Impact of Institutional Quality and Efficient Cohesion
Investments on Economic Growth Evidence from Italian Regions. Sustainability, 1432.
Bakos, J., Siu, M., Orengo, A., & Kasiri, N. (2019). An analysis of environmental sustainability in
small & medium sized enterprises: Patterns and trends. Business Strategy and the
Environment, 1285–1296.
Blundel, R., Monaghan, A., & Thomas, C. (2013). SMEs and environmental responsibility: a policy
perspective. Business Ethics: A European Review, 246-262.
Bruton, G. D., Ahlstrom, D., & Li, H.-L. (2010). Institutional Theory and Entrepreneurship: Where
Are We Now and Where Do We Need to Move in the Future? Entrepreneurship Theory and
Practice, 421-440.
Cecere, G., Corrocher, N., & Mancusi, M. L. (2020). Financial constraints and public funding of eco-
innovation: empirical evidence from European SMEs. Small Business Economics: An
Entrepreneurship Journal, 285-302.
Clement, K., & Hansen, M. (2003). Financial incentives to improve environmental performance: a
review of Nordic public sector support for SMEs. European Environment, 34-47.
Commission of the European Communities. (2008). Statistical Classification of Economic Activities in
the European Community, Rev. 2. European Commission.
Cungu, A., Cow, H., Swinnen, J. F., & Vranken, L. (2008). Investment with weak contract
enforcement: evidence from Hungary during transition. European Review of Agricultural
Economics, 75-91.
Dvouletý, O., Srhoj, S., & Pantea, S. (2020). Public SME grants and firm performance in European
Union: A systematic review of empirical evidence. Small Business Economics.

52 Thomas Steenbrink – Radboud University – 2021
EDUCBA. (2021, February 9). Financial Institution | Types, Features, Functions of Financial
Institutions. Retrieved from https://www.educba.com/: https://www.educba.com/financial-
institution/
Elkington, J. (1997). Accounting for the Triple Bottom Line. Cannibals With Forks: the triple bottom
line of 21st Century Business, 18-22.
European Commission. (2011). Corporate Social Responsibility: a new definition, a new agenda for
action. Brussels.
European Commission. (2018). Flash Eurobarometer 456 (Small and Medium Enterprises, Resource
Efficiency and Green Markets, wave 4). Brussels: GESIS data archive, Cologne. ZA6917 data
file version 1.0.0, https://doi.org/10.4232/1.12966.
European Commission. (2020). User guide to the SME Definition. Luxembourg: Publications Office
of the European Union, 2020: European Union.
European Commission. (2021, January 28). Best environmental management practice - EU Science
Hub. Retrieved from https://ec.europa.eu/: https://ec.europa.eu/jrc/en/research-topic/best-
environmental-management-practice
European Commission. (2021, January 28). Resource Efficiency - Environment - European
Commission. Retrieved from https://ec.europa.eu/:
https://ec.europa.eu/environment/resource_efficiency/
European Commission. (n.d.). Public Opinion - European Commission. Retrieved from
https://ec.europa.eu/: https://ec.europa.eu/commfrontoffice/publicopinion/index.cfm
Feng, Y. (2001). Political Freedom, Political Instability, and Policy Uncertainty: A Study of Political
Institutions and Private Investment in Developing Countries. International Studies Quarterly,
271-294.
Forkuoh, S. K., Li, Y., Affum-Osei, E., & Quaye, I. (2015). Informal Financial Services, a Panacea for
SMEs Financing? A Case Study of SMEs in the Ashanti Region of Ghana. American Journal
of Industrial and Business Management, 779-793.
Freeman, R. (1984). Strategic Management: A Stakeholder Approach. Pitman, Boston, MA.
Guillamon-Saorin, E., Kapelko, M., & Stefanou, S. E. (2018). Corporate Social Responsibility and
Operational Inefficiency: A Dynamic Approach. Sustainability, 26.
53 Thomas Steenbrink – Radboud University – 2021
Hair, J. F., Black, W. C., Babin, B. J., & Anderson, R. E. (2019). Multivariate Data Analysis.
Hampshire: Cengage Learning EMEA.
Hussain, J., Millman, C., & Matlay, H. (2006). SME financing in the UK and in China: a comparative
perspective. Journal of Small Business and Enterprise Development, 584-599.
Iheonu, C. O. (2019). Governance and Domestic Investment in Africa. European Journal of
Government and Economics, 63-80.
Jenkins, H. (2004). A Critique of Conventional Csr: An SME Perspective. Journal of General
Management, 37-57.
Kaufmann, D., Kraay, A., & Mastruzzi, M. (2010). The Worldwide Governance Indicators:
Methodology and Analytical Issues . The World Bank - Policy Research Working Paper.
Kaya, O. (2014). SME financing in the euro area: New solutions to an old problem. Frankfurt am
Main, Germany: Deutsche Bank Research.
KNAW; NFU; NWO; TO2-federatie; Vereniging Hogescholen; VSNU. (2018). Netherlands Code of
Conduct for Research Integrity. DANS.
Kostova, T., Roth, K., & Dacin, T. M. (2008). Institutional Theory in the Study of Multinational
Corporations: Critique and New Directions. Academy of Management Review, 994-1006.
Kusyk, S. M., & Lozano, J. M. (2007). SME social performance: a four‐cell typology of key drivers
and barriers on social issues and their implications for stakeholder theory. Corporate
Governance: The international journal of business in society, 502-515.
Leahy, S. (2019, November 5). Most countries aren't hitting 2030 climate goals, and everyone will
pay the price. Retrieved from https://www.nationalgeographic.com/:
https://www.nationalgeographic.com/science/2019/11/nations-miss-paris-targets-climate-
driven-weather-events-cost-billions/
Lee, E., Walker, M., & Zeng, C. (. (2017). Do Chinese state subsidies affect voluntary corporate social
responsibility disclosure? Journal of Accounting and Public Policy, 179-200.
Lindenberg, N. (2014). Public Instruments to Leverage Private Capital for Green Investments in
Developing Countries. German Development Institute.
Luca, D. (2016). Do bureaucracies enhance or constrain policy effectiveness? Evidence from Turkey’s
central management of public investment. London School of Economics and Political Science.

54 Thomas Steenbrink – Radboud University – 2021
Lynch-Wood, G., Williamson, D., & Jenkins, W. (2009). The over-reliance on self-regulation in CSR
policy. Business Ethics: A European Review, 52-65.
Marinescu, C. (2013). Institutional Quality of the Business Environment: Some European Practices in
a Comparative Analysis. Amfiteatru Economic Journal, 270-287.
Mc Namara, A., & O Donohoe, D. S. (2013). The Role of Institutional Environments in Shaping SME
Credit Availability: A European Perspective.
Nejati, M., Quazi, A., Amran, A., & Ahmad, N. H. (2017). Social Responsibility and Performance:
Does Strategic Orientation Matter for Small Businesses? Journal of Small Business
Management, 43–59.
Neves, T., Drohomeretski, E., da Costa, S., & de Lima, E. (2014). Sustainable operations
management: practices and measures in the food industry. Int. J. Advanced Operations
Management, 335–352.
North, D. C. (1991). Institutions, Institutional Change and Economic Performance. Cambridge :
University of Cambridge.
OECD. (2017). Enhancing the Contributions of SMEs in a Global and Digitalised Economy. Paris:
OECD.
Oguntoye, O., & Quartey, S. H. (2020). Environmental support programmes for small businesses: A
systematic literature review. Business Strategy Development, 304–317.
Perrini, F., Russo, A., & Tencati, A. (2007). CSR Strategies of SMEs and Large Firms. Evidence from
Italy. Journal of Business Ethics, 285-300.
Perrini, F., Russo, A., & Tencati, A. (2007). CSR Strategies of SMEs and Large Firms. Evidence from
Italy. Journal of Business Ethics, 285–300.
Pickering, J., McGee, J. S., Karlsson-Vinkhuyzen, S. I., & Wenta, J. (2019). Global Climate
Governance Between Hard and Soft Law: Can the Paris Agreement’s ‘Crème Brûlée’
Approach Enhance Ecological Reflexivity? Journal of Environmental Law, 1-28.
Polzin, F. (2017). Mobilizing privatefinance for low-carbon innovation–A systematic review of
barriers and solutions. Renewable and Sustainable Energy Reviews, 525-535.
Polzin, F., Flotow, P. v., & Klerkx, L. (2016). Addressing barriers to eco-innovation: Exploring the
finance mobilisation functions of institutional innovation intermediaries. Technological
Forecasting & Social Change, 34-46.

55 Thomas Steenbrink – Radboud University – 2021
Rademaekers, K., Williams, R., Ellis, R., Smith, M., Svatikova, D. K., & Bilsen, D. V. (2012). Study
on Incentives Driving Improvement of Environmental Performance of Companies. Rotterdam:
Ecorys.
Raza, J., Liu, Y., & Usman, M. (2019). Corporate social responsibility commitment of small‐to‐
medium enterprises and organizational competitive differentiation: Stakeholder pressure,
market orientation, and socioeconomic context effects. Journal of Public Affairs, 413-427.
Reilly, A., & Weirup, A. (2012). Sustainability initiatives, social media activity, and organizational
culture: An exploratory study. Journal of Sustainability and Green Business.
Rijksoverheid. (2020, December). Wat is het Klimaatakkoord? | Klimaatverandering |
Rijksoverheid.nl. Retrieved from https://www.rijksoverheid.nl/:
https://www.rijksoverheid.nl/onderwerpen/klimaatverandering/klimaatakkoord/wat-is-het-
klimaatakkoord
Rodrik, D. (1991). Policy uncertainty and private investment in developing countries. Journal of
Development Economics, 229-242.
Russo, A., & Tencati, A. (2008). Formal vs. Informal CSR Strategies: Evidence from Italian Micro,
Small, Medium-sized and Large Firms. Journal of Business Ethics , 339–353.
Russo, M. V. (2008). Environmental Management. Oregon: Sage Publications.
Scott, R. W. (2001). Institutions and Organizations. Lodon: Sage.
Shanmugam, M. (2020). Foreign Direct Investment and Domestic Private Investment: Role of
Governance and Financial Development in Emerging Markets. Journal of International
Economics, 15-28.
Skjærseth, J. B., Stokke, O. S., & Wettestad, J. (2006). Soft Law, Hard Law, and Effective
Implementation of International Environmental Norms. Global Environmental Politics , 104-
120.
Spence, L. J. (1999). Does size matter? The state of the art in small business ethics. Business Ethics,
the Environment & Responsibility, 163-174.
Spoz, A. (2014). Significance of the EU Funds in Investments of Small and Medium-Sized
Enterprises. Oeconomia Copernicana, 61-74.
Stoian, C., & Gilman, M. (2017). Corporate Social Responsibility That “ Pays” : A Strategic Approach
to CSR for SMEs. Journal of Small Business Management, 5–31.

56 Thomas Steenbrink – Radboud University – 2021
Sun, H., Edziah, B. K., Sun, C., & Kporsu, A. K. (2019). Institutional quality, green innovation and
energy efficiency. Energy Policy.
Svensson, J. (1998). Investment, property rights and political instability: Theory and evidence .
European Economic Review , 1317-1341.
United Nations Framework Convention on Climate Change. (2018, October). What is the Paris
Agreement? | UNFCCC. Retrieved from https://unfccc.int/: https://unfccc.int/process-and-
meetings/the-paris-agreement/what-is-the-paris-agreement
UNSD. (2020). UNSD - Methodology. Retrieved from https://unstats.un.org/:
https://unstats.un.org/unsd/methodology/m49/
van der Wiel, K., Dubovik, A., & van Solinge, F. (2019). Dutch SME bank financing, from a
European perspective. Den Haag: Centraal Planbureu .
Van Kranenburg, H., & Voinea, C. L. (2017). Nonmarket Strategic Management. New York:
Routledge.
Wang, Y., & Zhang, Y. (2020). Do state subsidies increase corporate environmental spending?
International Review of Financial Analysis.
Yang, R., Tang, W., & Zhang, J. (2021). Technology improvement strategy for green products under
competition: The role of government subsidy. European Journal of Operational Research,
653-668.
Zhu, Y., Wittmann, X., & Peng, M. W. (2012). Institution-based barriers to innovation in SMEs in
China. Asia Pacific Journal of Management, 1131-1142.

57 Thomas Steenbrink – Radboud University – 2021
Appendix Appendix 1: Total list of countries Flash Eurobarometer 456

58 Thomas Steenbrink – Radboud University – 2021
Appendix 2: Descriptive analysis
All 36 incorporated countries and their share in the dataset.

59 Thomas Steenbrink – Radboud University – 2021
The distributions across sectors of the firms.

60 Thomas Steenbrink – Radboud University – 2021
Size of firms in the dataset
Cronbach’s alpha for computing a sum score for the resource actions variable SME_RA.
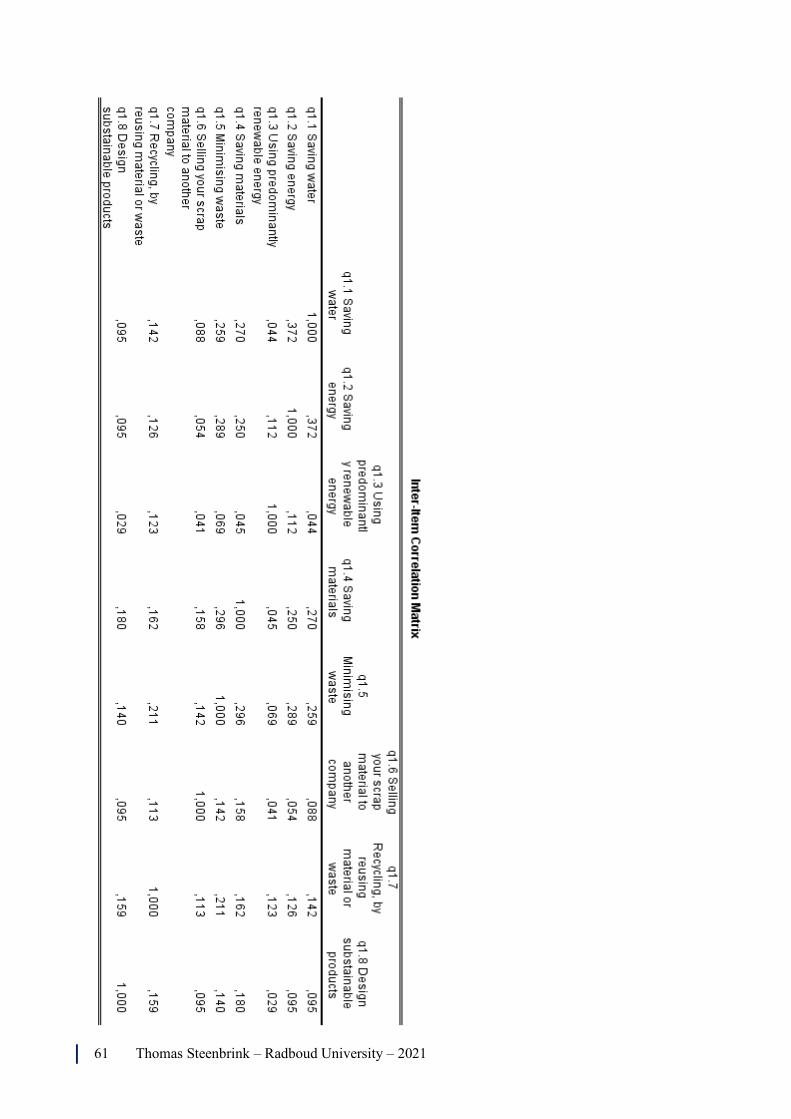
61 Thomas Steenbrink – Radboud University – 2021

62 Thomas Steenbrink – Radboud University – 2021
Appendix 3: Missing value analysis

63 Thomas Steenbrink – Radboud University – 2021

64 Thomas Steenbrink – Radboud University – 2021

65 Thomas Steenbrink – Radboud University – 2021

66 Thomas Steenbrink – Radboud University – 2021
Crosstabulations of Categorical Versus Indicator Variables
Appendix 4: Normality test

67 Thomas Steenbrink – Radboud University – 2021
Test of normality with transformed SME_RA

68 Thomas Steenbrink – Radboud University – 2021

69 Thomas Steenbrink – Radboud University – 2021
Appendix 5: Boxplot SME_RA

70 Thomas Steenbrink – Radboud University – 2021
Appendix 6: Multiple regression analysis

71 Thomas Steenbrink – Radboud University – 2021

72 Thomas Steenbrink – Radboud University – 2021

73 Thomas Steenbrink – Radboud University – 2021

74 Thomas Steenbrink – Radboud University – 2021