Embed Size (px)
Citation preview

FINANCIAL SUMMARY(All financial information has been prepared in accordance with International Financial Reporting Standards)
FY2021 First Quarter(April 1, 2020 through June 30, 2020)
English translation from the original Japanese-language document
TOYOTA MOTOR CORPORATION
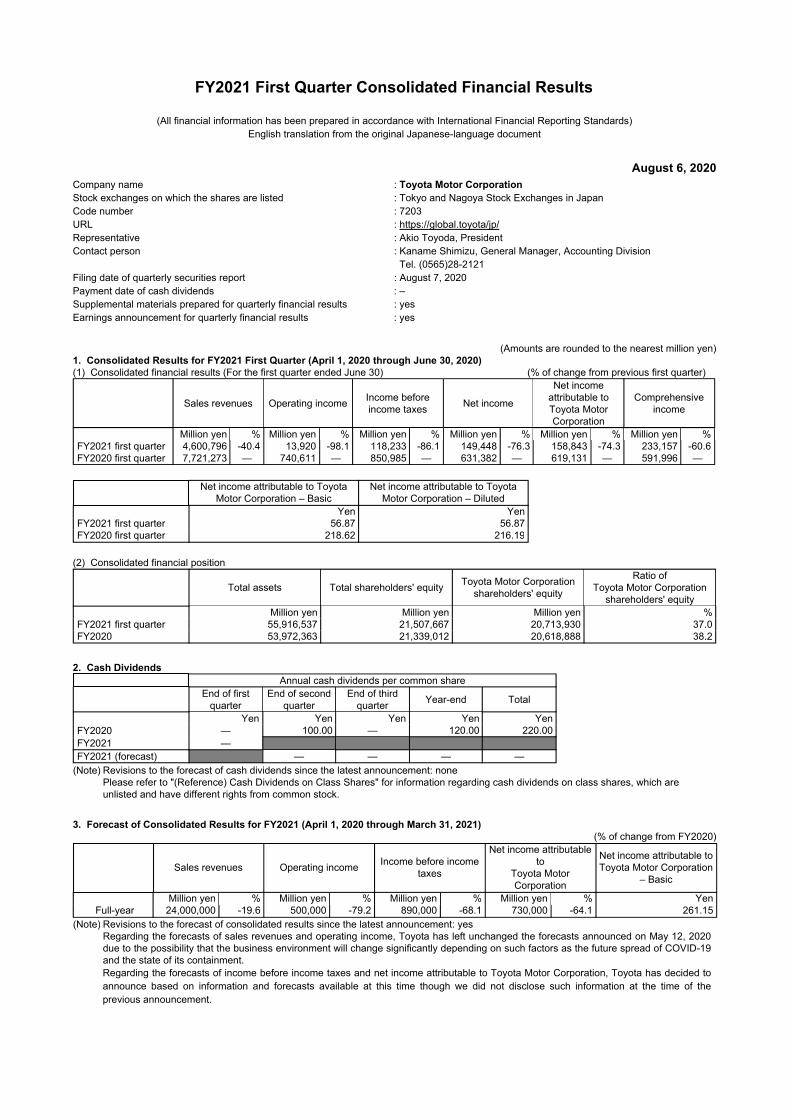
FY2021 First Quarter Consolidated Financial Results
Company name : Toyota Motor CorporationStock exchanges on which the shares are listed : Tokyo and Nagoya Stock Exchanges in JapanCode number : 7203URLRepresentative
: https://global.toyota/jp/: Akio Toyoda, President
Contact person : Kaname Shimizu, General Manager, Accounting Division Tel. (0565)28-2121
Filing date of quarterly securities report : August 7, 2020Payment date of cash dividends : –Supplemental materials prepared for quarterly financial results : yesEarnings announcement for quarterly financial results : yes
Sales revenues Operating income Income before income taxes Net income
Net income attributable toToyota Motor Corporation
Comprehensive income
Million yen % Million yen % Million yen % Million yen % Million yen % Million yen %FY2021 first quarter 4,600,796 -40.4 13,920 -98.1 118,233 -86.1 149,448 -76.3 158,843 -74.3 233,157 -60.6FY2020 first quarter 7,721,273 — 740,611 — 850,985 — 631,382 — 619,131 — 591,996 —
Net income attributable to Toyota Motor Corporation – Basic
Net income attributable to Toyota Motor Corporation – Diluted
Yen YenFY2021 first quarter 56.87 56.87FY2020 first quarter 218.62 216.19
Total assets Total shareholders' equity Toyota Motor Corporationshareholders' equity
Ratio ofToyota Motor Corporation
shareholders' equityMillion yen Million yen Million yen %
FY2021 first quarter 55,916,537 21,507,667 20,713,930 37.0FY2020 53,972,363 21,339,012 20,618,888 38.2
Annual cash dividends per common shareEnd of first
quarterEnd of second
quarterEnd of third
quarter Year-end Total
Yen Yen Yen Yen YenFY2020 — 100.00 — 120.00 220.00FY2021 —FY2021 (forecast) — — — —
(Note) Revisions to the forecast of cash dividends since the latest announcement: nonePlease refer to "(Reference) Cash Dividends on Class Shares" for information regarding cash dividends on class shares, which areunlisted and have different rights from common stock.
Sales revenues Operating income Income before income taxes
Net income attributable to
Toyota Motor Corporation
Net income attributable to Toyota Motor Corporation
– Basic
Million yen % Million yen % Million yen % Million yen % YenFull-year 24,000,000 -19.6 500,000 -79.2 890,000 -68.1 730,000 -64.1 261.15
(Note) Revisions to the forecast of consolidated results since the latest announcement: yesRegarding the forecasts of sales revenues and operating income, Toyota has left unchanged the forecasts announced on May 12, 2020 due to the possibility that the business environment will change significantly depending on such factors as the future spread of COVID-19 and the state of its containment.Regarding the forecasts of income before income taxes and net income attributable to Toyota Motor Corporation, Toyota has decided toannounce based on information and forecasts available at this time though we did not disclose such information at the time of theprevious announcement.
(All financial information has been prepared in accordance with International Financial Reporting Standards)English translation from the original Japanese-language document
August 6, 2020
(Amounts are rounded to the nearest million yen)1. Consolidated Results for FY2021 First Quarter (April 1, 2020 through June 30, 2020)(1) Consolidated financial results (For the first quarter ended June 30) (% of change from previous first quarter)
(2) Consolidated financial position
2. Cash Dividends
3. Forecast of Consolidated Results for FY2021 (April 1, 2020 through March 31, 2021)(% of change from FY2020)
Annual cash dividends per First Series Model AA Class ShareEnd of first
quarterEnd of second
quarterEnd of third
quarter Year-end Total
Yen Yen Yen Yen YenFY2020 ― 132.00 ― 132.00 264.00FY2021 ―FY2021 (forecast) ― ― ― ―
(Note) The First Series Model AA Class Shares were issued in July 2015.
Notes(1) Changes in significant subsidiaries during the current quarter
(Changes in specified subsidiaries that caused a change in the scope of consolidation): none
(2) Changes in accounting policies and changes in accounting estimates(i) Changes in accounting policies required by IFRS: none(ii) Changes other than (2)-(i) above: none(iii) Changes in accounting estimates: none
(3) Number of shares issued and outstanding (common stock)(i) Number of shares issued and outstanding at the end of each period (including treasury stock): FY2021 first quarter 3,262,997,492 shares,
FY2020 3,262,997,492 shares(ii) Number of treasury stock at the end of each period: FY2021 first quarter 467,035,101 shares,
FY2020 496,844,960 shares(iii) Average number of shares issued and outstanding in each period: FY2021 first quarter 2,793,273,694 shares,
FY2020 first quarter 2,831,992,804 shares
This report is not reviewed.
Cautionary Statement with Respect to Forward-Looking Statements, and Other Information
This report contains forward-looking statements that reflect Toyota's plans and expectations.These forward-looking statements are not guarantees of future performance and involve known and unknown risks, uncertainties and other
factors that may cause Toyota's actual results, performance, achievements or financial position to be materially different from any future results, performance, achievements or financial position expressed or implied by these forward-looking statements.
These factors include, but are not limited to: (i) changes in economic conditions, market demand, and the competitive environment affecting the automotive markets in Japan, North America, Europe, Asia and other markets in which Toyota operates; (ii) fluctuations in currency exchange rates, particularly with respect to the value of the Japanese yen, the U.S. dollar, the euro, the Australian dollar, the Russian ruble, the Canadian dollar and the British pound, fluctuations in stock prices, and interest rates fluctuations; (iii)changes in funding environment in financial markets and increased competition in the financial services industry; (iv)Toyota's ability to market and distribute effectively; (v) Toyota's ability to realize production efficiencies and to implement capital expenditures at the levels and times planned by management; (vi) changes in the laws, regulations and government policies in the markets in which Toyota operates that affect Toyota's automotive operations, particularly laws, regulations and government policies relating to vehicle safety including remedial measures such as recalls, trade, environmental protection, vehicle emissions and vehicle fuel economy, as well as changes in laws, regulations and government policies that affect Toyota's other operations, including the outcome of current and future litigation and other legal proceedings, government proceedings and investigations; (vii) political and economic instability in the markets in which Toyota operates; (viii) Toyota's ability to timely develop and achieve market acceptance of new products that meet customer demand; (ix) any damage to Toyota's brand image; (x) Toyota's reliance on various suppliers for the provision of supplies; (xi) increases in prices of raw materials; (xii) Toyota's reliance on various digital and information technologies; (xiii) fuel shortages or interruptions in electricity, transportation systems, labor strikes, work stoppages or other interruptions to, or difficulties in, the employment of labor in the major markets where Toyota purchases materials, components and supplies for the production of its products or where its products are produced, distributed or sold; and (xiv) the impact of natural calamities as well as the outbreak and spread of epidemics, including the negative effect on Toyota's vehicle production and sales.
A discussion of these and other factors which may affect Toyota's actual results, performance, achievements or financial position is contained in Toyota's annual report on Form 20-F, which is on file with the United States Securities and Exchange Commission.
The global spread of COVID-19 and the responses to it by governments and other stakeholders have adversely affected Toyota in a number of ways. For reasons such as government directives as well as anticipated reduced demand for its vehicles, Toyota has temporarily suspended, or intends to temporarily suspend, production of automobiles and components at selected plants in Japan and overseas. COVID-19 has also affected, and is expected to continue to affect, the businesses of Toyota dealers and distributors, as well as certain of Toyota’s third-party suppliers and business partners. In addition, the global spread of COVID-19 and related matters have adversely affected businesses in a wide variety of industries, as well as consumers, all of which negatively impacted demand for Toyota’s vehicles and related financial services.
The duration of the global spread of COVID-19 and the resulting future effects are uncertain, and the foregoing impacts and other effects not referenced above, as well as the ultimate impact of COVID-19, are difficult to predict and could have an adverse effect on Toyota’s financial condition and results of operations.
The parent company has adopted International Financial Reporting Standards ("IFRS") for its consolidated financial statements beginning with the first quarter ended June 30, 2020. In addition, consolidated financial statements for the first quarter ended June 30, 2019 and for the fiscal year ended March 31, 2020 are also presented in accordance with IFRS.
(Reference) Cash Dividends on Class SharesCash dividends on class shares, which have different rights from common stock, are as follows:
TOYOTA MOTOR CORPORATION FY2021 First Quarter Financial Summary
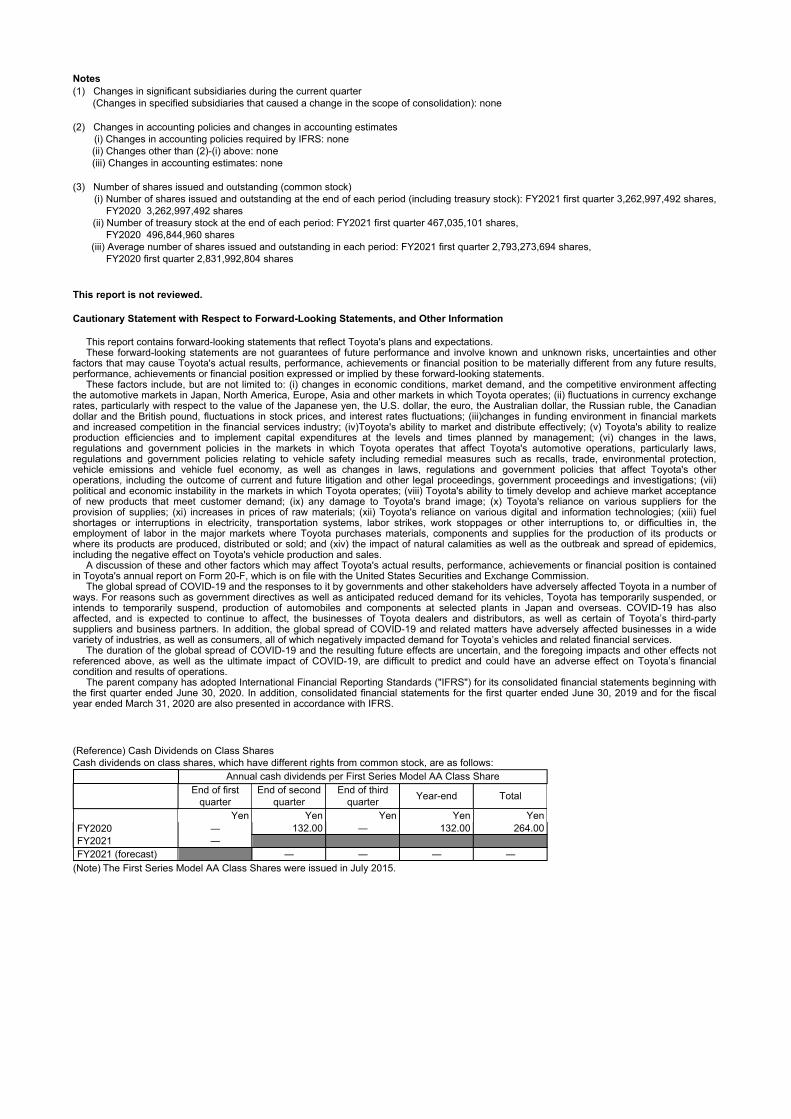
Condensed Quarterly Consolidated Financial Statements and
Notes to Condensed Quarterly Consolidated Financial Statements........................................................................................ 2
1. Condensed Quarterly Consolidated Statement of Financial Position............................................................................................. 2
2. Condensed Quarterly Consolidated Statement of Income and
Condensed Quarterly Consolidated Statement of Comprehensive Income.................................................................................... 4
3. Condensed Quarterly Consolidated Statement of Changes in Equity............................................................................................ 6
4. Condensed Quarterly Consolidated Statement of Cash Flows....................................................................................................... 7
5. Going Concern Assumption............................................................................................................................................................. 8
6. First-Time Adoption......................................................................................................................................................................... 9
Forecast of Consolidated Financial Results for FY2021....................................................................................................................
Supplemental Material for Financial Results for FY2021 First Quarter
25
TABLE OF CONTENTS
1
TOYOTA MOTOR CORPORATION FY2021 First Quarter Financial Summary
Yen in millions
April 1, 2019 March 31, 2020 June 30, 2020
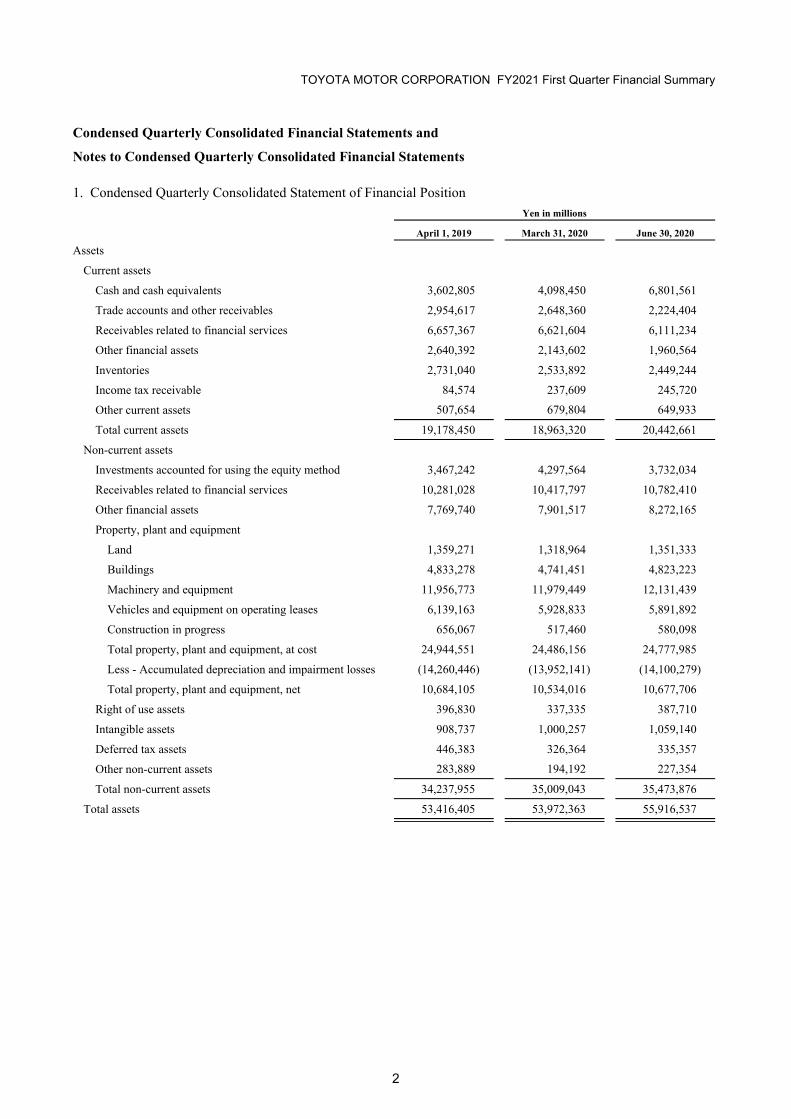
AssetsCurrent assets
Cash and cash equivalents 3,602,805 4,098,450 6,801,561Trade accounts and other receivables 2,954,617 2,648,360 2,224,404Receivables related to financial services 6,657,367 6,621,604 6,111,234Other financial assets 2,640,392 2,143,602 1,960,564Inventories 2,731,040 2,533,892 2,449,244Income tax receivable 84,574 237,609 245,720Other current assets 507,654 679,804 649,933
Total current assets 19,178,450 18,963,320 20,442,661Non-current assets
Investments accounted for using the equity method 3,467,242 4,297,564 3,732,034Receivables related to financial services 10,281,028 10,417,797 10,782,410Other financial assets 7,769,740 7,901,517 8,272,165Property, plant and equipment
Land 1,359,271 1,318,964 1,351,333Buildings 4,833,278 4,741,451 4,823,223Machinery and equipment 11,956,773 11,979,449 12,131,439Vehicles and equipment on operating leases 6,139,163 5,928,833 5,891,892Construction in progress 656,067 517,460 580,098Total property, plant and equipment, at cost 24,944,551 24,486,156 24,777,985Less - Accumulated depreciation and impairment losses (14,260,446) (13,952,141) (14,100,279)Total property, plant and equipment, net 10,684,105 10,534,016 10,677,706
Right of use assets 396,830 337,335 387,710Intangible assets 908,737 1,000,257 1,059,140Deferred tax assets 446,383 326,364 335,357Other non-current assets 283,889 194,192 227,354
Total non-current assets 34,237,955 35,009,043 35,473,876Total assets 53,416,405 53,972,363 55,916,537
Condensed Quarterly Consolidated Financial Statements andNotes to Condensed Quarterly Consolidated Financial Statements
1. Condensed Quarterly Consolidated Statement of Financial Position
2
TOYOTA MOTOR CORPORATION FY2021 First Quarter Financial Summary
Yen in millions
April 1, 2019 March 31, 2020 June 30, 2020
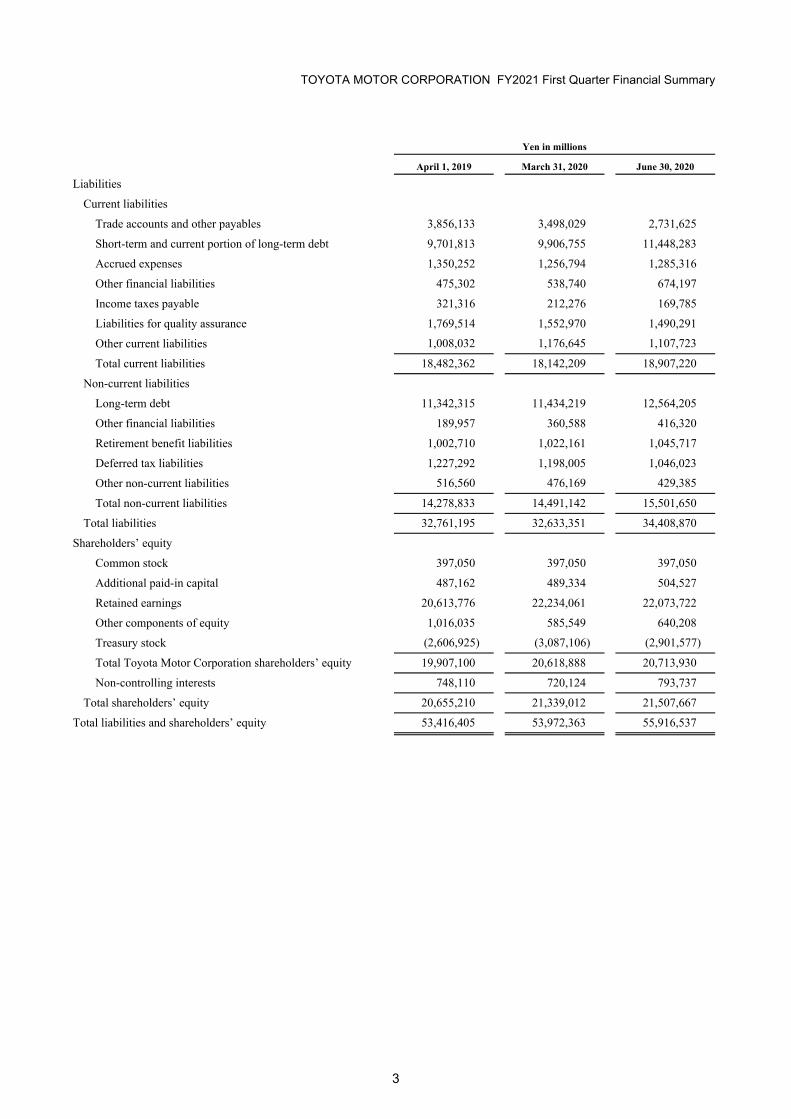
LiabilitiesCurrent liabilities
Trade accounts and other payables 3,856,133 3,498,029 2,731,625Short-term and current portion of long-term debt 9,701,813 9,906,755 11,448,283Accrued expenses 1,350,252 1,256,794 1,285,316Other financial liabilities 475,302 538,740 674,197Income taxes payable 321,316 212,276 169,785Liabilities for quality assurance 1,769,514 1,552,970 1,490,291Other current liabilities 1,008,032 1,176,645 1,107,723
Total current liabilities 18,482,362 18,142,209 18,907,220Non-current liabilities
Long-term debt 11,342,315 11,434,219 12,564,205Other financial liabilities 189,957 360,588 416,320Retirement benefit liabilities 1,002,710 1,022,161 1,045,717Deferred tax liabilities 1,227,292 1,198,005 1,046,023Other non-current liabilities 516,560 476,169 429,385
Total non-current liabilities 14,278,833 14,491,142 15,501,650Total liabilities 32,761,195 32,633,351 34,408,870
Shareholders’ equityCommon stock 397,050 397,050 397,050Additional paid-in capital 487,162 489,334 504,527Retained earnings 20,613,776 22,234,061 22,073,722Other components of equity 1,016,035 585,549 640,208Treasury stock (2,606,925) (3,087,106) (2,901,577)
Total Toyota Motor Corporation shareholders’ equity 19,907,100 20,618,888 20,713,930Non-controlling interests 748,110 720,124 793,737
Total shareholders’ equity 20,655,210 21,339,012 21,507,667Total liabilities and shareholders’ equity 53,416,405 53,972,363 55,916,537
3
TOYOTA MOTOR CORPORATION FY2021 First Quarter Financial Summary
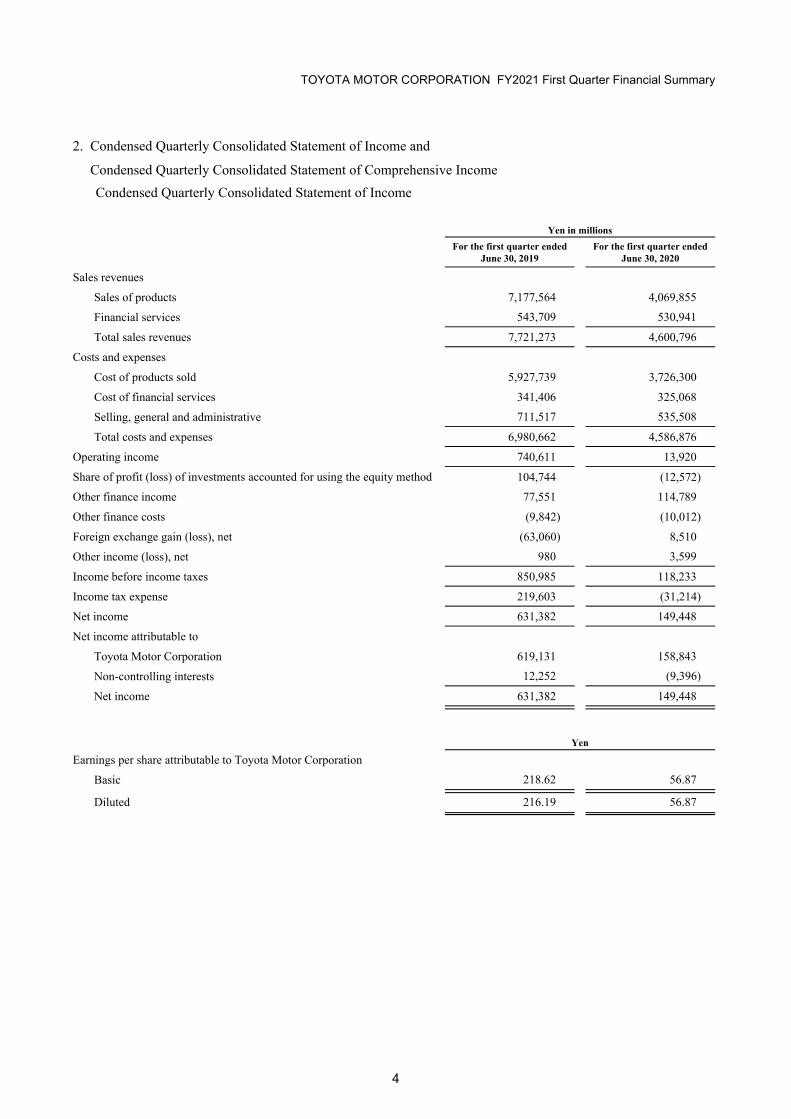
Condensed Quarterly Consolidated Statement of Income
Yen in millionsFor the first quarter ended
June 30, 2019For the first quarter ended
June 30, 2020
Sales revenuesSales of products 7,177,564 4,069,855Financial services 543,709 530,941
Total sales revenues 7,721,273 4,600,796Costs and expenses
Cost of products sold 5,927,739 3,726,300Cost of financial services 341,406 325,068Selling, general and administrative 711,517 535,508
Total costs and expenses 6,980,662 4,586,876Operating income 740,611 13,920Share of profit (loss) of investments accounted for using the equity method 104,744 (12,572)Other finance income 77,551 114,789Other finance costs (9,842) (10,012)Foreign exchange gain (loss), net (63,060) 8,510Other income (loss), net 980 3,599
Income before income taxes 850,985 118,233Income tax expense 219,603 (31,214)Net income 631,382 149,448Net income attributable to
Toyota Motor Corporation 619,131 158,843Non-controlling interests 12,252 (9,396)
Net income 631,382 149,448
Yen
Earnings per share attributable to Toyota Motor CorporationBasic 218.62 56.87
Diluted 216.19 56.87
2. Condensed Quarterly Consolidated Statement of Income and
Condensed Quarterly Consolidated Statement of Comprehensive Income
4
TOYOTA MOTOR CORPORATION FY2021 First Quarter Financial Summary
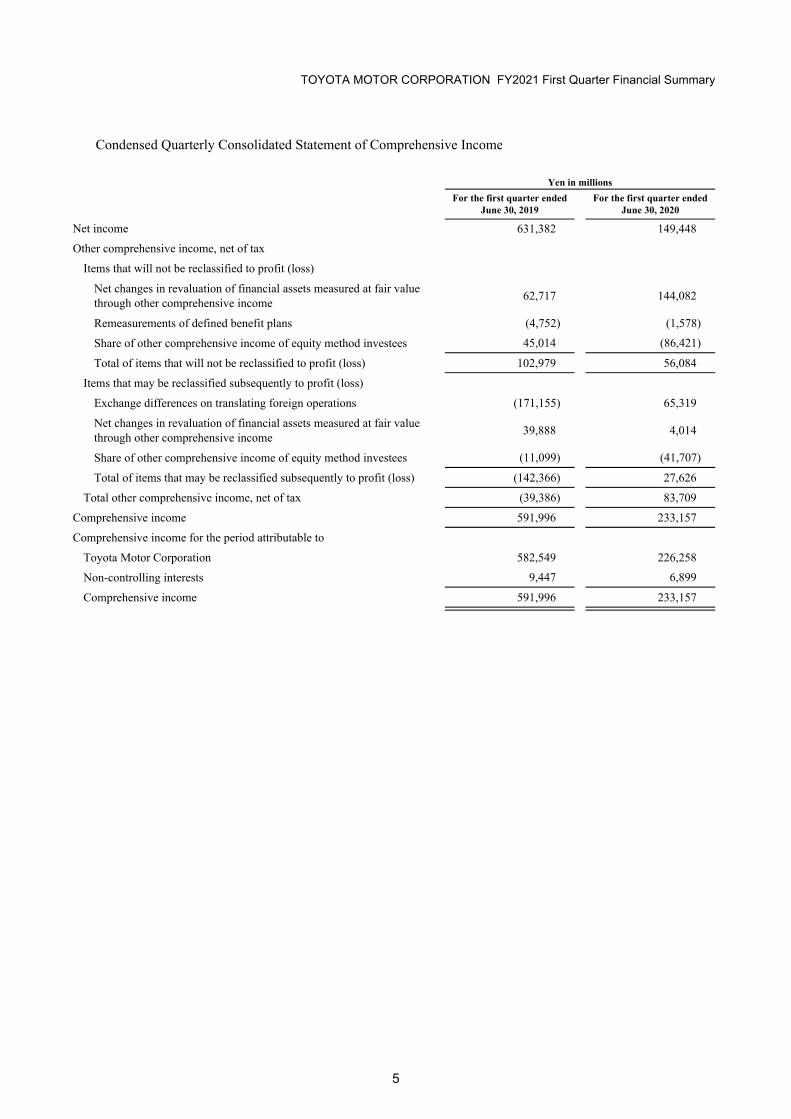
Condensed Quarterly Consolidated Statement of Comprehensive Income
Yen in millionsFor the first quarter ended
June 30, 2019For the first quarter ended
June 30, 2020
Net income 631,382 149,448Other comprehensive income, net of tax
Items that will not be reclassified to profit (loss)Net changes in revaluation of financial assets measured at fair valuethrough other comprehensive income 62,717 144,082
Remeasurements of defined benefit plans (4,752) (1,578)Share of other comprehensive income of equity method investees 45,014 (86,421)
Total of items that will not be reclassified to profit (loss) 102,979 56,084Items that may be reclassified subsequently to profit (loss)
Exchange differences on translating foreign operations (171,155) 65,319Net changes in revaluation of financial assets measured at fair valuethrough other comprehensive income 39,888 4,014
Share of other comprehensive income of equity method investees (11,099) (41,707)
Total of items that may be reclassified subsequently to profit (loss) (142,366) 27,626Total other comprehensive income, net of tax (39,386) 83,709
Comprehensive income 591,996 233,157Comprehensive income for the period attributable to
Toyota Motor Corporation 582,549 226,258Non-controlling interests 9,447 6,899
Comprehensive income 591,996 233,157
5

TOYOTA MOTOR CORPORATION FY2021 First Quarter Financial Summary
For the first quarter ended June 30, 2019
Yen in millions
Commonstock
Additionalpaid-in capital
Retainedearnings
Othercomponents
of equity
Treasurystock
Toyota Motor Corporation shareholders'
equity
Non-controlling
interests
Totalshareholders'
equity
Balances at April 1, 2019 397,050 487,162 20,613,776 1,016,035 (2,606,925) 19,907,100 748,110 20,655,210
Comprehensive income
Net income — — 619,131 — — 619,131 12,252 631,382Other comprehensive income, net of tax — — — (36,582) — (36,582) (2,804) (39,386)Total comprehensive income — — 619,131 (36,582) — 582,549 9,447 591,996
Transactions with owners andother
Dividends paid — — (339,893) — — (339,893) (23,881) (363,774)Repurchase of treasury stock — — — — (54,308) (54,308) — (54,308)Equity transactions and other — 914 — — — 914 (2,703) (1,789)Total transactions with owners and other — 914 (339,893) — (54,308) (393,287) (26,584) (419,871)
Reclassification to retained earnings — — (2,670) 2,670 — — — —
Balances at June 30, 2019 397,050 488,077 20,890,344 982,123 (2,661,233) 20,096,362 730,973 20,827,336
For the first quarter ended June 30, 2020
Yen in millions
Commonstock
Additionalpaid-in capital
Retainedearnings
Othercomponents
of equity
Treasurystock
Toyota Motor Corporation shareholders'
equity
Non-controlling
interests
Totalshareholders'
equity
Balances at April 1, 2020 397,050 489,334 22,234,061 585,549 (3,087,106) 20,618,888 720,124 21,339,012
Comprehensive income
Net income — — 158,843 — — 158,843 (9,396) 149,448Other comprehensive income, net of tax — — — 67,415 — 67,415 16,295 83,709Total comprehensive income — — 158,843 67,415 — 226,258 6,899 233,157
Transactions with owners andother
Dividends paid — — (331,938) — — (331,938) (17,932) (349,870)Repurchase of treasury stock — — — — (13) (13) — (13)Reissuance of treasury stock — 15,031 — — 185,542 200,573 — 200,573Change in scope of consolidation — — — — — — 67,331 67,331Equity transactions and other — 163 — — — 163 17,316 17,478Total transactions with owners and other — 15,193 (331,938) — 185,529 (131,216) 66,715 (64,501)
Reclassification to retainedearnings — — 12,756 (12,756) — — — —
Balances at June 30, 2020 397,050 504,527 22,073,722 640,208 (2,901,577) 20,713,930 793,737 21,507,667
3. Condensed Quarterly Consolidated Statement of Changes in Equity
6

TOYOTA MOTOR CORPORATION FY2021 First Quarter Financial Summary
Yen in millionsFor the first quarter ended
June 30, 2019For the first quarter ended
June 30, 2020
Cash flows from operating activitiesNet income 631,382 149,448Depreciation and amortization 395,997 398,044Interest income and interest costs related to financial services, net (45,419) (47,617)Share of profit (loss) of investments accounted for using the equity method (104,744) 12,572Income tax expense 219,603 (31,214)Changes in operating assets and liabilities, and other (454,266) 134,000Interest received 196,995 173,382Dividends received 207,012 190,101Interest paid (82,860) (101,457)Income taxes paid, net of refund (312,802) (204,007)Net cash provided by (used in) operating activities 650,897 673,252
Cash flows from investing activitiesAdditions to fixed assets excluding equipment leased to others (381,612) (358,358)Additions to equipment leased to others (596,156) (386,686)Proceeds from sales of fixed assets excluding equipment leased to others 6,815 12,650Proceeds from sales of equipment leased to others 366,021 265,751Additions to intangible assets (53,654) (74,804)Additions to financial assets (292,597) (592,187)Proceeds from sales of financial assets andupon maturity of financial assets 885,676 593,473
Other, net (345,314) 202,544Net cash provided by (used in) investing activities (410,820) (337,617)
Cash flows from financing activitiesIncrease (decrease) in short-term debt 102,762 (213,223)Proceeds from long-term debt 1,569,856 3,982,675Payments of long-term debt (1,197,075) (1,284,411)Dividends paid to Toyota Motor Corporation common shareholders (339,893) (331,938)Dividends paid to non-controlling interests (23,881) (17,932)Reissuance (repurchase) of treasury stock (54,308) 199,986Net cash provided by (used in) financing activities 57,463 2,335,157
Effect of exchange rate changes on cash and cash equivalents (60,337) 32,319Net increase (decrease) in cash and cash equivalents 237,203 2,703,111Cash and cash equivalents at beginning of period 3,602,805 4,098,450Cash and cash equivalents at end of period 3,840,008 6,801,561
4. Condensed Quarterly Consolidated Statement of Cash Flows
7
TOYOTA MOTOR CORPORATION FY2021 First Quarter Financial Summary
None
5. Going Concern Assumption
8
TOYOTA MOTOR CORPORATION FY2021 First Quarter Financial Summary
6. First-Time Adoption
Transition to reporting in accordance with IFRSToyota Motor Corporation ("TMC") has prepared its condensed consolidated financial statements in
accordance with IFRS from the first quarter ended June 30, 2020.
Up to the fiscal year ended March 31, 2020, TMC and its consolidated subsidiaries ("Toyota") prepared its
consolidated financial statements in accordance with Generally Accepted Accounting Standards in the
United States ("U.S. GAAP"). The date of the transition to IFRS ("Transition Date") was April 1, 2019.
IFRS 1 "First-time Adoption of International Financial Reporting Standards" ("IFRS 1") stipulates that, in
principle, the retrospective application of IFRS is required. However, it provides some voluntary and
mandatory exemptions from full retrospective applications. TMC elected such exemptions with respect to
the following items.
Business combination -
IFRS 3 "Business Combinations", was not applied retrospectively to business combinations that occurred
before the Transition Date.
Foreign currency translation adjustments of foreign operations -
The cumulative foreign currency translation adjustments were reclassified from other comprehensive
income to retained earnings as of the date of the Transition Date.
Designation of equity financial assets -
Equity financial assets recognized before the Transition Date were designated as financial assets measured
at fair value through other comprehensive income based on the facts and circumstances that existed as of
the Transition Date.
Deemed cost -
IFRS 1 permits a first time adopter to elect to use fair value at the Transition Date as deemed cost for
items of property, plant and equipment. For some property, plant and equipment, the fair value at the
Transition Date is used as deemed cost.
Recognition of right of use assets and lease liabilities -
When a first time adopter that is a lessee recognizes right of use assets and lease liabilities, it is permitted
to measure lease liabilities at the Transition Date under IFRS 1. Toyota measures all lease liabilities at the
Transition Date, using the present value of the remaining lease payments and discounted by the lessee's
incremental borrowing rate at the Transition Date. Toyota measures right of use assets at the Transition
Date and shall be equal to the lease liability.
For leases for which the lease term ends within 12 months of the Transition Date, lease payment
associated with those leases as an expense on a straight-line basis over the lease term.
9

TOYOTA MOTOR CORPORATION FY2021 First Quarter Financial Summary
Reconciliation of U.S. GAAP to IFRSToyota has made the necessary adjustments to the previously disclosed U.S. GAAP consolidated financial
statements or quarterly consolidated financial statements in transition to IFRS.
Items that do not affect retained earnings and comprehensive income are included in “Reclassification,”
and items that affect retained earnings and comprehensive income are included in “Adjustment of
recognition and measurement” of the reconciliation tables.
10

TOYOTA MOTOR CORPORATION FY2021 First Quarter Financial Summary
Reconciliation of equity as of the transition date (April 1, 2019)
Yen in millions
Presentation under U.S. GAAP U.S. GAAP Reclassification
Adjustment of recognition and measurement
IFRS Notes Presentation under IFRS
Assets AssetsCurrent assets Current assets
Cash and cash equivalents 3,574,704 ― 28,101 3,602,805 Cash and cash
equivalentsTrade accounts and notes receivable,less allowance for doubtful accounts
2,372,734 568,156 13,728 2,954,617 A Trade accounts and other receivables
Other receivables 568,156 (568,156) ― ― AFinance receivables, net 6,647,771 ― 9,596 6,657,367 Receivables related to
financial servicesTime deposits 1,126,352 1,508,812 5,228 2,640,392 B,C,D Other financial assetsMarketable securities 1,127,160 (1,127,160) ― ― BInventories 2,656,396 ― 74,644 2,731,040 a Inventories
― 84,281 293 84,574 E Income tax receivablePrepaid expenses and other current assets 805,964 (297,502) (807) 507,654 C,D,E Other current assets
Total current assets 18,879,237 168,431 130,781 19,178,450 Total current assets
Non-current assetsInvestments in affiliated companies 3,313,723 54,004 99,516 3,467,242
Investments accounted for using the equity method
Noncurrent finance receivables, net 10,281,118 ― (90) 10,281,028 Receivables related to
financial servicesMarketable securities and other securities investments
7,479,926 238,009 51,806 7,769,740 D,F,G,b Other financial assets
Employees receivables 21,683 (21,683) ― ― FProperty, plant and equipment
Property, plant and equipment
Land 1,386,308 1,353 (28,391) 1,359,271 c Land Buildings 4,802,175 (14,489) 45,593 4,833,278 Buildings Machinery and equipment 11,857,425 (6,097) 105,445 11,956,773 Machinery and
equipment Vehicles and equipment on operating leases
6,139,163 ― ― 6,139,163 Vehicles and equipment on operating leases
Construction in progress 651,713 61 4,293 656,067 Construction in
progress Total property, plant and equipment, at cost
24,836,784 (19,172) 126,939 24,944,551 Total property, plant and equipment, at cost
Less - Accumulated depreciation
(14,151,290) (8,140) (101,016) (14,260,446) Less - Accumulated depreciation and impairment losses
Total property, plant and equipment, net
10,685,494 (27,313) 25,923 10,684,105 Total property, plant and equipment, net
― 27,313 369,517 396,830 d Right of use assets― 297,394 611,343 908,737 G,e Intangible assets― 501,872 (55,489) 446,383 G,f Deferred tax assets
Other 1,275,768 (991,888) 9 283,889 G Other non-current assets
33,057,712 77,709 1,102,535 34,237,955 Total non-current assets
Total assets 51,936,949 246,140 1,233,316 53,416,405 Total assets
11

TOYOTA MOTOR CORPORATION FY2021 First Quarter Financial Summary
Yen in millions
Presentation under U.S. GAAP U.S. GAAP Reclassification
Adjustment of recognition and measurement
IFRS Notes Presentation under IFRS
Liabilities LiabilitiesCurrent liabilities Current liabilities
Accounts payable 2,645,984 1,180,657 29,492 3,856,133 H,K Trade accounts and other payables
Other payable 1,102,802 (1,102,802) ― ― H
Short-term borrowings 5,344,973 4,254,260 102,580 9,701,813 I,dShort-term and current portion of long-term debt
Current portion of long-term debt 4,254,260 (4,254,260) ― ― IAccrued expenses 3,222,446 (1,870,433) (1,761) 1,350,252 J Accrued expenses
― 475,409 (107) 475,302 D,K Other financial liabilities
Income taxes payable 320,998 ― 318 321,316 Income taxes payable― 1,769,275 239 1,769,514 J Liabilities for quality
assuranceOther current liabilities 1,335,475 (339,131) 11,688 1,008,032 D,K Other current
liabilitiesTotal current liabilities 18,226,938 112,975 142,449 18,482,362 Total current
liabilities
Long-term liabilities Non-current liabilitiesLong-term debt 10,550,945 498,073 293,298 11,342,315 L,d Long-term debt
― 189,957 ― 189,957 D Other financial liabilities
Accrued pension and severance costs 963,406 37,532 1,771 1,002,710 Retirement benefit
liabilitiesDeferred income taxes 1,014,851 11,670 200,771 1,227,292 f Deferred tax liabilitiesOther long-term liabilities 615,599 (105,994) 6,955 516,560 Other non-current
liabilitiesTotal long-term liabilities 13,144,801 631,238 502,794 14,278,833 Total non-current
liabilitiesTotal liabilities 31,371,739 744,213 645,244 32,761,195 Total liabilities
Mezzanine equity 498,073 (498,073) ― ― LShareholders’ equity Shareholders’ equity
Toyota Motor Corporation shareholders’ equity
Common stock, no par value 397,050 ― ― 397,050 Common stockAdditional paid-in capital 487,162 ― ― 487,162 Additional paid-in
capitalRetained earnings 21,987,515 ― (1,373,738) 20,613,776 j Retained earningsAccumulated other comprehensive income (loss)
(916,650) ― 1,932,686 1,016,035 b,g,h Other components of equity
Treasury stock, at cost (2,606,925) ― ― (2,606,925) Treasury stockTotal Toyota Motor Corporation shareholders’ equity
19,348,152 ― 558,947 19,907,100Total Toyota Motor Corporation shareholders’ equity
Noncontrolling interests 718,985 ― 29,125 748,110 Non-controllinginterests
Total shareholders’ equity 20,067,137 ― 588,072 20,655,210 Total shareholders'
equityTotal mezzanine equity and shareholders’ equity
20,565,210 (498,073) 588,072 20,655,210
Commitments and contingenciesTotal liabilities, mezzanine equity and shareholders’ equity
51,936,949 246,140 1,233,316 53,416,405 Total liabilities and shareholders’ equity
12

TOYOTA MOTOR CORPORATION FY2021 First Quarter Financial Summary
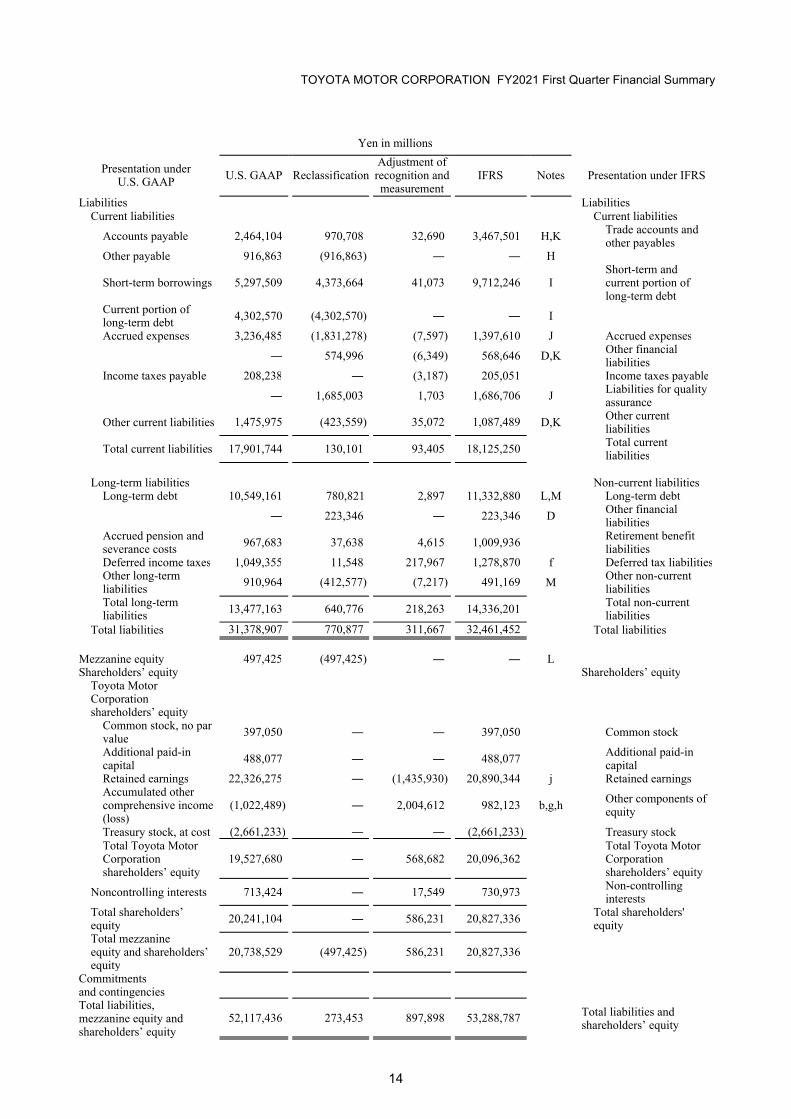
Reconciliation of equity as of the end of the first quarter (June 30, 2019)
Yen in millions
Presentation under U.S. GAAP U.S. GAAP Reclassification
Adjustment of recognition and measurement
IFRS Notes Presentation under IFRS
Assets AssetsCurrent assets Current assets
Cash and cash equivalents 3,761,800 ― 78,208 3,840,008 Cash and cash
equivalentsTrade accounts and notes receivable,less allowance fordoubtful accounts
2,234,909 528,709 11,844 2,775,461 A Trade accounts and other receivables
Other receivables 528,709 (528,709) ― ― AFinance receivables, net 6,648,292 ― 7,700 6,655,992 Receivables related to
financial servicesTime deposits 1,466,979 1,344,405 818 2,812,202 B,C,D Other financial assetsMarketable securities 971,958 (971,958) ― ― BInventories 2,738,140 ― 63,872 2,802,012 a Inventories
― 86,327 513 86,840 E Income tax receivablePrepaid expenses and other current assets 935,748 (294,095) 13,431 655,084 C,D,E Other current assets
Total current assets 19,286,535 164,679 176,386 19,627,600 Total current assets
Non-current assetsInvestments in affiliated companies 3,288,535 56,693 97,354 3,442,582
Investments accounted for using the equity method
Noncurrent finance receivables, net 10,265,912 ― 1,799 10,267,712 Receivables related to
financial servicesMarketable securities and other securities investments
7,095,229 224,748 48,338 7,368,315 D,F,G,b Other financial assets
Employees receivables 22,408 (22,408) ― ― FProperty, plant and equipment
Property, plant and equipment
Land 1,374,624 1,476 (28,409) 1,347,692 c Land Buildings 4,773,122 (4,970) 39,974 4,808,125 Buildings Machinery and equipment 11,706,623 (25,432) 100,827 11,782,019 Machinery and
equipment Vehicles and equipment on operating leases
5,968,646 ― (33) 5,968,613 Vehicles and equipment on operating leases
Construction in progress 647,443 59 2,181 649,683 Construction in
progress Total property, plant and equipment, at cost
24,470,458 (28,867) 114,541 24,556,132 Total property, plant and equipment, at cost
Less - Accumulated depreciation
(13,929,933) (4,375) (101,282) (14,035,591) Less - Accumulated depreciation and impairment losses
Total property, plant and equipment, net
10,540,525 (33,242) 13,259 10,520,541 Total property, plant and equipment, net
― 387,812 (4,496) 383,315 G Right of use assets― 299,163 601,714 900,877 G,e Intangible assets― 485,530 (36,614) 448,916 G,f Deferred tax assets
Other 1,618,292 (1,289,522) 159 328,929 G Other non-current assets
32,830,901 108,774 721,513 33,661,188 Total non-current assets
Total assets 52,117,436 273,453 897,898 53,288,787 Total assets
13
TOYOTA MOTOR CORPORATION FY2021 First Quarter Financial Summary
Yen in millions
Presentation under U.S. GAAP U.S. GAAP Reclassification
Adjustment of recognition and measurement
IFRS Notes Presentation under IFRS
Liabilities LiabilitiesCurrent liabilities Current liabilities
Accounts payable 2,464,104 970,708 32,690 3,467,501 H,K Trade accounts and other payables
Other payable 916,863 (916,863) ― ― H
Short-term borrowings 5,297,509 4,373,664 41,073 9,712,246 IShort-term and current portion of long-term debt
Current portion of long-term debt 4,302,570 (4,302,570) ― ― IAccrued expenses 3,236,485 (1,831,278) (7,597) 1,397,610 J Accrued expenses
― 574,996 (6,349) 568,646 D,K Other financial liabilities
Income taxes payable 208,238 ― (3,187) 205,051 Income taxes payable― 1,685,003 1,703 1,686,706 J Liabilities for quality
assuranceOther current liabilities 1,475,975 (423,559) 35,072 1,087,489 D,K Other current
liabilitiesTotal current liabilities 17,901,744 130,101 93,405 18,125,250 Total current
liabilities
Long-term liabilities Non-current liabilitiesLong-term debt 10,549,161 780,821 2,897 11,332,880 L,M Long-term debt
― 223,346 ― 223,346 D Other financial liabilities
Accrued pension and severance costs 967,683 37,638 4,615 1,009,936 Retirement benefit
liabilitiesDeferred income taxes 1,049,355 11,548 217,967 1,278,870 f Deferred tax liabilitiesOther long-term liabilities 910,964 (412,577) (7,217) 491,169 M Other non-current
liabilitiesTotal long-term liabilities 13,477,163 640,776 218,263 14,336,201 Total non-current
liabilitiesTotal liabilities 31,378,907 770,877 311,667 32,461,452 Total liabilities
Mezzanine equity 497,425 (497,425) ― ― LShareholders’ equity Shareholders’ equity
Toyota Motor Corporation shareholders’ equity
Common stock, no par value 397,050 ― ― 397,050 Common stockAdditional paid-in capital 488,077 ― ― 488,077 Additional paid-in
capitalRetained earnings 22,326,275 ― (1,435,930) 20,890,344 j Retained earningsAccumulated other comprehensive income (loss)
(1,022,489) ― 2,004,612 982,123 b,g,h Other components of equity
Treasury stock, at cost (2,661,233) ― ― (2,661,233) Treasury stockTotal Toyota Motor Corporation shareholders’ equity
19,527,680 ― 568,682 20,096,362Total Toyota Motor Corporation shareholders’ equity
Noncontrolling interests 713,424 ― 17,549 730,973 Non-controllinginterests
Total shareholders’ equity 20,241,104 ― 586,231 20,827,336 Total shareholders'
equityTotal mezzanine equity and shareholders’ equity
20,738,529 (497,425) 586,231 20,827,336
Commitments and contingenciesTotal liabilities, mezzanine equity and shareholders’ equity
52,117,436 273,453 897,898 53,288,787 Total liabilities and shareholders’ equity
14

TOYOTA MOTOR CORPORATION FY2021 First Quarter Financial Summary
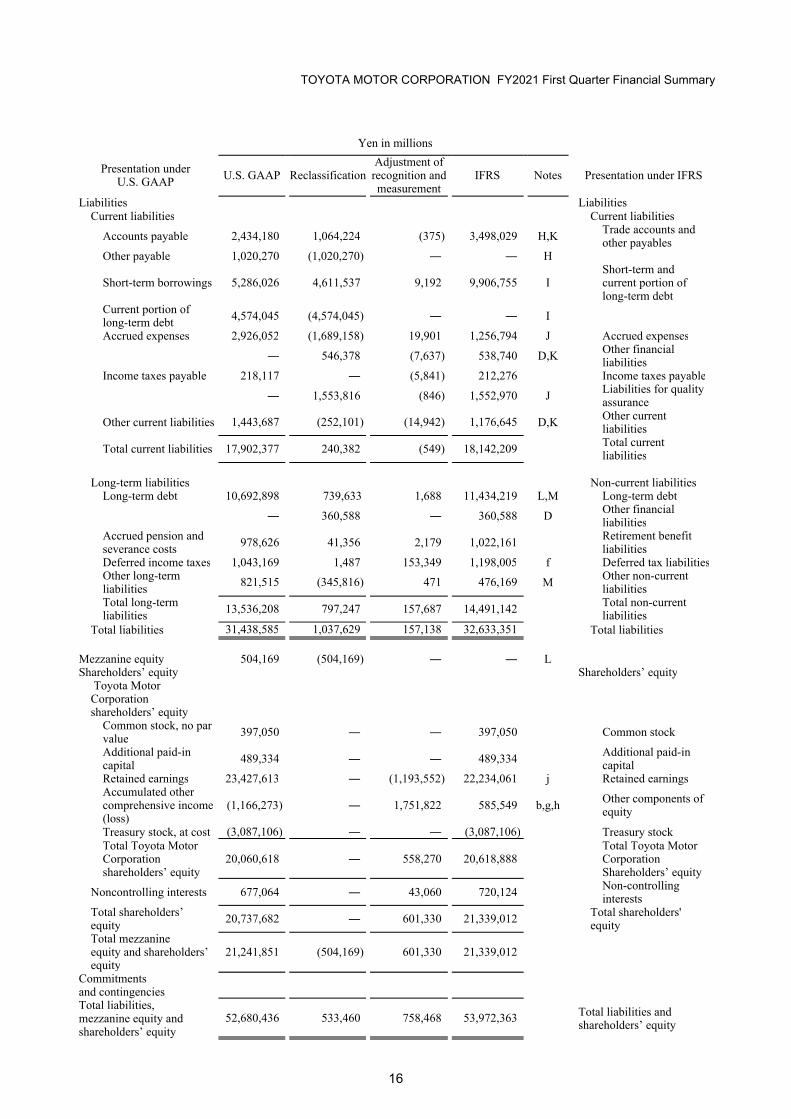
Reconciliation of equity as of the end of the prior period (March 31, 2020)
Presentation underU.S. GAAP U.S. GAAP Reclassification
Adjustment of recognition and measurement
IFRS Notes Presentation under IFRS
Assets AssetsCurrent assets Current assets
Cash and cash equivalents 4,190,518 ― (92,068) 4,098,450 Cash and cash
equivalentsTrade accounts and notes receivables,less allowance fordoubtful accounts
2,094,894 564,854 (11,389) 2,648,360 A Trade accounts and other receivables
Other receivables 564,854 (564,854) ― ― AFinance receivables, net 6,614,171 ― 7,433 6,621,604 Receivables related to
financial servicesTime deposits 828,220 1,316,339 (958) 2,143,602 B,C,D Other financial assetsMarketable securities 678,731 (678,731) ― ― BInventories 2,434,918 ― 98,974 2,533,892 a Inventories
― 237,333 275 237,609 E Income tax receivablePrepaid expenses and other current assets 1,236,225 (578,614) 22,193 679,804 C,D,E Other current assets
Total current assets 18,642,531 296,327 24,462 18,963,320 Total current assets
Non-current assetsInvestments in affiliated companies 4,123,453 81,731 92,380 4,297,564
Investments accounted for using the equity method
Noncurrent finance receivables, net 10,423,858 49 (6,109) 10,417,797 Receivables related to
financial servicesMarketable securities and other securities investments
7,348,651 502,296 50,570 7,901,517 D,F,G,b Other financial assets
Employees receivables 21,484 (21,484) ― ― FProperty, plant and equipment
Property, plant and equipment
Land 1,346,988 165 (28,189) 1,318,964 c Land Buildings 4,730,783 (19,860) 30,528 4,741,451 Buildings Machinery and equipment 11,939,121 (43,092) 83,419 11,979,449 Machinery and
equipment Vehicles and equipment on operating leases
5,929,233 ― (400) 5,928,833 Vehicles and equipment on operating leases
Construction in progress 510,963 60 6,438 517,460 Construction in
progress Total property, plant and equipment, at cost
24,457,088 (62,728) 91,797 24,486,156 Total property, plant and equipment, at cost
Less - Accumulated depreciation
(13,855,563) 2,355 (98,933) (13,952,141) Less - Accumulated depreciation and impairment losses
Total property, plant and equipment, net
10,601,525 (60,373) (7,136) 10,534,016 Total property, plant and equipment, net
― 337,442 (107) 337,335 G Right of use assets― 374,263 625,994 1,000,257 G,e Intangible assets― 354,785 (28,420) 326,364 G,f Deferred tax assets
Other 1,518,934 (1,331,576) 6,834 194,192 G Other non-current assets
34,037,905 237,133 734,005 35,009,043 Total non-current assets
Total assets 52,680,436 533,460 758,468 53,972,363 Total assets
Yen in millions
15
TOYOTA MOTOR CORPORATION FY2021 First Quarter Financial Summary
Yen in millions
Presentation under U.S. GAAP U.S. GAAP Reclassification
Adjustment of recognition and measurement
IFRS Notes Presentation under IFRS
Liabilities LiabilitiesCurrent liabilities Current liabilities
Accounts payable 2,434,180 1,064,224 (375) 3,498,029 H,K Trade accounts and other payables
Other payable 1,020,270 (1,020,270) ― ― H
Short-term borrowings 5,286,026 4,611,537 9,192 9,906,755 IShort-term and current portion of long-term debt
Current portion of long-term debt 4,574,045 (4,574,045) ― ― IAccrued expenses 2,926,052 (1,689,158) 19,901 1,256,794 J Accrued expenses
― 546,378 (7,637) 538,740 D,K Other financial liabilities
Income taxes payable 218,117 ― (5,841) 212,276 Income taxes payable― 1,553,816 (846) 1,552,970 J Liabilities for quality
assuranceOther current liabilities 1,443,687 (252,101) (14,942) 1,176,645 D,K Other current
liabilitiesTotal current liabilities 17,902,377 240,382 (549) 18,142,209 Total current
liabilities
Long-term liabilities Non-current liabilitiesLong-term debt 10,692,898 739,633 1,688 11,434,219 L,M Long-term debt
― 360,588 ― 360,588 D Other financial liabilities
Accrued pension and severance costs 978,626 41,356 2,179 1,022,161 Retirement benefit
liabilitiesDeferred income taxes 1,043,169 1,487 153,349 1,198,005 f Deferred tax liabilitiesOther long-term liabilities 821,515 (345,816) 471 476,169 M Other non-current
liabilitiesTotal long-term liabilities 13,536,208 797,247 157,687 14,491,142 Total non-current
liabilitiesTotal liabilities 31,438,585 1,037,629 157,138 32,633,351 Total liabilities
Mezzanine equity 504,169 (504,169) ― ― LShareholders’ equity Shareholders’ equity
Toyota Motor Corporation shareholders’ equity
Common stock, no par value 397,050 ― ― 397,050 Common stockAdditional paid-in capital 489,334 ― ― 489,334 Additional paid-in
capitalRetained earnings 23,427,613 ― (1,193,552) 22,234,061 j Retained earningsAccumulated other comprehensive income (loss)
(1,166,273) ― 1,751,822 585,549 b,g,h Other components of equity
Treasury stock, at cost (3,087,106) ― ― (3,087,106) Treasury stockTotal Toyota Motor Corporation shareholders’ equity
20,060,618 ― 558,270 20,618,888Total Toyota Motor Corporation Shareholders’ equity
Noncontrolling interests 677,064 ― 43,060 720,124 Non-controllinginterests
Total shareholders’ equity 20,737,682 ― 601,330 21,339,012 Total shareholders'
equityTotal mezzanine equity and shareholders’ equity
21,241,851 (504,169) 601,330 21,339,012
Commitments and contingenciesTotal liabilities, mezzanine equity and shareholders’ equity
52,680,436 533,460 758,468 53,972,363 Total liabilities and shareholders’ equity
16
TOYOTA MOTOR CORPORATION FY2021 First Quarter Financial Summary
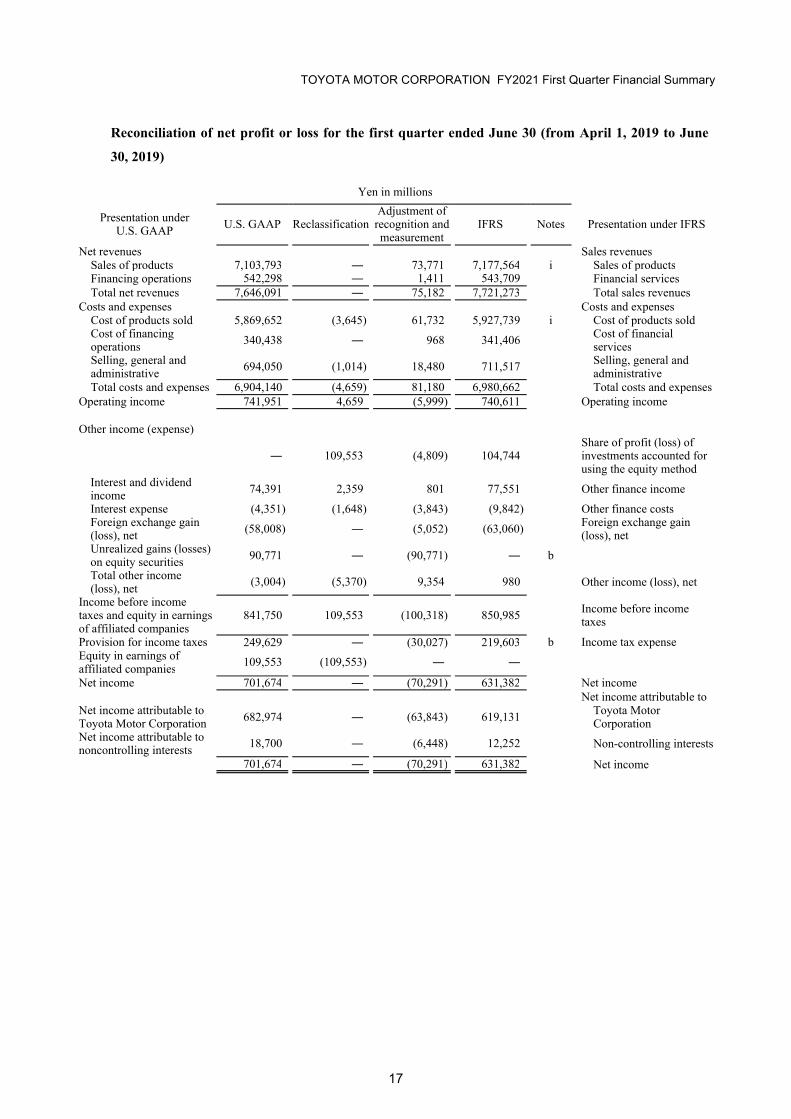
Reconciliation of net profit or loss for the first quarter ended June 30 (from April 1, 2019 to June 30, 2019)
Yen in millions
Presentation underU.S. GAAP U.S. GAAP Reclassification
Adjustment of recognition and measurement
IFRS Notes Presentation under IFRS
Net revenues Sales revenuesSales of products 7,103,793 ― 73,771 7,177,564 i Sales of productsFinancing operations 542,298 ― 1,411 543,709 Financial servicesTotal net revenues 7,646,091 ― 75,182 7,721,273 Total sales revenues
Costs and expenses Costs and expensesCost of products sold 5,869,652 (3,645) 61,732 5,927,739 i Cost of products soldCost of financing operations 340,438 ― 968 341,406 Cost of financial
servicesSelling, general and administrative 694,050 (1,014) 18,480 711,517 Selling, general and
administrativeTotal costs and expenses 6,904,140 (4,659) 81,180 6,980,662 Total costs and expenses
Operating income 741,951 4,659 (5,999) 740,611 Operating income
Other income (expense)
― 109,553 (4,809) 104,744Share of profit (loss) of investments accounted for using the equity method
Interest and dividend income 74,391 2,359 801 77,551 Other finance incomeInterest expense (4,351) (1,648) (3,843) (9,842) Other finance costsForeign exchange gain (loss), net (58,008) ― (5,052) (63,060) Foreign exchange gain
(loss), netUnrealized gains (losses) on equity securities 90,771 ― (90,771) ― bTotal other income (loss), net (3,004) (5,370) 9,354 980 Other income (loss), net
Income before income taxes and equity in earnings of affiliated companies
841,750 109,553 (100,318) 850,985 Income before income taxes
Provision for income taxes 249,629 ― (30,027) 219,603 b Income tax expenseEquity in earnings of affiliated companies 109,553 (109,553) ― ―
Net income 701,674 ― (70,291) 631,382 Net incomeNet income attributable to
Net income attributable to Toyota Motor Corporation 682,974 ― (63,843) 619,131 Toyota Motor
CorporationNet income attributable to noncontrolling interests 18,700 ― (6,448) 12,252 Non-controlling interests
701,674 ― (70,291) 631,382 Net income
17

TOYOTA MOTOR CORPORATION FY2021 First Quarter Financial Summary
Reconciliation of other comprehensive income for the first quarter ended June 30 (from April 1, 2019 to June 30, 2019)
Yen in millions
Presentation underU.S. GAAP U.S. GAAP Reclassification
Adjustment of recognition and measurement
IFRS Notes Presentation under IFRS
Net income 701,674 ― (70,291) 631,382 Net income
Other comprehensive income (loss), net of tax
Other comprehensive income, net of tax
Items that will not be reclassified to profit (loss)
Unrealized gains (losses) on securities 40,453 (40,453) 62,717 62,717 b
Net changes in revaluation of financial assets measured at fair value through other comprehensive income
Pension liability adjustments (2,562) 93 (2,283) (4,752) Remeasurements of
defined benefit plans
― (93) 45,107 45,014Shares of other comprehensive income of equity method investees
37,891 (40,453) 105,541 102,979Total of items that will not be reclassified to profit (loss)
Items that may be reclassified subsequently to profit (loss)
Foreign currency translation adjustments (143,006) 64,719 (92,868) (171,155)
Exchange differences on translating foreign operations
― 40,453 (565) 39,888
Net changes in revaluation of financial assets measured at fair value through other comprehensive income
― (64,719) 53,620 (11,099)Shares of other comprehensive income of equity method investees
(143,006) 40,453 (39,812) (142,366)Total of items that may be reclassified subsequently to profit (loss)
Total other comprehensive income (loss)
(105,115) ― 65,729 (39,386)Total other comprehensive income, net of tax
Comprehensive income 596,559 ― (4,562) 591,996 Comprehensive income
Comprehensive income for the period attributable to
Comprehensive income attributable to Toyota Motor Corporation
577,135 ― 5,414 582,549 Toyota Motor Corporation
Comprehensive income attributable to noncontrolling interests
19,424 ― (9,976) 9,447 Non-controlling interests
596,559 ― (4,562) 591,996 Comprehensive income
18

TOYOTA MOTOR CORPORATION FY2021 First Quarter Financial Summary
Reconciliation of net profit or loss for prior period (from April 1, 2019 to March 31, 2020)
Yen in millions
Presentation under U.S. GAAP U.S. GAAP Reclassification
Adjustment of recognition and measurement
IFRS Notes Presentation under IFRS
Net revenues Sales revenuesSales of products 27,759,749 ― (66,056) 27,693,693 i Sales of productsFinancing operations 2,170,243 ― 2,611 2,172,854 Financial servicesTotal net revenues 29,929,992 ― (63,445) 29,866,547 Total sales revenues
Costs and expenses Costs and expensesCost of products sold 23,142,744 (12,761) (26,387) 23,103,596 i Cost of products soldCost of financing operations 1,379,620 ― 2,134 1,381,755 Cost of financial
servicesSelling, general and administrative 2,964,759 (3,391) 20,597 2,981,965 Selling, general and
administrativeTotal costs and expenses 27,487,123 (16,153) (3,655) 27,467,315 Total costs and expenses
Operating income 2,442,869 16,153 (59,790) 2,399,232 Operating income
Other income (expense)
― 271,153 39,094 310,247Share of profit (loss) of investments accounted for using the equity method
Interest and dividend income 232,870 77,241 (4,266) 305,846 Other finance incomeInterest expense (32,217) (2,573) (12,365) (47,155) Other finance costsForeign exchange gain (loss), net (79,020) ― (15,599) (94,619) Foreign exchange gain
(loss), netUnrealized gains (losses) on equity securities (24,600) ― 24,600 ― bTotal other income (loss), net 14,705 (90,821) (4,491) (80,607) Other income (loss), net
Income before income taxes and equity in earnings of affiliated companies
2,554,607 271,152 (32,817) 2,792,942 Income before income taxes
Provision for income taxes 683,430 ― (1,613) 681,817 b Income tax expenseEquity in earnings of affiliated companies 271,152 (271,152) ― ―
Net income 2,142,329 ― (31,204) 2,111,125 Net incomeNet income attributable to
Net income attributable to Toyota Motor Corporation 2,076,183 ― (40,043) 2,036,140 Toyota Motor
CorporationNet income attributable to noncontrolling interests 66,146 ― 8,839 74,985 Non-controlling interests
2,142,329 ― (31,204) 2,111,125 Net income
19
TOYOTA MOTOR CORPORATION FY2021 First Quarter Financial Summary
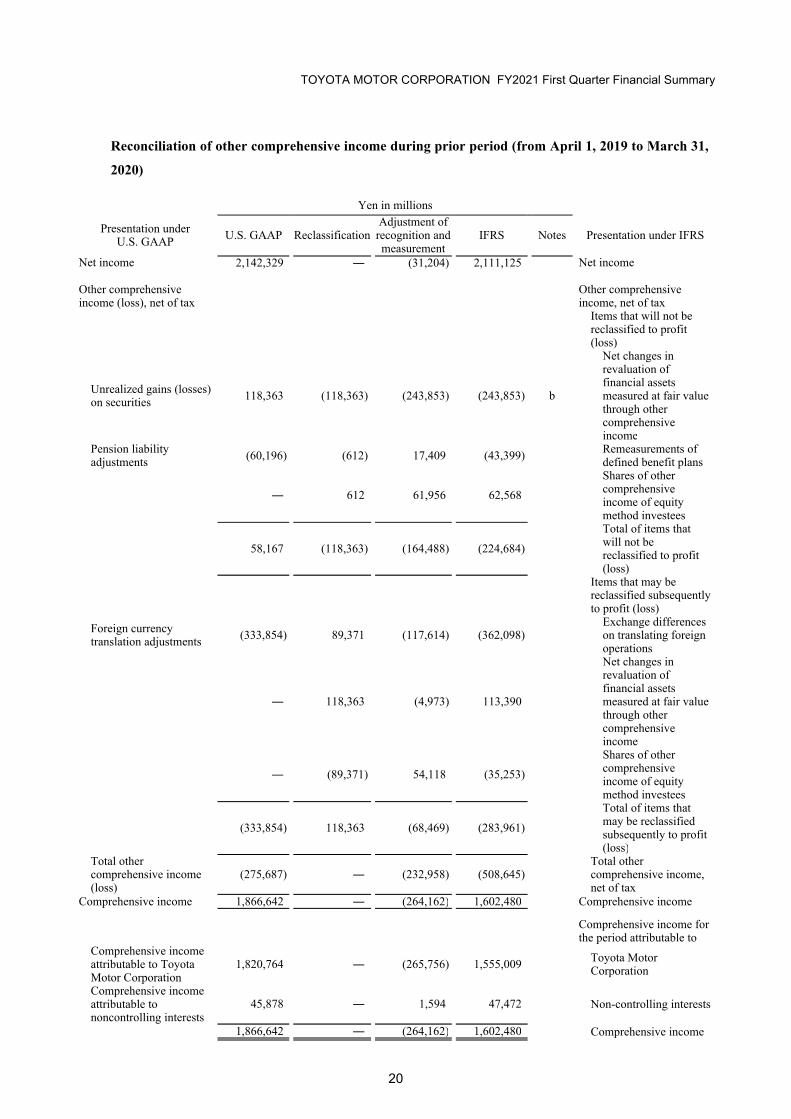
Reconciliation of other comprehensive income during prior period (from April 1, 2019 to March 31, 2020)
Presentation underU.S. GAAP U.S. GAAP Reclassification
Adjustment of recognition and measurement
IFRS Notes Presentation under IFRS
Net income 2,142,329 ― (31,204) 2,111,125 Net income
Other comprehensive income (loss), net of tax
Other comprehensive income, net of tax
Items that will not be reclassified to profit (loss)
Unrealized gains (losses) on securities 118,363 (118,363) (243,853) (243,853) b
Net changes in revaluation of financial assets measured at fair value through other comprehensive income
Pension liability adjustments (60,196) (612) 17,409 (43,399) Remeasurements of
defined benefit plans
― 612 61,956 62,568Shares of other comprehensiveincome of equity method investees
58,167 (118,363) (164,488) (224,684)Total of items that will not be reclassified to profit (loss)
Items that may be reclassified subsequently to profit (loss)
Foreign currency translation adjustments (333,854) 89,371 (117,614) (362,098)
Exchange differences on translating foreign operations
― 118,363 (4,973) 113,390
Net changes in revaluation of financial assets measured at fair value through other comprehensive income
― (89,371) 54,118 (35,253)Shares of other comprehensiveincome of equity method investees
(333,854) 118,363 (68,469) (283,961)Total of items that may be reclassified subsequently to profit (loss)
Total other comprehensive income (loss)
(275,687) ― (232,958) (508,645)Total other comprehensive income, net of tax
Comprehensive income 1,866,642 ― (264,162) 1,602,480 Comprehensive income
Comprehensive income for the period attributable to
Comprehensive income attributable to Toyota Motor Corporation
1,820,764 ― (265,756) 1,555,009 Toyota Motor Corporation
Comprehensive income attributable to noncontrolling interests
45,878 ― 1,594 47,472 Non-controlling interests
1,866,642 ― (264,162) 1,602,480 Comprehensive income
Yen in millions
20

TOYOTA MOTOR CORPORATION FY2021 First Quarter Financial Summary
A. Other receivables separately presented under U.S. GAAP have been reclassified into trade accounts
and other receivables under IFRS.
B. Marketable securities separately presented under U.S. GAAP have been reclassified into other
financial assets in current assets under IFRS.
C. Other financial assets included in prepaid expenses and other current assets under U.S. GAAP are
separately presented under IFRS.
D. Derivative assets and liabilities that meet certain requirements are offset under U.S. GAAP. Under
IFRS they are presented in gross amount.
E. Income tax receivable included in prepaid expenses and others current assets under U.S. GAAP are
separately presented under IFRS.
F. Employees receivables separately presented under U.S. GAAP have been reclassified into other
financial assets in non-current assets under IFRS.
G. Right of use assets, intangible assets, deferred tax assets and other financial assets in non-current
assets included in other in investment and other assets under U.S. GAAP are separately presented
under IFRS.
H. Other payables separately presented under U.S. GAAP have been reclassified into trade accounts
and other payables under IFRS.
I. Current portion of long-term debt separately presented under U.S. GAAP have been reclassified
into short-term and current portion of long-term debt under IFRS.
J. Liabilities for quality assurance included in accrued expenses under U.S. GAAP are separately
presented under IFRS.
K. Other financial liabilities included in other current liabilities under U.S. GAAP are separately
presented under IFRS.
L. Model AA Class Shares presented as mezzanine equity under U.S. GAAP have been reclassified
into long-term debt under IFRS.
M. Lease liabilities included in other long-term liabilities under U.S. GAAP have been reclassified into
long-term debt under IFRS.
Notes to reconciliation
Changes in presentation -
21
TOYOTA MOTOR CORPORATION FY2021 First Quarter Financial Summary
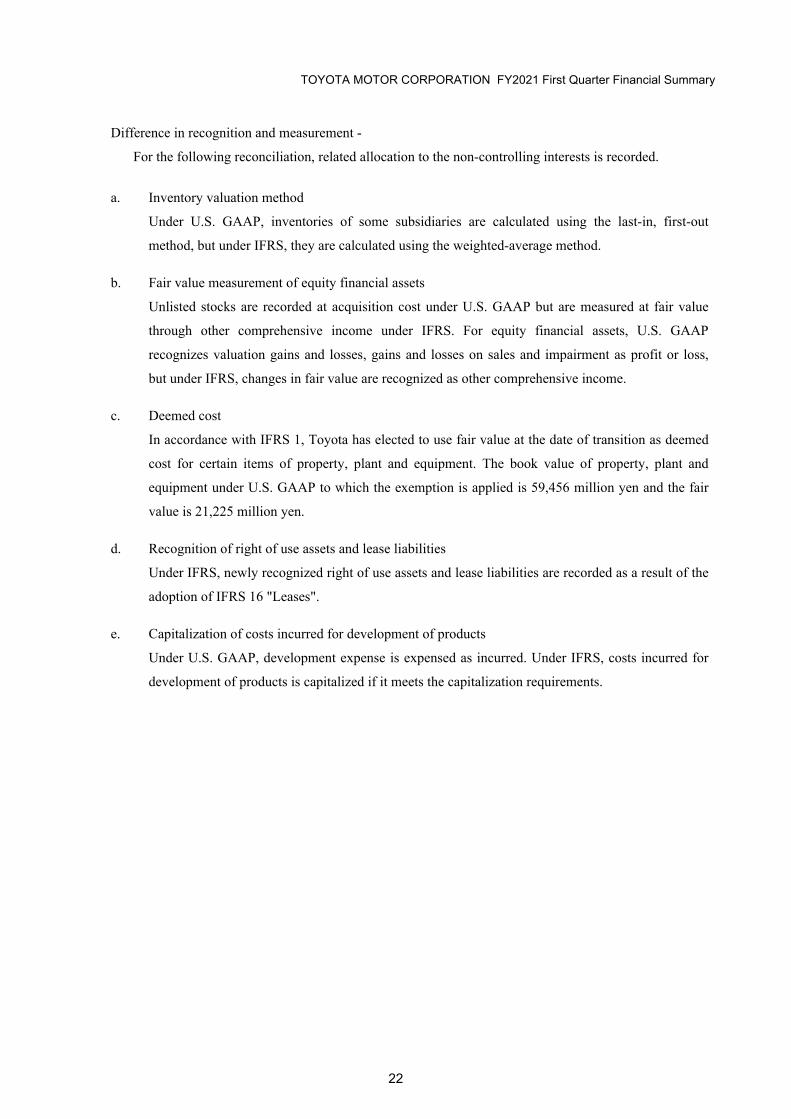
Difference in recognition and measurement -
For the following reconciliation, related allocation to the non-controlling interests is recorded.
a. Inventory valuation method
Under U.S. GAAP, inventories of some subsidiaries are calculated using the last-in, first-out
method, but under IFRS, they are calculated using the weighted-average method.
b. Fair value measurement of equity financial assets
Unlisted stocks are recorded at acquisition cost under U.S. GAAP but are measured at fair value
through other comprehensive income under IFRS. For equity financial assets, U.S. GAAP
recognizes valuation gains and losses, gains and losses on sales and impairment as profit or loss,
but under IFRS, changes in fair value are recognized as other comprehensive income.
c. Deemed cost
In accordance with IFRS 1, Toyota has elected to use fair value at the date of transition as deemed
cost for certain items of property, plant and equipment. The book value of property, plant and
equipment under U.S. GAAP to which the exemption is applied is 59,456 million yen and the fair
value is 21,225 million yen.
d. Recognition of right of use assets and lease liabilities
Under IFRS, newly recognized right of use assets and lease liabilities are recorded as a result of the
adoption of IFRS 16 "Leases".
e. Capitalization of costs incurred for development of products
Under U.S. GAAP, development expense is expensed as incurred. Under IFRS, costs incurred for
development of products is capitalized if it meets the capitalization requirements.
22

TOYOTA MOTOR CORPORATION FY2021 First Quarter Financial Summary
f. Deferred income taxes
Deferred income taxes have been adjusted due to the other adjustments from U.S. GAAP to IFRS.
The adjustment mainly related to 188,837 million yen (as of April 1, 2019), 186,321 million yen (as
of June 30, 2019), and 193,271 million yen (as of March 31, 2020) of the capitalization of
development costs.
g. Exchange differences on translating foreign operations
In accordance with the first-time exemption, the cumulative translation differences of foreign
operations as of the Transition Date are transferred from other components of equity to retained
earnings.
h. Retirement benefit obligations for defined benefit plans
Under U.S. GAAP, actuarial gains and losses and past service cost are recognized in other
comprehensive income when they are incurred and amortized over a certain period of future years.
Under IFRS, remeasurements arising from defined benefit plans, including actuarial gains and
losses are recognized in other comprehensive income and reclassified directly from other
components of equity to retained earnings when they are incurred. Past service cost is recognized in
profit or loss when incurred.
i. Unification of a reporting period
For certain consolidated subsidiaries and companies accounted for by the equity method that have
closing dates different from Toyota, the reporting period has been unified to Toyota’s closing date
on the Transition Date.
j. Reconciliation of retained earnings
Yen in millions
Transition Date(April 1, 2019)
First quarter(June 30, 2019)
Prior fiscal year(March 31, 2020)
b. Fair value measurement of equity instruments (990,815) (1,049,567) (799,568)g. Exchange differences on translating foreign
operations (649,532) (649,532) (649,532)h. Retirement benefit obligations for defined
benefit plans (265,867) (268,571) (324,014)
Subtotal (1,906,213) (1,967,670) (1,773,114)e. Capitalization of cost incurred for development
of product 410,531 416,660 432,202
i. Unification of a reporting period 85,211 72,371 51,480Others 36,732 42,708 95,880Total (1,373,738) (1,435,930) (1,193,552)
Subtotal represents reclassification from other components of equity.
23
TOYOTA MOTOR CORPORATION FY2021 First Quarter Financial Summary
Adjustments on the Cash FlowsAcquisitions, collections and sales of receivables from financial services which were classified as cash
flows from investing activities under U.S. GAAP are classified as cash flows from operating activities
under IFRS.
24
TOYOTA MOTOR CORPORATION FY2021 First Quarter Financial Summary
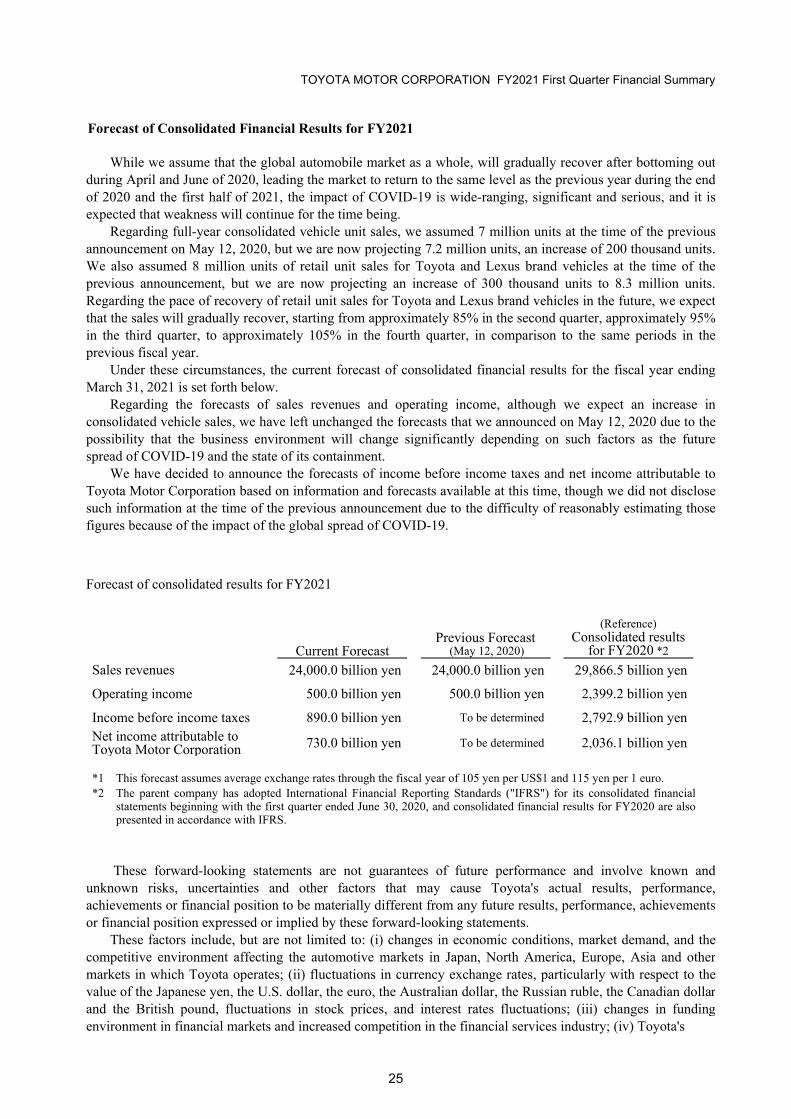
Forecast of Consolidated Financial Results for FY2021
While we assume that the global automobile market as a whole, will gradually recover after bottoming outduring April and June of 2020, leading the market to return to the same level as the previous year during the endof 2020 and the first half of 2021, the impact of COVID-19 is wide-ranging, significant and serious, and it isexpected that weakness will continue for the time being.
Regarding full-year consolidated vehicle unit sales, we assumed 7 million units at the time of the previousannouncement on May 12, 2020, but we are now projecting 7.2 million units, an increase of 200 thousand units.We also assumed 8 million units of retail unit sales for Toyota and Lexus brand vehicles at the time of theprevious announcement, but we are now projecting an increase of 300 thousand units to 8.3 million units.Regarding the pace of recovery of retail unit sales for Toyota and Lexus brand vehicles in the future, we expectthat the sales will gradually recover, starting from approximately 85% in the second quarter, approximately 95%in the third quarter, to approximately 105% in the fourth quarter, in comparison to the same periods in theprevious fiscal year.
Under these circumstances, the current forecast of consolidated financial results for the fiscal year endingMarch 31, 2021 is set forth below.
Regarding the forecasts of sales revenues and operating income, although we expect an increase inconsolidated vehicle sales, we have left unchanged the forecasts that we announced on May 12, 2020 due to thepossibility that the business environment will change significantly depending on such factors as the futurespread of COVID-19 and the state of its containment.
We have decided to announce the forecasts of income before income taxes and net income attributable toToyota Motor Corporation based on information and forecasts available at this time, though we did not disclosesuch information at the time of the previous announcement due to the difficulty of reasonably estimating thosefigures because of the impact of the global spread of COVID-19.
Forecast of consolidated results for FY2021
Current ForecastPrevious Forecast
(May 12, 2020)
(Reference)Consolidated results
for FY2020 *2Sales revenues 24,000.0 billion yen 24,000.0 billion yen 29,866.5 billion yen
Operating income 500.0 billion yen 500.0 billion yen 2,399.2 billion yen
Income before income taxes 890.0 billion yen To be determined 2,792.9 billion yenNet income attributable toToyota Motor Corporation 730.0 billion yen To be determined 2,036.1 billion yen
*1 This forecast assumes average exchange rates through the fiscal year of 105 yen per US$1 and 115 yen per 1 euro.*2 The parent company has adopted International Financial Reporting Standards ("IFRS") for its consolidated financial
statements beginning with the first quarter ended June 30, 2020, and consolidated financial results for FY2020 are also presented in accordance with IFRS.
These forward-looking statements are not guarantees of future performance and involve known andunknown risks, uncertainties and other factors that may cause Toyota's actual results, performance,achievements or financial position to be materially different from any future results, performance, achievementsor financial position expressed or implied by these forward-looking statements.
These factors include, but are not limited to: (i) changes in economic conditions, market demand, and thecompetitive environment affecting the automotive markets in Japan, North America, Europe, Asia and othermarkets in which Toyota operates; (ii) fluctuations in currency exchange rates, particularly with respect to thevalue of the Japanese yen, the U.S. dollar, the euro, the Australian dollar, the Russian ruble, the Canadian dollarand the British pound, fluctuations in stock prices, and interest rates fluctuations; (iii) changes in fundingenvironment in financial markets and increased competition in the financial services industry; (iv) Toyota's
25
TOYOTA MOTOR CORPORATION FY2021 First Quarter Financial Summary
ability to market and distribute effectively; (v) Toyota's ability to realize production efficiencies and toimplement capital expenditures at the levels and times planned by management; (vi) changes in the laws,regulations and government policies in the markets in which Toyota operates that affect Toyota's automotiveoperations, particularly laws, regulations and government policies relating to vehicle safety including remedialmeasures such as recalls, trade, environmental protection, vehicle emissions and vehicle fuel economy, as wellas changes in laws, regulations and government policies that affect Toyota's other operations, including theoutcome of current and future litigation and other legal proceedings, government proceedings andinvestigations; (vii) political and economic instability in the markets in which Toyota operates; (viii) Toyota'sability to timely develop and achieve market acceptance of new products that meet customer demand; (ix) anydamage to Toyota's brand image; (x) Toyota's reliance on various suppliers for the provision of supplies; (xi)increases in prices of raw materials; (xii) Toyota's reliance on various digital and information technologies;(xiii) fuel shortages or interruptions in electricity, transportation systems, labor strikes, work stoppages or otherinterruptions to, or difficulties in, the employment of labor in the major markets where Toyota purchasesmaterials, components and supplies for the production of its products or where its products are produced,distributed or sold; and (xiv) the impact of natural calamities as well as the outbreak and spread of epidemics,including the negative effect on Toyota's vehicle production and sales.
A discussion of these and other factors which may affect Toyota's actual results, performance, achievementsor financial position is contained in Toyota's annual report on Form 20-F, which is on file with the United StatesSecurities and Exchange Commission.
The global spread of COVID-19 and the responses to it by governments and other stakeholders haveadversely affected Toyota in a number of ways. For reasons such as government directives as well asanticipated reduced demand for its vehicles, Toyota has temporarily suspended, or intends to temporarilysuspend, production of automobiles and components at selected plants in Japan and overseas. COVID-19 hasalso affected, and is expected to continue to affect, the businesses of Toyota dealers and distributors, as well ascertain of Toyota’s third-party suppliers and business partners. In addition, the global spread of COVID-19 andrelated matters have adversely affected businesses in a wide variety of industries, as well as consumers, all ofwhich negatively impacted demand for Toyota’s vehicles and related financial services.
The duration of the global spread of COVID-19 and the resulting future effects are uncertain, and theforegoing impacts and other effects not referenced above, as well as the ultimate impact of COVID-19, aredifficult to predict and could have an adverse effect on Toyota’s financial condition and results of operations.
26

Supplemental Material for Financial Results for FY2021 First Quarter (Consolidated)< IFRS >
FY2020 FY2021 FY2021
Forecast1Q 12 months 1Q 12 months
(2019/4-6) ('19/4-'20/3) (2020/4-6) ('20/4-'21/3)
2,311 8,820 1,080
1,134 4,413 679
[Daihatsu & Hino] [ 265 ] [ 1,109 ] [ 178 ]
1,178 4,406 401
[Daihatsu & Hino] [ 124 ] [ 545 ] [ 15 ]
North America 499 1,807 187
Europe 174 674 82
Asia 386 1,522 109
Central andSouth America
86 293 10
Africa 33 110 13
2,318 8,955 1,158 7,200
555 2,240 385 1,960
[Daihatsu & Hino] [ 158 ] [ 657 ] [ 104 ] [ 590 ]
1,762 6,715 774 5,240
[Daihatsu & Hino] [ 65 ] [ 285 ] [ 16 ] [ 140 ]
North America 744 2,713 285 2,330
Europe 279 1,029 141 870
Asia 410 1,600 182 1,130
Central andSouth America
104 403 30 240
Oceania 66 262 48 230
Africa 54 207 24 170
Middle East 106 493 62 270
Other 2 7 2
2,709 10,457 1,848 9,100 Total Retail Unit Sales (thousands of units) [Toyota, Daihatsu and Hino]
Vehicle Production (thousands of units)
(Japan) - including Daihatsu & Hino
(Overseas) - including Daihatsu & Hino
(Japan) - including Daihatsu & Hino
(Overseas) - including Daihatsu & Hino
Vehicle Sales (thousands of units)
Supplemental 1
Supplemental Material for Financial Results for FY2021 First Quarter (Consolidated)< IFRS >
FY2020 FY2021 FY2021
Forecast1Q 12 months 1Q 12 months
(2019/4-6) ('19/4-'20/3) (2020/4-6) ('20/4-'21/3)
110 109 108
123 121 119
49.0 48.8 52.7
45.2 45.5 47.8
(Note 1)
7,721.2 4,600.7 *
Japan 4,175.0 2,675.6
North America 2,838.0 1,381.1
Europe 883.2 3,355.3 471.4
Asia 1,361.9 5,293.2 906.5
Other 553.8 2,114.1 281.2
Elimination -1,115.2
Business Segment
Automotive 6,954.5 3,976.4
Financial Services 549.1 2,193.1 534.9
All Other 370.0 1,504.9 206.0
Elimination -152.4 -631.2 -116.7
740.6 2,399.2 13.9 500.0 *
( 9.6 ) ( 8.0 ) ( 0.3 ) ( 2.1 ) Geographic Information
Japan 429.9 1,585.2 77.4
North America 112.6 253.2 -68.5
Europe 38.6 143.8 -21.9
Asia 109.1 363.5 42.8
Other 21.1 84.0 -11.7
Elimination 29.0 -30.6 -4.0
Business Segment
Automotive 617.8 2,013.1 -86.5
Financial Services 109.7 283.7 92.2
All Other 14.2 103.3 9.3
Elimination -1.2 -0.9 -1.1
104.7 310.2 -12.5 200.0
850.9 2,792.9 118.2 890.0
( 11.0 ) ( 9.4 ) ( 2.6 ) ( 3.7 )
619.1 2,036.1 158.8 730.0
( 8.0 ) ( 6.8 ) ( 3.5 ) ( 3.0 )
Common Shares
― 610.8 ― (Note 2)
Cash Dividends per Share (yen) ― 220 ―
Payout Ratio (%) ― 29.9 ― Model AA Class Shares
― 12.4 ― (Note 2)
Cash Dividends per Share (yen) ― 264 ―
54.2 499.9 ― (Note 3)
― ― (Note 3)(Note 4)
47,100 47,100 47,100
10,642.0
-7,980.0
26,799.7
Income before Income Taxes (billions of yen)
Net Income Attributable toToyota Motor Corporation (billions of yen)
(Income before Income Taxes Ratio) (%)
(Operating Income Ratio) (%)
Operating Income (billions of yen)
Share of Profit (Loss) of Investments Accounted for Using the Equity Method (billions of yen)
-2,090.8
Dividends
(Net Income Ratio) (%)
Cash Dividends (billions of yen)
Number of Outstanding Common Shares (thousands)
Cash Dividends (billions of yen)
Value of Shares Repurchased (billions of yen)[actual purchase] Value of Shares Repurchased (billions of yen)[shareholder return]
Number of Outstanding Model AA Class Shares (thousands)
Yen to US Dollar Rate
Yen to Euro Rate
Sales Revenues (billions of yen)
Toyota, Daihatsu and Hino (including Mini-Vehicles) (%)
Geographic Information
Number of Employees
Toyota(excluding Mini-Vehicles) (%)
Foreign Exchange Rates
Market Share (Japan)
379,201
3,262,9973,262,997
369,701361,907
29,866.5
199.9
16,441.8
3,262,997
as premise:105
as premise:115
24,000.0
Supplemental 2
Supplemental Material for Financial Results for FY2021 First Quarter (Consolidated)< IFRS >
FY2020 FY2021 FY2021
Forecast1Q 12 months 1Q 12 months
(2019/4-6) ('19/4-'20/3) (2020/4-6) ('20/4-'21/3)
297.4 1,110.3 280.7 1,100.0 (Note 5)
196.9 803.3 204.0 830.0 (Note 6)
Japan 88.6 376.5 98.1
North America 54.0 212.4 59.0
Europe 13.2 52.5 14.1
Asia 32.4 129.4 25.9
Other 8.5 32.3 6.7
272.7 1,372.3 260.3 1,350.0 (Note 6)
Japan 144.8 747.2 147.1
North America 69.8 341.2 54.8
Europe 19.5 103.3 14.8
Asia 23.0 123.0 35.2
Other 15.4 57.4 8.3
9,197.1 8,602.6 9,451.8 (Note 7)
12.4 10.0 3.1
4.6 3.8 1.2
537
199
Analysis of Consolidated Net Income
Attributable to Toyota Motor Corporation for FY2021 1Q (billions of yen, approximately) (2020/4-6)
Effects of Marketing Activities -810.0
Effects of Changes in Exchange Rates -75.0
Cost Reduction Efforts 10.0
From Engineering 5.0
From Manufacturing and Logistics 5.0
75.0
Other 73.4
(Changes in Operating Income) -726.6
Non-operating Income -6.0
-117.3
272.4
-460.2
* Regarding the forecasts of sales revenues and operating income, Toyota has left unchanged the forecasts announced on May 12, 2020 due to the possibility that the business environment will change significantly depending on such factors as the future spread of COVID-19 and the state of its containment.
(Note 1) Shows the number of employees as of the end of each period (excluding loan employees from Toyota to outside Toyota and including loan employees from outside Toyota to Toyota) (Note 2) 2Q= Interim Dividend, 4Q= Year-end Dividend, FY= Annual Dividend(Note 3) Value of common shares repurchased (excluding shares constituting less than one unit that were purchased upon request). This does not include the commission fees incurred for the repurchase(Note 4) Value of common shares repurchased (shareholder return on Net Income for the period)(Note 5) Figures for R&D expenses are R&D activity related expenditures incurred during the reporting period and do not conform to "R&D Expenses" on Toyota's Consolidated Statement of Income(Note 6) Figures for depreciation expenses and capital expenditures do not include vehicles in operating lease or right of use assets(Note 7) Cash and cash equivalents, time deposits, public and corporate bonds and its investment in monetary trust funds, excluding in each case those relating to financial services
(Changes in Net Income Attributable to Toyota Motor Corporation)
R&D Expenses (billions of yen)
Capital Expenditures (billions of yen)
Return on Asset (%)
Geographic Information
Total Assets (billions of yen)
Increase or Decrease in Expenses and Expense Reduction Efforts
Share of Profit (Loss) of Investments Accounted for Using the Equity Method
Income tax expense, Net Income Attributable to Non-controlling Interests
Number of Associates and Joint Ventures Accounted for Using the Equity Method
Number of Consolidated Subsidiaries (including Structured Entities)
Toyota Motor Corporation Shareholders' Equity (billions of yen)
Return on Equity (%)
Total Liquid Assets (billions of yen)
Geographic Information
Depreciation Expenses (billions of yen)
20,713.9
53,972.3
20,618.820,096.3
53,288.7 55,916.5
Cautionary Statement with Respect to Forward-Looking StatementsThis report contains forward-looking statements that reflect Toyota's plans and expectations. These forward-looking statements are not guarantees of future performance and involve known and unknown risks, uncertainties andother factors that may cause Toyota's actual results, performance, achievements or financial position to be materially different from any future results, performance, achievements or financial position expressed or implied by these forward-looking statements. These factors include, but are not limited to: (i) changes in economic conditions, market demand, and the competitive environment affecting the automotive markets in Japan, North America, Europe, Asia and other markets in which Toyota operates; (ii) fluctuations in currency exchange rates, particularly with respect to the value of the Japanese yen, the U.S. dollar, the euro, the Australian dollar, the Russian ruble, the Canadian dollar and the British pound, fluctuations in stock prices, and interest rates fluctuations; (iii)changes in funding environment in financial markets and increased competition in the financial services industry; (iv)Toyota's ability to market and distribute effectively; (v) Toyota's ability to realize production efficiencies and to implement capital expenditures at the levels and times planned by management; (vi) changes in the laws, regulations and government policies in the markets in which Toyota operates that affect Toyota's automotive operations, particularly laws, regulations and government policies relating to vehicle safety including remedial measures such as recalls, trade, environmental protection, vehicle emissions and vehicle fuel economy, as well as changes in laws, regulations and government policies that affect Toyota's other operations, including the outcome of current and future litigation and other legal proceedings, government proceedings and investigations; (vii) political and economic instability in the markets in which Toyota operates; (viii) Toyota's ability to timely develop and achieve market acceptance of new products that meet customer demand; (ix) any damage to Toyota's brand image; (x) Toyota's reliance on various suppliers for the provision of supplies; (xi) increases in prices of raw materials; (xii) Toyota's reliance on various digital and information technologies; (xiii) fuel shortages or interruptions in electricity, transportation systems, labor strikes, work stoppages or other interruptions to, or difficulties in, the employment of labor in the major markets where Toyota purchases materials, components and supplies for the production of its products or where its products are produced, distributed or sold; and (xiv) the impact of natural calamities as well as the outbreak and spread of epidemics, including the negative effect on Toyota's vehicle production and sales. A discussion of these and other factors which may affect Toyota's actual results, performance, achievements or financial position is contained in Toyota's annual report on Form 20-F, which is on file with the United States Securities and Exchange Commission.The global spread of COVID-19 and the responses to it by governments and other stakeholders have adversely affected Toyota in a number of ways. For reasons such as government directives as well as anticipated reduced demand for its vehicles, Toyota hastemporarily suspended, or intends to temporarily suspend, production of automobiles and components at selected plants in Japan and overseas. COVID-19 has also affected, and is expected to continue to affect, the businesses of Toyota dealers and distributors, as well as certain of Toyota’s third-party suppliers and business partners. In addition, the global spread of COVID-19 and related matters have adversely affected businesses in a wide variety of industries, as well as consumers, all of which negatively impacted demand forToyota’s vehicles and related financial services.The duration of the global spread of COVID-19 and the resulting future effects are uncertain, and the foregoing impacts and other effects not referenced above, as well as the ultimate impact of COVID-19, are difficult to predict and could have an adverse effect on Toyota’s financial condition and results of operations.
Supplemental 3