Embed Size (px)
Citation preview
Financial statements
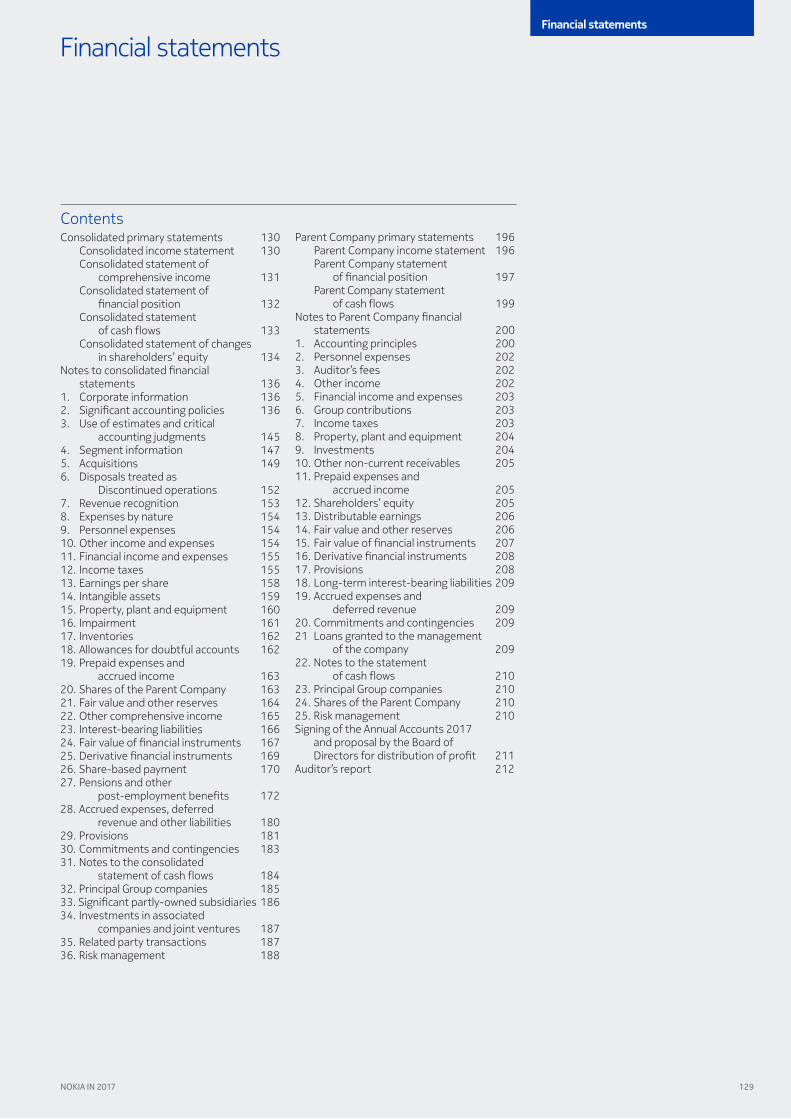
ContentsConsolidated primary statements 130
Consolidated income statement 130Consolidated statement of
comprehensive income 131Consolidated statement of
financial position 132Consolidated statement
of cash flows 133Consolidated statement of changes
in shareholders’ equity 134Notes to consolidated financial
statements 1361. Corporate information 1362. Significant accounting policies 1363. Use of estimates and critical
accounting judgments 1454. Segment information 1475. Acquisitions 1496. Disposals treated as
Discontinued operations 1527. Revenue recognition 1538. Expenses by nature 1549. Personnel expenses 15410. Other income and expenses 15411. Financial income and expenses 15512. Income taxes 15513. Earnings per share 15814. Intangible assets 15915. Property, plant and equipment 16016. Impairment 16117. Inventories 16218. Allowances for doubtful accounts 16219. Prepaid expenses and
accrued income 16320. Shares of the Parent Company 16321. Fair value and other reserves 16422. Other comprehensive income 16523. Interest-bearing liabilities 16624. Fair value of financial instruments 16725. Derivative financial instruments 16926. Share-based payment 17027. Pensions and other
post-employment benefits 17228. Accrued expenses, deferred
revenue and other liabilities 18029. Provisions 18130. Commitments and contingencies 18331. Notes to the consolidated
statement of cash flows 18432. Principal Group companies 18533. Significant partly-owned subsidiaries 18634. Investments in associated
companies and joint ventures 18735. Related party transactions 18736. Risk management 188
Parent Company primary statements 196Parent Company income statement 196Parent Company statement
of financial position 197Parent Company statement
of cash flows 199Notes to Parent Company financial
statements 2001. Accounting principles 2002. Personnel expenses 2023. Auditor’s fees 2024. Other income 2025. Financial income and expenses 2036. Group contributions 2037. Income taxes 2038. Property, plant and equipment 2049. Investments 20410. Other non-current receivables 20511. Prepaid expenses and
accrued income 20512. Shareholders’ equity 20513. Distributable earnings 20614. Fair value and other reserves 20615. Fair value of financial instruments 20716. Derivative financial instruments 20817. Provisions 20818. Long-term interest-bearing liabilities 20919. Accrued expenses and
deferred revenue 20920. Commitments and contingencies 20921 Loans granted to the management
of the company 20922. Notes to the statement
of cash flows 21023. Principal Group companies 21024. Shares of the Parent Company 21025. Risk management 210Signing of the Annual Accounts 2017
and proposal by the Board of Directors for distribution of profit 211
Auditor’s report 212
129
Financial statements
NOKIA IN 2017
130 NOKIA IN 2017
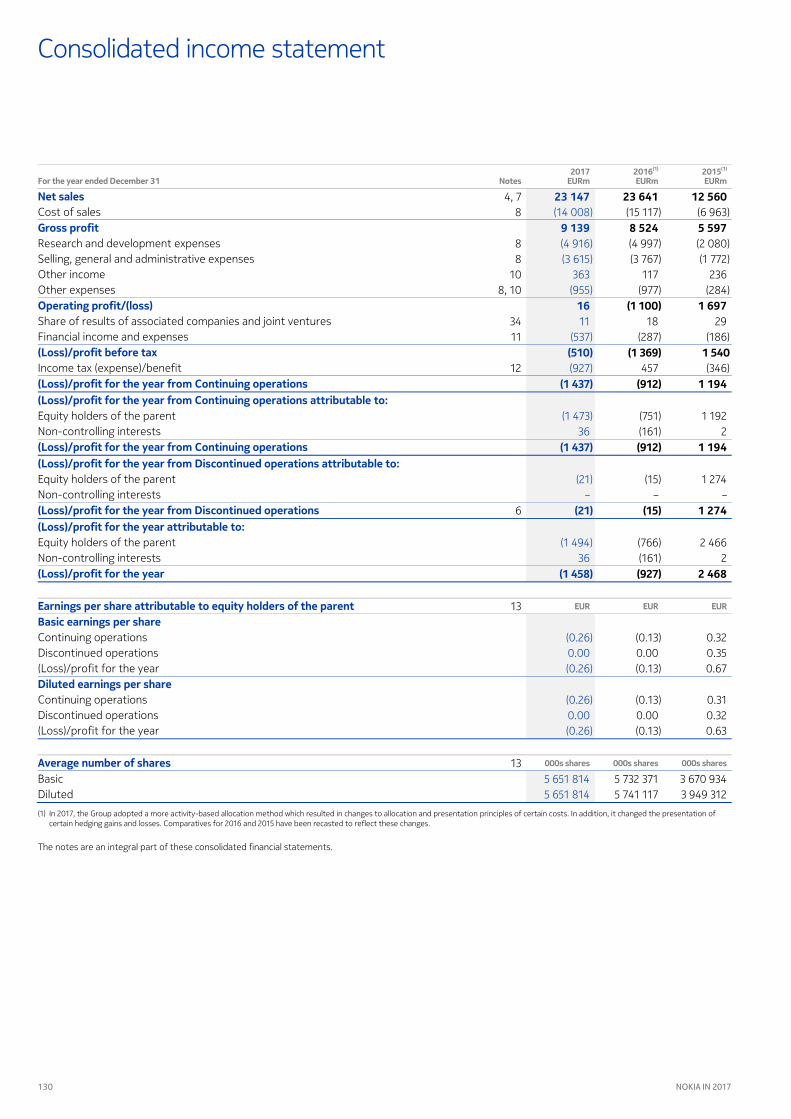
For the year ended December 31 Notes 2017
EURm 2016(1) EURm
2015(1) EURm
4, 7 23 641 12 560 Cost of sales 8 (15 117) (6 963)
8 524 5 597 Research and development expenses 8 (4 997) (2 080) Selling, general and administrative expenses 8 (3 767) (1 772) Other income 10 117 236 Other expenses 8, 10 (977) (284)
( ) 1 697 Share of results of associated companies and joint ventures 34 18 29 Financial income and expenses 11 (287) (186)
( ) Income tax (expense)/benefit 12 457 (346)
() 1 194
Equity holders of the parent (751) 1 192 Non-controlling interests (161) 2
() 1 194
Equity holders of the parent (15) 1 274 Non-controlling interests – –
6 () 1 274
Equity holders of the parent (766) 2 466 Non-controlling interests (161) 2
() 2 468
13 EUR EUR EUR
Continuing operations (0.13) 0.32 Discontinued operations 0.00 0.35 (Loss)/profit for the year (0.13) 0.67
Continuing operations (0.13) 0.31 Discontinued operations 0.00 0.32 (Loss)/profit for the year (0.13) 0.63
13 000s shares 000s shares 000s shares
Basic 5 732 371 3 670 934 Diluted 5 741 117 3 949 312 (1) In 2017, the Group adopted a more activity-based allocation method which resulted in changes to allocation and presentation principles of certain costs. In addition, it changed the presentation of
certain hedging gains and losses. Comparatives for 2016 and 2015 have been recasted to reflect these changes.
The notes are an integral part of these consolidated financial statements.
Consolidated income statement
Net sales 23 147 (14 008)
Gross profit 9 139 (4 916) (3 615)
363 (955)
Operating profit/(loss) 16 11
(537) (Loss)/profit before tax ()
(927) (Loss)/profit for the year from Continuing operations ( ) (Loss)/profit for the year from Continuing operations attributable to:
(1 473) 36
(Loss)/profit for the year from Continuing operations ( ) (Loss)/profit for the year from Discontinued operations attributable to:
(21) –
(Loss)/profit for the year from Discontinued operations () (Loss)/profit for the year attributable to:
(1 494) 36
(Loss)/profit for the year ( )
Earnings per share attributable to equity holders of the parent Basic earnings per share
(0.26) 0.00 (0.26)
Diluted earnings per share (0.26) 0.00 (0.26)
Average number of shares
5 651 814 5 651 814

131
Financial statements
NOKIA IN 2017
Consolidated statement of comprehensive income
For the year ended December 31 Notes 2017
EURm 2016
EURm 2015
EURm
(Loss)/profit for the year ( ( ) ) 2 468 Other comprehensive income
Items that will not be reclassified to profit or loss: Remeasurements on defined benefit plans 613 112 723 Income tax related to items that will not be reclassified to profit or loss (269) (28) (58)
Items that may be reclassified subsequently to profit or loss: Translation differences 251 (1 054) (1 819) Net investment hedges (103) 322 440 Cash flow hedges 14 (5) 35 Available-for-sale investments (75) 113 (88) Other (decrease)/increase, net (6) 2 (1) Income tax related to items that may be reclassified subsequently to profit or loss 20 (88) (92)
22 Other comprehensive (loss)/income, net of tax 445 ( () ) Total comprehensive (loss)/income for the year ( ( ) ) 1 842 Attributable to:
Equity holders of the parent (277) 1 837 (2 304) Non-controlling interests (205) 5 (14)
Total comprehensive (loss)/income for the year ( ( ) ) 1 842 Attributable to equity holders of the parent:
Continuing operations (262) 1 513 (2 283) Discontinued operations (15) 324 (21)
Total attributable to equity holders of the parent ( ( ) ) 1 837 Attributable to non-controlling interests:
Continuing operations (205) 5 (14) Discontinued operations – – –
Total attributable to non-controlling interests ( () ) 5 The notes are an integral part of these consolidated financial statements.

132 NOKIA IN 2017
Consolidated statement of financial position
As of December 31 Notes 2017
EURm 2016
EURm
ASSETS Non-current assets Intangible assets 14, 16 10 960 9 219 Property, plant and equipment 15 1 981 1 853 Investments in associated companies and joint ventures 34 116 128 Available-for-sale investments 24 1 040 816 Deferred tax assets 12 5 701 4 582 Other non-current financial assets 24, 36 254 215 Defined benefit pension assets 27 3 802 3 979 Other non-current assets 19 328 368 Total non-current assets 21 160 Current assets Inventories 17 2 506 2 646 Accounts receivable, net of allowances for doubtful accounts 18, 24, 36 6 972 6 880 Prepaid expenses and accrued income 19 1 296 1 259 Current income tax assets 279 474 Other financial assets 24, 25, 36 296 302 Investments at fair value through profit and loss, liquid assets 24, 36 327 – Available-for-sale investments, liquid assets 24, 36 1 502 911 Cash and cash equivalents 24, 36 7 497 7 369 Total current assets 19 841 20 675 Assets held for sale 44 23 Total assets 41 024 44 901 SHAREHOLDERS' EQUITY AND LIABILITIES Capital and reserves attributable to equity holders of the parent Share capital 20 246 246 Share issue premium 439 447 Treasury shares (881) (1 480) Translation differences 21 483 (932) Fair value and other reserves 21 488 1 094 Reserve for invested non-restricted equity 15 731 15 616 Retained earnings 3 588 1 147 Total capital and reserves attributable to equity holders of the parent 16 138 20 094 Non-controlling interests 881 80 Total equity 16 218 20 975 Non-current liabilities Long-term interest-bearing liabilities 23, 24, 36 3 657 3 457 Deferred tax liabilities 12 403 413 Defined benefit pension and post-retirement liabilities 27 5 000 4 440 Deferred revenue and other long-term liabilities 24, 28 1 453 2 986 Provisions 29 808 766 Total non-current liabilities 11 321 12 062 Current liabilities Short-term interest-bearing liabilities 23, 24, 36 370 309 Other financial liabilities 24, 25, 36 236 268 Current income tax liabilities 536 383 Accounts payable 24, 36 3 781 3 996 Accrued expenses, deferred revenue and other liabilities 28 6 412 6 666 Provisions 29 1 270 1 122 Total current liabilities 12 605 12 744 Total liabilities 23 926 24 806 Total shareholders' equity and liabilities 44 901 41 024 The notes are an integral part of these consolidated financial statements.
133
Financial statements
NOKIA IN 2017
For the year ended December 31
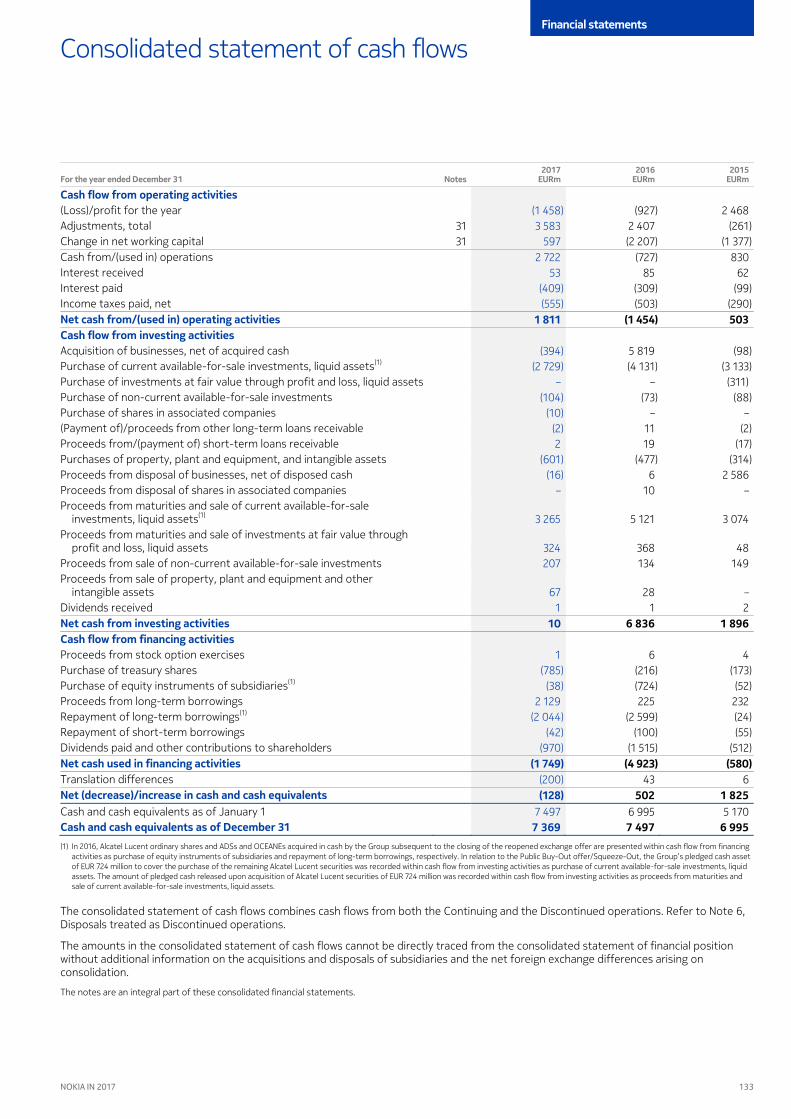
Consolidated statement of cash flows
Notes 2017
EURm2016
EURm 2015
EURm
Cash flow from operating activities (Loss)/profit for the year (927) 2 468 Adjustments, total
(1 458) 31 2 407 (261)
Change in net working capital 3 583
31 (2 207) (1 377) Cash from/(used in) operations
597 (727) 830
Interest received 2 722
85 62 Interest paid
53 (309) (99)
Income taxes paid, net (409)
(503) (290) Net cash from/(used in) operating activities
(555) 1 811 ( ) 503
Cash flow from investing activities Acquisition of businesses,
net of acquired cash 5 819 (98)
Purchase of current available-fo (394)
r-sale investments, liquid assets(1) (4 131) (3 133) Purchase of investments at fair value
(2 729) through profit and loss, liquid assets – (311)
Purchase of non-current ava –
ilable-for-sale investments (73) (88) Purchase of shares in associated companies
(104) – –
(Payment of)/proceeds from othe (10)
r long-term loans receivable 11 (2) Proceeds from/(payment of) sh
(2) ort-term loans receivable 19 (17)
Purchases of property, plant and eq 2
uipment, and intangible assets (477) (314) Proceeds from disposal of businesses, net of disposed cash
(601) 6 2 586
Proceeds from disposal of shares in associated companies (16)
10 – Proceeds from maturities and sale
– of current available-for-sale
investments, liquid assets(1) 5 121 3 074 Proceeds from maturities and sale of investments at fair value through
3 265
profit and loss, liquid assets 368 48 Proceeds from sale of non-current available-for-sale investments
324 134 149
Proceeds from sale of property 207
, plant and equipment and other intangible assets 28 –
Dividends received 67
1 2 Net cash from investing activities
1 6 836 1 896
Cash flow from financing activities 10
Proceeds from stock option exercises
6 4
Purchase of treasury shares 1
(216) (173) Purchase of equity inst
(785) ruments of subsidiaries(1) (724) (52)
Proceeds from long-term borrowings (38)
225 232 Repayment of long-term borrowings
2 129 (1) (2 599) (24)
Repayment of short-term borrowings (2 044)
(100) (55) Dividends paid and other contr
(42) ibutions to shareholders (1 515) (512)
Net cash used in financing activities (970)
( ( ) ) () Translation differences 43 6 Net (decrease)/increase in cash and cash equivalents
(200) 502 1 825
Cash and cash equivalents as of January 1 ()
6 995 5 170 7 497 Cash and cash equivalents as of December 31 7 497 6 995 (1) In 2016, Alcatel Lucent ordinary shares and ADSs and OCEANEs acquired in cash by the Group subsequent to the closing of the
7 369 reopened exchange offer are presented within cash flow from financing
activities as purchase of equity instruments of subsidiaries and repayment of long-term borrowings, respectively. In relation to the Public Buy-Out offer/Squeeze-Out, the Group’s pledged cash asset of EUR 724 million to cover the purchase of the remaining Alcatel Lucent securities was recorded within cash flow from investing activities as purchase of current available-for-sale investments, liquid assets. The amount of pledged cash released upon acquisition of Alcatel Lucent securities of EUR 724 million was recorded within cash flow from investing activities as proceeds from maturities and sale of current available-for-sale investments, liquid assets.
The consolidated statement of cash flows combines cash flows from both the Continuing and the Discontinued operations. Refer to Note , Disposals treated as Discontinued operations.
The amounts in the consolidated statement of cash flows cannot be directly traced from the consolidated statement of financial position without additional information on the acquisitions and disposals of subsidiaries and the net foreign exchange differences arising on consolidation.
The notes are an integral part of these consolidated financial statements.
134 NOKIA IN 2017
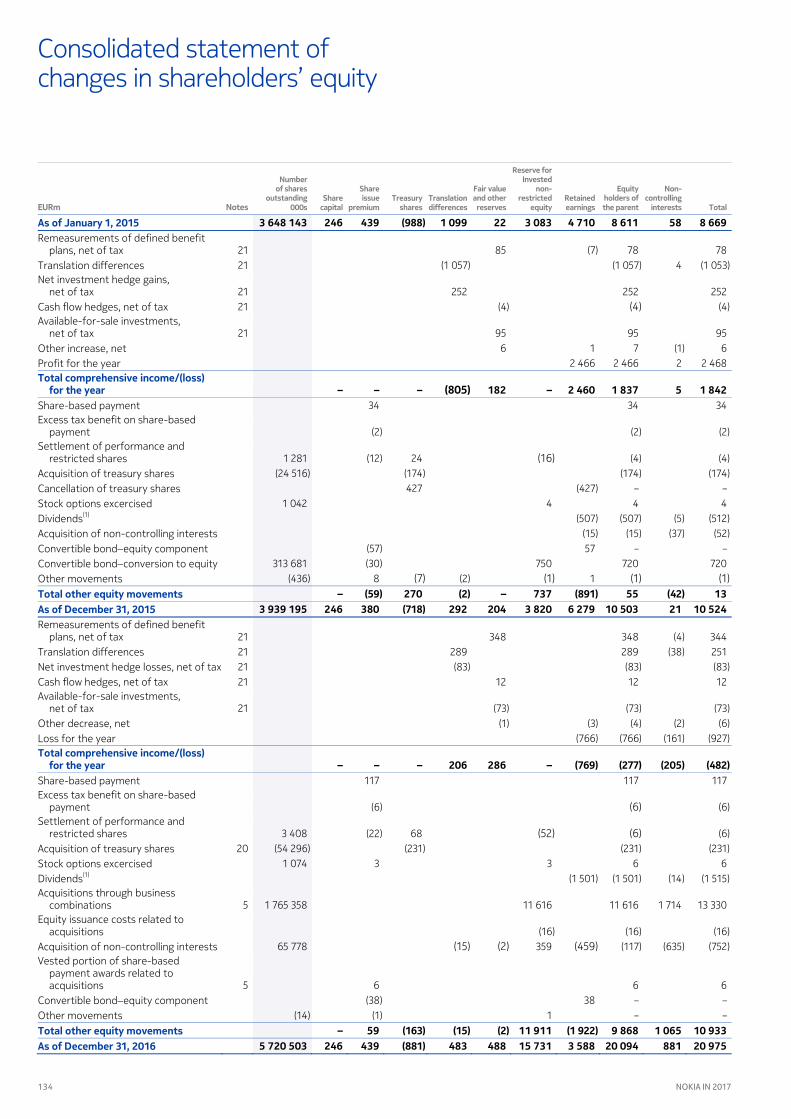
Consolidated statement of changes in shareholders’ equity
EURm Notes
Number of shares
outstanding 000s
Share capital
Share issue
premium Treasury
shares Translation differences
Fair value and other reserves
Reserve for Invested
non- restricted
equity Retained earnings
Equity holders of
the parent
Non- controlling
interests Total
As of January 1, 2015 3 648 143 246 439 () 1 099 22 3 083 4 710 8 611 58 8 669 Remeasurements of defined benefit
plans, net of tax 21 85 (7) 78 78 Translation differences 21 (1 057) (1 057) 4 (1 053) Net investment hedge gains,
net of tax 21 252 252 252 Cash flow hedges, net of tax 21 (4) (4) (4) Available-for-sale investments,
net of tax 21 95 95 95 Other increase, net 6 1 7 (1) 6 Profit for the year 2 466 2 466 2 2 468 Total comprehensive income/(loss)
for the year – – – () 182 – 2 460 1 837 5 1 842 Share-based payment 34 34 34 Excess tax benefit on share-based
payment (2) (2) (2) Settlement of performance and
restricted shares 1 281 (12) 24 (16) (4) (4) Acquisition of treasury shares (24 516) (174) (174) (174) Cancellation of treasury shares 427 (427) – – Stock options excercised 1 042 4 4 4 Dividends(1) (507) (507) (5) (512) Acquisition of non-controlling interests (15) (15) (37) (52) Convertible bondequity component (57) 57 – – Convertible bondconversion to equity 313 681 (30) 750 720 720 Other movements (436) 8 (7) (2) (1) 1 (1) (1) Total other equity movements – () 270 () – 737 () 55 () 13 As of December 31, 2015 3 939 195 246 380 () 292 204 3 820 6 279 10 503 21 10 524 Remeasurements of defined benefit
plans, net of tax 21 348 348 (4) 344 Translation differences 21 289 289 (38) 251 Net investment hedge losses, net of tax 21 (83) (83) (83) Cash flow hedges, net of tax 21 12 12 12 Available-for-sale investments,
net of tax 21 (73) (73) (73) Other decrease, net (1) (3) (4) (2) (6) Loss for the year (766) (766) (161) (927) Total comprehensive income/(loss)
for the year – – – 206 286 – () () () () Share-based payment 117 117 117 Excess tax benefit on share-based
payment (6) (6) (6) Settlement of performance and
restricted shares 3 408 (22) 68 (52) (6) (6) Acquisition of treasury shares 20 (54 296) (231) (231) (231) Stock options excercised 1 074 3 3 6 6 Dividends(1) (1 501) (1 501) (14) (1 515) Acquisitions through business
combinations 5 1 765 358 11 616 11 616 1 714 13 330 Equity issuance costs related to
acquisitions (16) (16) (16) Acquisition of non-controlling interests 65 778 (15) (2) 359 (459) (117) (635) (752) Vested portion of share-based
payment awards related to acquisitions 5 6 6 6
Convertible bondequity component (38) 38 – – Other movements (14) (1) 1 – – Total other equity movements – 59 () () () 11 911 ( ) 9 868 1 065 10 933 As of December 31, 2016 5 720 503 246 439 () 483 488 15 731 3 588 20 094 881 20 975

135
Financial statements
NOKIA IN 2017
EURm Notes
Number of shares
outstanding 000s
Share capital
Share
issue
premiumTreasury
sharesTranslation
differences
Fair value
and other reserves
Reserve for
Invested non-
restricted equity
Retained earnings
Equity
holders of
the parent
Non-
controlling
interests Total As of December 31, 2016 5 720 503 246 439 () 483 488 15 731 3 588 20 094 881 20 975 Remeasurements of defined benefit
plans, net of tax 21 662 662 662 Translation differences 21 (1 768) (1 768) (50) Net investment hedge losses,
(1 818)
net of tax 21 352 352 Cash flow hedges, net of tax
352 21 28 28
Available-for-sale investments, 28
net of tax 21 (86) (86) Other increase, net
(86) 2 2
Loss for the year 2
(1 494) (1 494) 36
(1 458) Total comprehensive (loss)/income
for the year – – – ( ) 606 – ( ) ( ) () Share-based payment
( ) 92 92
Excess tax benefit on share-based 92
payment (7) (7) Settlement of performance and
(7)
restricted shares 20 12 199 (79) 170 (116) (25) Acquisition of treasury shares
(25) 20 (153 601) (769) (769)
Stock options excercised (769)
20 416 1 1 Dividends
1 (1) (963) (963) (7)
Acquisitions through business (970)
combinations – 17 Acquisition of non-controlling interests
17 12 12 (788)
Disposal of subsidiaries (776)
– (9) Other movements
(9) 2 1 4 7
7 Total other equity movements – 8 () 1 – () () ( ) ()
( )
As of December , 5 579 517 246 447 ( ) () 1 094 15 616 1 147 16 138 80 (1) Dividend declared is EUR 0.19 per share, subject to shareholders’ approval (dividend EUR 0.17 per share for 2016; dividend
16 218 EUR 0.16 per share for 2015; and special dividend EUR 0.10 per
share for 2015).
The notes are an integral part of these consolidated financial statements.
136 NOKIA IN 2017
Notes to consolidated financial statements
1. Corporate information Nokia Oyj, a public limited liability company incorporated and domiciled in Helsinki, Finland, is the parent company (“Parent Company” or “Parent”) for all its subsidiaries (“Nokia” or “the Group”). The Group’s operational headquarters are located in Espoo, Finland. The Group is listed on the Nasdaq Helsinki stock exchange, the New York stock exchange and the Euronext Paris stock exchange. The Group is a leading global provider of mobile and fixed network infrastructure combining hardware, software and services, as well as advanced technologies and licensing that connect people and things.
On March , the Board of Directors authorized the financial statements for for issuance and filing.
2. Significant accounting policies Basis of presentation and statement of compliance The consolidated financial statements are prepared in accordance with International Financial Reporting Standards as issued by the International Accounting Standards Board (“IASB”) and as adopted by the European Union (“IFRS”). The consolidated financial statements are presented in millions of euros (“EURm”), except as otherwise noted, and are prepared under the historical cost convention, except as disclosed in the accounting policies below. The notes to the consolidated financial statements also conform to the Finnish accounting legislation.
In , comparative presentation of certain items in the consolidated financial statements has been modified to conform with current year presentation.
Other information This paragraph is included in connection with statutory reporting requirements in Germany. The fully consolidated German subsidiary, Nokia Solutions and Networks GmbH & Co. KG, registered in the commercial register of Munich under HRA , has made use of the exemption available under § b and § of the German Commercial Code (“HGB”).
Principles of consolidation The consolidated financial statements comprise the financial statements of the Parent Company, and each of those companies over which it exercises control. Control over an entity exists when the Group is exposed, or has rights, to variable returns from its involvement with the entity and has the ability to affect those returns through its power over the entity. When the Group has less than a majority of voting or similar rights in an entity, the Group considers all relevant facts and circumstances in assessing whether it has power over an entity, including the contractual arrangements, and voting rights and potential voting rights. The Group reassesses whether or not it controls an entity if facts and circumstances indicate that there are changes to the elements of control.
Consolidation of a subsidiary begins when the Group obtains control over the subsidiary and ceases when the Group loses control over the subsidiary. Assets, liabilities, income and expenses of a subsidiary acquired or disposed of during the year are included in the consolidated financial statements from the date the Group gains control until the date the Group ceases to control the subsidiary. A change in the ownership interest of a subsidiary, without a loss of control, is accounted for as an equity transaction. If the Group loses control in a subsidiary, the related assets, liabilities, non-controlling interest and other components of equity are derecognized with any gain or loss recognized in the consolidated income statement. Any investment retained in the former subsidiary is measured at fair value.
All inter-company transactions are eliminated as part of the consolidation process. Non-controlling interests are presented separately as a component of net profit and are shown as a component of shareholders’ equity in the consolidated statement of financial position.
Business combinations Business combinations are accounted for using the acquisition method. The consideration transferred in a business combination is measured as the aggregate of the fair values of the assets transferred, liabilities incurred towards the former owners of the acquired entity or business and equity instruments issued. Acquisition-related costs are recognized as expenses in the consolidated income statement in the period in which the costs are incurred and the related services are received with the exception of costs directly attributable to the issuance of equity instruments that are accounted for as a deduction from equity.
Identifiable assets acquired and liabilities assumed are measured at the acquisition date fair values. The Group elects whether to measure the non-controlling interests in the acquiree at fair value or at the proportionate share of the acquiree’s identifiable net assets on a business combination by business combination basis. The excess of the aggregate of the consideration transferred and the amount recognized for non-controlling interests over the acquisition date fair values of the identifiable net assets acquired is recorded as goodwill.
Investment in associates and joint ventures An associate is an entity over which the Group exercises significant influence. Significant influence is the power to participate in the financial and operating policy decisions of the entity, but is not control or joint control over those policies.
A joint venture is a type of joint arrangement whereby the parties that have joint control of the arrangement have rights to the net assets of the arrangement. Joint control is the contractually agreed sharing of control of an arrangement, which exists only when decisions about relevant activities require the unanimous consent of the parties sharing control.
The Group’s investments in associates and joint ventures are accounted for using the equity method. Under the equity method, the investment in an associate or joint venture is initially recognized at cost. The carrying amount of the investment is adjusted to recognize changes in the Group’s share of net assets of the associate or joint venture since the acquisition date. The Group’s share of profits and losses of associates and joint ventures is included in the consolidated income statement outside operating profit or loss. Any change in other comprehensive income (“OCI”) of associates and joint ventures is presented as part of the Group’s OCI.
After application of the equity method, as of each reporting date the Group determines whether there is objective evidence that the investment in an associate or joint venture is impaired. If there is such evidence, the Group recognizes an impairment loss that is calculated as the difference between the recoverable amount of the associate or joint venture and its carrying value. The impairment loss is presented in ‘Share of results of associated companies and joint ventures’ in the consolidated income statement.

137
Financial statements
NOKIA IN 2017
Non-current assets held for sale (or disposal groups) and discontinued operations Non-current assets or disposal groups are classified as assets held for sale if their carrying amounts will be recovered principally through a sale transaction rather than through continuing use. For this to be the case, the asset, or the disposal group, must be available for immediate sale in its present condition subject only to terms that are usual and customary for sales of such assets or disposal groups, and the sale must be highly probable. These assets, or in the case of disposal groups, assets and liabilities, are presented separately in the consolidated statement of financial position and measured at the lower of the carrying amount and fair value less costs to sell. Non-current assets classified as held for sale, or included in a disposal group classified as held for sale, are not depreciated or amortized.
Discontinued operations are reported when a component of the Group, comprising operations and cash flows that can be clearly distinguished both operationally and for financial reporting purposes from the rest of the Group, is classified as held for sale or has been disposed of, or the component represents a major line of business or geographical area of operations, or is a part of a single coordinated plan to dispose of a separate major line of business or geographical area of operations. Profit or loss from Discontinued operations is reported separately from income and expenses from Continuing operations in the consolidated income statement, with prior periods presented on a comparative basis. Cash flows for Discontinued operations are presented separately in the notes to the consolidated financial statements. Intra-group revenues and expenses between Continuing and Discontinued operations are eliminated.
Revenue recognition Revenue is recognized when the following criteria for the transaction have been met: significant risks and rewards of ownership have transferred to the buyer; continuing managerial involvement and effective control usually associated with ownership have ceased; the amount of revenue can be measured reliably; it is probable that the economic benefits associated with the transaction will flow to the Group; and the costs incurred or to be incurred in respect of the transaction can be measured reliably. Revenue is measured at the fair value of the consideration received or receivable net of discounts and excluding taxes and duties.
Recurring service revenue which includes managed services and maintenance services is generally recognized on a straight-line basis over the agreed period, unless there is evidence that some other method better represents the rendering of services.
The Group enters into contracts consisting of any combination of hardware, services and software. Within these multiple element arrangements, separate components are identified and accounted for based on the nature of those components, considering the economic substance of the entire arrangement. Revenue is allocated to each separately identifiable component based on the relative fair value of each component. The fair value of each component is determined by taking into consideration factors such as the price of the component when sold separately and the component cost plus a reasonable margin when price references are not available. The revenue allocated to each component is recognized when the revenue recognition criteria for that component have been met.
Revenue from contracts involving the construction of an asset according to customer specifications is recognized using the percentage of completion method. Stage of completion for each contract is measured by either the achievement of contractually defined milestones or costs incurred compared to total project costs.
Revenue on license fees is recognized in accordance with the substance of the relevant agreements. In the majority of cases, the Group retains obligations related to the licensed assets after the initial licensing transaction, and as a result revenue is recognized over a period of time during which the Group is expected to perform. Where the Group has no remaining obligations to perform subsequent to the initial licensing transaction, and licensing fees are non-refundable, revenue is recognized after the customer has been provided access to the underlying assets. In some multiple element licensing transactions, the Group applies the residual method in the absence of reference information.
Net sales includes revenue from all licensing negotiations, litigations and arbitrations to the extent that the criteria for revenue recognition have been met.
Government grants Government grants are recognized when there is reasonable assurance that the Group will comply with the conditions attached to them and the grants will be received. Government grants received as compensation for expenses or losses incurred are recognized in the consolidated income statement as a deduction against the related expenses. Government grants related to assets are presented in the consolidated statement of financial position as deferred income and recognized as income over the same period the asset is depreciated or amortized.
Government grants received in the form of R&D tax credits are recognized as a deduction against R&D expenses if the amount of the tax credit is linked to the amount of R&D expenditures incurred by the Group and the tax credit is a fully collectible asset which will be paid in cash by the government in case the Group is not able to offset it against its income tax payable. R&D tax credits that do not meet both conditions are recognized as income tax benefit.
Employee benefits Pensions and other post-employment benefits The Group companies have various post-employment plans in accordance with the local conditions and practices in the countries in which they operate. The plans are generally funded through payments to insurance companies or contributions to trustee-administered funds as determined by periodic actuarial calculations.
In a defined contribution plan, the Group’s legal or constructive obligation is limited to the amount that it agrees to contribute to the fund. The Group’s contributions to defined contribution plans, multi-employer and insured plans are recognized in the consolidated income statement in the period to which the contributions relate. If a pension plan is funded through an insurance contract where the Group does not retain any legal or constructive obligations, the plan is treated as a defined contribution plan. All arrangements that do not fulfill these conditions are considered defined benefit plans.
For defined benefit plans, including pension and post-retirement healthcare and life insurance, costs are assessed using the projected unit credit method: the cost is recognized in the consolidated income statement so as to spread the benefit over the service lives of employees. The defined benefit obligation is measured as the present value of the estimated future cash outflows using interest rates on high-quality corporate bonds or government bonds with maturities that most closely match expected payouts of benefits. Actuarial gains and losses arising from experience adjustments and changes in actuarial assumptions are charged or credited to equity in other comprehensive income in the period in which they arise. Past service costs and settlement gains and losses are recognized immediately in the consolidated income statement as part of service cost, when the plan amendment, curtailment or settlement occurs. Curtailment gains and losses are accounted for as past service costs.

138 NOKIA IN 2017
Notes to consolidated financial statements continued
The liability or asset recognized in the consolidated statement of financial position is the defined benefit obligation as of the closing date less the fair value of plan assets including effects relating to any asset ceiling.
Remeasurements, comprising actuarial gains and losses, the effect of the asset ceiling and the return on plan assets, excluding amounts recognized in net interest, are recognized immediately in the consolidated statement of financial position with a corresponding debit or credit to Fair Value and Other Reserves in Equity through the consolidated statement of other comprehensive income in the period in which they occur. Remeasurements are not reclassified to the consolidated income statement in subsequent periods.
Actuarial valuations for the Group’s defined benefit post-employment plans are performed annually or when a material curtailment or settlement of a defined benefit plan occurs.
Termination benefits Termination benefits are payable when employment is terminated before the normal retirement date, or whenever an employee accepts voluntary redundancy in exchange for these benefits. The Group recognizes termination benefits when it is demonstrably committed to either terminating the employment of current employees according to a detailed formal plan without possibility of withdrawal, or providing termination benefits as a result of an offer made to encourage voluntary redundancy. Local laws may provide employees with the right to benefits from the employer upon termination whether the termination is voluntary or involuntary. For these specific termination benefits, the portion of the benefit that the Group would be required to pay to the employee in the case of voluntary termination is treated as a legal obligation determined by local law and accounted for as a defined benefit arrangement as described in the pensions section above.
Share-based payment The Group offers three types of global equity-settled share-based compensation plans for employees: performance shares, restricted shares and the employee share purchase plan.
Employee services received and the corresponding increase in equity are measured by reference to the fair value of the equity instruments as of the grant date, excluding the impact of any non-market vesting conditions. Non-market vesting conditions attached to the performance shares are included in assumptions about the number of shares that the employee will ultimately receive. The Group reviews the assumptions made on a regular basis and, where necessary, revises its estimates of the number of performance shares that are expected to be settled. Plans that apply tranched vesting are accounted for under the graded vesting model. Share-based compensation is recognized as an expense in the consolidated income statement over the relevant service periods.
Income taxes The income tax expense comprises current tax and deferred tax. Tax is recognized in the consolidated income statement except to the extent that it relates to items recognized in other comprehensive income, or directly in equity; then the related tax is recognized in other comprehensive income or equity, respectively.
Current taxes are based on the results of group companies and are calculated using the local tax laws and tax rates that are enacted or substantively enacted as of each reporting date. Corporate taxes withheld at the source of the income on behalf of group companies, both recoverable and irrecoverable, are accounted for in income taxes.
Following the IFRS Interpretations Committee agenda decision in September on interest and penalties related to income taxes, the Group no longer accounts for these items as income taxes. Interest expenses and income are presented in financial expenses and income, respectively, and penalties are presented in other operating expenses in the consolidated income statement. In relation to this, the Group has retrospectively revised the presentation of interest and penalties related to income taxes from current income tax liabilities to provisions in the consolidated statement of financial position. The impact of the revision was EUR million as of December , and EUR million as of December , .
The Group periodically evaluates positions taken in tax returns with respect to situations in which applicable tax regulation is subject to interpretation. It adjusts the amounts recorded, where appropriate, on the basis of amounts expected to be paid to the tax authorities. The amount of current income tax liabilities for uncertain income tax positions is recognized when it is more likely than not that certain tax positions may not be fully sustained upon review by tax authorities. The amounts recorded are based upon the estimated future settlement amount as of each reporting date.
Deferred tax assets and liabilities are determined using the liability method for all temporary differences arising between the tax bases of assets and liabilities and their carrying amounts in the consolidated financial statements. Deferred tax assets are recognized to the extent that it is probable that future taxable profit will be available against which the unused tax losses, unused tax credits or deductible temporary differences can be utilized before the unused tax losses or unused tax credits expire. Deferred tax assets are assessed for realizability as of each reporting date. When circumstances indicate it is no longer probable that deferred tax assets will be utilized, adjustments are made as necessary. Deferred tax liabilities are recognized for temporary differences that arise between the fair value and the tax base of identifiable net assets acquired in business combinations.
Deferred tax assets and deferred tax liabilities are offset for presentation purposes when there is a legally enforceable right to set off current tax assets against current tax liabilities, and the deferred tax assets and deferred tax liabilities relate to income taxes levied by the same taxation authority on either the same taxable entity or different taxable entities which intend either to settle current tax liabilities and assets on a net basis, or to realize the assets and settle the liabilities simultaneously in each future period in which significant amounts of deferred tax liabilities or deferred tax assets are expected to be settled or recovered.
Deferred tax liabilities are not recognized if they arise from the initial recognition of goodwill. Deferred tax liabilities are provided on taxable temporary differences arising from investments in subsidiaries, associates and joint arrangements, except for deferred tax liability where the timing of the reversal of the temporary difference is controlled by the Group, and it is probable that the temporary difference will not reverse in the foreseeable future.
The enacted or substantively enacted tax rates as of each reporting date that are expected to apply in the period when the asset is realized or the liability is settled are used in the measurement of deferred tax assets and deferred tax liabilities. Deferred tax assets and liabilities are not discounted.
139
Financial statements
NOKIA IN 2017
Foreign currency translation Functional and presentation currency The financial statements of all group companies are measured using functional currency, which is the currency of the primary economic environment in which the entity operates. The consolidated financial statements are presented in euro, the functional and presentation currency of the Parent Company.
Transactions in foreign currencies Transactions in foreign currencies are recorded at exchange rates prevailing as of the dates of the individual transactions. For practical reasons, a rate that approximates the actual rate as of the date of the transaction is often used. At the end of the reporting period, monetary assets and liabilities denominated in foreign currency are valued at the exchange rates prevailing at the end of the reporting period. Foreign exchange gains and losses arising from monetary assets and liabilities as well as fair value changes of related hedging instruments are recognized in financial income and expenses. Unrealized foreign exchange gains and losses related to non-monetary non-current available-for-sale investments are included in the fair value measurement of these investments and recognized in other comprehensive income.
Foreign group companies All income and expenses of foreign group companies where the functional currency is not the euro are translated into euro at the average foreign exchange rates for the reporting period. All assets and liabilities of foreign group companies are translated into euro at foreign exchange rates prevailing at the end of the reporting period. Differences resulting from the translation of income and expenses at the average rate and assets and liabilities at the closing rate are recognized as translation differences in consolidated statement of comprehensive income. On the disposal of all or part of a foreign group company through sale, liquidation, repayment of share capital or abandonment, the cumulative amount or proportionate share of translation differences is recognized as income or expense when the gain or loss on disposal is recognized.
Intangible assets Intangible assets acquired separately are measured on initial recognition at cost. The cost of intangible assets acquired in a business combination is their fair value as of the date of acquisition. Internally generated intangibles, except for development costs that may be capitalized, are expensed as incurred. Development costs are capitalized only if the Group has the technical feasibility to complete the asset; has an ability and intention to use or sell the asset; can demonstrate that the asset will generate future economic benefits; has resources available to complete the asset; and has the ability to measure reliably the expenditure during development.
Following initial recognition, intangible assets are carried at cost less accumulated amortization and accumulated impairment losses. Intangible assets are amortized over their useful lives, generally three to ten years, using the straight-line method which is considered reflecting best the pattern in which the asset’s future economic benefits are expected to be consumed. The amortization charges are presented within cost of sales, research and development expenses and selling, general and administrative expenses in the consolidated income statement.
Property, plant and equipment Property, plant and equipment are stated at cost less accumulated depreciation and accumulated impairment losses. Depreciation is recorded on a straight-line basis over the expected useful lives of the assets as follows:
Buildings and constructions Buildings and constructions 20–33 yearsLight buildings and constructions 3–20 years Machinery and equipment Production machinery, measuring and test equipment 1–5 years Other machinery and equipment 3–10 years Land and water areas are not depreciated.
Maintenance, repairs and renewals are generally expensed in the period in which they are incurred. However, major renovations are capitalized and included in the carrying amount of the asset when it is probable that future economic benefits in excess of the originally assessed standard of performance of the existing asset will flow to the Group. Major renovations are depreciated over the remaining useful life of the related asset. Leasehold improvements are depreciated over the shorter of the lease term and the useful life. Gains and losses on the disposal of property, plant and equipment are included in operating profit or loss.
Leases Leases are classified as finance leases whenever the terms of the lease transfer substantially all the risks and rewards incidental to ownership to the lessee. All other leases are classified as operating leases.
The Group has entered into various operating lease contracts as a lessee. The related payments are treated as rental expenses and recognized in the consolidated income statement on a straight-line basis over the lease terms unless another systematic approach is more representative of the pattern of the benefit.
The Group does not have any significant finance lease arrangements.
Impairment of goodwill, other intangible assets and property, plant and equipment The Group assesses the recoverability of the carrying value of goodwill, other intangible assets and property, plant and equipment if events or changes in circumstances indicate that the carrying value may be impaired. In addition, the Group tests the carrying value of goodwill for impairment annually even if there is no indication of impairment.
Factors that the Group considers when it reviews indications of impairment include, but are not limited to, underperformance of the asset relative to its historical or projected future results, significant changes in the manner of using the asset or the strategy for the overall business, and significant negative industry or economic trends.
Goodwill is allocated to the cash-generating units or groups of cash-generating units that are expected to benefit from the synergies of the related business combination and that reflect the lowest level at which goodwill is monitored for internal management purposes. A cash-generating unit, as determined for the purposes of the Group’s goodwill impairment testing, is the smallest group of

140 NOKIA IN 2017
Notes to consolidated financial statements continued
assets, including goodwill, generating cash inflows that are largely independent of the cash inflows from other assets or groups of assets. The carrying value of a cash-generating unit includes its share of relevant corporate assets allocated to it on a reasonable and consistent basis. When the composition of one or more groups of cash generating units to which goodwill has been allocated is changed, the goodwill is reallocated based on the relative fair value of the affected groups of cash generating units.
The Group conducts its impairment testing by determining the recoverable amount for an asset or a cash-generating unit. The recoverable amount of an asset or a cash-generating unit is the higher of its fair value less costs of disposal and its value-in-use. The recoverable amount is compared to the asset’s or cash-generating unit’s carrying value. If the recoverable amount for the asset or cash-generating unit is less than its carrying value, the asset is considered impaired and is written down to its recoverable amount. Impairment losses are presented in other expenses, or as a separate line item if significant, in the consolidated income statement.
Inventories Inventories are stated at the lower of cost and net realizable value. Cost is determined using standard cost, which approximates actual cost on a first-in first-out (“FIFO”) basis. Net realizable value is the amount that can be realized from the sale of the inventory in the normal course of business after allowing for the costs of realization. In addition to the cost of materials and direct labor, an appropriate proportion of production overhead is included in the inventory values. An allowance is recorded for excess inventory and obsolescence based on the lower of cost and net realizable value.
Fair value measurement A number of financial instruments are measured at fair value as of each reporting date after initial recognition. Fair value is the price that would be received to sell an asset or paid to transfer a liability in an orderly transaction between market participants at the measurement date. The fair value of an asset or a liability is measured using the assumptions that market participants would use when pricing the asset or liability, assuming that market participants act in their economic best interest by using quoted market rates, discounted cash flow analyses and other appropriate valuation models. The Group uses valuation techniques that are appropriate in the circumstances and for which sufficient data is available to measure fair value, maximizing the use of relevant observable inputs and minimizing the use of unobservable inputs. All assets and liabilities for which fair values are being measured or disclosed in the consolidated financial statements are categorized within the fair value hierarchy, described as follows, based on the lowest level input that is significant to the fair value measurement as a whole:
Level —Quoted (unadjusted) market prices for exchange-traded products in active markets for identical assets or liabilities;
Level —Valuation techniques for which significant inputs other than quoted prices are directly or indirectly observable; and
Level —Valuation techniques for which significant inputs are unobservable.
The Group categorizes assets and liabilities that are measured at fair value on a recurring basis into an appropriate level of the fair value hierarchy at the end of each reporting period.
Financial assets The Group has classified its financial assets in the following categories: available-for-sale investments, derivative and other current financial assets, loans receivable, accounts receivable, financial assets at fair value through profit or loss, and cash and cash equivalents. Derivatives are described in the section on derivative financial instruments.
Available-for-sale investments The Group invests a portion of the cash needed to cover the projected cash outflows of its ongoing business operations in highly liquid, interest-bearing investments and certain equity instruments. The following investments are classified as available-for-sale based on the purpose of the investment and the Group’s ongoing intentions:
Available-for-sale investments, liquid assets consist of highly liquid, fixed-income and money-market investments with maturities at acquisition of more than three months, as well as bank deposits with maturities or contractual call periods at acquisition of more than three months.
Investments in technology-related publicly quoted equity shares or unlisted private equity shares and unlisted venture funds, classified in the consolidated statement of financial position as non-current available-for-sale investments.
Current fixed-income and money-market investments are fair valued by using quoted market rates, discounted cash flow analyses and other appropriate valuation models as of the reporting date. Investments in publicly quoted equity shares are measured at fair value using exchange quoted bid prices. Other available-for-sale investments carried at fair value include holdings in unlisted shares. Fair value is estimated using a number of methods, including, but not limited to: the current market value of similar instruments; prices established from a recent arm’s-length financing transaction of target companies; and analysis of market prospects and operating performance of target companies, taking into consideration public market comparable companies in similar industry sectors. The Group uses judgment in selecting the appropriate valuation methodology as well as underlying assumptions based on existing market practice and conditions. Changes in these assumptions may cause the Group to recognize impairments or losses in future periods.
The remaining available-for-sale investments are carried at cost less impairment. These are technology-related investments in private equity shares and unlisted venture funds for which fair value cannot be measured reliably due to non-existent public markets or reliable valuation methods.
All purchases and sales of investments are recorded on the trade date, that is, when the Group commits to purchase or sell the asset.
Changes in the fair value of available-for-sale investments are recognized in fair value and other reserves as part of other comprehensive income, with the exception of interest calculated using the effective interest method and foreign exchange gains and losses on monetary available-for-sale investments recognized directly in the consolidated income statement. Dividends on available-for-sale equity instruments are recognized in the consolidated income statement when the Group’s right to receive payment is established. When the investment is disposed of, the related accumulated fair value changes are released from other comprehensive income and recognized in the consolidated income statement. The weighted average method is used to determine the cost basis of publicly listed equities being disposed of. The FIFO method is used to determine the cost basis of fixed-income securities being disposed of. An impairment charge is recorded if the carrying amount of an available-for-sale investment is greater than the estimated fair value and there is objective evidence that the
141
Financial statements
NOKIA IN 2017
asset is impaired including, but not limited to, counterparty default and other factors causing a reduction in value that can be considered other than temporary. The cumulative net loss relating to the investment is removed from equity and recognized in the consolidated income statement for the period. If, in a subsequent period, the fair value of the investment in a non-equity instrument increases and the increase can be objectively related to an event occurring after the loss was recognized, the loss is reversed and the reversal is recognized in the consolidated income statement.
Investments at fair value through profit and loss, liquid assets Certain highly liquid financial assets are designated at inception as investments at fair value through profit and loss, liquid assets. These investments must meet one of the following two criteria: the designation eliminates or significantly reduces an inconsistent treatment that would otherwise arise from measuring the assets or recognizing gains or losses on a different basis; or the assets are part of a group of financial assets, which are managed and their performance evaluated on a fair value basis in accordance with a documented risk management or investment strategy. These investments are initially recognized and subsequently remeasured at fair value. Fair value adjustments and realized gains and losses are recognized in the consolidated income statement.
Loans receivable Loans receivable include loans to customers and suppliers and are measured initially at fair value and subsequently at amortized cost less impairment using the effective interest method. Loans are subject to regular review as to their collectability and available collateral. A valuation allowance is made if a loan is deemed not to be fully recoverable. The related cost is recognized in other expenses or financial expenses, depending on the nature of the receivable to reflect the shortfall between the carrying amount and the present value of expected future cash flows. Interest income on loans receivable is recognized in financial income and expenses in the consolidated income statement by applying the effective interest rate.
Cash and cash equivalents Cash and cash equivalents consist of cash at bank and in hand and available-for-sale investments, cash equivalents. Available-for-sale investments, cash equivalents consist of highly liquid, fixed-income and money-market investments that are readily convertible to known amounts of cash with maturities at acquisition of three months or less, as well as bank deposits with maturities or contractual call periods at acquisition of three months or less. Due to the high credit quality and short-term nature of these investments, there is an insignificant risk of change in value. Investments in money-market funds that have a risk profile consistent with the aforementioned criteria are also classified as cash equivalents.
Accounts receivable Accounts receivable include amounts invoiced to customers, amounts where revenue recognition criteria have been fulfilled but the customers have not yet been invoiced, and amounts where the contractual rights to the cash flows have been confirmed but the customers have not yet been invoiced. Billed accounts receivable are carried at the amount invoiced to customers less allowances for doubtful accounts. Allowances for doubtful accounts are based on a periodic review of all outstanding amounts, including an analysis of historical bad debt, customer concentrations, customer creditworthiness, past due amounts, current economic trends and changes in customer payment terms. Impairment charges on receivables identified as uncollectible are included in other operating expenses in the consolidated income statement.
Financial liabilities The Group has classified its financial liabilities into the following categories: derivative and other current financial liabilities, compound financial instruments, loans payable, and accounts payable. Derivatives are described in the section on derivative financial instruments.
Compound financial instruments Compound financial instruments have both a financial liability and an equity component from the issuers’ perspective. The components are defined based on the terms of the financial instrument and presented and measured separately according to their substance. The financial liability component is initially recognized at fair value, the residual being allocated to the equity component. The allocation remains the same for the life of the compound financial instrument. The financial liability components of convertible bonds issued by the Group are accounted for as loan payables.
Loans payable Loans payable are recognized initially at fair value net of transaction costs. In subsequent periods, loans payable are presented at amortized cost using the effective interest method. Transaction costs and loan interest are recognized in the consolidated income statement as financial expenses over the life of the instrument.
Accounts payable Accounts payable are carried at invoiced amount which is considered to be the fair value due to the short-term nature of the Group’s accounts payable.
Derivative financial instruments All derivatives are recognized initially at fair value on the date a derivative contract is entered into and subsequently remeasured at fair value. The method of recognizing the resulting gain or loss varies according to whether the derivatives are designated and qualify under hedge accounting. Generally, the cash flows of a hedge are classified as cash flows from operating activities in the consolidated statement of cash flows as the underlying hedged items relate to the Group’s operating activities. When a derivative contract is accounted for as a hedge of an identifiable position relating to financing or investing activities, the cash flows of the contract are classified in the same way as the cash flows of the position being hedged.
Derivatives not designated in hedge accounting relationships carried at fair value through profit and loss Forward foreign exchange contracts are valued at market-forward exchange rates. Changes in fair value are measured by comparing these rates with the original contract-forward rate. Currency options are valued as of each reporting date by using the Garman & Kohlhagen option valuation model. Changes in fair value are recognized in the consolidated income statement.
Fair values of forward rate agreements, interest rate options, futures contracts and exchange-traded options are calculated based on quoted market rates as of each reporting date. Discounted cash flow analyses are used to value interest rate and cross-currency interest rate swaps. Changes in fair value are recognized in the consolidated income statement.
For derivatives not designated under hedge accounting but hedging identifiable exposures such as anticipated foreign currency denominated sales and purchases, the gains and losses are recognized in other income or expenses. The gains and losses on all other derivatives not designated under hedge accounting are recognized in financial income and expenses in the consolidated income statement.

142 NOKIA IN 2017
Notes to consolidated financial statements continued
Embedded derivatives, if any, are identified and monitored by the Group and measured at fair value as of each reporting date with changes in fair value recognized in the consolidated income statement.
Hedge accounting The Group applies hedge accounting on certain forward foreign exchange contracts, options or option strategies, and interest rate derivatives. Qualifying options and option strategies have zero net premium or a net premium paid. For option structures, the critical terms of the bought and sold options are the same and the nominal amount of the sold option component is not greater than that of the bought option.
Cash flow hedges: hedging of forecast foreign currency denominated sales and purchases The Group applies hedge accounting for qualifying hedges. Qualifying hedges are those properly documented cash flow hedges of foreign exchange rate risk of future forecast foreign currency denominated sales and purchases that meet the requirements set out in IAS , Financial Instruments: Recognition and Measurement. The hedged item must be highly probable and present an exposure to variations in cash flows that could ultimately affect profit or loss. The hedge must be highly effective, both prospectively and retrospectively.
For qualifying foreign exchange forwards, the change in fair value that reflects the change in spot exchange rates and, for qualifying foreign exchange options or option strategies, the change in intrinsic value are deferred in fair value and other reserves in shareholders’ equity to the extent that the hedge is effective. The ineffective portion is recognized immediately in the consolidated income statement. Hedging costs, expressed either as the change in fair value that reflects the change in forward exchange rates less the change in spot exchange rates for forward foreign exchange contracts, or as changes in the time value for options or options strategies, are recognized in other income or expenses in the consolidated income statement.
Accumulated changes in fair value from qualifying hedges are released from fair value and other reserves into the consolidated income statement as adjustments to other operating income and expenses when the hedged cash flow affects the consolidated income statement. Forecast foreign currency sales and purchases affect the consolidated income statement at various dates up to approximately one year from the reporting date. If the forecasted transaction is no longer expected to take place, all deferred gains or losses are released immediately into the consolidated income statement. If the hedged item ceases to be highly probable but is still expected to take place, accumulated gains and losses remain in fair value and other reserves until the hedged cash flow affects the consolidated income statement.
Cash flow hedges: hedging of foreign currency risk of highly probable business acquisitions and other transactions From time to time, the Group hedges cash flow variability caused by foreign currency risk inherent in highly probable business acquisitions and other future transactions that result in the recognition of non-financial assets. When those non-financial assets are recognized in the consolidated statement of financial position, the gains and losses previously deferred in fair value and other reserves are transferred to the initial acquisition cost of the asset. The deferred amounts are ultimately recognized in the consolidated income statement as a result of goodwill assessments for business acquisitions and through depreciation or amortization for other assets. The application of hedge accounting is conditional on the forecast transaction being highly probable and the hedge being highly effective, prospectively and retrospectively.
Cash flow hedges: hedging of cash flow variability on variable rate liabilities From time to time, the Group applies cash flow hedge accounting for hedging cash flow variability on certain variable rate liabilities. The effective portion of the gain or loss relating to interest rate swaps hedging variable rate borrowings is deferred in fair value and other reserves. The gain or loss related to the ineffective portion is recognized immediately in the consolidated income statement. If hedging instruments are settled before the maturity date of the related liability, hedge accounting is discontinued and all cumulative gains and losses recycled gradually to the consolidated income statement when the hedged variable interest cash flows affect the consolidated income statement.
Fair value hedges: hedging of foreign exchange exposure The Group applies fair value hedge accounting for foreign exchange risk with the objective to reduce the exposure to fluctuations in the fair value of firm commitments due to changes in foreign exchange rates. Changes in the fair value of derivatives designated and qualifying as fair value hedges, together with any changes in the fair value of the hedged firm commitments attributable to the hedged risk, are recorded in financial income and expenses in the consolidated income statement.
Fair value hedges: hedging of interest rate exposure The Group applies fair value hedge accounting to reduce exposure to fair value fluctuations of interest-bearing liabilities due to changes in interest rates and foreign exchange rates. Changes in the fair value of derivatives designated and qualifying as fair value hedges, together with any changes in the fair value of hedged liabilities attributable to the hedged risk, are recognized in financial income and expenses. If the hedged item no longer meets the criteria for hedge accounting, hedge accounting ceases and any fair value adjustments made to the carrying amount of the hedged item while the hedge was effective are recognized in financial income and expenses based on the effective interest method.
Hedges of net investments in foreign operations The Group applies hedge accounting for its foreign currency hedging on net investments. Qualifying hedges are those properly documented hedges of foreign exchange rate risk of foreign currency denominated net investments that are effective both prospectively and retrospectively.
The change in fair value that reflects the change in spot exchange rates for qualifying foreign exchange forwards, and the change in intrinsic value for qualifying foreign exchange options, are deferred in translation differences in the consolidated statement of shareholder’s equity. The change in fair value that reflects the change in forward exchange rates less the change in spot exchange rates for forwards, and changes in time value for options are recognized in financial income and expenses. If a foreign currency denominated loan is used as a hedge, all foreign exchange gains and losses arising from the transaction are recognized in translation differences. The ineffective portion is recognized immediately in the consolidated income statement.
Accumulated changes in fair value from qualifying hedges are released from translation differences on the disposal of all or part of a foreign Group company by sale, liquidation, repayment of share capital or abandonment. The cumulative amount or proportionate share of changes in the fair value of qualifying hedges deferred in translation differences is recognized as income or expense when the gain or loss on disposal is recognized.

143
Financial statements
NOKIA IN 2017
Provisions Provisions are recognized when the Group has a present legal or constructive obligation as a result of past events, it is probable that an outflow of resources will be required to settle the obligation and a reliable estimate of the amount can be made. When the Group expects a provision to be reimbursed, the reimbursement is recognized as an asset only when the reimbursement is virtually certain. The Group assesses the adequacy of its existing provisions and adjusts the amounts as necessary based on actual experience and changes in facts and circumstances as of each reporting date.
Restructuring provisions The Group provides for the estimated cost to restructure when a detailed formal plan of restructuring has been completed, approved by management, and announced. Restructuring costs consist primarily of personnel restructuring charges. The other main components are costs associated with exiting real estate locations, and costs of terminating certain other contracts directly linked to the restructuring.
Warranty provisions The Group provides for the estimated liability to repair or replace products under standard warranty at the time revenue is recognized. The provision is an estimate based on historical experience of the level of repairs and replacements.
Litigation provisions The Group provides for the estimated future settlements related to litigation based on the probable outcome of potential claims.
Environmental provisions The Group provides for estimated costs of environmental remediation relating to soil, groundwater, surface water and sediment contamination when the Group becomes obliged, legally or constructively, to rectify the environmental damage, or to perform restorative work.
Project loss provisions The Group provides for onerous contracts based on the lower of the expected cost of fulfilling the contract and the expected cost of terminating the contract. An onerous contract is a contract in which the unavoidable costs of meeting the obligations under the contract exceed the economic benefits expected to be received under it.
Divestment-related provisions The Group provides for indemnifications it is required to make to the buyers of its disposed businesses.
Material liability provisions The Group recognizes the estimated liability for non-cancellable purchase commitments for inventory in excess of forecasted requirements at each reporting date.
Other provisions The Group provides for other legal and constructive obligations based on the expected cost of executing any such commitments.
Treasury shares The Group recognizes its own equity instruments that are acquired (“treasury shares”) as a reduction of equity at cost of acquisition. When cancelled, the acquisition cost of treasury shares is recognized in retained earnings.
Dividends Dividends proposed by the Board of Directors are recognized in the consolidated financial statements when they have been approved by the shareholders at the Annual General Meeting.
New and amended standards and interpretations adopted On January , , the Group adopted amendments to IAS , Statement of Cash Flows (“IAS ”) and IAS , Income Taxes (“IAS ”). The amendments to IAS are part of the IASB’s Disclosure Initiative and help users of financial statements to better understand changes in an entity’s debt arising from financing activities, including both changes arising from cash flows and non-cash changes. The amendments to IAS relate to potential restrictions of tax laws to sources of taxable profits against which an entity may make deductions on the reversal of deductible temporary difference, as well as to provide additional guidance on how an entity should determine future taxable profits. The amendments did not have a material impact on the Group’s consolidated financial statements.
Standards issued but not yet effective The Group will adopt the following new and revised standards, amendments and interpretations to existing standards issued by the IASB that are expected to be relevant to its operations and financial position when they become effective and are endorsed by the EU. Other revisions, amendments and interpretations to existing standards issued by the IASB that are not yet effective, except what has been described below, are not expected to have a material impact on the consolidated financial statements of the Group when adopted.
The Group has not early adopted any standard, interpretation or amendment that has been issued but is not yet effective.
IFRS Financial Instruments IFRS , Financial Instruments (“IFRS ”), was issued in July and it replaces IAS , Financial Instruments: Recognition and Measurement (“IAS ”). IFRS addresses the classification and measurement of financial assets and liabilities, introduces a new impairment model and a new hedge accounting model. The Group will adopt the standard on the effective date of January , . On adoption, the Group does not restate comparative periods but will present the cumulative effect of adopting IFRS as a transition adjustment to the opening balance of retained earnings as of January , .
Classification and measurement Based on assessment of the Group’s business models for holding financial assets, the Group has identified the following to be the most significant impacts in the classification and measurement of financial assets:
The Group’s investments in venture funds that are under IAS 39 classified as non-current available-for-sale investments will be classified at fair value through profit or loss with value changes included to other operating income and expenses. Upon initial application of the standard, the accumulated net positive fair value changes of approximately EUR 200 million, formerly recorded to other comprehensive income, will be presented as an adjustment to opening balance of retained earnings. There will be no change in the valuation nor carrying amount of these assets.
Certain restricted bank deposits currently classified as non-current available-for-sale investments under IAS 39 will be classified as amortized cost. There will be no change in the carrying amount of these deposits.
Trade receivables are under IAS 39 carried at the invoiced amount less allowances for doubtful accounts. The Group’s business model for managing trade receivables is both to collect contractual cash flows and to sell assets and hence trade receivables will be measured at fair value through other comprehensive income. The initial fair value adjustment, which will be presented in other comprehensive income as a transition adjustment upon initial application of the standard, is not material.
144 NOKIA IN 2017
Notes to consolidated financial statements continued
The Group’s business model for managing customer finance assets is both to collect contractual cash flows and to sell assets and hence customer finance assets will be measured at fair value through other comprehensive income. The initial fair value adjustment, which will be presented in other comprehensive income as a transition adjustment upon initial application of the standard, is not material.
The Group has assessed the investments currently classified as current available-for-sale, liquid assets, and will classify certain investment funds to be measured at fair value through profit or loss at the adoption of the new standard. The rest of these investments satisfy the conditions for classification at fair value through other comprehensive income.
Certain term deposits used as collaterals for derivative transactions that are under IAS 39 classified as cash equivalents will be classified to current financial investments based on IFRS 9 business model assessment.
Impairment model The Group has assessed the impact of the new impairment model. As the credit quality of the Group’s fixed income and money market investments is high, there will be no significant impact from the new model. There will be a limited impact to loans extended to the Group’s customers as the new model results in an earlier recognition of credit losses.
Hedge accounting model The new hedge accounting model will align the accounting for hedging instruments more closely with the Group’s risk management practices. The Group’s foreign exchange risk management policy and hedge accounting model have been aligned with the requirements from IFRS and hence there is no impact on the accounting for its hedging relationships. For cash flow hedge accounting, the Group has elected to defer cost of hedging in other comprehensive income until the hedged item impacts profit and loss. For net investment hedge accounting, the Group has elected to defer cost of hedging in other comprehensive income and amortize it over the duration of the hedge. The initial adjustment related to treatment of cost of hedging, that is recorded between other comprehensive income and retained earnings as a transition adjustment upon initial application of the standard, is not material.
Disclosure The new standard also introduces expanded disclosure requirements and changes in presentation that are expected to change the nature and extent of the Group’s disclosures about its financial instruments, particularly in the year of the adoption of the new standard. The financial effect of the IFRS transition will be presented in the annual report.
IFRS Revenue from Contracts with Customers IFRS , Revenue from Contracts with Customers, (“IFRS ”) was issued in May and establishes a new five-step model that will apply to revenue arising from contracts with customers. Under IFRS , revenue is recognized to reflect the transfer of promised goods and services to customers for amounts that reflect the consideration to which an entity expects to be entitled in exchange for those goods and services. The Group will adopt the standard on the effective date of January , . The new standard replaces IAS , Revenue, and IAS , Construction contracts. The Group adopted the standard by applying the modified retrospective method and will present the cumulative effect of adopting IFRS as an adjustment to the opening balance of retained earnings as of January , .
Management has analyzed the impact of the adoption of IFRS and concluded that the new standard will not have a material impact on the Group’s consolidated financial statements. The procedures performed by management focused on a review of existing contracts through December , , focusing on the following areas:
Arrangements with customers Management considered the definition of a contract in accordance with the new standard and concluded that only legally binding commitments should be considered in evaluating the accounting for arrangements with customers. As such, frame agreements will be accounted for based on purchase orders, initial discounts and other material rights. Previously, a broader contract definition was permitted for accounting purposes.
Identification of performance obligations and allocation of transaction price In accordance with IFRS , the identification of performance obligations and allocation of transaction price is based on a fair value model. The Group’s application of previous accounting standards is consistent with IFRS .
Transfer of control of hardware The point at which control transfers to the customer under IFRS is consistent with the Group’s assessed point of transfer of the significant risks and rewards of ownership to the customer under the previous standard.
Software revenue In accordance with IFRS , revenue related to software arrangements will be recognized at points in time. Under previous standards, certain software revenue arrangements were recorded as revenue over the terms of the arrangements where customers had access to a portfolio of software solutions. After the adoption of IFRS , this change may result in larger fluctuations in revenue between quarters than under the previous standard.
Patent license agreements in Nokia Technologies The Group’s current revenue recognition principles for license agreements, which contain future commitments to perform, are in line with IFRS and continue to be recorded over time. Further, the Group has determined that, upon transition to IFRS , one specific license agreement is a completed contract as it has no such future commitments (refer to Application of transition guidance below).
Application of transition guidance In April , the Group entered into an agreement to license certain technology patents and patent applications owned by the Group on the effective date of that agreement, on a non-exclusive basis, to a licensee, for a period of years (the “License Agreement”). Contemporaneously and under the terms of the License Agreement, the Group issued to the licensee an option to extend the technology patent license for remaining life of the licensed patents. The Group received all cash consideration due for the sale of the -year license and option upon closing of the License Agreement. Management has determined that, upon transition to IFRS , the License Agreement is a completed contract. As such, in accordance with the transition requirements of the standard, the Group continues to apply its prior revenue accounting policies, based on IAS , Revenue, and related interpretations, to the License Agreement. Under those policies, the Group is recognizing revenue over the term of the License Agreement.
As of December , the balance of deferred revenue related to the License Agreement of EUR million, recognized in advance payments and deferred revenue in the consolidated statement of financial position, is expected to be recognized as revenue through .
Opening balance sheet adjustment Adoption of the standard will result in a net decrease of retained earnings of approximately EUR million in the opening balance sheet of .

145
Financial statements
NOKIA IN 2017
Disclosure The new standard introduces expanded disclosure requirements which will impact the presentation of the statement of financial position by providing information on customer-related contract assets and liabilities. The standard requires presentation of the net position of the Group’s contract-related balances, excluding invoiced receivables, as of the reporting date, on a contract-by-contract basis.
IFRS Leases IFRS , Leases, (“IFRS ”) issued in January , sets out the requirements for the recognition, measurement, presentation and disclosure of leases. IFRS provides a single lessee accounting model, requiring lessees to recognize right-of-use assets and lease liabilities for substantially all leases in the consolidated statement of financial position. The Group will adopt IFRS on the effective date of January , using the cumulative catch-up transition method, whereby the cumulative effect of initially applying IFRS will be recognized as an adjustment to the opening balance of retained earnings on January , and comparative information will not be restated. The Group is currently assessing the full impact of IFRS but the initial expectation is that the main impact from adoption relates to the recognition and disclosure of the Group’s real estate-related operating leases. In the consolidated financial statements for the year ended December , the Group disclosed non-cancellable operating lease commitments of EUR million. Refer to Note , Commitments and contingencies.
3. Use of estimates and critical accounting judgments The preparation of consolidated financial statements requires use of management judgment in electing and applying accounting policies as well as in making estimates that involve assumptions about the future. These judgments, estimates and assumptions may have a significant effect on the consolidated financial statements.
The estimates used in determining the carrying amounts of assets and liabilities subject to estimation uncertainty are based on historical experience, expected outcomes and various other assumptions that were available when these consolidated financial statements were prepared, and they are believed to be reasonable under the circumstances. The estimates are revised if changes in circumstances occur, or as a result of new information or more experience. As estimates inherently contain a varying degree of uncertainty, actual outcomes may differ, resulting in additional charges or credits to the consolidated income statement.
Management considers that the estimates, assumptions and judgments about the following accounting policies represent the most significant areas of estimation uncertainty and critical judgment that may have an impact on the consolidated financial statements.
Business combinations The Group applies the acquisition method to account for acquisitions of separate entities or businesses. The determination of the fair value and allocation thereof to each separately identifiable asset acquired and liability assumed as well as the determination of the acquisition date, when the valuation and allocation is to be conducted require estimation and judgment.
Estimation and judgment are required in determining the fair value of the acquisition, including the discount rate, the terminal growth rate, the number of years on which to base the cash flow projections, and the assumptions and estimates used to determine the cash inflows and outflows. The discount rate reflects current assessments of the time value of money, relevant market risk premiums, and industry comparisons. Risk premiums reflect risks and uncertainties for which the future cash flow estimates have not been adjusted. Terminal values are based on the expected life of products and forecasted life cycle, and forecasted cash flows over that period. The assumptions are based on information available at the date of acquisition; actual results may differ materially from the forecast as more information becomes available. Refer to Note , Acquisitions.
Revenue recognition The Group enters into transactions involving multiple components consisting of any combination of hardware, services, software and intellectual property rights where the Group identifies the separate components and estimates their relative fair values, considering the economic substance of the entire arrangement. The fair value of each component is determined by taking into consideration factors such as the price of the component when sold separately and the component cost plus a reasonable margin when price references are not available. The determination of the fair value and allocation thereof to each separately identifiable component requires the use of estimates and judgment which may have a significant impact on the timing and amount of revenue recognized. In some multiple element licensing transactions, the Group applies the residual method in the absence of reference information.
Net sales includes revenue from all licensing negotiations, litigations and arbitrations to the extent that the criteria for revenue recognition have been met. The final outcome may differ from the current estimate. Refer to Note , Revenue recognition.
Pension and other post-employment benefit obligations and expenses The determination of pension and other post-employment benefit obligations and expenses for defined benefit plans is dependent on a number of estimates and assumptions, including the discount rate, future mortality rate, annual rate of increase in future compensation levels, and healthcare costs trend rates and usage of services in the United States where the majority of our post-employment healthcare plans are maintained. A portion of plan assets is invested in debt and equity securities, which are subject to market volatility. Changes in assumptions and actuarial estimates may materially affect the benefit obligation, future expense and future cash flow. Based on these estimates and assumptions, defined benefit obligations amount to EUR million (EUR million in ) and the fair value of plan assets amounts to EUR million (EUR million in ). Refer to Note , Pensions and other post-employment benefits.
Income taxes The Group is subject to income taxes in the jurisdictions in which it operates. Judgment is required in determining current tax expense, uncertain tax positions, deferred tax assets and deferred tax liabilities; and the extent to which deferred tax assets can be recognized.
Estimates related to the recoverability of deferred tax assets are based on forecasted future taxable income and tax planning strategies. Based on these estimates and assumptions, the Group has EUR million (EUR million in ) of temporary differences, tax losses carry forward and tax credits for which no deferred tax assets are recognized due to uncertainty of utilization. The majority of the unrecognized deferred tax assets relate to France. Refer to Note , Income taxes.
146 NOKIA IN 2017
Notes to consolidated financial statements continued
The utilization of deferred tax assets is dependent on future taxable profit in excess of the profit arising from the reversal of existing taxable temporary differences. The recognition of deferred tax assets is based on the assessment of whether it is more likely than not that sufficient taxable profit will be available in the future to utilize the reversal of deductible temporary differences, unused tax losses and unused tax credits before the unused tax losses and unused tax credits expire. Recognition of deferred tax assets involves judgment regarding the future financial performance of the particular legal entity or tax group that has recognized the deferred tax asset.
Liabilities for uncertain tax positions are recorded based on estimates and assumptions of the amount and likelihood of outflow of economic resources when it is more likely than not that certain positions may not be fully sustained upon review by local tax authorities. Currently, the Group has ongoing tax investigations in multiple jurisdictions, including India and Canada. Due to the inherently uncertain nature of tax investigations, the ultimate outcome or actual cost of settlement may vary materially from estimates. Refer to Note , Income taxes.
Goodwill recoverability The recoverable amounts of the groups of CGUs and the CGU were based on fair value less costs of disposal that was determined using market participant assumptions based on a discounted cash flow calculation. The cash flow projections used in calculating the recoverable amounts were based on financial plans approved by management covering an explicit forecast period of three years. Seven additional years of cash flow projections subsequent to the explicit forecast period reflect a gradual progression towards the steady state cash flow projections modeled in the terminal year. Estimation and judgment are required in determining the components of the recoverable amount calculation, including the discount rate, the terminal growth rate, estimated revenue growth rates, gross margin and operating margin. The discount rates reflect current assessments of the time value of money and relevant market risk premiums reflecting risks and uncertainties for which the future cash flow estimates have not been adjusted. The terminal growth rate assumptions reflect long-term average growth rates for the industry and economies in which the groups of CGUs and the CGU operate.
The results of the impairment testing indicate adequate headroom for each group of CGUs. Total goodwill amounts to EUR million as of December , (EUR million in ). Refer to Note , Intangible assets and Note , Impairment.
Allowances for doubtful accounts Allowances for doubtful accounts are recognized for estimated losses resulting from customers’ inability to meet payment obligations. Estimation and judgment are required in determining the value of allowances for doubtful accounts at each reporting date. Management specifically analyzes accounts receivable and historical bad debt; customer concentrations; customer creditworthiness; past due balances; current economic trends; and changes in customer payment terms when determining allowances for doubtful accounts. Additional allowances may be required in future periods if financial positions of customers deteriorate, reducing their ability to meet payment obligations. Based on these estimates and assumptions, allowances for doubtful accounts are EUR million (EUR million in ), representing % of accounts receivable (% in ). Refer to Note , Allowances for doubtful accounts.
Allowances for excess and obsolete inventory Allowances for excess and obsolete inventory are recognized for excess amounts, obsolescence and declines in net realizable value below cost. Estimation and judgment are required in determining the value of the allowance for excess and obsolete inventory at each reporting date. Management specifically analyzes estimates of future demand for products when determining allowances for excess and obsolete inventory. Changes in these estimates could result in revisions to the valuation of inventory in future periods. Based on these estimates and assumptions, allowances for excess and obsolete inventory are EUR million (EUR million in ), representing % of inventory (% in ). Refer to Note , Inventories.
Fair value of derivatives and other financial instruments The fair value of derivatives and other financial instruments that are not traded in an active market such as unlisted equities is determined using valuation techniques. Estimation and judgment are required in selecting an appropriate valuation technique and in determining the underlying assumptions. Where quoted market prices are not available for unlisted shares, the fair value is based on a number of factors including, but not limited to, the current market value of similar instruments; prices established from recent arm’s-length transactions; and/or analysis of market prospects and operating performance of target companies with reference to public market comparable companies in similar industry sectors. Changes in these estimates could result in impairments or losses in future periods. Based on these estimates and assumptions, the fair value of derivatives and other financial assets that are not traded in an active market, using non-observable data (level of the fair value hierarchy), is EUR million (EUR million in ), representing % of total financial assets measured at fair value on a recurring basis (% of total net financial assets in ). Level financial liabilities include conditional obligation to China Huaxin as part of the Nokia Shanghai Bell definitive agreements where China Huaxin obtained the right to fully transfer its ownership interest in Nokia Shanghai Bell to the Group in exchange for a future cash settlement. The calculated net present value of the expected future cash settlement is EUR million, representing % of total financial liabilities measured at fair value on recurring basis. Refer to Note , Fair value of financial instruments.
Provisions Provisions are recognized when the Group has a present legal or constructive obligation as a result of past events, it is probable that an outflow of resources will be required to settle the obligation, and a reliable estimate of the amount can be made. At times, judgment is required in determining whether the Group has a present obligation; estimation is required in determining the value of the obligation. Whilst provisions are based on the best estimate of unavoidable costs, management may be required to make a number of assumptions surrounding the amount and likelihood of outflow of economic resources, and the timing of payment. Changes in estimates of timing or amounts of costs to be incurred may become necessary as time passes and/or more accurate information becomes available. Based on these estimates and assumptions, provisions amount to EUR million (EUR million in ). Refer to Note , Provisions.
Legal contingencies Legal proceedings covering a wide range of matters are pending or threatened in various jurisdictions. Provisions are recognized for pending litigation when it is apparent that an unfavorable outcome is probable and a best estimate of unavoidable costs can be reasonably estimated. Due to the inherently uncertain nature of litigation, the ultimate outcome or actual cost of settlement may vary materially from estimates. Refer to Note , Provisions.

147
Financial statements
NOKIA IN 2017
4. Segment information The Group has two businesses: Nokia’s Networks business and Nokia Technologies, and four reportable segments for financial reporting purposes: () Ultra Broadband Networks, () Global Services and () IP Networks and Applications within Nokia’s Networks business; and () Nokia Technologies. Segment-level information for Group Common and Other is also presented.
The Group has aggregated Mobile Networks and Fixed Networks operating segments to one reportable segment, Ultra Broadband Networks; and IP/Optical Networks and Nokia Software() operating segments to one reportable segment, IP Networks and Applications. The aggregated operating segments have similar economic characteristics, such as long-term margins; have similar products, production processes, distribution methods and customers; and operate in a similar regulatory environment.
The Group adopted its current operational and reporting structure on April , . Previously the Group had three reportable segments for financial reporting purposes: Ultra Broadband Networks and IP/Networks and Applications within Nokia's Networks business, and Nokia Technologies. Ultra Broadband Networks was comprised of two aggregated operating segments: Mobile Networks and Fixed Networks, and IP Networks and Applications was comprised of two aggregated operating segments: IP/Optical Networks and Nokia Software. On March , , the Group announced changes in its organizational structure which included the separation of the Group’s former Mobile Networks operating segment into two distinct operating segments: one focused on products and solutions, called Mobile Networks, and the other on services, called Global Services. The Global Services operating segment is comprised of the services that resided within the previous Mobile Networks operating segment, including company-wide managed services. Global Services does not include the services of Fixed Networks, IP/Optical Networks and Nokia Software, which continue to reside within the respective operating segments.
The President and CEO is the chief operating decision maker and monitors the operating results of operating and reportable segments for the purpose of making decisions about resource allocation and performance assessment. Key financial performance measures of the segments include primarily net sales and operating profit. The evaluation of segment performance and allocation of resources is based on segment operating profit().
Accounting policies of the segments are the same as those described in Note , Significant accounting policies. Inter-segment revenues and transfers are accounted for as if the revenues were to third parties, that is, at current market prices. Certain costs and revenue adjustments are not allocated to the segments().
No single customer represents % or more of revenues.
Segment descriptions Ultra Broadband Networks Ultra Broadband Networks comprises Mobile Networks and Fixed Networks operating segments.
The Mobile Networks operating segment offers an industry-leading portfolio of end-to-end mobile networking solutions comprising hardware and software for communications service providers, enterprises and related markets/verticals, such as public safety and Internet of Things (“IoT”).
The Fixed Networks operating segment provides copper and fiber access products, solutions and services. The portfolio allows for a customized combination of technologies that brings fiber to the most economical point for the customer.
Global Services Global Services operating segment provides a wide range of professional services with multi-vendor capabilities, covering network planning and optimization, systems integration as well as company-wide managed services. It also provides network implementation and care services for mobile networks, using the strength of its global service delivery for quality, speed and efficiency.
IP Networks and Applications IP Networks and Applications comprises IP/Optical Networks and Nokia Software operating segments.
The IP/Optical Networks operating segment provides the key IP routing and optical transport systems, software and services to build high capacity network infrastructure for the internet and global connectivity.
The Nokia Software operating segment offers software solutions spanning customer experience management, network operations and management, communications and collaboration, policy and charging, as well as Cloud, IoT, security, and analytics platforms that enable digital services providers and enterprises to accelerate innovation, monetize services, and optimize their customer experience.
Nokia Technologies The Nokia Technologies operating segment has two main objectives: to drive growth and renewal in its existing patent licensing business; and to build new businesses based on breakthrough innovation in key technologies and products, in the areas of Digital Media and Digital Health. The majority of net sales and related costs and expenses attributable to licensing and patenting the separate patent portfolios of Nokia Technologies, Nokia’s Networks business, and Nokia Bell Labs are recorded in Nokia Technologies. Each reportable segment continues to separately record its own research and development expenses.
Group Common and Other Group Common and Other includes Alcatel-Lucent Submarine Networks and Radio Frequency Systems, both of which are being managed as separate entities. In addition, Group Common and Other includes Nokia Bell Labs’ operating expenses, as well as certain corporate-level and centrally managed operating expenses.
(1) Applications & Analytics operating segment was renamed as Nokia Software on February 1, 2018. (2) Segment results exclude costs related to the acquisition of Alcatel Lucent and related integration, goodwill impairment charges, intangible asset amortization and other purchase price fair
value adjustments, restructuring and associated charges and certain other items.
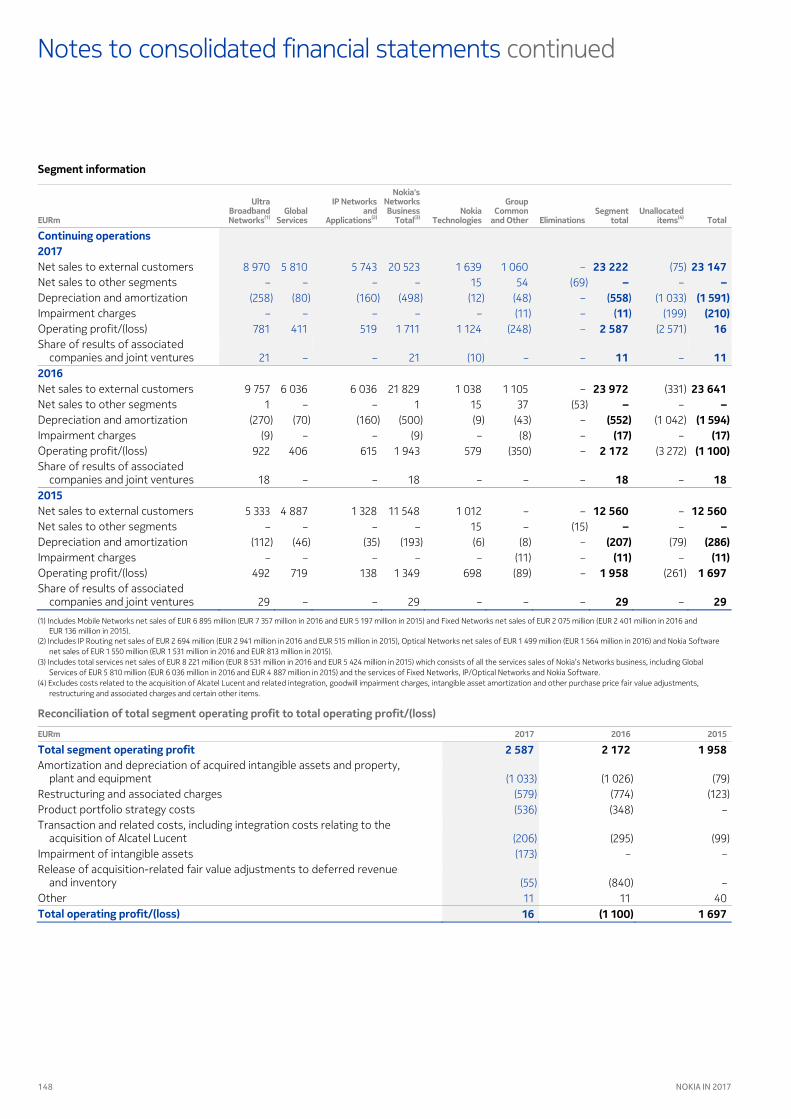
148 NOKIA IN 2017
continuedNotes to consolidated financial statements
Segment information
EURm
Ultra Broadband Networks(1)
Global Services
IP Networks and
Applications(2)
Nokia's Networks Business
Total(3) Nokia
Technologies
Group Common
and Other Eliminations Segment
total Unallocated
items(4) Total
Continuing operations Net sales to external customers 8 970 5 810 5 743 20 523 1 639 1 060 – 23 222 (75) 23 147 Net sales to other segments – – – – 15 54 (69) – – – Depreciation and amortization (258) (80) (160) (498) (12) (48) – () (1 033) ( ) Impairment charges – – – – – (11) – () (199) () Operating profit/(loss) 781 411 519 1 711 1 124 (248) – 2 587 (2 571) 16 Share of results of associated
companies and joint ventures 21 – – 21 (10) – – 11 – 11
Net sales to external customers 9 757 6 036 6 036 21 829 1 038 1 105 – 23 972 (331) 23 641 Net sales to other segments 1 – – 1 15 37 (53) – – – Depreciation and amortization (270) (70) (160) (500) (9) (43) – () (1 042) ( ) Impairment charges (9) – – (9) – (8) – () – () Operating profit/(loss) 922 406 615 1 943 579 (350) – 2 172 (3 272) ( ) Share of results of associated
companies and joint ventures 18 – – 18 – – – 18 – 18
Net sales to external customers 5 333 4 887 1 328 11 548 1 012 – – 12 560 – 12 560 Net sales to other segments – – – – 15 – (15) – – – Depreciation and amortization (112) (46) (35) (193) (6) (8) – () (79) () Impairment charges – – – – – (11) – () – () Operating profit/(loss) 492 719 138 1 349 698 (89) – 1 958 (261) 1 697 Share of results of associated
companies and joint ventures 29 – – 29 – – – 29 – 29 (1) Includes Mobile Networks net sales of EUR 6 895 million (EUR 7 357 million in 2016 and EUR 5 197 million in 2015) and Fixed Networks net sales of EUR 2 075 million (EUR 2 401 million in 2016 and
EUR 136 million in 2015). (2) Includes IP Routing net sales of EUR 2 694 million (EUR 2 941 million in 2016 and EUR 515 million in 2015), Optical Networks net sales of EUR 1 499 million (EUR 1 564 million in 2016) and Nokia Software
net sales of EUR 1 550 million (EUR 1 531 million in 2016 and EUR 813 million in 2015). (3) Includes total services net sales of EUR 8 221 million (EUR 8 531 million in 2016 and EUR 5 424 million in 2015) which consists of all the services sales of Nokia’s Networks business, including Global
Services of EUR 5 810 million (EUR 6 036 million in 2016 and EUR 4 887 million in 2015) and the services of Fixed Networks, IP/Optical Networks and Nokia Software. (4) Excludes costs related to the acquisition of Alcatel Lucent and related integration, goodwill impairment charges, intangible asset amortization and other purchase price fair value adjustments,
restructuring and associated charges and certain other items.
Reconciliation of total segment operating profit to total operating profit/(loss)
EURm 2017 2016 2015
Total segment operating profit 2 172 1 958 2 587 Amortization and depreciation of acquired intangible assets and property,
plant and equipment (1 026) (79) (1 033) Restructuring and associated charges (774) (123) (579) Product portfolio strategy costs (348) – (536) Transaction and related costs, including integration costs relating to the
acquisition of Alcatel Lucent (295) (99) (206) Impairment of intangible assets – – (173) Release of acquisition-related fair value adjustments to deferred revenue
and inventory (840) – (55) Other 11 40 11 Total operating profit/(loss) 16 ( ) 1 697
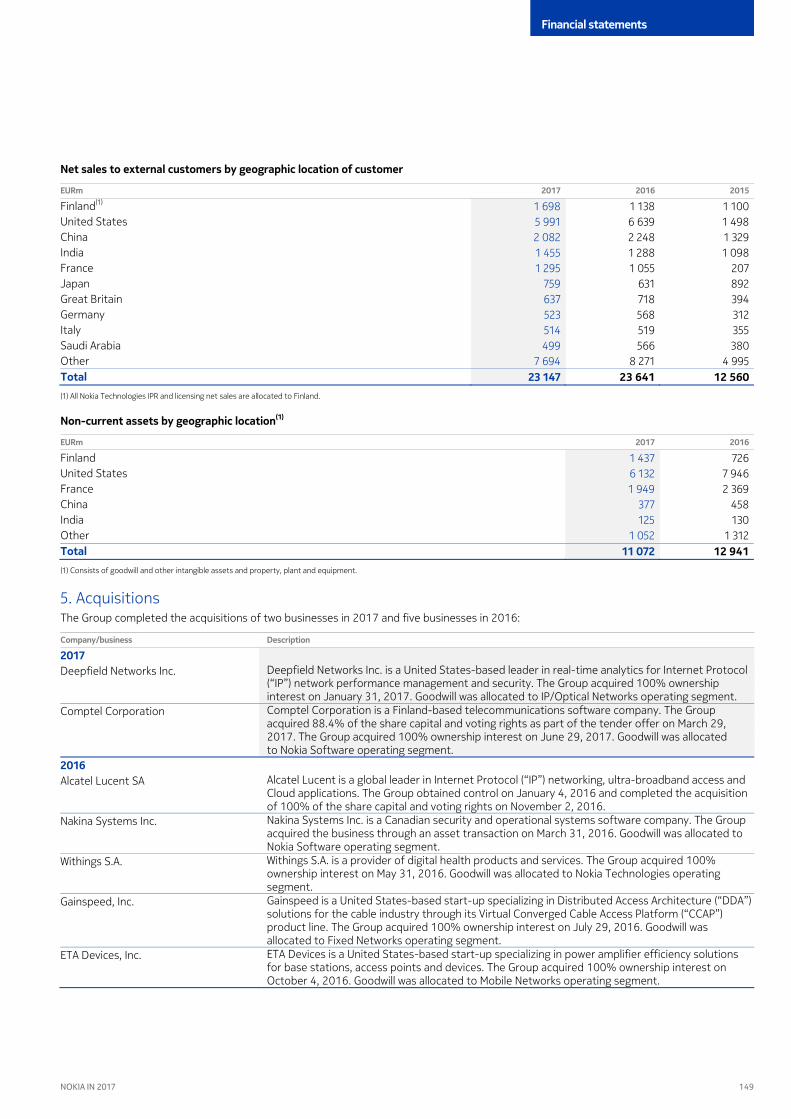
149
Financial statements
NOKIA IN 2017
Net sales to external customers by geographic location of customer
EURm 2017 2016 2015
Finland(1) 1 138 1 100 1 698 United States 6 639 1 498 5 991 China 2 248 1 329 2 082 India 1 288 1 098 1 455 France 1 055 207 1 295 Japan 631 892 759 Great Britain 718 394 637 Germany 568 312 523 Italy 519 355 514 Saudi Arabia 566 380 499 Other 8 271 4 995 7 694 Total 23 147 23 641 12 560 (1) All Nokia Technologies IPR and licensing net sales are allocated to Finland.
Non-current assets by geographic location(1)
EURm 2017 2016
Finland 726 1 437 United States 7 946 6 132 France 2 369 1 949 China 458 377 India 130 125 Other 1 312 1 052 Total 11 072 12 941 (1) Consists of goodwill and other intangible assets and property, plant and equipment.
The Group completed the acquis
5. Acquisitions itions of two businesses in and five businesses in :
Company/business Description
2017 Deepfield Networks Inc. Deepfield Networks Inc. is a United States-based leader in real-time analytics for Internet Protocol
(“IP”) network performance management and security. The Group acquired % ownership interest on January , . Goodwill was allocated to IP/Optical Networks operating segment.
Comptel Corporation Comptel Corporation is a Finland-based telecommunications software company. The Group acquired .% of the share capital and voting rights as part of the tender offer on March , . The Group acquired % ownership interest on June , . Goodwill was allocated to Nokia Software operating segment.
2016 Alcatel Lucent SA Alcatel Lucent is a global leader in Internet Protocol (“IP”) networking, ultra-broadband access and
Cloud applications. The Group obtained control on January , and completed the acquisition of % of the share capital and voting rights on November , .
Nakina Systems Inc. Nakina Systems Inc. is a Canadian security and operational systems software company. The Group acquired the business through an asset transaction on March , . Goodwill was allocated to Nokia Software operating segment.
Withings S.A. Withings S.A. is a provider of digital health products and services. The Group acquired % ownership interest on May , . Goodwill was allocated to Nokia Technologies operating segment.
Gainspeed, Inc. Gainspeed is a United States-based start-up specializing in Distributed Access Architecture (“DDA”) solutions for the cable industry through its Virtual Converged Cable Access Platform (“CCAP”) product line. The Group acquired % ownership interest on July , . Goodwill was allocated to Fixed Networks operating segment.
ETA Devices, Inc. ETA Devices is a United States-based start-up specializing in power amplifier efficiency solutions for base stations, access points and devices. The Group acquired % ownership interest on October , . Goodwill was allocated to Mobile Networks operating segment.
150 NOKIA IN 2017
continuedNotes to consolidated financial statements
Information on the Alcatel Lucent acquisition is presented below. All other acquisitions completed by the Group in and are individually immaterial to the consolidated financial statements. Goodwill arising from these acquisitions is attributable to future derivations of the acquired technology, future customers, synergies and assembled workforce, and was allocated to cash-generating units or groups of cash-generating units expected to benefit from the synergies of the combination. Refer to Note , Impairment. The majority of the goodwill acquired from these acquisitions is not expected to be deductible for tax purposes. The Group also recognised intangible assets from these acquisitions related to acquired customer relationships and technology assets. As of each respective acquisition date, the total consideration paid, aggregate fair values of intangible assets, other net assets acquired and resulting goodwill for the individually immaterial acquisitions are as follows:
EURm 2017 2016
Other intangible assets 70 169 Other net assets 16 67 Total identifiable net assets 236 86 Goodwill 274 162 Total purchase consideration 398 360 Alcatel Lucent business combination Acquisition of Alcatel Lucent Securities On April , , the Group and Alcatel Lucent announced their intention to combine through a public exchange offer (“exchange offer”) in France and the United States. The Group obtained control of Alcatel Lucent on January , when the interim results of the successful initial exchange offer were announced by the French stock market authority, Autorité des Marchés Financiers (“AMF”). On January , , as required by the AMF General Regulation, the Group reopened its exchange offer in France and the United States for the outstanding Alcatel Lucent ordinary shares, Alcatel Lucent American Depositary Shares (“ALU ADS”) and OCEANE convertible bonds (the “OCEANEs”, collectively “Alcatel Lucent Securities”) not tendered during the initial exchange offer period. The reopened exchange offer closed on February , . The Group has determined that the initial and the reopened exchange offers are linked transactions that are considered together as a single arrangement, given that the reopened exchange offer is required by the AMF General Regulation and is based on the same terms and conditions as the initial exchange offer. Following the initial and reopened exchange offers, the Group held .% of the share capital, and at least .% of the voting rights of Alcatel Lucent.
Subsequent to the exchange offers, a series of transactions were carried out to acquire the remaining outstanding equity interests in Alcatel Lucent. As a result, the Group held .% of the share capital and .% of the voting rights in Alcatel Lucent, corresponding to .% of the Alcatel Lucent shares on a fully diluted basis.
On September , , the Group and Alcatel Lucent filed a joint offer document with the AMF relating to the proposed Public Buy-Out Offer, in cash, for the remaining Alcatel Lucent shares and OCEANEs (the “Public Buy-Out Offer”). The Public Buy-Out Offer was followed by a Squeeze-Out in accordance with the AMF General Regulation, in cash, for the Shares and OCEANEs not tendered into the Public Buy-Out Offer (the “Squeeze-Out”, and together with the Public Buy-Out Offer, the “Offer”). In the Squeeze-Out, the Alcatel Lucent shares and OCEANEs not tendered into the Public Buy-Out Offer were transferred to the Group for the same consideration provided in the Public Buy-Out Offer, net of all costs. The remaining outstanding Alcatel Lucent stock options and performance shares were modified to settle in cash or Nokia shares.
The Public Buy-Out Offer period ended on October , , and the Squeeze-Out was implemented on November , , in accordance with the AMF General Regulation. On November , , the Group held % of the share capital and voting rights of Alcatel Lucent.
Alcatel Lucent ordinary shares and ALU ADSs acquired subsequent to the exchange offer, including through the Public Buy-Out Offer and the Squeeze-Out, were accounted for as equity transactions with the remaining non-controlling interests in Alcatel Lucent. As such, any new Nokia shares or cash consideration paid for these instruments were recorded directly in equity against the carrying amount of non-controlling interests. The acquisition of OCEANEs subsequent to the transactions linked to the exchange offer was treated both as extinguishment of debt and equity transaction with remaining non-controlling interests in Alcatel Lucent, with the redemption consideration allocated to the liability and equity components.
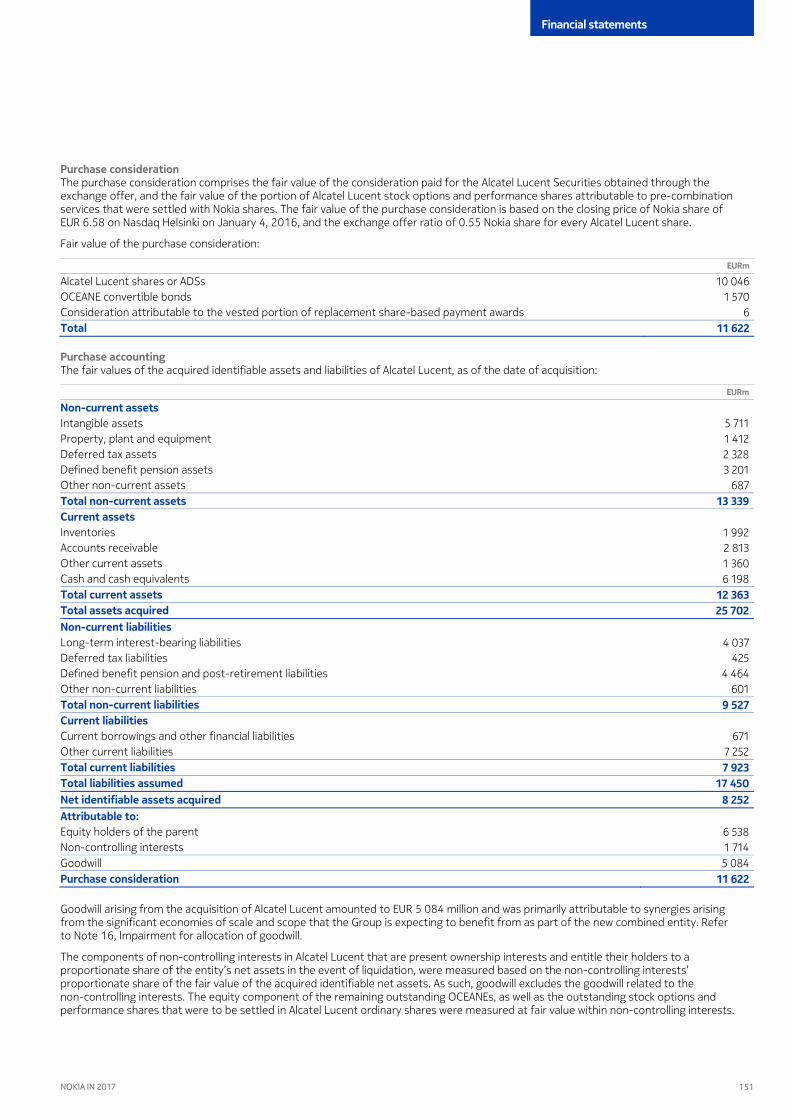
151
Financial statements
NOKIA IN 2017
Purchase consideration The purchase consideration comprises the fair value of the consideration paid for the Alcatel Lucent Securities obtained through the exchange offer, and the fair value of the portion of Alcatel Lucent stock options and performance shares attributable to pre-combination services that were settled with Nokia shares. The fair value of the purchase consideration is based on the closing price of Nokia share of EUR . on Nasdaq Helsinki on January , , and the exchange offer ratio of . Nokia share for every Alcatel Lucent share.
Fair value of the purchase consideration:
EURm
Alcatel Lucent shares or ADSs 10 046 OCEANE convertible bonds 1 570 Consideration attributable to the vested portion of replacement share-based payment awards 6 Total 11 622 Purchase accounting The fair values of the acquired identifiable assets and liabilities of Alcatel Lucent, as of the date of acquisition:
EURm
Non-current assets Intangible assets 5 711 Property, plant and equipment 1 412 Deferred tax assets 2 328 Defined benefit pension assets 3 201 Other non-current assets 687 Total non-current assets 13 339 Current assets Inventories 1 992 Accounts receivable 2 813 Other current assets 1 360 Cash and cash equivalents 6 198 Total current assets 12 363 Total assets acquired 25 702 Non-current liabilities Long-term interest-bearing liabilities 4 037 Deferred tax liabilities 425 Defined benefit pension and post-retirement liabilities 4 464 Other non-current liabilities 601 Total non-current liabilities 9 527 Current liabilities Current borrowings and other financial liabilities 671 Other current liabilities 7 252 Total current liabilities 7 923 Total liabilities assumed 17 450 Net identifiable assets acquired 8 252 Attributable to: Equity holders of the parent 6 538 Non-controlling interests 1 714 Goodwill 5 084 Purchase consideration 11 622
Goodwill arising from the acquisition of Alcatel Lucent amounted to EUR million and was primarily attributable to synergies arising from the significant economies of scale and scope that the Group is expecting to benefit from as part of the new combined entity. Refer to Note , Impairment for allocation of goodwill.
The components of non-controlling interests in Alcatel Lucent that are present ownership interests and entitle their holders to a proportionate share of the entity’s net assets in the event of liquidation, were measured based on the non-controlling interests’ proportionate share of the fair value of the acquired identifiable net assets. As such, goodwill excludes the goodwill related to the non-controlling interests. The equity component of the remaining outstanding OCEANEs, as well as the outstanding stock options and performance shares that were to be settled in Alcatel Lucent ordinary shares were measured at fair value within non-controlling interests.

152 NOKIA IN 2017
continuedNotes to consolidated financial statements
Fair values of identifiable intangible assets acquired:
Fair value
EURm Amortization period years
Customer relationships 2 902 10 Technologies 2 170 4 Other 639 8 Total 5 711
Acquisition-related costs not directly attributable to the issue of shares, recorded in selling, general and administrative expenses and other expenses in the consolidated income statement, and in operating cash flows in the consolidated statement of cash flows, amounted to EUR million, of which EUR million was recognized in .
From January to December , the acquired business contributed revenues of EUR million and a net loss of EUR million to the consolidated income statement. These amounts were calculated using the subsidiary’s results, adjusting them for accounting policy alignments.
Results of Discontinued operations6. Disposals treated as Discontinued operations
(1)
EURm 2017 2016 2015
Net sales – 1 075 – Cost of sales – (244) – Gross profit – 831 – Research and development expenses – (498) – Selling, general and administrative expenses (11) (213) (7) Other income and expenses (4) (23) (15) Operating (loss)/profit ( () ) 97 Financial income and expenses 14 (9) 6 (Loss)/profit before tax ( () ) 88 Income tax (expense)/benefit (28) 8 (10) (Loss)/profit for the year, ordinary activities ( () ) 96 Gain on the sale, net of tax(2) 14 1 178 5 (Loss)/profit for the year ( () ) 1 274 (1) Results of Discontinued operations include the results of the HERE business and the D&S business, the disposals of which were completed on December 4, 2015 and April 25, 2014, respectively.
In 2013, the tax authorities in India commenced an investigation into withholding tax in respect of payments by Nokia India Private Limited to Nokia Corporation for the supply of operating software. (2) In 2017, an additional gain on the sale of EUR 5 million was recognized related to the HERE business due to a tax indemnification. In 2016, an additional gain on the sale of EUR 7 million was recognized
related to the HERE business as a result of the final settlement of the purchase price, and EUR 7 million related to the D&S business due to a tax indemnification.
Cash flows from Discontinued operations(1)
EURm 2017 2016 2015
Net cash (used in)/from operating activities (10) 6 (14) Net cash (used in)/from investing activities 3 2 553 (16) Net cash flow for the period () () 2 559 (1) Cash flows from Discontinued operations include the cash flows from the HERE business and the D&S business, the disposals of which were completed on December 4, 2015 and April 25, 2014, respectively.
Sale of the HERE Business On August , the Group announced the Sale of the HERE Business to a consortium of leading automotive companies, comprising AUDI AG, BMW Group and Daimler AG. Subsequent to the announcement, the Group has presented the HERE business as Discontinued operations. The HERE business was previously an operating and reportable segment and its business focused on the development of location intelligence, location-based services and local commerce. The Sale of the HERE Business was completed on December , .
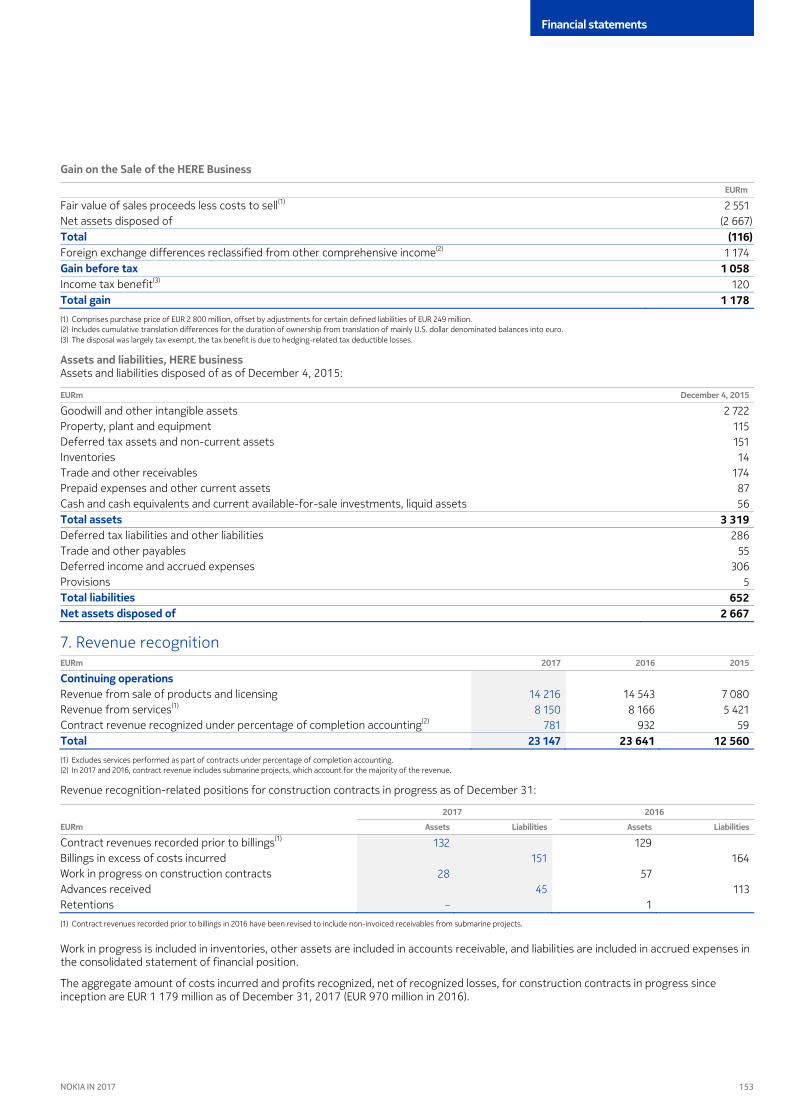
153
Financial statements
NOKIA IN 2017
Gain on the Sale of the HERE Business
EURm
Fair value of sales proceeds less costs to sell(1) 2 551 Net assets disposed of (2 667) Total () Foreign exchange differences reclassified from other comprehensive income(2) 1 174 Gain before tax 1 058 Income tax benefit(3) 120 Total gain 1 178 (1) Comprises purchase price of EUR 2 800 million, offset by adjustments for certain defined liabilities of EUR 249 million. (2) Includes cumulative translation differences for the duration of ownership from translation of mainly U.S. dollar denominated balances into euro. (3) The disposal was largely tax exempt, the tax benefit is due to hedging-related tax deductible losses.
Assets and liabilities, HERE business Assets and liabilities disposed of as of December , :
EURm December 4, 2015
Goodwill and other intangible assets 2 722 Property, plant and equipment 115 Deferred tax assets and non-current assets 151 Inventories 14 Trade and other receivables 174 Prepaid expenses and other current assets 87 Cash and cash equivalents and current available-for-sale investments, liquid assets 56 Total assets 3 319 Deferred tax liabilities and other liabilities 286 Trade and other payables 55 Deferred income and accrued expenses 306 Provisions 5 Total liabilities 652 Net assets disposed of 2 667
EURm
7. Revenue recognition 2017 2016 2015
Continuing operations Revenue from sale of products and licensing 14 543 7 080 14 216 Revenue from services(1) 8 166 5 421 8 150 Contract revenue recognized under percentage of completion accounting(2) 932 59 781 Total 23 147 23 641 12 560 (1) Excludes services performed as part of contracts under percentage of completion accounting. (2) In 2017 and 2016, contract revenue includes submarine projects, which account for the majority of the revenue.
Revenue recognition-related positions for construction contracts in progress as of December :
2017 2016
EURm Assets Liabilities Assets Liabilities
Contract revenues recorded prior to billings(1) 132 129 Billings in excess of costs incurred 164 151 Work in progress on construction contracts 28 57 Advances received 113 45 Retentions – 1
(1) Contract revenues recorded prior to billings in 2016 have been revised to include non-invoiced receivables from submarine projects.
Work in progress is included in inventories, other assets are included in accounts receivable, and liabilities are included in accrued expenses in the consolidated statement of financial position.
The aggregate amount of costs incurred and profits recognized, net of recognized losses, for construction contracts in progress since inception are EUR million as of December , (EUR million in ).
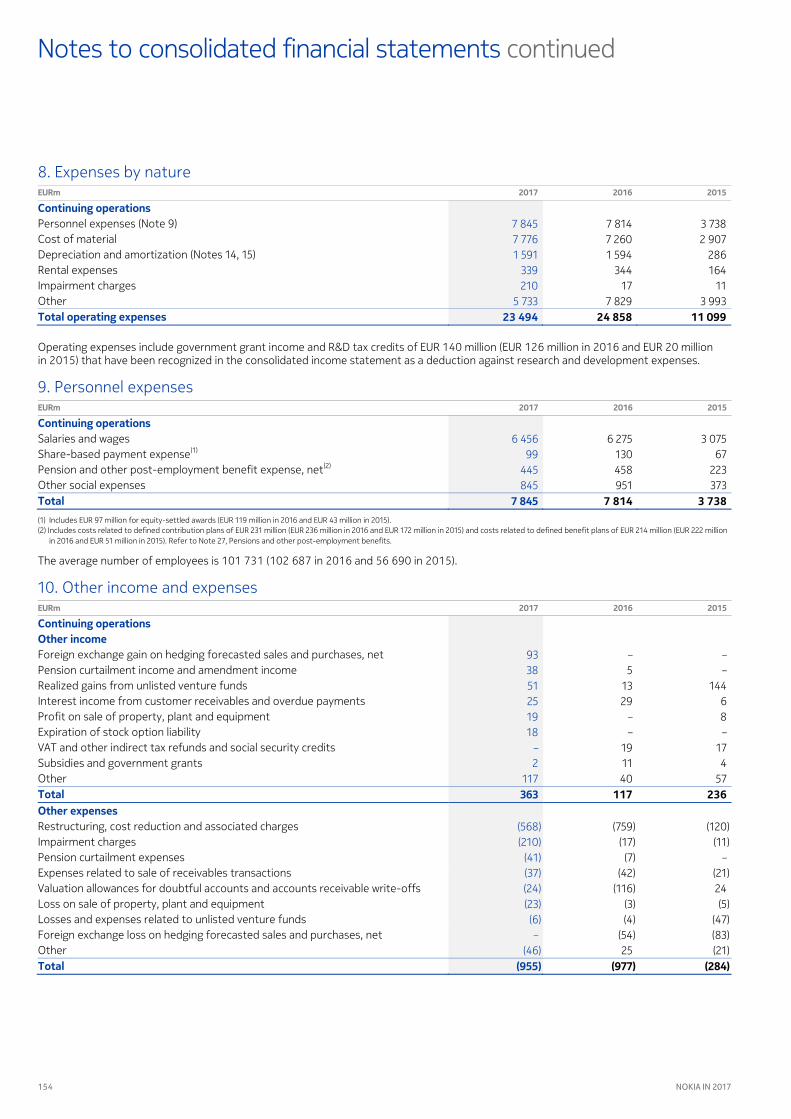
154 NOKIA IN 2017
continuedNotes to consolidated financial statements
EURm
8. Expenses by nature 2017 2016 2015
Continuing operations Personnel expenses (Note 9) 7 814 3 738 7 845 Cost of material 7 260 2 907 7 776 Depreciation and amortization (Notes 14, 15) 1 594 286 1 591 Rental expenses 344 164 339 Impairment charges 17 11 210 Other 7 829 3 993 5 733 Total operating expenses 24 858 11 099 23 494
Operating expenses include government grant income and R&D tax credits of EUR million (EUR million in and EUR million in ) that have been recognized in the consolidated income statement as a deduction against research and development expenses.
EURm
9. Personnel expenses 2017 2016 2015
Continuing operations Salaries and wages 6 275 3 075 6 456 Share-based payment expense(1) 130 67 99 Pension and other post-employment benefit expense, net(2) 458 223 445 Other social expenses 951 373 845 Total 7 845 7 814 3 738 (1) Includes EUR 97 million for equity-settled awards (EUR 119 million in 2016 and EUR 43 million in 2015). (2) Includes costs related to defined contribution plans of EUR 231 million (EUR 236 million in 2016 and EUR 172 million in 2015) and costs related to defined benefit plans of EUR 214 million (EUR 222 million
in 2016 and EUR 51 million in 2015). Refer to Note 27, Pensions and other post-employment benefits.
The average number of employees is ( in and in ).
EURm
10. Other income and expenses 2017 2016 2015
Continuing operations Other income Foreign exchange gain on hedging forecasted sales and purchases, net – – 93 Pension curtailment income and amendment income 5 – 38 Realized gains from unlisted venture funds 13 144 51 Interest income from customer receivables and overdue payments 29 6 25 Profit on sale of property, plant and equipment – 8 19 Expiration of stock option liability – – 18 VAT and other indirect tax refunds and social security credits 19 17 – Subsidies and government grants 11 4 2 Other 40 57 117 Total 363 117 236 Other expenses Restructuring, cost reduction and associated charges (759) (120) (568) Impairment charges (17) (11) (210) Pension curtailment expenses (7) – (41) Expenses related to sale of receivables transactions (42) (21) (37) Valuation allowances for doubtful accounts and accounts receivable write-offs (116) 24 (24) Loss on sale of property, plant and equipment (3) (5) (23) Losses and expenses related to unlisted venture funds (4) (47) (6) Foreign exchange loss on hedging forecasted sales and purchases, net (54) (83) – Other 25 (21) (46) Total () () ()
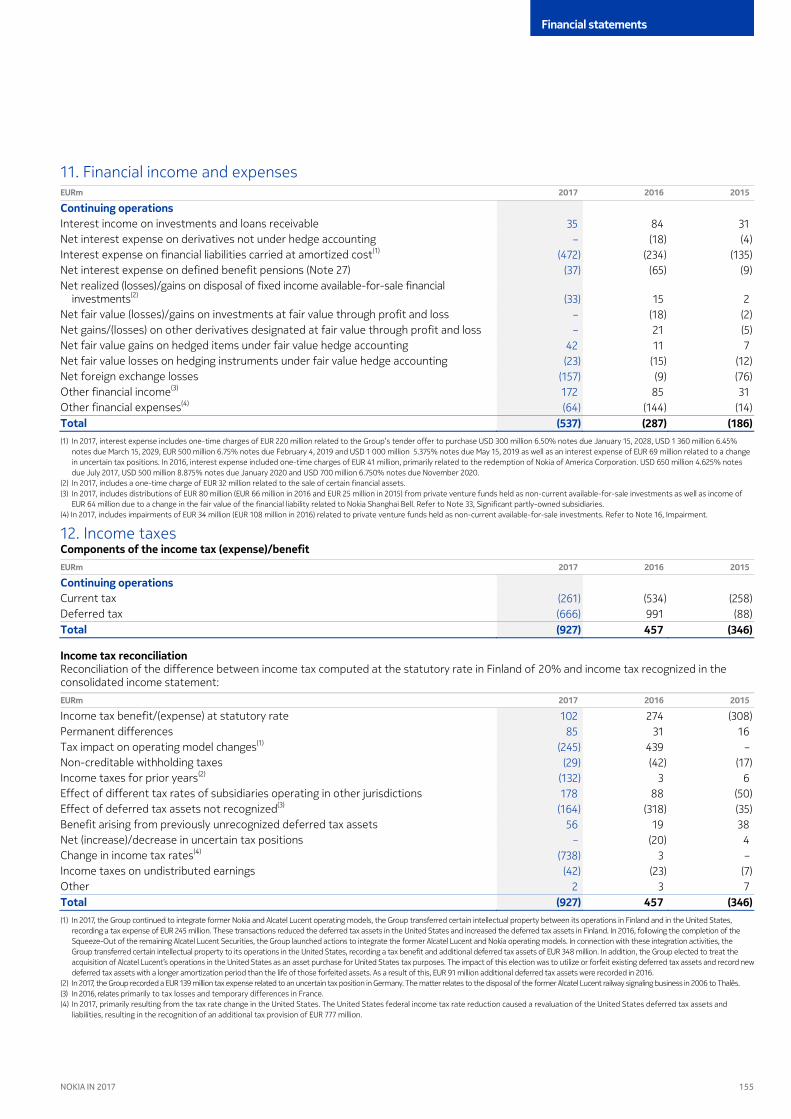
155
Financial statements
NOKIA IN 2017
EURm
11. Financial income and expenses 2017 2016 2015
Continuing operations Interest income on investments and loans receivable 84 31 35 Net interest expense on derivatives not under hedge accounting (18) (4) – Interest expense on financial liabilities carried at amortized cost(1) (234) (135) (472) Net interest expense on defined benefit pensions (Note 27) (65) (9) (37) Net realized (losses)/gains on disposal of fixed income available-for-sale financial
investments(2) 15 2 (33) Net fair value (losses)/gains on investments at fair value through profit and loss (18) (2) – Net gains/(losses) on other derivatives designated at fair value through profit and loss 21 (5) – Net fair value gains on hedged items under fair value hedge accounting 11 7 42 Net fair value losses on hedging instruments under fair value hedge accounting (15) (12) (23) Net foreign exchange losses (9) (76) (157) Other financial income(3) 85 31 172 Other financial expenses(4) (144) (14) (64) Total () () () (1) In 2017, interest expense includes one-time charges of EUR 220 million related to the Group’s tender offer to purchase USD 300 million 6.50% notes due January 15, 2028, USD 1 360 million 6.45%
notes due March 15, 2029, EUR 500 million 6.75% notes due February 4, 2019 and USD 1 000 million 5.375% notes due May 15, 2019 as well as an interest expense of EUR 69 million related to a change in uncertain tax positions. In 2016, interest expense included one-time charges of EUR 41 million, primarily related to the redemption of Nokia of America Corporation. USD 650 million 4.625% notes due July 2017, USD 500 million 8.875% notes due January 2020 and USD 700 million 6.750% notes due November 2020.
(2) In 2017, includes a one-time charge of EUR 32 million related to the sale of certain financial assets. (3) In 2017, includes distributions of EUR 80 million (EUR 66 million in 2016 and EUR 25 million in 2015) from private venture funds held as non-current available-for-sale investments as well as income of
EUR 64 million due to a change in the fair value of the financial liability related to Nokia Shanghai Bell. Refer to Note 33, Significant partly-owned subsidiaries. (4) In 2017, includes impairments of EUR 34 million (EUR 108 million in 2016) related to private venture funds held as non-current available-for-sale investments. Refer to Note 16, Impairment.
Components of the income tax (expense)/benefit 12. Income taxes
EURm 2017 2016 2015
Continuing operations Current tax (534) (258) (261) Deferred tax 991 (88) (666) Total () 457 () Income tax reconciliation Reconciliation of the difference between income tax computed at the statutory rate in Finland of % and income tax recognized in the consolidated income statement: EURm 2017 2016 2015
Income tax benefit/(expense) at statutory rate 274 (308) 102 Permanent differences 31 16 85 Tax impact on operating model changes(1) 439 – (245) Non-creditable withholding taxes (42) (17) (29) Income taxes for prior years(2) 3 6 (132) Effect of different tax rates of subsidiaries operating in other jurisdictions 88 (50) 178 Effect of deferred tax assets not recognized(3) (318) (35) (164) Benefit arising from previously unrecognized deferred tax assets 19 38 56 Net (increase)/decrease in uncertain tax positions (20) 4 – Change in income tax rates(4) 3 – (738) Income taxes on undistributed earnings (23) (7) (42) Other 3 7 2 Total 457 ( () ) (1) In 2017, the Group continued to integrate former Nokia and Alcatel Lucent operating models, the Group transferred certain intellectual property between its operations in Finland and in the United States,
recording a tax expense of EUR 245 million. These transactions reduced the deferred tax assets in the United States and increased the deferred tax assets in Finland. In 2016, following the completion of the Squeeze-Out of the remaining Alcatel Lucent Securities, the Group launched actions to integrate the former Alcatel Lucent and Nokia operating models. In connection with these integration activities, the Group transferred certain intellectual property to its operations in the United States, recording a tax benefit and additional deferred tax assets of EUR 348 million. In addition, the Group elected to treat the acquisition of Alcatel Lucent’s operations in the United States as an asset purchase for United States tax purposes. The impact of this election was to utilize or forfeit existing deferred tax assets and record new deferred tax assets with a longer amortization period than the life of those forfeited assets. As a result of this, EUR 91 million additional deferred tax assets were recorded in 2016.
(2) In 2017, the Group recorded a EUR 139 million tax expense related to an uncertain tax position in Germany. The matter relates to the disposal of the former Alcatel Lucent railway signaling business in 2006 to Thalès. (3) In 2016, relates primarily to tax losses and temporary differences in France. (4) In 2017, primarily resulting from the tax rate change in the United States. The United States federal income tax rate reduction caused a revaluation of the United States deferred tax assets and
liabilities, resulting in the recognition of an additional tax provision of EUR 777 million.

156 NOKIA IN 2017
continuedNotes to consolidated financial statements
Income tax liabilities and assets include a net EUR million liability (EUR million in ) relating to uncertain tax positions with inherently uncertain timing of cash outflows.
Prior period income tax returns for certain Group companies are under examination by local tax authorities. The Group has on-going tax audits in various jurisdictions, including India, Finland and Canada. The Group’s business and investments, especially in emerging market countries, may be subject to uncertainties, including unfavorable or unpredictable tax treatment. Management judgment and a degree of estimation are required in determining the tax expense or benefit. Even though management does not expect that any significant additional taxes in excess of those already provided for will arise as a result of these examinations, the outcome or actual cost of settlement may vary materially from estimates.
Deferred tax assets and liabilities
2017 2016
EURm Deferred
tax assets Deferred
tax liabilities Net balance Deferred
tax assets Deferred
tax liabilities Net balance
Tax losses carried forward and unused tax credits 1 019 – 1 428 – Undistributed earnings – (106) – (67) Intangible assets and property, plant and equipment 2 851 (353) 3 713 (501) Defined benefit pension assets 13 (940) 3 (1 334) Other non-current assets 85 (6) 19 (52) Inventories 157 (1) 154 (3) Other current assets 241 (7) 81 (66) Defined benefit pension and other post-retirement
liabilities 933 (60) 1 478 (29) Other non-current liabilities 34 – 12 (2) Provisions 240 (55) 249 (6) Other current liabilities 223 (78) 307 (56) Other temporary differences 12 (33) 16 (46) Total before netting 5 808 ( ) 7 460 ( 4 169 ) 5 298 Netting of deferred tax assets and liabilities (1 226) 1 226 (1 759) 1 759 – – Total after netting 4 582 () 5 701 ( 4 169 ) 5 298
Movements in the net deferred tax balance during the year:
EURm 2017 2016
As of January 1 2 573 5 298 Recognized in income statement, Continuing Operations 991 (666) Recognized in income statement, Discontinued Operations (2) 2 Recognized in other comprehensive income (255) (150) Recognized in equity (5) (7) Acquisitions through business combinations and disposals 1 914 (29) Translation differences 82 (279) As of December 31 4 169 5 298

157
Financial statements
NOKIA IN 2017
Amount of temporary differences, tax losses carried forward and tax credits for which no deferred tax asset was recognized due to uncertainty of utilization:
EURm 2017 2016
Temporary differences 2 214 1 879 Tax losses carried forward 18 706 18 449 Tax credits 32 37 Total 20 365 20 952
The majority of the unrecognized temporary differences and tax losses relate to France. Based on the pattern of losses in the past years and in the absence of convincing other evidence of sufficient taxable profit in the future years, it is uncertain whether these deferred tax assets can be utilized in the foreseeable future. A significant portion of the French unrecognized deferred tax assets are indefinite in nature and available against future French tax liabilities, subject to a limitation of % of annual taxable profits.
The deferred tax assets are recognized to the extent it is probable that taxable profit will be available against which the tax losses, tax credits and deductible temporary difference can be utilized in the relevant jurisdictions. The majority of the Group's recognized deferred tax assets relate to unused tax losses, tax credits and deductible temporary differences in Finland of EUR . billion (EUR . billion in ) and the United States of EUR . billion (EUR . billion in ). Based on the recent years’ profitability in Finland and the United States, as well as the latest forecasts of future financial performance, the Group has been able to establish a pattern of sufficient tax profitability in Finland and the United States to conclude that it is probable that it will be able to utilize the tax losses, tax credits and deductible temporary differences in the foreseeable future.
Expiry of tax losses carried forward and unused tax credits:
2017 2016
EURm Recognized Unrecognized Total Recognized Unrecognized Total
Tax losses carried forward Within 10 years 1 338 1 491 1 853 1 681 3 534 2 828 Thereafter 135 25 79 17 96 160 No expiry 1 674 16 933 1 878 17 008 18 886 18 608 Total 3 147 18 449 21 596 3 810 18 706 22 516 Tax credits Within 10 years 367 21 395 23 418 388 Thereafter 111 5 94 – 94 116 No expiry 35 11 66 9 75 46 Total 513 37 550 555 32 587
The Group has undistributed earnings of EUR million (EUR million in ) for which a deferred tax liability has not been recognized as these earnings will not be distributed in the foreseeable future.

158 NOKIA IN 2017
continuedNotes to consolidated financial statements
13. Earnings per share 2017
EURm2016
EURm 2015
EURm
Basic (Loss)/profit for the year attributable to equity holders of the parent Continuing operations (751) 1 192 (1 473) Discontinued operations (15) 1 274 (21) Total (766) 2 466 (1 494) Diluted Effect of profit adjustments Profit adjustment relating to Alcatel Lucent American Depositary Shares (8) – – Elimination of interest expense, net of tax, on convertible bonds, where dilutive – 36 – Total effect of profit adjustments (8) 36 – (Loss)/profit attributable to equity holders of the parent adjusted for the effect
of dilution Continuing operations (759) 1 228 (1 473) Discontinued operations (15) 1 274 (21) Total (774) 2 502 (1 494)
000s shares 000s shares 000s shares
Basic Weighted average number of shares in issue 5 732 371 3 670 934 5 651 814 Diluted Effect of dilutive shares Effect of dilutive equity-based share incentive programs
Restricted shares and other – 4 253 – Performance shares – 3 179 – Stock options – 1 971 –
Total effect of dilutive equity-based share incentive programs – 9 403 – Effect of other dilutive shares
Alcatel Lucent American Depositary Shares 8 746 – – Assumed conversion of convertible bonds – 268 975 –
Total effect of other dilutive-shares 8 746 268 975 – Total effect of dilutive shares 8 746 278 378 – Adjusted weighted average number of shares 5 5 741 117 3 949 312 651 814
Earnings per share attributable to equity holders of the parent EUR EUR EUR
Basic earnings per share Continuing operations (0.13) 0.32 (0.26) Discontinued operations 0.00 0.35 0.00 (Loss)/profit for the year (0.13) 0.67 (0.26) Diluted earnings per share Continuing operations (0.13) 0.31 (0.26) Discontinued operations 0.00 0.32 0.00 (Loss)/profit for the year (0.13) 0.63 (0.26)
Basic earnings per share is calculated by dividing the profit/loss attributable to equity holders of the parent by the weighted average number of shares outstanding during the year, excluding treasury shares. Diluted earnings per share is calculated by adjusting the profit/loss attributable to equity holders of the parent to eliminate the interest expense of dilutive convertible bonds and other equity instruments; and by adjusting the weighted average number of shares outstanding with the dilutive effect of stock options, restricted shares and performance shares outstanding during the period as well as the assumed conversion of convertible bonds and other equity instruments.
million restricted shares are outstanding ( million in and none in ) that could potentially have a dilutive impact in the future but are excluded from the calculation as they are determined to be anti-dilutive.
million performance shares are outstanding ( million in and none in ) that could potentially have a dilutive impact in the future but are excluded from the calculation as they are determined to be anti-dilutive. In addition, million performance shares ( million in and ) have been excluded from the calculation of diluted shares as contingency conditions have not been met.
Stock options equivalent to fewer than million shares (fewer than million shares in and ) have been excluded from the calculation of diluted shares as they are determined to be anti-dilutive.
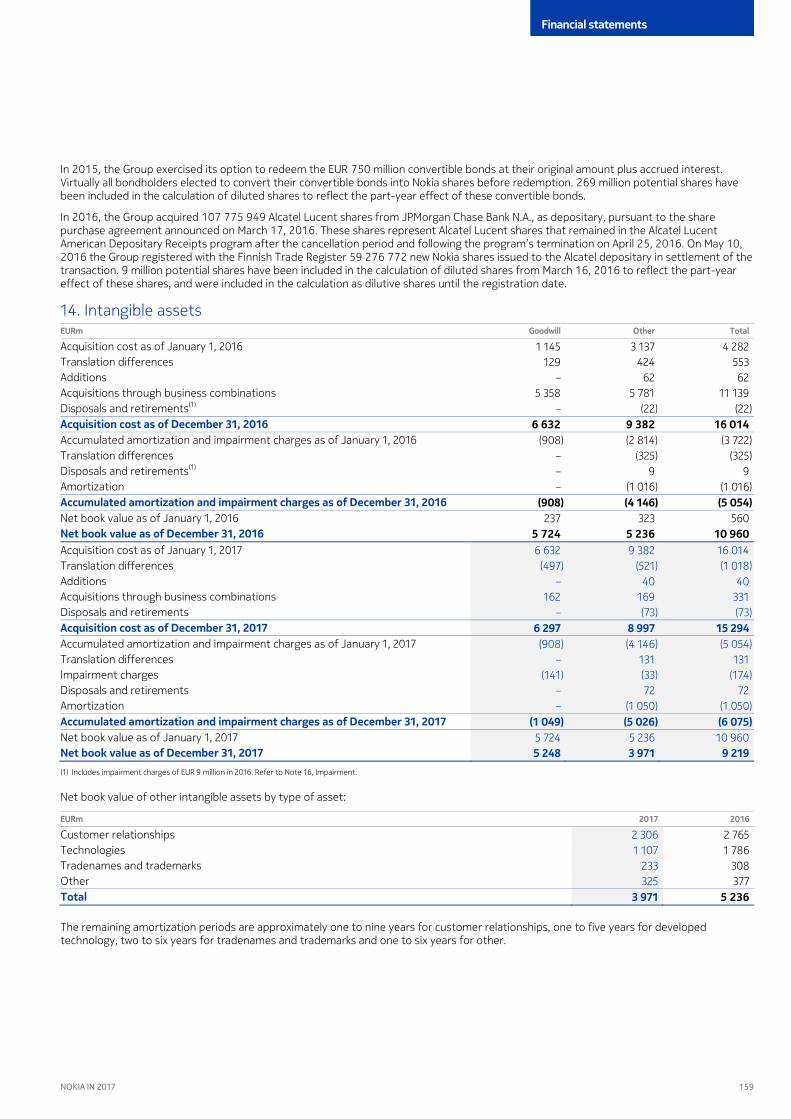
159
Financial statements
NOKIA IN 2017
In , the Group exercised its option to redeem the EUR million convertible bonds at their original amount plus accrued interest. Virtually all bondholders elected to convert their convertible bonds into Nokia shares before redemption. million potential shares have been included in the calculation of diluted shares to reflect the part-year effect of these convertible bonds.
In , the Group acquired Alcatel Lucent shares from JPMorgan Chase Bank N.A., as depositary, pursuant to the share purchase agreement announced on March , . These shares represent Alcatel Lucent shares that remained in the Alcatel Lucent American Depositary Receipts program after the cancellation period and following the program’s termination on April , . On May , the Group registered with the Finnish Trade Register new Nokia shares issued to the Alcatel depositary in settlement of the transaction. million potential shares have been included in the calculation of diluted shares from March , to reflect the part-year effect of these shares, and were included in the calculation as dilutive shares until the registration date.
EURm
14. Intangible assets Goodwill Other Total
Acquisition cost as of January 1, 2016 1 145 3 137 4 282 Translation differences 129 424 553 Additions – 62 62 Acquisitions through business combinations 5 358 5 781 11 139 Disposals and retirements(1) – (22) (22) Acquisition cost as of December 31, 2016 6 632 9 382 16 014 Accumulated amortization and impairment charges as of January 1, 2016 (908) (2 814) (3 722) Translation differences – (325) (325) Disposals and retirements(1) – 9 9 Amortization – (1 016) (1 016) Accumulated amortization and impairment charges as of December 31, 2016 () ( ) ( ) Net book value as of January 1, 2016 237 323 560 Net book value as of December 31, 2016 5 724 5 236 10 960 Acquisition cost as of January 1, 2017 6 632 9 382 16 014 Translation differences (497) (521) Additions
(1 018) – 40
Acquisitions through business combinations 40
162 169 Disposals and retirements
331 – (73)
Acquisition cost as of December 31, 2017 (73)
6 297 8 997 15 294 Accumulated amortization and impairment charges as of January 1, 2017 (908) (4 146) Translation differences
(5 054) – 131
Impairment charges 131
(141) (33) Disposals and retirements
(174) – 72
Amortization 72
– (1 050) Accumulated amortization and impairment charges as of December 31, 2017
(1 050) ( ) ( ) ( )
Net book value as of January 1, 2017 5 724 5 236 Net book value as of December 31, 2017
10 960 5 248 3 971 9 219
(1) Includes impairment charges of EUR 9 million in 2016. Refer to Note 16, Impairment.
Net book value of other intangible assets by type of asset:
EURm 2017 2016
Customer relationships 2 765 2 306 Technologies 1 786 1 107 Tradenames and trademarks 308 233 Other 377 325 Total 3 971 5 236
The remaining amortization periods are approximately one to nine years for customer relationships, one to five years for developed technology, two to six years for tradenames and trademarks and one to six years for other.

160 NOKIA IN 2017
continuedNotes to consolidated financial statements
EURm
15. Property, plant and equipment Buildings and constructions
Machinery and equipment Other
Assets under construction Total
Acquisition cost as of January 1, 2016 427 1 746 41 15 2 229 Transfers to assets held for sale (47) – – – (47) Translation differences 1 (15) 2 – (12) Additions 65 361 3 87 516 Acquisitions through business combinations 587 674 68 84 1 413 Reclassifications 20 75 2 (97) – Disposals and retirements (54) (148) (2) – (204) Acquisition cost as of December 31, 2016 999 2 693 114 89 3 895 Accumulated depreciation as of January 1, 2016 (174) (1 351) (9) – (1 534) Transfers to assets held for sale 5 – – – 5 Translation differences 1 13 – – 14 Disposals and retirements 46 133 – – 179 Depreciation (94) (480) (4) – (578) Accumulated depreciation as of December 31, 2016 () ( ) () – ( ) Net book value as of January 1, 2016 253 395 32 15 695 Net book value at December 31, 2016 783 1 008 101 89 1 981 Acquisition cost as of January 1, 2017 999 2 693 114 89 3 895 Translation differences (52) (105) (9) (5) Additions
(171) 115 370 3 89
Acquisitions through business combinations 577
1 1 – – Reclassifications
2 42 43 – (85)
Disposals and retirements –
(40) (353) (2) (2) Acquisition cost as of December 31, 2017
(397) 1 065 2 649 106 86 3 906
Accumulated depreciation as of January 1, 2017 (216) (1 685) (13) – Translation differences
(1 914) 20 67 1 –
Impairment charges 88
– (25) – – Disposals and retirements
(25) 22 315 2 –
Depreciation 339
(97) (440) (4) – Accumulated depreciation as of December 31, 2017
(541) () ( ) () – ( )
Net book value as of January 1, 2017 783 1 008 101 89 Net book value as of December 31, 2017
1 981 794 881 92 86 1 853
In , the tax authorities in India placed a lien which prohibited the Group from transferring the mobile devices-related facility in Chennai to Microsoft as part of the Sale of the D&S Business.

161
Financial statements
NOKIA IN 2017
Goodwill 16. Impairment
Based on the current operational and reporting structure (refer to Note , Segment information), the Group allocated goodwill to the operating segments within Nokia’s Networks business and to the Digital Health cash generating unit within Nokia Technologies corresponding to groups of cash generating units and cash generating unit (“CGU”), respectively.
Allocation of goodwill The following table presents the allocation of goodwill to groups of CGUs and the CGU as of the annual impairment testing date October :
EURm 2017 2016
Mobile Networks(1) 2 298 950 Fixed Networks 896 812 Global Services(1) – 1 288 IP/Optical Networks 1 970 1 847 Nokia Software 240 405 Digital Health (Nokia Technologies) 141 –
(1) In 2017, the Group’s former Mobile Networks operating segment was separated into two distinct operating segments: Mobile Networks and Global Services (refer to Note 4., Segment Information). The affected goodwill was allocated based on the relative fair value of the Group’s Mobile Networks and Global Services operating segments.
Recoverable amounts The recoverable amounts of the groups of CGUs and the CGU were based on fair value less costs of disposal that was determined using a level fair value measurement based on a discounted cash flow calculation. The cash flow projections used in calculating the recoverable amounts were based on financial plans approved by management covering an explicit forecast period of three years.
Seven additional years of cash flow projections subsequent to the explicit forecast period reflect a gradual progression towards the steady state cash flow projections modeled in the terminal year. The terminal growth rate assumptions reflect long-term average growth rates for the industries and economies in which the groups of CGUs and the CGU operate. The discount rates reflect current assessments of the time value of money and relevant market risk premiums reflecting risks and uncertainties for which the future cash flow estimates have not been adjusted. Other key variables in future cash flow projections include assumptions on estimated sales growth, gross margin and operating margin. All cash flow projections are consistent with market participant assumptions.
The results of the impairment testing indicate adequate headroom for each group of CGUs. The key assumptions applied in the impairment testing analysis for the groups of CGUs and the CGU as of the annual impairment testing date October :
2017 2016 2017 2016
Key assumption % Terminal growth rate Post-tax discount rate
Mobile Networks 0.9 1.1 9.2 8.9 Fixed Networks 0.9 1.1 8.6 8.6 Global Services – 1.0 – 8.9 IP/Optical Networks 1.4 1.3 8.9 9.3 Nokia Software 1.8 1.7 9.0 8.2 Digital Health (Nokia Technologies) 2.1 – 12.7 – Impairment charges by asset category
EURm 2017 2016 2015
Goodwill – – 141 Other intangible assets 9 – 33 Property, plant and equipment – – 25 Available-for-sale investments 116 11 45 Total 244
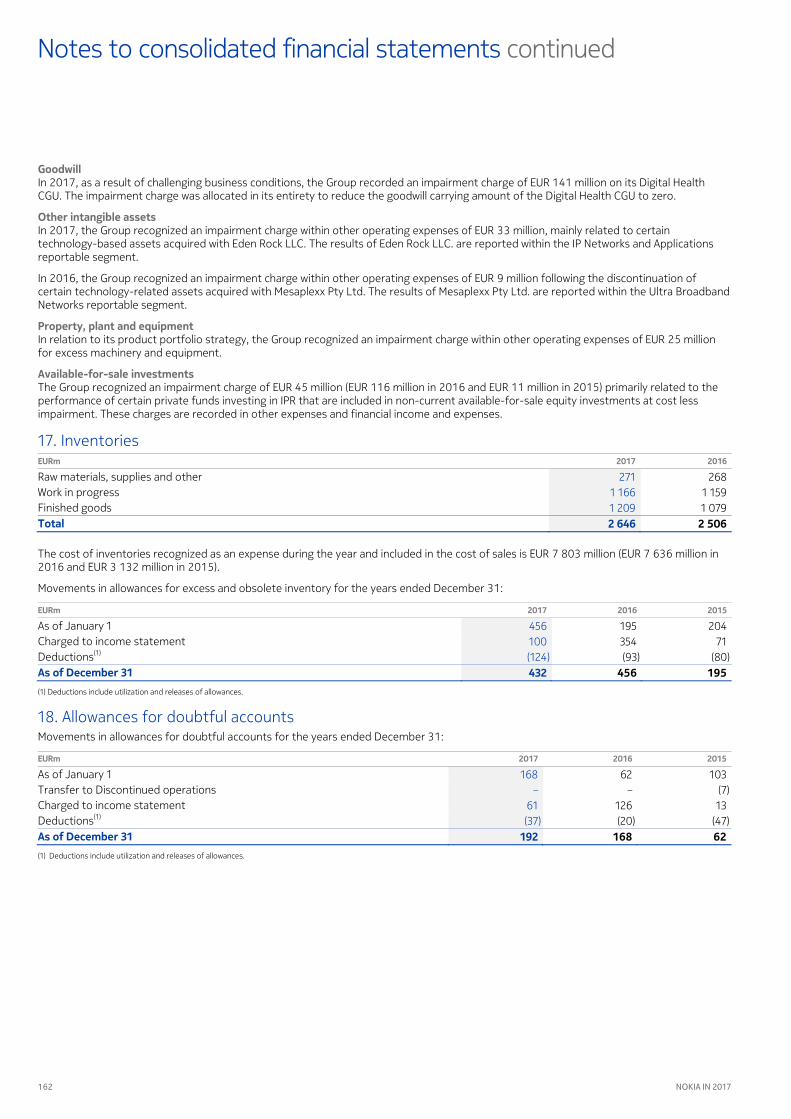
162 NOKIA IN 2017
continuedNotes to consolidated financial statements
Goodwill In , as a result of challenging business conditions, the Group recorded an impairment charge of EUR million on its Digital Health CGU. The impairment charge was allocated in its entirety to reduce the goodwill carrying amount of the Digital Health CGU to zero.
Other intangible assets In , the Group recognized an impairment charge within other operating expenses of EUR million, mainly related to certain technology-based assets acquired with Eden Rock LLC. The results of Eden Rock LLC. are reported within the IP Networks and Applications reportable segment.
In , the Group recognized an impairment charge within other operating expenses of EUR million following the discontinuation of certain technology-related assets acquired with Mesaplexx Pty Ltd. The results of Mesaplexx Pty Ltd. are reported within the Ultra Broadband Networks reportable segment.
Property, plant and equipment In relation to its product portfolio strategy, the Group recognized an impairment charge within other operating expenses of EUR million for excess machinery and equipment.
Available-for-sale investments The Group recognized an impairment charge of EUR million (EUR million in and EUR million in ) primarily related to the performance of certain private funds investing in IPR that are included in non-current available-for-sale equity investments at cost less impairment. These charges are recorded in other expenses and financial income and expenses.
EURm
17. Inventories 2017 2016
Raw materials, supplies and other 268 271 Work in progress 1 159 1 166 Finished goods 1 079 1 209 Total 2 646 2 506
The cost of inventories recognized as an expense during the year and included in the cost of sales is EUR million (EUR million in and EUR million in ).
Movements in allowances for excess and obsolete inventory for the years ended December :
EURm 2017 2016 2015
As of January 1 195 204 456 Charged to income statement 354 71 100 Deductions(1) (93) (80) (124) As of December 31 432 456 195 (1) Deductions include utilization and releases of allowances.
Movements in allowances for doubtful accounts for the years ended December
18. Allowances for doubtful accounts :
EURm 2017 2016 2015
As of January 1 62 103 168 Transfer to Discontinued operations – (7) – Charged to income statement 126 13 61 Deductions(1) (20) (47) (37) As of December 31 192 168 62 (1) Deductions include utilization and releases of allowances.

163
Financial statements
NOKIA IN 2017
Non-current assets 19. Prepaid expenses and accrued income
EURm 2017 2016
R&D tax credits and other indirect tax receivables 254 174 Deposits – 77 Other 74 117 Total 368 328 Current assets
EURm 2017 2016
Social security, R&D tax credits, VAT and other indirect taxes 560 552 Deposits 118 28 Accrued revenue 101 232 Divestment-related receivables 90 79 Other 427 368 Total 1 259 1 296
Shares and share capital 20. Shares of the Parent Company
Nokia Corporation (“Parent Company”) has one class of shares. Each share entitles the holder to one vote at General Meetings. As of December , , the share capital of Nokia Corporation is EUR . and the total number of shares issued is . As of December , , the total number of shares includes shares owned by Group companies representing .% of share capital and total voting rights. Under the Nokia Articles of Association, Nokia Corporation does not have minimum or maximum share capital or share par value.
Authorizations Authorization to issue shares and special rights entitling to shares At the Extraordinary General Meeting held on December , , the shareholders authorized the Board of Directors to issue, in deviation from the shareholders’ pre-emptive right, a maximum of million shares through one or more share issues. The authorization includes the right for the Board of Directors to resolve on all the terms and conditions of such share issuances. The authorization may be used to issue Parent Company shares to the holders of Alcatel Lucent shares, American Depositary Shares and convertible bonds as well as to beneficiaries of Alcatel Lucent employee equity compensation arrangements for the purpose of implementing the transaction with Alcatel Lucent, including the consummation of the public exchange offers made to Alcatel Lucent shareholders as well as other transactions contemplated by the memorandum of understanding between the Group and Alcatel Lucent, and/or otherwise to effect the combination. The authorization is effective until December , .
At the Annual General Meeting held on June , , the shareholders authorized the Board of Directors to issue a maximum of million shares through one or more issues of shares or special rights entitling to shares. The Board of Directors was authorized to issue either new shares or shares held by the Parent Company. The authorization included the right for the Board of Directors to resolve on all the terms and conditions of such share and special rights issuances, including issuance in deviation from the shareholders’ pre-emptive rights. The authorization may be used to develop the Parent Company’s capital structure, diversify the shareholder base, finance or carry out acquisitions or other arrangements, settle the Parent Company’s equity-based incentive plans, or for other purposes resolved by the Board of Directors. The authorization that would have been effective until December , was terminated by a resolution of Annual General Meeting on May , .
At the Annual General Meeting held on May , , the shareholders authorized the Board of Directors to issue a maximum of million shares through one or more issues of shares or special rights entitling to shares. The Board of Directors is authorized to issue either new shares or shares held by the Parent Company. The authorization included the right for the Board of Directors to resolve on all the terms and conditions of such share and special rights issuances, including issuance in deviation from the shareholders’ pre-emptive rights. The authorization may be used to develop the Parent Company’s capital structure, diversify the shareholder base, finance or carry out acquisitions or other arrangements, settle the Parent Company’s equity-based incentive plans, or for other purposes resolved by the Board of Directors. The authorization is effective until November , .
In , under the authorization held by the Board of Directors, the Parent Company issued new shares following the holders of stock options issued in , and exercising their option rights.
In , the Parent Company issued new shares without consideration to the Parent Company to fulfil the company’s obligation under the Nokia Equity Programs.

164 NOKIA IN 2017
continuedNotes to consolidated financial statements
In , under the authorization held by the Board of Directors, the Parent Company issued treasury shares to employees, including certain members of the Group Leadership Team, as settlement under equity-based incentive plans and the employee share purchase plan. The shares were issued without consideration and in accordance with the plan rules.
As of December , , the Board of Directors had no other authorizations to issue shares, convertible bonds, warrants or stock options.
Other authorizations At the Annual General Meeting held on June , , the shareholders authorized the Board of Directors to repurchase a maximum of million shares. The amount corresponded to less than % of the total number of Parent Company’s shares. The shares may be repurchased in order to optimize the capital structure of the Parent Company. In addition, the shares may be repurchased in order to finance or carry out acquisitions or other arrangements, to settle the Parent Company’s equity-based incentive plans or to be transferred for other purposes. The authorization that would have been effective until December , was terminated by a resolution of the Annual General Meeting on May , .
At the Annual General Meeting held on May , , the shareholders authorized the Board of Directors to repurchase a maximum of million shares. The amount corresponds to less than % of the total number of Parent Company’s shares. The shares may be repurchased in order to optimize the capital structure of the Company. In addition, shares may be repurchased in order to meet obligations arising from debt financial instruments that are exchangeable into equity instruments, to settle equity-based incentive plans for employees of the Group or of its associated companies, or to be transferred for other purposes such as financing or carrying out acquisitions. The authorization is effective until November , .
Under the authorization held by the Board of Directors and in line with the capital structure optimization program, the Parent Company repurchased shares in representing approximately .% of share capital and total voting rights as of December , . In , the Parent Company had repurchased shares. The price paid for the shares was based on the current market price of the Nokia share on the securities market at the time of the repurchase. On February , the Parent Company announced that the Board of Directors had decided to cancel treasury shares repurchased under the capital structure optimization program. The cancellation of the shares does not have an impact on the Parent Company’s share capital.
EURm
21. Fair value and other reserves
Translation differences
Pension remeasurements
Hedging reserve
Available-for-sale investments
As of January 1, 2015 1 099 () 2 284 Foreign exchange translation differences 672 – – – Net investment hedging losses (207) – – – Remeasurements of defined benefit plans – 84 – – Net fair value (losses)/gains – – (53) 225 Transfer to income statement (1 268) – 49 (131) Disposal of businesses – 8 – – Movement attributable to non-controlling interests (4) – – – As of December 31, 2015 292 () () 378 Foreign exchange translation differences 265 – – – Net investment hedging losses (83) – – – Remeasurements of defined benefit plans – 343 – – Net fair value losses – – (13) (10) Transfer to income statement (14) – 25 (63) Acquisition on non-controlling interest (15) (2) – – Movement attributable to non-controlling interests 38 4 – – As of December 31, 2016 483 173 10 305 Foreign exchange translation differences (1 830) – – – Net investment hedging gains 352 – – Remeasurements of defined benefit plans
– – 662 –
Net fair value gains –
– – 103 Transfer to income statement
18 12 – (75)
Other increase/(decrease) (104)
1 3 (1) Movement attributable to non-controlling interests
– 50 – –
As of December 31, 2017 –
() 838 37 219
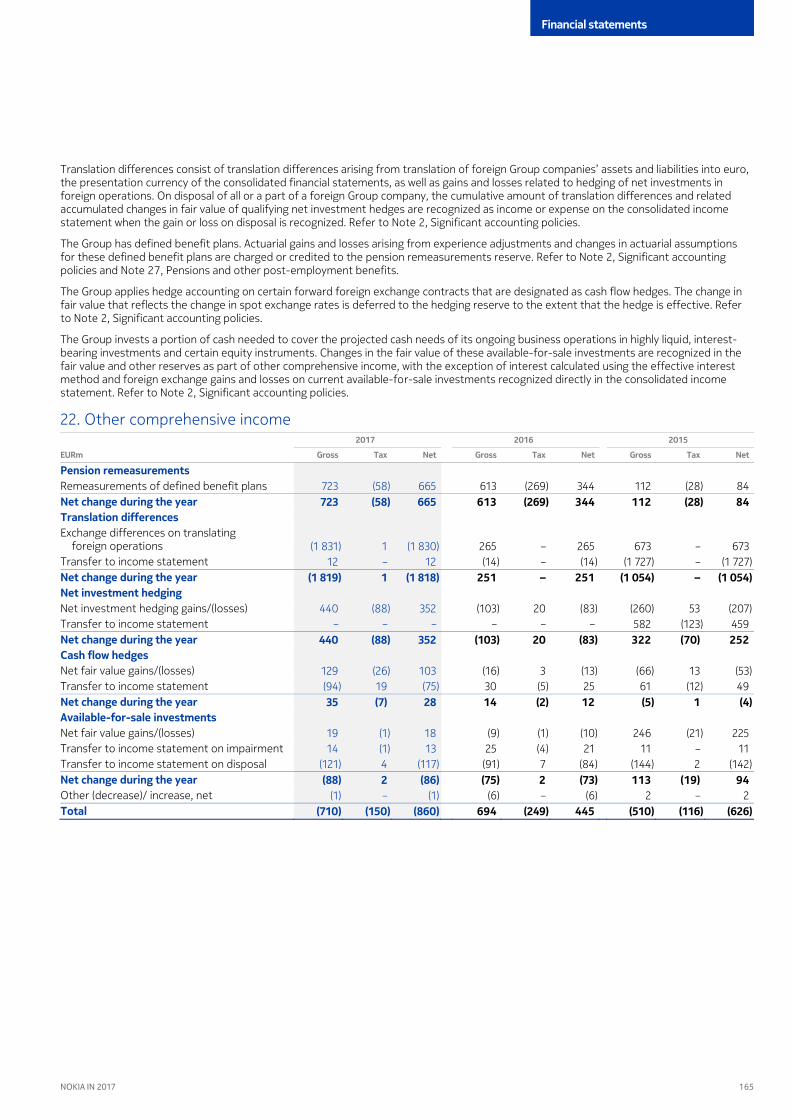
165
Financial statements
NOKIA IN 2017
Translation differences consist of translation differences arising from translation of foreign Group companies’ assets and liabilities into euro, the presentation currency of the consolidated financial statements, as well as gains and losses related to hedging of net investments in foreign operations. On disposal of all or a part of a foreign Group company, the cumulative amount of translation differences and related accumulated changes in fair value of qualifying net investment hedges are recognized as income or expense on the consolidated income statement when the gain or loss on disposal is recognized. Refer to Note , Significant accounting policies.
The Group has defined benefit plans. Actuarial gains and losses arising from experience adjustments and changes in actuarial assumptions for these defined benefit plans are charged or credited to the pension remeasurements reserve. Refer to Note , Significant accounting policies and Note , Pensions and other post-employment benefits.
The Group applies hedge accounting on certain forward foreign exchange contracts that are designated as cash flow hedges. The change in fair value that reflects the change in spot exchange rates is deferred to the hedging reserve to the extent that the hedge is effective. Refer to Note , Significant accounting policies.
The Group invests a portion of cash needed to cover the projected cash needs of its ongoing business operations in highly liquid, interest-bearing investments and certain equity instruments. Changes in the fair value of these available-for-sale investments are recognized in the fair value and other reserves as part of other comprehensive income, with the exception of interest calculated using the effective interest method and foreign exchange gains and losses on current available-for-sale investments recognized directly in the consolidated income statement. Refer to Note , Significant accounting policies.
22. Other comprehensive income 2017 2016 2015
EURm Gross Tax Net Gross Tax Net Gross Tax Net
Pension remeasurements Remeasurements of defined benefit plans 723 (58) 613 (269) 344 112 (28) 84 665 Net change during the year 723 () 665 613 () 344 112 () 84 Translation differences Exchange differences on translating
foreign operations (1 831) 1 265 – 265 673 – 673 (1 830) Transfer to income statement 12 – (14) – (14) (1 727) – (1 727) 12 Net change during the year ( ) 1 ( ) 251 – 251 ( ) – ( ) Net investment hedging Net investment hedging gains/(losses) 440 (88) (103) 20 (83) (260) 53 (207) 352 Transfer to income statement – – – – – 582 (123) 459 – Net change during the year 440 () 352 () 20 () 322 (70) 252 Cash flow hedges Net fair value gains/(losses) 129 (26) (16) 3 (13) (66) 13 (53) 103 Transfer to income statement (94) 19 30 (5) 25 61 (12) 49 (75) Net change during the year 35 (7) 28 14 () 12 () 1 () Available-for-sale investments Net fair value gains/(losses) 19 (1) (9) (1) (10) 246 (21) 225 18 Transfer to income statement on impairment 14 (1) 25 (4) 21 11 – 11 13 Transfer to income statement on disposal (121) 4 (91) 7 (84) (144) 2 (142) (117) Net change during the year () 2 () () 2 () 113 (19) 94 Other (decrease)/ increase, net (1) – (6) – (6) 2 – 2 (1) Total () () () 694 () 445 () () ()

166 NOKIA IN 2017
continuedNotes to consolidated financial statements
Carrying amount EURm
23. Interest-bearing liabilities
Issuer/borrower Instrument Currency Nominal (million) Final maturity 2017 2016
Nokia Corporation 6.75% Senior Notes(1) EUR 231 February 2019 527 241 Nokia Corporation 5.375% Senior Notes(2) USD 581 May 2019 961 487 Nokia Corporation 1.00% Senior Notes(1) EUR 500 March 2021 – 498 Nokia Corporation 3.375% Senior Notes(2) USD 500 June 2022 – 406 Nokia Corporation 2.00% Senior Notes(1) EUR 750 March 2024 – 744 Nokia Corporation 4.375% Senior Notes(2) USD 500 June 2027 – 404 Nokia of America
Corporation 6.5% Senior Notes(1)(2) USD 74 January 2028 287 62 Nokia of America
Corporation 6.45% Senior Notes(1)(2) USD 206 March 2029 1 306 174 Nokia Corporation 6.625% Senior Notes USD 500 May 2039 482 424 Nokia Corporation Revolving Credit Facility EUR 1 579 June 2020 – – Nokia Corporation and
various subsidiaries Other liabilities(3) 464 326 Total 4 027 3 766 (1) In March 2017, the Group issued EUR 500 million 1.00% Senior Notes due 2021 and EUR 750 million 2.00% Senior Notes due 2024 under the 5 billion Euro Medium-Term Note Programme. The proceeds
of the new notes were used to redeem (nominal amounts) EUR 269 million of the 2019 Euro Notes, USD 86 million of the 2028 USD Notes and USD 401 million of the 2029 USD Notes and for general corporate purposes.
(2) In June 2017, the Group issued USD 500 million 3.375% Senior Notes due 2022 and USD 500 million 4.375% Senior Notes due 2027 under U.S. Securities Act of 1933, as amended. The proceeds of the new notes were used to redeem (nominal amounts) USD 419 million of the 2019 USD Notes, USD 140 million of the 2028 USD Notes and USD 753 million of the 2029 USD Notes and for general corporate purposes.
(3) Includes liabilities related to the French research and development tax credits (Crédits d’Impôt Recherche) of EUR 62 million (EUR 132 million in 2016) that have been sold to banks on a recourse basis and hence remain on the consolidated statement of financial position.
All borrowings presented above are senior unsecured and have no financial covenants.
Changes in interest-bearing liabilities arising from financing activities:
Long-term interest-
bearing liabilities Short-term interest-
bearing liabilities
Derivatives held to hedge long-term
borrowings Total
As of January 1, 2017 3 657 370 () 3 997 Cash flows 132 (40) (49) 43 Non-cash changes:
Acquisitions
– 4 – Translation differences
4 (291) (12) 199
Changes in fair value (104)
(46) – 15 Other
(31) 5 (13) –
As of December 31, 2017 (8)
3 457 309 135 3 901
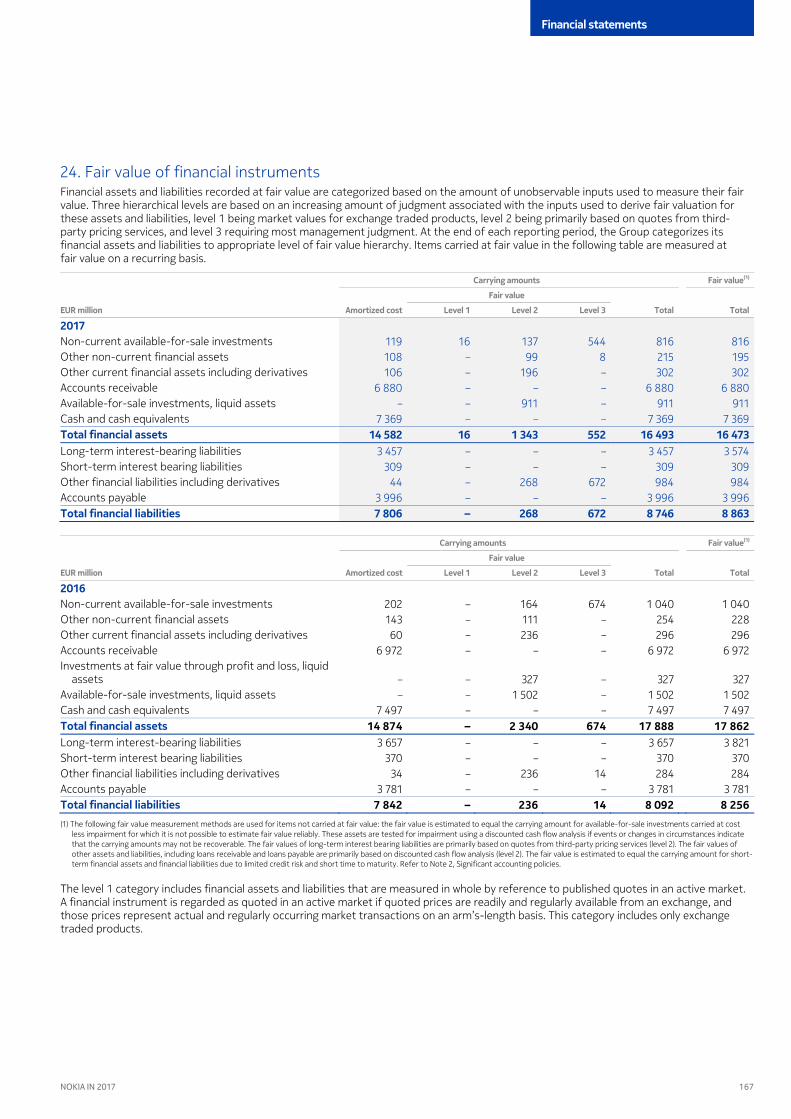
167
Financial statements
NOKIA IN 2017
Financial assets and liabilities recorded at fair value are catego
24. Fair value of financial instruments rized based on the amount of unobservable inputs used to measure their fair
value. Three hierarchical levels are based on an increasing amount of judgment associated with the inputs used to derive fair valuation for these assets and liabilities, level being market values for exchange traded products, level being primarily based on quotes from third-party pricing services, and level requiring most management judgment. At the end of each reporting period, the Group categorizes its financial assets and liabilities to appropriate level of fair value hierarchy. Items carried at fair value in the following table are measured at fair value on a recurring basis.
Carrying amounts Fair value(1)
Fair value
EUR million Amortized cost Level 1 Level 2 Level 3 Total Total
2017 Non-current available-for-sale investments 119 16 137 544 816 Other non-current financial assets
816 108 – 99 8 215
Other current financial asse 195
ts including derivatives 106 – 196 – 302 Accounts receivable
302 6 880 – – – 6 880
Available-for-sale investments, liquid assets 6 880
– – 911 – 911 Cash and cash equivalents
911 7 369 – – – 7 369
Total financial assets 7 369
14 582 16 1 343 552 16 493 16 473 Long-term interest-bearing liabilities 3 457 – – – 3 457 3 574 Short-term interest bearing liabilities 309 – – – 309 Other financial liabilities including derivatives
309 44 – 268 672 984
Accounts payable 984
3 996 – – – 3 996 Total financial liabilities
3 996 7 806 – 268 672 8 746 8 863
Carrying amounts Fair value(1)
Fair value
EUR million Amortized cost Level 1 Level 2 Level 3 Total Total
2016 Non-current available-for-sale investments 202 – 164 674 1 040 1 040 Other non-current financial assets 143 – 111 – 254 228 Other current financial assets including derivatives 60 – 236 – 296 296 Accounts receivable 6 972 – – – 6 972 6 972 Investments at fair value through profit and loss, liquid
assets – – 327 – 327 327 Available-for-sale investments, liquid assets – – 1 502 – 1 502 1 502 Cash and cash equivalents 7 497 – – – 7 497 7 497 Total financial assets 14 874 – 2 340 674 17 888 17 862 Long-term interest-bearing liabilities 3 657 – – – 3 657 3 821 Short-term interest bearing liabilities 370 – – – 370 370 Other financial liabilities including derivatives 34 – 236 14 284 284 Accounts payable 3 781 – – – 3 781 3 781 Total financial liabilities 7 842 – 236 14 8 092 8 256 (1) The following fair value measurement methods are used for items not carried at fair value: the fair value is estimated to equal the carrying amount for available-for-sale investments carried at cost
less impairment for which it is not possible to estimate fair value reliably. These assets are tested for impairment using a discounted cash flow analysis if events or changes in circumstances indicate that the carrying amounts may not be recoverable. The fair values of long-term interest bearing liabilities are primarily based on quotes from third-party pricing services (level 2). The fair values of other assets and liabilities, including loans receivable and loans payable are primarily based on discounted cash flow analysis (level 2). The fair value is estimated to equal the carrying amount for short-term financial assets and financial liabilities due to limited credit risk and short time to maturity. Refer to Note 2, Significant accounting policies.
The level category includes financial assets and liabilities that are measured in whole by reference to published quotes in an active market. A financial instrument is regarded as quoted in an active market if quoted prices are readily and regularly available from an exchange, and those prices represent actual and regularly occurring market transactions on an arm’s-length basis. This category includes only exchange traded products.
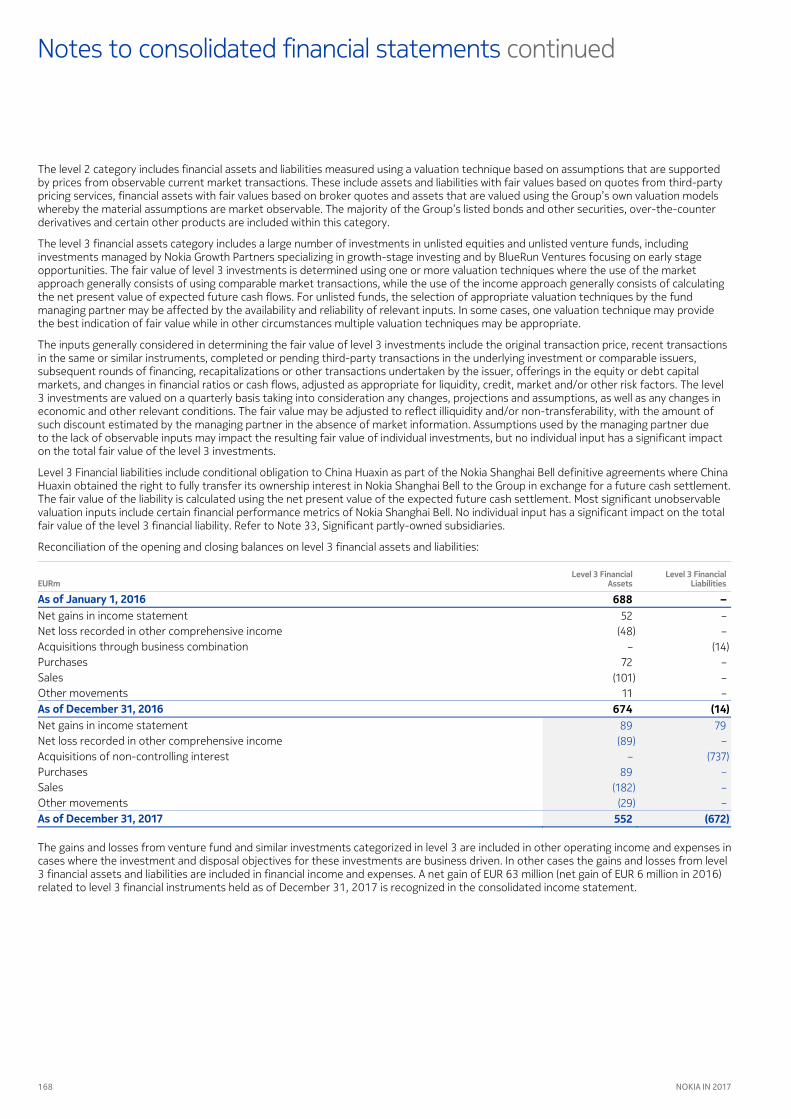
168 NOKIA IN 2017
continuedNotes to consolidated financial statements
The level category includes financial assets and liabilities measured using a valuation technique based on assumptions that are supported by prices from observable current market transactions. These include assets and liabilities with fair values based on quotes from third-party pricing services, financial assets with fair values based on broker quotes and assets that are valued using the Group’s own valuation models whereby the material assumptions are market observable. The majority of the Group’s listed bonds and other securities, over-the-counter derivatives and certain other products are included within this category.
The level financial assets category includes a large number of investments in unlisted equities and unlisted venture funds, including investments managed by Nokia Growth Partners specializing in growth-stage investing and by BlueRun Ventures focusing on early stage opportunities. The fair value of level investments is determined using one or more valuation techniques where the use of the market approach generally consists of using comparable market transactions, while the use of the income approach generally consists of calculating the net present value of expected future cash flows. For unlisted funds, the selection of appropriate valuation techniques by the fund managing partner may be affected by the availability and reliability of relevant inputs. In some cases, one valuation technique may provide the best indication of fair value while in other circumstances multiple valuation techniques may be appropriate.
The inputs generally considered in determining the fair value of level investments include the original transaction price, recent transactions in the same or similar instruments, completed or pending third-party transactions in the underlying investment or comparable issuers, subsequent rounds of financing, recapitalizations or other transactions undertaken by the issuer, offerings in the equity or debt capital markets, and changes in financial ratios or cash flows, adjusted as appropriate for liquidity, credit, market and/or other risk factors. The level investments are valued on a quarterly basis taking into consideration any changes, projections and assumptions, as well as any changes in economic and other relevant conditions. The fair value may be adjusted to reflect illiquidity and/or non-transferability, with the amount of such discount estimated by the managing partner in the absence of market information. Assumptions used by the managing partner due to the lack of observable inputs may impact the resulting fair value of individual investments, but no individual input has a significant impact on the total fair value of the level investments.
Level Financial liabilities include conditional obligation to China Huaxin as part of the Nokia Shanghai Bell definitive agreements where China Huaxin obtained the right to fully transfer its ownership interest in Nokia Shanghai Bell to the Group in exchange for a future cash settlement. The fair value of the liability is calculated using the net present value of the expected future cash settlement. Most significant unobservable valuation inputs include certain financial performance metrics of Nokia Shanghai Bell. No individual input has a significant impact on the total fair value of the level financial liability. Refer to Note , Significant partly-owned subsidiaries.
Reconciliation of the opening and closing balances on level financial assets and liabilities:
EURm Level 3 Financial
Assets Level 3 Financial
Liabilities
As of January 1, 2016 688 – Net gains in income statement 52 – Net loss recorded in other comprehensive income (48) – Acquisitions through business combination – (14) Purchases 72 – Sales (101) – Other movements 11 – As of December 31, 2016 674 () Net gains in income statement 89 79 Net loss recorded in other comprehensive income (89) Acquisitions of non-controlling interest
– –
Purchases (737)
89 Sales
– (182)
Other movements –
(29) As of December 31, 2017
– 552 ()
The gains and losses from venture fund and similar investments categorized in level are included in other operating income and expenses in cases where the investment and disposal objectives for these investments are business driven. In other cases the gains and losses from level financial assets and liabilities are included in financial income and expenses. A net gain of EUR million (net gain of EUR million in ) related to level financial instruments held as of December , is recognized in the consolidated income statement.

169
Financial statements
NOKIA IN 2017
Assets Liabilities
25. Derivative financial instruments
EURm Fair value(1) Notional(2) Fair value(1) Notional(2)
2017 Hedges on net investment in foreign subsidiaries Forward foreign exchange contracts
38 3 491 (2)
Cash flow hedges 773
Forward foreign exchange contracts
56 1 305 (6)
Fair value hedges 465
Forward foreign exchange contracts
1 165 (1)
Firm commitments 79
17 133 (24) Cash flow and fair value hedges
229 (3)
Cross-currency interest rate swaps
– – (141) Derivatives not designated in hedge accounting relationships
1 512
carried at fair value through profit and loss Forward foreign exchange contracts
73 5 858 (88)
Currency options bought 7 002
12 664 – Currency options sold
– – – (4)
Interest rate swaps 163
– – – Other derivatives
– – – (2)
Total 100
197 11 616 () 10 323 2016 Hedges on net investment in foreign subsidiaries Forward foreign exchange contracts 20 1 829 (1) 255 Cash flow hedges Forward foreign exchange contracts 12 382 (9) 185 Fair value hedges Interest rate swaps 42 300 – – Forward foreign exchange contracts 21 350 (51) 689 Firm commitments 34 633 (6) 311 Cash flow and fair value hedges(3) Cross-currency interest rate swaps 42 1 002 – – Derivatives not designated in hedge accounting relationships
carried at fair value through profit and loss Forward foreign exchange contracts 61 3 777 (135) 7 526 Currency options bought 3 569 – – Interest rate swaps – – (29) 329 Other derivatives – – (5) 157 Total 235 8 842 () 9 452 (1) Included in other financial assets and other financial liabilities in the consolidated statement of financial position. (2) Includes the gross amount of all notional values for contracts that have not yet been settled or cancelled. The amount of notional value outstanding is not necessarily a measure or indication of
market risk as the exposure of certain contracts may be offset by that of other contracts. (3) Cross-currency interest rate swaps have been designated partly as fair value hedges and partly as cash flow hedges.
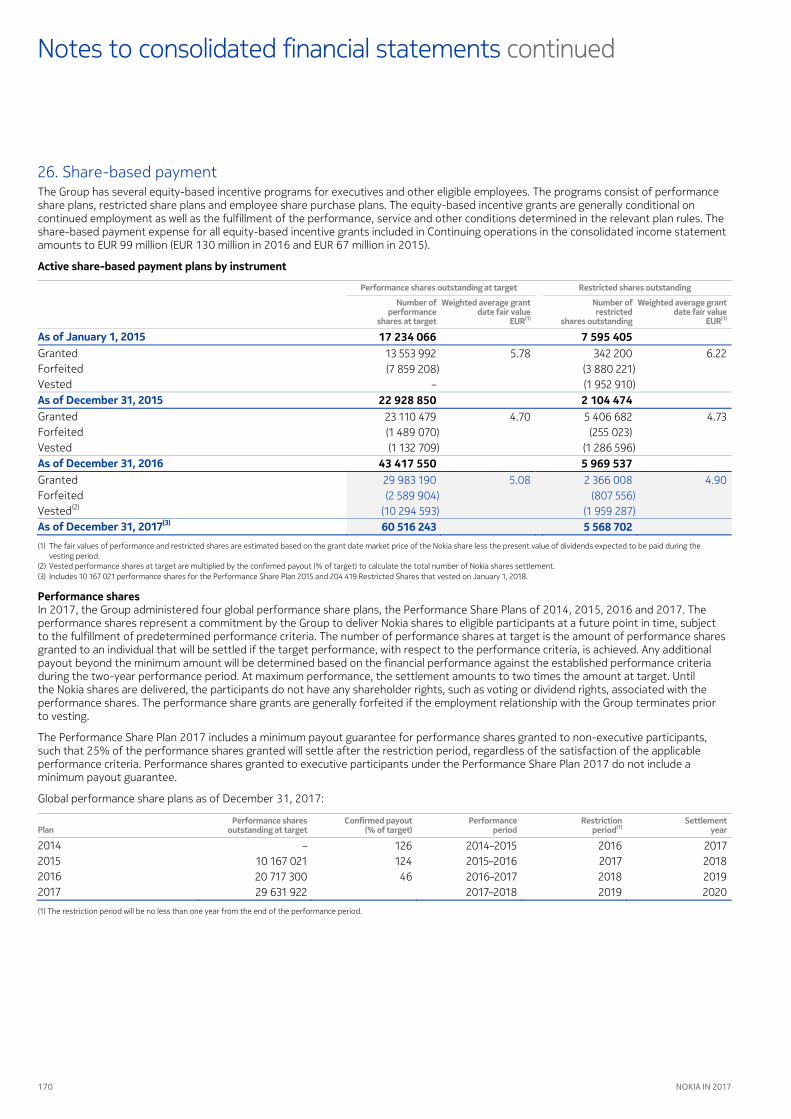
170 NOKIA IN 2017
continuedNotes to consolidated financial statements
The Group has several equity-based incentive programs for executives and other eligible employees. The programs consist of perf
26. Share-based payment ormance
share plans, restricted share plans and employee share purchase plans. The equity-based incentive grants are generally conditional on continued employment as well as the fulfillment of the performance, service and other conditions determined in the relevant plan rules. The share-based payment expense for all equity-based incentive grants included in Continuing operations in the consolidated income statement amounts to EUR million (EUR million in and EUR million in ).
Active share-based payment plans by instrument
Performance shares outstanding at target Restricted shares outstanding
Number of performance
shares at target
Weighted average grant date fair value
EUR(1)
Number of restricted
shares outstanding
Weighted average grant date fair value
EUR(1)
As of January 1, 2015 17 234 066 7 595 405 Granted 13 553 992 5.78 342 200 6.22 Forfeited (7 859 208) (3 880 221) Vested – (1 952 910) As of December 31, 2015 22 928 850 2 104 474 Granted 23 110 479 4.70 5 406 682 4.73 Forfeited (1 489 070) (255 023) Vested (1 132 709) (1 286 596) As of December 31, 2016 43 417 550 5 969 537 Granted 29 983 190 5.08 2 366 008 4.90 Forfeited (2 589 904) (807 556) Vested
(2) (10 294 593) (1 959 287)
As of December 31, 2017
(3) 60 516 243 5 568 702 (1) The fair values of performance and restricted shares are estimated based on the grant date market price of the Nokia share less the present value of dividends expected to be paid during the
vesting period. (2) Vested performance shares at target are multiplied by the confirmed payout (% of target) to calculate the total number of Nokia shares settlement. (3) Includes 10 167 021 performance shares for the Performance Share Plan 2015 and 204 419 Restricted Shares that vested on January 1, 2018.
Performance shares In , the Group administered four global performance share plans, the Performance Share Plans of , , and . The performance shares represent a commitment by the Group to deliver Nokia shares to eligible participants at a future point in time, subject to the fulfillment of predetermined performance criteria. The number of performance shares at target is the amount of performance shares granted to an individual that will be settled if the target performance, with respect to the performance criteria, is achieved. Any additional payout beyond the minimum amount will be determined based on the financial performance against the established performance criteria during the two-year performance period. At maximum performance, the settlement amounts to two times the amount at target. Until the Nokia shares are delivered, the participants do not have any shareholder rights, such as voting or dividend rights, associated with the performance shares. The performance share grants are generally forfeited if the employment relationship with the Group terminates prior to vesting.
The Performance Share Plan includes a minimum payout guarantee for performance shares granted to non-executive participants, such that % of the performance shares granted will settle after the restriction period, regardless of the satisfaction of the applicable performance criteria. Performance shares granted to executive participants under the Performance Share Plan do not include a minimum payout guarantee.
Global performance share plans as of December , :
Plan Performance shares
outstanding at target Confirmed payout
(% of target) Performance
period Restriction
period(1) Settlement
year
2014 – 126 2014–2015 2016 2017 2015 10 167 021 124 2015–2016 2017 2018 2016 20 717 300 46 2016–2017 2018 2019 2017 29 631 922 2017–2018 2019 2020
(1) The restriction period will be no less than one year from the end of the performance period.
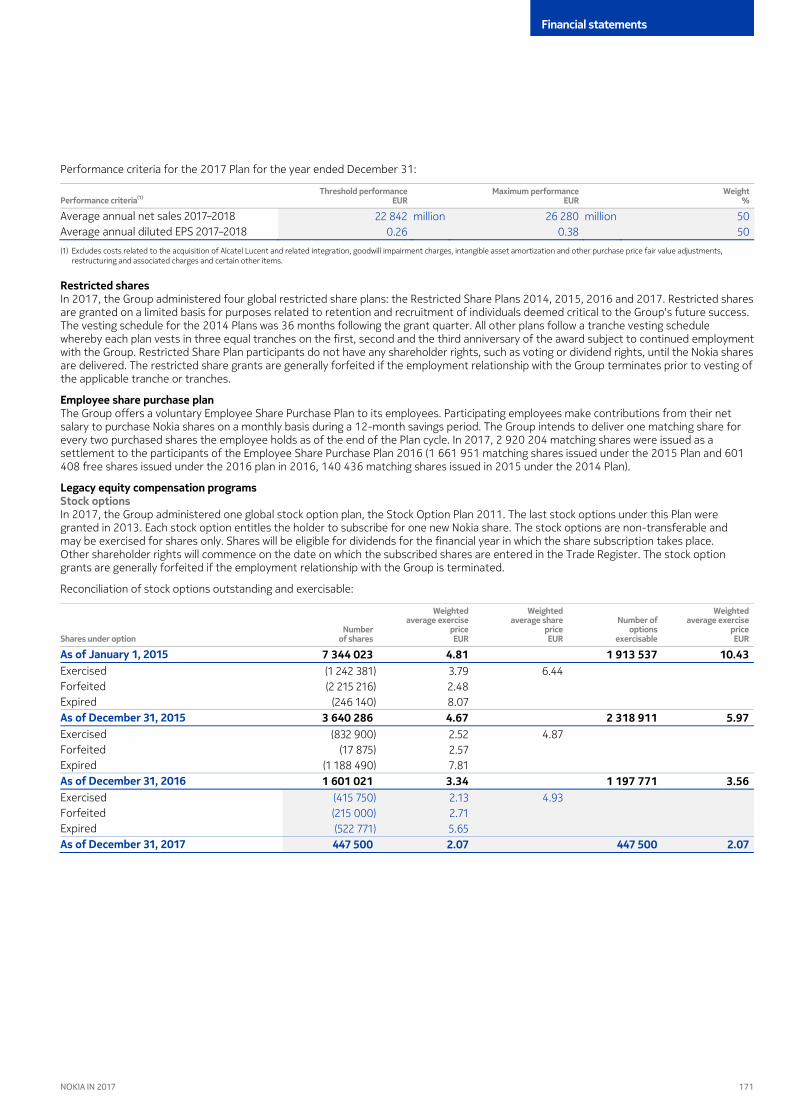
171
Financial statements
NOKIA IN 2017
Performance criteria for the Plan for the year ended December :
Performance criteria(1) Threshold performance
EUR Maximum performance
EUR Weight
%
Average annual net sales 2017–2018 22 842 million 26 280 million 50 Average annual diluted EPS 2017–2018 0.26 0.38
(1) Excludes costs related to the acquisition of Alcatel Lucent and related integration, goodwill impairment charges, intangibl
50
e asset amortization and other purchase price fair value adjustments, restructuring and associated charges and certain other items.
Restricted shares In , the Group administered four global restricted share plans: the Restricted Share Plans , , and . Restricted shares are granted on a limited basis for purposes related to retention and recruitment of individuals deemed critical to the Group's future success. The vesting schedule for the Plans was months following the grant quarter. All other plans follow a tranche vesting schedule whereby each plan vests in three equal tranches on the first, second and the third anniversary of the award subject to continued employment with the Group. Restricted Share Plan participants do not have any shareholder rights, such as voting or dividend rights, until the Nokia shares are delivered. The restricted share grants are generally forfeited if the employment relationship with the Group terminates prior to vesting of the applicable tranche or tranches.
Employee share purchase plan The Group offers a voluntary Employee Share Purchase Plan to its employees. Participating employees make contributions from their net salary to purchase Nokia shares on a monthly basis during a -month savings period. The Group intends to deliver one matching share for every two purchased shares the employee holds as of the end of the Plan cycle. In , matching shares were issued as a settlement to the participants of the Employee Share Purchase Plan ( matching shares issued under the Plan and free shares issued under the plan in , matching shares issued in under the Plan).
Legacy equity compensation programs Stock options In , the Group administered one global stock option plan, the Stock Option Plan . The last stock options under this Plan were granted in . Each stock option entitles the holder to subscribe for one new Nokia share. The stock options are non-transferable and may be exercised for shares only. Shares will be eligible for dividends for the financial year in which the share subscription takes place. Other shareholder rights will commence on the date on which the subscribed shares are entered in the Trade Register. The stock option grants are generally forfeited if the employment relationship with the Group is terminated.
Reconciliation of stock options outstanding and exercisable:
Shares under option Number
of shares
Weighted average exercise
price EUR
Weighted average share
price EUR
Number of options
exercisable
Weighted average exercise
price EUR
As of January 1, 2015 7 344 023 4.81 1 913 537 10.43 Exercised (1 242 381) 3.79 6.44 Forfeited (2 215 216) 2.48 Expired (246 140) 8.07 As of December 31, 2015 3 640 286 4.67 2 318 911 5.97 Exercised (832 900) 2.52 4.87 Forfeited (17 875) 2.57 Expired (1 188 490) 7.81 As of December 31, 2016 1 601 021 3.34 1 197 771 3.56 Exercised (415 750) 2.13 4.93 Forfeited (215 000) 2.71 Expired
(522 771) 5.65
As of December 31, 2017
447 500 2.07 447 500 2.07

172 NOKIA IN 2017
continuedNotes to consolidated financial statements
The Group maintains a number of post-employment plans in variou
27. Pensions and other post-employment benefits s countries including both defined contribution and defined benefit plans.
The Group’s defined benefit plans comprise significant pension schemes, as well as material other post employment benefit (“Opeb”) plans providing post-retirement healthcare and life insurance coverage to certain employee groups. Defined benefit plans expose the Group to actuarial risks such as investment risk, interest rate risk, and life expectancy risk. The characteristics and associated risks of the defined benefit plans vary depending on the legal, fiscal, and economic requirements in each country. These characteristics and risks are further described below and relate to the plans included as part of the Group’s Continuing operations.
The total net defined benefit liability is EUR million (EUR million in ) consisting of net pension and other post-employment benefit liabilities of EUR million (EUR million in ) and net pension and other post-employment benefit assets of EUR million (EUR million in ).
Defined benefit plans The Group’s most significant defined benefit pension plans are in the United States, Germany, and the United Kingdom. Together they account for % (% in ) of the Group’s total defined benefit obligation and % (% in ) of the Group’s total plan assets.
The defined benefit obligations, the fair value of plan assets, the effects of the asset ceiling and the net defined benefit balance as of December :
2017 2016
EURm
Defined benefit
obligation Fair value
of plan assets Effects of
asset ceiling
Net defined benefit balance
Defined benefit
obligation Fair value
of plan assets Effects of
asset ceiling
Net defined benefit balance
United States (19 614) 20 499 (453) (22 845) 22 880 (265) (230) 432 Germany (2 773) 1 203 – (2 680) 1 160 – (1 520) (1 570) United Kingdom (1 276) 1 552 – (1 265) 1 485 – 220 276 Other (1 834) 2 281 (46) (1 873) 2 245 (40) 332 401 Total ( ) 25 535 () () ( ) 27 770 () ( ) United States The Group has significant defined benefit pension plans and a significant post-retirement welfare benefit plan, providing post-retirement healthcare benefits and life insurance coverage, in the United States. The pension plans include both traditional service-based programs as well as cash-balance plans. The principal non-represented plan for salaried, non-union member employees was closed to new entrants after December , and fully frozen on December , . The Group, then Alcatel Lucent, adopted a new cash-balance program, a cash balance plan, for salaried, non-union member employees effective January , . The new program was extended to all United States-based salaried employees, except the employees of Nokia Technologies, effective January , . For active union-represented employees and for former employees who, when active, were represented by a union, the Group maintains two represented defined benefit plans, both of which are traditional service-based pension programs. The larger of the two, which represents % of the obligation, is a closed plan. Post-retirement welfare benefits are maintained for certain retired former employees. An agreement was made with the Communications Workers of America (“CWA”) and the International Brotherhood of Electrical Workers (“IBEW”) unions to continue to provide post-retirement healthcare benefits and life-insurance coverage for employees formerly represented by these two unions. The current union agreement expires on December , .
The defined benefit obligations, the fair value of plan assets, the effects of the asset ceiling and the net defined benefit balance for United States defined benefit plans as of December :
2017 2016
EURm
Defined benefit
obligationFair value
of plan assets Effects of
asset ceiling
Net defined
benefit balance
Defined benefit
obligation Fair value
of plan assets Effects of
asset ceiling
Net defined benefit balance
Pension benefits Management (13 750) 15 263 (2) (15 855) 16 861 (2) 1 004 1 511 Occupational (2 995) 4 704 (451) (3 528) 5 440 (263) 1 649 1 258 Supplemental (351) – – (401) – – (401) (351) Total ( ) 19 967 () 2 418 ( ) 22 301 () 2 252 Post-retirement benefits Health (non-union represented) (76) – – (126) – – (126) (76) Health (formerly union represented) (1 026) 264 – (1 343) 270 – (1 073) (762) Group life (non-union represented) (929) 186 – (1 040) 220 – (820) (743) Group life (formerly union represented) (486) 82 – (551) 89 – (462) (404) Other (1) – – (1) – – (1) (1) Total ( ) 532 – ( ) ( ) 579 – ( )
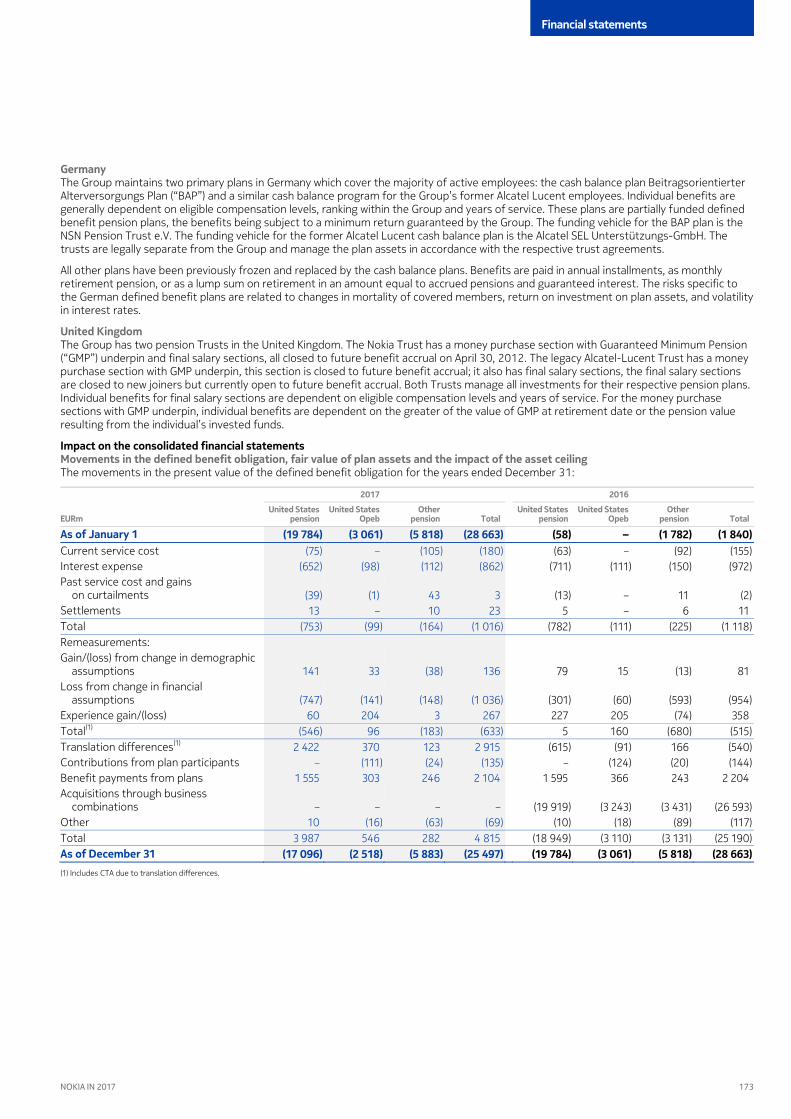
173
Financial statements
NOKIA IN 2017
Germany The Group maintains two primary plans in Germany which cover the majority of active employees: the cash balance plan Beitragsorientierter Alterversorgungs Plan (“BAP”) and a similar cash balance program for the Group’s former Alcatel Lucent employees. Individual benefits are generally dependent on eligible compensation levels, ranking within the Group and years of service. These plans are partially funded defined benefit pension plans, the benefits being subject to a minimum return guaranteed by the Group. The funding vehicle for the BAP plan is the NSN Pension Trust e.V. The funding vehicle for the former Alcatel Lucent cash balance plan is the Alcatel SEL Unterstützungs-GmbH. The trusts are legally separate from the Group and manage the plan assets in accordance with the respective trust agreements.
All other plans have been previously frozen and replaced by the cash balance plans. Benefits are paid in annual installments, as monthly retirement pension, or as a lump sum on retirement in an amount equal to accrued pensions and guaranteed interest. The risks specific to the German defined benefit plans are related to changes in mortality of covered members, return on investment on plan assets, and volatility in interest rates.
United Kingdom The Group has two pension Trusts in the United Kingdom. The Nokia Trust has a money purchase section with Guaranteed Minimum Pension (“GMP”) underpin and final salary sections, all closed to future benefit accrual on April , . The legacy Alcatel-Lucent Trust has a money purchase section with GMP underpin, this section is closed to future benefit accrual; it also has final salary sections, the final salary sections are closed to new joiners but currently open to future benefit accrual. Both Trusts manage all investments for their respective pension plans. Individual benefits for final salary sections are dependent on eligible compensation levels and years of service. For the money purchase sections with GMP underpin, individual benefits are dependent on the greater of the value of GMP at retirement date or the pension value resulting from the individual’s invested funds.
Impact on the consolidated financial statements Movements in the defined benefit obligation, fair value of plan assets and the impact of the asset ceiling The movements in the present value of the defined benefit obligation for the years ended December :
2017 2016
EURm United States
pension United States
Opeb Other
pension Total United States
pension United States
Opeb Other
pension Total
As of January 1 ( ) ( ) ( ) ( ) () – ( ) ( ) Current service cost (75) – (105) (63) – (92) (155) (180) Interest expense (652) (98) (112) (711) (111) (150) (972) (862) Past service cost and gains
on curtailments (39) (1) 43 (13) – 11 (2) 3 Settlements 13 – 10 5 – 6 11 23 Total (753) (99) (164) (782) (111) (225) (1 118) (1 016) Remeasurements: Gain/(loss) from change in demographic
assumptions 141 33 (38) 79 15 (13) 81 136 Loss from change in financial
assumptions (747) (141) (148) (301) (60) (593) (954) (1 036) Experience gain/(loss) 60 204 3 227 205 (74) 358 267 Total(1) (546) 96 (183) 5 160 (680) (515) (633) Translation differences(1) 2 422 370 123 (615) (91) 166 (540) 2 915 Contributions from plan participants – (111) (24) – (124) (20) (144) (135) Benefit payments from plans 1 555 303 246 1 595 366 243 2 204 2 104 Acquisitions through business
combinations – – – (19 919) (3 243) (3 431) (26 593) – Other 10 (16) (63) (10) (18) (89) (117) (69) Total 3 987 546 282 (18 949) (3 110) (3 131) (25 190) 4 815 As of December 31 ( ) ( ) ( ) ( ) ( ) ( ) ( ) ( ) (1) Includes CTA due to translation differences.

174 NOKIA IN 2017
continuedNotes to consolidated financial statements
The movements in the fair value of plan assets for the years ended December :
2017 2016
EURm United States
pension United States
Opeb Other
pension Total United States
pension United States
Opeb Other
pension Total
As of January 1 22 301 579 4 890 27 770 57 – 1 394 1 451 Interest income 738 16 101 774 18 135 927 855 Administrative expenses and interest
on asset ceiling (17) – (1) (19) – (1) (20) (18) Settlements (12) – (11) (5) – (6) (11) (23) Total 709 16 89 750 18 128 896 814 Remeasurements:
Return on plan assets, excluding amounts included in interest income 1 369 37 183 947 6 387 1 340 1 589
Total 1 369 37 183 947 6 387 1 340 1 589 Translation differences (2 725) (71) (111) 709 16 (207) 518 (2 907) Contributions:
Employers 28 3 129 32 10 74 116 160 Plan participants – 111 24 – 124 20 144 135
Benefit payments from plans (1 555) (303) (158) (1 595) (366) (164) (2 125) (2 016) Acquisitions through business combinations – – – 21 571 599 3 182 25 352 – Section 420 Transfer(1) (160) 160 – (172) 172 – – – Other – – (10) 2 – 76 78 (10) Total (4 412) (100) (126) 20 547 555 2 981 24 083 (4 638) As of December 31 19 967 532 5 036 25 535 22 301 579 4 890 27 770 (1) Section 420 Transfer. Refer to ‘Future Cash Flow’ section below.
The movements in the funded status for the years ended December :
2017 2016
EURm United States
pension United States
Opeb Other
pension Total United States
pension United States
Opeb Other
pension Total
As of January 1 2 517 ( ) () () () – () () Current service cost (75) – (105) (63) – (92) (155) (180) Interest income/(expense) 69 (82) (12) 44 (93) (16) (65) (25) Past service cost and gains on curtailments (39) (1) 43 (13) – 11 (2) 3 Settlements 1 – (1) – – – – – Total (44) (83) (75) (32) (93) (97) (222) (202) Remeasurements:
Return on plan assets, excluding amounts included in interest income 1 369 37 183 947 6 387 1 340 1 589
Gain/(loss) from change in demographic assumptions 141 33 (38) 79 15 (13) 81 136
Loss from change in financial assumptions (747) (141) (148) (301) (60) (593) (954) (1 036) Experience gain/(loss) 60 204 3 227 205 (74) 358 267
Total(1) 823 133 – 952 166 (293) 825 956 Translation differences(1) (303) 299 12 94 (75) (41) (22) 8 Employer contributions 28 3 129 32 10 74 116 160 Benefit payments from plans – – 88 – – 79 79 88 Acquisitions through business combinations – – – 1 652 (2 644) (249) (1 241) – Section 420 Transfer(2) (160) 160 – (172) 172 – – – Other 10 (16) (73) (8) (18) (13) (39) (79) Total (425) 446 156 1 598 (2 555) (150) (1 107) 177 As of December 31 2 871 ( ) () 38 2 517 ( ) () () (1) Includes CTA due to translation differences. (2) Section 420 Transfer. Refer to ‘Future Cash Flow’ section below.
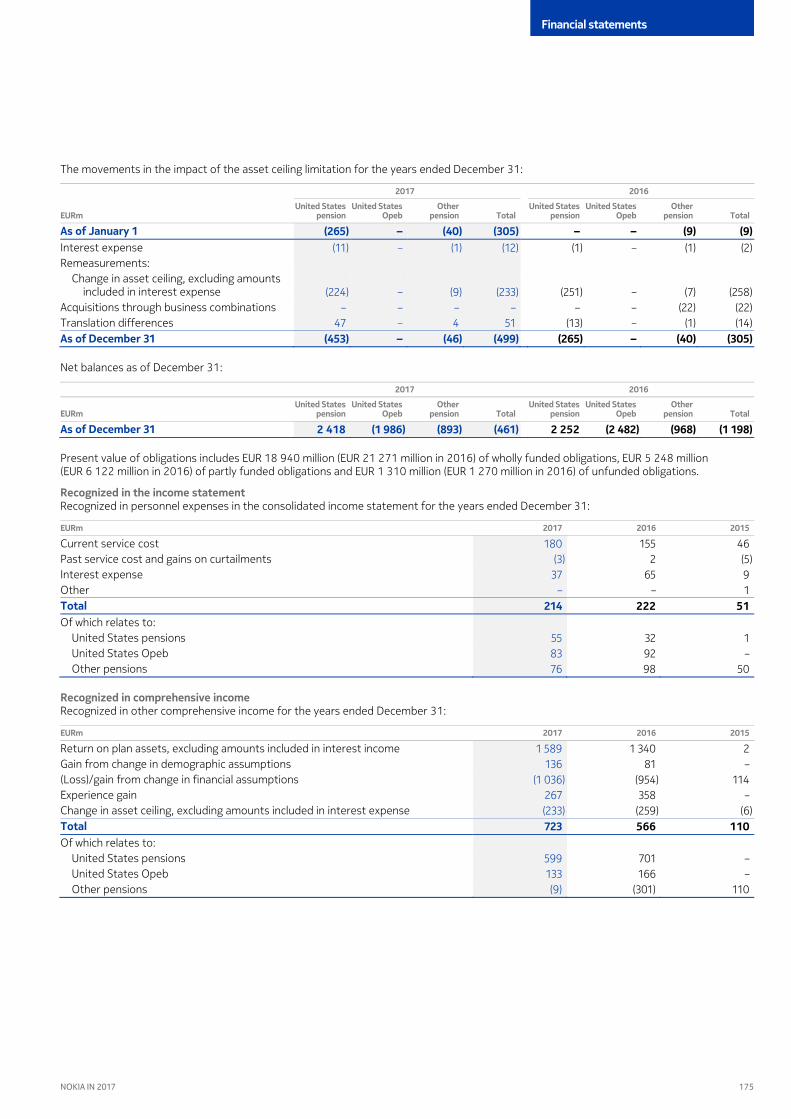
175
Financial statements
NOKIA IN 2017
The movements in the impact of the asset ceiling limitation for the years ended December :
2017 2016
EURm United States
pension United States
Opeb Other
pension Total United States
pension United States
Opeb Other
pension Total
As of January 1 (265) – () () – – () () Interest expense (11) – (1) (1) – (1) (2) (12) Remeasurements:
Change in asset ceiling, excluding amounts included in interest expense (224) – (9) (251) – (7) (258) (233)
Acquisitions through business combinations – – – – – (22) (22) – Translation differences 47 – 4 (13) – (1) (14) 51 As of December 31 () – () () () – () () Net balances as of December :
2017 2016
EURm United States
pension United States
Opeb Other
pension Total United States
pension United States
Opeb Other
pension Total
As of December 31 2 418 ( ) () () 2 252 ( ) () ( ) Present value of obligations includes EUR million (EUR million in ) of wholly funded obligations, EUR million (EUR million in ) of partly funded obligations and EUR million (EUR million in ) of unfunded obligations.
Recognized in the income statement Recognized in personnel expenses in the consolidated income statement for the years ended December :
EURm 2017 2016 2015
Current service cost 155 46 180 Past service cost and gains on curtailments 2 (5) (3) Interest expense 65 9 37 Other – 1 –Total 214 222 51 Of which relates to:
United States pensions 32 1 55 United States Opeb 92 – 83 Other pensions 98 50 76
Recognized in comprehensive income Recognized in other comprehensive income for the years ended December :
EURm 2017 2016 2015
Return on plan assets, excluding amounts included in interest income 1 340 2 1 589 Gain from change in demographic assumptions 81 – 136 (Loss)/gain from change in financial assumptions (954) 114 (1 036) Experience gain 358 – 267 Change in asset ceiling, excluding amounts included in interest expense (259) (6) (233) Total 723 566 110 Of which relates to:
United States pensions 701 – 599 United States Opeb 166 – 133 Other pensions (301) 110 (9)

176 NOKIA IN 2017
continuedNotes to consolidated financial statements
Actuarial assumptions and sensitivity analysis Actuarial assumptions Assumptions regarding future mortality are set based on actuarial advice in accordance with published statistics and experience in each country.
The discount rates and mortality tables used for the significant plans:
2017 2016 2017
Discount rate % Mortality table
United States 3.7 3.3
RP–2014 w/MP–2017 mortality projection
scale Germany 1.6 1.3 United Kingdom
Heubeck 2005G (1) 2.7 2.5
Total weighted average for all countries S2PA Light
3.3 2.9
(1) Tables are adjusted with 1.5% long-term rate of improvement.
The principal actuarial weighted average assumptions used for determining the defined benefit obligation:
% 2017 2016
Discount rate for determining present values 3.3 2.9 Annual rate of increase in future compensation levels 1.9 1.9 Pension growth rate 0.3 0.4 Inflation rate 2.0 2.1 Weighted average duration of defined benefit obligations 11 yrs 11 yrs United States defined benefit plans Actuarial assumptions used for determining the defined benefit obligation:
% 2017 2016
Benefit obligation, discount rate Pension 3.7 3.3 Post-retirement healthcare and other 3.4 3.1 Post–retirement group life 3.8 3.4 Annual rate of increase in future compensation levels 2.08 2.06 Assumed healthcare cost trend rates Healthcare costs trend rate assumed for next year 7.5 11.5 Healthcare cost trend rate assumed for next year (excluding post-retirement dental benefits) 7.7 11.8 Terminal growth rate 4.9 4.9 Year that the rate reaches the terminal growth value 2028 2028

177
Financial statements
NOKIA IN 2017
Sensitivity analysis The sensitivity of the defined benefit obligation to changes in the principal assumptions:
Change in assumption Increase in assumption(1)
EURm Decrease in assumption(1)
EURm
Discount rate for determining present values 1.0 % 2 441 (2 961) Annual rate of increase in future compensation levels 1.0 % (117) 103 Pension growth rate 1.0 % (557) 468 Inflation rate 1.0 % (533) 437 Healthcare cost trend rate 1.0 % (47) 43 Life expectancy 1 year (899) 846
(1) Positive movement indicates a reduction in the defined benefit obligation; a negative movement indicates an increase in the defined benefit obligation.
The above sensitivity analyses are based on a change in an assumption while holding all other assumptions constant and may not be representative of the actual impact of changes. If more than one assumption is changed simultaneously, the combined impact of changes would not necessarily be the same as the sum of the individual changes. If the assumptions change to a different level compared with that presented above, the effect on the defined benefit obligation may not be linear. The methods and types of assumptions used in preparing the sensitivity analyses are the same as in the previous period.
When calculating the sensitivity of the defined benefit obligation to significant actuarial assumptions, the present value of the defined benefit obligation is calculated with the projected unit credit method. Increases and decreases in the discount rate, rate of increase in future compensation levels, pension growth rate and inflation, which are used in determining the defined benefit obligation, do not have a symmetrical effect on the defined benefit obligation primarily due to the compound interest effect created when determining the net present value of the future benefit.
Investment strategies The overall investment objective of the Group is to preserve or enhance the pension plans’ funded status through the implementation of an investment strategy that maximizes return within the context of minimizing surplus risk. In formulating the asset allocation for the Plans, multiple factors are considered, including, but not limited to the long-term risk and return expectations for a variety of asset classes as well as current and multi-year projections of the pension plans’ demographics, benefit payments, contributions and funded status. Local trustee boards are responsible for conducting asset liability studies, when appropriate; overseeing the investment of plan assets; and monitoring and managing associated risks under company oversight and in accordance with local law. The results of the Asset-Liability framework are implemented on a plan level.
The Group’s investment managers may use derivative financial instruments including futures contracts, forward contracts, options and interest rate swaps to manage market risk. The performance and risk profile of investments is regularly monitored on a stand-alone basis as well as in the broader portfolio context. One risk is a decline in the plan’s funded status as a result of the adverse performance of plan assets and/or defined benefit obligations. The application of the Asset-Liability Model study focuses on minimizing such risks.
Disaggregation of plan assets
2017
2016
EURm Quoted Unquoted Total % Quoted Unquoted Total %
Equity securities 1 857 1 1 858 2 777 – 2 777 10 7 Debt securities 17 810 44 17 854 18 329 – 18 329 66 70 Insurance contracts – 1 013 1 013 – 833 833 3 4 Real estate – 1 350 1 350 – 1 389 1 389 5 5 Short-term
investments 709 14 723 1 110 – 1 110 4 3 Other – 2 737 2 737 – 3 332 3 332 12 11 Total 20 376 5 159 25 535 100 22 216 5 554 27 770 100 Most short-term investments including cash, equities and fixed-income securities have quoted market prices in active markets. Equity securities represent investments in equity funds and direct investments, which have quoted market prices in an active market. Debt securities represent investments in government and corporate bonds, as well as investments in bond funds, which have quoted market prices in an active market. Debt securities may also comprise investments in funds and direct investments. Insurance contracts are customary pension insurance contracts structured under domestic law in the respective countries. Real estate investments are investments in commercial properties or real estate funds which invest in a diverse range of real estate properties. Short-term investments are liquid assets or cash which are being held for a short period of time, with the primary purpose of controlling the tactical asset allocation. Other includes commodities as well as alternative investments, including derivative financial instruments.

178 NOKIA IN 2017
continuedNotes to consolidated financial statements
United States plan United States plan asset target and actual allocation range of the pension and post-retirement trust by asset category as of December , :
% Pension target
allocation rangePercentage of
plan assetsPost-retirement
target allocationPercentage of post-
employment plan assets
Equity securities 5–9 6 44 44 Fixed income securities 68–88 78 15 Real estate
15 4-8 6 –
Private equity and other –
6–13 10 – Cash
– – – 41
Total 41
100 100 100 The majority of the Group’s United States pension plan assets are held in a master pension trust. The post-retirement plan assets are held in two separate trusts in addition to the amount set aside in the master pension trust for retiree healthcare. The Pension & Benefits Investment Committee formally approves the target allocation ranges every few years on the completion of the Asset-Liability Model study by external advisors and internal investment management. The overall United States pension plan asset portfolio reflects a balance of investments split of approximately / between equity, including alternative investments for this purpose, and fixed income securities.
United States pension plan assets included EUR . million of Nokia ordinary shares and EUR . million of Nokia bonds as of December , (EUR million of Nokia bonds in ).
Asset ceiling limitation IAS, Employee benefits, limits the amount of pension fund surplus that an entity may recognize to the amount of economic benefit that the entity can realize, either through refunds, or as reductions in future contributions. The Group recognized an asset ceiling limitation in in the amount of EUR million, reducing the total gross asset value from EUR million to the recognized value of EUR million.
The most significant limitation of asset recognition for the Group is from the United States formerly represented pension plan. For the plans in the United States, the surplus is owned by the plan and therefore cannot be recognized by the Group as a recoverable pension asset. However, Section of the Internal Revenue code (“Section ”) allows for the transfer of pension assets in excess of specified thresholds (“excess pension assets”) over the plan’s funding obligation to be used to fund healthcare benefits and life insurance coverage (Opeb) of retired employees entitled to pension benefits under the plan. Section requires employers making such transfers to continue to provide healthcare benefits or life insurance coverage to those retirees for a certain period of time (“cost maintenance period”), at levels prescribed by regulations.
For retirees who were represented by the CWA and IBEW, the Group expects to fund the current retiree healthcare and group life insurance obligations with Section transfers from the United States formerly represented pension plan’s pension surplus. This is considered as a refund from the pension plan when setting the asset ceiling.
Annual valuation of funded status of the pension plans in the United States has established that the ability to utilize the Section transfer of excess assets is limited to the United States formerly represented pension plan. Based on a calculated valuation of related Opeb liabilities to which the asset transfer is applicable, EUR million asset may be recognized. This results in an asset ceiling limitation reducing the total funding surplus of this plan by EUR million from a funded status of EUR million to EUR million as of December , .
Significant events in 2017 Plan amendments United States Special Voluntary Termination Program (“SVTP”) benefits offered to certain eligible participants Effective January , , the Group amended the represented pension plan to reflect additional offers under the SVTP to provide for enhanced benefits to certain eligible employees. The SVTP benefits resulted in an expense of EUR million, recognized as past service costs in the consolidated income statement.
French AUXAD pension plan amendment AUXAD is a French supplemental pension plan for the portion of income that exceeds eight times the annual French social security pension limit, beyond which there is no legal or contractual pension scheme. In , the Group amended this plan to close the plan to future accruals from January , . This change resulted in a gain of EUR million, recognized as income related to past service in the consolidated income statement.
Curtailments In , the Group recognized curtailments in a number of countries following continued integration efforts to achieve cost savings. In France, restructuring activities resulted in a gain on curtailment of EUR million following the release of liabilities. In the United States, restructuring activities resulted in a loss on curtailment of EUR million driven by severance-related pension benefit enhancement.
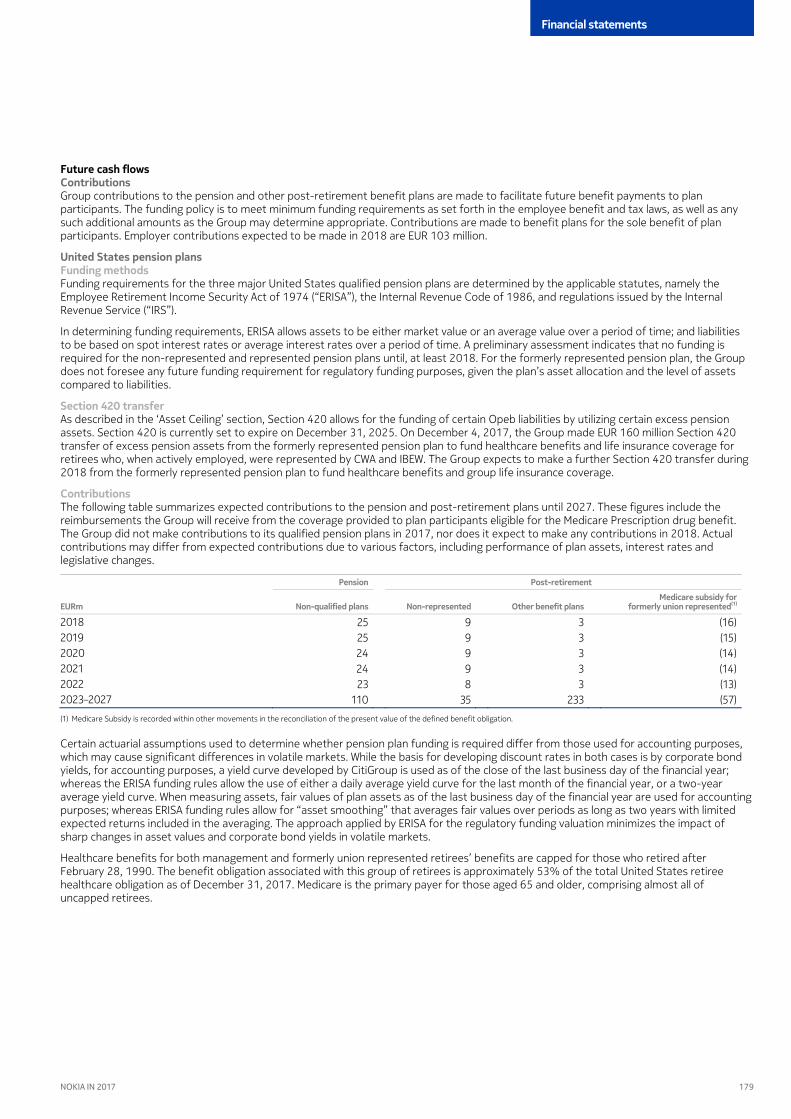
179
Financial statements
NOKIA IN 2017
Future cash flows Contributions Group contributions to the pension and other post-retirement benefit plans are made to facilitate future benefit payments to plan participants. The funding policy is to meet minimum funding requirements as set forth in the employee benefit and tax laws, as well as any such additional amounts as the Group may determine appropriate. Contributions are made to benefit plans for the sole benefit of plan participants. Employer contributions expected to be made in are EUR million.
United States pension plans Funding methods Funding requirements for the three major United States qualified pension plans are determined by the applicable statutes, namely the Employee Retirement Income Security Act of (“ERISA”), the Internal Revenue Code of , and regulations issued by the Internal Revenue Service (“IRS”).
In determining funding requirements, ERISA allows assets to be either market value or an average value over a period of time; and liabilities to be based on spot interest rates or average interest rates over a period of time. A preliminary assessment indicates that no funding is required for the non-represented and represented pension plans until, at least . For the formerly represented pension plan, the Group does not foresee any future funding requirement for regulatory funding purposes, given the plan’s asset allocation and the level of assets compared to liabilities.
Section 420 transfer As described in the ‘Asset Ceiling’ section, Section allows for the funding of certain Opeb liabilities by utilizing certain excess pension assets. Section is currently set to expire on December , . On December , , the Group made EUR million Section transfer of excess pension assets from the formerly represented pension plan to fund healthcare benefits and life insurance coverage for retirees who, when actively employed, were represented by CWA and IBEW. The Group expects to make a further Section transfer during from the formerly represented pension plan to fund healthcare benefits and group life insurance coverage.
Contributions The following table summarizes expected contributions to the pension and post-retirement plans until . These figures include the reimbursements the Group will receive from the coverage provided to plan participants eligible for the Medicare Prescription drug benefit. The Group did not make contributions to its qualified pension plans in , nor does it expect to make any contributions in . Actual contributions may differ from expected contributions due to various factors, including performance of plan assets, interest rates and legislative changes.
Pension Post-retirement
EURm Non-qualified plans Non-represented Other benefit plans Medicare subsidy for
formerly union represented(1)
2018 25 9 3 (16) 2019 25 9 3 (15) 2020 24 9 3 (14) 2021 24 9 3 (14) 2022 23 8 3 (13) 2023–2027 110 35 233 (57)
(1) Medicare Subsidy is recorded within other movements in the reconciliation of the present value of the defined benefit obligation.
Certain actuarial assumptions used to determine whether pension plan funding is required differ from those used for accounting purposes, which may cause significant differences in volatile markets. While the basis for developing discount rates in both cases is by corporate bond yields, for accounting purposes, a yield curve developed by CitiGroup is used as of the close of the last business day of the financial year; whereas the ERISA funding rules allow the use of either a daily average yield curve for the last month of the financial year, or a two-year average yield curve. When measuring assets, fair values of plan assets as of the last business day of the financial year are used for accounting purposes; whereas ERISA funding rules allow for “asset smoothing” that averages fair values over periods as long as two years with limited expected returns included in the averaging. The approach applied by ERISA for the regulatory funding valuation minimizes the impact of sharp changes in asset values and corporate bond yields in volatile markets.
Healthcare benefits for both management and formerly union represented retirees’ benefits are capped for those who retired after February , . The benefit obligation associated with this group of retirees is approximately % of the total United States retiree healthcare obligation as of December , . Medicare is the primary payer for those aged and older, comprising almost all of uncapped retirees.

180 NOKIA IN 2017
continuedNotes to consolidated financial statements
Benefit payments The following table summarizes expected benefit payments from the pension and post-retirement plans and other post-employment benefit plans until . Actual benefit payments may differ from expected benefit payments. The amounts for the United States plans are net of expected plan participant contributions, as well as the annual Medicare Part D subsidy of approximately EUR million.
United States direct benefit payments Other countries Total
Pension Post-retirement
EURm Qualified
management Qualified
occupational Non-qualified
plans Formerly union
represented Non-union
represented
2018 1 237 286 25 125 51 273 1 997 2019 1 073 265 25 118 52 261 1 794 2020 1 041 253 24 147 53 267 1 785 2021 1 006 242 24 141 54 280 1 747 2022 971 230 23 133 55 279 1 691 2023-2027 4 294 980 110 539 281 1 515 7 719 Benefit payments are paid from plan assets where plans are fully funded. Funding mechanisms, such as the Section transfer, are further utilized to minimize direct benefit payments for underfunded United States Opeb liabilities. Direct benefit payments expected to be paid in total EUR million.
Non-current liabilities 28. Accrued expenses, deferred revenue and other liabilities
EURm 2017 2016
Advance payments and deferred revenue(1) 1 171 2 204 Discounted non-interest-bearing liabilities(2) 23 690 Salaries, wages and social charges 138 59 Other 121 33 Total 2 986 1 453 Current liabilities
EURm 2017 2016
Advance payments and deferred revenue(1) 3 178 3 513 Salaries, wages and social charges 1 576 1 551 VAT and other indirect taxes 362 453 Other 1 296 1 149 Total 6 666 6 412 (1) Non-current deferred revenue includes EUR 924 million (EUR 1 080 million in 2016) and current deferred revenue includes EUR 155 million (EUR 155 million in 2016) prepayment relating to a ten-year
mutual patent license agreement with Microsoft. (2) Includes EUR 672 million financial liability related to the conditional obligation to China Huaxin as part of the Nokia Shanghai Bell definitive agreements where China Huaxin obtained the right to fully
transfer its ownership interest in Nokia Shanghai Bell to the Group in exchange for a future cash settlement. Refer to Note 33, Significant partly-owned subsidiaries.
Other accruals include accrued royalties, research and development expenses, marketing expenses and interest expenses, as well as various amounts which are individually insignificant.
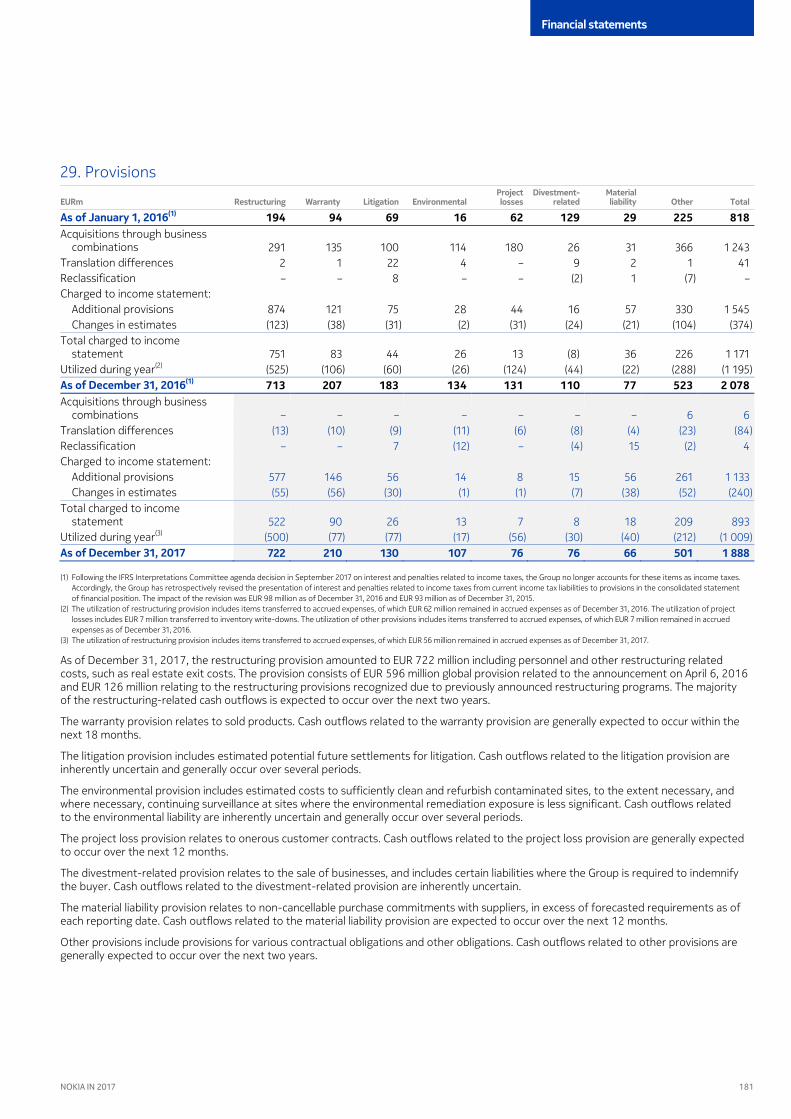
181
Financial statements
NOKIA IN 2017
EURm
29. Provisions
Restructuring Warranty Litigation Environmental Project losses
Divestment- related
Material liability Other Total
194 94 69 16 62 129 29 225 818 As of January , () Acquisitions through business
combinations 291 135 100 114 180 26 31 366 1 243 Translation differences 2 1 22 4 – 9 2 1 41 Reclassification – – 8 – – (2) 1 (7) – Charged to income statement:
Additional provisions 874 121 75 28 44 16 57 330 1 545 Changes in estimates (123) (38) (31) (2) (31) (24) (21) (104) (374)
Total charged to income statement 751 83 44 26 13 (8) 36 226 1 171
Utilized during year(2) (525) (106) (60) (26) (124) (44) (22) (288) (1 195) 713 207 183 134 131 110 77 523 2 078 As of December , ()
Acquisitions through business combinations – – – – – – – 6 6
Translation differences (13) (10) (9) (11) (6) (8) (4) (23) Reclassification
(84) – – 7 (12) – (4) 15 (2)
Charged to income statement: 4
Additional provisions
577 146 56 14 8 15 56 261
Changes in estimates 1 133
(55) (56) (30) (1) (1) (7) (38) (52) Total charged to income
(240)
statement 522 90 26 13 7 8 18 209 Utilized during year
893 (3) (500) (77) (77) (17) (56) (30) (40) (212)
As of December 31, 2017 (1 009)
722 210 130 107 76 76 66 501 1 888 (1) Following the IFRS Interpretations Committee agenda decision in September 2017 on interest and penalties related to income taxes, the Group no longer accounts for these items as income taxes.
Accordingly, the Group has retrospectively revised the presentation of interest and penalties related to income taxes from current income tax liabilities to provisions in the consolidated statement of financial position. The impact of the revision was EUR 98 million as of December 31, 2016 and EUR 93 million as of December 31, 2015.
(2) The utilization of restructuring provision includes items transferred to accrued expenses, of which EUR 62 million remained in accrued expenses as of December 31, 2016. The utilization of project losses includes EUR 7 million transferred to inventory write-downs. The utilization of other provisions includes items transferred to accrued expenses, of which EUR 7 million remained in accrued expenses as of December 31, 2016.
(3) The utilization of restructuring provision includes items transferred to accrued expenses, of which EUR 56 million remained in accrued expenses as of December 31, 2017.
As of December , , the restructuring provision amounted to EUR million including personnel and other restructuring related costs, such as real estate exit costs. The provision consists of EUR million global provision related to the announcement on April , and EUR million relating to the restructuring provisions recognized due to previously announced restructuring programs. The majority of the restructuring-related cash outflows is expected to occur over the next two years.
The warranty provision relates to sold products. Cash outflows related to the warranty provision are generally expected to occur within the next months.
The litigation provision includes estimated potential future settlements for litigation. Cash outflows related to the litigation provision are inherently uncertain and generally occur over several periods.
The environmental provision includes estimated costs to sufficiently clean and refurbish contaminated sites, to the extent necessary, and where necessary, continuing surveillance at sites where the environmental remediation exposure is less significant. Cash outflows related to the environmental liability are inherently uncertain and generally occur over several periods.
The project loss provision relates to onerous customer contracts. Cash outflows related to the project loss provision are generally expected to occur over the next months.
The divestment-related provision relates to the sale of businesses, and includes certain liabilities where the Group is required to indemnify the buyer. Cash outflows related to the divestment-related provision are inherently uncertain.
The material liability provision relates to non-cancellable purchase commitments with suppliers, in excess of forecasted requirements as of each reporting date. Cash outflows related to the material liability provision are expected to occur over the next months.
Other provisions include provisions for various contractual obligations and other obligations. Cash outflows related to other provisions are generally expected to occur over the next two years.
182 NOKIA IN 2017
Notes to consolidated financial statements continued
Legal matters A number of Group companies are and will likely continue to be subject to various legal proceedings and investigations that arise from time to time, including proceedings regarding intellectual property, product liability, sales and marketing practices, commercial disputes, employment, and wrongful discharge, antitrust, securities, health and safety, environmental, tax, international trade, and privacy matters. As a result, the Group may incur substantial costs that may not be covered by insurance and could affect business and reputation. While management does not expect any of these legal proceedings to have a material adverse effect on the Group’s financial position, litigation is inherently unpredictable and the Group may in the future incur judgments or enter into settlements that could have a material adverse effect on the results of operations and cash flows.
Litigation and proceedings Vertu The Group divested the United Kingdom-based luxury handset business, Vertu, to Crown Bidco Ltd in . In , Crown Bidco Ltd served a claim in the Commercial Court in London alleging breach of contract in relation to the transfer of IT assets and breach of warranties under the sale agreement. In July , Crown Bidco and the Group resolved the dispute on terms confidential to the parties and without any admission of liability on the part of any entity.
Mass labor litigation Brazil The Group is defending against a substantial number of labor claims in various Brazilian labor courts. Plaintiffs are former employees whose contracts were terminated after the Group exited from certain managed services contracts. The claims mainly relate to payments made under, or in connection with, the terminated labor contracts. The Group has closed the majority of the court cases through settlement or judgement. Closure of most of the remaining open cases is expected to occur within the next couple of years.
Asbestos litigation in the United States The Group is defending approximately asbestos-related matters, at various stages of litigation. The claims are based on premises liability, products liability, and contractor liability. The claims also involve plaintiffs allegedly diagnosed with various diseases, including but not limited to asbestosis, lung cancer, and mesothelioma.
Intellectual property rights litigation Apple On December , , the Group commenced patent infringement proceedings against Apple in Asia, Europe and the United States. On May , , the parties settled all pending patent litigation between them, and entered into a patent license and business collaboration agreement. The Group received an up-front cash payment from Apple, with additional revenues during the term of the agreement.
LG Electronics In , LG Electronics agreed to take a royalty-bearing smartphone patent license from Nokia Technologies with the royalty payment obligations subject to commercial arbitration. In September , the International Court of Arbitration of the International Chamber of Commerce issued its award for that arbitration between the Group and LG Electronics. The parties have since reached an agreement on a license for a longer term than was set out in the arbitration.
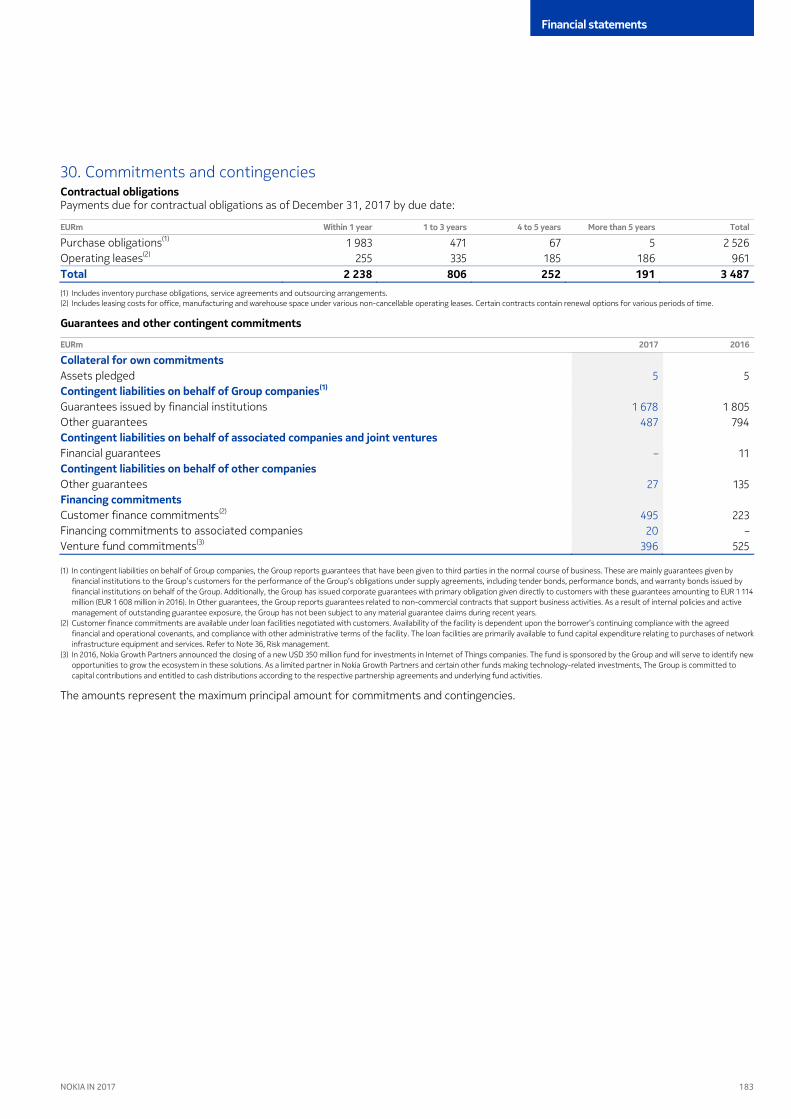
183
Financial statements
NOKIA IN 2017
Contractual obligations 30. Commitments and contingencies
Payments due for contractual obligations as of December , by due date:
EURm Within 1 year 1 to 3 years 4 to 5 years More than 5 years Total
Purchase obligations(1) 1 983 471 67 5 2 526 Operating leases(2) 255 335 185 186 961 Total 2 238 806 252 191 3 487 (1) Includes inventory purchase obligations, service agreements and outsourcing arrangements. (2) Includes leasing costs for office, manufacturing and warehouse space under various non-cancellable operating leases. Certain contracts contain renewal options for various periods of time.
Guarantees and other contingent commitments
EURm 2017 2016
Collateral for own commitments Assets pledged 5 5 Contingent liabilities on behalf of Group companies(1) Guarantees issued by financial institutions 1 805 1 678 Other guarantees 794 487 Contingent liabilities on behalf of associated companies and joint ventures Financial guarantees 11 – Contingent liabilities on behalf of other companies Other guarantees 135 27 Financing commitments Customer finance commitments(2) 223 495 Financing commitments to associated companies – 20 Venture fund commitments(3) 525 396 (1) In contingent liabilities on behalf of Group companies, the Group reports guarantees that have been given to third parties in the normal course of business. These are mainly guarantees given by
financial institutions to the Group’s customers for the performance of the Group’s obligations under supply agreements, including tender bonds, performance bonds, and warranty bonds issued by financial institutions on behalf of the Group. Additionally, the Group has issued corporate guarantees with primary obligation given directly to customers with these guarantees amounting to EUR 1 114 million (EUR 1 608 million in 2016). In Other guarantees, the Group reports guarantees related to non-commercial contracts that support business activities. As a result of internal policies and active management of outstanding guarantee exposure, the Group has not been subject to any material guarantee claims during recent years.
(2) Customer finance commitments are available under loan facilities negotiated with customers. Availability of the facility is dependent upon the borrower’s continuing compliance with the agreed financial and operational covenants, and compliance with other administrative terms of the facility. The loan facilities are primarily available to fund capital expenditure relating to purchases of network infrastructure equipment and services. Refer to Note 36, Risk management.
(3) In 2016, Nokia Growth Partners announced the closing of a new USD 350 million fund for investments in Internet of Things companies. The fund is sponsored by the Group and will serve to identify new opportunities to grow the ecosystem in these solutions. As a limited partner in Nokia Growth Partners and certain other funds making technology-related investments, The Group is committed to capital contributions and entitled to cash distributions according to the respective partnership agreements and underlying fund activities.
The amounts represent the maximum principal amount for commitments and contingencies.
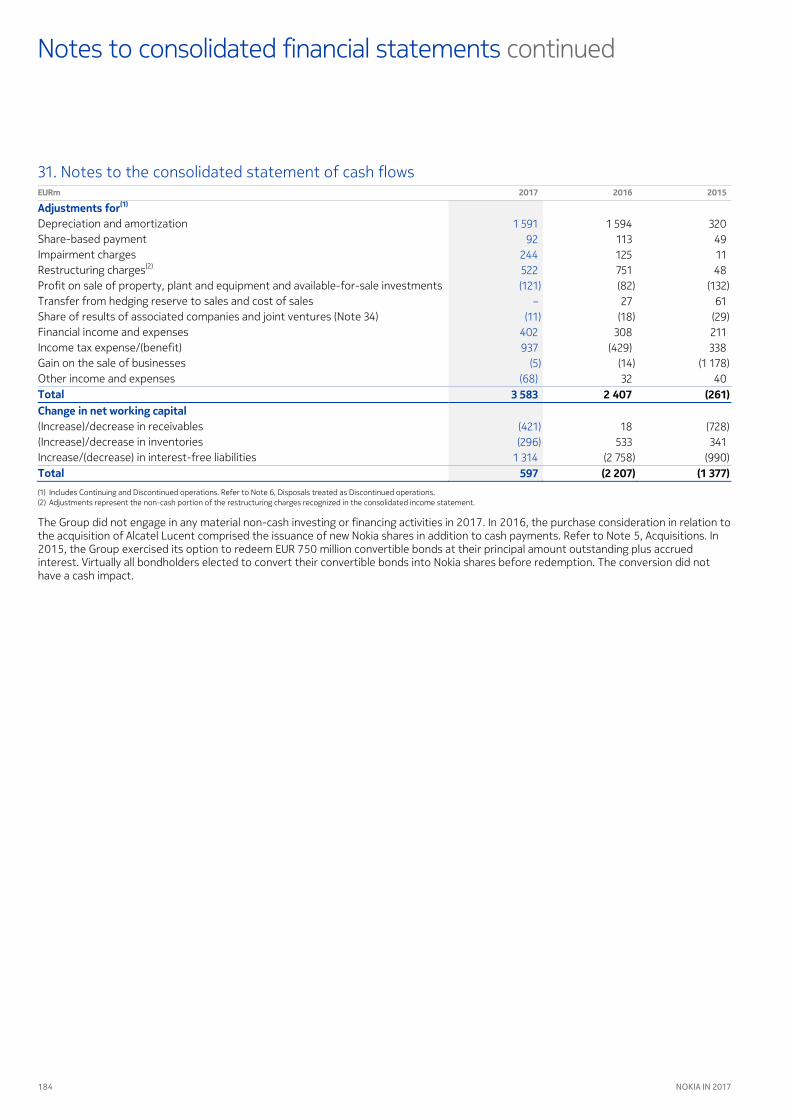
184 NOKIA IN 2017
continuedNotes to consolidated financial statements
EURm
31. Notes to the consolidated statement of cash flows 2017 2016 2015
Adjustments for(1) Depreciation and amortization 1 594 320 1 591 Share-based payment 113 49 92 Impairment charges 125 11 244 Restructuring charges(2) 751 48 522 Profit on sale of property, plant and equipment and available-for-sale investments (82) (132) (121) Transfer from hedging reserve to sales and cost of sales 27 61 – Share of results of associated companies and joint ventures (Note 34) (18) (29) (11) Financial income and expenses 308 211 402 Income tax expense/(benefit) (429) 338 937 Gain on the sale of businesses (14) (1 178) (5) Other income and expenses 32 40 (68) Total 3 583 2 407 () Change in net working capital (Increase)/decrease in receivables 18 (728) (421) (Increase)/decrease in inventories 533 341 (296) Increase/(decrease) in interest-free liabilities (2 758) (990) 1 314 Total 597 ( ) ( ) (1) Includes Continuing and Discontinued operations. Refer to Note 6, Disposals treated as Discontinued operations. (2) Adjustments represent the non-cash portion of the restructuring charges recognized in the consolidated income statement.
The Group did not engage in any material non-cash investing or financing activities in . In , the purchase consideration in relation to the acquisition of Alcatel Lucent comprised the issuance of new Nokia shares in addition to cash payments. Refer to Note , Acquisitions. In , the Group exercised its option to redeem EUR million convertible bonds at their principal amount outstanding plus accrued interest. Virtually all bondholders elected to convert their convertible bonds into Nokia shares before redemption. The conversion did not have a cash impact.
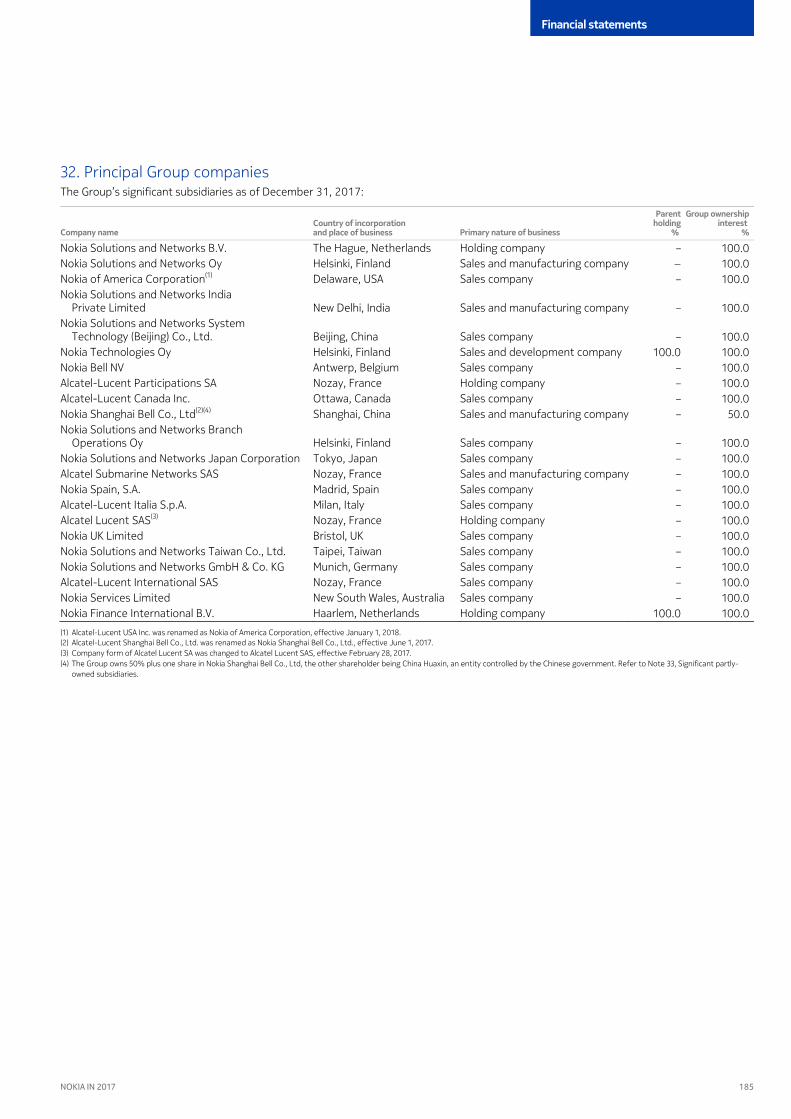
185
Financial statements
NOKIA IN 2017
32. Principal Group companies The Group’s significant subsidiaries as of December , :
Company name Country of incorporation and place of business Primary nature of business
Parent holding
%
Group ownership interest
%
Nokia Solutions and Networks B.V. The Hague, Netherlands Holding company – 100.0 Nokia Solutions and Networks Oy Helsinki, Finland Sales and manufacturing company 100.0 Nokia of America Corporation(1) Delaware, USA Sales company – 100.0 Nokia Solutions and Networks India
Private Limited New Delhi, India Sales and manufacturing company – 100.0 Nokia Solutions and Networks System
Technology (Beijing) Co., Ltd. Beijing, China Sales company – 100.0 Nokia Technologies Oy Helsinki, Finland Sales and development company 100.0 100.0 Nokia Bell NV Antwerp, Belgium Sales company – 100.0 Alcatel-Lucent Participations SA Nozay, France Holding company – 100.0 Alcatel-Lucent Canada Inc. Ottawa, Canada Sales company – 100.0 Nokia Shanghai Bell Co., Ltd(2)(4) Shanghai, China Sales and manufacturing company – 50.0 Nokia Solutions and Networks Branch
Operations Oy Helsinki, Finland Sales company – 100.0 Nokia Solutions and Networks Japan Corporation Tokyo, Japan Sales company – 100.0 Alcatel Submarine Networks SAS Nozay, France Sales and manufacturing company – 100.0 Nokia Spain, S.A. Madrid, Spain Sales company – 100.0 Alcatel-Lucent Italia S.p.A. Milan, Italy Sales company – 100.0 Alcatel Lucent SAS(3) Nozay, France Holding company – 100.0 Nokia UK Limited Bristol, UK Sales company – 100.0 Nokia Solutions and Networks Taiwan Co., Ltd. Taipei, Taiwan Sales company – 100.0 Nokia Solutions and Networks GmbH & Co. KG Munich, Germany Sales company – 100.0 Alcatel-Lucent International SAS Nozay, France Sales company – 100.0 Nokia Services Limited New South Wales, Australia Sales company – 100.0 Nokia Finance International B.V. Haarlem, Netherlands Holding company 100.0 100.0
(1) Alcatel-Lucent USA Inc. was renamed as Nokia of America Corporation, effective January 1, 2018. (2) Alcatel-Lucent Shanghai Bell Co., Ltd. was renamed as Nokia Shanghai Bell Co., Ltd., effective June 1, 2017. (3) Company form of Alcatel Lucent SA was changed to Alcatel Lucent SAS, effective February 28, 2017. (4) The Group owns 50% plus one share in Nokia Shanghai Bell Co., Ltd, the other shareholder being China Huaxin, an entity controlled by the Chinese government. Refer to Note 33, Significant partly-
owned subsidiaries.

186 NOKIA IN 2017
continuedNotes to consolidated financial statements
As part of the acquisition of Alcatel Lucent on January
33. Significant partly-owned subsidiaries , , the Group acquired a partly-owned consolidated subsidiary, Alcatel-Lucent
Shanghai Bell Co., Ltd. On May , , the Group announced the signing of definitive agreements with the China Huaxin Post & Telecommunication Economy Development Center ("China Huaxin") related to the integration of Alcatel-Lucent Shanghai Bell Co,. Ltd. and the Group's China business into a new joint venture branded as Nokia Shanghai Bell.
As part of the definitive agreements, the Group transferred it’s China business and subsidiaries to Nokia Shanghai Bell in exchange for a cash payment. As the transfer of the Group’s China business consisted of a transaction between two Group subsidiaries, all gains or losses that arose from the transaction were fully eliminated within the Group’s consolidated financial statements. Further, the transfer of cash from Nokia Shanghai Bell to the wholly-owned parent entity of the Group’s China business did not impact the cash nor net cash balances in the Group’s consolidated financial statements.
On July , , the Group and China Huaxin commenced operations of the new Nokia Shanghai Bell joint venture. The Group holds an ownership interest of % plus one share in the Nokia Shanghai Bell’s parent company, Nokia Shanghai Bell Co., Ltd., with China Huaxin holding the remaining ownership interests. The definitive agreements provide China Huaxin with the right to fully transfer its ownership interest in Nokia Shanghai Bell to the Group and the Group with the right to purchase China Huaxin’s ownership interest in Nokia Shanghai Bell in exchange for a future cash settlement. As a result, the Group derecognised the non-controlling interest balance related to Nokia Shanghai Bell of EUR million partly offset by the recognition of a related financial liability of EUR million with the difference of EUR million recorded as a gain within retained earnings as a transaction with the non-controlling interest.
The financial liability is measured based on the present value of the expected future cash settlement to acquire the non-controlling interest in Nokia Shanghai Bell. In , an interest expense of EUR million was recorded to reflect the recognition of the present value discount on the financial liability. The Group decreased the value of the financial liability in to reflect a change in estimate of the future cash settlement resulting in the recognition of a EUR million gain in financial income and expenses in the consolidated income statement.
Financial information for the Nokia Shanghai Bell Group():
EURm 2017 2016
Summarized income statement Net sales(2) 1 806 2 276 Operating profit/(loss) (136) 83 Profit/(loss) for the year (89) 52 Profit/(loss) for the year attributable to:
Equity holders of the parent (45) 15 Non-controlling interests(3) (45) 37
Summarized statement of financial position Non-current assets 424 589 Non-current liabilities (128) (130) Non-current net assets 459 296 Current assets(4) 2 841 3 888 Current liabilities (1 657) (2 765) Current net assets 1 123 1 184 Net assets() 1 582 1 480 Non-controlling interests(6) 775 – Summarized statement of cash flows Net cash from/(used in) operating activities (182) 438 Net cash (used in)/from investing activities 89 (184) Net cash used in financing activities (24) (442) Net decrease in cash and cash equivalents () () (1) Financial information in 2017 is not fully comparable to financial information in 2016: the new Nokia Shanghai Bell joint venture commenced operations on July 3, 2017 and includes, in addition to the
Alcatel Lucent Shanghai Bell Group entities previously reported as material partly-owned subsidiaries, the Group’s China business, which were previously fully owned subsidiaries. Financial information for the Nokia Shanghai Bell Group is presented before eliminations of intercompany transactions with the rest of the Group but after eliminations of intercompany transactions between entities within the Nokia Shanghai Bell Group.
(2) Includes EUR 328 million (EUR 483 million in 2016) net sales to other Group entities. (3) In 2017, profit for the year is attributed to non-controlling interests until July 3, 2017. (4) Includes a total of EUR 1 001 million (EUR 1 284 million in 2016) of cash and cash equivalents and available-for-sale investments, liquid assets. (5) The distribution of the profits of Nokia Shanghai Bell Co., Ltd requires the passing of a special resolution by more than two-thirds of its shareholders, subject to a requirement that at least 50% of the
after-tax distributable profits are distributed as dividends each year. (6) In 2017, the non-controlling interest balance was derecognized and partially offset by the recognition of the related financial liability of EUR 737 million.

187
Financial statements
NOKIA IN 2017
EURm
34. Investments in associated companies and joint ventures 2017 2016
Net carrying amount as of January 1 84 116 Translation differences (1) (8) Acquisitions through business combinations 20 1 Additions ‒ 9 Disposals (4) ‒ Share of results 18 11 Dividends (1) (1) Net carrying amount as of December 31 128 116
Shareholdings in associated companies and joint ventures comprise investments in unlisted companies.
The Group has related party transactions wi
35. Related party transactions th a pension fund, associated companies, joint ventures and other entities where the Group has
significant influence, as well as the management and the Board of Directors. Transactions and balances with companies over which the Group exercises control are eliminated on consolidation. Refer to Note , Significant accounting policies, and Note , Principal Group companies.
Transactions with pension fund The Group has borrowings of EUR million (EUR million in ) from Nokia Unterstützungsgesellschaft mbH, the Group’s German pension fund, a separate legal entity. The loan bears interest at the rate of % per annum and its duration is pending until further notice by the loan counterparties even though they have the right to terminate the loan with a -day notice. The loan is included in short-term interest-bearing liabilities in the consolidated statement of financial position.
Transactions with associated companies, joint ventures and other entities where the Group has significant influence
EURm 2017 2016 2015
Share of results 18 29 11 Dividend income 1 2 1 Share of shareholders' equity 116 84 128 Sales 62 (1) 117 Purchases (322) (233) (252) Receivables 13 – 41 Payables (38) (37) (19) The Group has financial commitments of EUR million (guaranteed a loan of EUR million in ) for an associated company.
Management compensation Compensation information for the President and CEO:
EUR 2017 2016 2015
Base salary/fee 1 049 044 1 000 000 1 050 000 Cash incentive payments 780 357 1 922 195 997 369 Share-based payment expenses(1) 5 296 960 4 604 622 2 606 613 Pension expenses 469 737 491 641 338 787 Total 4 992 769 7 596 098 8 018 458 (1) Represents the expense for all outstanding equity grants recorded during the year.
Total remuneration awarded to the Group Leadership Team for their time as members of the Group Leadership Team:
EURm 2017 2016 2015
Short-term benefits 26 9 22 Post-employment benefits(1) 1 1 1 Share-based payment 15 9 7 Termination benefits(2) 1 3 4 Total 34 43 22 (1) The members of the Group Leadership Team participate in the local retirement programs applicable to employees in the country where they reside. (2) Includes both termination payments and payments made under exceptional contractual arrangements for lapsed equity awards.
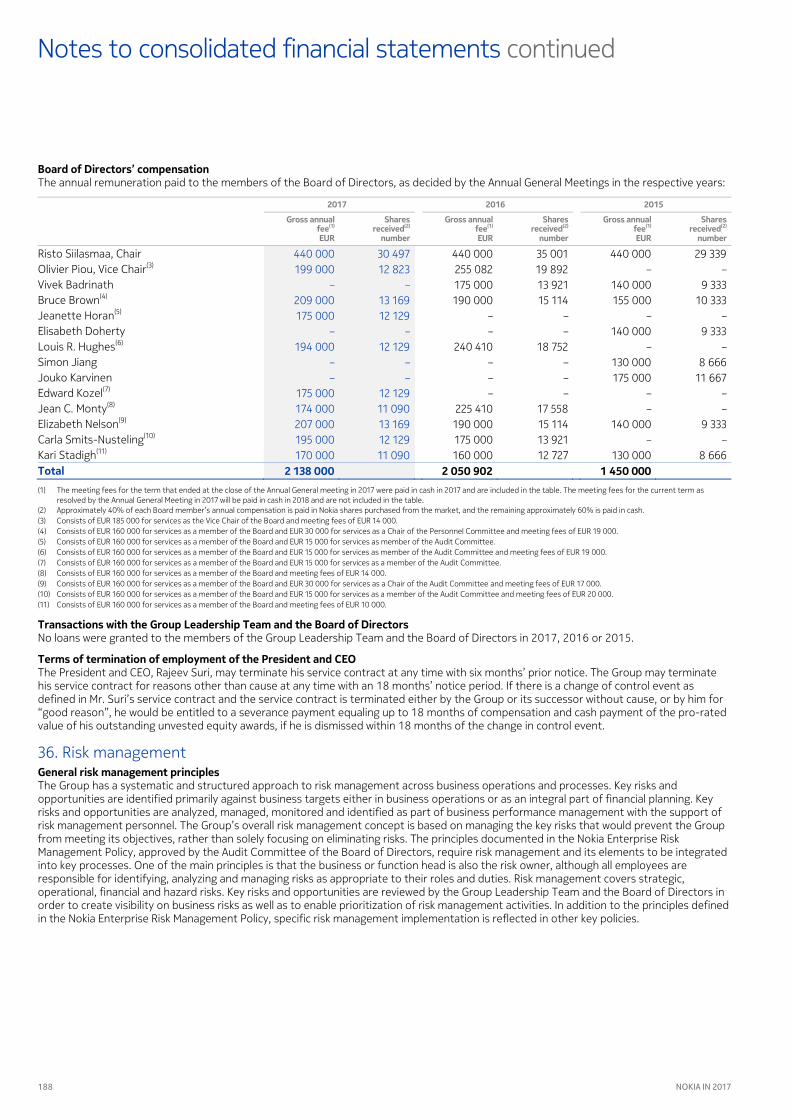
188 NOKIA IN 2017
continuedNotes to consolidated financial statements
Board of Directors’ compensation The annual remuneration paid to the members of the Board of Directors, as decided by the Annual General Meetings in the respective years:
2017 2016 2015
Gross annual fee(1) EUR
Shares
received(2)
number
Gross annual fee(1)
EUR
Shares received(2)
number
Gross annual fee(1) EUR
Shares received(2)
number
Risto Siilasmaa, Chair 440 000 440 000 35 001 440 000 29 339 30 497 Olivier Piou, Vice Chair(3) 199 000 255 082 19 892 – – 12 823 Vivek Badrinath – 175 000 13 921 140 000 9 333 – Bruce Brown(4) 209 000 190 000 15 114 155 000 10 333 13 169 Jeanette Horan(5) 175 000 – – – – 12 129 Elisabeth Doherty – – – 140 000 9 333 – Louis R. Hughes(6) 194 000 240 410 18 752 – – 12 129 Simon Jiang – – – 130 000 8 666 – Jouko Karvinen – – – 175 000 11 667 – Edward Kozel(7) 175 000 – – – – 12 129 Jean C. Monty(8) 174 000 225 410 17 558 – – 11 090 Elizabeth Nelson(9) 207 000 190 000 15 114 140 000 9 333 13 169 Carla Smits-Nusteling(10) 195 000 175 000 13 921 – – 12 129 Kari Stadigh(11) 170 000 160 000 12 727 130 000 8 666 11 090 Total 2 138 000 2 050 902 1 450 000
(1) The meeting fees for the term that ended at the close of the Annual General meeting in 2017 were paid in cash in 2017 and are included in the table. The meeting fees for the current term as resolved by the Annual General Meeting in 2017 will be paid in cash in 2018 and are not included in the table.
(2) Approximately 40% of each Board member’s annual compensation is paid in Nokia shares purchased from the market, and the remaining approximately 60% is paid in cash. (3) Consists of EUR 185 000 for services as the Vice Chair of the Board and meeting fees of EUR 14 000. (4) Consists of EUR 160 000 for services as a member of the Board and EUR 30 000 for services as a Chair of the Personnel Committee and meeting fees of EUR 19 000. (5) Consists of EUR 160 000 for services as a member of the Board and EUR 15 000 for services as member of the Audit Committee. (6) Consists of EUR 160 000 for services as a member of the Board and EUR 15 000 for services as member of the Audit Committee and meeting fees of EUR 19 000. (7) Consists of EUR 160 000 for services as a member of the Board and EUR 15 000 for services as a member of the Audit Committee. (8) Consists of EUR 160 000 for services as a member of the Board and meeting fees of EUR 14 000. (9) Consists of EUR 160 000 for services as a member of the Board and EUR 30 000 for services as a Chair of the Audit Committee and meeting fees of EUR 17 000. (10) Consists of EUR 160 000 for services as a member of the Board and EUR 15 000 for services as a member of the Audit Committee and meeting fees of EUR 20 000. (11) Consists of EUR 160 000 for services as a member of the Board and meeting fees of EUR 10 000.
Transactions with the Group Leadership Team and the Board of Directors No loans were granted to the members of the Group Leadership Team and the Board of Directors in , or .
Terms of termination of employment of the President and CEO The President and CEO, Rajeev Suri, may terminate his service contract at any time with six months’ prior notice. The Group may terminate his service contract for reasons other than cause at any time with an months’ notice period. If there is a change of control event as defined in Mr. Suri’s service contract and the service contract is terminated either by the Group or its successor without cause, or by him for “good reason”, he would be entitled to a severance payment equaling up to months of compensation and cash payment of the pro-rated value of his outstanding unvested equity awards, if he is dismissed within months of the change in control event.
General risk management principles 36. Risk management
The Group has a systematic and structured approach to risk management across business operations and processes. Key risks and opportunities are identified primarily against business targets either in business operations or as an integral part of financial planning. Key risks and opportunities are analyzed, managed, monitored and identified as part of business performance management with the support of risk management personnel. The Group’s overall risk management concept is based on managing the key risks that would prevent the Group from meeting its objectives, rather than solely focusing on eliminating risks. The principles documented in the Nokia Enterprise Risk Management Policy, approved by the Audit Committee of the Board of Directors, require risk management and its elements to be integrated into key processes. One of the main principles is that the business or function head is also the risk owner, although all employees are responsible for identifying, analyzing and managing risks as appropriate to their roles and duties. Risk management covers strategic, operational, financial and hazard risks. Key risks and opportunities are reviewed by the Group Leadership Team and the Board of Directors in order to create visibility on business risks as well as to enable prioritization of risk management activities. In addition to the principles defined in the Nokia Enterprise Risk Management Policy, specific risk management implementation is reflected in other key policies.
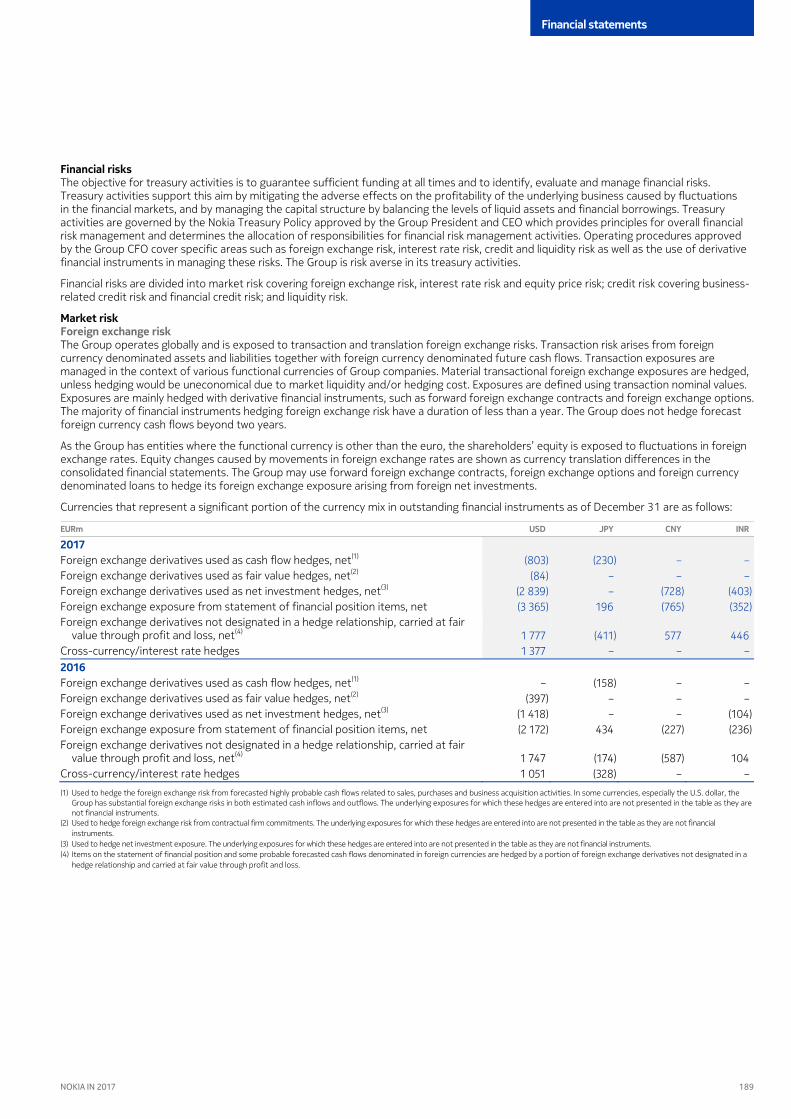
189
Financial statements
NOKIA IN 2017
Financial risks The objective for treasury activities is to guarantee sufficient funding at all times and to identify, evaluate and manage financial risks. Treasury activities support this aim by mitigating the adverse effects on the profitability of the underlying business caused by fluctuations in the financial markets, and by managing the capital structure by balancing the levels of liquid assets and financial borrowings. Treasury activities are governed by the Nokia Treasury Policy approved by the Group President and CEO which provides principles for overall financial risk management and determines the allocation of responsibilities for financial risk management activities. Operating procedures approved by the Group CFO cover specific areas such as foreign exchange risk, interest rate risk, credit and liquidity risk as well as the use of derivative financial instruments in managing these risks. The Group is risk averse in its treasury activities.
Financial risks are divided into market risk covering foreign exchange risk, interest rate risk and equity price risk; credit risk covering business-related credit risk and financial credit risk; and liquidity risk.
Market risk Foreign exchange risk The Group operates globally and is exposed to transaction and translation foreign exchange risks. Transaction risk arises from foreign currency denominated assets and liabilities together with foreign currency denominated future cash flows. Transaction exposures are managed in the context of various functional currencies of Group companies. Material transactional foreign exchange exposures are hedged, unless hedging would be uneconomical due to market liquidity and/or hedging cost. Exposures are defined using transaction nominal values. Exposures are mainly hedged with derivative financial instruments, such as forward foreign exchange contracts and foreign exchange options. The majority of financial instruments hedging foreign exchange risk have a duration of less than a year. The Group does not hedge forecast foreign currency cash flows beyond two years.
As the Group has entities where the functional currency is other than the euro, the shareholders’ equity is exposed to fluctuations in foreign exchange rates. Equity changes caused by movements in foreign exchange rates are shown as currency translation differences in the consolidated financial statements. The Group may use forward foreign exchange contracts, foreign exchange options and foreign currency denominated loans to hedge its foreign exchange exposure arising from foreign net investments.
Currencies that represent a significant portion of the currency mix in outstanding financial instruments as of December are as follows:
EURm USD JPY CNY INR
2017 Foreign exchange derivatives used as cash flow hedges, net(1) (803) (230) – Foreign exchange derivatives us
– ed as fair value hedges, net(2) (84) – –
Foreign exchange derivatives used –
as net investment hedges, net(3) (2 839) – (728) Foreign exchange exposure from statem
(403) ent of financial position items, net (3 365) 196 (765)
Foreign exchange derivatives (352)
not designated in a hedge relationship, carried at fair value through profit and loss, net(4) 1 777 (411) 577
Cross-currency/interest rate hedges 446
1 377 – – 2016
–
Foreign exchange derivatives used as cash flow hedges, net(1) – (158) – – Foreign exchange derivatives used as fair value hedges, net(2) (397) – – – Foreign exchange derivatives used as net investment hedges, net(3) (1 418) – – (104) Foreign exchange exposure from statement of financial position items, net (2 172) 434 (227) (236) Foreign exchange derivatives not designated in a hedge relationship, carried at fair
value through profit and loss, net(4) 1 747 (174) (587) 104 Cross-currency/interest rate hedges 1 051 (328) – –
(1) Used to hedge the foreign exchange risk from forecasted highly probable cash flows related to sales, purchases and business acquisition activities. In some currencies, especially the U.S. dollar, the Group has substantial foreign exchange risks in both estimated cash inflows and outflows. The underlying exposures for which these hedges are entered into are not presented in the table as they are not financial instruments.
(2) Used to hedge foreign exchange risk from contractual firm commitments. The underlying exposures for which these hedges are entered into are not presented in the table as they are not financial instruments.
(3) Used to hedge net investment exposure. The underlying exposures for which these hedges are entered into are not presented in the table as they are not financial instruments. (4) Items on the statement of financial position and some probable forecasted cash flows denominated in foreign currencies are hedged by a portion of foreign exchange derivatives not designated in a
hedge relationship and carried at fair value through profit and loss.
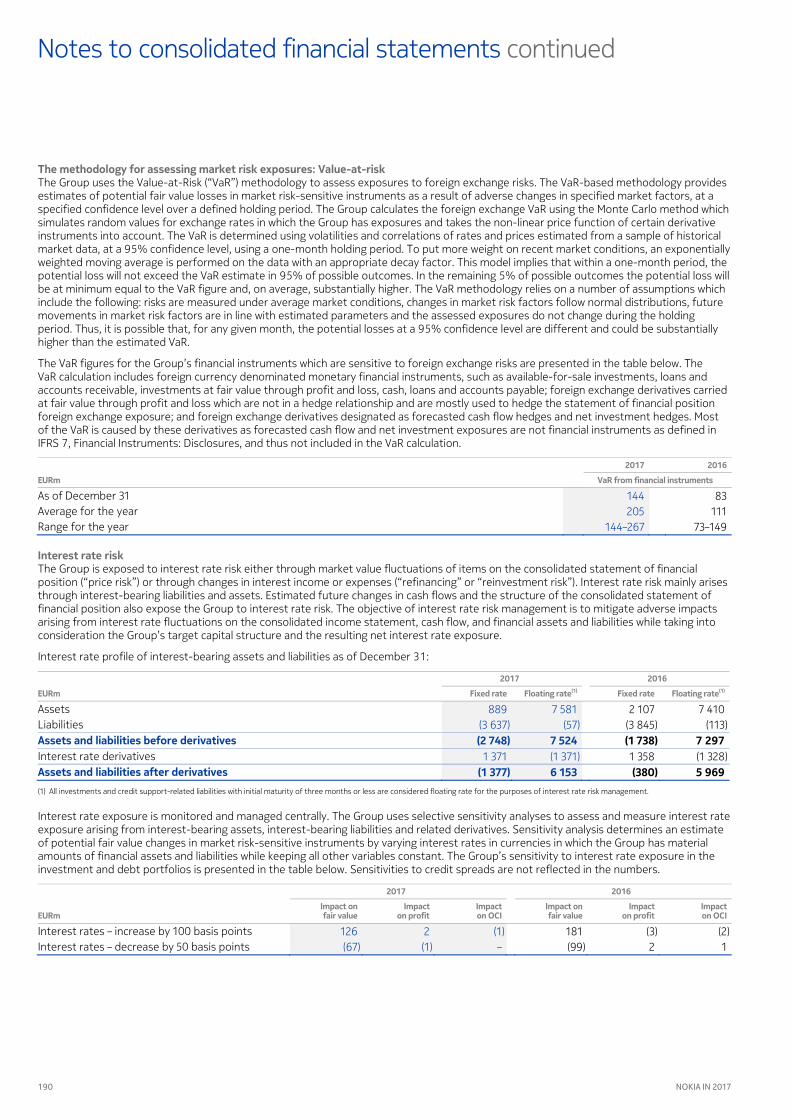
190 NOKIA IN 2017
continuedNotes to consolidated financial statements
The methodology for assessing market risk exposures: Value-at-risk The Group uses the Value-at-Risk (“VaR”) methodology to assess exposures to foreign exchange risks. The VaR-based methodology provides estimates of potential fair value losses in market risk-sensitive instruments as a result of adverse changes in specified market factors, at a specified confidence level over a defined holding period. The Group calculates the foreign exchange VaR using the Monte Carlo method which simulates random values for exchange rates in which the Group has exposures and takes the non-linear price function of certain derivative instruments into account. The VaR is determined using volatilities and correlations of rates and prices estimated from a sample of historical market data, at a % confidence level, using a one-month holding period. To put more weight on recent market conditions, an exponentially weighted moving average is performed on the data with an appropriate decay factor. This model implies that within a one-month period, the potential loss will not exceed the VaR estimate in % of possible outcomes. In the remaining % of possible outcomes the potential loss will be at minimum equal to the VaR figure and, on average, substantially higher. The VaR methodology relies on a number of assumptions which include the following: risks are measured under average market conditions, changes in market risk factors follow normal distributions, future movements in market risk factors are in line with estimated parameters and the assessed exposures do not change during the holding period. Thus, it is possible that, for any given month, the potential losses at a % confidence level are different and could be substantially higher than the estimated VaR.
The VaR figures for the Group’s financial instruments which are sensitive to foreign exchange risks are presented in the table below. The VaR calculation includes foreign currency denominated monetary financial instruments, such as available-for-sale investments, loans and accounts receivable, investments at fair value through profit and loss, cash, loans and accounts payable; foreign exchange derivatives carried at fair value through profit and loss which are not in a hedge relationship and are mostly used to hedge the statement of financial position foreign exchange exposure; and foreign exchange derivatives designated as forecasted cash flow hedges and net investment hedges. Most of the VaR is caused by these derivatives as forecasted cash flow and net investment exposures are not financial instruments as defined in IFRS , Financial Instruments: Disclosures, and thus not included in the VaR calculation.
EURm
2017 2016
VaR from financial instruments
As of December 31 83 144 Average for the year 111 205 Range for the year 73–149 144–267 Interest rate risk The Group is exposed to interest rate risk either through market value fluctuations of items on the consolidated statement of financial position (“price risk”) or through changes in interest income or expenses (“refinancing” or “reinvestment risk”). Interest rate risk mainly arises through interest-bearing liabilities and assets. Estimated future changes in cash flows and the structure of the consolidated statement of financial position also expose the Group to interest rate risk. The objective of interest rate risk management is to mitigate adverse impacts arising from interest rate fluctuations on the consolidated income statement, cash flow, and financial assets and liabilities while taking into consideration the Group’s target capital structure and the resulting net interest rate exposure.
Interest rate profile of interest-bearing assets and liabilities as of December :
2017 2016
EURm Fixed rate Floating rate (1) Fixed rate Floating rate (1)
Assets 889 2 107 7 410 7 581 Liabilities (3 637) (3 845) (113) (57) Assets and liabilities before derivatives ( ) 7 524 ( ) 7 297 Interest rate derivatives 1 371 1 358 (1 328) (1 371) Assets and liabilities after derivatives ( ) 6 153 () 5 969 (1) All investments and credit support-related liabilities with initial maturity of three months or less are considered floating rate for the purposes of interest rate risk management.
Interest rate exposure is monitored and managed centrally. The Group uses selective sensitivity analyses to assess and measure interest rate exposure arising from interest-bearing assets, interest-bearing liabilities and related derivatives. Sensitivity analysis determines an estimate of potential fair value changes in market risk-sensitive instruments by varying interest rates in currencies in which the Group has material amounts of financial assets and liabilities while keeping all other variables constant. The Group’s sensitivity to interest rate exposure in the investment and debt portfolios is presented in the table below. Sensitivities to credit spreads are not reflected in the numbers.
2017 2016
EURm Impact on fair value
Impact on profit
Impact on OCI
Impact on fair value
Impact on profit
Impact on OCI
Interest rates – increase by 100 basis points 126 2 181 (3) (2) (1) Interest rates – decrease by 50 basis points (67) (1) (99) 2 1 –
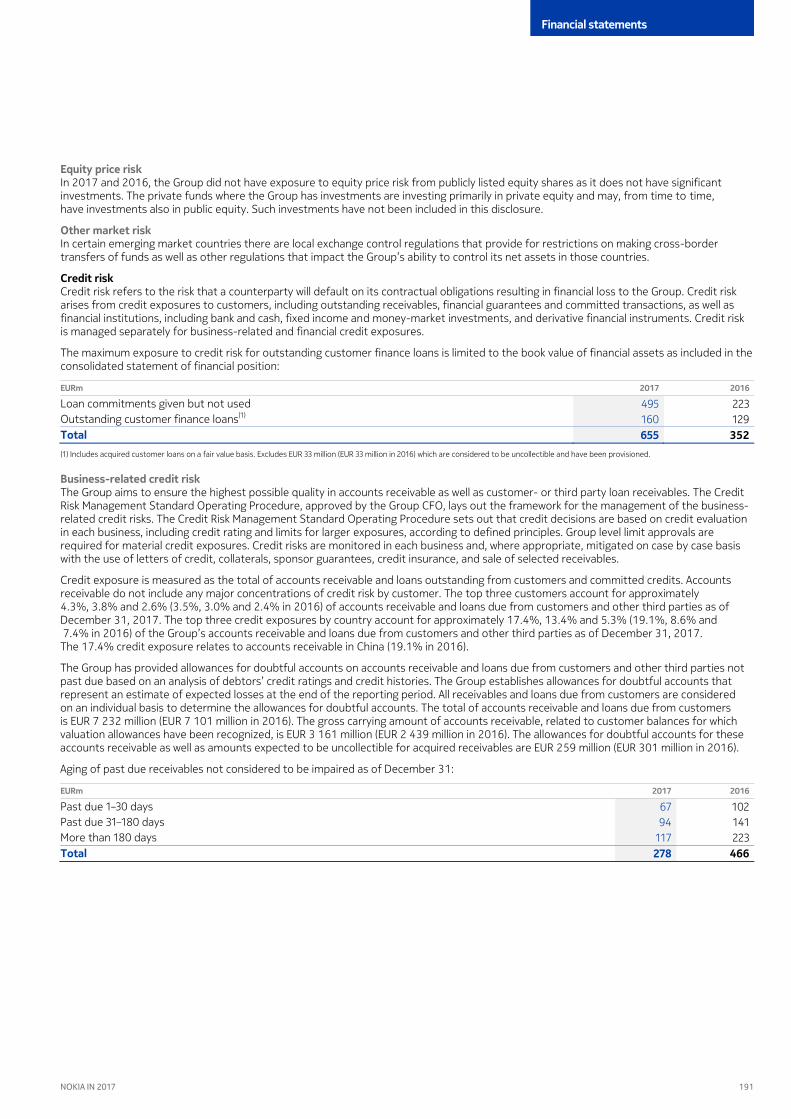
191
Financial statements
NOKIA IN 2017
Equity price risk In and , the Group did not have exposure to equity price risk from publicly listed equity shares as it does not have significant investments. The private funds where the Group has investments are investing primarily in private equity and may, from time to time, have investments also in public equity. Such investments have not been included in this disclosure.
Other market risk In certain emerging market countries there are local exchange control regulations that provide for restrictions on making cross-border transfers of funds as well as other regulations that impact the Group’s ability to control its net assets in those countries.
Credit risk Credit risk refers to the risk that a counterparty will default on its contractual obligations resulting in financial loss to the Group. Credit risk arises from credit exposures to customers, including outstanding receivables, financial guarantees and committed transactions, as well as financial institutions, including bank and cash, fixed income and money-market investments, and derivative financial instruments. Credit risk is managed separately for business-related and financial credit exposures.
The maximum exposure to credit risk for outstanding customer finance loans is limited to the book value of financial assets as included in the consolidated statement of financial position:
EURm 2017 2016
Loan commitments given but not used 223 495 Outstanding customer finance loans(1) 129 160 Total 655 352 (1) Includes acquired customer loans on a fair value basis. Excludes EUR 33 million (EUR 33 million in 2016) which are considered to be uncollectible and have been provisioned.
Business-related credit risk The Group aims to ensure the highest possible quality in accounts receivable as well as customer- or third party loan receivables. The Credit Risk Management Standard Operating Procedure, approved by the Group CFO, lays out the framework for the management of the business-related credit risks. The Credit Risk Management Standard Operating Procedure sets out that credit decisions are based on credit evaluation in each business, including credit rating and limits for larger exposures, according to defined principles. Group level limit approvals are required for material credit exposures. Credit risks are monitored in each business and, where appropriate, mitigated on case by case basis with the use of letters of credit, collaterals, sponsor guarantees, credit insurance, and sale of selected receivables.
Credit exposure is measured as the total of accounts receivable and loans outstanding from customers and committed credits. Accounts receivable do not include any major concentrations of credit risk by customer. The top three customers account for approximately .%, .% and .% (.%, .% and .% in ) of accounts receivable and loans due from customers and other third parties as of December , . The top three credit exposures by country account for approximately .%, .% and .% (.%, .% and .% in ) of the Group’s accounts receivable and loans due from customers and other third parties as of December , . The .% credit exposure relates to accounts receivable in China (.% in ).
The Group has provided allowances for doubtful accounts on accounts receivable and loans due from customers and other third parties not past due based on an analysis of debtors’ credit ratings and credit histories. The Group establishes allowances for doubtful accounts that represent an estimate of expected losses at the end of the reporting period. All receivables and loans due from customers are considered on an individual basis to determine the allowances for doubtful accounts. The total of accounts receivable and loans due from customers is EUR million (EUR million in ). The gross carrying amount of accounts receivable, related to customer balances for which valuation allowances have been recognized, is EUR million (EUR million in ). The allowances for doubtful accounts for these accounts receivable as well as amounts expected to be uncollectible for acquired receivables are EUR million (EUR million in ).
Aging of past due receivables not considered to be impaired as of December :
EURm 2017 2016
Past due 1–30 days 102 67 Past due 31–180 days 141 94 More than 180 days 223 117 Total 278 466
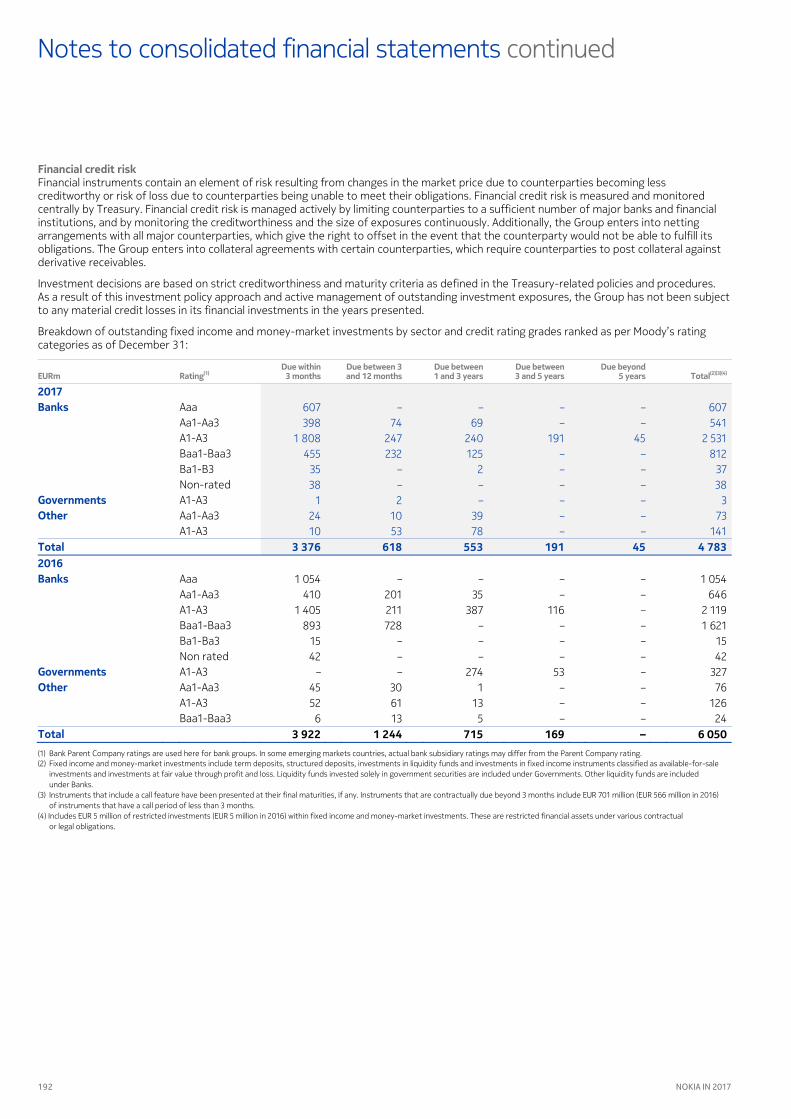
192 NOKIA IN 2017
continuedNotes to consolidated financial statements
Financial credit risk Financial instruments contain an element of risk resulting from changes in the market price due to counterparties becoming less creditworthy or risk of loss due to counterparties being unable to meet their obligations. Financial credit risk is measured and monitored centrally by Treasury. Financial credit risk is managed actively by limiting counterparties to a sufficient number of major banks and financial institutions, and by monitoring the creditworthiness and the size of exposures continuously. Additionally, the Group enters into netting arrangements with all major counterparties, which give the right to offset in the event that the counterparty would not be able to fulfill its obligations. The Group enters into collateral agreements with certain counterparties, which require counterparties to post collateral against derivative receivables.
Investment decisions are based on strict creditworthiness and maturity criteria as defined in the Treasury-related policies and procedures. As a result of this investment policy approach and active management of outstanding investment exposures, the Group has not been subject to any material credit losses in its financial investments in the years presented.
Breakdown of outstanding fixed income and money-market investments by sector and credit rating grades ranked as per Moody’s rating categories as of December :
EURm Rating(1) Due within 3 months
Due between 3 and 12 months
Due between 1 and 3 years
Due between 3 and 5 years
Due beyond 5 years Total(2)(3)(4)
2017 Banks Aaa 607 – – – –
607 Aa1-Aa3 398 74 69 – –
541
A1-A3 1 808 247 240 191 45
2 531 Baa1-Baa3 455 232 125 – –
812
Ba1-B3 35 – 2 – –
37 Non-rated 38 – – – –
Governments 38
A1-A3 1 2 – – – Other
3 Aa1-Aa3 24 10 39 – –
73
A1-A3 10 53 78 – – Total
141 3 376 618 553 191 45 4 783
2016 Banks Aaa 1 054 – – – – 1 054 Aa1-Aa3 410 201 35 – – 646 A1-A3 1 405 211 387 116 – 2 119 Baa1-Baa3 893 728 – – – 1 621 Ba1-Ba3 15 – – – – 15 Non rated 42 – – – – 42 Governments A1-A3 – – 274 53 – 327 Other Aa1-Aa3 45 30 1 – – 76 A1-A3 52 61 13 – – 126 Baa1-Baa3 6 13 5 – – 24 Total 3 922 1 244 715 169 – 6 050 (1) Bank Parent Company ratings are used here for bank groups. In some emerging markets countries, actual bank subsidiary ratings may differ from the Parent Company rating. (2) Fixed income and money-market investments include term deposits, structured deposits, investments in liquidity funds and investments in fixed income instruments classified as available-for-sale
investments and investments at fair value through profit and loss. Liquidity funds invested solely in government securities are included under Governments. Other liquidity funds are included under Banks.
(3) Instruments that include a call feature have been presented at their final maturities, if any. Instruments that are contractually due beyond 3 months include EUR 701 million (EUR 566 million in 2016) of instruments that have a call period of less than 3 months.
(4) Includes EUR 5 million of restricted investments (EUR 5 million in 2016) within fixed income and money-market investments. These are restricted financial assets under various contractual or legal obligations.

193
Financial statements
NOKIA IN 2017
% (% in ) of the Group’s cash at bank of EUR million (EUR million in ) is held with banks of investment grade credit rating.
Financial assets and liabilities subject to offsetting under enforceable master netting agreements and similar arrangements as of December :
Gross amounts of
financial assets/ (liabilities)
Gross amounts of financial liabilities/
(assets) set off in the statement of financial
position
Net amounts of financial assets/
(liabilities) presented in the statement of
financial position
Related amounts not set off in the
statement of financial position
EURm Financial instruments
assets/(liabilities) Cash collateral
received/(pledged) Net amount
2017 Derivative assets 197 – 197 135 38 Derivative liabilities
24 (268) – (268) (145) (100)
Total (23)
() – () () () 1 2016 Derivative assets 235 – 235 153 73 9 Derivative liabilities (236) – (236) (128) (96) (12) Total () – () 25 () () The financial instruments subject to enforceable master netting agreements and similar arrangements are not offset in the consolidated statement of financial position where there is no intention to settle net or realize the asset and settle the liability simultaneously.
Liquidity risk Liquidity risk is defined as financial distress or extraordinarily high financing costs arising from a shortage of liquid funds in a situation where outstanding debt needs to be refinanced or where business conditions unexpectedly deteriorate and require financing. Transactional liquidity risk is defined as the risk of executing a financial transaction below fair market value or not being able to execute the transaction at all within a specific period of time. The objective of liquidity risk management is to maintain sufficient liquidity, and to ensure that it is available fast enough without endangering its value in order to avoid uncertainty related to financial distress at all times.
The Group aims to secure sufficient liquidity at all times through efficient cash management and by investing in short-term liquid interest-bearing securities and money-market investments. Depending on its overall liquidity position, the Group may pre-finance or refinance upcoming debt maturities before contractual maturity dates. The transactional liquidity risk is minimized by entering into transactions where proper two-way quotes can be obtained from the market.
Due to the dynamic nature of the underlying business, the Group aims to maintain flexibility in funding by maintaining committed and uncommitted credit lines. As of December , committed revolving credit facilities totaled EUR million (EUR million in ).
Significant current long-term funding programs as of December , :
Issuer: Program: Issued
Nokia Corporation Euro Medium-Term Note Program, totaling EUR 5 000 million 1 250 Significant current short-term funding programs as of December , :
Issuer: Program: Issued
Nokia Corporation Local commercial paper program in Finland, totaling EUR 750 million
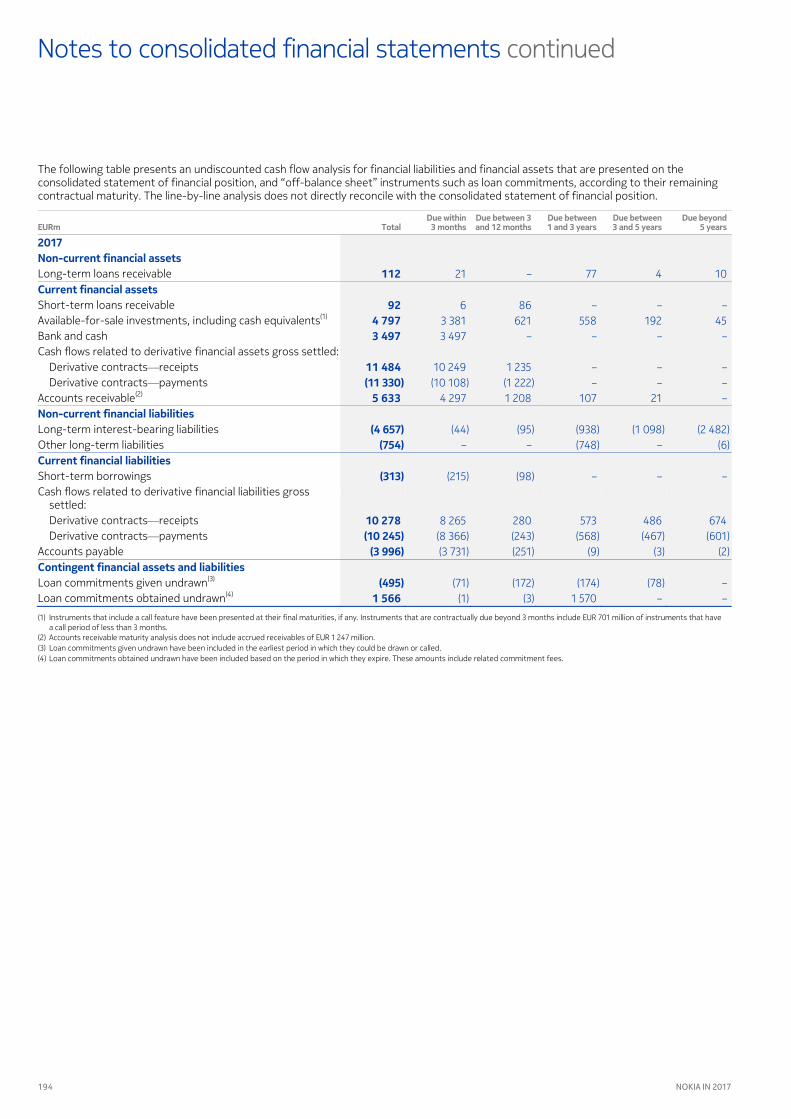
194 NOKIA IN 2017
continuedNotes to consolidated financial statements
The following table presents an undiscounted cash flow analysis for financial liabilities and financial assets that are presented on the consolidated statement of financial position, and “off-balance sheet” instruments such as loan commitments, according to their remaining contractual maturity. The line-by-line analysis does not directly reconcile with the consolidated statement of financial position.
EURm Total Due within 3 months
Due between 3 and 12 months
Due between 1 and 3 years
Due between 3 and 5 years
Due beyond 5 years
2017 Non-current financial assets Long-term loans receivable
112 21 – 77 4
Current financial assets 10
Short-term loans receivable
92 6 86 – –
Available-for-sale investments, including cash equivalents –
(1) 4 797 3 381 621 558 192 Bank and cash
45 3 497 3 497 – – –
Cash flows related to derivative –
financial assets gross settled: Derivative contracts
—receipts 11 484 10 249 1 235 – –
Derivative contracts –
—payments ( ) (10 108) (1 222) – – Accounts receivable
– (2) 5 633 4 297 1 208 107 21
Non-current financial liabilities –
Long-term interest-bearing liabilities
( ) (44) (95) (938) (1 098)
Other long-term liabilities (2 482)
() – – (748) – Current financial liabilities
(6)
Short-term borrowings
() (215) (98) – – Cash flows related to derivative financial liabilities gross
–
settled: Derivative contracts
—receipts 10 278 8 265 280 573 486
Derivative contracts 674
—payments ( ) (8 366) (243) (568) (467) Accounts payable
(601) ( ) (3 731) (251) (9) (3)
Contingent financial assets and liabilities (2)
Loan commitments given undrawn
(3) () (71) (172) (174) (78)
Loan commitments obtained undrawn –
(4) 1 566 (1) (3) 1 570 –
(1) Instruments that include a call feature have been presented at their final maturities, if any. Instruments that are contrac
–
tually due beyond 3 months include EUR 701 million of instruments that have a call period of less than 3 months.
(2) Accounts receivable maturity analysis does not include accrued receivables of EUR 1 247 million. (3) Loan commitments given undrawn have been included in the earliest period in which they could be drawn or called. (4) Loan commitments obtained undrawn have been included based on the period in which they expire. These amounts include related commitment fees.
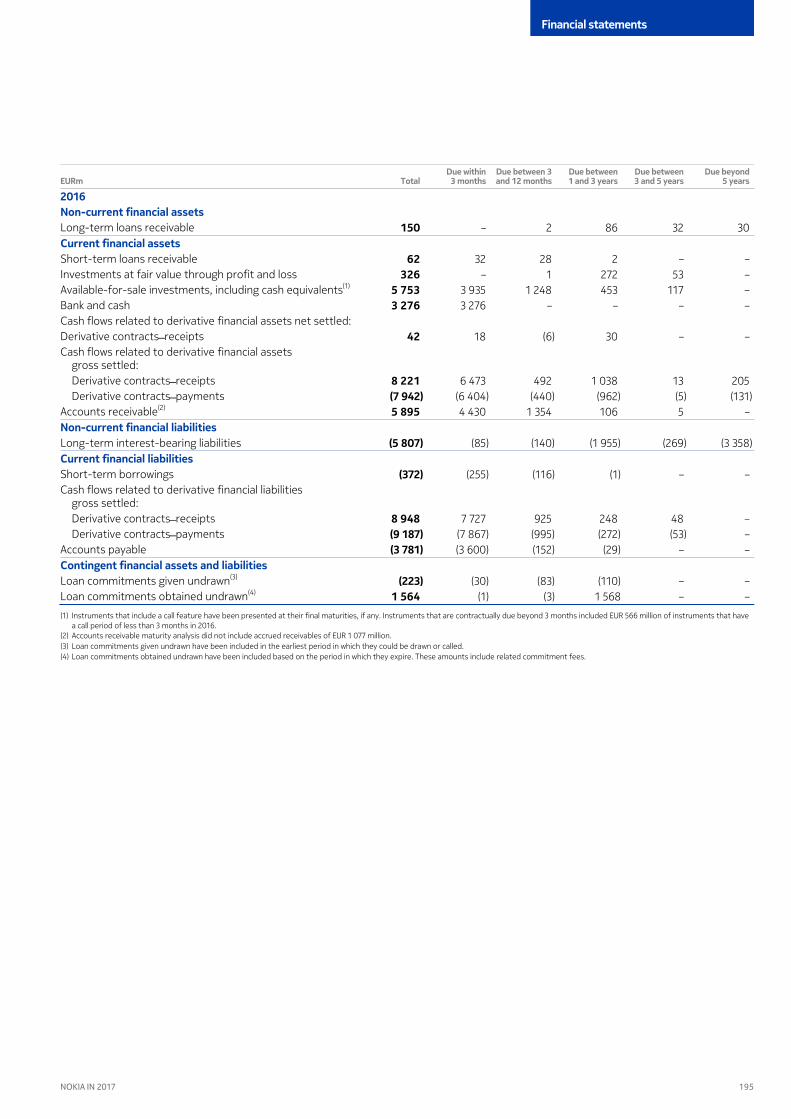
195
Financial statements
NOKIA IN 2017
EURm Total Due within 3 months
Due between 3 and 12 months
Due between 1 and 3 years
Due between 3 and 5 years
Due beyond 5 years
2016 Non-current financial assets Long-term loans receivable 150 – 2 86 32 30 Current financial assets Short-term loans receivable 62 32 28 2 – – Investments at fair value through profit and loss 326 – 1 272 53 – Available-for-sale investments, including cash equivalents(1) 5 753 3 935 1 248 453 117 – Bank and cash 3 276 3 276 – – – – Cash flows related to derivative financial assets net settled: Derivative contracts ̶ receipts 42 18 (6) 30 – – Cash flows related to derivative financial assets
gross settled: Derivative contracts ̶ receipts 8 221 6 473 492 1 038 13 205 Derivative contracts ̶ payments ( ) (6 404) (440) (962) (5) (131)
Accounts receivable(2) 5 895 4 430 1 354 106 5 – Non-current financial liabilities Long-term interest-bearing liabilities ( ) (85) (140) (1 955) (269) (3 358) Current financial liabilities Short-term borrowings () (255) (116) (1) – – Cash flows related to derivative financial liabilities
gross settled: Derivative contracts ̶ receipts 8 948 7 727 925 248 48 – Derivative contracts ̶ payments ( ) (7 867) (995) (272) (53) –
Accounts payable ( ) (3 600) (152) (29) – – Contingent financial assets and liabilities Loan commitments given undrawn(3) () (30) (83) (110) – – Loan commitments obtained undrawn(4) 1 564 (1) (3) 1 568 – –
(1) Instruments that include a call feature have been presented at their final maturities, if any. Instruments that are contractually due beyond 3 months included EUR 566 million of instruments that have a call period of less than 3 months in 2016.
(2) Accounts receivable maturity analysis did not include accrued receivables of EUR 1 077 million. (3) Loan commitments given undrawn have been included in the earliest period in which they could be drawn or called. (4) Loan commitments obtained undrawn have been included based on the period in which they expire. These amounts include related commitment fees.
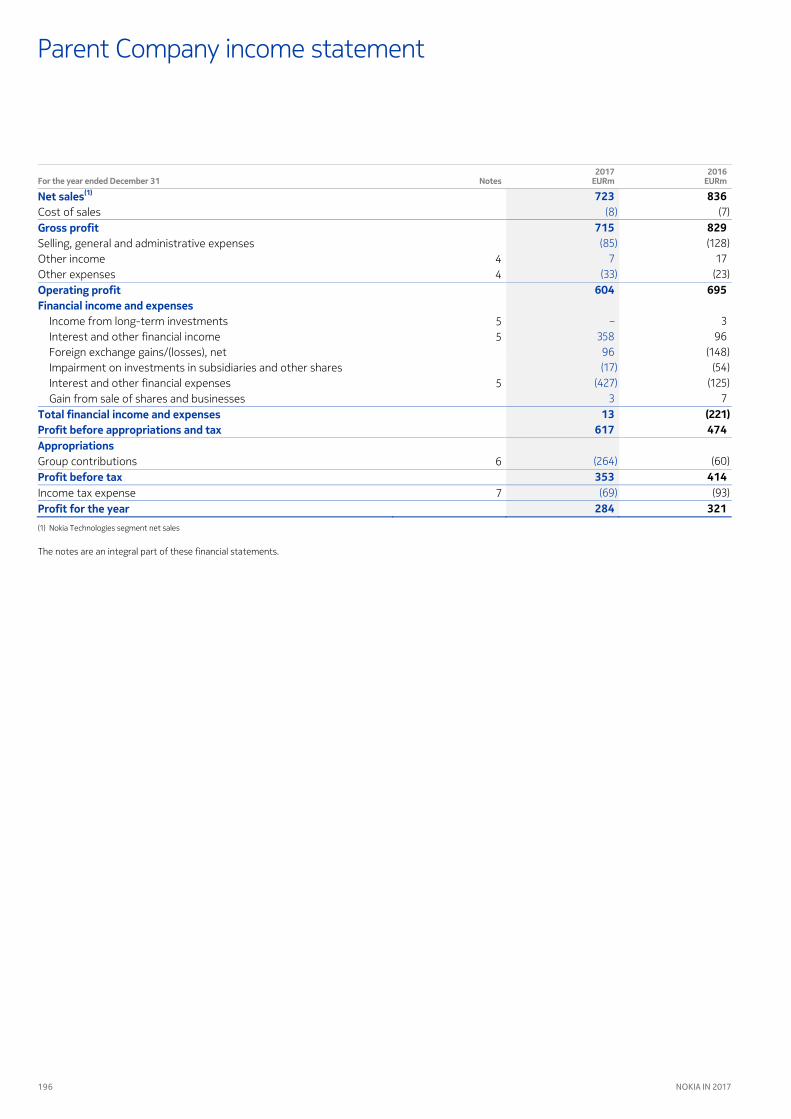
196
For the year ended December 31 Notes 2017
EURm 2016
EURm
836 Cost of sales (7)
829 Selling, general and administrative expenses (28) Other income 4 7 Other expenses 4 (23)
695
Income from long-term investments 5 3 Interest and other financial income 5 Foreign exchange gains/(losses), net (48) Impairment on investments in subsidiaries and other shares (54) Interest and other financial expenses 5 (25) Gain from sale of shares and businesses 7
() 474
Group contributions (0) 414
Income tax expense 7 (3) 321
() Nokia Technologies segment net sales
The notes are an integral part of these financial statements.
Parent Company income statement
Net sales() 723 (8)
Gross profit 715 (85)
7 (33)
Operating profit 604 Financial income and expenses
– 358 (7)
(427) 3
Total financial income and expenses 13 Profit before appropriations and tax 617 Appropriations
(24) Profit before tax 353
() Profit for the year 284
196 NOKIA IN 2017
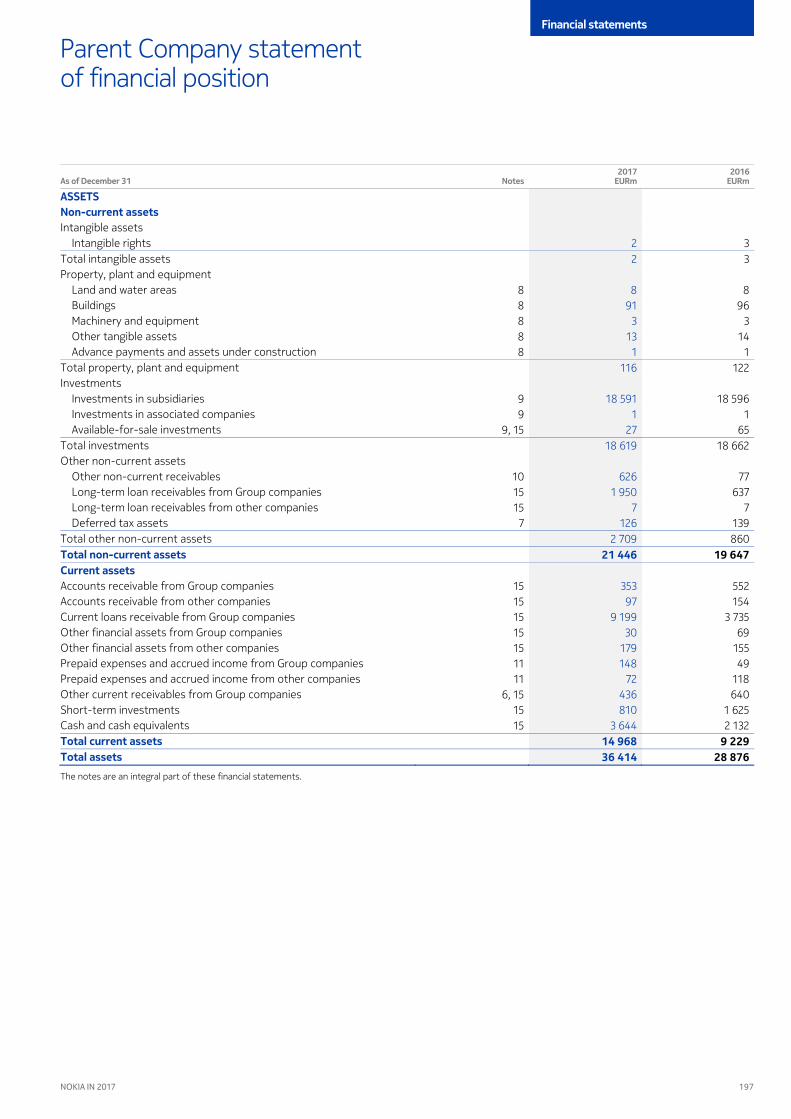
19
As of December 31 Notes 2017
EURm 2016
EURm
Intangible assets Intangible rights 3
Total intangible assets 3 Property, plant and equipment
Land and water areas 8 8 Buildings 8 Machinery and equipment 8 3 Other tangible assets 8 4 Advance payments and assets under construction 8
Total property, plant and equipment 22 Investments
Investments in subsidiaries 8 5 Investments in associated companies Available-for-sale investments , 5 5
Total investments 8 2 Other non-current assets
Other non-current receivables 0 77 Long-term loan receivables from Group companies 5 37 Long-term loan receivables from other companies 5 7 Deferred tax assets 7 3
Total other non-current assets 80 19 647
Accounts receivable from Group companies 5 552 Accounts receivable from other companies 5 54 Current loans receivable from Group companies 5 3 735 Other financial assets from Group companies 5 Other financial assets from other companies 5 55 Prepaid expenses and accrued income from Group companies 4 Prepaid expenses and accrued income from other companies 8 Other current receivables from Group companies , 5 40 Short-term investments 5 25 Cash and cash equivalents 5 2 32
9 229 28 876
The notes are an integral part of these financial statements.
Parent Company statement of financial position
ASSETS Non-current assets
2 2
8
3 3
8 5
27 8
2
50 7
2 2 70
Total non-current assets 21 446 Current assets
353 7
30
7 48
72 43 80
3 44 Total current assets 14 968 Total assets 36 414
197
Financial statements
NOKIA IN 2017
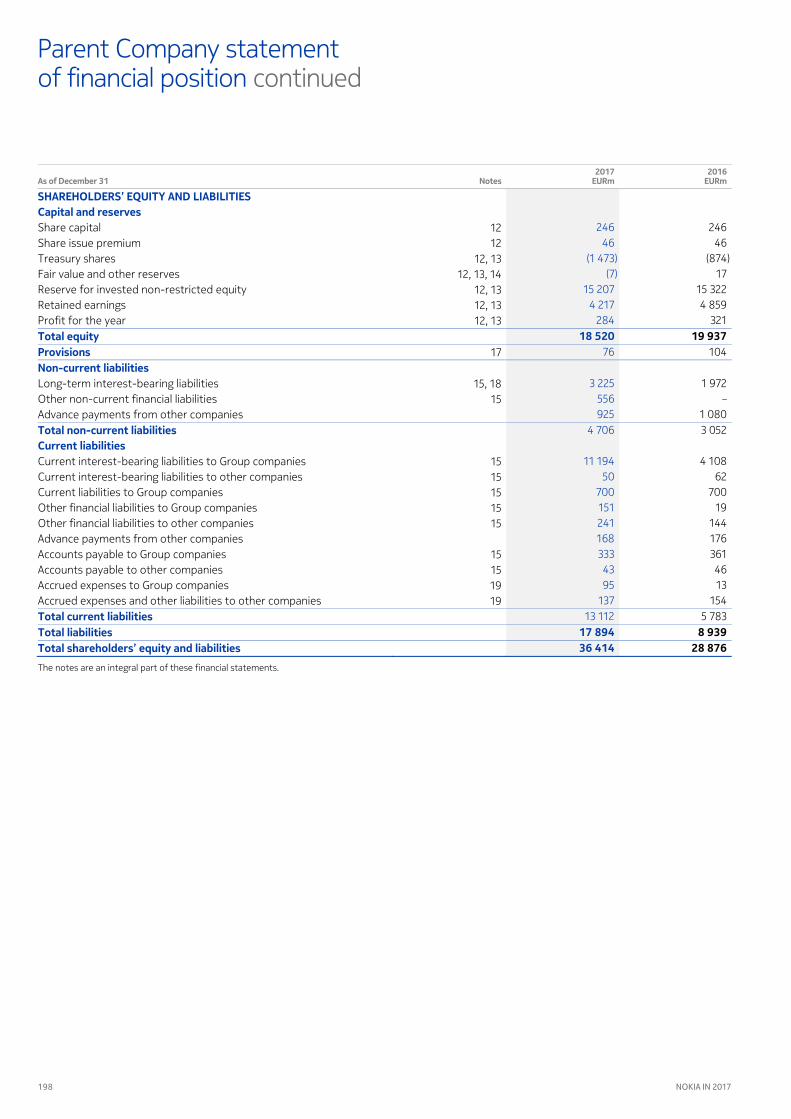
continued
19
As of December 31 Notes 2017
EURm 2016
EURm
Share capital 2 24 Share issue premium 2 4 Treasury shares 2, 3 (874) Fair value and other reserves 2, 3, 4 7 Reserve for invested non-restricted equity 2, 3 5 322 Retained earnings 2, 3 4 85 Profit for the year 2, 3 32
19 937 7 04
Long-term interest-bearing liabilities 5, 8 72 Other non-current financial liabilities 5 – Advance payments from other companies 080
3 052
Current interest-bearing liabilities to Group companies 5 4 08 Current interest-bearing liabilities to other companies 5 2 Current liabilities to Group companies 5 700 Other financial liabilities to Group companies 5 Other financial liabilities to other companies 5 44 Advance payments from other companies 7 Accounts payable to Group companies 5 3 Accounts payable to other companies 5 4 Accrued expenses to Group companies 3 Accrued expenses and other liabilities to other companies 54
5 783 8 939 28 876
The notes are an integral part of these financial statements.
Parent Company statement of financial position
SHAREHOLDERS’ EQUITY AND LIABILITIES Capital and reserves
24 4
( 473) (7)
5 207 4 27
284 Total equity 18 520 Provisions 7 Non-current liabilities
3 225 55 25
Total non-current liabilities 4 70 Current liabilities
4 50
700 5
24 8
333 43
5 37
Total current liabilities 3 2 Total liabilities 17 894 Total shareholders’ equity and liabilities 36 414
198 NOKIA IN 2017

199
For the year ended December 31 Notes 2017
EURm 2016
EURm
Profit for the year 32 Adjustments, total 22 40 Change in net working capital 22 () Cash from operations 570 Interest received 70 Interest paid (5) Other financial income and expenses, net paid (2) Income taxes, net paid (83)
246
Purchases of shares in subsidiary companies and available-for-sale investments (4) Purchases of property, plant and equipment and intangible assets () Proceeds from/(payments of) disposal of shares and business (2) Proceeds from sale of property, plant and equipment and other intangible assets Payments of other long-term receivables (44) (Payments of)/proceeds from short-term receivables 438 Dividends received and other proceeds from Group companies 3 Purchase of short-term investments, liquid assets (3 43) Proceeds from short-term investments, liquid assets 4 74
347
Purchase of treasury shares (2) Stock option exercise 3 Proceeds from/(payments of) long-term borrowings () Proceeds from/(payments of) short-term borrowings (2 84) Dividends paid ( 503) Group contributions 82
( ) ( )
Cash and cash equivalents as of January 033 2 132
The notes are an integral part of these financial statements.
Parent Company statement of cash flows
Cash flow from operating activities 284 388 (455) 27 07
() (2) (48)
Net cash (used in)/from operating activities () Cash flow from investing activities
() (2)
2 –
( 33) (4 04)
– (2 28) 3 48
Net cash (used in)/from investing activities ( ) Cash flow from financing activities
(785)
7 304 03 (3) (0)
Net cash from/(used in) financing activities 7 400 Net increase/(decrease) in cash and cash equivalents 1 512
2 32 Cash and cash equivalents as of December 3 644
199
Financial statements
NOKIA IN 2017
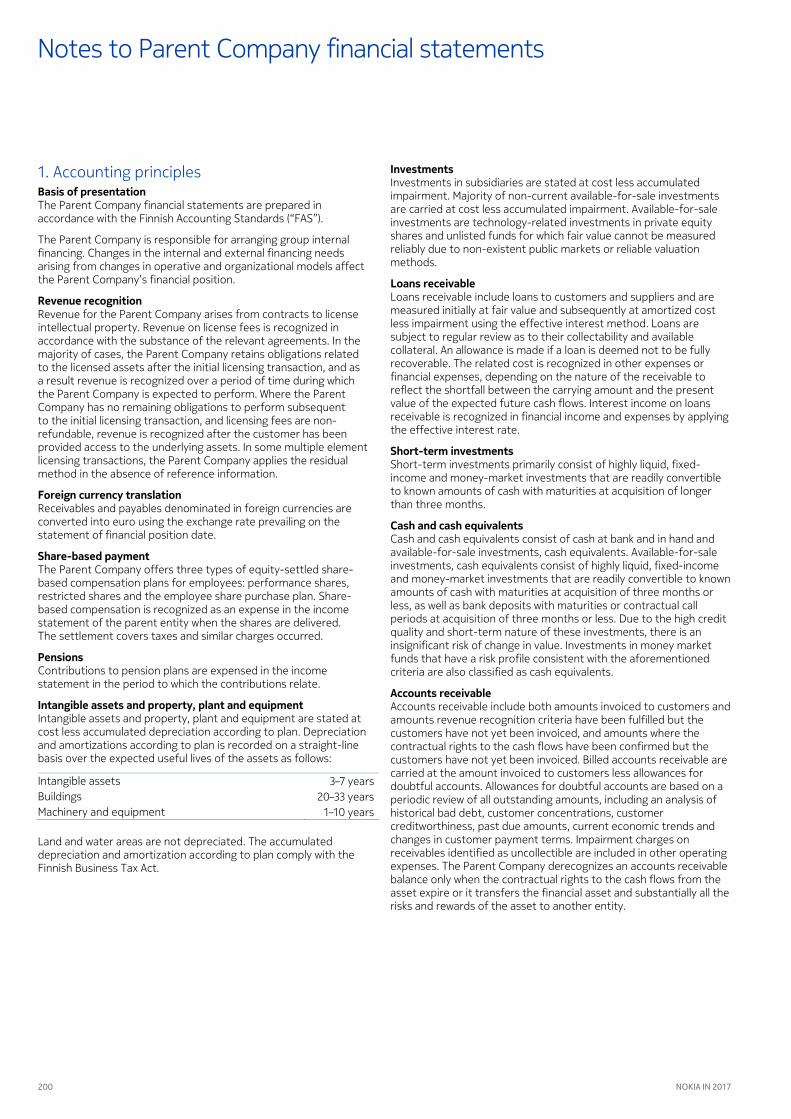
Notes to Parent Company financial statements
. Accounting principles Basis of presentation The Parent Company financial statements are prepared in accordance with the Finnish Accounting Standards (“FAS”).
The Parent Company is responsible for arranging group internal financing. Changes in the internal and external financing needs arising from changes in operative and organizational models affect the Parent Company’s financial position.
Revenue recognition Revenue for the Parent Company arises from contracts to license intellectual property. Revenue on license fees is recognized in accordance with the substance of the relevant agreements. In the majority of cases, the Parent Company retains obligations related to the licensed assets after the initial licensing transaction, and as a result revenue is recognized over a period of time during which the Parent Company is expected to perform. Where the Parent Company has no remaining obligations to perform subsequent to the initial licensing transaction, and licensing fees are non-refundable, revenue is recognized after the customer has been provided access to the underlying assets. In some multiple element licensing transactions, the Parent Company applies the residual method in the absence of reference information.
Foreign currency translation Receivables and payables denominated in foreign currencies are converted into euro using the exchange rate prevailing on the statement of financial position date.
Share-based payment The Parent Company offers three types of equity-settled share-based compensation plans for employees: performance shares, restricted shares and the employee share purchase plan. Share-based compensation is recognized as an expense in the income statement of the parent entity when the shares are delivered. The settlement covers taxes and similar charges occurred.
Pensions Contributions to pension plans are expensed in the income statement in the period to which the contributions relate.
Intangible assets and property, plant and equipment Intangible assets and property, plant and equipment are stated at cost less accumulated depreciation according to plan. Depreciation and amortizations according to plan is recorded on a straight-line basis over the expected useful lives of the assets as follows:
Intangible assets 3–7 years Buildings 20–33 years Machinery and equipment –0 years
Land and water areas are not depreciated. The accumulated depreciation and amortization according to plan comply with the Finnish Business Tax Act.
Investments Investments in subsidiaries are stated at cost less accumulated impairment. Majority of non-current available-for-sale investments are carried at cost less accumulated impairment. Available-for-sale investments are technology-related investments in private equity shares and unlisted funds for which fair value cannot be measured reliably due to non-existent public markets or reliable valuation methods.
Loans receivable Loans receivable include loans to customers and suppliers and are measured initially at fair value and subsequently at amortized cost less impairment using the effective interest method. Loans are subject to regular review as to their collectability and available collateral. An allowance is made if a loan is deemed not to be fully recoverable. The related cost is recognized in other expenses or financial expenses, depending on the nature of the receivable to reflect the shortfall between the carrying amount and the present value of the expected future cash flows. Interest income on loans receivable is recognized in financial income and expenses by applying the effective interest rate.
Short-term investments Short-term investments primarily consist of highly liquid, fixed-income and money-market investments that are readily convertible to known amounts of cash with maturities at acquisition of longer than three months.
Cash and cash equivalents Cash and cash equivalents consist of cash at bank and in hand and available-for-sale investments, cash equivalents. Available-for-sale investments, cash equivalents consist of highly liquid, fixed-income and money-market investments that are readily convertible to known amounts of cash with maturities at acquisition of three months or less, as well as bank deposits with maturities or contractual call periods at acquisition of three months or less. Due to the high credit quality and short-term nature of these investments, there is an insignificant risk of change in value. Investments in money market funds that have a risk profile consistent with the aforementioned criteria are also classified as cash equivalents.
Accounts receivable Accounts receivable include both amounts invoiced to customers and amounts revenue recognition criteria have been fulfilled but the customers have not yet been invoiced, and amounts where the contractual rights to the cash flows have been confirmed but the customers have not yet been invoiced. Billed accounts receivable are carried at the amount invoiced to customers less allowances for doubtful accounts. Allowances for doubtful accounts are based on a periodic review of all outstanding amounts, including an analysis of historical bad debt, customer concentrations, customer creditworthiness, past due amounts, current economic trends and changes in customer payment terms. Impairment charges on receivables identified as uncollectible are included in other operating expenses. The Parent Company derecognizes an accounts receivable balance only when the contractual rights to the cash flows from the asset expire or it transfers the financial asset and substantially all the risks and rewards of the asset to another entity.
200 NOKIA IN 2017
1
Loans payable Loans payable are recognized at nominal value. Transaction costs are initially recognized as accruals and amortized over the life of the instrument. Transaction cost and loan interest are recognized in the income statement as financial expenses over the life of the instrument.
Accounts payable Accounts payable are carried at invoiced amount which is considered to be the fair value due to the short-term nature of the Parent Company’s accounts payable.
Derivative financial instruments Interest income or expense on interest rate derivatives is accrued in the income statement during the financial year. In the financial statements, outstanding interest rate forward contracts, interest rate future contracts, interest rate option contracts and interest rate swap contracts are stated at market values and included in the income statement.
Forward foreign exchange contracts are valued using the forward exchange rate of the statement of financial position date. The exchange differences arising from outstanding derivative contracts are reported in financial income and expenses. Foreign exchange option contracts are valued using an option valuation model on the statement of financial position date and reported in financial income and expense. For derivatives not designated under hedge accounting but hedging identifiable exposures such as anticipated foreign currency denominated sales and purchases, the gains and losses are recognized in other income or expenses.
Fair values of forward rate agreements, interest rate options, futures contracts and exchange traded options are calculated based on quoted market rates at each statement of financial position date. Discounted cash flow analyses are used to value interest rate and cross-currency interest rate swaps.
Hedge accounting The Parent Company applies hedge accounting on certain forward foreign exchange contracts, certain options or option strategies, and certain interest rate derivatives. Qualifying options and option strategies have zero net premium or a net premium paid. For option structures, the critical terms of the bought and sold options are the same and the nominal amount of the sold option component is no greater than that of the bought option.
Fair value hedges The Parent Company applies fair value hedge accounting to reduce exposure to fair value fluctuations of interest-bearing liabilities due to changes in interest rates and foreign exchange rates. Changes in the fair value of derivatives designated and qualifying as fair value hedges, together with any changes in the fair value of hedged liabilities attributable to the hedged risk, are recognized in financial income and expenses. If the hedged item no longer meets the criteria for hedge accounting, hedge accounting ceases and any fair value adjustments made to the carrying amount of the hedged item while the hedge was effective are recognized in financial income and expenses based on the effective interest method.
Deferred tax Deferred tax liabilities and deferred tax assets are calculated for temporary differences between book values and tax bases using an enacted or substantively enacted tax rate at each statement of financial position date that are expected to apply in the period when the asset is realized or the liability is settled. Non-current and current deferred tax liabilities and deferred tax assets are presented separately on statement of financial position. Deferred tax assets are recognized at the probable amount estimated to be received. Deferred tax assets and deferred tax liabilities are offset for presentation purposes, because the Parent Company has a legally enforceable right to set off current tax assets against current tax liabilities.
201
Financial statements
NOKIA IN 2017
continued
Notes to Parent Company financial statements
EURm
2017 2016
2. Personnel expenses
Salaries and wages 47 Share-based payment expense
3 28
Pension expense 4 20
Other social expenses 2 5
81
Average number of employees
Total
2017 2016
57
Marketing 70 Administration
7 2 77
281 Total average 273
248 As of December
Management compensation Refer to Note
235
, Related party transactions in the consolidated financial statements.
EURm 2017 2016
3. Auditor’s fees
Audit of financial statements 4 4 4
In
Total
1
4
, PricewaterhouseCoopers Oy provided non-audit services to Group entities in total for EUR 1 9 thousand. These services included auditors’ statements of EUR 6 thousand and other services of EUR 1 thousand.
Total annual group fees paid to the auditor are EUR million in 1 (EUR million in 16), including audit fees of EUR million (EUR 1 million in 16).
EURm 2017 2016
4. Other income and expenses
Other income Rental income
2
Interest income from customer receivables and overdue payments 2
4 Other
5 –
17 Total
7 Other expenses Foreign exchange loss on hedging forecasted sales and purchases
–
Divestment-related expenses ( (2)
0) Other
(3) (3) (8) () Total
()
202 NOKIA IN 2017

EURm 2017 2016
5. Financial income and expenses
Dividend income from Group companies Income from long-term investments
3 3
– Total
–
Interest and other financial income Interest income from Group companies
55
Interest income from other companies 30
Other financial income from other companies
40 96
48 Total
358
Interest and other financial expenses Interest expenses to Group companies
(0)
Interest expenses to other companies (7)
(73) Other financial expenses (42)
(320)
( (3)
) Total
Financial income and expenses includes EUR
()
million expenses for derivative financial instruments designated in hedge accounting relationships (EUR 1 million in 16) and EUR million income for liabilities under fair value hedge accounting (EUR 11 million in 16).
EURm 2017 2016
Granted
. Group contributions
(700) Received
(700) 40 43 () Total
EURm 2017 2016
()
Current tax
7. Income taxes
(5) Deferred tax
(43) (28) (
(2) ) Total
Income tax from operations ()
(3) (3) Income tax from appropriations 2 Income tax relating to previous financial years
53 (2) () Total
Deferred taxes
()
2017 2016
EURm Deferred tax assets Deferred tax liabilities Deferred tax assets Deferred tax liabilities
146 (Total before netting ) 132 Netting of deferred tax assets and liabilities
() (7) 7 ()
139 – Total after netting 126 –
203
Financial statements
NOKIA IN 2017

continued
Notes to Parent Company financial statements
EURm
Land and water areas Buildings
8. Property, plant and equipment
Machinery and equipment
Other tangible assets
Advance payments and
assets under construction Total
Acquisition cost as of January , 20 8 5 2 5 204 Additions – 4 – – – 4 Disposals and retirements – () () – – (2)
8 162 20 15 1 206 Accumulated depreciation as of January , 20Acquisition cost as of December ,
– () (8) – – (7) Disposals and retirements – – – – Depreciation() – (5) – () – ()
– () (Accumulated depreciation as of December , ) () – () Net book value as of January , 20 8 8 3 5 25
8 96 3 14 1 122 Acquisition cost as of January , 20Net book value as of December ,
7 8 2 20 5 20 Additions – – – Disposals and retirements
2 – () () –
Reclassifications – (2)
– – – () – Acquisition cost as of December , 8 163 19 15 Accumulated depreciation as of January
1 , 20
206 7 – () (7) ()
Disposals and retirements – (84)
– – – Depreciation(
– )
– () – () – (7)
Accumulated depreciation as of December , – () () () Net book value as of January
– , 20
() 7 8 3 4 22
Net book value as of December , 8 91 3 13 (
1 ) Recognized in selling, general and administrative expenses.
EURm
116
2017 2016
. Investments
Investments in subsidiaries Net carrying amount as of January 2 8 5 2 Additions() (2) 2 304 Disposals
2 30 () –
18 596 (2 34)
Net carrying amount as of December
18 591 Investments in associated companies Net carrying amount as of January
3
Impairment charges
(2) 1
– Net carrying amount as of December
1
Available-for-sale investments Net carrying amount as of January
32
Additions 5
5 Impairment charges
– ()
Other changes (7)
3 Disposals
– () (2)
65 (
Net carrying amount as of December ) In 20
27 7, additions and disposals relate to share transactions made to optimize the legal structure of the Group following the acquisition of Alcatel Lucent in 20.
(2) In 20, the Parent Company acquired 00% of the shares in Alcatel Lucent SA, a parent company to the Alcatel Lucent Group, partially through a share exchange and partially in cash.
Investments in associated companies
Associated company Ownership
% Carrying amount
EURm
Sapura-Nokia Telecommunication Sdn Bhd 40 – Noksel A.S 20 Sapura Nokia Software Sdn Bhd 50 –
204 NOKIA IN 2017

EURm
2017 2016
Expected future cash settlement to acquire no
0. Other non-current receivables
n-controlling interest in Nokia Shanghai Bell() – Other
55 77 77
70
(
Total ) Refer to Note 33, Significant partly-owned subs
626 idiaries in the consolidated financial statements.
EURm 2017 2016
Prepaid and accrued royalty income
. Prepaid expenses and accrued income
08 7 Divestment-related receivables 44 Accrued interest
3 0
Other from Group companies 2
2 Other from other companies
25 3
167 0
EURm Share capital
Total
Share issue premium
220
Treasury
2. Shareholders’ equity
shares
Fair value and other reserves
Reserve for invested
non-restricted equity
Retained earnings Total
246 46 () 25 3 805 6 362 9 773 As of January , Settlement of performance and restricted shares – – 8 – (52) – Stock options exercised – – – – 3 – 3 Acquisition of treasury shares – – (23) – – – (23) Acquisition of Alcatel Lucent shares – – – – 5 – 5 Fair value reserve, decrease – – – (8) – – (8) Dividends – – – – – ( 503) ( 503) Profit for the year – – – – – 32 32
246 46 () 17 15 322 5 180 19 937 Settlement of performance As of December ,
and restricted shares – – 70 – () – 54 Stock options exercised – – – – Acquisition of treasury shares
– – – (7) – –
Fair value reserve, decrease – (7)
– – – (24) – Dividends
– (24) – – – – –
Profit for the year (3) (3)
– – – – – 284 284 As of December , 246 46 ( ) () 15 207 4 501 18 520
205
Financial statements
NOKIA IN 2017

continuedNotes to Parent Company financial statements
6
EURm
3. Distributable earnings 2017 2016
Reserve for invested non-restricted equity 5 207 5 322 Retained earnings 4 85 4 27 Profit for the year 32 284 Non-restricted equity 20 502 19 708 Treasury shares (874) ( 473) Fair value and other reserves – (7) Total 19 628 18 229
4. Fair value and other reserves Hedging reserve Available for sale investments Total
EURm Gross Tax Net Gross Tax Net Gross Tax Net
As of January , 9 () 7 22 () 18 31 () 25 Cash flow hedges
Net fair value losses () – () – – – () – () Available-for-sale investments
Net fair value losses – – – () – () – Transfer to income statement on disposal – – – () 2 (7) () 2 (7)
As of December , 8 () 6 12 () 11 20 () 17 Cash flow hedges
Net fair value losses (2) 5 () – – – (2) 5
() Available-for-sale investments Net fair value losses
– – – (4) () (5) (4) ()
Transfer to income statement on disposal (5)
– – – (4) (3) (4)
(3) As of December , () 3 () 4 () 3 () 2
()
206 NOKIA IN 2017
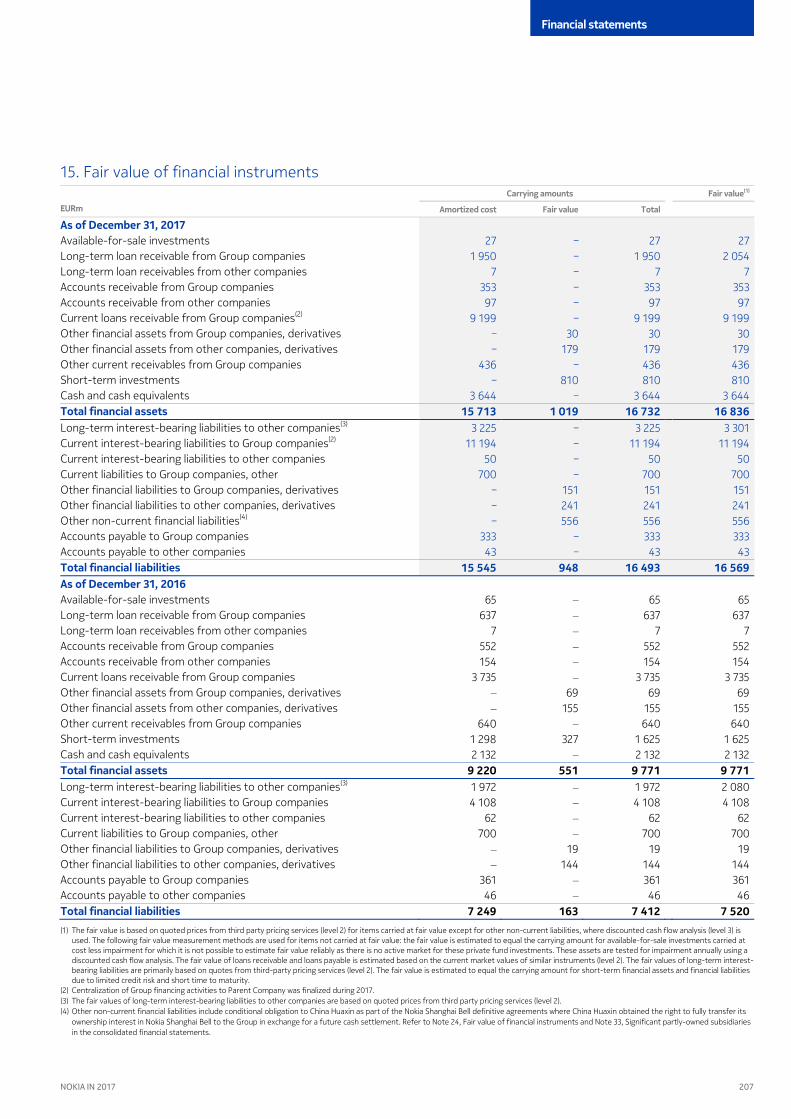
Carrying amounts Fair value(1)
5. Fair value of financial instruments
EURm Amortized cost Fair value Total
As of December , Available-for-sale investments
27 ‒ 27
Long-term loan receivable from Group companies 27
50 ‒ 50 Long-term loan receivables from other companies
2 054 7 ‒ 7
Accounts receivable from Group companies 7
353 ‒ 353 Accounts receivable fr
om other companies
353 7 ‒ 7
Current loans receivable from Group companies
(2) 7
‒ Other financial assets from
Group companies, derivatives
‒ 30 30
Other financial assets from
other companies, derivatives 30
‒ 7 7 Other current receivables
from Group companies
7 43 ‒ 43
Short-term investments 43
‒ 80 80 Cash and cash equivalents
80 3 44 ‒ 3 44 3 44
Total financial assets 15 713 1 019 16 732 Long-term interest-bearing liabilities to other companies
(3)
16 836 3 225 ‒ 3 225 3 30
Current interest-bearing liabilities to Group companies(2) 4 ‒ 4 Current interest-bearing liabilities to other companies
4 50 ‒ 50
Current liabilities to Group companies, other 50
700 ‒ 700 Other financial liabilities to Group companies, derivatives
700 ‒ 5 5
Other financial liabilities to other companies, derivatives 5
‒ 24 24 Other non-current fi
nancial liabilities(4)
24 ‒ 55 55
Accounts payable to Group companies 55
333 ‒ 333 Accounts payable to
other companies
333 43 ‒ 43 43
Total financial liabilities 15 545 948 16 493
Available-for-sale investments
16 569 As of December ,
5 ‒ 5 5 Long-term loan receivable from Group companies 37 ‒ 37 37 Long-term loan receivables from other companies 7 ‒ 7 7 Accounts receivable from Group companies 552 ‒ 552 552 Accounts receivable from other companies 54 ‒ 54 54 Current loans receivable from Group companies 3 735 ‒ 3 735 3 735 Other financial assets from Group companies, derivatives ‒ Other financial assets from other companies, derivatives ‒ 55 55 55 Other current receivables from Group companies 40 ‒ 40 40 Short-term investments 28 327 25 25 Cash and cash equivalents 2 32 ‒ 2 32 2 32
9 220 551 9 771 9 771 Long-term interest-bearing liabilities to other companies(3)Total financial assets
72 ‒ 72 2 080 Current interest-bearing liabilities to Group companies 4 08 ‒ 4 08 4 08 Current interest-bearing liabilities to other companies 2 ‒ 2 2 Current liabilities to Group companies, other 700 ‒ 700 700 Other financial liabilities to Group companies, derivatives ‒ Other financial liabilities to other companies, derivatives ‒ 44 44 44 Accounts payable to Group companies 3 ‒ 3 3 Accounts payable to other companies 4 ‒ 4 4
7 249 163 7 412 7 520 (
Total financial liabilities ) The fair value is based on quoted prices from third party pricing services (level 2) for items carried at fair value except for other non-current liabilities, where discounted cash flow analysis (level 3) is
used. The following fair value measurement methods are used for items not carried at fair value: the fair value is estimated to equal the carrying amount for available-for-sale investments carried at cost less impairment for which it is not possible to estimate fair value reliably as there is no active market for these private fund investments. These assets are tested for impairment annually using a discounted cash flow analysis. The fair value of loans receivable and loans payable is estimated based on the current market values of similar instruments (level 2). The fair values of long-term interest-bearing liabilities are primarily based on quotes from third-party pricing services (level 2). The fair value is estimated to equal the carrying amount for short-term financial assets and financial liabilities due to limited credit risk and short time to maturity.
(2) Centralization of Group financing activities to Parent Company was finalized during 207. (3) The fair values of long-term interest-bearing liabilities to other companies are based on quoted prices from third party pricing services (level 2). (4) Other non-current financial liabilities include conditional obligation to China Huaxin as part of the Nokia Shanghai Bell definitive agreements where China Huaxin obtained the right to fully transfer its
ownership interest in Nokia Shanghai Bell to the Group in exchange for a future cash settlement. Refer to Note 24, Fair value of financial instruments and Note 33, Significant partly-owned subsidiaries in the consolidated financial statements.
207
Financial statements
NOKIA IN 2017
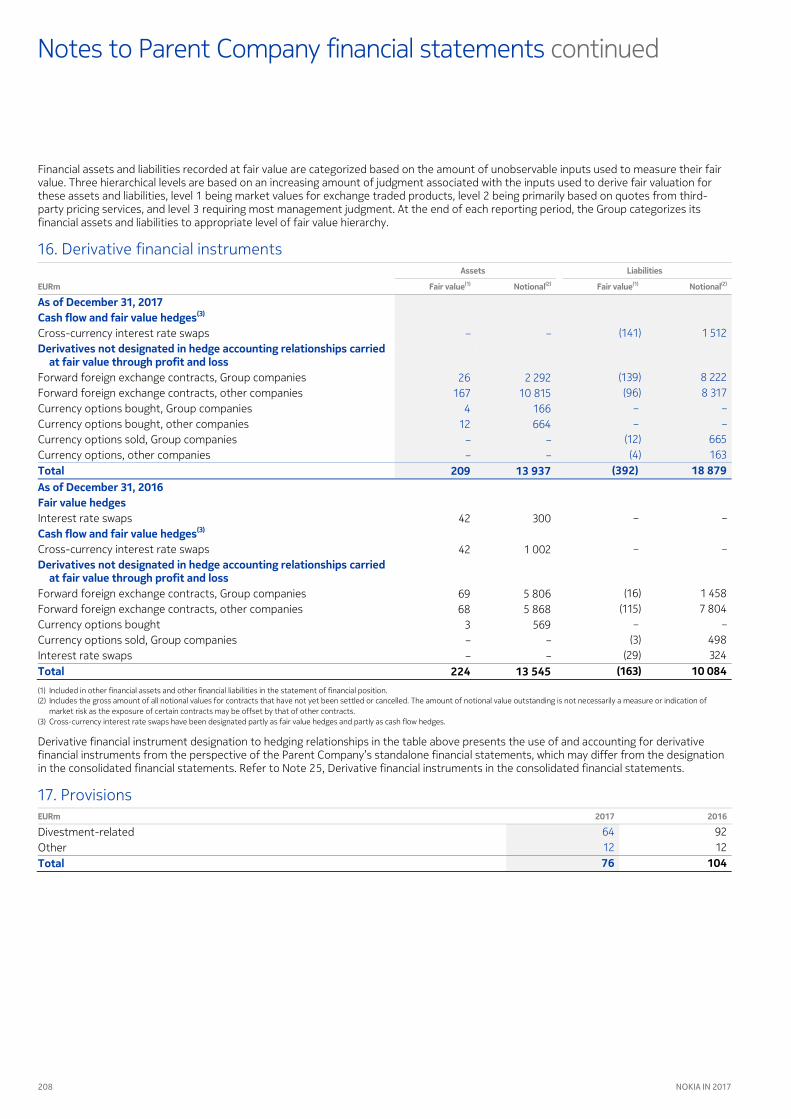
continued
Financial assets and liabilities recorded at fair value are categorized based on the amount of unobservable inputs used to meas
Notes to Parent Company financial statements
ure their fair
value. Three hierarchical levels are based on an increasing amount of judgment associated with the inputs used to derive fair valuation for these assets and liabilities, level 1 being market values for exchange traded products, level being primarily based on quotes from third-party pricing services, and level requiring most management judgment. At the end of each reporting period, the Group categorizes its financial assets and liabilities to appropriate level of fair value hierarchy.
Assets Liabilities
EURm Fair value
. Derivative financial instruments
(1) Notional(2) Fair value(1) Notional(2)
As of December , Cash flow and fair value hedges() Cross-currency interest rate swaps
– – (4) 52
Derivatives not designated in hedge accounting relationships carried at fair value through profit and loss
Forward foreign exchange contracts, Group companies
2 2 22 Forward foreign exchange contracts, other companies
(3) 8 222 7 0 85
Currency options bought, Group companies () 8 37
4 Currency options bought, other companies
– – 2 4
Currency options sold, Group companies – –
– – Currency options, other companies
(2) 5 – – (4) 3
Total 209 13 937
(392)
Interest rate swaps 42 300
18 879 As of December ,
– –
Fair value hedges
Cross-currency interest rate swaps 42 002 Cash flow and fair value hedges()
– –
Forward foreign exchange contracts, Group companies 5 80
Derivatives not designated in hedge accounting relationships carried at fair value through profit and loss
() 458 Forward foreign exchange contracts, other companies 8 5 88 (5) 7 804 Currency options bought 3 5 – – Currency options sold, Group companies – – (3) 48 Interest rate swaps – – (2) 324
224 13 545 () 10 084 (
Total ) Included in other financial assets and other financial liabilities in the statement of financial position.
(2) Includes the gross amount of all notional values for contracts that have not yet been settled or cancelled. The amount of notional value outstanding is not necessarily a measure or indication of market risk as the exposure of certain contracts may be offset by that of other contracts.
(3) Cross-currency interest rate swaps have been designated partly as fair value hedges and partly as cash flow hedges.
Derivative financial instrument designation to hedging relationships in the table above presents the use of and accounting for derivative financial instruments from the perspective of the Parent Company’s standalone financial statements, which may differ from the designation in the consolidated financial statements. Refer to Note , Derivative financial instruments in the consolidated financial statements.
EURm 2017 2016
Divestment-related
7. Provisions
2 4 Other 2
104 2
Total 76
208 NOKIA IN 2017

9
Nominal value
million
Nominal interest %
2017
8. Long-term interest-bearing liabilities
EURm 2016
EURm
200Bonds
-20
() 23 EUR .750 527 200-20 (2)
242 58 USD 5.375 2
207-202 488
() 500 EUR .000 – 207-2022 (2)
500 500 USD 3.375 –
207-2024 ( 40
) 750 EUR 2.000 – 207-2027 (2)
750 500 USD 4.375 –
200-203 408
500 USD .25
428 1 972
(
Total
) In March 20
7, the Parent Company issued EUR 500 million
3 225 .00% Senior Notes due 202 and EUR 750 million 2.00% Senior Notes due 2024 under our 5 billion Euro Medium-Term Note Programme.
The proceeds of the new notes were used to redeem (nominal amounts) EUR 2 million of the 20 Euro Notes, USD 8 million of the 2028 USD Notes and USD 40 million of the 202 USD Notes and for general corporate purposes.
(2) In June 207, the Parent Company issued USD 500 million 3.375% Senior Notes due 2022 and USD 500 million 4.375% Senior Notes due 2027 under U.S. Securities Act of 33, as amended. The proceeds of the new notes were used to redeem (nominal amounts) USD 4 million of the 20 USD Notes, USD 40 million of the 2028 USD Notes and USD 753 million of the 202 USD Notes and for general corporate purposes.
All these borrowings are senior unsecured and have no financial covenants.
EURm 2017 2016
VAT and other indirect taxes
. Accrued expenses and other liabilities
47 Accrued interest 4
5
Salaries and social expenses 3
5 Divestment-related
4 2
Other to Group companies 2
3 Other to other companies
5
167
EURm
2
2017 2016
Total 232
20. Commitments and contingencies
Leasing guarantees Contingent liabilities on behalf of Group companies
4 Other guarantees
78 87
445
Financial guarantees Contingent liabilities on behalf of associated companies
–
Other guarantees Contingent liabilities on behalf of other companies
3
Certain India related accounts receivable are under
27
payment restrictions due to ongoing tax proceedings.
As of December 1, 1 operating lease commitments amounted to EUR 1 million (EUR million in 16).
There were no loans granted to the members of the Group Leadership Team and Board of Directors as of December 1,
2. Loans granted to the management of the company 1 or 16.
209
Financial statements
NOKIA IN 2017
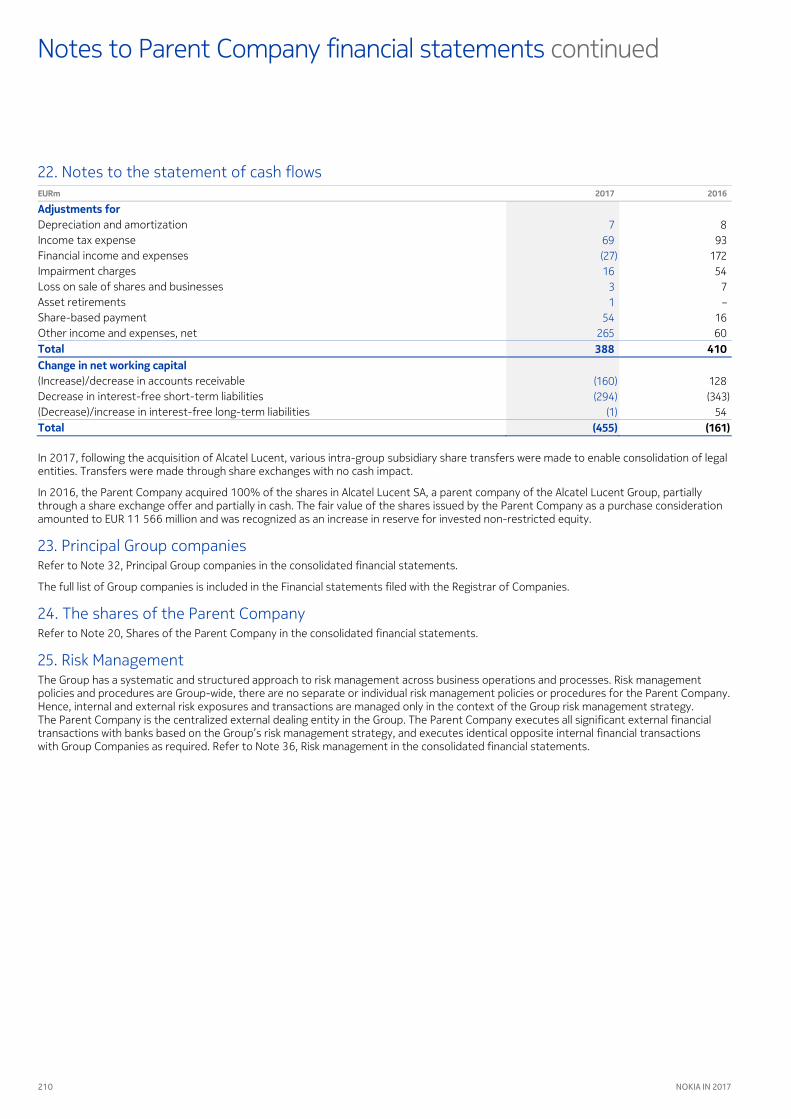
continued
Notes to Parent Company financial statements
1
EURm 2017 2016
22. Notes to the statement of cash flows
Adjustments for Depreciation and amortization 8 Income tax expense
7 3
Financial income and expenses 72 (27) Impairment charges 54 Loss on sale of shares and businesses
7
Asset retirements 3
– Share-based payment
54
Other income and expenses, net 0 25 410 Total 388
Change in net working capital (Increase)/decrease in accounts receivable 28 (0) Decrease in interest-free short-term liabilities (343) (Decrease)/increase in interest-free long-term liabilities
(24) 54 ()
(Total ) ()
In 1, following the acquisition of Alcatel Lucent, various intra-group subsidiary share transfers were made to enable consolidation of legal entities. Transfers were made through share exchanges with no cash impact.
In 16, the Parent Company acquired 1% of the shares in Alcatel Lucent SA, a parent company of the Alcatel Lucent Group, partially through a share exchange offer and partially in cash. The fair value of the shares issued by the Parent Company as a purchase consideration amounted to EUR 11 66 million and was recognized as an increase in reserve for invested non-restricted equity.
Refer to Note , Principal Group companies in the consolidated financial statements.
23. Principal Group companies
The full list of Group companies is included in the Financial statements filed with the Registrar of Companies.
Refer to Note , Shares of the Parent Company in the
24. The shares of the Parent Company consolidated financial statements.
The Group has a systematic and structured approach to risk management across business operations and
25. Risk Management processes. Risk management
policies and procedures are Group-wide, there are no separate or individual risk management policies or procedures for the Parent Company. Hence, internal and external risk exposures and transactions are managed only in the context of the Group risk management strategy. The Parent Company is the centralized external dealing entity in the Group. The Parent Company executes all significant external financial transactions with banks based on the Group’s risk management strategy, and executes identical opposite internal financial transactions with Group Companies as required. Refer to Note 6, Risk management in the consolidated financial statements.
210 NOKIA IN 2017

Signing of the Annual Accounts 2017 and proposal by the Board of Directors for distribution of profits
The distributable funds in the statement of financial position of the Parent company at December 31, 2017 amounted to EUR 18 229 million.
The Board proposes to the Annual General Meeting that from the retained earnings a dividend of EUR 0,19 per share be paid out on the shares of the company. At December 31, 2017 the total number of the shares of the company was 5 839 404 303, based on which the maximum amount to be distributed as dividend would be EUR 1 109 million.
The proposed dividend is in line with the company’s distribution policy.
March 22, 2018
Risto Siilasmaa Chair of the Board
Jeanette Horan
Edward Kozel
Elizabeth Nelson
Carla Smits-Nusteling
Bruce Brown
Louis R. Hughes
Jean C. Monty
Olivier Piou
Kari Stadigh
Rajeev Suri President and CEO
211
Financial statements
NOKIA IN 2017

Auditor’s report
To the Annual General Meeting of Nokia Oyj
Report on the audit of the financial statements OpinionIn our opinion:
■ The consolidated financial statements give a true and fair view of the group’s financial position and financial performance and cash flows in accordance with International Financial Reporting Standards (IFRS) as issued by the International Accounting Standards Board and as adopted by the European Union; and,
■ The financial statements give a true and fair view of the parent company’s financial performance and financial position in accordance with the laws and regulations governing the preparation of the financial statements in Finland and comply with statutory requirements.
Our opinion is consistent with our additional report to the Audit Committee.
What we have auditedWe have audited the financial statements of Nokia Oyj (business identity code 0112038-9) for the year ended 31 December 2017. The financial statements comprise:
■ The consolidated statement of financial position, income statement, statement of comprehensive income, statement of changes in shareholders’ equity and statement of cash flows, and notes to the consolidated financial statements including a summary of significant accounting policies; and
■ The parent company’s statement of financial position, income statement, statement of cash flows and notes to the financial statements.
Basis for opinion We conducted our audit in accordance with good auditing practice in Finland. Our responsibilities under good auditing practice are further described in the Auditor’s Responsibilities for the Audit of the Financial Statements section of our report.
We believe that the audit evidence we have obtained is sufficient and appropriate to provide a basis for our opinion.
IndependenceWe are independent of the parent company and of the group companies in accordance with the ethical requirements that are applicable in Finland and are relevant to our audit, and we have fulfilled our other ethical responsibilities in accordance with these requirements.
To the best of our knowledge, the non-audit services that we have provided to the parent company and to the group companies are in accordance with the applicable law and regulations in Finland and we have not provided non-audit services that are prohibited under Article 5(1) of Regulation (EU) No 537/2014. The non-audit services that we have provided are disclosed in Auditor fees and services in Note 3 to the parent company financial statements.
Our audit approachOverview
Key audit matters
Group scoping
Materiality
■ Overall group materiality: EUR 125 million, which represents 0.5% of consolidated net sales
■ We performed specific audit procedures at 39 reporting components, in addition to group level procedures over specific consolidated accounts and analytical procedures to assess unusual movements across all entities
■ Valuation of goodwill
■ Revenue recognition on complex contracts
■ Valuation of deferred tax assets
■ Fair value of pension and post-retirement plan assets
As part of designing our audit, we determined materiality and assessed the risks of material misstatement in the financial statements. In particular, we considered where management made subjective judgements; for example, in respect of significant accounting estimates that involved making assumptions and considering future events that are inherently uncertain.
MaterialityThe scope of our audit was influenced by our application of materiality. An audit is designed to obtain reasonable assurance whether the financial statements are free from material misstatement. Misstatements may arise due to fraud or error. They are considered material if individually or in aggregate, they could reasonably be expected to influence the economic decisions of users taken on the basis of the financial statements.
Based on our professional judgement, we determined certain quantitative thresholds for materiality, including the overall group materiality for the consolidated financial statements as set out in the table below. These, together with qualitative considerations, helped us to determine the scope of our audit and the nature, timing and extent of our audit procedures and to evaluate the effect of misstatements on the financial statements as a whole.
Overall group materiality EUR 125 million (previous year EUR 125 million)
How we determined it 0.5% of consolidated net sales
Rationale for the materiality benchmark applied
The Group‘s loss before tax was substantial, in part as a result of significant charges recorded that relate to the continued integration of the Alcatel Lucent acquisition and therefore we assessed that an earnings based measure was not the most appropriate basis to determine our materiality.
In light of the loss for the year, we chose net sales as a most appropriate measure of the operating results of the company. We chose 0.5% of revenue which is based on perspectives and expectations of the users of the financial statements in the context of our understanding of the entity and the environment in which it operates.
212 NOKIA IN 2017

How we tailored our group audit scopeWe tailored the scope of our audit in order to perform sufficient work to enable us to provide an opinion on the consolidated financial statements as a whole, taking into account the structure of the Group, the accounting processes and controls, and the industry in which the Group operates.
The Group operates in a significant number of legal entities or “reporting components” globally. We determined the nature, timing and extent of audit work that needed to be performed at reporting components by us, as the group engagement team, or component auditors from other PwC network firms operating under our instruction. Where the work was performed by reporting component auditors, we issued specific instructions to those auditors which included our risk analysis, materiality and global audit approach to centralized processes and systems. We visited all significant reporting components and communicated regularly with the reporting component auditors throughout our audit. We performed audits of reporting component financial information at each of the 9 reporting components which are considered significant based on our overall risk assessment and materiality.
We also performed targeted audit procedures at an additional 30 less significant reporting components in order to provide further coverage over the Group’s revenue and consolidation process. None of the remaining reporting components individually contributed greater than 1% of either Group net sales or Group total assets. In addition to the audit work performed on internal controls which operate on a Group-wide basis, we performed analytical procedures over these components, which corroborated our assessment that these components did not present a reasonable risk of material misstatement. By performing the procedures above at reporting components, combined with additional procedures at the Group level, we have obtained sufficient and appropriate evidence regarding the financial information of the Group as a whole to provide a basis for our opinion on the consolidated financial statements.
Key audit matters Key audit matters are those matters that, in our professional judgment were of most significance in our audit of the financial statements of the current period. These matters were addressed in the context of our audit of the financial statements as a whole, and in forming our opinion thereon, and we do not provide a separate opinion on these matters.
As in all of our audits, we also addressed the risk of management override of internal controls, including among other matters consideration of whether there was evidence of bias that represented a risk of material misstatement due to fraud.
Key audit matter in the audit of the group How our audit addressed the key audit matter
Valuation of goodwill Refer to Note 3, Use of estimates and critical accounting judgments, Note 14, Intangible assets of the consolidated financial statements, and Note 16 ImpairmentAt December 31, 2017, the total carrying value of goodwill amounted to EUR 5,3 billion, representing 13% of the group’s total assets.
Goodwill is tested for impairment when indicators of impairment exist or, at least annually. Goodwill impairment testing is conducted by assessing the fair value of cash generating units (CGU) (to which goodwill is allocated) against the carrying amount of those cash generating units. Management estimates the fair value of the cash generating units using a discounted cash flow model.
We focus on this area given the significant judgements and estimates required to be made in applying the discounted cash flow approach to determine fair value. Specifically, estimates relating to future business operations that impact operating cash flows, anticipated future tax payments, changes in working capital and other estimates such as the discount rate used in the modelling exercise may significantly impact management’s assessment of the fair value of a CGU.
We have determined that this area constitutes a significant risk of material misstatement referred to in Article 10(2c) of Regulation (EU) No 537/2014.
We designed our audit procedures to be responsive to this risk.
We obtained an understanding of management’s goodwill impairment assessment process, evaluated the design and tested the operating effectiveness of internal controls in this area with a focus on the controls in place over the modelling of the fair value of CGU’s.
Our detailed audit work over the fair value of CGU’s with the involvement of our valuation specialists included:
■ Evaluation of the methodology adopted by management for calculating fair values;
■ Reconciliation of management’s expected cash flows to the Group’s most recent business plan, which reflected management’s current expectations of market trends and was consistent with information provided to Board of Directors;
■ Validating and challenging key inputs and data used in valuation models such as revenue growth, discount rates, and cash flow projections by reference to historical data and our expectations based on observable data; and,
■ Performing sensitivity analysis by stress testing key assumptions in the model to consider the degree to which these assumptions would need to change before an impairment would have to be recognized.
We also assessed the adequacy of the Company’s disclosure as included in Note 14, Intangible assets and Note 16, Impairment.
213
Financial statements
NOKIA IN 2017
Auditor’s report continued
Key audit matter in the audit of the group How our audit addressed the key audit matter
Revenue recognition on complex contracts Refer to Note 3, Use of estimates and critical accounting judgments, and Note 7, Revenue recognition of the consolidated financial statements Certain revenue contracts in the Networks business and at Nokia Technologies involve multiple deliverables or elements; for example, a revenue arrangement may combine the delivery of hardware, software, licensing of intellectual property and rendering of services. Such agreements require management to identify all of the deliverables in the arrangement and record revenue based on the fair value of the deliverables at the appropriate time, generally upon delivery of equipment or acceptance of products and services.
These complex contracts give rise to the risk of material misstatement due to the incorrect identification of revenue elements and timing of revenue recognition for each element. We have determined that this area constitutes a significant risk of material misstatement referred to in Article 10(2c) of Regulation (EU) No 537/2014.
We designed our audit procedures to be responsive to this risk.
We obtained an understanding of management’s revenue recognition process and evaluated the design and tested the operating effectiveness of controls over revenue recognition, with particular focus on the controls executed globally for the initial identification of multiple elements within revenue contracts and determination of the timing of recognition for each revenue element.
Audit procedures were performed over revenue recognition at the Group level and at each of the reporting components that were in scope for the Group audit.
We completed detailed testing procedures over revenue arrangements that we selected based on size and complexity to assess the appropriateness of judgements made by management regarding revenue elements, the determination of fair value of deliverables and the appropriateness of recognition triggers.
We tested a sample of revenue transactions recorded during the year at each component by tracing them to supporting evidence of delivery and acceptance and assessed the revenue recorded in the period by comparing it to contractual terms.
We assessed the Group’s revenue recognition accounting policies for compliance with IFRS.
Valuation of deferred tax assets Refer to Note 3, Use of estimates and critical accounting judgments, and Note 12, Income taxes of the consolidated financial statements At December 31, 2017, the Group had recognized net deferred tax assets of EUR 4.2 billion. The Group also had temporary differences of EUR 1.9 billion and tax losses carried forward of EUR 18.4 billion which were not recognized due to uncertainty of utilization.
The analysis of the recoverability of the deferred tax assets was significant to our audit as the amounts are material, the assessment process is judgemental and is based on assumptions that are impacted by expected future market conditions, specifically as it relates to future performance in United States and the Eurozone where the majority of the Group’s deferred tax assets reside.
We have determined that this area constitutes a significant risk of material misstatement referred to in Article 10(2c) of Regulation (EU) No 537/2014.
We designed our audit procedures to be responsive to this risk.
We obtained an understanding of process that management has implemented for accounting for deferred tax assets. We also evaluated the design and tested the operating effectiveness of controls in this area.
We performed substantive audit procedures to validate the deferred tax balances which are recorded with a consideration of enacted tax laws in each jurisdiction in accordance with IFRS.
Our audit work on the valuation of deferred tax assets, with the involvement of our tax specialists, included:
■ Validating the completeness and accuracy of tax attributes;
■ Confirming the appropriate application of tax rules for utilizing deferred tax assets, including expiry of those attributes;
■ Evaluating the Company’s ability to generate sufficient taxable income to utilize deferred tax assets. This evaluation takes into account the Company’s historical profitability and future projections; and,
■ Reviewing the adequacy of the disclosures made by the company in accordance with IFRS.
In addition, we assessed the Group’s accounting for compliance with IFRS.
214 NOKIA IN 2017

Key audit matter in the audit of the group How our audit addressed the key audit matter
Fair value of pension and post-retirement plan assets Refer to Note 3, Use of estimates and critical accounting judgments, and Note 27, Pensions and other post-employment benefitsThe fair value of the Group’s pension and post-retirement plan assets is EUR 25.5 billion, primarily in the United States and includes EUR 5.2 billion in unquoted investments for which the valuation requires the use of estimates and significant judgement. A small change in the assumptions used could have a material impact on the consolidated financial statements.
We considered valuation of the unquoted plan assets as a key audit matter due to materiality of the related balances and judgments involved in these estimates.
We designed our audit procedures to be responsive to this risk.
We obtained an understanding of process that management has related to the preparation and review of plan asset valuations. We also evaluated the design and tested the operating effectiveness of controls in this area.
We tested the existence of a sample of unquoted investments by obtaining confirmations from investment custodians including administrators, investment managers, and trustees. Our audit work on the valuation of these investments, with the involvement of our valuation specialists, included:
■ Assessing the appropriateness of the valuation method, estimates and judgements used by the Group to value these investments;
■ Testing the inputs used in the valuations; and,
■ Confirming the valuation of net asset value of investment funds with the investment custodian.
Finally, we reviewed the adequacy of the disclosures made by the company in accordance with IFRS.
There are no key audit matters to report or significant risks of material misstatement referred to in Article 10(2c) of Regulation (EU) No 537/2014 with respect to the parent company financial statements.
Responsibilities of the Board of Directors and the Managing Director for the Financial StatementsThe Board of Directors and the Managing Director are responsible for the preparation of consolidated financial statements that give a true and fair view in accordance with International Financial Reporting Standards (IFRS) as adopted by the EU, and of financial statements that give a true and fair view in accordance with the laws and regulations governing the preparation of financial statements in Finland and comply with statutory requirements. The Board of Directors and the Managing Director are also responsible for such internal control as they determine is necessary to enable the preparation of financial statements that are free from material misstatement, whether due to fraud or error.
In preparing the financial statements, the Board of Directors and the Managing Director are responsible for assessing the parent company’s and the group’s ability to continue as a going concern, disclosing, as applicable, matters relating to going concern and using the going concern basis of accounting. The financial statements are prepared using the going concern basis of accounting unless there is an intention to liquidate the parent company or the group or to cease operations, or there is no realistic alternative but to do so.
Auditor’s Responsibilities for the Audit of the Financial StatementsOur objectives are to obtain reasonable assurance about whether the financial statements as a whole are free from material misstatement, whether due to fraud or error, and to issue an auditor’s report that includes our opinion. Reasonable assurance is a high level of assurance, but is not a guarantee that an audit conducted in accordance with good auditing practice will always detect a material misstatement when it exists. Misstatements can arise from fraud or error and are considered material if, individually or in the aggregate, they could reasonably be expected to influence the economic decisions of users taken on the basis of these financial statements.
As part of an audit in accordance with good auditing practice, we exercise professional judgment and maintain professional skepticism throughout the audit. We also:
■ Identify and assess the risks of material misstatement of the financial statements, whether due to fraud or error, design and perform audit procedures responsive to those risks, and obtain audit evidence that is sufficient and appropriate to provide a basis for our opinion. The risk of not detecting a material misstatement resulting from fraud is higher than for one resulting from error, as fraud may involve collusion, forgery, intentional omissions, misrepresentations, or the override of internal control;
■ Obtain an understanding of internal control relevant to the audit in order to design audit procedures that are appropriate in the circumstances, but not for the purpose of expressing an opinion on the effectiveness of the parent company’s or the group’s internal control;
■ Evaluate the appropriateness of accounting policies used and the reasonableness of accounting estimates and related disclosures made by management;
■ Conclude on the appropriateness of the Board of Directors’ and the Managing Director’s use of the going concern basis of accounting and based on the audit evidence obtained, whether a material uncertainty exists related to events or conditions that may cast significant doubt on the parent company’s or the group’s ability to continue as a going concern. If we conclude that a material uncertainty exists, we are required to draw attention in our auditor’s report to the related disclosures in the financial statements or, if such disclosures are inadequate, to modify our opinion. Our conclusions are based on the audit evidence obtained up to the date of our auditor’s report. However, future events or conditions may cause the parent company or the group to cease to continue as a going concern;
215
Financial statements
NOKIA IN 2017
■ Evaluate the overall presentation, structure and content of the financial statements, including the disclosures, and whether the financial statements represent the underlying transactions and events so that the financial statements give a true and fair view; and,
■ Obtain sufficient appropriate audit evidence regarding the financial information of the entities or business activities within the group to express an opinion on the consolidated financial statements. We are responsible for the direction, supervision and performance of the group audit. We remain solely responsible for our audit opinion.
We communicate with those charged with governance regarding, among other matters, the planned scope and timing of the audit and significant audit findings, including any significant deficiencies in internal control that we identify during our audit.
We also provide those charged with governance with a statement that we have complied with relevant ethical requirements regarding independence, and to communicate with them all relationships and other matters that may reasonably be thought to bear on our independence, and where applicable, related safeguards.
From the matters communicated with those charged with governance, we determine those matters that were of most significance in the audit of the financial statements of the current period and are therefore the key audit matters. We describe these matters in our auditor’s report unless law or regulation precludes public disclosure about the matter or when, in extremely rare circumstances, we determine that a matter should not be communicated in our report because the adverse consequences of doing so would reasonably be expected to outweigh the public interest benefits of such communication.
Other reporting requirements AppointmentWe were first appointed as auditors by the annual general meeting on 25 March 1987. Our appointment represents a total period of uninterrupted engagement of 31 years.
Other Information The Board of Directors and the Managing Director are responsible for the other information. The other information comprises the report of the Board of Directors and the information included in the Annual Report, but does not include the financial statements and our auditor’s report thereon.
Our opinion on the financial statements does not cover the other information.
In connection with our audit of the financial statements, our responsibility is to read the other information and, in doing so, consider whether the other information is materially inconsistent with the financial statements or our knowledge obtained in the audit, or otherwise appears to be materially misstated. With respect to the report of the Board of Directors, our responsibility also includes considering whether the report of the Board of Directors has been prepared in accordance with the applicable laws and regulations.
In our opinion:
■ the information in the report of the Board of Directors is consistent with the information in the financial statements; and,
■ the report of the Board of Directors has been prepared in accordance with the applicable laws and regulations.
If, based on the work we have performed, we conclude that there is a material misstatement of the other information, we are required to report that fact. We have nothing to report in this regard.
Other StatementsWe support that the financial statements and the consolidated financial statements should be adopted. The proposal by the Board of Directors regarding the use of profit shown in the balance sheet is in compliance with the Limited Liability Companies Act. We support that the Members of the Board of Directors and the Managing Director should be discharged from liability for the financial period audited by us.
Helsinki, March 22, 2018
PricewaterhouseCoopers OyAuthorised Public Accountants
Pasi KarppinenAuthorised Public Accountant (KHT)
Auditor’s report continued
216 NOKIA IN 2017


![Contingencies and provisioning[1]](https://img.dokumen.tips/doc/110x75/5457ed9faf795963388b5b66/contingencies-and-provisioning1.jpg)