Embed Size (px)
Citation preview

F R E M A N T L E P O R T S A N N U A L R E P O R T 2 0 0 371
FINANCIAL STATEMENTS FOR THE YEAR ENDED 30 JUNE 2003
Statement of Financial PerformanceStatement of Financial PositionStatement of Cash FlowsNotes to and Forming Part of the Financial Statements1. Summary of Significant Accounting Policies 2. Revenue from Ordinary Activities 3. Profit from Ordinary Activities before Income Tax4. Income Tax5. Dividends6. Current Assets7. Non-Current Assets8. Current and Non-Current Liabilities9. Commitments 10. Tax Liabilities11. Provisions 12. Other Liabilities13. Equity14. Reserves and Retained Profits15. Notes to Statement of Cash Flows16. Remuneration of Directors17. Remuneration of Executives18. Remuneration of Auditors19. Related Parties20. Segment Information
Directors ̓DeclarationFinancial Audit OpinionFinancial Performance Indicators

F I N A N C I A L S T A T E M E N T Sas a t 30 June 2003
F R E M A N T L E P O R T S A N N U A L R E P O R T 2 0 0 372
Note 2003$ʼ000
2002$ʼ000
Revenue from Ordinary Activities 2 76,359 62,937
Operational Expenses (29,589) (19,773)
Commercial Management (17,488) (14,760)
Port Utilities (3,201) (2,503)
Borrowing costs 3 (2,199) (1,380)
Other expenses from Ordinary Activities (6,103) (5,429)
Profit from Ordinary Activities Before Income Tax Expense 3 17,779 19,092
Income Tax Expense 4 (5,358) (5,496)
Net Profit 14 (b) 12,421 13,596
Non – owner transaction changes in equity
Net decrease in retained profits on the initial adoption of
revised AASB 1028 “Employee Benefits” 14 (b) (201) -
Total changes in equity from non-owner related transactions 12,220 13,596
The above Statement of Financial Performance should be read in conjunction with the accompanying notes.
S TAT E M E N T O F F I N A N C I A L P E R F O R M A N C E

F I N A N C I A L S T A T E M E N T Sas a t 30 June 2003
F R E M A N T L E P O R T S A N N U A L R E P O R T 2 0 0 373
S T A T E M E N T O F F I N A N C I A L P O S I T I O N
Note 2003$ʼ000
2002$ʼ000
CURRENT ASSETS Cash Assets 6.1 2,360 1,967 Other Financial Assets 6.2 10,145 24,645 Receivables 6.3 12,114 8,490 Other 6.4 436 374Total Current Assets 25,055 35,476
NON-CURRENT ASSETS Property, Plant and Equipment 7.1 123,520 108,223 Deferred Tax Assets 7.2 7,597 6,325Total Non-Current Assets 131,117 114,548
TOTAL ASSETS 156,172 150,024
CURRENT LIABILITIES Payables 8.1 9,094 4,984 Interest Bearing Liabilities 8.2 4,103 4,197 Current Tax Liabilities 10 194 2,553 Provisions 11 8,048 9,180 Other 12 1,774 1,210Total Current Liabilities 23,213 22,124
NON-CURRENT LIABILITIES Interest Bearing Liabilities 8.2 21,467 25,570 Deferred Tax Liabilities 10 972 91 Provisions 11 10,247 9,034 Other 12 1,685 1,903Total Non-Current Liabilities 34,371 36,598
TOTAL LIABILITIES 57,584 58,722
NET ASSETS 98,588 91,302
EQUITY Contributed Equity 13 45,531 45,310 Reserves 14(a) 5,102 5,102 Retained Profits 14(b) 47,955 40,890
TOTAL EQUITY 98,588 91,302
The above Statement of Financial Position should be read in conjunction with the accompanying notes.

F I N A N C I A L S T A T E M E N T Sas a t 30 June 2003
F R E M A N T L E P O R T S A N N U A L R E P O R T 2 0 0 374
S T A T E M E N T O F C A S H F L O W S
Note 2003$ʼ000
2002$ʼ000
CASH FLOWS FROM OPERATING ACTIVITIES
Receipts from Customers 70,007 57,406
Payments to Suppliers and Employees (44,975) (40,525)
Interest Received 1,015 1,175
Borrowing Costs Paid (2,068) (1,172)
Income Tax Paid (8,022) (7,136)
Net Cash Inflow from Operating Activities 15 15,957 9,748
CASH FLOWS FROM INVESTING ACTIVITIES
Payments for Investments (14,000) (24,900)
Proceeds from the disposal of Investments 28,500 23,950
Payments for purchase of Property, Plant and Equipment (22,120) (9,936)
Proceeds from the disposal of Property, Plant and Equipment 2 - 1,022
Net Cash Outflow from Investing Activities (7,620) (9,864)
CASH FLOWS FROM FINANCING ACTIVITIES
Repayment of Borrowings (1,367) (1,095)
Dividends Paid (6,798) (2,782)
Equity Contribution 13 221 4,039
Net Cash (Outflow) / Inflow from Financing Activities (7,944) 162
NET INCREASE IN CASH HELD 393 46
CASH AT THE BEGINNING OF THE FINANCIAL YEAR 1,967 1,921
CASH AT THE END OF THE FINANCIAL YEAR 6.1 2,360 1,967
The above Statement of Cash Flows should be read in conjunction with the accompanying notes.

N O T E S T O A N D F O R M I N G PA R T O F T H E F I N A N C I A L S TAT E M E N T S
F I N A N C I A L S T A T E M E N T Sas a t 30 June 2003
F R E M A N T L E P O R T S A N N U A L R E P O R T 2 0 0 375
1. SUMMARY OF SIGNIFICANT ACCOUNTING POLICIES
The following significant accounting policies have been adopted in the preparation of the financial statements for the year ended 30 June 2003. Unless otherwise stated these policies are consistent with those adopted in the preceding year.
1.1 Basis of Accounting
These financial statements have been prepared as a general purpose financial report in accordance with the Australian Accounting Standards, other authoritative pronouncements of the Australian Accounting Standards Board, Urgent Issues Group Consensus Views and the financial reporting provisions of the Port Authorities Act 1999.
The financial report has been prepared on an accrual accounting basis and in accordance with the historical cost convention, except for property, plant and equipment which has been recorded at deemed cost based on prior period revaluations.
1.2 Revenue Recognition
Revenue from ordinary activities is for services to entities outside the Fremantle Ports and is recognised when the services have been provided. Miscellaneous Revenue is derived predominantly from the hire of facilities and equipment. Interest revenue includes interest on short-term investments and is recognised when accrued.
1.3 Borrowing Costs
Borrowing costs are recognised as expenses in the period in which they are incurred.
1.4 National Tax Equivalent Regime (Income Tax)
Fremantle Ports is subject to the National Tax Equivalent Regime (NTER).
The NTER is an administrative arrangement under which Relevant Taxation Laws are applied notionally to the NTER entities as if they were subject to those laws. Income tax equivalent liabilities are paid to the State Government.
1.5 Income Tax
Fremantle Ports adopts the liability method of tax-effect accounting whereby the income tax attributable to profit from ordinary activities shown in the Statement of Financial Performance is based on the profit from ordinary activities before tax adjusted for any permanent differences. The provisions for deferred income tax liability and the future income tax benefit represent the tax effect of timing differences calculated at the rate of income tax applicable when those timing differences are expected to reverse.
1.6 Other Financial Assets
Investments are stated at cost and interest revenue is recognised when accrued.
1.7 Receivables
Trade debtors are recognised at the amounts due and are generally settled within 30 days except for property rentals, which are governed by individual lease agreements.
The value of the provision for doubtful debts is assessed using an analysis of historical data to determine the level of risk and subsequent recovery of debts based on the age of amounts outstanding. Bad debts are written off when formally recognised as being irrecoverable.

N O T E S T O A N D F O R M I N G PA R T O F T H E F I N A N C I A L S TAT E M E N T S
F I N A N C I A L S T A T E M E N T Sas a t 30 June 2003
F R E M A N T L E P O R T S A N N U A L R E P O R T 2 0 0 376
Depreciation Rates (%)Channels and breakwaters 1.92 – 3.7
Land improvements 1.92 – 16.67
Buildings and improvements 2 – 100
Plant and equipment 2.86 – 100
Berths, jetties and infrastructure 2.25 – 25
1. SUMMARY OF SIGNIFICANT ACCOUNTING POLICIES (Continued)
1.8 Property, Plant and Equipment
Property, Plant and Equipment purchased or constructed for port operations is recorded at the cost of acquisition being the fair value of the consideration provided plus incidental costs directly attributable to the acquisition.
Property, plant and equipment, excluding freehold land, are depreciated at rates based on the expected useful lives using the straight line method. Depreciation on assets under construction commences when the project has been completed.
The depreciation rates for the various classes of non-current assets are as follows:
1.9 Recoverable Amount of Property, Plant and Equipment
The recoverable amount of an asset is the net amount expected to be recovered through the net cash inflows and outflows arising from its continued use and subsequent disposal.
All property, plant and equipment are assessed at least annually to determine whether their carrying amounts require write down to recoverable amount. Recoverable amount is determined using net cash flows discounted to present values at a rate of 9.8 % (2002: 10.2 %).
Where a group of assets working together supports the generation of cash inflows, recoverable amount is assessed in relation to that group of assets.
Where the carrying amount of a non-current asset is greater than its recoverable amount, the asset is written down to its recoverable amount. The decrement in the carrying amount is recognised as an expense in the Statement of Financial Performance in the reporting period in which the recoverable amount write-down occurs.
1.10 Leased Assets
Fremantle Ports has entered into a number of operating lease arrangements for motor vehicles, computer and office equipment where the lessors effectively retain all the risks and benefits incidental to ownership of the items held under the operating leases. Equal instalments of the lease payments are charged to the Statement of Financial Performance over the lease term, as this is representative of the pattern of benefits to be derived from the leased property.

N O T E S T O A N D F O R M I N G PA R T O F T H E F I N A N C I A L S TAT E M E N T S
F I N A N C I A L S T A T E M E N T Sas a t 30 June 2003
F R E M A N T L E P O R T S A N N U A L R E P O R T 2 0 0 377
1. SUMMARY OF SIGNIFICANT ACCOUNTING POLICIES (Continued)
1.11 Payables
Payables, including trade creditors, amounts payable and accrued expenses, are recognised for amounts to be paid in the future for goods and services received. Trade creditors are unsecured and are usually paid within 30 days of recognition.
1.12 Interest Bearing Liabilities
Interest Bearing Liabilities are recognised and carried at their principal amounts. Borrowing costs are recognised when incurred.
1.13 Net Fair Values of Financial Assets and Liabilities
The net fair values of monetary financial assets and liabilities not traded in an organised financial market are determined using the cost basis.
1.14 Employee Benefits
Annual and Sick Leave benefits expected to be settled within 12 months of the year-end represent present obligations resulting from employees ̓services provided to reporting date and are provided at nominal amounts calculated on the basis of remuneration rates expected to be paid when the liability is settled.
Long Service Leave liability was assessed on the basis of the present value of estimated future payments, discounted by the Commonwealth Government Bonds rates estimated to be applicable to the relevant period. A 3% (2002: 3%) per annum rate of increase in employee wage and salary rates was assumed in the present value calculations.
The liability in all provisions covers entitlements from the date the employee commences in accordance with the conditions of employment.
Provisions are made for long service leave even though in some cases such amounts are currently not vesting. Associated payroll on-costs were included in the determination of provisions.
1.15 Change in Accounting Policy
The accounting policies adopted are consistent with those of the previous year except for the accounting policies with respect to the provision for employee benefits.
Employee Benefits
Fremantle Ports has adopted the revised AASB 1028 Employee Benefits, which has resulted in a change in the accounting policy for the measurement of employee benefit liabilities. Previously, annual leave and vested sick leave were measured on the current remuneration rates as at the reporting date. In accordance with the requirements of the revised Standard, these employee benefits are now measured based on the remuneration rates expected to be paid when the liability is settled. The effect of the revised policy has been to increase employee benefit liabilities at the beginning of the year by $286,705, decrease retained profits by $200,693 and decrease future income tax benefit by $86,012. In addition, current year profits have decreased by $273,041 with an increase in the provision of employee benefits at 30 June 2003 of $559,746 as a result of the change in accounting policy.

N O T E S T O A N D F O R M I N G PA R T O F T H E F I N A N C I A L S TAT E M E N T S
F I N A N C I A L S T A T E M E N T Sas a t 30 June 2003
F R E M A N T L E P O R T S A N N U A L R E P O R T 2 0 0 378
1. SUMMARY OF SIGNIFICANT ACCOUNTING POLICIES (Continued)
1.16 Employee Superannuation
The Gold State Superannuation Scheme, a defined benefit lump sum scheme, and the Superannuation and Family Benefits Act Scheme, a defined benefit pension scheme are now closed to new members. Fremantle Ports is liable for superannuation benefits for past years ̓service of members of the Superannuation and Family Benefits Act Scheme who elected to transfer to the Gold State Superannuation Scheme. Fremantle Ports also accrues for superannuation benefits to the pension scheme for those members who elected not to transfer from that scheme.
Staff who do not contribute to either of these schemes become non-contributory members of the West State Superannuation Scheme, an accumulation fund complying with the Commonwealth Government s̓ Superannuation Guarantee (Administration) Act 1992.
The superannuation liability for existing employees with the pre-transfer service incurred under the Superannuation and Family Benefits Act pension scheme who transferred to the Gold State Superannuation Scheme are provided for at reporting date.
The liabilities for superannuation charges under the Gold State Superannuation Scheme and West State Superannuation Scheme are extinguished by payment of employer contributions to the Government Employee Superannuation Board.
Fremantle Ports ̓total superannuation liability has been actuarially assessed as at 30 June 2003.
The note disclosure required by paragraph 6.10 of AASB 1028 Employee Benefits (being the employerʼs share of the difference between employees ̓accrued superannuation benefits and the attributable net market value of plan assets) has not been provided. State scheme deficiencies are recognised by the State in its whole of government reporting. The Government Employees Superannuation Boardʼs records are not structured to provide the information for Fremantle Ports. Accordingly, deriving the information for Fremantle Ports is impractical under current arrangements, and thus any benefits thereof would be exceeded by the cost of obtaining the information.
1.17 Cash Assets
For the purposes of the Statement of Cash Flows, cash assets include Cash on Hand, Cash at Bank and At Call Deposits.
1.18 Goods and Services Tax
The Federal Government, as part of its national taxation reform agenda, introduced a Goods and Services Tax (GST) which became operational on 1 July 2000. GST applies equally to government agencies and the private sector.
Revenues, expenses and assets are recognised net of the amount of goods and services tax. Receivables and payables are stated inclusive of GST.
Cash flows are included in the statement of cash flows on a gross basis.
1.19 Comparatives
Where the classification of an item in the financial statements has been changed in relation to the corresponding item in the financial statements for the immediately preceding financial year, the item for that immediately preceding financial year has been similarly reclassified for the purpose of showing comparative figures.

N O T E S T O A N D F O R M I N G PA R T O F T H E F I N A N C I A L S TAT E M E N T S
F I N A N C I A L S T A T E M E N T Sas a t 30 June 2003
F R E M A N T L E P O R T S A N N U A L R E P O R T 2 0 0 379
1. SUMMARY OF SIGNIFICANT ACCOUNTING POLICIES (Continued)
1.20 Rounding
Amounts have been rounded to the nearest thousand dollars.
2 REVENUE FROM ORDINARY ACTIVITIES
Revenue from Ordinary Activities consists of the following items:
2003$ʼ000
2002$ʼ000
Revenue from operating activities
Charges on Cargo 42,262 30,869
Charges on Ships 9,124 8,803
Shipping Services 5,326 5,577
Rentals and Leases 10,215 9,260
Port Utilities and Services 3,569 3,102
Miscellaneous Revenue 2,709 3,132
Contribution of asset 2,110 -
75,315 60,743
Revenue from outside the operating activities
Interest 1,044 1,172
Proceeds on Disposal of Property, Plant and Equipment - 1,022
1,044 2,194
Total Revenue from Ordinary Activities 76,359 62,937
The contribution of asset of $2.110 million represents the fair value of a property that was inherited by Fremantle Ports from the termination of a lease. In accordance with AASB 1004 Revenue, this value has been accounted for as revenue in this financial year.

N O T E S T O A N D F O R M I N G PA R T O F T H E F I N A N C I A L S TAT E M E N T S
F I N A N C I A L S T A T E M E N T Sas a t 30 June 2003
F R E M A N T L E P O R T S A N N U A L R E P O R T 2 0 0 380
3. PROFIT FROM ORDINARY ACTIVITIES BEFORE INCOME TAX
Note 2003$ʼ000
2002$ʼ000
ExpensesProfit from ordinary activities before income tax includes the following specific expenses:
Borrowing Costs 3 (i) 2,199 1,380
Depreciation
Channels and breakwaters 1,111 1,111
Land improvements 245 176
Buildings and improvements 537 425
Plant and equipment 2,061 1,180
Berths, jetties and infrastructure 2,134 2,182
Total Depreciation 6,088 5,074
Net loss / (gain) on disposal of property, plant and equipment 15 (787)
Other charges against assets
Write down of assets to recoverable amount - 185
Bad and Doubtful Debts – Trade Debtors - 120
Provisions - Employee Benefits 1,726 846
Rental expense relating to operating leases 487 543
3 (i) In 2003, Fremantle Ports entered into a defeasance arrangement to refinance a portion of its debt. $14.1 million consisting of $13.4 million debt and interest premium of $0.7 million was repaid. The interest premium was recognized as an expense for the financial year and debt of $13.4 million was reborrowed at revised interest rates.

N O T E S T O A N D F O R M I N G PA R T O F T H E F I N A N C I A L S TAT E M E N T S
F I N A N C I A L S T A T E M E N T Sas a t 30 June 2003
F R E M A N T L E P O R T S A N N U A L R E P O R T 2 0 0 381
4. INCOME TAX
2003$ʼ000
2002$ʼ000
The income tax expense for the financial year differs from the amount prima facie payable on the profit from ordinary activities and is reconciled as follows: Profit from ordinary activities 17,779 19,092
Prima facie income tax on the operating profit at 30% (5,333) (5,728)
Tax effect of permanent differences:
Non deductible depreciation (529) (294)
Sundry items 541 502
Income tax adjusted for permanent differences (5,321) (5,520)
(Under ) / Over provision of income tax in prior years (37) 24
Income tax expense (5,358) (5,496)
Comprising:
Current income taxation provision (5,646) (6,597)
Deferred income tax provision (881) 36
Future income tax benefit 1,206 1,041
(Under) / Over provision in prior years (37) 24
(5,358) (5,496)

N O T E S T O A N D F O R M I N G PA R T O F T H E F I N A N C I A L S TAT E M E N T S
F I N A N C I A L S T A T E M E N T Sas a t 30 June 2003
F R E M A N T L E P O R T S A N N U A L R E P O R T 2 0 0 382
5. DIVIDENDS
2003$ʼ000
2002$ʼ000
Dividend provided for or paid for the financial year 5,155 6,798
The directors intend to make a recommendation to the Minister, that dividends amounting to $5,154,870 (2002: $6,797,860) be declared.
The new AASB 1044 Provisions, Contingent Liabilities and Contingent Assets states that dividends cannot be recognized as a provision unless they are declared, determined or publicly recommended prior to reporting date. The publication of proposed dividends in the Statement of Corporate Intent creates a valid expectation that a dividend will be paid. Therefore, a provision for dividend of $5,154,870 (2002: $6,797,860) has been provided for in the accounts in respect of the year ended 30 June 2003 and includes a special provision of $0.438 million (2002: $0.413 million) for a required Government Efficiency Dividend.
6. CURRENT ASSETS
6.1 Cash Assets
Cash Assets represent the Cash at Bank, Cash on Hand and At Call Deposits. Funds surplus to operational requirements have been invested in At Call Deposits to maximise earnings.
2003$ʼ000
2002$ʼ000
Cash at Bank and Cash on Hand 847 418
At Call Deposits 1,513 1,549
Balance as at 30 June 2,360 1,967
(i) Significant Terms and Conditions
Interest on Cash at Bank was at prevailing bank rates. The weighted average interest rate at 30 June 2003 was 3.30% (2002: 3.30%).
Interest on At Call Deposits was at prevailing rates. The weighted average interest rate at 30 June 2003was 4.60% (2002: 4.60%).
(ii) Net Fair Values
The directors consider the carrying amount of Cash at Bank and At Call Deposits represent their netfair value.

N O T E S T O A N D F O R M I N G PA R T O F T H E F I N A N C I A L S TAT E M E N T S
F I N A N C I A L S T A T E M E N T Sas a t 30 June 2003
F R E M A N T L E P O R T S A N N U A L R E P O R T 2 0 0 383
6.2 Other Financial Assets
Bank Bills and Term Deposits
Funds surplus to operational requirements have been invested in bank bills and fixed term deposits to maximise earnings.
2003$ʼ000
2002$ʼ000
Bank Bills 10,100 24,600
Term Deposits 45 45
Balance as at 30 June 10,145 24,645
(i) Significant Terms and Conditions
Bank bills and deposits are held until their maturity dates. Bank bills are normally held for a period of 30 days to 60 days and term deposits are normally held for a period of 150 days to 180 days.
(ii) Interest Risk
Interest on term deposits was at prevailing rates. The weighted average interest rate at 30 June 2003 was 4.38% (2002: 4.40%).
Interest on bank bills was at prevailing rates. The weighted average interest rate at 30 June 2003 was 4.75% (2002: 4.92 %).
(iii) Net Fair Values
The directors consider the carrying amount of bank bills and term deposits represent their net fair value.
6.3 Receivables
Receivables represent Debtors and Accrued Income. Accrued Income includes accrued interest, charges on ships, cargo and services provided but not invoiced as at reporting date.
2003$ʼ000
2002$ʼ000
Trade Debtors 6,933 6,214
Less: Provision for Doubtful Debts (190) (190)
6,743 6,024
Other Debtors 4,420 938
Accrued Income 951 1,528
Balance as at 30 June 12,114 8,490
(i) Significant Terms and Conditions
Trade debtors are generally settled within 30 days except for property rentals which are governed by individual lease agreements.
Other debtors have a range of terms and conditions with various settlement periods.

N O T E S T O A N D F O R M I N G PA R T O F T H E F I N A N C I A L S TAT E M E N T S
F I N A N C I A L S T A T E M E N T Sas a t 30 June 2003
F R E M A N T L E P O R T S A N N U A L R E P O R T 2 0 0 384
6.3 Receivables (Continued)
(ii) Credit Risk
Trade Debtors
Fremantle Ports operates predominantly within the shipping and cargo handling industry and accordingly is exposed to risks affecting that industry. The maximum exposure to this industry risk is the carrying value of the trade debtors.
Other Debtors
No significant risk is believed to be attached to other debtors.
(iii) Net Fair Values
The directors consider the carrying amounts of receivables represent their net fair values.
6.4 Other
Other Current Assets represent prepaid expenses, which comprise the prepayment of servicesnot yet rendered.
2003$ʼ000
2002$ʼ000
Prepayments 436 374
N O T E S T O A N D F O R M I N G PA R T O F T H E F I N A N C I A L S TAT E M E N T S
F I N A N C I A L S T A T E M E N T Sas a t 30 June 2003
F R E M A N T L E P O R T S A N N U A L R E P O R T 2 0 0 385
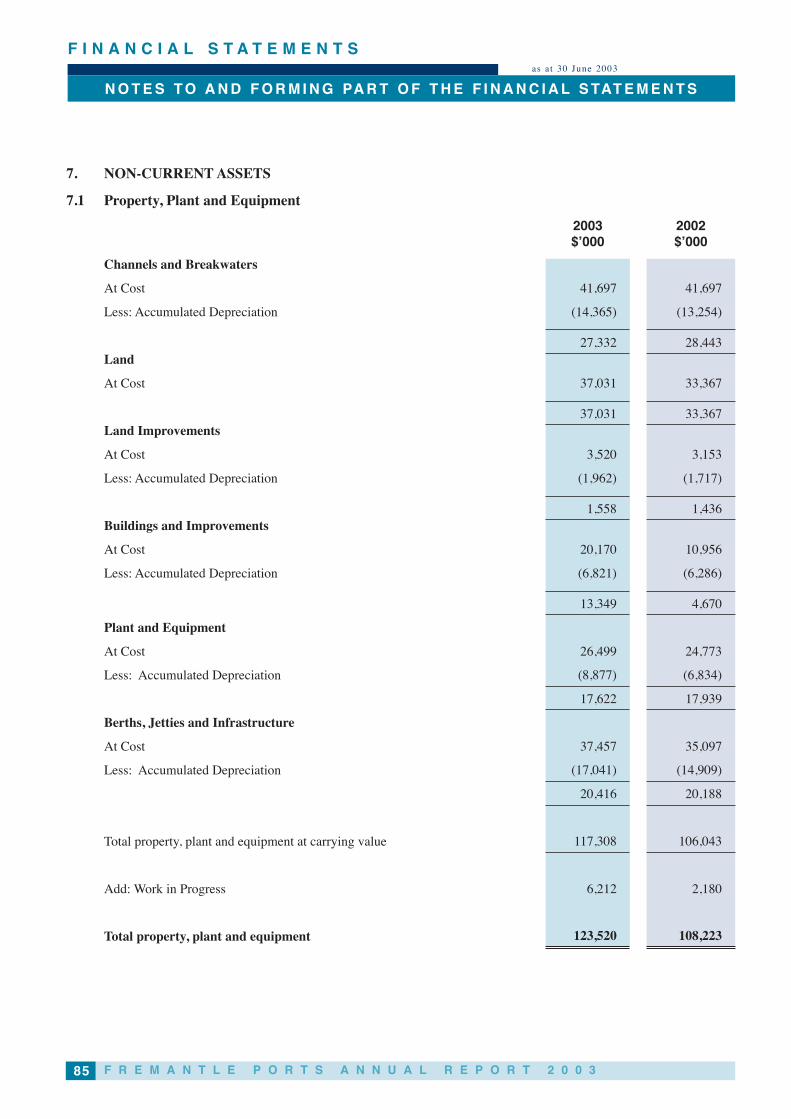
7. NON-CURRENT ASSETS
7.1 Property, Plant and Equipment
2003$ʼ000
2002$ʼ000
Channels and Breakwaters
At Cost 41,697 41,697
Less: Accumulated Depreciation (14,365) (13,254)
27,332 28,443Land
At Cost 37,031 33,367
37,031 33,367Land Improvements
At Cost 3,520 3,153
Less: Accumulated Depreciation (1,962) (1,717)
1,558 1,436Buildings and Improvements
At Cost 20,170 10,956
Less: Accumulated Depreciation (6,821) (6,286)
13,349 4,670
Plant and Equipment
At Cost 26,499 24,773
Less: Accumulated Depreciation (8,877) (6,834)
17,622 17,939
Berths, Jetties and Infrastructure
At Cost 37,457 35,097
Less: Accumulated Depreciation (17,041) (14,909)
20,416 20,188
Total property, plant and equipment at carrying value 117,308 106,043
Add: Work in Progress 6,212 2,180
Total property, plant and equipment 123,520 108,223

N O T E S T O A N D F O R M I N G PA R T O F T H E F I N A N C I A L S TAT E M E N T S
F I N A N C I A L S T A T E M E N T Sas a t 30 June 2003
F R E M A N T L E P O R T S A N N U A L R E P O R T 2 0 0 386
7.1 Property, Plant and Equipment (Continued)
Fremantle Ports, as lessor, derives operating lease income from the following leased assets included in the above:
2003$ʼ000
2002$ʼ000
Land
At Cost 9,861 9,034
9,861 9,034
Buildings and Improvements
At Cost 11,881 3,229
Less: Accumulated Depreciation 1,692 1,494
10,189 1,735
Included in Accumulated Depreciation above is the charge for the year of 229 136
Reconciliations of carrying amounts
2003$ʼ000
2002$ʼ000
Channels and breakwaters:
Carrying amount at 1 July 28,443 29,554
Depreciation for the year (1,111) (1,111)
Carrying amount at 30 June 27,332 28,443
Land:
Carrying amount at 1 July 33,367 20,138
Additions 3,664 13,229
Carrying amount at 30 June 37,031 33,367
Land Improvements:
Carrying amount at 1 July 1,436 1,432
Additions 367 180
Depreciation for the year (245) (176)
Carrying amount at 30 June 1,558 1,436
Buildings and Improvements:
Carrying amount at 1 July 4,670 4,720
Additions 9,227 379
Disposals (11) (4)
Depreciation for the year (537) (425)
Carrying amount at 30 June 13,349 4,670

N O T E S T O A N D F O R M I N G PA R T O F T H E F I N A N C I A L S TAT E M E N T S
F I N A N C I A L S T A T E M E N T Sas a t 30 June 2003
F R E M A N T L E P O R T S A N N U A L R E P O R T 2 0 0 387
7.1 Property, Plant and Equipment (Continued)
Reconciliations of carrying amounts (Continued)2003$ʼ000
2002$ʼ000
Plant and equipment:
Carrying amount at 1 July 17,939 5,124
Additions 1,746 14,237
Disposals (2) (57)
Depreciation for the year (2,061) (1,180)
Write down to recoverable amount - (185)
Carrying amount at 30 June 17,622 17,939
Berths, jetties and infrastructure:
Carrying amount at 1 July 20,188 21,293
Additions 2,362 1,255
Disposals - (178)
Depreciation for the year (2,134) (2,182)
Carrying amount at 30 June 20,416 20,188
117,308 106,043
Add: Work in progress 6,212 2,180
Total property, plant and equipment 123,520 108,223
Acquisition of Business
On 31 January 2002, Fremantle Ports acquired the Kwinana based bulk handling business fromBHP Billiton.
The cost of acquisition, including incidental costs is detailed below:
Business assets $2.94 million
Land $12.92 million
The acquisition cost included a contingent contribution not recognized at 30 June 2002.
The contingent amount has been paid during the course of the financial year resulting in additionsto plant and equipment.
Valuations
An independent valuation of Fremantle Ports ̓land and buildings carried out as at 30 June 2003 resulted in a valuation of buildings of $20.76 million and a valuation of land of $107.64 million. Valuation of land was based on market value for either highest and best use or existing use. Valuation of buildings was based on written down current cost. As land and buildings are recorded at cost, the valuation has not been brought to account.

N O T E S T O A N D F O R M I N G PA R T O F T H E F I N A N C I A L S TAT E M E N T S
F I N A N C I A L S T A T E M E N T Sas a t 30 June 2003
F R E M A N T L E P O R T S A N N U A L R E P O R T 2 0 0 388
7.2 Deferred Tax Assets
2003$ʼ000
2002$ʼ000
Future income tax benefit 7,597 6,325
8. CURRENT AND NON-CURRENT LIABILITIES
8.1 Payables
Payables represent Trade Creditors, Amounts Payable and Accrued Expenses. Accrued expenses are comprised of interest and charges for goods and services received but not invoiced as at reporting date.
2003$ʼ000
2002$ʼ000
Trade Creditors and Amounts Payable 7,374 3,266
Accrued Expenses 1,720 1,718
9,094 4,984
(i) Significant Terms and Conditions
Trade creditors payable are usually settled within 30 days.
(ii) Net Fair Values
The directors consider the carrying amounts of trade creditors represent their net fair values.
8.2 Interest Bearing Liabilities
2003$ʼ000
2002$ʼ000
Current
Direct Borrowings 977 977
Special Borrowings 456 390
Other Borrowings 2,670 2,830
4,103 4,197
Non Current
Direct Borrowings 8,984 9,962
Special Borrowings 8,705 9,160
Other Borrowings 3,778 6,448
21,467 25,570

N O T E S T O A N D F O R M I N G PA R T O F T H E F I N A N C I A L S TAT E M E N T S
F I N A N C I A L S T A T E M E N T Sas a t 30 June 2003
F R E M A N T L E P O R T S A N N U A L R E P O R T 2 0 0 389
8.2 Interest Bearing Liabilities (Continued)
2003$ʼ000
2002$ʼ000
Financing arrangements
Fremantle Ports has access to the following lines of credit
Total facilities available:
Liquidity Facility 10,000 10,000
Direct Borrowings 70,000 70,000
Special Borrowings 20,000 20,000
100,000 100,000
Facilities utilised at balance date:
Liquidity Facility - -
Direct Borrowings 9,961 10,939
Special Borrowings 9,161 9,550
19,122 20,489
Facilities not utilised at balance date:
Liquidity Facility 10,000 10,000
Direct Borrowings 60,039 59,061
Special Borrowings 10,839 10,450
80,878 79,511
The lines of credit do not have a term. Funds can be accessed only after WA Government approval.
(i) Significant Terms and Conditions
All interest-bearing liabilities are unsecured.
The interest and principal for the Direct Borrowings are payable quarterly. The weighted average interest rate at 30 June 2003 on the loan portfolio is 4.67% per annum (2002: 5.58%).
Included in Special Borrowings is an amount to fund the acquisition of a new bulk unloader at Fremantle Ports ̓Kwinana Bulk Jetty. Interest and principal is payable quarterly on part of the borrowing and the remainder is subject to interest only. Interest rates on the Special Borrowings are fixed and range from 4.74% to 6.15% per annum (2002: 6.15% to 7.11%).
Included in Other Borrowings are deferred payments for assets acquired. In accordance with AASB 1015 Acquisition of Assets, the fair value of the cash consideration has been discounted at the rate of 6.0% being the present value of the amounts payable as at acquisition date.

N O T E S T O A N D F O R M I N G PA R T O F T H E F I N A N C I A L S TAT E M E N T S
F I N A N C I A L S T A T E M E N T Sas a t 30 June 2003
F R E M A N T L E P O R T S A N N U A L R E P O R T 2 0 0 390
8.2 Interest Bearing Liabilities (Continued)
(ii) Interest Rate Risk Exposures
Fremantle Ports exposure to interest rate risk on the interest bearing liabilities and the effective weighted average interest rate at 30 June 2003 by maturity periods is set out in the following table.
2003 Fixed Interest maturing in:
1 year or less
$ʼ000
Over 1 to 5 years$ʼ000
More than 5 years$ʼ000
Total$ʼ000
Interest Bearing Liabilities:
Direct borrowings 977 3,909 5,075 9,961
Special borrowings - - 9,161 9,161
Other borrowings 2,670 3,778 - 6,448
3,647 7,687 14,235 25,570
Weighted Average Interest Rate:
Direct borrowings 4.65% 4.50% 4.92%
Special borrowings - - 5.21%
Other borrowings 6.00% 6.00% -
2002 Fixed Interest maturing in:
1 year or less
$ʼ000
Over 1 to 5 years$ʼ000
More than 5 years$ʼ000
Total$ʼ000
Interest Bearing Liabilities:
Direct borrowings 977 3,909 6,053 10,939
Special borrowings - - 9,550 9,550
Other borrowings 2,830 6,448 - 9,278
3,807 10,357 15,603 29,767
Weighted Average Interest Rate:
Direct borrowings 4.94% 5.81% 6.22%
Special borrowings - - 6.78%
Other borrowings 6.00% 6.00% -
(iii) Net Fair Values
The directors consider the carrying amount of all interest bearing liabilities approximatetheir net fair value.

N O T E S T O A N D F O R M I N G PA R T O F T H E F I N A N C I A L S TAT E M E N T S
F I N A N C I A L S T A T E M E N T Sas a t 30 June 2003
F R E M A N T L E P O R T S A N N U A L R E P O R T 2 0 0 391
9. COMMITMENTS
9.1 Capital Works
As at 30 June 2003, Fremantle Ports had contracted capital expenditure commitments amounting to $2.218 million (2002: $13.202 million) in respect of approved capital works but not recognised in the financial statements.
Capital Commitments
Commitments for the acquisition of plant and equipment and land contracted for at the reporting date but not recognised as liabilities:
2003$ʼ000
2002$ʼ000
Payable within one year 2,218 13,202
2.2 Lease Commitments
Operating Leases Payable
Commitments for operating leases payable at reporting date but not recognised as liabilities:
2003$ʼ000
2002$ʼ000
Payable within one year 542 513Later than one year but not later than 5 years 462 518
1,004 1,031
Operating Leases Receivable
Commitments for operating leases receivable at reporting date but not recognised as assets:
2003$ʼ000
2002$ʼ000
Receivable within one year 11,045 8,915Later than one year but not later than 5 years 37,869 30,091
Later than five years 83,441 68,520
132,355 107,526
Operating leases receivable are in respect of property rentals.

N O T E S T O A N D F O R M I N G PA R T O F T H E F I N A N C I A L S TAT E M E N T S
F I N A N C I A L S T A T E M E N T Sas a t 30 June 2003
F R E M A N T L E P O R T S A N N U A L R E P O R T 2 0 0 392
10. TAX LIABILITIES
Current Tax Liabilities
2003$ʼ000
2002$ʼ000
Income Tax 194 2,553
Non-Current – Deferred Tax Liabilities
2003$ʼ000
2002$ʼ000
Deferred Income Tax 972 91
11. PROVISIONS
(a) Current
2003$ʼ000
2002$ʼ000
Dividends 5,155 6,798
Fringe Benefits Tax 12 14
Employee Benefits 2,881 2,368
8,048 9,180
(b) Non-Current
2003$ʼ000
2002$ʼ000
Employee Benefits 10,247 9,034

N O T E S T O A N D F O R M I N G PA R T O F T H E F I N A N C I A L S TAT E M E N T S
F I N A N C I A L S T A T E M E N T Sas a t 30 June 2003
F R E M A N T L E P O R T S A N N U A L R E P O R T 2 0 0 393
11. PROVISIONS (Continued) (c) Aggregate Employee Benefits
2003$ʼ000
2002$ʼ000
Current Liability 2,881 2,368Non-Current Liability 10,247 9,034
13,128 11,402
(i) Net Fair Values
The directors consider the carrying amounts of employee entitlements represent their net fair value.
12. OTHER LIABILITIES
Other liabilities represent prepaid income, being rentals received in advance applicable to the 2003/04 financial year and beyond.
Current 2003$ʼ000
2002$ʼ000
Prepaid Rental Income 1,467 1,167
Income Received in Advance 275 -
Interest Received in Advance 22 41
Others 10 2
1,774 1,210Non-Current
Prepaid Rental Income 1,685 1,903

N O T E S T O A N D F O R M I N G PA R T O F T H E F I N A N C I A L S TAT E M E N T S
F I N A N C I A L S T A T E M E N T Sas a t 30 June 2003
F R E M A N T L E P O R T S A N N U A L R E P O R T 2 0 0 394
13. EQUITY Contributed equity
2003$ʼ000
2002$ʼ000
Opening Balance 45,310 41,271
Add: Equity Contribution 221 4,039
Balance as at 30 June 45,531 45,310
On 12 December 2000, Fremantle Ports entered into a fixed interest loan of $5 million with the Western Australian Treasury Corporation which partially funded the acquisition of a new bulk unloader at the Fremantle Ports ̓Kwinana Bulk Jetty.
The WA Government has agreed to provide support on borrowing costs for this loan by way of equity contributions to Fremantle Ports. The amount of equity contributions made to Fremantle Ports is equivalent to the after tax costs of the borrowing costs paid by Fremantle Ports.
The period of the equity contribution is subject to a review in accordance with the terms of agreement between Government and Fremantle Ports.
Also included in the equity contribution for 2002 is $3.82 million received from Government. Fremantle Ports has committed to apply this amount to the Fremantle Waterfront project infrastructure.
14. RESERVES AND RETAINED PROFITS
2003$ʼ000
2002$ʼ000
(a) ReservesAsset Revaluation Reserve 5,102 5,102
The asset revaluation reserve was created prior to the adoption of AASB 1041 Revaluation on NonCurrent Assets implemented as at 30 June 2001 when Fremantle Ports adopted the cost method ofvaluing property, plant and equipment.
2003$ʼ000
2002$ʼ000
(b) Retained ProfitsRetained profits at 1 July 40,890 34,092Net effect of initial adoption of AASB 1028 Employee Benefits (refer to note 1.15) (201) -
Net Profit 12,421 13,596
Dividends (refer to note 5) (5,155) (6,798)
Retained profits at 30 June 47,955 40,890

N O T E S T O A N D F O R M I N G PA R T O F T H E F I N A N C I A L S TAT E M E N T S
F I N A N C I A L S T A T E M E N T Sas a t 30 June 2003
F R E M A N T L E P O R T S A N N U A L R E P O R T 2 0 0 395
15. RECONCILIATION OF NET CASH INFLOW FROM OPERATING ACTIVITIES TO PROFIT FROM ORDINARY ACTIVITIES AFTER INCOME TAX
2003$ʼ000
2002$ʼ000
Profit from Ordinary Activities After Income Tax 12,421 13,596
Depreciation 6,088 5,074
Write down of assets to recoverable amount - 185
Net Loss \ (Gain) on Disposal of Property, Plant and Equipment 15 (787)
Contribution of asset (2,110) -
Changes in Assets and Liabilities:
Receivables (3,565) (3,134)
Prepaid Expenses (62) 39
Payables 4,040 (5,236)
Prepaid Rental Income and Income Received in Advance 356 1,691
Movements in Provisions:
Doubtful Debts - 110
Employee Benefits 1,440 846
Income Tax (2,359) (563)
Future Income Tax Benefit (1,186) (1,041)
Provision for Deferred Income Tax 882 (36)
Others (3) (996)
NET CASH INFLOW FROM OPERATING ACTIVITIES 15,957 9,748
16. REMUNERATION OF DIRECTORS
2003 2002$ $
The total fees, salaries and other benefits received or due and receivable for the year, by directors of the Fremantle Ports. 86,470 71,121
The number of directors of the Fremantle Ports whose total fees, salaries and other benefits received or due and receivable for theyear, falls within the following bands:-
2003 2002$0 - $10,000 - 2
$10,001 - $20,000 3 3
$20,001 - $30,000 2 1

N O T E S T O A N D F O R M I N G PA R T O F T H E F I N A N C I A L S TAT E M E N T S
F I N A N C I A L S T A T E M E N T Sas a t 30 June 2003
F R E M A N T L E P O R T S A N N U A L R E P O R T 2 0 0 396
17. REMUNERATION OF EXECUTIVES
2003 2002$ $
The total fees, salaries and other benefits received or due and receivable for the year, by executives who are directly accountable and responsible for the strategic direction and operational management of Fremantle Ports. 875,476 825,529
The number of executives of the Fremantle Ports whose total fees, salaries and other benefits received or due and receivable for the year, falls within the following bands:-
2003 2002$180,001 - $190,000 - 1
$190,001 - $200,000 2 2
$200,001 - $210,000 1 -
$250,001 - $260,000 - 1
$270,001 - $280,000 1 -
18. REMUNERATION OF AUDITORS 2003 2002
$ $
Remuneration for audit of the financial statements. 72,000 79,000

N O T E S T O A N D F O R M I N G PA R T O F T H E F I N A N C I A L S TAT E M E N T S
F I N A N C I A L S T A T E M E N T Sas a t 30 June 2003
F R E M A N T L E P O R T S A N N U A L R E P O R T 2 0 0 397
19. RELATED PARTIES
The following persons held the position of director during the financial year:
Mr. Ron Aitkenhead
Mr. Joe McKay
Mr. Robert Edel
Mr. Tony Finucane
Mrs. Rosemary Pinter
Information on remuneration and retirement benefits received or receivable by directorsis disclosed in Note 16.
20. SEGMENT INFORMATION
The mission statement of Fremantle Ports is “To add value for our customers and stakeholders by facilitating trade in a commercial and efficient manner while fulfilling our social and environmental responsibilities”.
Fremantle Ports ̓activities are directed towards achieving this mission and in this regard Fremantle Ports operate in one reportable business segment for reporting purposes as required by the revised AASB 1005 Segment Reporting. The principal activity of Fremantle Ports is the provision of port related activities and services. An analysis of the revenue of Fremantle Ports is disclosed in Note 2 - Revenue from Ordinary Activities.
Fremantle Ports operates predominantly in the one geographical segment, being Australia.

F R E M A N T L E P O R T S A N N U A L R E P O R T 2 0 0 398
F I N A N C I A L S T A T E M E N T Sas at 30 June 2003
DIRECTORS ̓DECLARATION
In the opinion of the Directors of the Fremantle Port Authority:
(a) The Statement of Financial Performance gives a true and fair view of the Fremantle Port Authorityʼs profit for the financial year 1 July 2002 to 30 June 2003;
(b) The Statement of Financial Position gives a true and fair view of the Fremantle Port Authorityʼs state of affairs as at 30 June 2003;
(c) At the date of this statement there are reasonable grounds to believe that the Fremantle Port Authority will be able to pay its debts as and when they fall due.
The financial statements included in this Annual Report have been made out in accordance with applicable Accounting Standards, other mandatory professional reporting requirements and the financial reporting provisions of the Port Authorities Act 1999.
This statement is signed in accordance with a resolution of the Directors.
Chairman
Deputy Chairman
22 August 2003
D I R E C T O R S ʼ D E C L A R AT I O N

F I N A N C I A L S T A T E M E N T Sas a t 30 June 2003
F R E M A N T L E P O R T S A N N U A L R E P O R T 2 0 0 399
F I N A N C I A L A U D I T O P I N I O N
INDEPENDENT AUDIT REPORT ON FREMANTLE PORT AUTHORITY
To the Parliament of Western Australia
Audit OpinionIn my opinion, the financial statements of the Fremantle Port Authority are properly drawn up:
(a) so as to give a true and fair view of:(i) the Authorityʼs financial position at June 30, 2003 and of its performance for the financial year
ended on that date; and(ii) the other matters required by Schedule 5 of the Port Authorities Act 1999 to be dealt with in the
financial statements;(b) in accordance with the provisions of the Port Authorities Act 1999; and(c) in accordance with applicable Accounting Standards and other mandatory professional reporting
requirements in Australia.
ScopeThe Board s̓ RoleThe Board of Directors is responsible for the financial statements.
The financial statements consist of the Statement of Financial Performance, Statement of Financial Position, Statement of Cash Flows, accompanying Notes and Directors ̓Declaration.
Summary of my RoleAs required by the Port Authorities Act 1999, I have independently audited the financial statements to express an opinion on them. This was done by looking at a sample of the evidence.
An audit does not guarantee that every amount and disclosure in the financial statements is error free, nor does it examine all evidence and every transaction. However, my audit procedures should identify errors or omissions significant enough to adversely affect the decisions of users of the financial statements.
K O OʼNEILACTING AUDITOR GENERALAugust 29, 2003

F R E M A N T L E P O R T S A N N U A L R E P O R T 2 0 0 3100
F I N A N C I A L P E R F O R M A N C E I N D I C AT O R S
F I N A N C I A L S T A T E M E N T Sas at 30 June 2003
In addition to the key performance indicators provided, the following financial performance indicators, which are not subjected to audit, are provided to assist users to assess the financial management performance of Fremantle Ports. The indicators selected are considered appropriate for use in either evaluating the performance of a Government Trading Enterprise or an entity in the private sector.
Working Capital Ratio – Graph 1
This ratio is to ascertain the extent to which current assets may be realised to meet current liabilities.
2003$ʼ000
2002$ʼ000
Total Current Assets 25,055 = 1.1 35,476 = 1.6
Total Current Liabilities 23,213 22,124
Free Cash Flow – Graph 2
It measures the net cash flow available as a source of funds from operations after meeting interest costs.
2003$ʼ000
2002$ʼ000
Net Cashflow from Operations(after interest) 15,957 = 88.5% 9,748 = 89.3%
Net Cashflow from Operations (before interest)
18,025 10,920
Debtors Turnover – Average Collection Period for Debtors – Graph 3
Shows the rate at which debtors generate cash flow for use in operations.
2003$ʼ000
2002$ʼ000
Average Trade Debtors 6,674 x 365 = 30 days 5,321 x 365 = 29 days
Sales Revenue 80,273 67,203

F R E M A N T L E P O R T S A N N U A L R E P O R T 2 0 0 3101
F I N A N C I A L P E R F O R M A N C E I N D I C AT O R S
F I N A N C I A L S T A T E M E N T Sas at 30 June 2003
FINANCIAL PERFORMANCE INDICATORS Continued
Interest Cover - Graph 4
Provides an indication of the Portʼs ability to meet interest costs from operating profit.
2003$ʼ000
2002$ʼ000
Earnings Before Interest and Tax 19,978 = 9.1 times 20,472 = 14.8 times
Total Interest Costs 2,199 1,380
Return on Assets – Graph 5
This measures the rate of return earned through operating total assets provided by the Port.
2003$ʼ000
2002$ʼ000
Earnings Before Interest and Tax 19,978
= 13.1%20,472
= 14.6%Average Total Assets 152,566 140,500
Economic Rate of Return - Graph 6
In accordance with the new Government policy effective July 2000, Fremantle Ports is required to report a rate of return on non-current assets valued at Deprival Value. This indicator quantifies the rate of return earned on average current and non-current assets of the Port.
2003$ʼ000
2002$ʼ000
Operating EBIT(excluding significant items) + Depreciation – Deprival Value Depreciation 17,601
= 8.3%19,958
= 10.0%Current Assets + Deprival Value
of Assets – Accumulated Deprival Value Depreciation
212,178 199,543

F R E M A N T L E P O R T S A N N U A L R E P O R T 2 0 0 3102
F I N A N C I A L P E R F O R M A N C E I N D I C AT O R S
F I N A N C I A L S T A T E M E N T Sas at 30 June 2003
21.80 23.49 223.41 22.55 22.65
0.0
0.8
1.6
2.4
2002/032001/022000/011999/001998/99
Graph 1: Current RatioComparison 1998/1999 to 2002/2003
1.20 1.06 1.51 1.60 1.10 0.8 23.49 223.41 22.55 22.65
0%
10%
20%
30%
40%
50%
60%
70%
80%
90%
100%
2002/032001/022000/011999/001998/99
Graph 2: Free CashflowComparison 1998/1999 to 2002/2003
62.5% 79.1% 87.8% 89.3% 88.5%
0.8 23.49 223.41 v 29
0
5
10
15
20
25
30
35
2002/032001/022000/011999/001998/99
Graph 3: Average Collection PeriodComparison 1998/1999 to 2002/2003
27 26 25 29 30 0.8 23.49 223.41 v 29
0
7
14
21
2002/032001/022000/011999/001998/99
Graph 4: Interest CoverComparison 1998/1999 to 2002/2003
3.50 5.19 12.48 14.83 9.10
17.0% 15.6% 13.5% 14.6% 13.1%
0%
10%
20%
2002/032001/022000/011999/001998/99
Graph 5: Return on AssetsComparison 1998/1999 to 2002/2003
8.8% 8.7% 9.0% 10.0% 8.3%
0.0%
3.0%
6.0%
9.0%
12.0%
2002/032001/022000/011999/001998/99
Graph 6: Economic Rate of ReturnComparison 1998/1999 to 2002/2003
From 1998/1999 to 1999/2000 the rate of return was based on assets valued at current cost. The rate of return from 2000/2001 is based on assets valued at deprival value.