Embed Size (px)
Citation preview

FINANCIAL STATEMENTS
Contents
Financial Statements128 Independent Auditor’s Report Consolidated Financial Statements133 Consolidated Income Statement134 Consolidated Statement of Comprehensive Income135 Consolidated Balance Sheet136 Consolidated Statement of Changes in Equity138 Consolidated Cash Flow Statement Notes to the Consolidated Financial Statements Basis of reporting139 1. Description of business139 2. Basis of preparation and consolidation139 3. Foreign currency and translation140 4. Accounting pronouncements141 5. Critical accounting estimates and judgements Results for the year142 6. Segmental analysis146 7. Net sales revenue146 8. Operating expenses148 9. Finance costs, net148 10. Taxation151 11. Earnings per share151 12. Components of other comprehensive income Operating assets and liabilities152 13. Intangible assets155 14. Property, plant and equipment158 15. Interests in other entities161 16. Inventories162 17. Trade, other receivables and assets165 18. Assets classified as held for sale165 19. Trade and other payables166 20. Provisions and employee benefits171 21. Offsetting financial assets and financial liabilities172 22. Business combinations Risk management and capital structure173 23. Financial risk management and financial instruments184 24. Net debt188 25. Equity Other financial information190 26. Related party transactions192 27. Share based payments195 28. Contingencies196 29. Commitments196 30. Post balance sheet events
Strategic R
eport
Co
rporate G
overnance
Financial Statem
entsS
wiss S
tatutory R
eporting
Supplem
entary Inform
ation
127Coca-Cola HBC 2017 Integrated Annual Report

Independent auditor’s report to Coca-Cola HBC AG
Report on the audit of the consolidated financial statements
Our opinionIn our opinion, the consolidated financial statements give a true and fair view of the consolidated financial position of Coca-Cola HBC AG’s (the “Company”) and its subsidiaries (together the “Group”) as at 31 December 2017, and of its consolidated financial performance and its consolidated cash flows for the year then ended in accordance with International Financial Reporting Standards (IFRSs) as issued by the International Accounting Standards Board (IASB).
What we have auditedThe Group’s consolidated financial statements included within the 2017 Integrated Annual Report comprise:
– the consolidated balance sheet as at 31 December 2017;
– the consolidated income statement for the year then ended;
– the consolidated statement of comprehensive income for the year then ended;
– the consolidated statement of changes in equity for the year then ended;
– the consolidated cash flow statement for the year then ended; and
– the notes to the consolidated financial statements, which include a summary of significant accounting policies.
Basis for opinionWe conducted our audit in accordance with International Standards on Auditing (ISAs). Our responsibilities under those standards are further described in the Auditor’s responsibilities for the audit of the consolidated financial statements section of our report.
We believe that the audit evidence we have obtained is sufficient and appropriate to provide a basis for our opinion.
IndependenceWe are independent of the Group in accordance with applicable laws and regulations regarding independence relevant to our audit of the consolidated financial statements, including the International Ethics Standards Board for Accountants’ Code of Ethics for Professional Accountants (IESBA Code). We have also fulfilled our other ethical responsibilities in accordance with the IESBA Code and other applicable laws and regulations.
Our audit approach
Overview
As part of designing our audit, we determined materiality and assessed the risks of material misstatement in the consolidated financial statements. In particular, we looked at where the Directors made subjective judgements; for example, in respect of significant accounting estimates that involved making assumptions and considering future events that are inherently uncertain. As in all of our audits, we also addressed the risk of management override of internal controls, including among other matters consideration of whether there was evidence of bias by the Directors that represented a risk of material misstatement due to fraud.
Overall group materiality: €28.2 million, which represents 5% of profit before tax.
– We audited the complete financial information of the Company and of subsidiary undertakings in 16 countries.
– Taken together, the undertakings of which an audit of their complete financial information was performed accounted for 87% of consolidated net sales revenue, 93% of consolidated profit before tax and 88% of consolidated total assets of the Group.
– We also conducted specified audit procedures and analytical review procedures for other Group undertakings and functions.
Key audit matters, which remain the same as the prior year, comprised:
– Goodwill and indefinite-lived intangible assets impairment assessment.
– Uncertain tax positions.
– Provisions and contingent liabilities.
Key audit matters
Materiality
Group scoping
128 Coca-Cola HBC 2017 Integrated Annual Report
INDEPENDENT AUDITOR’S REPORT

MaterialityThe scope of our audit was influenced by our application of materiality. An audit is designed to obtain reasonable assurance whether the financial statements are free from material misstatement. Misstatements may arise due to fraud or error. They are considered material if individually or in aggregate, they could reasonably be expected to influence the economic decisions of users taken on the basis of the consolidated financial statements.
Based on our professional judgement, we determined certain quantitative thresholds for materiality, including the overall group materiality for the consolidated financial statements as a whole as set out in the table below. These, together with qualitative considerations, helped us to determine the scope of our audit and the nature, timing and extent of our audit procedures and to evaluate the effect of misstatements, both individually and in aggregate, on the financial statements as a whole.
Overall group materiality €28.2 million (2016: €22.9 million)How we determined it 5% of profit before tax
Rationale for the materiality benchmark applied
We chose profit before tax as the benchmark because, in our view, it is one of the principal measures considered by users, and is a generally accepted benchmark. We chose 5% which is within the range of acceptable quantitative materiality thresholds in generally accepted auditing practice.
We agreed with the Audit and Risk Committee that we would report to them misstatements identified during our audit above €1.0 million as well as misstatements below that amount that, in our view, warranted reporting for qualitative reasons.
Key audit matters Key audit matters are those matters that, in our professional judgement, were of most significance in our audit of the consolidated financial statements of the current period. These matters were addressed in the context of our audit of the consolidated financial statements as a whole, and in forming our opinion thereon, and we do not provide a separate opinion on these matters.
Key audit matter How our audit addressed the key audit matter
Goodwill and indefinite-lived intangible assets impairment assessment Refer to Note 13 for intangible assets including goodwill.
Goodwill and indefinite-lived intangible assets as at 31 December 2017 amount to €1,621.2 million and €199.9 million, respectively.
The above noted amounts have been allocated to individual cash-generating units (‘CGUs’). The impairment assessment must be performed at least annually and involves the determination of the recoverable amount, being the higher of the value-in-use and the fair value less costs to dispose.
This area was a key matter for our audit due to the size of goodwill and indefinite-lived intangible assets and because the determination of whether elements of goodwill and of indefinite-lived intangible assets are impaired involves complex and subjective estimates and judgements by management about the future results of the CGUs. These estimates and judgements include assumptions surrounding revenue growth rates, direct costs, foreign exchange rates and discount rates.
Furthermore, macroeconomic volatility, competitor activity and regulatory/fiscal developments can adversely affect each CGU and potentially the carrying amount of goodwill and indefinite-lived intangible assets.
No impairment charge was recorded in 2017. Goodwill and franchise agreements held by the Nigeria CGU have been determined by management to remain sensitive to changes in the key drivers of cash flow forecasts given the macroeconomic volatility in Nigeria.
We evaluated the appropriateness of management’s identification of the Group’s CGUs and the process by which management prepared the CGUs value-in-use calculations which we found to be satisfactory for the purposes of our audit. We tested the mathematical accuracy of the CGUs value-in-use calculations and compared them to the latest budget approved by the Directors and assessed the quality of the budgeting process by comparing the prior year budget with actual data.
With the support of our valuation specialists, we challenged management’s analysis around the key drivers of cash flow forecasts including selling price increases, short-term and long-term volume growth and the level of direct costs by comparing them with either the Group’s historical information or market data, as appropriate. We also evaluated the appropriateness of other key assumptions including discount rates and foreign exchange rates by comparing them to relevant market data. We found the assumptions to be consistent and in line with our expectations.
We also performed sensitivity analyses on the key drivers of cash flow forecasts for the CGUs with significant balances of goodwill and indefinite-lived intangible assets as well as for CGUs which remain sensitive to changes in the key drivers, including the goodwill and franchise agreements held by the Nigeria CGU.
We assessed the appropriateness and completeness of the related disclosures in Note 13, and consider them to be reasonable. As a result of our work, we found that the determination by management that no impairment was required for goodwill and indefinite-lived intangible assets was supported by assumptions within reasonable ranges.
129Coca-Cola HBC 2017 Integrated Annual Report
Strategic R
eport
Co
rporate G
overnance
Financial Statem
entsS
wiss S
tatutory R
eporting
Supplem
entary Inform
ation

Key audit matter How our audit addressed the key audit matter
Uncertain tax positionsRefer to Note 10 for taxation and Note 28 for contingencies.
The Group operates in a complex multinational tax environment which gives rise to uncertain tax positions in relation to corporation tax, transfer pricing and indirect taxes. As at 31 December 2017, the Group has current tax liabilities of €97.5 million which include €69.2 million of provisions for tax uncertainties.
The Group establishes provisions based on management’s judgements of the probable amount of the liability. Given the number of judgements involved in estimating the provisions relating to uncertain tax positions and the complexities of dealing with tax rules and regulations in numerous jurisdictions, this was considered as a key audit matter.
We evaluated the related accounting policy for provisioning for tax exposures and found it to be appropriate.
In conjunction with our tax specialists, we evaluated management’s judgements in respect of estimates of tax exposures and contingencies in order to assess the adequacy of the Group’s tax provisions. In order to understand and evaluate management’s judgements, we considered the status of current tax authority audits and enquiries, the outcome of previous tax authority audits, judgemental positions taken in tax returns and current year estimates and recent developments in the tax environments in which the Group operates.
We challenged management’s key assumptions, in particular on cases where there had been significant developments with tax authorities, noting no significant deviation from our expectations.
From the evidence obtained and in the context of the consolidated financial statements, taken as a whole, we consider the provisions in relation to uncertain tax positions as at 31 December 2017 to be appropriate.
Provisions and contingent liabilitiesRefer to Note 20 for provisions and Note 28 for contingencies.
The Group faces a number of threatened and actual legal and regulatory proceedings. The determination of the provision and/or the level of disclosure required involves a high degree of judgement resulting in provisions and contingent liabilities being considered as a key audit matter.
We evaluated the design of, and tested, key controls in respect of litigation and regulatory procedures, which we found to be satisfactory for the purposes of our audit.
Our procedures included the following:
– where relevant, reading external legal advice obtained by management;
– discussing open matters with the Group general counsel;
– meeting with local management and reading subsequent correspondence;
– assessing and challenging management’s conclusions through understanding precedents set in similar cases; and
– circularising relevant third-party legal representatives and follow up discussions, where appropriate, on certain material cases.
On the basis of the work performed, whilst noting the inherent uncertainty with such legal and regulatory matters, we determined the relevant provisions as at 31 December 2017 to be appropriate.
We assessed the appropriateness of the related disclosures in Note 28 and considered these to be reasonable.
How we tailored our group audit scopeWe tailored the scope of our audit in order to perform sufficient work to enable us to provide an opinion on the consolidated financial statements as a whole, taking into account the geographic structure of the Group, the accounting processes and controls, and the industry in which the Group operates.
The Group operates through its trading subsidiary undertakings in 28 countries, as set out on page 142 of the 2017 Integrated Annual Report. The processing of the accounting entries for these entities is largely centralised in a shared services centre in Bulgaria, except for the subsidiary undertakings in Russia, Ukraine, Belarus and Armenia, which process their accounting entries locally. The Group also operates a centralised treasury function in the Netherlands and in Greece and a centralised procurement function in Austria. We considered the nature of the work that needed to be performed on these entities and functions by us, as the group engagement team and by component auditors from other PwC network firms. Where work was performed by component auditors, we determined the level of involvement we needed to have in the audit work at those entities or functions to be able to conclude whether appropriate audit evidence had been obtained as a basis for our opinion on the consolidated financial statements as a whole.
Based on the significance to the consolidated financial statements and in light of the key audit matters as noted above, we identified subsidiary undertakings in 16 countries (including the trading subsidiary undertakings in Russia, Nigeria and Italy) which in our view, required an audit of their complete financial information. Furthermore, the Company’s complete financial information was subject to audit. Specified audit procedures on certain balances and transactions were also performed on one joint venture and the corporate service centres in Greece and Austria. In addition, audit procedures were performed with respect to the centralised treasury function by the group engagement team and by the component audit team in Austria as regards to the centralised procurement function. The group engagement team also performed analytical review and other procedures on balances and transactions of subsidiary undertakings not covered by the procedures described above.
130 Coca-Cola HBC 2017 Integrated Annual Report
INDEPENDENT AUDITOR’S REPORT CONTINUED

Our group engagement team’s involvement with respect to audit work performed by component auditors included site visits (to Russia, Nigeria, Italy, Switzerland, Romania, Poland, Austria Bulgaria and Greece), conference calls with component audit teams, meetings with local management, review of component auditor work papers, attendance at component audit clearance meetings, and other forms of interactions as considered necessary depending on the significance of the component and the extent of accounting and audit issues arising. The group engagement team was also responsible for planning, designing and overseeing the audit procedures performed at the shared services centre in Bulgaria. The Group consolidation, financial statement disclosures and a number of areas of significant judgement, including goodwill and intangible assets, material provisions and contingent liabilities, were audited by the group engagement team. We also performed work centrally on IT general controls. This year, we held a two-day audit planning workshop in Bulgaria focusing on planning and risk assessment activities, auditor independence, centralised testing procedures and implementation of new IFRSs. This audit planning workshop was attended by the component teams responsible for the subsidiaries requiring an audit of their complete financial information.
Based on the above, the undertakings of which an audit of their complete financial information was performed accounted for 87% of consolidated net sales revenue, 93% of consolidated profit before tax and 88% of consolidated total assets of the Group.
Other information The Directors are responsible for the other information. The other information comprises Coca-Cola HBC AG’s 2017 Integrated Annual Report (but does not include the consolidated financial statements, our auditor’s report thereon and the Swiss statutory reporting), which we obtained prior to the date of this auditor’s report.
Our opinion on the consolidated financial statements does not cover the other information and, accordingly, we do not express an audit opinion or, except to the extent otherwise explicitly stated in this report, any form of assurance thereon.
In connection with our audit of the consolidated financial statements, our responsibility is to read the other information identified above and, in doing so, consider whether the other information is materially inconsistent with the consolidated financial statements or our knowledge obtained in the audit, or otherwise appears to be materially misstated.
If, based on the work we have performed, we conclude that there is a material misstatement of this other information, we are required to report that fact. We have nothing to report on these responsibilities.
UK Corporate Governance Code provisionsWe have nothing to report in respect of our responsibility to report when the Directors’ statement relating to the Company’s compliance with the UK Corporate Governance Code (the “Code”) does not properly disclose a departure from a relevant provision of the Code specified, under the Listing Rules, for review by the auditor.
The Directors’ statement on going concernWe have reviewed the statement on going concern, included in the Statement of Directors’ Responsibilities, in Coca-Cola HBC AG’s 2017 Integrated Annual Report on page 126, as if the Company were a UK incorporated premium listed entity. We have nothing to report having performed our review.
As noted in the Statement of Directors’ Responsibilities, the Directors have concluded that it is appropriate to prepare the consolidated financial statements using the going concern basis of accounting. The going concern basis presumes that the Group has adequate resources to remain in operation, and that the Directors intend it to do so, for at least one year from the date the consolidated financial statements were signed. As part of our audit we have concluded that the Directors’ use of the going concern basis is appropriate.
However, because not all future events or conditions can be predicted, these statements are not a guarantee as to the Group’s ability to continue as a going concern.
The Directors’ assessment of the prospects of the GroupWe have also reviewed the Directors’ statement in relation to the longer-term viability of the Group, set out on page 70, of the Coca-Cola HBC’s 2017 Integrated Annual Report as if the Company were a UK incorporated premium listed entity. Our review was substantially less in scope than an audit and only consisted of making inquiries and considering the Directors’ process supporting their statement; checking that the statement is in alignment with the relevant provisions of the Code; and considering whether the statement is consistent with the knowledge acquired by us in the course of performing our audit. We have nothing to report having performed our review.
Responsibilities of the Directors for the consolidated financial statementsAs explained more fully in the Statement of Directors’ Responsibilities set out in the 2017 Integrated Annual Report on page 126, the Directors are responsible for the preparation of the consolidated financial statements and for being satisfied that they give a true and fair view, and for such internal control as the Directors determine is necessary to enable the preparation of consolidated financial statements that are free from material misstatement, whether due to fraud or error.
In preparing the consolidated financial statements, the Directors are responsible for assessing the Group’s ability to continue as a going concern, disclosing, as applicable, matters related to going concern and using the going concern basis of accounting unless the Directors either intend to liquidate the Group or to cease operations, or have no realistic alternative but to do so.
131Coca-Cola HBC 2017 Integrated Annual Report
Strategic R
eport
Co
rporate G
overnance
Financial Statem
entsS
wiss S
tatutory R
eporting
Supplem
entary Inform
ation

Auditor’s responsibilities for the audit of the consolidated financial statementsOur objectives are to obtain reasonable assurance about whether the consolidated financial statements as a whole are free from material misstatement, whether due to fraud or error, and to issue an auditor’s report that includes our opinion. Reasonable assurance is a high level of assurance, but is not a guarantee that an audit conducted in accordance with ISAs will always detect a material misstatement when it exists. Misstatements can arise from fraud or error and are considered material if, individually or in the aggregate, they could reasonably be expected to influence the economic decisions of users taken on the basis of these consolidated financial statements.
As part of an audit in accordance with ISAs, we exercise professional judgement and maintain professional scepticism throughout the audit. We also:
– Identify and assess the risks of material misstatement of the consolidated financial statements, whether due to fraud or error, design and perform audit procedures responsive to those risks, and obtain audit evidence that is sufficient and appropriate to provide a basis for our opinion. The risk of not detecting a material misstatement resulting from fraud is higher than for one resulting from error, as fraud may involve collusion, forgery, intentional omissions, misrepresentations, or the override of internal control.
– Obtain an understanding of internal control relevant to the audit in order to design audit procedures that are appropriate in the circumstances, but not for the purpose of expressing an opinion on the effectiveness of the Group’s internal control.
– Evaluate the appropriateness of accounting policies used and the reasonableness of accounting estimates and related disclosures made by the Directors.
– Conclude on the appropriateness of the Directors’ use of the going concern basis of accounting and, based on the audit evidence obtained, whether a material uncertainty exists related to events or conditions that may cast significant doubt on the Group’s ability to continue as a going concern. If we conclude that a material uncertainty exists, we are required to draw attention in our auditor’s report to the related disclosures in the consolidated financial statements or, if such disclosures are inadequate, to modify our opinion. Our conclusions are based on the audit evidence obtained up to the date of our auditor’s report. However, future events or conditions may cause the Group to cease to continue as a going concern.
– Evaluate the overall presentation, structure and content of the consolidated financial statements, including the disclosures, and whether the consolidated financial statements represent the underlying transactions and events in a manner that achieves fair presentation.
– Obtain sufficient appropriate audit evidence regarding the financial information of the entities or business activities within the Group to express an opinion on the consolidated financial statements. We are responsible for the direction, supervision and performance of the group audit. We remain solely responsible for our audit opinion.
We communicate with those charged with governance regarding, among other matters, the planned scope and timing of the audit and significant audit findings, including any significant deficiencies in internal control that we identify during our audit. Those charged with governance are responsible for overseeing the Group’s financial reporting process.
We also provide those charged with governance with a statement that we have complied with relevant ethical requirements regarding independence, and to communicate with them all relationships and other matters that may reasonably be thought to bear on our independence, and where applicable, related safeguards.
From the matters communicated with those charged with governance, we determine those matters that were of most significance in the audit of the consolidated financial statements of the current period and are therefore the key audit matters. We describe these matters in our auditor’s report unless law or regulation precludes public disclosure about the matter or when, in extremely rare circumstances, we determine that a matter should not be communicated in our report because the adverse consequences of doing so would reasonably be expected to outweigh the public interest benefits of such communication.
Use of this reportThis report, including the opinion, has been prepared for and only for Coca-Cola HBC AG for the purpose of the Disclosure Guidance and Transparency Rules sourcebook and the Listing Rules of the Financial Conduct Authority and for no other purpose.
Marios Psaltisthe Certified Auditor, Reg. No. 38081for and on behalf of PricewaterhouseCoopers S.A.Certified Auditors, Reg. No. 113Athens, Greece
16 March 2018
Notes:(a) The maintenance and integrity of the Coca-Cola HBC AG website is the responsibility of the Directors; the work carried out by the auditors does not involve
consideration of these matters and, accordingly, the auditors accept no responsibility for any changes that may have occurred to the consolidated financial statements since they were initially presented on the website.
(b) Legislation in UK and Switzerland governing the preparation and dissemination of consolidated financial statements may differ from legislation in other jurisdictions.
132 Coca-Cola HBC 2017 Integrated Annual Report
INDEPENDENT AUDITOR’S REPORT CONTINUED
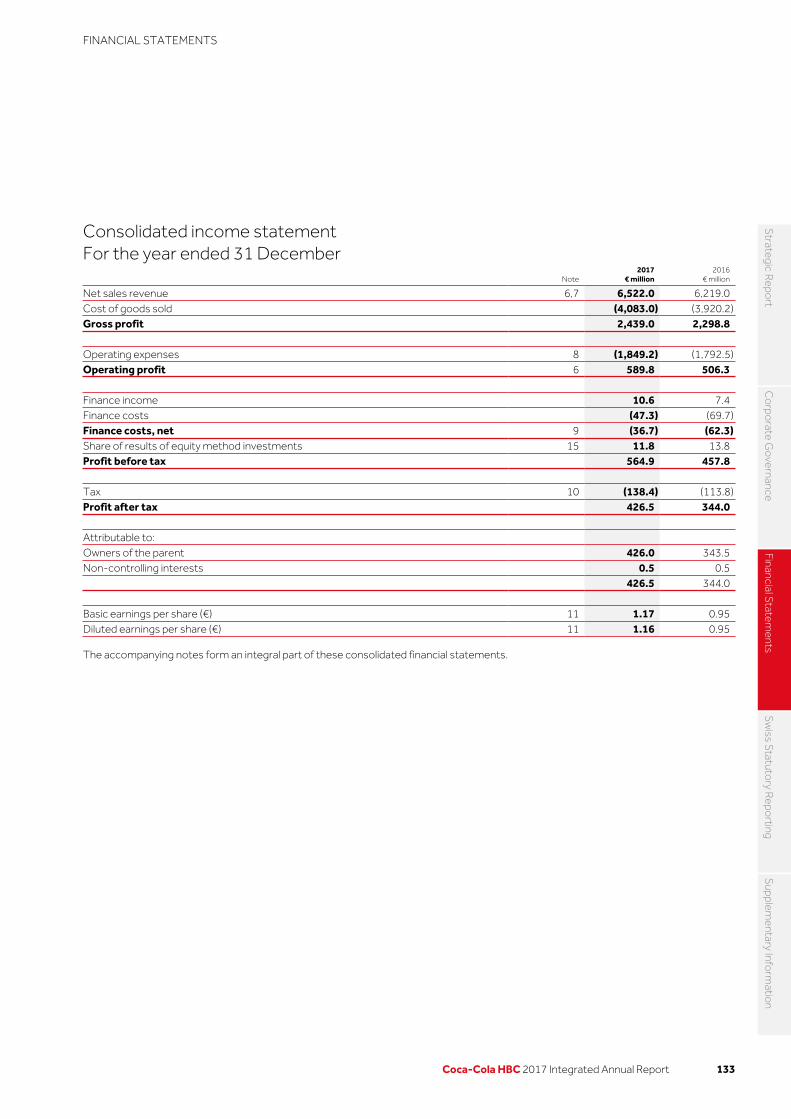
Consolidated income statementFor the year ended 31 December
Note2017
€ million2016
€ million
Net sales revenue 6,7 6,522.0 6,219.0Cost of goods sold (4,083.0) (3,920.2)Gross profit 2,439.0 2,298.8 Operating expenses 8 (1,849.2) (1,792.5)Operating profit 6 589.8 506.3 Finance income 10.6 7.4Finance costs (47.3) (69.7)Finance costs, net 9 (36.7) (62.3)Share of results of equity method investments 15 11.8 13.8Profit before tax 564.9 457.8 Tax 10 (138.4) (113.8)Profit after tax 426.5 344.0 Attributable to: Owners of the parent 426.0 343.5Non-controlling interests 0.5 0.5 426.5 344.0 Basic earnings per share (€) 11 1.17 0.95Diluted earnings per share (€) 11 1.16 0.95
The accompanying notes form an integral part of these consolidated financial statements.
133Coca-Cola HBC 2017 Integrated Annual Report
Strategic R
eport
Co
rporate G
overnance
Financial Statem
entsS
wiss S
tatutory R
eporting
Supplem
entary Inform
ation
FINANCIAL STATEMENTS
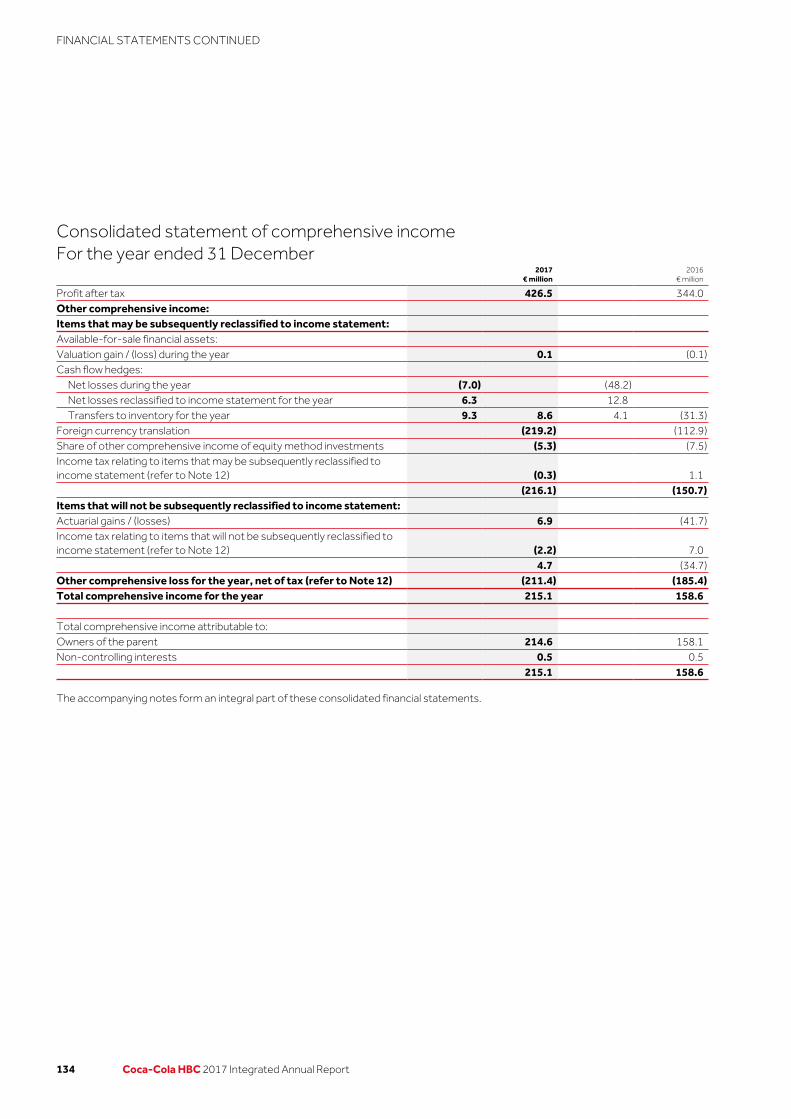
Consolidated statement of comprehensive incomeFor the year ended 31 December
2017
€ million2016
€ million
Profit after tax 426.5 344.0Other comprehensive income: Items that may be subsequently reclassified to income statement: Available-for-sale financial assets: Valuation gain / (loss) during the year 0.1 (0.1)Cash flow hedges:
Net losses during the year (7.0) (48.2) Net losses reclassified to income statement for the year 6.3 12.8 Transfers to inventory for the year 9.3 8.6 4.1 (31.3)
Foreign currency translation (219.2) (112.9)Share of other comprehensive income of equity method investments (5.3) (7.5)Income tax relating to items that may be subsequently reclassified to income statement (refer to Note 12) (0.3) 1.1 (216.1) (150.7)Items that will not be subsequently reclassified to income statement: Actuarial gains / (losses) 6.9 (41.7)Income tax relating to items that will not be subsequently reclassified to income statement (refer to Note 12) (2.2) 7.0 4.7 (34.7)Other comprehensive loss for the year, net of tax (refer to Note 12) (211.4) (185.4)Total comprehensive income for the year 215.1 158.6 Total comprehensive income attributable to: Owners of the parent 214.6 158.1Non-controlling interests 0.5 0.5 215.1 158.6
The accompanying notes form an integral part of these consolidated financial statements.
134 Coca-Cola HBC 2017 Integrated Annual Report
FINANCIAL STATEMENTS CONTINUED

Consolidated balance sheetAs at 31 December
Note2017
€ million 2016
€ million
Assets Intangible assets 13 1,829.9 1,885.7Property, plant and equipment 14 2,322.0 2,406.6Equity method investments 15 96.8 117.0Derivative financial instruments 23 4.4 8.1Deferred tax assets 10 59.1 57.5Other non-current assets 17 32.4 28.7Total non-current assets 4,344.6 4,503.6 Inventories 16 416.8 431.5Trade, other receivables and assets 17 966.8 1,030.8Other financial assets 24 150.9 –Derivative financial instruments 23 12.0 7.9Current tax assets 12.3 6.1Cash and cash equivalents 24 723.5 573.2 2,282.3 2,049.5Assets classified as held for sale 18 3.3 11.8Total current assets 2,285.6 2,061.3Total assets 6,630.2 6,564.9 Liabilities Borrowings 24 166.4 156.5Derivative financial instruments 23 4.5 14.2Trade and other payables 19 1,544.4 1,587.3Provisions and employee benefits 20 83.6 118.6Current tax liabilities 97.5 91.5Total current liabilities 1,896.4 1,968.1 Borrowings 24 1,459.8 1,468.1Derivative financial instruments 23 0.9 1.3Deferred tax liabilities 10 134.0 124.1Provisions and employee benefits 20 120.2 125.0Other non-current liabilities 6.7 8.2Total non-current liabilities 1,721.6 1,726.7Total liabilities 3,618.0 3,694.8 Equity Share capital 25 2,015.1 1,990.8Share premium 25 4,739.3 4,854.6Group reorganisation reserve 25 (6,472.1) (6,472.1)Treasury shares 25 (71.3) (70.7)Exchange equalisation reserve 25 (1,026.3) (801.8)Other reserves 25 271.2 245.1Retained earnings 3,551.5 3,119.7Equity attributable to owners of the parent 3,007.4 2,865.6Non-controlling interests 4.8 4.5Total equity 3,012.2 2,870.1Total equity and liabilities 6,630.2 6,564.9
The accompanying notes form an integral part of these consolidated financial statements.
135Coca-Cola HBC 2017 Integrated Annual Report
Strategic R
eport
Co
rporate G
overnance
Financial Statem
entsS
wiss S
tatutory R
eporting
Supplem
entary Inform
ation

Consolidated statement of changes in equity Attributable to owners of the parent
Non- controlling
interests€ million
Total equity
€ million
Share capital
€ million
Share premium
€ million
Group reorganisation
reserve€ million
Treasury shares
€ million
Exchange equalisation
reserve€ million
Other reserves€ million
Retained earnings€ million
Total€ million
Balance as 1 January 2016 2,000.1 5,028.3 (6,472.1) (132.0) (681.4) 260.4 2,816.5 2,819.8 4.3 2,824.1Shares issued to employees exercising stock options 9.1 12.5 – – – – – 21.6 – 21.6Share-based compensation:
Options and performance shares – – – – – 8.1 – 8.1 – 8.1Movement in shares held for equity compensation plan – – – (0.4) – – – (0.4) – (0.4)
Sale of own shares – – – 3.1 – – – 3.1 – 3.1Cancellation of shares (18.4) (40.1) – 58.5 – – – – – –Appropriation of reserves – – – 0.1 – 6.9 (7.0) – – –Dividends – (146.1) – – – – 1.4 (144.7) (0.3) (145.0) 1,990.8 4,854.6 (6,472.1) (70.7) (681.4) 275.4 2,810.9 2,707.5 4.0 2,711.5Profit for the year net of tax – – – 343.5 343.5 0.5 344.0Other comprehensive loss for the year, net of tax – – – (120.4) (30.3) (34.7) (185.4) – (185.4)Total comprehensive income for the year, net of tax1 – – – (120.4) (30.3) 308.8 158.1 0.5 158.6Balance as at 31 December 2016 1,990.8 4,854.6 (6,472.1) (70.7) (801.8) 245.1 3,119.7 2,865.6 4.5 2,870.1
1. The amount included in the exchange equalisation reserve of €120.4m loss for 2016 represents the exchange loss attributed to the owners of the parent, including €7.5m loss relating to share of other comprehensive income of equity method investments.
The amount included in other reserves of €30.3m loss for 2016 consists of loss on valuation of available-for-sale financial assets of €0.1m, cash flow hedges losses of €31.3m and the deferred tax income thereof amounting to €1.1m.
The amount of €308.8m gain comprises profit for the year of €343.5m, less actuarial losses of €41.7m, plus a deferred tax income of €7.0m. The amount of €0.5m gain included in non-controlling interests for 2016 represents the share of non-controlling interests in profit for the year.
The accompanying notes form an integral part of these consolidated financial statements.
136 Coca-Cola HBC 2017 Integrated Annual Report
FINANCIAL STATEMENTS CONTINUED

Attributable to owners of the parent
Non- controlling
interests€ million
Total equity
€ million
Share capital
€ million
Share premium
€ million
Group reorganisation
reserve€ million
Treasury shares
€ million
Exchange equalisation
reserve€ million
Other reserves€ million
Retained earnings€ million
Total€ million
Balance as at 1 January 2017 1,990.8 4,854.6 (6,472.1) (70.7) (801.8) 245.1 3,119.7 2,865.6 4.5 2,870.1Shares issued to employees exercising stock options 24.3 46.7 – – – – – 71.0 – 71.0Share-based compensation:
Options and performance shares – – – – – 17.2 – 17.2 – 17.2Movement in shares held for equity compensation plan – – – (0.6) – 0.1 – (0.5) – (0.5)
Appropriation of reserves – – – – – 0.4 (0.4) – – –Dividends – (162.0) – – – – 1.5 (160.5) (0.2) (160.7) 2,015.1 4,739.3 (6,472.1) (71.3) (801.8) 262.8 3,120.8 2,792.8 4.3 2,797.1Profit for the year net of tax – – – – – – 426.0 426.0 0.5 426.5Other comprehensive loss for the year, net of tax – – – – (224.5) 8.4 4.7 (211.4) – (211.4)Total comprehensive income for the year, net of tax2 – – – – (224.5) 8.4 430.7 214.6 0.5 215.1Balance as at 31 December 2017 2,015.1 4,739.3 (6,472.1) (71.3) (1,026.3) 271.2 3,551.5 3,007.4 4.8 3,012.2
2. The amount included in the exchange equalisation reserve of €224.5m loss for 2017 represents the exchange loss attributed to the owners of the parent, including €5.3m loss relating to share of other comprehensive income of equity method investments.
The amount included in other reserves of €8.4m gain for 2017 consists of gain on valuation of available-for-sale financial assets of €0.1m, cash flow hedges gains of €8.6m and the deferred tax expense thereof amounting to €0.3m.
The amount of €430.7m gain comprises profit for the year of €426.0m, plus actuarial gains of €6.9m, minus deferred tax expense of €2.2m. The amount of €0.5m gain included in non-controlling interests for 2017 represents the share of non-controlling interests in profit for the year.
For further details, refer to: Note 25 Equity and Note 27 Share based payments.
The accompanying notes form an integral part of these consolidated financial statements.
137Coca-Cola HBC 2017 Integrated Annual Report
Strategic R
eport
Co
rporate G
overnance
Financial Statem
entsS
wiss S
tatutory R
eporting
Supplem
entary Inform
ation

Consolidated cash flow statementFor the year ended 31 December
Note2017
€million2016
€million
Operating activities Profit after tax 426.5 344.0Finance costs, net 9 36.7 62.3Share of results of equity method investments 15 (11.8) (13.8)Tax charged to the income statement 10 138.4 113.8Depreciation of property, plant and equipment 14 300.7 305.5Impairment of property, plant and equipment 14 16.1 26.9Employee stock options and performance shares 27 20.8 8.1Amortisation of intangible assets 13 0.4 0.4Other non-cash items (0.3) (1.3) 927.5 845.9Gain on disposals of non-current assets 8 (4.3) (2.9)(Increase) / Decrease in inventories (13.1) 3.8Decrease / (Increase) in trade and other receivables 11.7 (122.6)Increase in trade and other payables 10.1 131.2Tax paid (128.4) (92.1)Net cash inflow from operating activities 803.5 763.3 Investing activities Payments for purchases of property, plant and equipment (409.9) (347.8)Payments for purchases of intangible assets 13 (1.8) –Proceeds from sales of property, plant and equipment 39.5 35.9Net receipts from equity investments 24.4 17.8Net payments for investments in financial assets 23 (151.0) –Proceeds from loans to related parties 1.6 2.8Interest received 7.1 7.3Payments for acquisition of subsidiary 22 – (19.5)Net cash outflow from investing activities (490.1) (303.5) Financing activities Proceeds from shares issued to employees exercising stock options 25 71.0 21.6Purchase of shares from non-controlling interests (0.5) (0.7)Proceeds from sale of own shares – 3.1Dividends paid to owners of the parent 25 (160.5) (144.7)Dividends paid to non-controlling interests (0.2) (0.3)Proceeds from borrowings 82.2 679.6Repayments of borrowings (83.8) (738.2)Principal repayments of finance lease obligations (7.2) (20.2)Payments for settlement of derivatives and forward starting swaps (3.1) (55.4)Interest paid (36.9) (72.8)Net cash outflow from financing activities (139.0) (328.0)Net increase in cash and cash equivalents 174.4 131.8 Movement in cash and cash equivalents Cash and cash equivalents at 1 January 573.2 487.4Net increase in cash and cash equivalents 174.4 131.8Effect of changes in exchange rates (24.1) (46.0)Cash and cash equivalents at 31 December 24 723.5 573.2
The accompanying notes form an integral part of these consolidated financial statements.
138 Coca-Cola HBC 2017 Integrated Annual Report
FINANCIAL STATEMENTS CONTINUED

1. Description of businessCoca-Cola HBC AG and its subsidiaries (the ‘Group’ or ‘Coca-Cola HBC’ or ‘the Company’) are principally engaged in the production, sales and distribution of non-alcoholic ready-to-drink beverages, under franchise from The Coca-Cola Company. The Company distributes its products in Nigeria and 27 countries in Europe. Information on the Company’s operations by segment is included in Note 6.
On 11 October 2012, Coca-Cola HBC, a Swiss stock corporation (Aktiengesellschaft/Société Anonyme) incorporated by Kar-Tess Holding (a related party of the Group, see Note 26), announced a voluntary share exchange offer to acquire all outstanding ordinary registered shares and all American depositary shares of Coca-Cola Hellenic Bottling Company S.A. As a result of the successful completion of this offer, on 25 April 2013 Coca-Cola HBC acquired 96.85% of the issued Coca-Cola Hellenic Bottling Company S.A. shares, including shares represented by American depositary shares, and became the new parent company of the Group. On 17 June 2013, Coca-Cola HBC completed its statutory buy-out of the remaining shares of Coca-Cola Hellenic Bottling Company S.A. that it did not acquire upon completion of its voluntary share exchange offer. Consequently, Coca-Cola HBC acquired 100% of Coca-Cola Hellenic Bottling Company S.A. which was eventually delisted from the Athens Exchange, from the London Stock Exchange where it had a secondary listing and from the New York Stock Exchange where American depositary shares were listed.
The shares of Coca-Cola HBC started trading in the premium segment of the London Stock Exchange (Ticker symbol: CCH), on the Athens Exchange (Ticker symbol: EEE) and regular way trading in Coca-Cola HBC ADS commenced on the New York Stock Exchange (Ticker symbol: CCH) on 29 April 2013. On 24 July 2014 the Group proceeded to the delisting of its American Depository Receipts from the New York Stock Exchange and terminated its reporting obligations under the US Securities Exchange Act of 1934. The deregistration of Coca-Cola HBC shares under the US Securities Exchange Act of 1934 and the termination of its reporting obligations became effective on 3 November 2014.
2. Basis of preparation and consolidation
Basis of preparationThe consolidated financial statements included in this document are prepared in accordance with International Financial Reporting Standards (‘IFRS’) as issued by the International Accounting Standards Board (‘IASB’).
The consolidated financial statements are prepared on a going concern basis under the historical cost convention, as modified by the revaluation of available-for-sale financial assets and derivative financial instruments.
These consolidated financial statements were approved for issue by the Board of Directors on 15 March 2018 and are expected to be verified at the Annual General Meeting to be held on 11 June 2018.
Basis of consolidationSubsidiary undertakings are those companies over which the Group, directly or indirectly, has control. The Group controls an entity when the Group is exposed to, or has rights to, variable returns from its involvement with the entity and has the ability to affect those returns through power over the entity. Subsidiary undertakings are consolidated from the date on which control is transferred to the Group and cease to be consolidated from the date on which control is transferred out of the Group.
Transactions with non-controlling interests that do not result in loss of control are accounted for as equity transactions – that is, as transactions with the owners in their capacity as owners. The difference between fair value of any consideration paid and the relevant share acquired of the carrying value of net assets of the subsidiary is recorded in equity.
Inter-company transactions and balances between Group companies are eliminated. The subsidiaries’ accounting policies are consistent with policies adopted by the Group.
When the Group ceases to have control, any retained interest in the entity is remeasured to its fair value at the date when such control is lost, with the change in carrying amount recognised in profit or loss. The fair value is the initial carrying amount for the purposes of subsequently accounting for the retained interest as an associate, joint venture or financial asset. In addition, any amounts previously recognised in other comprehensive income in respect of that entity are accounted for as if the Group had directly disposed of the related assets or liabilities. This may mean that amounts previously recognised in other comprehensive income are reclassified to profit or loss.
3. Foreign currency and translationThe individual financial statements of each Group entity are presented in the currency of the primary economic environment in which the entity operates (its functional currency). For the purpose of the consolidated financial statements, the results and financial position of each entity are expressed in Euro, which is the presentation currency for the consolidated financial statements.
139Coca-Cola HBC 2017 Integrated Annual Report
Strategic R
eport
Co
rporate G
overnance
Financial Statem
entsS
wiss S
tatutory R
eporting
Supplem
entary Inform
ation
NOTES TO THE CONSOLIDATED FINANCIAL STATEMENTS
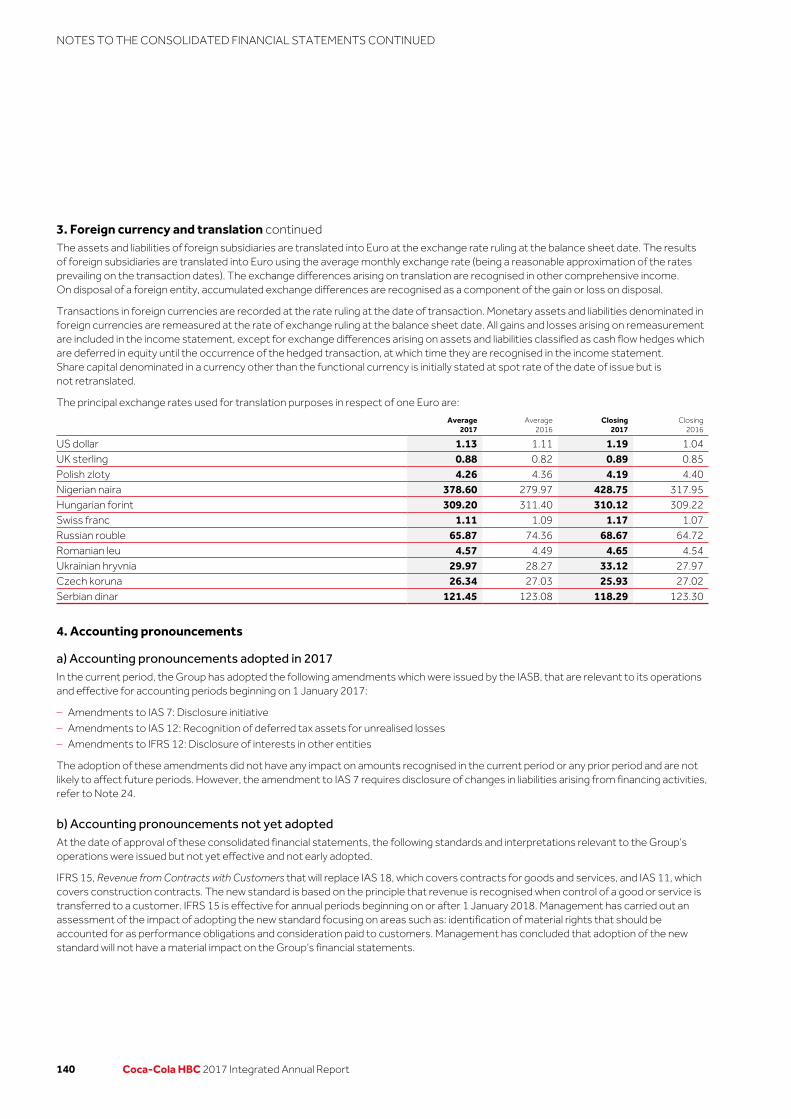
3. Foreign currency and translation continuedThe assets and liabilities of foreign subsidiaries are translated into Euro at the exchange rate ruling at the balance sheet date. The results of foreign subsidiaries are translated into Euro using the average monthly exchange rate (being a reasonable approximation of the rates prevailing on the transaction dates). The exchange differences arising on translation are recognised in other comprehensive income. On disposal of a foreign entity, accumulated exchange differences are recognised as a component of the gain or loss on disposal.
Transactions in foreign currencies are recorded at the rate ruling at the date of transaction. Monetary assets and liabilities denominated in foreign currencies are remeasured at the rate of exchange ruling at the balance sheet date. All gains and losses arising on remeasurement are included in the income statement, except for exchange differences arising on assets and liabilities classified as cash flow hedges which are deferred in equity until the occurrence of the hedged transaction, at which time they are recognised in the income statement. Share capital denominated in a currency other than the functional currency is initially stated at spot rate of the date of issue but is not retranslated.
The principal exchange rates used for translation purposes in respect of one Euro are:
Average
2017Average
2016Closing
2017Closing
2016
US dollar 1.13 1.11 1.19 1.04UK sterling 0.88 0.82 0.89 0.85Polish zloty 4.26 4.36 4.19 4.40Nigerian naira 378.60 279.97 428.75 317.95Hungarian forint 309.20 311.40 310.12 309.22Swiss franc 1.11 1.09 1.17 1.07Russian rouble 65.87 74.36 68.67 64.72Romanian leu 4.57 4.49 4.65 4.54Ukrainian hryvnia 29.97 28.27 33.12 27.97Czech koruna 26.34 27.03 25.93 27.02Serbian dinar 121.45 123.08 118.29 123.30
4. Accounting pronouncements
a) Accounting pronouncements adopted in 2017In the current period, the Group has adopted the following amendments which were issued by the IASB, that are relevant to its operations and effective for accounting periods beginning on 1 January 2017:
– Amendments to IAS 7: Disclosure initiative
– Amendments to IAS 12: Recognition of deferred tax assets for unrealised losses
– Amendments to IFRS 12: Disclosure of interests in other entities
The adoption of these amendments did not have any impact on amounts recognised in the current period or any prior period and are not likely to affect future periods. However, the amendment to IAS 7 requires disclosure of changes in liabilities arising from financing activities, refer to Note 24.
b) Accounting pronouncements not yet adoptedAt the date of approval of these consolidated financial statements, the following standards and interpretations relevant to the Group’s operations were issued but not yet effective and not early adopted.
IFRS 15, Revenue from Contracts with Customers that will replace IAS 18, which covers contracts for goods and services, and IAS 11, which covers construction contracts. The new standard is based on the principle that revenue is recognised when control of a good or service is transferred to a customer. IFRS 15 is effective for annual periods beginning on or after 1 January 2018. Management has carried out an assessment of the impact of adopting the new standard focusing on areas such as: identification of material rights that should be accounted for as performance obligations and consideration paid to customers. Management has concluded that adoption of the new standard will not have a material impact on the Group’s financial statements.
140 Coca-Cola HBC 2017 Integrated Annual Report
NOTES TO THE CONSOLIDATED FINANCIAL STATEMENTS CONTINUED

IFRS 9, Financial Instruments, which reflects all phases of the financial instruments project and replaces IAS 39, Financial Instruments: Recognition and Measurement. The standard introduces new requirements for classification and measurement, impairment, and hedge accounting. IFRS 9 is effective for annual periods beginning on or after 1 January 2018. Management has assessed the effect of adopting the new standard on the Group’s financial statements and has concluded that neither the new requirements related to the classification and measurement nor the ones related to impairment will have a material impact to the financial statements although may impact disclosures. The new hedge accounting requirements will align the accounting for hedging instruments more closely with the Group’s risk management practices and therefore more hedge relationships are expected to be eligible for hedge accounting. Furthermore, changes in time value of option contracts will in future be deferred in a new ‘costs of hedging’ reserve within equity. The deferred amounts will be recognised against the related hedged transaction when it occurs. The Group will apply the new rules retrospectively from 1 January 2018, with the practical expedients permitted under the standard.
IFRS 16, Leases. The new standard supersedes IAS 17 and its objective is to ensure that lessees and lessors provide relevant information in a manner that faithfully represents those transactions. IFRS 16 introduces a single lessee accounting model and requires a lessee to recognise assets and liabilities for all leases with a term of more than 12 months, unless the underlying asset is of low value. IFRS 16 is effective for annual periods beginning on or after 1 January 2019. The Group is currently evaluating the impact IFRS 16 will have on its consolidated financial statements.
In addition, the following amendments have been issued by the IASB but are not yet effective. The Group is currently evaluating the impact these amendments will have on its consolidated financial statements:
– Amendments to IFRS 2: Classification and Measurement of Share-based Payment Transactions
– Amendments to IFRS 10 and IAS 28: Sale or contribution of assets between an investor and its associate or joint venture
– Interpretation 22: Foreign Currency Transactions and Advance Consideration
– Annual improvements to IFRSs: 2014-2016 Cycle – IAS 28
– Annual improvements to IFRSs: 2015-2017 Cycle
– Interpretation 23: Uncertainty over income tax treatments
5. Critical accounting estimates and judgementsIn conformity with IFRS, the preparation of the consolidated financial statements for Coca-Cola HBC requires management to make estimates and judgements that affect the reported amounts of assets, liabilities, revenues and expenses, and the disclosure of contingent assets and liabilities in the consolidated financial statements and accompanying notes. Although these estimates and judgements are based on management’s knowledge of current events and actions that may be undertaken in the future, actual results may ultimately differ from estimates.
Estimates – Income taxes (Refer to Note 10)
– Impairment of goodwill and indefinite lived intangible assets (Refer to Note 13)
– Employee benefits – defined benefit pension plans (Refer to Note 20)
Judgements – Joint arrangements (Refer to Note 15)
141Coca-Cola HBC 2017 Integrated Annual Report
Strategic R
eport
Co
rporate G
overnance
Financial Statem
entsS
wiss S
tatutory R
eporting
Supplem
entary Inform
ation

6. Segmental analysisThe Group has one business, being the production, sale and distribution of ready-to-drink, primarily non-alcoholic, beverages. The Group operates in 28 countries which are aggregated in reportable segments as follows:
Established markets: Austria, Cyprus, Greece, Italy, Northern Ireland, the Republic of Ireland and Switzerland.
Developing markets: Croatia, Czech Republic, Estonia, Hungary, Latvia, Lithuania, Poland, Slovakia and Slovenia.
Emerging markets: Armenia, Belarus, Bosnia and Herzegovina, Bulgaria, FYROM, Moldova, Montenegro, Nigeria, Romania, the Russian Federation, Serbia (including the Republic of Kosovo) and Ukraine.
Established: €2,407.8mDeveloping: €1,094.2mEmerging: €2,717.0m
2016€6,219.0m
Established: €2,436.3mDeveloping: €1,173.4mEmerging: €2,912.3m
2017€6,522.0m
The Group’s operations in each of the three reportable segments have been aggregated on the basis of their similar economic characteristics, assessed by reference to their net sales revenue per unit case as well as disposable income per capita, exposure to political and economic volatility, regulatory environments, customers and distribution infrastructures. The accounting policies of the reportable segments are the same as those adopted by the Group. The Group’s chief operating decision maker is its Operating Committee, which evaluates performance and allocates resources based on volume, net sales revenue and operating profit.
a) Volume and net sales revenueThe Group sales volume in million unit cases1 for the years ended 31 December was as follows:
2017 2016
Established 613.3 606.6Developing 394.2 383.5Emerging 1,096.6 1,067.8Total volume 2,104.1 2,057.9
1. One unit case corresponds to approximately 5.678 litres or 24 servings, being a typically used measure of volume. Volume data is derived from unaudited operational data.
Net sales revenue per reportable segment for the years ended 31 December is presented in the graphs below:
142 Coca-Cola HBC 2017 Integrated Annual Report
NOTES TO THE CONSOLIDATED FINANCIAL STATEMENTS CONTINUED
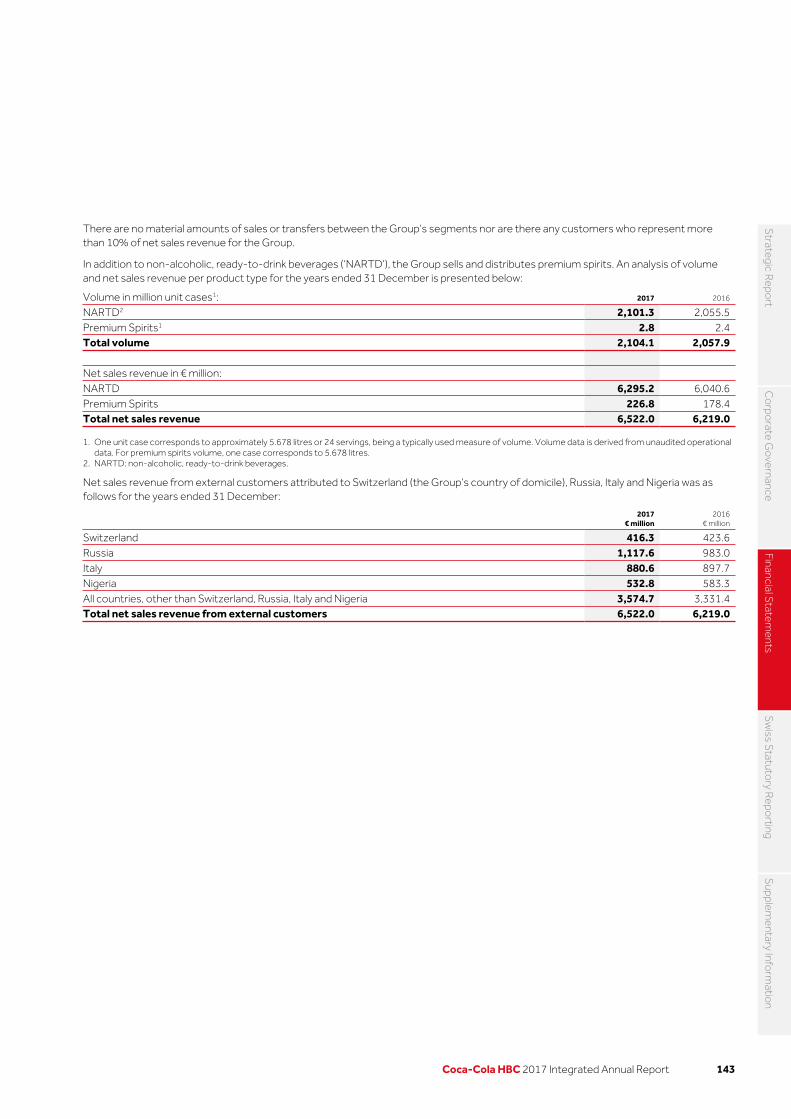
There are no material amounts of sales or transfers between the Group’s segments nor are there any customers who represent more than 10% of net sales revenue for the Group.
In addition to non-alcoholic, ready-to-drink beverages (‘NARTD’), the Group sells and distributes premium spirits. An analysis of volume and net sales revenue per product type for the years ended 31 December is presented below:
Volume in million unit cases1: 2017 2016
NARTD2 2,101.3 2,055.5Premium Spirits1 2.8 2.4Total volume 2,104.1 2,057.9 Net sales revenue in € million: NARTD 6,295.2 6,040.6Premium Spirits 226.8 178.4Total net sales revenue 6,522.0 6,219.0
1. One unit case corresponds to approximately 5.678 litres or 24 servings, being a typically used measure of volume. Volume data is derived from unaudited operational data. For premium spirits volume, one case corresponds to 5.678 litres.
2. NARTD: non-alcoholic, ready-to-drink beverages.
Net sales revenue from external customers attributed to Switzerland (the Group’s country of domicile), Russia, Italy and Nigeria was as follows for the years ended 31 December:
2017
€ million2016
€ million
Switzerland 416.3 423.6Russia 1,117.6 983.0Italy 880.6 897.7Nigeria 532.8 583.3 All countries, other than Switzerland, Russia, Italy and Nigeria 3,574.7 3,331.4Total net sales revenue from external customers 6,522.0 6,219.0
143Coca-Cola HBC 2017 Integrated Annual Report
Strategic R
eport
Co
rporate G
overnance
Financial Statem
entsS
wiss S
tatutory R
eporting
Supplem
entary Inform
ation

6. Segmental analysis continued
b) Other income statement items
Year ended 31 December Note2017
€ million2016
€ million
Operating profit: Established 238.3 236.8Developing 91.6 92.9Emerging 259.9 176.6Total operating profit 589.8 506.3 Interest expense and other finance costs: Established (25.4) (40.1)Developing (4.3) (4.9)Emerging (12.9) (8.9)Corporate3 (99.4) (133.2)Inter-segment interest expense 94.7 117.4Interest expense and other finance costs 9 (47.3) (69.7) Finance income: Established 0.6 0.5Developing 1.3 1.7Emerging 23.9 21.5Corporate3 79.5 101.1Inter-segment finance income (94.7) (117.4)Total finance income 9 10.6 7.4 Income tax expense: Established (57.6) (49.7)Developing (17.2) (19.0)Emerging (45.4) (35.7)Corporate3 (18.2) (9.4)Total income tax expense 10 (138.4) (113.8) Reconciling items: Share of results of equity method investments 15 11.8 13.8Profit after tax 426.5 344.0
Depreciation and impairment of property, plant and equipment and amortisation of intangible assets included in the measure of operating profit, are as follows:
Note2017
€ million2016
€ million
Depreciation and impairment of property, plant and equipment: Established (93.4) (95.8)Developing (52.2) (56.6)Emerging (171.2) (180.0)Total depreciation and impairment of property, plant and equipment 14 (316.8) (332.4)Amortisation of intangible assets: Emerging (0.4) (0.4)Total amortisation of intangible assets 13 (0.4) (0.4)
3. Corporate refers to holding, finance and other non-operating subsidiaries of the Group.
144 Coca-Cola HBC 2017 Integrated Annual Report
NOTES TO THE CONSOLIDATED FINANCIAL STATEMENTS CONTINUED

c) Other itemsThe balance of non-current assets4 attributed to Switzerland (the Group’s country of domicile), Russia, Italy and Nigeria was as follows for the year ended 31 December:
2017
€ million2016
€ million
Switzerland 497.9 546.0Russia 542.2 578.0Italy 979.4 990.7Nigeria 388.7 439.9 All countries, other than Switzerland, Russia, Italy and Nigeria 1,768.8 1,759.3Total non-current assets4 4,177.0 4,313.9
4. Excluding financial instruments, equity method investments and deferred tax assets.
Expenditure of property, plant and equipment per reportable segment was as follows for the year ended 31 December:
2017
€ million2016
€ million
Established 89.7 94.7Developing 63.2 44.3Emerging 257.0 208.8Total expenditure of property, plant and equipment 409.9 347.8
During 2016 and 2017 the Nigerian naira was significantly devalued against the Euro, resulting in foreign currency translation losses which were recognised within other comprehensive income of the consolidated statement of comprehensive income in both 2016 and 2017 (refer to Note 12). The Group continues to monitor the situation in Nigeria in order to ensure that timely actions and initiatives are undertaken to minimise potential adverse impact on its performance, particularly in relation to the currency volatility.
145Coca-Cola HBC 2017 Integrated Annual Report
Strategic R
eport
Co
rporate G
overnance
Financial Statem
entsS
wiss S
tatutory R
eporting
Supplem
entary Inform
ation

7. Net sales revenue
Accounting policyNet sales revenue is recognised when all of the following conditions are met: when the amount of revenue can be reliably measured; when it is probable that future economic benefits will flow to the Group; and when the significant risks and rewards of ownership of the products have passed to the buyer, usually on delivery of goods.
Net sales revenue is measured at the fair value of the consideration received or receivable and is stated net of sales discounts, as well as listing fees and marketing and promotional incentives provided to customers. Net sales revenue includes excise and other duties where the Group pays as principal but excludes amounts collected on behalf of third parties, such as value added taxes. Listing fees are incentives provided to customers for carrying the Group’s products in their stores. Listing fees that are subject to contract-based term arrangements are capitalised and amortised over the term of the contract as a reduction to revenue. All other listing fees as well as marketing and promotional incentives are a reduction of revenue as incurred.
Coca-Cola HBC receives contributions from The Coca-Cola Company in order to promote sales of their brands. Contributions for price support, marketing and promotional campaigns in respect of specific customers are recognised as an offset to promotional incentives provided to those customers to which the contributions contractually relate. These contributions are accrued and matched to the expenditure to which they relate (refer to Note 26).
Refer to Note 6 for an analysis of net sales revenue per reportable segment.
Listing fees and marketing and promotional incentives provided to customers recognised as a reduction to net sales revenue for the year ended 31 December are presented below:
2017
€ million2016
€ million
Listing fees 474.2 485.9Marketing and promotional incentives 210.2 216.6Total listing fees, marketing and promotional incentives 684.4 702.5
The amount of listing fees capitalised at 31 December 2017 was €7.9m (31 December 2016: €11.0m). Of this balance, €6.0m (31 December 2016: €7.9m) was classified as current prepayments and the remainder as non-current prepayments.
8. Operating expenses
Accounting policyRestructuring expenses are recorded in a separate line item within operating expenses and comprise costs arising from significant changes in the way the Group conducts its business such as significant supply chain infrastructure changes, outsourcing of activities and centralisation of processes. Redundancy provisions are recognised only when the Group has a present constructive obligation, which is when a detailed formal plan identifies the business or part of the business concerned, the location and number of employees affected, a detailed estimate of the associated costs, as well as an appropriate timeline and the employees affected have been notified of the plan’s main features.
a) Operating expensesOperating expenses for the year ended 31 December comprised:
2017
€ million2016
€ million
Selling expenses 917.2 869.9Delivery expenses 495.7 483.1Administrative expenses 407.4 401.8Restructuring expenses 28.9 37.7Operating expenses 1,849.2 1,792.5
In 2017, operating expenses included net gains on disposal of property, plant and equipment of €4.3m (2016: €2.9m net gains).
146 Coca-Cola HBC 2017 Integrated Annual Report
NOTES TO THE CONSOLIDATED FINANCIAL STATEMENTS CONTINUED

Restructuring expensesAs part of the effort to optimise its cost base and sustain competitiveness in the marketplace, the Company undertakes restructuring initiatives. The restructuring concerns mainly employees’ costs and impairment of property, plant and equipment (refer to Note 14). Restructuring expenses per reportable segment for the years ended 31 December are presented below:
b) Employee costsEmployee costs for the years ended 31 December comprised:
2017
€ million2016
€ million
Wages and salaries 697.2 707.1Social security costs 148.7 143.0Pension and other employee benefits 128.2 112.8Termination benefits 18.2 21.1Total employee costs 992.3 984.0
The average number of full-time equivalent employees in 2017 was 29,427 (2016: 31,083).
Employee costs for 2017 included in operating expenses and cost of goods sold amounted to €760.1m and €232.2m respectively (2016: €746.2m and €237.8m respectively).
c) Directors’ and senior management remunerationThe total remuneration paid or accrued for Directors and the senior management team for the years ended 31 December comprised:
2017
€ million2016
€ million
Salaries and other short-term benefits 13.8 18.7Stock option and perfomance share awards 12.6 4.9Pension and post-employment benefits 0.7 0.8Total renumeration 27.1 24.4
d) Fees and other services of the auditorAudit and other fees charged in the income statement concerning the auditor of the consolidated financial statements, PricewaterhouseCoopers S.A. and affiliates, were as follows, for the years ended 31 December:
2017
€ million2016
€ million
Audit fees 4.3 4.5Audit-related fees 0.4 0.4Other fees – 0.2Total audit and all other fees 4.7 5.1
Established: €9.4mDeveloping: €6.3mEmerging: €22.0m
2016€37.7m
Established: €13.1mDeveloping: €1.6mEmerging: €14.2m
2017€28.9m
147Coca-Cola HBC 2017 Integrated Annual Report
Strategic R
eport
Co
rporate G
overnance
Financial Statem
entsS
wiss S
tatutory R
eporting
Supplem
entary Inform
ation

9. Finance costs, net
Accounting policyInterest income and interest expense are recognised using the effective interest rate method, and are recorded in the income statement within ‘Finance income’ and ‘Finance cost’ respectively.
Finance costs, net for the years ended 31 December comprised:
2017
€ million2016
€ million
Interest income 10.6 7.4Interest expense (39.9) (60.6)Finance charges incurred with respect to finance leases (6.0) (7.7)Other finance costs (1.4) (1.4)Finance costs (47.3) (69.7)Finance costs, net (36.7) (62.3)
Other finance costs include commitment fees on loan facilities (for the part not yet drawn down) and other similar fees.
10. Taxation
Accounting policyTax is recognised in the income statement, except to the extent that it relates to items recognised in other comprehensive income or in equity. In this case, the tax is recognised in other comprehensive income or directly in equity.
The current income tax expense is calculated on the basis of the tax laws enacted or substantively enacted at the balance sheet date in the countries where the Group operates and generates taxable income. Management periodically evaluates positions taken in tax returns with respect to situations in which applicable tax regulations are subject to interpretation and establishes provisions where appropriate, on the basis of amounts expected to be paid to the tax authorities.
Deferred tax is provided using the liability method for all temporary differences arising between the tax bases of assets and liabilities and their carrying values for financial reporting purposes. However, the deferred tax liabilities are not recognised if they arise from the initial recognition of goodwill; deferred tax is not accounted for if it arises from initial recognition of an asset or liability in a transaction other than a business combination that at the time of the transaction affects neither accounting nor taxable profit or loss. Tax rates enacted or substantively enacted at the balance sheet date are those that are expected to apply when the deferred tax asset is realised or deferred tax liability is settled.
Deferred tax assets are recognised to the extent that it is probable that future taxable profit will be available against which the temporary differences can be utilised. Deferred tax assets are recognised for tax losses carried forward to the extent that realisation of the related tax benefit through the reduction of the future taxes is probable.
Deferred tax is provided on temporary differences arising on investments in subsidiaries, associates and joint ventures, except where the timing of the reversal of the temporary difference can be controlled by the Group, and it is probable that the temporary difference will not reverse in the foreseeable future. This includes taxation in respect of the retained earnings of overseas subsidiaries only to the extent that, at the balance sheet date, dividends have been accrued as receivable or a binding agreement to distribute past earnings in future periods has been entered into by the subsidiary.
Deferred tax assets and deferred tax liabilities are offset if a legally enforceable right exists to offset current tax assets against current income tax liabilities and the deferred taxes relate to the same taxation authority on either the same taxable entity or different taxable entities where there is an intention to settle the balances on a net basis.
Critical accounting estimatesThe Group is subject to income taxes in numerous jurisdictions. There are many transactions and calculations for which the ultimate tax determination cannot be assessed with certainty in the ordinary course of business. The Group recognises a provision for potential cases that might arise in the foreseeable future based on assessment of the probabilities as to whether additional taxes will be due. Where the final tax outcome on these matters is different from the amounts that were initially recorded, such differences will impact the income tax provision in the period in which such determination is made. The income tax provision amounted to €69.2m as at 31 December 2017 (2016: €56.7m) and is included in the line ‘Current tax liabilities’ of the consolidated balance sheet.
148 Coca-Cola HBC 2017 Integrated Annual Report
NOTES TO THE CONSOLIDATED FINANCIAL STATEMENTS CONTINUED

The income tax charge for the years ended 31 December is as follows:
2017
€ million2016
€ million
Current tax expense 130.6 116.4Deferred tax 7.8 (2.6)Income tax expense 138.4 113.8
The tax on the Group’s profit before tax differs from the theoretical amount that would arise using the weighted average tax rate applicable to profits of the consolidated entities as follows:
2017
€ million2016
€ million
Profit before tax 564.9 457.8 Tax calculated at domestic tax rates applicable to profits in the respective countries 130.1 105.0Additional local taxes in foreign jurisdictions 8.8 8.9Tax holidays in foreign jurisdictions (11.9) 0.7Expenses non-deductible for tax purposes 15.4 14.9Income not subject to tax (8.9) (12.5)Changes in tax laws and rates – (2.3)Movement in utilisation of accumulated tax losses 0.3 (2.3)Movement of deferred tax asset not recognised 2.0 (0.7)Recognition of previously unrecognised post-acquisition tax losses (0.3) 1.5Other 2.9 0.6Income tax expense 138.4 113.8
Non-deductible expenses for tax purposes include marketing and advertising expenses, service fees, bad debt provisions, entertainment expenses, certain employee benefits and stock options expenses and other items that, partially or in full, are not deductible for tax purposes in certain of our jurisdictions.
Deferred tax assets and liabilities presented in the consolidated balance sheet as at 31 December, can be further analysed as follows:
Deferred tax assets:2017
€ million2016
€ million
To be recovered after 12 months 47.1 48.0To be recovered within 12 months 67.2 86.0Gross deferred tax assets 114.3 134.0Offset of deferred tax (55.2) (76.5)Net deferred tax assets 59.1 57.5 Deferred tax liabilities: To be recovered after 12 months (167.1) (181.9)To be recovered within 12 months (22.1) (18.7)Gross deferred tax liabilities (189.2) (200.6)Offset of deferred tax 55.2 76.5Net deferred tax liabilities (134.0) (124.1)
A reconciliation of net deferred tax is presented below:
2017
€ million2016
€ million
As at 1 January (66.6) (75.7)Taken to the income statement (7.8) 2.6Taken to other comprehensive income (2.5) 8.1Foreign currency translation 2.0 (1.6)As at 31 December (74.9) (66.6)
149Coca-Cola HBC 2017 Integrated Annual Report
Strategic R
eport
Co
rporate G
overnance
Financial Statem
entsS
wiss S
tatutory R
eporting
Supplem
entary Inform
ation

10. Taxation continuedThe movements in deferred tax assets and liabilities during the year, without taking into consideration the offsetting of balances within the same tax jurisdiction where applicable, are as follows:
Deferred tax assets Provisions
€ million
Pensions and benefit plans
€ million
Tax losses carry-forward
€ million
Book in excess of tax depreciation
€ millionLeasing€ million
Other deferred tax assets
€ millionTotal
€ million
As at 1 January 2016 46.3 27.0 24.4 7.8 12.1 21.3 138.9Taken to the income statement 7.7 (6.0) (9.1) 0.3 (3.3) 3.2 (7.2)Taken to other comprehensive income 0.3 6.0 – – – 0.3 6.6Transfers between assets/liabilities 6.0 (1.0) – 0.2 – (6.0) (0.8)Foreign currency translation 3.2 (3.9) 1.4 – (0.2) (4.0) (3.5)As at 31 December 2016 63.5 22.1 16.7 8.3 8.6 14.8 134.0Taken to the income statement (12.1) (0.1) (6.1) 13.5 (0.9) 1.7 (4.0)Taken to other comprehensive income – (2.1) – – – (0.1) (2.2)Transfers between assets/liabilities (0.3) 0.3 – (0.1) – (10.5) (10.6)Foreign currency translation (1.3) (1.5) (0.2) (1.5) – 1.6 (2.9)As at 31 December 2017 49.8 18.7 10.4 20.2 7.7 7.5 114.3
Deferred tax liabilities
Tax in excess of book depreciation
€ million
Derivative instruments
€ million
Other deferred tax liabilities
€ millionTotal
€ million
As at 1 January 2016 (203.8) (1.9) (8.9) (214.6)Taken to the income statement 13.6 (1.5) (2.3) 9.8Taken to other comprehensive income – 1.5 – 1.5Transfers between assets/liabilities (0.2) – 1.0 0.8Foreign currency translation 2.0 – (0.1) 1.9As at 31 December 2016 (188.4) (1.9) (10.3) (200.6)Taken to the income statement 7.9 0.2 (11.9) (3.8)Taken to other comprehensive income – (0.2) (0.1) (0.3)Transfers between assets/liabilities (0.1) – 10.7 10.6Foreign currency translation 4.6 (0.1) 0.4 4.9As at 31 December 2017 (176.0) (2.0) (11.2) (189.2)
Deferred tax assets recognised for tax losses carry-forward in accordance with the relevant local rules applying in our jurisdictions, can be analysed as follows:
2017
€ million2016
€ million
Attributable to tax losses that expire within five years 5.5 9.8Attributable to tax losses that expire after five years 0.1 –Attributable to tax losses that can be carried forward indefinitely 4.8 6.9Recognised deferred tax assets attributable to tax losses 10.4 16.7
The Group has unrecognised deferred tax assets attributable to tax losses that are available to carry forward against future taxable income of €12.6m (2016: €13.0m). These are analysed as follows:
2017
€ million2016
€ million
Attributable to tax losses that expire within five years 12.6 12.3Attributable to tax losses that expire after five years – 0.7Unrecognised deferred tax assets attributable to tax losses 12.6 13.0
The aggregate amount of distributable reserves arising from the realised earnings of the Group’s operations was €2,071.6m in 2017 (2016: €1,871.9m). No deferred tax liabilities have been recognised on such reserves given that their distribution is controlled by the Group, or in the event of plans to remit overseas earnings of subsidiaries, such distribution would not give rise to a tax liability.
150 Coca-Cola HBC 2017 Integrated Annual Report
NOTES TO THE CONSOLIDATED FINANCIAL STATEMENTS CONTINUED

11. Earnings per share
Accounting policyBasic earnings per share is calculated by dividing the net profit attributable to the owners of the parent by the weighted average number of ordinary shares outstanding during the year. The weighted average number of ordinary shares outstanding during the year is the number of ordinary shares outstanding at the beginning of the year, adjusted by the number of ordinary shares bought back or issued during the year multiplied by a time-weighting factor. Diluted earnings per share incorporates stock options for which the average share price for the year is in excess of the exercise price of the stock option and there is a dilutive effect.
The calculation of the basic and diluted earnings per share attributable to the owners of the parent entity is based on the following data:
2017 2016
Net profit attributable to the owners of the parent (€ million) 426.0 343.5Weighted average number of ordinary shares for the purposes of basic earnings per share (million) 364.7 362.1Effect of dilutive stock options (million) 2.9 1.4Weighted average number of ordinary shares for the purposes of diluted earnings per share (million) 367.6 363.5Basic earnings per share (€) 1.17 0.95Diluted earnings per share (€) 1.16 0.95
Outstanding stock options that have an anti-dilutive effect and therefore were excluded from diluted earnings per share in 2017 were €1.0m (2016: €4.3m).
12. Components of other comprehensive incomeThe components of other comprehensive income for the years ended 31 December comprise:
2017 2016
Before-tax
€ millionTax expense
€ millionNet-of-tax
€ millionBefore-tax
€ millionTax income
€ millionNet-of-tax
€ million
Available-for-sale financial assets 0.1 – 0.1 (0.1) – (0.1)Cash flow hedges 8.6 (0.3) 8.3 (31.3) 1.1 (30.2)Foreign currency translation (219.2) – (219.2) (112.9) – (112.9)Actuarial gains / (losses) 6.9 (2.2) 4.7 (41.7) 7.0 (34.7)Share of other comprehensive income of equity method investments (5.3) – (5.3) (7.5) – (7.5)Other comprehensive loss (208.9) (2.5) (211.4) (193.5) 8.1 (185.4)
The majority of foreign currency translation impact for 2017 is related to the Nigerian naira as well as the Russian rouble and the Swiss franc, while the majority of the impact for 2016 related to the Nigerian naira and the Russian rouble.
151Coca-Cola HBC 2017 Integrated Annual Report
Strategic R
eport
Co
rporate G
overnance
Financial Statem
entsS
wiss S
tatutory R
eporting
Supplem
entary Inform
ation
13. Intangible assets
Accounting policyIntangible assets consist of goodwill, franchise agreements, trademarks and water rights. Goodwill and other indefinite-lived intangible assets are carried at cost less accumulated impairment losses, while intangible assets with finite lives are amortised over their useful economic lives. The useful lives, both finite and indefinite, assigned to intangible assets are evaluated on an annual basis.
Intangible assets with indefinite lives (‘not subject to amortisation’)
Intangible assets not subject to amortisation consist of goodwill, franchise agreements and trademarks.
Goodwill is the excess of the consideration transferred over the fair value of the share of net assets acquired. Goodwill and fair value adjustments arising on the acquisition of subsidiaries are treated as the assets and liabilities of those subsidiaries. These balances are denominated in the functional currency of the subsidiary and are translated to Euro on a basis consistent with the other assets and liabilities of the subsidiary.
The useful life of franchise agreements is usually based on the term of the respective franchise agreements. The Coca-Cola Company does not grant perpetual franchise rights outside the United States. However, given the Group's strategic relationship with The Coca-Cola Company and consistent with past experience, the Group believes that franchise agreements will continue to be renewed at each expiration date with no significant costs. The Group has concluded that the franchise agreements are perpetual in nature and they have therefore been assigned indefinite useful lives.
The Group’s trademarks are assigned an indefinite useful life when they have an established sales history in the applicable region. It is the intention of the Group to receive a benefit from them indefinitely and there is no indication that this will not be the case.
Goodwill and other indefinite-lived intangible assets are tested for impairment annually and whenever there is an indication of impairment.
For the purpose of impairment testing, goodwill is allocated to each of the Group’s cash-generating units expected to benefit from the business combination in which the goodwill arose. Other indefinite-lived intangible assets are also allocated to the Group’s cash-generating units expected to benefit from those intangibles. The cash-generating units (‘unit’) to which goodwill and other indefinite-lived intangible assets have been allocated are tested for impairment annually, or more frequently when there is an indication that the unit may be impaired. If the recoverable amount (i.e. the higher of the value-in-use and fair value less costs to sell) of the cash-generating unit is less than the carrying amount of the unit, the impairment loss is allocated first to reduce the carrying amount of any goodwill allocated to the unit and then pro-rata to the other assets of the unit on the basis of the carrying amount of each asset in the unit. Impairment losses recognised against goodwill are not reversed in subsequent periods.
Intangible assets with finite lives
Intangible assets with finite lives mainly consist of water rights and are amortised over their useful economic lives and are carried at cost less accumulated amortisation and impairment losses.
Critical accounting estimatesDetermining whether goodwill or indefinite-lived intangible assets are impaired requires an estimation of the value-in-use of the cash-generating units to which they have been allocated in order to determine the recoverable amount of the cash-generating units. The value in use calculation requires the Group to estimate the future cash flows expected to arise from the cash-generating unit and a suitable discount rate in order to calculate present value.
152 Coca-Cola HBC 2017 Integrated Annual Report
NOTES TO THE CONSOLIDATED FINANCIAL STATEMENTS CONTINUED
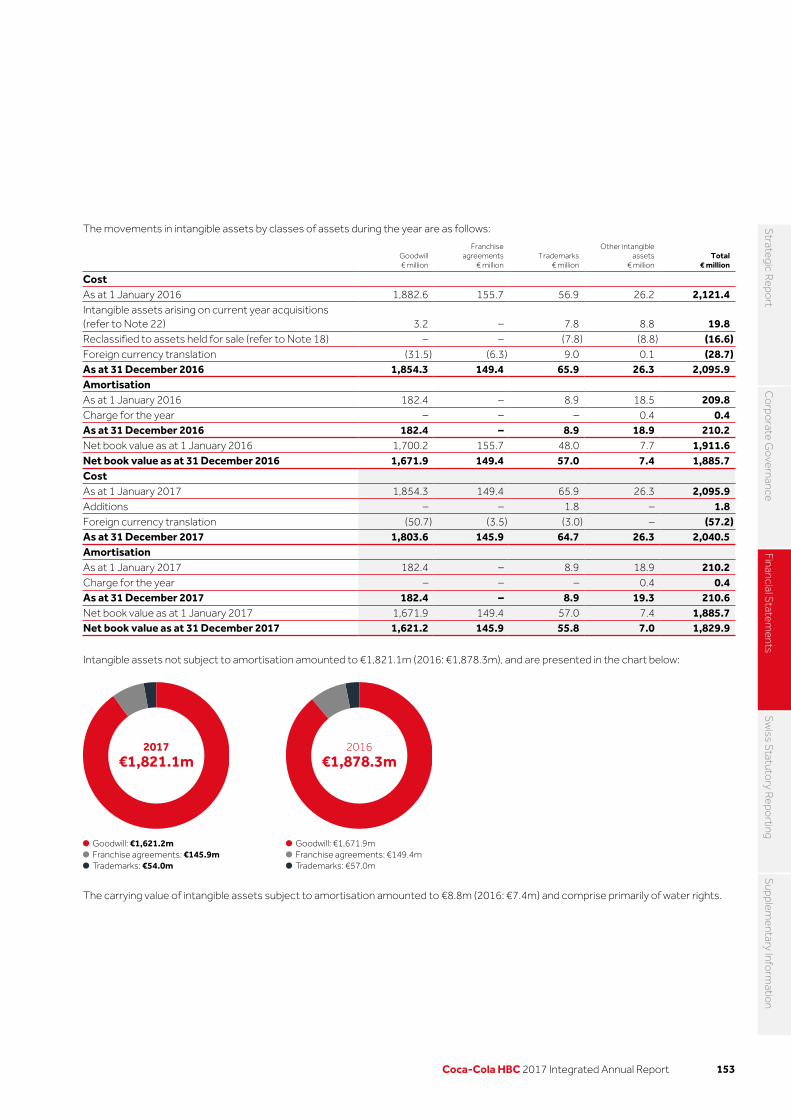
The movements in intangible assets by classes of assets during the year are as follows:
Goodwill€ million
Franchiseagreements
€ millionTrademarks
€ million
Other intangible assets
€ millionTotal
€ million
Cost As at 1 January 2016 1,882.6 155.7 56.9 26.2 2,121.4Intangible assets arising on current year acquisitions (refer to Note 22) 3.2 – 7.8 8.8 19.8Reclassified to assets held for sale (refer to Note 18) – – (7.8) (8.8) (16.6)Foreign currency translation (31.5) (6.3) 9.0 0.1 (28.7)As at 31 December 2016 1,854.3 149.4 65.9 26.3 2,095.9Amortisation As at 1 January 2016 182.4 – 8.9 18.5 209.8Charge for the year – – – 0.4 0.4As at 31 December 2016 182.4 – 8.9 18.9 210.2Net book value as at 1 January 2016 1,700.2 155.7 48.0 7.7 1,911.6Net book value as at 31 December 2016 1,671.9 149.4 57.0 7.4 1,885.7Cost As at 1 January 2017 1,854.3 149.4 65.9 26.3 2,095.9Additions – – 1.8 – 1.8Foreign currency translation (50.7) (3.5) (3.0) – (57.2)As at 31 December 2017 1,803.6 145.9 64.7 26.3 2,040.5Amortisation As at 1 January 2017 182.4 – 8.9 18.9 210.2Charge for the year – – – 0.4 0.4As at 31 December 2017 182.4 – 8.9 19.3 210.6Net book value as at 1 January 2017 1,671.9 149.4 57.0 7.4 1,885.7Net book value as at 31 December 2017 1,621.2 145.9 55.8 7.0 1,829.9
Intangible assets not subject to amortisation amounted to €1,821.1m (2016: €1,878.3m), and are presented in the chart below:
The carrying value of intangible assets subject to amortisation amounted to €8.8m (2016: €7.4m) and comprise primarily of water rights.
Goodwill: €1,671.9mFranchise agreements: €149.4mTrademarks: €57.0m
2016€1,878.3m
Goodwill: €1,621.2mFranchise agreements: €145.9mTrademarks: €54.0m
2017€1,821.1m
153Coca-Cola HBC 2017 Integrated Annual Report
Strategic R
eport
Co
rporate G
overnance
Financial Statem
entsS
wiss S
tatutory R
eporting
Supplem
entary Inform
ation

13. Intangible assets continued
Impairment tests for goodwill and other indefinite-lived intangible assetsThe recoverable amount of each cash-generating unit was determined through a value-in-use calculation. That calculation uses cash flow projections based on financial budgets approved by the Board of Directors covering a one-year period and cash projections for four additional years. Cash flows for years two to five were projected by management based on operation and market specific high-level assumptions including growth rates, discount rates and forecasted selling prices and direct costs. Management determined gross margins based on past performance, expectations for the development of the market and expectations about raw material costs. The growth rates used in perpetuity reflect the forecasts in line with management beliefs. These forecasts exceeded, in certain cases, those expected for the industry in general, due to the strength of our brand portfolio. Management estimates discount rates using rates that reflect current market assessments of the time value of money and risks specific to the countries of operation.
No impairment of goodwill and other indefinite lived assets was indicated from the impairment tests of 2017 and 2016.
The following table sets forth the carrying value of goodwill and other indefinite lived intangible assets for those cash-generating units whose carrying value is greater than 10% of the total, as at 31 December 2017.
Goodwill€ million
Franchiseagreements
€ millionTrademarks
€ millionTotal
€ million
Italy 625.2 126.9 – 752.1Switzerland 393.0 – – 393.0The Republic of Ireland and Northern Ireland 240.4 – – 240.4All other cash-generating units 362.6 19.0 54.0 435.6Total 1,621.2 145.9 54.0 1,821.1
For the above cash-generating units, cash flows beyond the five-year period (the period in perpetuity) have been extrapolated using the following estimated growth and discount rates:
Sensitivity analysisIn the cash-generating unit of Nigeria, which held €20.1m of goodwill and franchise agreements as at 31 December 2017, possible changes in certain key assumptions of the 2017 impairment test would remove the remaining headroom. As at 31 December 2017, the recoverable amount of the Nigerian CGU calculated based on value in use exceeded carrying value by €605.1m; changes per assumption that would eliminate remaining headroom are summarised in the table below:
Average gross
profit marginGrowth rate in
perpetuityDiscount
rate
Nigeria 6.0% 6.6% 5.3%
Intangible assets not subject to amortisation as at 31 December 2017 (%)
Growth rate in perpetuity(%)
Discount rate(%)
2017 2016 2017 2016
Italy 2.5 2.5 6.7 6.5 Switzerland 1.1 1.5 6.7 6.7 The Republic of Ireland and Northern Ireland 2.9 3.1 6.8 6.8
Italy: 41%Switzerland: 22%The Republic of Ireland andNorthern Ireland: 13%Other: 24%
154 Coca-Cola HBC 2017 Integrated Annual Report
NOTES TO THE CONSOLIDATED FINANCIAL STATEMENTS CONTINUED
14. Property, plant and equipment
Accounting policyAll property, plant and equipment is initially recorded at cost and subsequently measured at cost less accumulated depreciation and impairment losses. Subsequent expenditure is added to the carrying value of the asset when it is probable that future economic benefits, in excess of the original assessed standard of performance of the existing asset, will flow to the operation and the costs can be measured reliably. All other subsequent expenditure is expensed in the period in which it is incurred.
Assets under construction are recorded as part of property, plant and equipment and depreciation on these assets commences when the assets are available for use.
The Coca-Cola Company, at its sole discretion, provides the Group with contributions towards the purchase of cold drink equipment. Payments are made on placement of coolers and are based on franchise incentive arrangements. The terms and conditions of these arrangements require reimbursement if certain conditions stipulated in the agreements are not met, including minimum volume through-put requirements. Support payments received from The Coca-Cola Company for the placement of cold drink equipment are deducted from the cost of the related asset.
Depreciation is calculated on a straight-line basis to allocate the depreciable amount over the estimated useful life of the assets as follows:
Freehold buildings and improvements 40 yearsLeasehold buildings and improvements Over the lease term, up to 40 yearsProduction equipment 4 to 20 yearsVehicles 5 to 8 yearsComputer hardware and software 3 to 10 yearsMarketing equipment 3 to 10 yearsFixtures and fittings 8 yearsReturnable containers 3 to 12 years
Freehold land is not depreciated as it is considered to have an indefinite life.
Deposits received for returnable containers by customers are accounted for as deposit liabilities (refer to Note 19).
Residual values and useful lives of assets are reviewed and adjusted if appropriate at each balance sheet date.
Property, plant and equipment and other non-financial assets that are subject to depreciation are reviewed for impairment whenever events or changes in circumstances indicate that the carrying amount may not be recoverable. An impairment loss is recognised for the amount by which the carrying amount of the asset exceeds its recoverable amount, which is the higher of the asset’s fair value less cost to sell and its value-in-use. For the purposes of assessing impairment, assets are grouped at the lowest level of separately identifiable cash flows.
155Coca-Cola HBC 2017 Integrated Annual Report
Strategic R
eport
Co
rporate G
overnance
Financial Statem
entsS
wiss S
tatutory R
eporting
Supplem
entary Inform
ation
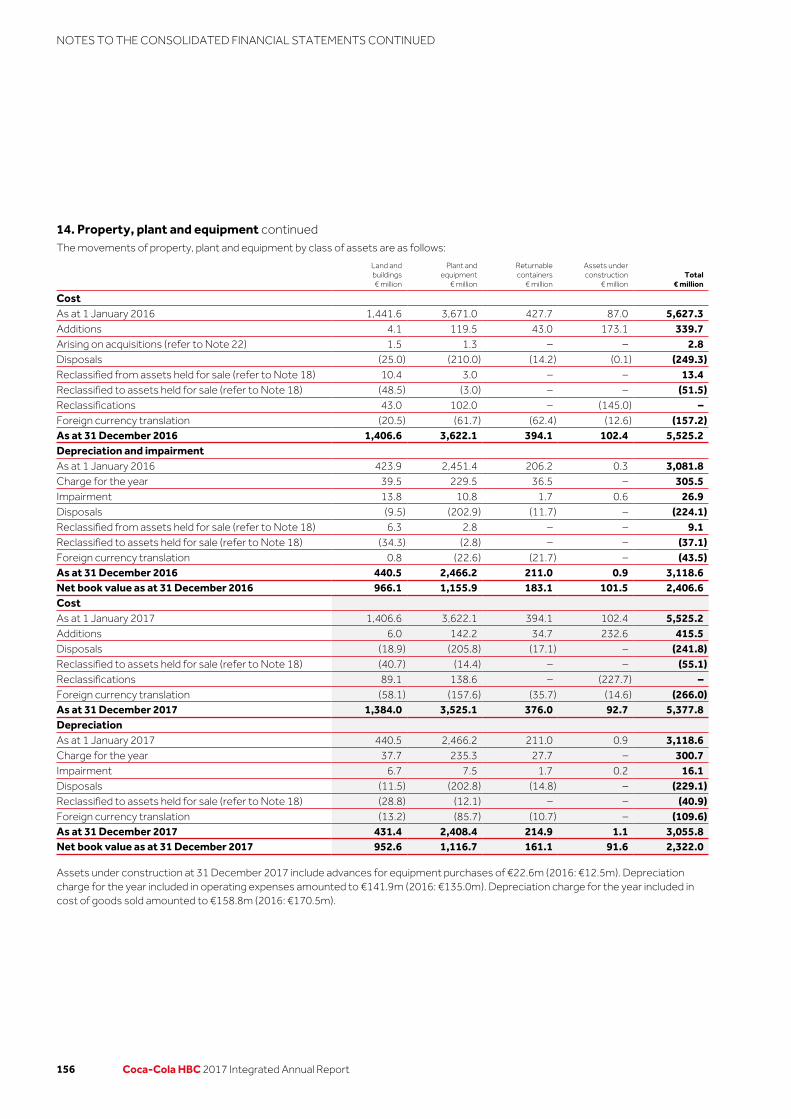
14. Property, plant and equipment continuedThe movements of property, plant and equipment by class of assets are as follows:
Land andbuildings€ million
Plant andequipment
€ million
Returnable containers
€ million
Assets under construction
€ millionTotal
€ million
CostAs at 1 January 2016 1,441.6 3,671.0 427.7 87.0 5,627.3Additions 4.1 119.5 43.0 173.1 339.7Arising on acquisitions (refer to Note 22) 1.5 1.3 – – 2.8Disposals (25.0) (210.0) (14.2) (0.1) (249.3)Reclassified from assets held for sale (refer to Note 18) 10.4 3.0 – – 13.4Reclassified to assets held for sale (refer to Note 18) (48.5) (3.0) – – (51.5)Reclassifications 43.0 102.0 – (145.0) –Foreign currency translation (20.5) (61.7) (62.4) (12.6) (157.2)As at 31 December 2016 1,406.6 3,622.1 394.1 102.4 5,525.2Depreciation and impairmentAs at 1 January 2016 423.9 2,451.4 206.2 0.3 3,081.8Charge for the year 39.5 229.5 36.5 – 305.5Impairment 13.8 10.8 1.7 0.6 26.9Disposals (9.5) (202.9) (11.7) – (224.1)Reclassified from assets held for sale (refer to Note 18) 6.3 2.8 – – 9.1Reclassified to assets held for sale (refer to Note 18) (34.3) (2.8) – – (37.1)Foreign currency translation 0.8 (22.6) (21.7) – (43.5)As at 31 December 2016 440.5 2,466.2 211.0 0.9 3,118.6Net book value as at 31 December 2016 966.1 1,155.9 183.1 101.5 2,406.6CostAs at 1 January 2017 1,406.6 3,622.1 394.1 102.4 5,525.2Additions 6.0 142.2 34.7 232.6 415.5Disposals (18.9) (205.8) (17.1) – (241.8)Reclassified to assets held for sale (refer to Note 18) (40.7) (14.4) – – (55.1)Reclassifications 89.1 138.6 – (227.7) –Foreign currency translation (58.1) (157.6) (35.7) (14.6) (266.0)As at 31 December 2017 1,384.0 3,525.1 376.0 92.7 5,377.8DepreciationAs at 1 January 2017 440.5 2,466.2 211.0 0.9 3,118.6Charge for the year 37.7 235.3 27.7 – 300.7Impairment 6.7 7.5 1.7 0.2 16.1Disposals (11.5) (202.8) (14.8) – (229.1)Reclassified to assets held for sale (refer to Note 18) (28.8) (12.1) – – (40.9)Foreign currency translation (13.2) (85.7) (10.7) – (109.6)As at 31 December 2017 431.4 2,408.4 214.9 1.1 3,055.8Net book value as at 31 December 2017 952.6 1,116.7 161.1 91.6 2,322.0
Assets under construction at 31 December 2017 include advances for equipment purchases of €22.6m (2016: €12.5m). Depreciation charge for the year included in operating expenses amounted to €141.9m (2016: €135.0m). Depreciation charge for the year included in cost of goods sold amounted to €158.8m (2016: €170.5m).
156 Coca-Cola HBC 2017 Integrated Annual Report
NOTES TO THE CONSOLIDATED FINANCIAL STATEMENTS CONTINUED

Impairment of property, plant and equipmentIn 2016 the Group recorded an impairment loss of €3.9m, €6.1m and €20.2m and recorded reversals of impairment of €0.9m, €nil and €2.4m relating to property, plant and equipment in the Established, Developing and Emerging segments respectively. This resulted in a net impairment loss of €3.0m, €6.1m and €17.8m in the Established, Developing and Emerging segments respectively. Impairment recorded mainly relates to restructuring initiatives (refer to Note 8). The impaired assets, being mainly buildings and production equipment, were written off based mainly on value-in-use calculations.
In 2017 the Group recorded an impairment loss of €6.6m, €1.9m and €13.6m and recorded reversals of impairment of €0.9m, €1.4m and €3.7m relating to property, plant and equipment in the Established, Developing and Emerging segments respectively. This resulted in a net impairment loss of €5.7m, €0.5m and €9.9m in the Established, Developing and Emerging segments respectively. Impairment recorded mainly relates to restructuring initiatives (refer to Note 8). The impaired assets, being mainly buildings and production equipment, were written off based mainly on value-in-use calculations.
Leased assets
Accounting policyLeases of property, plant and equipment, where the Group has substantially all the risks and rewards of ownership, are classified as finance leases.
Finance leases are capitalised at the inception of the lease at the lower of the fair value of the leased assets and the present value of the minimum lease payments. Each lease payment is allocated between liability and finance charges to achieve a constant rate on the finance balance outstanding. The corresponding lease obligations, net of finance charges, are included in current and non-current borrowings. The interest element of the finance cost is charged to the income statement over the lease period, so as to produce a constant periodic rate of interest on the remaining balance of the liability for each period (refer to Note 24). Property, plant and equipment acquired under finance lease is depreciated over the shorter of the useful life of the asset and the lease term. The useful life for leased assets corresponds with the Group policy for the depreciable life of property, plant and equipment.
Included in property, plant and equipment are assets held under finance leases, where the Group is the lessee, as follows:
2017€ million
2016€ million
Cost 175.7 184.9Accumulated depreciation (80.3) (82.4)Net book value 95.4 102.5
Net book value of assets held under finance leases by classes of assets is as follows:Plant and equipment 61.1 67.4Land and buildings 34.3 35.1Net book value 95.4 102.5
157Coca-Cola HBC 2017 Integrated Annual Report
Strategic R
eport
Co
rporate G
overnance
Financial Statem
entsS
wiss S
tatutory R
eporting
Supplem
entary Inform
ation

15. Interest in other entities
List of principal subsidiariesThe following are the principal subsidiaries of the Group as at 31 December:
Country of registration
% of voting rights % ownership
2017 2016 2017 2016
AS Coca-Cola HBC Eesti Estonia 100.0% 100.0% 100.0% 100.0%CCB Management Services GmbH Austria 100.0% 100.0% 100.0% 100.0%CCHBC Armenia CJSC Armenia 90.0% 90.0% 90.0% 90.0%CCHBC Bulgaria AD Bulgaria 99.4% 99.4% 99.4% 99.4%CCHBC Insurance (Guernsey) Limited Guernsey 100.0% 100.0% 100.0% 100.0%CCHBC IT Services Limited Bulgaria 100.0% 100.0% 100.0% 100.0%Coca-Cola Beverages Austria GmbH Austria 100.0% 100.0% 100.0% 100.0%Coca-Cola Beverages Belorussiya Belarus 100.0% 100.0% 100.0% 100.0%Coca-Cola Beverages Ukraine Ltd Ukraine 100.0% 100.0% 100.0% 100.0%Coca-Cola Bottlers Chisinau S.R.L. Moldova 100.0% 100.0% 100.0% 100.0%Coca-Cola HBC B-H d.o.o. Sarajevo Bosnia and Herzegovina 100.0% 100.0% 100.0% 100.0%Coca-Cola HBC Česko a Slovensko, s.r.o.1 Czech Republic 100.0% 100.0% 100.0% 100.0%Coca-Cola HBC Česko a Slovensko, s.r.o. – organizačná zložka2 Slovakia 100.0% 100.0% 100.0% 100.0%Coca-Cola HBC Finance B.V. The Netherlands 100.0% 100.0% 100.0% 100.0%Coca-Cola HBC Greece S.A.I.C. Greece 100.0% 100.0% 100.0% 100.0%Coca-Cola HBC Holdings B.V. The Netherlands 100.0% 100.0% 100.0% 100.0%Coca-Cola HBC Hrvatska d.o.o. Croatia 100.0% 100.0% 100.0% 100.0%Coca-Cola HBC Hungary Ltd Hungary 100.0% 100.0% 100.0% 100.0%Coca-Cola HBC Ireland Limited Republic of Ireland 100.0% 100.0% 100.0% 100.0%Coca-Cola HBC Italia S.r.l. Italy 100.0% 100.0% 100.0% 100.0%Coca-Cola HBC Kosovo L.L.C. Kosovo 100.0% 100.0% 100.0% 100.0%Coca-Cola HBC Northern Ireland Limited Northern Ireland 100.0% 100.0% 100.0% 100.0%Coca-Cola HBC Polska sp. z o.o. Poland 100.0% 100.0% 100.0% 100.0%Coca-Cola HBC Romania Ltd Romania 100.0% 100.0% 100.0% 100.0%Coca-Cola HBC Slovenija d.o.o. Slovenia 100.0% 100.0% 100.0% 100.0%Coca-Cola HBC Slovenska republica, s.r.o.2 Slovakia – 100.0% – 100.0%Coca-Cola HBC Switzerland Ltd Switzerland 99.9% 99.9% 99.9% 99.9%Coca-Cola HBC-Srbija d.o.o. Serbia 100.0% 100.0% 100.0% 100.0%Coca-Cola Hellenic Bottling Company-Crna Gora d.o.o., Podgorica Montenegro 100.0% 100.0% 100.0% 100.0%Coca-Cola Hellenic Business Service Organisation Bulgaria 100.0% 100.0% 100.0% 100.0%Coca-Cola Hellenic Procurement GmbH Austria 100.0% 100.0% 100.0% 100.0%CC Beverages Holdings II B.V. The Netherlands 100.0% 100.0% 100.0% 100.0%Lanitis Bros Ltd Cyprus 100.0% 100.0% 100.0% 100.0%LLC Coca-Cola HBC Eurasia Russia 100.0% 100.0% 100.0% 100.0%Nigerian Bottling Company Ltd Nigeria 100.0% 100.0% 100.0% 100.0%SIA Coca-Cola HBC Latvia Latvia 100.0% 100.0% 100.0% 100.0%Star Bottling Limited. Cyprus 100.0% 100.0% 100.0% 100.0%UAB Coca-Cola HBC Lietuva Lithuania 100.0% 100.0% 100.0% 100.0%
1. Effective 4 January 2017 Coca-Cola HBC Ceska republica, s.r.o. was renamed Coca-Cola HBC Česko a Slovensko, s.r.o.2. Effective 1 April 2017 Coca-Cola HBC Slovenska republica, s.r.o was merged with Coca-Cola HBC Česko a Slovensko, s.r.o. – organizačná zložka, branch
of Coca-Cola HBC Ceska republica, s.r.o.
158 Coca-Cola HBC 2017 Integrated Annual Report
NOTES TO THE CONSOLIDATED FINANCIAL STATEMENTS CONTINUED

Associates and joint arrangements
Accounting policies
Investments in associates
Investments in associated undertakings are accounted for by the equity method of accounting. Associated undertakings are all entities over which the Group has significant influence but not control, generally accompanying a shareholding of between 20% to 50% of the voting rights.
The equity method of accounting involves recognising the Group’s share of the associates’ post-acquisition profit or loss and movements in other comprehensive income for the period in the income statement and other comprehensive income respectively. Unrealised gains and losses resulting from transactions between the Group and the associate are eliminated to the extent of the interest in the associate.
The Group’s interest in each associate is carried in the balance sheet at an amount that reflects its share of the net assets of the associate and includes goodwill on acquisition. When the Group’s share of losses in an associate equals or exceeds its interest in the associate, the Group does not recognise further losses, unless the Group has incurred obligations or made payments on behalf of the associate.
Investments in joint arrangements
Joint arrangements are arrangements in which the Group has contractually agreed sharing of control, which exists only when decisions about the relevant activities require unanimous consent. Joint arrangements are classified as joint ventures or joint operations depending upon the rights and obligations arising from the joint arrangement.
The Group classifies a joint arrangement as a joint venture when the Group has rights to the net assets of the arrangement. The Group accounts for its interests in joint ventures using the equity method of accounting as described in the section above.
The Group classifies a joint arrangement as a joint operation when the Group has the rights to the assets, and obligations for the liabilities, of the arrangement and accounts for each of its assets, liabilities, revenues and expenses, including its share of those held or incurred jointly, in relation to the joint operation.
If facts and circumstances change, the Group reassesses whether it still has joint control and whether the type of joint arrangement in which it is involved has changed.
Critical accounting judgementsThe Group participates in several joint arrangements. Judgement is required in order to determine their classification as a joint venture where the Group has rights to the net assets of the arrangement, or a joint operation where the Group has rights to the assets and obligations for the liabilities of the arrangement. In making this judgement, consideration is given to the legal form of the arrangement, and the contractual terms and conditions, as well as other facts and circumstances (including the economic rationale of the arrangement and the impact of the legal framework).
a) Equity method investmentsChanges in the carrying amounts of equity method investments are as follows:
Associates
€ millionJoint ventures
€ millionTotal
€ million
As at 1 January 2016 23.2 90.6 113.8Capital increase – 7.9 7.9Additions (refer to Note 22) – 7.1 7.1Share of results of equity method investments 7.8 6.0 13.8Share of other comprehensive income of equity method investments (7.4) (0.1) (7.5)
Share of total comprehensive income 0.4 5.9 6.3Dividends (1.1) (17.0) (18.1)As at 31 December 2016 22.5 94.5 117.0Share of results of equity method investments 5.2 6.6 11.8Share of other comprehensive income of equity method investments (5.2) (0.1) (5.3)
Share of total comprehensive income – 6.5 6.5Disposals (refer to Note 22) – (3.5) (3.5)Return of capital – (17.7) (17.7)Dividends (0.5) (5.0) (5.5)As at 31 December 2017 22.0 74.8 96.8
159Coca-Cola HBC 2017 Integrated Annual Report
Strategic R
eport
Co
rporate G
overnance
Financial Statem
entsS
wiss S
tatutory R
eporting
Supplem
entary Inform
ation

15. Interests in other entities continuedIncluded in investment in associates is the Group’s investment in Frigoglass Industries Limited and Frigoglass West Africa Ltd. Nigerian Bottling Company Ltd holds an interest in Frigoglass Industries Limited of 23.9% (2016: 23.9% respectively). The Group has a 100% (2016: 100%) interest in Nigeria Bottling Company Ltd, therefore the Group has an effective interest of 23.9% in both Frigoglass Industries Limited (2016: 23.9%) and Frigoglass West Africa Ltd (2016: 23.9%).
In 2017, Frigoglass Industries Nigeria Limited and Frigoglass West Africa Ltd, became guarantors under the amended banking facilities and notes issued by the Frigoglass Group, as part of the debt restructuring of the latter. The Group has no direct exposure arising from these guarantee arrangements, but the Group’s investment in these associates, which stood at €16.8m as at 31 December 2017, would be at potential risk if there was a default under the terms of the amended banking facilities or the notes and the Frigoglass Group (including the guarantors) were unable to meet their obligations there under.
Investments in joint venturesThe Group has a significant joint venture with Heineken that is conducted through a number of legal entities being the BrewTech B.V. Group of companies, which is engaged in the bottling and distribution of soft drinks and beer in FYROM and the Brewinvest S.A. Group of companies which has minimal activity. BrewTech B.V. is incorporated in the Netherlands and the Group owns 50% (2016: 50%) of its share capital. Brewinvest S.A., parent company of Brewinvest S.A. Group of companies, which has minimal other activities, is incorporated in Greece and the Group owns 50% (2016: 50%) of its share capital. The structure of the joint venture provides the Group with rights to their net assets.
Summarised financial information of the Group’s significant joint venture is as follows (the information below reflects the amount presented in the IFRS financial statements of the joint venture, and not the Group’s share in those amounts):
2017
€ million2016
€ million
Summarised balance sheet: Non-current assets 56.1 46.9 Cash and cash equivalents 5.4 31.1Other current assets 7.8 16.8Total current assets 13.2 47.9Other current liabilities (including trade payables) (11.2) (10.9)Total current liabilities (11.2) (10.9)Non-current other liabilities (0.1) (0.2)Net assets 58.0 83.7 Summarised statement of comprehensive income: Revenue 61.8 57.8Depreciation and amortisation (5.0) (4.7)Interest income 0.2 0.6Interest expense – (0.1)Profit before tax 13.9 13.2Income tax expense (1.7) (1.6)Profit after tax 12.2 11.6Other comprehensive income 0.1 –Total comprehensive income 12.3 11.6Dividends received and capital returns (refer to Note 26) 19.3 16.5 Reconciliation of net assets to carrying amount: Closing net assets 58.0 83.7Interest in joint venture at 50% 29.0 41.8Goodwill 16.9 16.9Non-controlling interest (1.7) (1.7)Carrying value 44.2 57.0
160 Coca-Cola HBC 2017 Integrated Annual Report
NOTES TO THE CONSOLIDATED FINANCIAL STATEMENTS CONTINUED
Summarised financial information of the Group’s investment in other joint venture is as follows:
2017
€ million2016
€ million
Carrying amount 30.6 37.5Share of profit 0.5 0.2Share of other comprehensive income (0.1) (0.1)Share of total comprehensive income 0.4 0.1
The Group’s share of profit in other joint ventures includes restructuring initiatives within joint ventures of €0.2m (2016: €0.1m)
At 31 December 2017, the Group’s share of its joint ventures’ capital commitments and long-term commitments to purchase raw materials and receive services amounted to €nil (2016: €0.4m and €nil respectively).
b) Joint operations with TCCCThe Group has a 50% interest in the Multon Z.A.O. group of companies (‘Multon’). Multon is engaged in the production and distribution of juices in Russia and is classified as a joint operation as the arrangement gives the Group rights to the assets and obligations for the liabilities relating to the joint arrangement. Other joint operations of the Group comprise mainly a 50% interest in each of the water businesses depicted below, which are engaged in the production and distribution of water in the respective countries.
Country Joint operation Country Joint operation
Austria Römerquelle Poland MultivitaItaly Fonti del Vulture Switzerland ValserRomania Dorna Serbia VlasinkaBaltics Neptuno Vandenys
16. Inventories
Accounting policyInventories are stated at the lower of cost and net realisable value.
Cost for raw materials and consumables is determined on a weighted average basis. Cost for work in progress and finished goods is comprised of the cost of direct materials and labour plus attributable overhead costs. Cost includes all costs incurred to bring the product to its present location and condition.
Net realisable value is the estimated selling price in the ordinary course of business, less the estimated costs necessary to complete and sell the inventory.
Inventories consisted of the following at 31 December:
2017
€ million2016
€ million
Finished goods 197.7 199.8Raw materials and work in progress 151.4 158.3Consumables 67.7 73.4Total inventories 416.8 431.5
The amount of inventories recognised as an expense during 2017 was €3,154.6m (2016: €2,990.3m). During 2017 provision of obsolete inventories recognised as an expense amounted to €10.6m (2016: €11.4m), whereas provision reversed in the year amounted to €1.2m (2016: €0.5m).
161Coca-Cola HBC 2017 Integrated Annual Report
Strategic R
eport
Co
rporate G
overnance
Financial Statem
entsS
wiss S
tatutory R
eporting
Supplem
entary Inform
ation

17. Trade, other receivables and assets
Accounting policiesTrade receivables are initially recognised at fair value and subsequently measured at amortised cost. A provision for doubtful debts is established when there is objective evidence that the Group will not be able to collect all amounts due, according to the original terms of the trade receivable. Significant financial difficulties of the debtor, probability that the debtor will enter into bankruptcy or financial reorganisation and default or delinquency in payments (over 90 days) are considered indicators that the trade receivable could be uncollectible. The amount of the provision is the difference between the receivable’s carrying amount and the present value of its estimated future cash flows, discounted at the original effective interest rate. The carrying amount of the receivable is reduced by the amount of the provision, which is recognised as part of operating expenses. If a trade receivable ultimately becomes uncollectible, it is written off initially against any provision made in respect of that receivable with any excess recognised as part of operating expenses. Subsequent recoveries of amounts previously written off or provisions no longer required are credited against operating expenses.
Loans are initially recognised at the fair value net of transaction costs incurred.
After initial recognition, all interest-bearing loans are subsequently measured at amortised cost. Amortised cost is calculated using the effective interest rate method whereby any discount, premium or transaction costs associated with a loan are amortised to the income statement over the borrowing period.
Financial assets
The Group classifies its investments in debt and equity securities into the following categories: held-to-maturity and available-for-sale. The classification depends on the purpose for which the investment was acquired. Investments with a fixed maturity that management has the intent and ability to hold to maturity are classified as held-to-maturity and are included in non-current assets, except for those with maturities within 12 months from the balance sheet date, which are classified as current assets. Investments intended to be held for an indefinite period of time, which may be sold in response to need for liquidity or changes in interest rates, are classified as available-for-sale and are classified as non-current assets, unless they are expected to be realised within 12 months of the balance sheet date. Available-for-sale financial assets are carried at fair value. Held-to-maturity investments are carried at amortised cost using the effective interest rate method.
The Group derecognises a financial asset when the contractual rights to the cash flows from the asset expire, or it transfers the rights to receive the contractual cash flows in a transaction in which substantially all of the risks and rewards of ownership of the financial asset are transferred, or it neither transfers nor retains substantially all of the risks and rewards of ownership and does not retain control over the transferred asset. When the Group has neither transferred nor retained substantially all the risks and rewards of the asset, nor transferred control of the asset, the Group continues to recognise the transferred asset to the extent of the Group’s continuing involvement. In that case, the Group also recognises an associated liability. The transferred asset and the associated liability are measured on a basis that reflects the rights and obligations that the Group has retained.
Unrealised gains and losses on available-for-sale financial assets are recognised in other comprehensive income, except for impairment losses and foreign exchange gains and losses on monetary financial assets that are recognised in the income statement, until the financial assets are derecognised, at which time the cumulative gains or losses previously recognised in equity are reclassified to the income statement.
Gains and losses on held-to-maturity investments are recognised in the income statement, when the investments are derecognised or impaired.
162 Coca-Cola HBC 2017 Integrated Annual Report
NOTES TO THE CONSOLIDATED FINANCIAL STATEMENTS CONTINUED

Trade, other receivables and assets consisted of the following as at 31 December:
Current assets Non-current assets
2017€ million
2016€ million
2017€ million
2016€ million
Trade and other receivables: Trade receivables 688.7 727.6 2.0 2.2Receivables from related parties (refer to Note 26) 89.8 117.0 – –Loans to related parties (refer to Note 26) 3.6 5.2 – –Loans receivable 1.2 0.1 0.7 0.4Receivables from sale of property, plant and equipment 2.8 0.5 – –Non-current income tax receivable – – 8.5 8.4VAT and other taxes receivable 30.0 35.5 – –Loans and advances to employees 5.5 5.7 – –Other receivables 72.3 63.2 – –Total trade and other receivables 893.9 954.8 11.2 11.0Other assets: Prepayments 72.9 76.0 14.6 13.2Held-to-maturity investments – – 0.9 0.9Pension plan assets (refer to Note 20) – – 2.0 –Available-for-sale financial assets – – 3.7 3.6Total other assets 72.9 76.0 21.2 17.7Total trade, other receivables and assets 966.8 1,030.8 32.4 28.7
Non-current trade receivables relate to re-negotiated receivables, which are expected to be settled within the new contractual due date.
Current assets classified within the category ‘held-to-maturity’ are recorded as ‘Other financial assets’ in the consolidated balance sheet, refer to Note 23 – ‘Financial instruments categories’.
Trade receivables classified as current assets consisted of the following at 31 December:
2017
€ million2016
€ million
Trade receivables 792.3 819.6Less: Provision for doubtful debts (103.6) (92.0)Total trade receivables 688.7 727.6
Trade receivables classified as current assets, are as follows:
2017
€ million2016
€ million
Within due date 576.8 588.9Less: Provision for doubtful debts within due date (3.4) (2.5)Past due 215.5 230.7Less: Provision for doubtful debts past due (100.2) (89.5)Total trade receivables 688.7 727.6
The carrying amount of the trade receivables include €0.3m which are subject to a factoring agreement (2016: €15.3m). The Group continues to recognise the factored receivables in their entirety as it has retained the significant risks of ownership. The amount payable under the factoring agreement is presented within borrowings (refer to Note 24).
163Coca-Cola HBC 2017 Integrated Annual Report
Strategic R
eport
Co
rporate G
overnance
Financial Statem
entsS
wiss S
tatutory R
eporting
Supplem
entary Inform
ation

17. Trade, other receivables and assets continuedThe ageing analysis of past due trade receivables is as follows:
2017
€ million
Up to three
monthsThree to six
monthsSix to nine
monthsMore than nine
months Total
Trade receivables past due but not impaired 103.8 2.3 2.0 7.2 115.3Trade receivables past due and impaired 4.4 7.5 5.0 83.3 100.2Total trade receivables past due 108.2 9.8 7.0 90.5 215.5
2016
€ million
Up to three
monthsThree to six
monthsSix to nine
monthsMore than nine
months Total
Trade receivables past due but not impaired 114.6 12.6 3.5 10.5 141.2Trade receivables past due and impaired 4.1 7.3 3.4 74.7 89.5Total trade receivables past due 118.7 19.9 6.9 85.2 230.7
The movement in the provision for doubtful debts during the year is as follows:
2017
€ million2016
€ million
As at 1 January (92.0) (78.9)Amounts written off during the year 5.3 7.7Amounts recovered during the year 6.0 2.2Increase in allowance recognised in income statement (23.6) (22.8)Foreign currency translation 0.7 (0.2)As at 31 December (103.6) (92.0)
Receivables from related partiesThe related party receivables, net of the provision for doubtful debts, are as follows:
2017
€ million2016
€ million
Within due date 85.7 114.0Past due 4.4 3.3Less: Provision for doubtful debts (0.3) (0.3)Total related party receivables 89.8 117.0
As at 31 December 2017, related party receivables of €4.1m (2016: €3.0m) were past due but not impaired. The ageing analysis of these receivables is as follows:
2017
€ million2016
€ million
Up to three months 3.3 1.3Three to six months 0.2 0.3Six to nine months 0.1 0.3More than nine months 0.5 1.1Total 4.1 3.0
164 Coca-Cola HBC 2017 Integrated Annual Report
NOTES TO THE CONSOLIDATED FINANCIAL STATEMENTS CONTINUED
18. Assets classified as held for sale
Accounting policyNon-current assets and disposal groups are classified as held for sale if it is considered highly probable that their carrying amount will be principally recovered through a sale transaction rather than through continuing use. This condition is regarded as met only when the sale is highly probable and the asset (or disposal group) is available for immediate sale in its present condition. In order for a sale to be considered highly probable, management must be committed to a plan to sell the asset, an active programme to locate a buyer and complete the plan must have been initiated, and the sale expected to be completed within one year from the date of classification. In the event that the criteria for continued classification as held for sale are no longer met, the assets are reclassified to property, plant and equipment and the depreciation charge is adjusted for the depreciation that would have been recognised had the assets not been classified as held for sale. Non-current assets and disposal groups classified as held for sale are measured at the lower of the individual assets’ previous carrying amount and their fair value less costs to sell.
Changes in carrying amounts of assets classified as held for sale for the years ended 31 December are as follows:
2017
€ million2016
€ million
As at 1 January 11.8 5.5Reclassified from property, plant and equipment (refer to Note 14) 14.2 14.4Other assets classified as held for sale – 14.0Disposals (22.5) (17.1)Reclassified to property, plant and equipment (refer to Note 14) – (4.3)Foreign currency translation (0.2) (0.7)As at 31 December 3.3 11.8
In 2016, it was agreed that 50% of the Group’s share in its subsidiary Neptūno Vandenys, UAB, would be sold to European Refreshments, a subsidiary of TCCC. Accordingly, 50% of the net assets of Neptūno Vandenys, UAB amounting to €14.0m, mainly relating to intangible assets of €16.6m (refer to Note 13), net of the relevant deferred tax liability, were classified as assets held for sale. The transaction was completed in December 2016 (refer to Note 22). Total assets classified as held for sale as at 31 December 2016 amounted to €11.8m comprising property, plant and equipment in our Established, Developing and Emerging markets, measured at the lower of the carrying amount and fair value less costs to sell. The fair value of held for sale assets was determined through the use of a sales comparison approach and is a non-recurring fair value measurement within Level 3 of the fair value hierarchy.
Total assets classified as held for sale as at 31 December 2017 amounted to €3.3m comprising the net book value of property, plant and equipment in our Established, Developing and Emerging markets that have been written down to fair value less cost to sell. The fair value of assets classified as held for sale was determined through the use of a sales comparison approach and is a non-recurring fair value measurement within Level 3 of the fair value hierarchy.
19. Trade and other payables
Accounting policyTrade payables are recognised initially at fair value and subsequently measured at amortised cost using the effective interest rate method.
Trade and other payables consisted of the following at 31 December:
2017
€ million2016
€ million
Trade payables 569.5 536.7Accrued liabilities 428.1 471.2Payables to related parties (refer to Note 26) 300.9 303.4Deposit liabilities 94.0 100.6Other tax and social security liabilities 84.8 98.1Salaries and employee-related payables 41.8 43.6Deferred income 1.0 1.0Other payables 24.3 32.7Total trade and other payables 1,544.4 1,587.3
The amount due to pension funds as at 31 December 2017 was €0.9m (2016: €1.3m).
165Coca-Cola HBC 2017 Integrated Annual Report
Strategic R
eport
Co
rporate G
overnance
Financial Statem
entsS
wiss S
tatutory R
eporting
Supplem
entary Inform
ation

20. Provisions and employee benefitsProvisions and employee benefits consisted of the following at 31 December:
2017
€ million2016
€ million
Current: Employee benefits 61.8 96.0Restructuring provisions 7.7 8.5Other provisions 14.1 14.1Total current provisions and employee benefits 83.6 118.6 Non-current: Employee benefits 118.7 123.0Other provisions 1.5 2.0Total non-current provisions and employee benefits 120.2 125.0Total provisions and employee benefits 203.8 243.6
a) Provisions
Accounting policyProvisions are recognised when: the Group has a present obligation (legal or constructive) as a result of a past event; it is probable that an outflow of resources embodying economic benefits will be required to settle the obligation; and a reliable estimate can be made of the amount of the obligation.
Where the Group expects a provision to be reimbursed, for example under an insurance contract, the reimbursement is recognised as a separate asset only when such reimbursement is virtually certain. If the effect of the time value of money is material, provisions are determined by discounting the expected future cash flows at a pre-tax rate that reflects current market assessments of the time value of money and the risks specific to the liability.
The movements in restructuring and other provisions comprise:
2017
€ million2016
€ million
Restructuring
provisionsOther
provisionsRestructuring
provisionsOther
provisions
As at 1 January 8.5 16.1 15.8 10.1Arising during the year 19.3 5.4 22.7 11.8Utilised during the year (17.3) (4.2) (26.8) (4.3)Unused amount reversed (2.5) (1.6) (2.5) (1.5)Foreign currency translation (0.3) (0.1) (0.7) –As at 31 December 7.7 15.6 8.5 16.1
Other provisions comprise a provision for employee litigation of €3.2m (2016: €4.2m) and other items of €12.4m (2016: €11.9m).
166 Coca-Cola HBC 2017 Integrated Annual Report
NOTES TO THE CONSOLIDATED FINANCIAL STATEMENTS CONTINUED

b) Employee benefits
Accounting policies
Employee benefits
The Group operates a number of defined benefit and defined contribution pension plans in its territories.
The defined benefit plans are made up of both funded and unfunded pension plans and employee leaving indemnities. The assets of funded plans are generally held in separate trustee-administered funds and are financed by payments from employees and/or the relevant Group companies.
The liability recognised in the balance sheet in respect of defined benefit plans is the present value of the defined benefit obligation at the balance sheet date less the fair value of the plan assets.
For defined benefit pension plans, pension costs are assessed using the projected unit credit method. Actuarial gains and losses arising from experience adjustments and changes in actuarial assumptions are charged or credited to equity in other comprehensive income in the period in which they arise. Such actuarial gains and losses are not reclassified to the income statement in subsequent periods. The defined benefit obligations are measured at the present value of the estimated future cash outflows using interest rates of high-quality corporate bonds that are denominated in the currency in which the benefits will be paid, and that have terms approximating to the terms of the related obligation. In countries where there is no deep market in such bonds, the market rates on government bonds are used. Past service cost is recognised immediately in the income statement. A number of the Group’s operations have other long-service benefits in the form of jubilee plans. These plans are measured at the present value of the estimated future cash outflows with immediate recognition of actuarial gains and losses in the income statement.
The Group’s contributions to the defined contribution pension plans are charged to the income statement in the period to which the contributions relate.
Termination benefits
Termination benefits are payable whenever an employee’s employment is terminated before the normal retirement date or whenever an employee accepts voluntary redundancy in exchange for these benefits. The Group recognises termination benefits at the earlier of the following dates: a) when the Group can no longer withdraw the offer of those benefits and b) when the Group recognises costs for a restructuring that is within the scope of IAS 37 Provisions, Contingent Liabilities and Contingent Assets and involves the payment of termination benefits. In the case of an offer made to encourage voluntary redundancy, the termination benefits are measured based on the number of employees expected to accept the offer.
Critical accounting estimatesThe Group provides defined benefit pension plans as an employee benefit in certain territories. Determining the value of these plans requires several actuarial assumptions and estimates about discount rates, future salary increases and future pension increases. Due to the long-term nature of these plans, such estimates are subject to significant uncertainty.
Employee benefits consisted of the following at 31 December:
2017
€ million2016
€ million
Defined benefit plans: Employee leaving indemnities 68.9 76.0Pension plans 27.7 39.8Long service benefits – jubilee plans 7.4 8.4Total defined benefits plans 104.0 124.2Other employee benefits: Annual leave 7.5 7.4Other employee benefits 69.0 87.4Total other employee benefits 76.5 94.8Total employee benefits obligations 180.5 219.0
Other employee benefits are primarily comprised of employee bonuses including a management incentive plan which is a cash variable plan that operates over a three-year period.
167Coca-Cola HBC 2017 Integrated Annual Report
Strategic R
eport
Co
rporate G
overnance
Financial Statem
entsS
wiss S
tatutory R
eporting
Supplem
entary Inform
ation
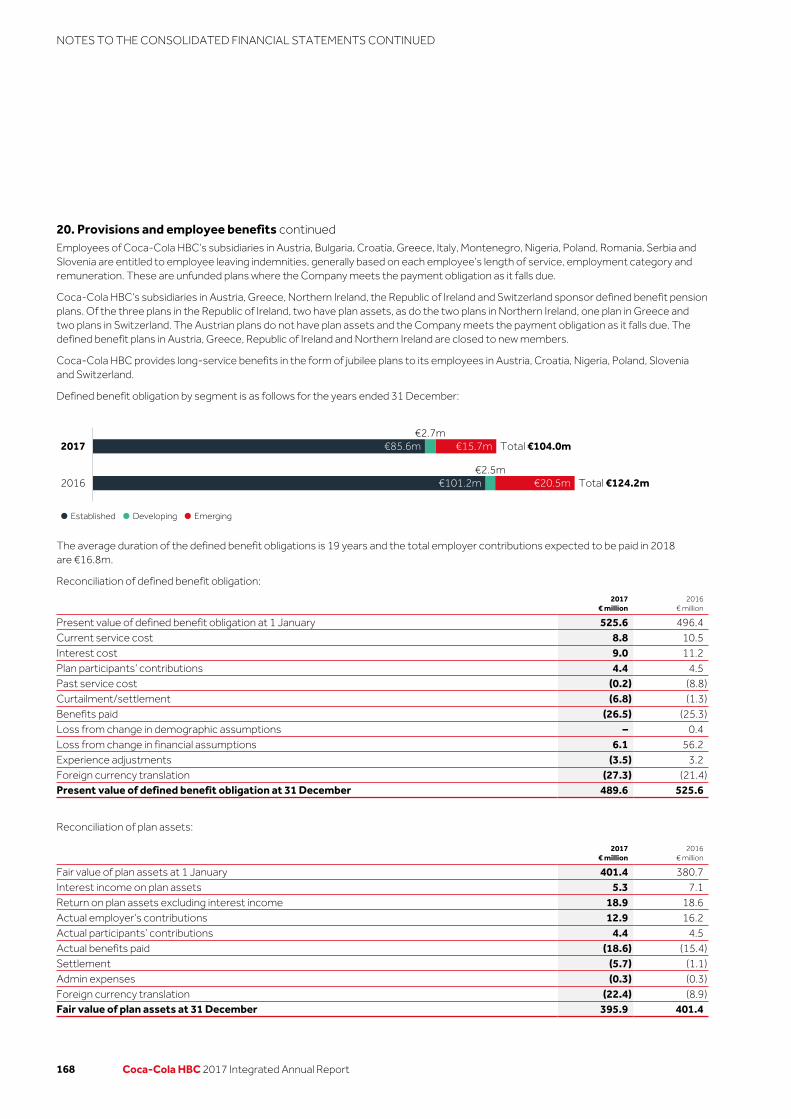
20. Provisions and employee benefits continuedEmployees of Coca-Cola HBC’s subsidiaries in Austria, Bulgaria, Croatia, Greece, Italy, Montenegro, Nigeria, Poland, Romania, Serbia and Slovenia are entitled to employee leaving indemnities, generally based on each employee’s length of service, employment category and remuneration. These are unfunded plans where the Company meets the payment obligation as it falls due.
Coca-Cola HBC’s subsidiaries in Austria, Greece, Northern Ireland, the Republic of Ireland and Switzerland sponsor defined benefit pension plans. Of the three plans in the Republic of Ireland, two have plan assets, as do the two plans in Northern Ireland, one plan in Greece and two plans in Switzerland. The Austrian plans do not have plan assets and the Company meets the payment obligation as it falls due. The defined benefit plans in Austria, Greece, Republic of Ireland and Northern Ireland are closed to new members.
Coca-Cola HBC provides long-service benefits in the form of jubilee plans to its employees in Austria, Croatia, Nigeria, Poland, Slovenia and Switzerland.
Defined benefit obligation by segment is as follows for the years ended 31 December:
The average duration of the defined benefit obligations is 19 years and the total employer contributions expected to be paid in 2018 are €16.8m.
Reconciliation of defined benefit obligation:
2017
€ million2016
€ million
Present value of defined benefit obligation at 1 January 525.6 496.4Current service cost 8.8 10.5Interest cost 9.0 11.2Plan participants’ contributions 4.4 4.5Past service cost (0.2) (8.8)Curtailment/settlement (6.8) (1.3)Benefits paid (26.5) (25.3)Loss from change in demographic assumptions – 0.4Loss from change in financial assumptions 6.1 56.2Experience adjustments (3.5) 3.2Foreign currency translation (27.3) (21.4)Present value of defined benefit obligation at 31 December 489.6 525.6
Reconciliation of plan assets:
2017
€ million2016
€ million
Fair value of plan assets at 1 January 401.4 380.7Interest income on plan assets 5.3 7.1Return on plan assets excluding interest income 18.9 18.6Actual employer’s contributions 12.9 16.2Actual participants’ contributions 4.4 4.5Actual benefits paid (18.6) (15.4)Settlement (5.7) (1.1)Admin expenses (0.3) (0.3)Foreign currency translation (22.4) (8.9)Fair value of plan assets at 31 December 395.9 401.4
€85.6m
€20.5m
€2.7m
€2.5m
€15.7m
€101.2m
Established Developing Emerging
Total €104.0m
Total €124.2m
2017
2016
168 Coca-Cola HBC 2017 Integrated Annual Report
NOTES TO THE CONSOLIDATED FINANCIAL STATEMENTS CONTINUED

The present value and funded status of defined benefit obligations were as follows at 31 December:
2017
€ million2016
€ million
Present value of funded obligations 411.3 439.1Fair value of plan assets (395.9) (401.4)Defined benefit obligations of funded plans 15.4 37.7Present value of unfunded obligations 78.3 86.5Unrecognised asset due to asset ceiling 8.3 –Defined benefit obligations 102.0 124.2Plus: amounts recognised within non-current assets (refer to Note 17) 2.0 –Total defined benefit obligations 104.0 124.2
Funding levels are monitored in conjunction with the agreed contribution rate. The funding level of the funded plans as at 31 December 2017 was 94% (2016: 91%).
Two of the plans have funded status surplus of €2.0m as at 31 December 2017 (31 December 2016: € nil) that is recognised as an asset on the basis that the Group has an unconditional right to future economic benefits either via a refund or a reduction in future contributions.
The movement in the defined benefit obligation recognised on the balance sheet was as follows:
2017
€ million2016
€ million
Defined benefit obligation as at 1 January 124.2 115.7Expense recognised in the income statement 10.4 5.4Remeasurements recognised in OCI (6.9) 41.7Employer contributions (12.9) (16.2)Benefits paid (7.9) (9.9)Foreign currency translation (4.9) (12.5)Defined benefit obligation as at 31 December 102.0 124.2Plus: amounts recognised within non-current assets (refer to Note 17) 2.0 –Total defined benefit obligation as at 31 December 104.0 124.2
The expense recognised in the income statement comprised the following for the years ended 31 December:
2017
€ million2016
€ million
Service cost 7.5 1.5Net interest cost on defined benefit liability / (asset) 3.7 4.1Actuarial gain (1.1) (0.5)Administrative expenses 0.3 0.3Total 10.4 5.4
Defined benefit plan expense is included in staff costs and presented in cost of goods sold and operating expenses.
The assumptions (weighted average for the Group) used in computing the defined benefit obligation comprised the following for the years ended 31 December:
2017
%2016
%
Discount rate 1.8 1.9Rate of compensation increase 2.7 2.7Rate of pension increase 1.1 1.0Life expectancy for pensioners at the age of 65 in years: Male 22 22Female 24 24
Asset liability matching: Plan assets allocated to growth assets are monitored regularly to ensure they remain appropriate and in line with the Group’s long-term strategy to manage the plans. As the plans mature, the level of investment risk will be reduced by investing more in assets such as bonds that better match the liabilities.
169Coca-Cola HBC 2017 Integrated Annual Report
Strategic R
eport
Co
rporate G
overnance
Financial Statem
entsS
wiss S
tatutory R
eporting
Supplem
entary Inform
ation
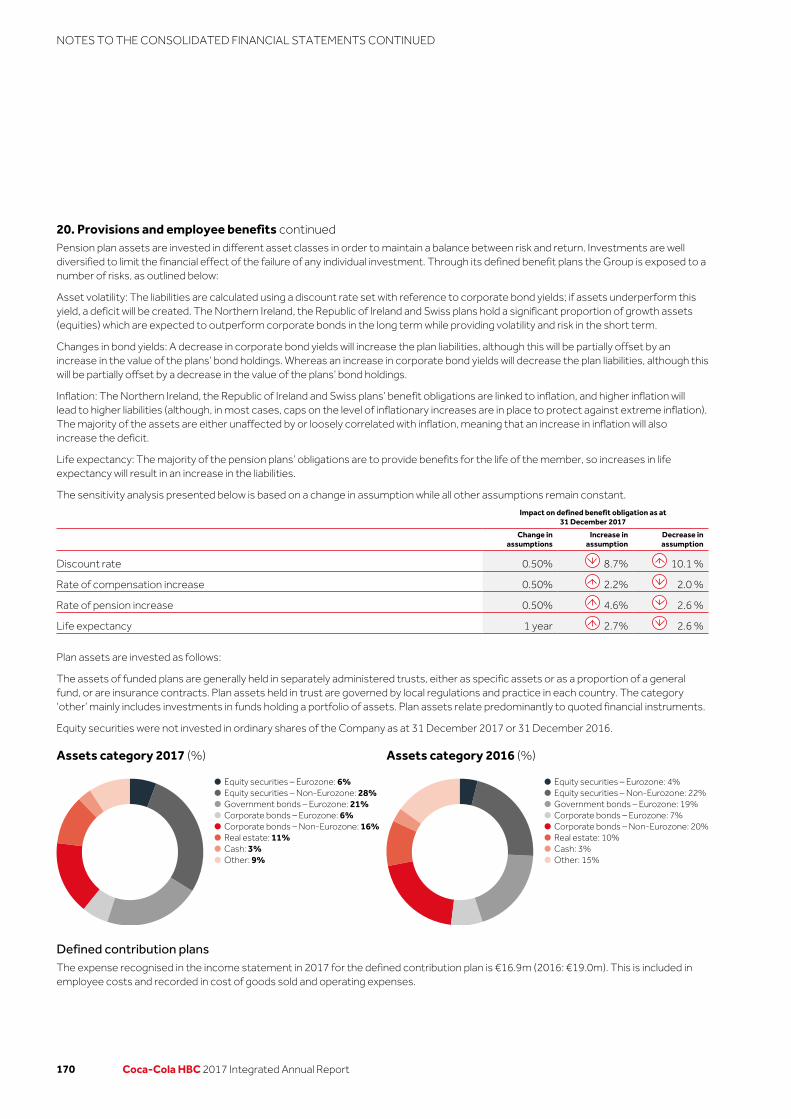
20. Provisions and employee benefits continuedPension plan assets are invested in different asset classes in order to maintain a balance between risk and return. Investments are well diversified to limit the financial effect of the failure of any individual investment. Through its defined benefit plans the Group is exposed to a number of risks, as outlined below:
Asset volatility: The liabilities are calculated using a discount rate set with reference to corporate bond yields; if assets underperform this yield, a deficit will be created. The Northern Ireland, the Republic of Ireland and Swiss plans hold a significant proportion of growth assets (equities) which are expected to outperform corporate bonds in the long term while providing volatility and risk in the short term.
Changes in bond yields: A decrease in corporate bond yields will increase the plan liabilities, although this will be partially offset by an increase in the value of the plans’ bond holdings. Whereas an increase in corporate bond yields will decrease the plan liabilities, although this will be partially offset by a decrease in the value of the plans’ bond holdings.
Inflation: The Northern Ireland, the Republic of Ireland and Swiss plans’ benefit obligations are linked to inflation, and higher inflation will lead to higher liabilities (although, in most cases, caps on the level of inflationary increases are in place to protect against extreme inflation). The majority of the assets are either unaffected by or loosely correlated with inflation, meaning that an increase in inflation will also increase the deficit.
Life expectancy: The majority of the pension plans’ obligations are to provide benefits for the life of the member, so increases in life expectancy will result in an increase in the liabilities.
The sensitivity analysis presented below is based on a change in assumption while all other assumptions remain constant.
Impact on defined benefit obligation as at
31 December 2017
Change in
assumptionsIncrease in
assumptionDecrease in assumption
Discount rate 0.50% 8.7% 10.1 %
Rate of compensation increase 0.50% 2.2% 2.0 %
Rate of pension increase 0.50% 4.6% 2.6 %
Life expectancy 1 year 2.7% 2.6 %
Plan assets are invested as follows:
The assets of funded plans are generally held in separately administered trusts, either as specific assets or as a proportion of a general fund, or are insurance contracts. Plan assets held in trust are governed by local regulations and practice in each country. The category ‘other’ mainly includes investments in funds holding a portfolio of assets. Plan assets relate predominantly to quoted financial instruments.
Equity securities were not invested in ordinary shares of the Company as at 31 December 2017 or 31 December 2016.
Defined contribution plansThe expense recognised in the income statement in 2017 for the defined contribution plan is €16.9m (2016: €19.0m). This is included in employee costs and recorded in cost of goods sold and operating expenses.
Assets category 2017 (%) Assets category 2016 (%)
Equity securities – Eurozone: 6%Equity securities – Non-Eurozone: 28%Government bonds – Eurozone: 21%Corporate bonds – Eurozone: 6%Corporate bonds – Non-Eurozone: 16%Real estate: 11%Cash: 3%Other: 9%
Equity securities – Eurozone: 4%Equity securities – Non-Eurozone: 22%Government bonds – Eurozone: 19%Corporate bonds – Eurozone: 7%Corporate bonds – Non-Eurozone: 20%Real estate: 10%Cash: 3%Other: 15%
170 Coca-Cola HBC 2017 Integrated Annual Report
NOTES TO THE CONSOLIDATED FINANCIAL STATEMENTS CONTINUED

21. Offsetting financial assets and financial liabilities
Accounting policyThe Group offsets financial assets and financial liabilities to the net amount reported in the balance sheet when it currently has a legally enforceable right to offset the recognised amounts and it intends to settle on a net basis or to realise the asset and settle the liability simultaneously. The legally enforceable right must not be contingent on future events and must be enforceable in the normal course of business and in the event of default, insolvency or bankruptcy of the company or the counterparty.
The Group enters into derivative transactions under International Swaps and Derivatives Association (ISDA) master netting agreements or other similar agreements. In general, under such agreements the counterparties can elect to settle into one single net amount the aggregated amounts owed by each counterparty on a single day with respect of all outstanding transactions of the same currency and the same type of derivative. In the event of default or early termination all outstanding transactions under the agreement are terminated and subject to any set-off. These agreements do not meet all of the IAS 32 criteria for offsetting in the balance sheet as the Group does not have any current legally enforceable right to offset amounts since the right can only be applied if elected by both counterparties.
The financial assets and financial liabilities presented below are subject to offsetting, enforceable master netting or similar agreements. The column ‘Net amount’ shows the impact on the Group’s balance sheet if all set-off rights were exercised.
a) Financial assetsAs at 31 December 2017
Related amounts not set
off in the balance sheet
Gross amounts of recognised financial
assets€ million
Gross amounts of recognised financial
liabilities set off in the balance sheet
€ million
Net amounts of financial assets presented in the
balance sheet€ million
Financialinstruments
€ millionNet amount
€ million
Derivative financial assets 16.4 – 16.4 (5.0) 11.4Cash and cash equivalents 723.5 – 723.5 – 723.5Other financial assets 150.9 – 150.9 – 150.9Trade receivables 757.2 (68.5) 688.7 – 688.7Total 1,648.0 (68.5) 1,579.5 (5.0) 1,574.5
As at 31 December 2016
Related amounts not set
off in the balance sheet
Gross amounts of recognised financial
assets€ million
Gross amounts of recognised financial
liabilities set off in the balance sheet
€ million
Net amounts of financial assets presented in the
balance sheet€ million
Financialinstruments
€ millionNet amount
€ million
Derivative financial assets 16.0 – 16.0 (8.3) 7.7Cash and cash equivalents 573.2 – 573.2 – 573.2Trade receivables 780.7 (53.1) 727.6 – 727.6Total 1,369.9 (53.1) 1,316.8 (8.3) 1,308.5
b) Financial liabilitiesAs at 31 December 2017
Related amounts not set
off in the balance sheet
Gross amounts of recognised financial
liabilities€ million
Gross amounts of recognised financial assets set off in the
balance sheet€ million
Net amounts of financial liabilities presented in
the balance sheet€ million
Financialinstruments
€ millionNet amount
€ million
Derivative financial liabilities 5.4 – 5.4 (5.0) 0.4Trade payables 638.0 (68.5) 569.5 – 569.5Total 643.4 (68.5) 574.9 (5.0) 569.9
171Coca-Cola HBC 2017 Integrated Annual Report
Strategic R
eport
Co
rporate G
overnance
Financial Statem
entsS
wiss S
tatutory R
eporting
Supplem
entary Inform
ation

21. Offsetting financial assets and financial liabilities continuedAs at 31 December 2016
Related amounts not set
off in the balance sheet
Gross amounts of recognised financial
liabilities€ million
Gross amounts of recognised financial assets set off in the
balance sheet€ million
Net amounts of financial liabilities presented in the
balance sheet€ million
Financialinstruments
€ millionNet amount
€ million
Derivative financial liabilities 15.5 – 15.5 (8.3) 7.2Trade payables 589.8 (53.1) 536.7 – 536.7Total 605.3 (53.1) 552.2 (8.3) 543.9
22. Business combinations
Accounting policyThe acquisition method of accounting is used to account for business combinations. The consideration transferred is the fair value of any asset transferred, shares issued and liabilities assumed. The consideration transferred includes the fair value of any asset or liability resulting from a contingent consideration arrangement. Identifiable assets acquired and liabilities and contingent liabilities assumed are measured initially at their fair values at the acquisition date. The excess of the consideration transferred and the fair value of non-controlling interest over the net assets acquired and liabilities assumed is recorded as goodwill. All acquisition-related costs are expensed as incurred.
For each business combination, the Group elects whether it measures the non-controlling interest in the acquiree either at fair value or at the proportionate share of the acquiree’s identifiable net assets.
Acquisition of controlling interestOn 1 April 2016, the Group acquired 100% of Neptūno Vandenys, UAB, the leading bottled water company in Lithuania, for a consideration of €19.5m, including the assumption of debt of €1.0m. The acquisition includes the mineral water brand ‘Neptūnas’ and is expected to increase the Group’s market share in the still drinks category in Lithuania. Details of the acquisition are as follows:
Acquiree’s carrying amount before
acquisition€ million
Fair value adjustments
€ millionFair value
€ million
Trademark – 7.8 7.8Water rights – 8.8 8.8Property, plant and equipment 2.4 0.4 2.8Inventories 0.1 – 0.1Other current assets 1.1 – 1.1Short-term borrowings (1.0) – (1.0)Other current liabilities (0.7) – (0.7)Deferred tax liabilities – (2.6) (2.6)Net identifiable assets acquired 1.9 14.4 16.3Goodwill arising on acquisition 3.2Cash paid to former shareholders 19.5
The acquisition resulted in the Group recording €3.2m of goodwill, €7.8m of trademark and €8.8m of water rights in its Developing markets segment. The goodwill arising from the acquisition of Neptūno Vandenys, UAB is attributed to expected future cash flows (including the effect of synergies) in excess of the value of net identifiable assets.
The acquired business contributed net sales revenue of €3.8m and net profit of €1.4m to the Group for the period from 1 April 2016 to 31 December 2016. If the acquisition had occurred on 1 January 2016, consolidated Group revenue and consolidated Group profit after tax for year ended 31 December 2016 would have been higher by €1.0m and €0.5m respectively.
172 Coca-Cola HBC 2017 Integrated Annual Report
NOTES TO THE CONSOLIDATED FINANCIAL STATEMENTS CONTINUED

In December 2016, TCCC acquired 50% of the share capital of Neptūno Vandenys, UAB for a total consideration of €10.3m, of which €9.8m was received in 2016 and the remaining in 2017 and is included in line ‘Net receipts from equity investments’ in the consolidated cash flow statement. This transaction resulted in a joint venture between the Group and TCCC. The gain on the transaction was immaterial.
During 2017, following the successful completion of the reorganisation of Neptūno Vandenys, UAB joint venture with TCCC, the Group obtained control over net assets of the joint venture amounting to €3.5m, with a corresponding decrease in the carrying amount of the investment in the joint venture (refer to Note 15a).
23. Financial risk management and financial instruments
Accounting policies
Derivative financial instruments
The Group uses derivative financial instruments, including currency, commodity and interest rate derivatives, to manage currency, commodity price and interest rate risk associated with the Group’s underlying business activities. The Group does not enter into derivative financial instruments for trading activity purposes.
All derivative financial instruments are initially recognised on the balance sheet at fair value and are subsequently remeasured at their fair value. Changes in the fair value of derivative financial instruments are recognised at each reporting date either in the income statement or in equity, depending on whether the derivative financial instrument qualifies for hedge accounting, and if so, whether it qualifies as a fair value hedge or a cash flow hedge.
Derivatives embedded in host contracts are accounted for as separate derivatives and recorded at fair value if:
a) their economic characteristics and risks are not closely related to those of the host contracts;
b) the host contracts are not designated as at fair value through profit or loss, and
c) a separate instrument with the same terms as the embedded derivative meets the definition of a derivative.
These embedded derivatives are measured at fair value with changes in fair value recognised in profit or loss. Reassessment only occurs if there is either a change in the terms of the contract that significantly modifies the cash flows that would otherwise be required or a reclassification of a financial asset out of the fair value through profit or loss.
All derivative financial instruments that are not part of an effective hedging relationship (undesignated hedges) are classified as assets or liabilities at fair value through profit or loss (‘FVTPL’).
At the inception of a hedge transaction the Group documents the relationship between the hedging instrument and the hedged item, as well as its risk management objective and strategy for undertaking the hedge transaction. This process includes linking the derivative financial instrument designated as a hedging instrument to the specific asset, liability, firm commitment or forecast transaction. Both at the hedge inception and on an ongoing basis, the Group assesses and documents whether the derivative financial instrument used in the hedging transaction is highly effective in offsetting changes in fair value or cash flow of the hedged item.
Changes in the fair values of derivative financial instruments that are designated and qualify as fair value hedges and are effective, are recorded in the income statement, together with the changes in the fair values of the hedged items that relate to the hedged risks. Changes in the fair value of derivative financial instruments that are designated and effective as hedges of future cash flows are recognised directly in other comprehensive income and the ineffective portion is recognised immediately in the income statement. Amounts accumulated in equity are recycled to the income statement as the related asset acquired or liability assumed affects the income statement. Changes in the fair values of derivative financial instruments that do not qualify for hedge accounting are recognised in the income statement as they arise.
Hedge accounting is discontinued when the hedging instrument expires or is sold, terminated, exercised, or no longer qualifies for hedge accounting. At that time, any cumulative gain or loss on the hedging instrument recognised in equity is retained in equity until the forecast transaction occurs. If a hedged transaction is no longer expected to occur, the net cumulative gain or loss recognised in equity is transferred to the income statement.
Regular purchases and sales of investments are recognised on the trade date, which is the day the Group commits to purchase or sell. The investments are recognised initially at fair value plus transaction costs, except in the case of FVTPL. For investments traded in active markets, fair value is determined by reference to stock exchange quoted bid prices. For other investments, fair value is estimated by reference to the current market value of similar instruments or by reference to the discounted cash flows of the underlying net assets.
173Coca-Cola HBC 2017 Integrated Annual Report
Strategic R
eport
Co
rporate G
overnance
Financial Statem
entsS
wiss S
tatutory R
eporting
Supplem
entary Inform
ation
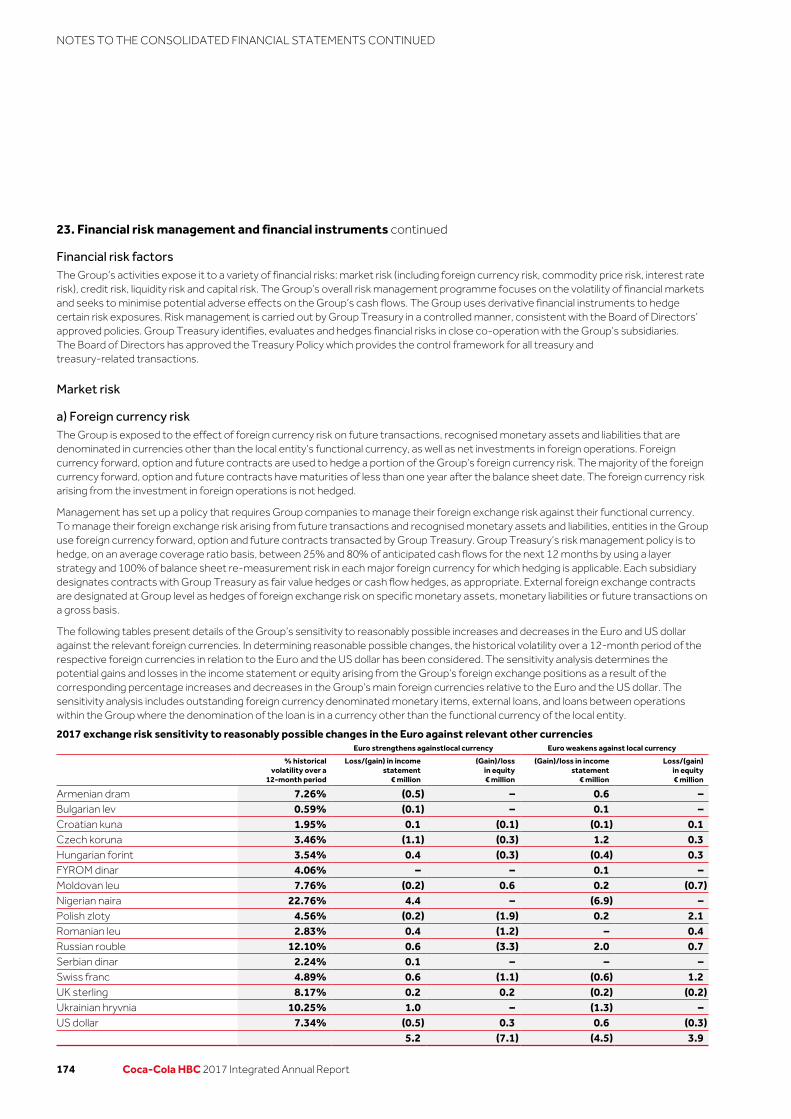
23. Financial risk management and financial instruments continued
Financial risk factorsThe Group’s activities expose it to a variety of financial risks: market risk (including foreign currency risk, commodity price risk, interest rate risk), credit risk, liquidity risk and capital risk. The Group’s overall risk management programme focuses on the volatility of financial markets and seeks to minimise potential adverse effects on the Group’s cash flows. The Group uses derivative financial instruments to hedge certain risk exposures. Risk management is carried out by Group Treasury in a controlled manner, consistent with the Board of Directors’ approved policies. Group Treasury identifies, evaluates and hedges financial risks in close co-operation with the Group’s subsidiaries. The Board of Directors has approved the Treasury Policy which provides the control framework for all treasury and treasury-related transactions.
Market risk
a) Foreign currency riskThe Group is exposed to the effect of foreign currency risk on future transactions, recognised monetary assets and liabilities that are denominated in currencies other than the local entity’s functional currency, as well as net investments in foreign operations. Foreign currency forward, option and future contracts are used to hedge a portion of the Group’s foreign currency risk. The majority of the foreign currency forward, option and future contracts have maturities of less than one year after the balance sheet date. The foreign currency risk arising from the investment in foreign operations is not hedged.
Management has set up a policy that requires Group companies to manage their foreign exchange risk against their functional currency. To manage their foreign exchange risk arising from future transactions and recognised monetary assets and liabilities, entities in the Group use foreign currency forward, option and future contracts transacted by Group Treasury. Group Treasury’s risk management policy is to hedge, on an average coverage ratio basis, between 25% and 80% of anticipated cash flows for the next 12 months by using a layer strategy and 100% of balance sheet re-measurement risk in each major foreign currency for which hedging is applicable. Each subsidiary designates contracts with Group Treasury as fair value hedges or cash flow hedges, as appropriate. External foreign exchange contracts are designated at Group level as hedges of foreign exchange risk on specific monetary assets, monetary liabilities or future transactions on a gross basis.
The following tables present details of the Group’s sensitivity to reasonably possible increases and decreases in the Euro and US dollar against the relevant foreign currencies. In determining reasonable possible changes, the historical volatility over a 12-month period of the respective foreign currencies in relation to the Euro and the US dollar has been considered. The sensitivity analysis determines the potential gains and losses in the income statement or equity arising from the Group’s foreign exchange positions as a result of the corresponding percentage increases and decreases in the Group’s main foreign currencies relative to the Euro and the US dollar. The sensitivity analysis includes outstanding foreign currency denominated monetary items, external loans, and loans between operations within the Group where the denomination of the loan is in a currency other than the functional currency of the local entity.
2017 exchange risk sensitivity to reasonably possible changes in the Euro against relevant other currencies Euro strengthens againstlocal currency Euro weakens against local currency
% historicalvolatility over a
12-month period
Loss/(gain) in income statement
€ million
(Gain)/lossin equity€ million
(Gain)/loss in incomestatement
€ million
Loss/(gain)in equity€ million
Armenian dram 7.26% (0.5) – 0.6 –Bulgarian lev 0.59% (0.1) – 0.1 –Croatian kuna 1.95% 0.1 (0.1) (0.1) 0.1Czech koruna 3.46% (1.1) (0.3) 1.2 0.3Hungarian forint 3.54% 0.4 (0.3) (0.4) 0.3FYROM dinar 4.06% – – 0.1 –Moldovan leu 7.76% (0.2) 0.6 0.2 (0.7)Nigerian naira 22.76% 4.4 – (6.9) –Polish zloty 4.56% (0.2) (1.9) 0.2 2.1Romanian leu 2.83% 0.4 (1.2) – 0.4Russian rouble 12.10% 0.6 (3.3) 2.0 0.7Serbian dinar 2.24% 0.1 – – –Swiss franc 4.89% 0.6 (1.1) (0.6) 1.2UK sterling 8.17% 0.2 0.2 (0.2) (0.2)Ukrainian hryvnia 10.25% 1.0 – (1.3) –US dollar 7.34% (0.5) 0.3 0.6 (0.3) 5.2 (7.1) (4.5) 3.9
174 Coca-Cola HBC 2017 Integrated Annual Report
NOTES TO THE CONSOLIDATED FINANCIAL STATEMENTS CONTINUED
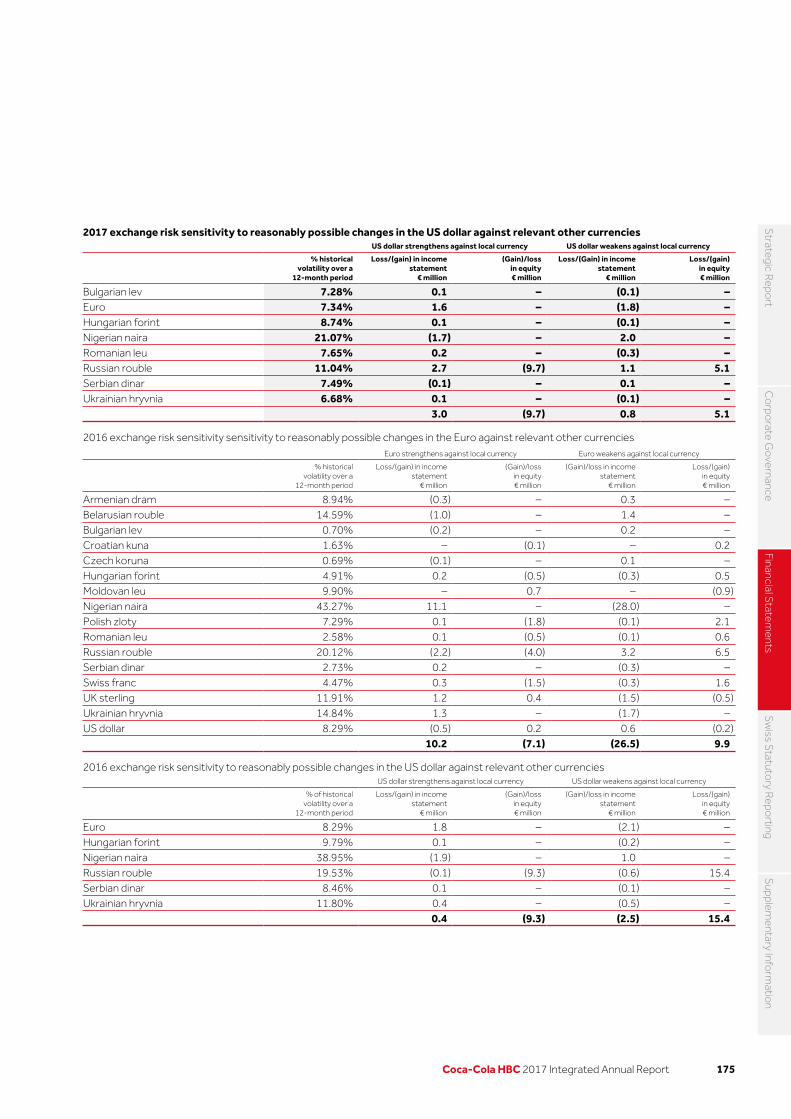
2017 exchange risk sensitivity to reasonably possible changes in the US dollar against relevant other currencies US dollar strengthens against local currency US dollar weakens against local currency
% historicalvolatility over a
12-month period
Loss/(gain) in incomestatement
€ million
(Gain)/lossin equity€ million
Loss/(Gain) in incomestatement
€ million
Loss/(gain)in equity€ million
Bulgarian lev 7.28% 0.1 – (0.1) –Euro 7.34% 1.6 – (1.8) –Hungarian forint 8.74% 0.1 – (0.1) –Nigerian naira 21.07% (1.7) – 2.0 –Romanian leu 7.65% 0.2 – (0.3) –Russian rouble 11.04% 2.7 (9.7) 1.1 5.1Serbian dinar 7.49% (0.1) – 0.1 –Ukrainian hryvnia 6.68% 0.1 – (0.1) – 3.0 (9.7) 0.8 5.1
2016 exchange risk sensitivity sensitivity to reasonably possible changes in the Euro against relevant other currencies Euro strengthens against local currency Euro weakens against local currency
% historicalvolatility over a
12-month period
Loss/(gain) in incomestatement
€ million
(Gain)/lossin equity€ million
(Gain)/loss in incomestatement
€ million
Loss/(gain)in equity€ million
Armenian dram 8.94% (0.3) – 0.3 –Belarusian rouble 14.59% (1.0) – 1.4 –Bulgarian lev 0.70% (0.2) – 0.2 –Croatian kuna 1.63% – (0.1) – 0.2Czech koruna 0.69% (0.1) – 0.1 –Hungarian forint 4.91% 0.2 (0.5) (0.3) 0.5Moldovan leu 9.90% – 0.7 – (0.9)Nigerian naira 43.27% 11.1 – (28.0) –Polish zloty 7.29% 0.1 (1.8) (0.1) 2.1Romanian leu 2.58% 0.1 (0.5) (0.1) 0.6Russian rouble 20.12% (2.2) (4.0) 3.2 6.5Serbian dinar 2.73% 0.2 – (0.3) –Swiss franc 4.47% 0.3 (1.5) (0.3) 1.6UK sterling 11.91% 1.2 0.4 (1.5) (0.5)Ukrainian hryvnia 14.84% 1.3 – (1.7) –US dollar 8.29% (0.5) 0.2 0.6 (0.2) 10.2 (7.1) (26.5) 9.9
2016 exchange risk sensitivity to reasonably possible changes in the US dollar against relevant other currencies US dollar strengthens against local currency US dollar weakens against local currency
% of historicalvolatility over a
12-month period
Loss/(gain) in incomestatement
€ million
(Gain)/lossin equity€ million
(Gain)/loss in incomestatement
€ million
Loss/(gain)in equity€ million
Euro 8.29% 1.8 – (2.1) –Hungarian forint 9.79% 0.1 – (0.2) –Nigerian naira 38.95% (1.9) – 1.0 –Russian rouble 19.53% (0.1) (9.3) (0.6) 15.4Serbian dinar 8.46% 0.1 – (0.1) –Ukrainian hryvnia 11.80% 0.4 – (0.5) – 0.4 (9.3) (2.5) 15.4
175Coca-Cola HBC 2017 Integrated Annual Report
Strategic R
eport
Co
rporate G
overnance
Financial Statem
entsS
wiss S
tatutory R
eporting
Supplem
entary Inform
ation

23. Financial risk management and financial instruments continued
b) Commodity price riskThe Group is affected by the volatility of certain commodity prices (being mainly sugar, aluminium, aluminium premium, PET and gas oil) in relation to certain raw materials necessary for the production of the Group’s products.
Due to the significantly increased volatility of commodity prices, the Group’s Board of Directors has developed and enacted a risk management strategy regarding commodity price risk and its mitigation. Although the Group continues to contract prices with suppliers in advance, to reduce its exposure to the effect of short-term changes in the price of sugar, aluminium, aluminium premium, gas oil and PET the Group hedges the market price of sugar, aluminium, aluminium premium and gas oil using commodity swap contracts based on a rolling 36-month forecast. The Group Treasury’s Risk management policy is to hedge a minimum of 25% and a maximum of 80% of commodity exposure for the next 12 months except for PET where no minimum coverage is required and the maximum is at 50% for the first year.
The following table presents details of the Group’s income statement and equity sensitivity to increases and decreases in sugar, aluminium, aluminium premium and gas oil prices. The table does not show the sensitivity to the Group’s total underlying commodity exposure or the impact of changes in volumes that may arise from increase or decrease in the respective commodity prices. The sensitivity analysis determines the potential effect on profit or loss and equity arising from the Group’s commodity swap contract positions as a result of the reasonably possible increases or decreases of the respective commodity price.
2017 commodity price risk sensitivity to reasonably possible changes in the commodity price of relevant commodities
Commodity price increases withall other variables held constant
Commodity price decreases withall other variables held constant
% historicalvolatility over a
12-month period per contract maturity
(Gain)/lossin income
statement€ million
(Gain)/lossin equity€ million
Loss/(gain)in income
statement€ million
Loss/(gain)in equity€ million
Sugar 19.3% (8.8) – 8.8 –Aluminium 15.4% (5.2) (1.1) 5.2 1.1Aluminium Premium 18.0% (0.3) – 0.3 –Gas oil 22.7% (2.2) – 2.2 – (16.5) (1.1) 16.5 1.1
2016 commodity price risk sensitivity to reasonably possible changes in the commodity price of relevant commodities
Commodity price increases withall other variables held constant
Commodity price decreases withall other variables held constant
% historicalvolatility over a
12-month period per contract maturity
(Gain)/lossin income
statement€ million
(Gain)/lossin equity€ million
Loss/(gain)in income
statement€ million
Loss/(gain)in equity€ million
Sugar 19.2% (12.4) – 12.4 –Aluminium 16.4% (6.7) (1.1) 6.7 1.1Aluminium Premium 19.2% (0.4) – 0.4 –Gas oil 41.0% (6.5) – 6.5 – (26.0) (1.1) 26.0 1.1
c) Interest rate riskThe sensitivity analysis in the following table has been determined based on exposure to interest rates of both derivative and non-derivative instruments existing at the balance sheet date and assuming constant foreign exchange rates. For floating rate liabilities, the analysis is prepared assuming the amount of liability outstanding at the balance sheet date was outstanding for the whole year. A 50 basis point increase or decrease for 2017 (2016:50 basis point) represents management’s assessment of a reasonably possible change in interest rates.
Interest rate risk sensitivity to reasonably possible changes in interest rates
2017
€ million2016
€ million
Loss/(gain)in income
statement(Gain)/loss
In equity
Loss/(gain)in income
statement(Gain)/loss
In equity
Increase in basis points 0.1 – – –Decrease in basis points (0.1) – – –
176 Coca-Cola HBC 2017 Integrated Annual Report
NOTES TO THE CONSOLIDATED FINANCIAL STATEMENTS CONTINUED

Credit riskCredit risk is the risk of financial loss to the Group if a customer or counterparty to a financial instrument fails to meet its obligations under the contract or arrangement. The Group has limited concentration of credit risk across trade and financial counterparties. Credit policies are in place and the exposure to credit risk is monitored on an ongoing basis.
The Group’s maximum exposure to credit risk in the event that counterparties fail to perform their obligations at 31 December 2017 in relation to each class of recognised financial asset is the carrying amount of those assets as indicated on the balance sheet.
Under the credit policies, before accepting any new credit customers, the Group investigates the potential customer’s credit quality, using either external agencies and in some cases bank references and/or historic experience, and defines credit limits for each customer. Customers that fail to meet the Group’s benchmark credit quality may transact with the Group only on a prepayment or cash basis. Customers are reviewed on an ongoing basis and credit limits are adjusted accordingly. There is no significant concentration of credit risk with regards to loans, trade and other receivables as the Group has a large number of customers which are internationally dispersed.
The Group has policies that limit the amount of credit exposure to any single financial institution. The Group only undertakes investment and derivative transactions with banks and financial institutions that have a minimum credit rating of ‘BBB-’ from Standard & Poor’s and ‘Baa3’ from Moody’s. The Group also uses Credit Default Swaps of a counterparty in order to measure in a timelier way the creditworthiness of a counterparty and set up its counterparties in tiers in order to assign maximum exposure and tenor per tier. If the Credit Default Swaps of certain counterparty exceed 400 basis points the Group will stop trading derivatives with that counterparty and will try to cancel any deposits on a best-effort basis. In addition, the Group regularly makes use of time deposits to invest excess cash balances and to diversify its counterparty risk. As at 31 December 2017, an amount of €476.8m (2016: € 243.5m) is invested in time deposits (refer to Note 24).
Liquidity risk The Group actively manages liquidity risk to ensure there are sufficient funds available for any short-term and long-term commitments. Bank overdrafts and bank facilities, both committed and uncommitted, are used to manage this risk.
The Group manages liquidity risk by maintaining adequate cash reserves and committed banking facilities, access to the debt and equity capital markets, and by continuously monitoring forecasted and actual cash flows. In Note 24, the undrawn facilities that the Group has at its disposal to manage liquidity risk are discussed under the headings ‘commercial paper programme’ and ‘committed credit facilities’.
The following tables detail the Group’s remaining contractual maturities for its financial liabilities. The tables include both interest and principal undiscounted cash flows, assuming that interest rates remain constant from 31 December 2017.
Up toone year€ million
One totwo years
€ million
Two tofive years
€ million
Overfive years
€ million
Borrowings 203.3 41.6 887.7 668.6Derivative liabilities 4.5 0.9 – –Trade and other payables 1,458.8 0.2 1.0 5.3As at 31 December 2017 1,666.6 42.7 888.7 673.9
Up toone year€ million
One totwo years
€ million
Two tofive years
€ million
Overfive years
€ million
Borrowings 193.4 43.7 903.6 691.9Derivative liabilities 14.2 1.0 0.3 –Trade and other payables 1,488.2 1.3 0.2 6.7As at 31 December 2016 1,695.8 46.0 904.1 698.6
177Coca-Cola HBC 2017 Integrated Annual Report
Strategic R
eport
Co
rporate G
overnance
Financial Statem
entsS
wiss S
tatutory R
eporting
Supplem
entary Inform
ation

23. Financial risk management and financial instruments continued
Capital risk
The Group monitors its financial capacity and credit ratings by reference to a number of key financial ratios including net debt to comparable adjusted EBITDA, which provides a framework within which the Group's capital base is managed. This ratio is calculated as net debt divided by comparable adjusted EBITDA.
Adjusted EBITDA is calculated by adding back to operating profit the depreciation and impairment of property, plant and equipment, the amortisation and impairment of intangible assets, the employee share option and performance share costs and other non-cash items, if any. Comparable adjusted EBITDA refers to adjusted EBITDA excluding restructuring expenses and the unrealised gains or losses resulting from the mark-to-market valuation of derivatives and embedded derivatives related to commodity hedging.
Refer to Note 24 for definition of net debt.
The Group’s objectives when managing capital are to safeguard the Group’s ability to continue as a going concern and to maintain an optimal capital structure to reduce the cost of capital.
In order to maintain or adjust the capital structure, the Group may increase or decrease debt, issue or buy back shares, adjust the amount of dividends paid to shareholders, or return capital to shareholders.
The Group’s goal is to maintain a conservative financial profile. This is evidenced by the credit ratings maintained with Standard & Poor’s and Moody’s. In April 2017, Standard & Poor’s affirmed Coca-Cola HBC’s ‘BBB+’ long-term, ‘A2’ short-term corporate credit ratings and positive outlook. The corporate credit ratings by Moody’s remained unchanged, ‘Baa1’ long-term, ‘P2’ short-term and stable outlook after the latest assessment in October 2017.
The Group’s medium-to long-term target is to maintain the net debt to comparable adjusted EBITDA ratio within a 1.5 to 2.0 range.
The ratios as at 31 December were as follows:
2017
€ million2016
€ million
Net debt (refer to Note 24) 751.8 1,051.4Operating profit 589.8 506.3Depreciation and impairment of property, plant and equipment 316.8 332.4Amortisation of intangible assets 0.4 0.4Employee share options and performance shares 20.8 8.1Other non-cash items included in operating income (0.3) (1.3)Adjusted EBITDA 927.5 845.9Restructuring expenses 19.5 19.9Unrealised commodity derivatives 2.3 (26.5)Total comparable adjusted EBITDA 949.3 839.3Net debt / comparable adjusted EBITDA ratio 0.79 1.25
Hedging activity
a) Cash flow hedges
The fair values of derivative financial instruments as at 31 December designated as cash flow hedges were:
Contracts with positive fair values Contracts with negative fair values
2017
€ million2016
€ million2017
€ million2016
€ million
Foreign currency forward contracts 0.7 1.0 (1.6) (4.0)Foreign currency option contracts 2.3 0.3 – –Commodity swap contracts 0.6 0.4 – (0.1)Total contracts 3.6 1.7 (1.6) (4.1)
Cash flows from the Group’s foreign currency cash flow hedges at 31 December 2017 are expected to occur and, accordingly, affect profit or loss in 2018; cash flows from the Group’s commodity swap contracts, are expected to occur and affect profit or loss between 2018 and 2020.The net amount reclassified from other comprehensive income to the income statement for the year amounted to a €6.3m loss
178 Coca-Cola HBC 2017 Integrated Annual Report
NOTES TO THE CONSOLIDATED FINANCIAL STATEMENTS CONTINUED
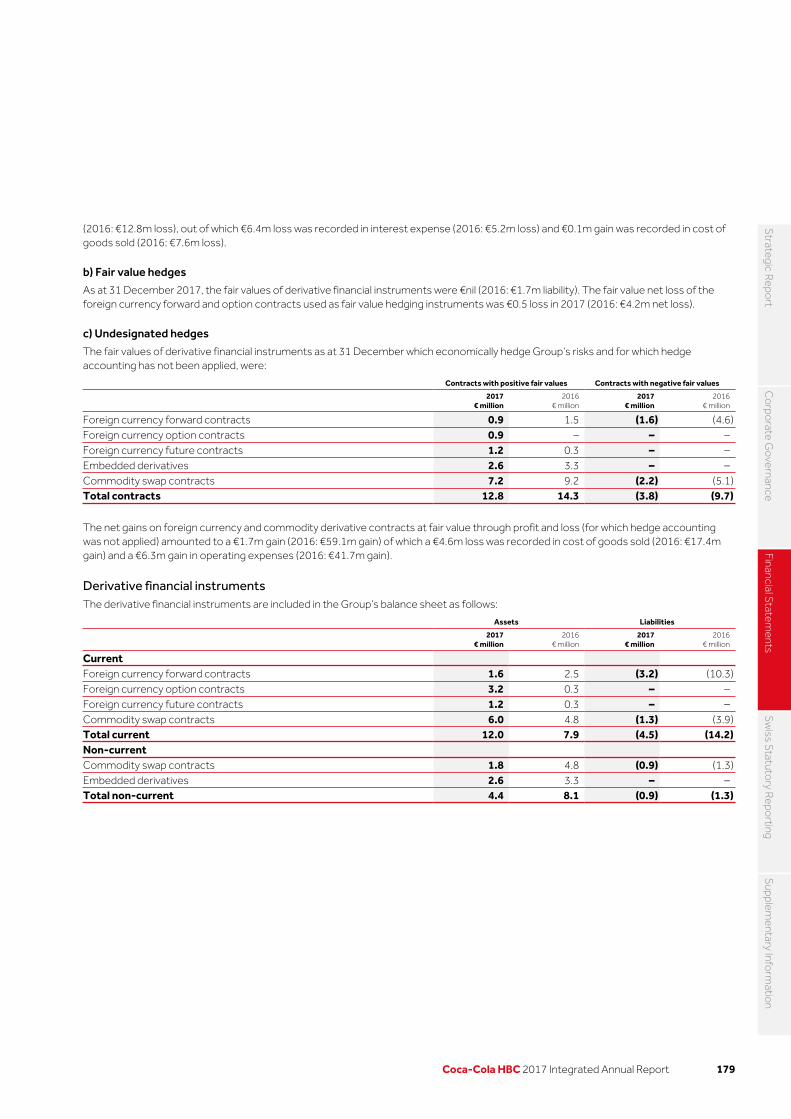
(2016: €12.8m loss), out of which €6.4m loss was recorded in interest expense (2016: €5.2m loss) and €0.1m gain was recorded in cost of goods sold (2016: €7.6m loss).
b) Fair value hedges
As at 31 December 2017, the fair values of derivative financial instruments were €nil (2016: €1.7m liability). The fair value net loss of the foreign currency forward and option contracts used as fair value hedging instruments was €0.5 loss in 2017 (2016: €4.2m net loss).
c) Undesignated hedges
The fair values of derivative financial instruments as at 31 December which economically hedge Group’s risks and for which hedge accounting has not been applied, were:
Contracts with positive fair values Contracts with negative fair values
2017
€ million2016
€ million2017
€ million2016
€ million
Foreign currency forward contracts 0.9 1.5 (1.6) (4.6)Foreign currency option contracts 0.9 – – –Foreign currency future contracts 1.2 0.3 – –Embedded derivatives 2.6 3.3 – –Commodity swap contracts 7.2 9.2 (2.2) (5.1)Total contracts 12.8 14.3 (3.8) (9.7)
The net gains on foreign currency and commodity derivative contracts at fair value through profit and loss (for which hedge accounting was not applied) amounted to a €1.7m gain (2016: €59.1m gain) of which a €4.6m loss was recorded in cost of goods sold (2016: €17.4m gain) and a €6.3m gain in operating expenses (2016: €41.7m gain).
Derivative financial instrumentsThe derivative financial instruments are included in the Group’s balance sheet as follows:
Assets Liabilities
2017
€ million2016
€ million2017
€ million2016
€ million
Current Foreign currency forward contracts 1.6 2.5 (3.2) (10.3)Foreign currency option contracts 3.2 0.3 – –Foreign currency future contracts 1.2 0.3 – –Commodity swap contracts 6.0 4.8 (1.3) (3.9)Total current 12.0 7.9 (4.5) (14.2)Non-current Commodity swap contracts 1.8 4.8 (0.9) (1.3)Embedded derivatives 2.6 3.3 – –Total non-current 4.4 8.1 (0.9) (1.3)
179Coca-Cola HBC 2017 Integrated Annual Report
Strategic R
eport
Co
rporate G
overnance
Financial Statem
entsS
wiss S
tatutory R
eporting
Supplem
entary Inform
ation

23. Financial risk management and financial instruments continued
Financial instruments categoriesCategories of financial instruments as at 31 December were as follows (in € million):
2017 Analysis of total assets
AssetsLoans and
receivablesAssets at
FVTPL
Derivatives designated as hedging
instrumentsHeld-to-maturity
Available-for-sale
Total current and
non-current Current Non-current
Investments – – – 151.8 3.7 155.5 150.9 4.6Derivative financial instruments – 12.8 3.6 – – 16.4 12.0 4.4Trade and other receivables excluding prepayments 896.6 – – – – 896.6 893.9 2.7Cash and cash equivalents 723.5 – – – – 723.5 723.5 –Total 1,620.1 12.8 3.6 151.8 3.7 1,792.0 1,780.3 11.7
Analysis of total liabilities
Liabilities
Liabilities held at
amortised cost
Liabilities at FVTPL
Derivatives designated as hedging
instruments
Total current and
non-current Current Non-current
Trade and other payables excluding provisions and deferred income 1,465.3 – – 1,465.3 1,458.6 6.7Borrowings 1,626.2 – – 1,626.2 166.4 1,459.8Derivative financial instruments – 3.8 1.6 5.4 4.5 0.9Total 3,091.5 3.8 1.6 3,096.9 1,629.5 1,467.4
2016 Analysis of total assets
AssetsLoans and
receivablesAssets at
FVTPL
Derivatives designated as hedging
instrumentsHeld-to-maturity
Available-for-sale
Total current and
non-current Current Non-current
Investments – – – 0.9 3.6 4.5 – 4.5Derivative financial instruments – 14.3 1.7 – – 16.0 7.9 8.1Trade and other receivables excluding prepayments 957.4 – – – – 957.4 954.8 2.6Cash and cash equivalents 573.2 – – – – 573.2 573.2 –Total 1,530.6 14.3 1.7 0.9 3.6 1,551.1 1,535.9 15.2
Analysis of total liabilities
Liabilities
Liabilities held at amortised
costLiabilities at FVTPL
Derivatives designated as hedging
instruments
Total current and
non-current Current Non-current
Trade and other payables excluding provisions and deferred income 1,496.4 – – 1,496.4 1,488.2 8.2Borrowings 1,624.6 – – 1,624.6 156.5 1,468.1Derivative financial instruments – 9.7 5.8 15.5 14.2 1.3Total 3,121.0 9.7 5.8 3,136.5 1,658.9 1,477.6
Foreign currency derivatives
The net notional principal amounts of the outstanding foreign currency forward contracts at 31 December 2017 totalled €190.5m (2016: €289.9m). The net notional principal amounts of the outstanding foreign currency option contracts at 31 December 2017 totalled €91.2m (2016: €13.8m). The net notional principal amounts of the outstanding foreign currency future contracts at 31 December 2017 totalled €5.6m (2016: €7.6m).
180 Coca-Cola HBC 2017 Integrated Annual Report
NOTES TO THE CONSOLIDATED FINANCIAL STATEMENTS CONTINUED

Commodity swap contracts
The notional principal amounts of the outstanding commodity swap contracts at 31 December 2017 totalled €92.6m (2016: €125.2m).
Forward starting swap contracts
The Group entered into forward starting swap contracts of €500.0m in 2014 to hedge the interest rate risk related to its Euro denominated forecasted issuance of fixed rate debt in March 2016. In August 2015 the Group entered into additional forward starting swap contracts of €100.0m. In March 2016 the forward starting swap contracts were settled and at the same time the new note was issued, the accumulated loss of €55.4m recorded in other comprehensive income is being amortised to the income statement over the term of the new note (refer to Note 24).
Embedded derivatives
During 2015 the Group recognised embedded derivatives whose risks and economic characteristics were not considered to be closely related to the commodity contract in which they were embedded. The fair value of the embedded derivatives as at 31 December 2017 amounted to a financial asset of €2.6m (2016: €3.3m).
Fair values of financial assets and liabilitiesFor financial instruments such as cash, deposits, debtors and creditors, investments, loans payable to related parties, short-term borrowings (excluding the current portion of bonds and notes payable) and other financial liabilities (other than bonds and notes payable), carrying values are a reasonable approximation of their fair values. According to the fair value hierarchy, the financial instruments measured at fair value are classified as follows:
Level 1The fair value of available-for-sale listed equity securities is based on quoted market prices at the reported date. The fair value of bonds is based on quoted market prices at the recorded date.
Level 2The fair value of foreign currency forward, option and future contracts, commodity swap contracts, bonds and notes payable, interest rate swap contracts, forward starting swap contracts, embedded foreign currency derivatives and cross currency swap contracts is determined by using valuation techniques. These valuation techniques maximise the use of observable market data. The fair value of the foreign currency forward, option and future contracts, commodity swap contracts, embedded foreign currency derivatives and cross currency swap contracts is calculated by reference to quoted forward exchange, deposit rates and forward rate curve of the underlying commodity at the reported date for contracts with similar maturity dates. The fair value of interest rate option contracts is calculated by reference to the Black-Scholes valuation model and implied volatilities. The fair value of interest rate swap contracts is determined as the difference in the present value of the future interest cash inflows and outflows based on observable yield curves.
Level 3The fair value of available-for-sale unlisted investments is determined through the use of estimated discounted cash flows.
181Coca-Cola HBC 2017 Integrated Annual Report
Strategic R
eport
Co
rporate G
overnance
Financial Statem
entsS
wiss S
tatutory R
eporting
Supplem
entary Inform
ation

23. Financial risk management and financial instruments continuedThe following table provides the fair value hierarchy in which fair value measurements are categorised for assets and liabilities measured at fair value as at 31 December 2017:
Level 1
€ millionLevel 2
€ millionLevel 3
€ millionTotal
€ million
Financial assets at FVTPL Foreign currency forward contracts – 0.9 – 0.9Foreign currency option contracts – 0.9 – 0.9Embedded derivatives – 2.6 – 2.6Foreign currency futures contracts – 1.2 – 1.2Commodity swap contracts – 7.2 – 7.2
Derivative financial assets used for hedging Cash flow hedges
Foreign currency forward contracts – 0.7 – 0.7Foreign currency option contracts – 2.3 – 2.3Commodity swap contracts – 0.6 – 0.6
Available-for-sale financial assets Equity securities 1.0 – 2.7 3.7
Total financial assets 1.0 16.4 2.7 20.1Financial liabilities at FVTPL
Foreign currency forward contracts – (1.6) – (1.6)Commodity swap contracts – (2.2) – (2.2)
Derivative financial liabilities used for hedging Cash flow hedges
Foreign currency forward contracts – (1.6) – (1.6)Total financial liabilities – (5.4) – (5.4)
There were no transfers between Level 1, Level 2 and Level 3 in the period.
182 Coca-Cola HBC 2017 Integrated Annual Report
NOTES TO THE CONSOLIDATED FINANCIAL STATEMENTS CONTINUED

The following table provides the fair value hierarchy in which fair value measurements are categorised for assets and liabilities measured at fair value as at 31 December 2016:
Level 1
€ millionLevel 2
€ millionLevel 3
€ millionTotal
€ million
Financial assets at FVTPL Foreign currency forward contracts – 1.5 – 1.5Embedded derivatives – 3.3 – 3.3Foreign currency future contracts – 0.3 – 0.3Commodity swap contracts – 9.2 – 9.2
Derivative financial assets used for hedging Cash flow hedges
Foreign currency forward contracts – 1.0 – 1.0Foreign currency option contracts – 0.3 – 0.3Commodity swap contracts – 0.4 – 0.4
Available-for-sale financial assets Equity securities 0.9 – 2.7 3.6
Total financial assets 0.9 16.0 2.7 19.6Financial liabilities at FVTPL
Foreign currency forward contracts – (4.6) – (4.6)Commodity swap contracts – (5.1) – (5.1)
Derivative financial liabilities used for hedging Fair value hedges
Foreign currency forward contracts – (1.7) – (1.7)Cash flow hedges
Foreign currency forward contracts – (4.0) – (4.0)Commodity swap contracts – (0.1) – (0.1)
Total financial liabilities – (15.5) – (15.5)
During 2016 the Group acquired an equity investment of €2.2m classified within Level 3. There were no transfers between Level 1, Level 2 and Level 3 in the period.
183Coca-Cola HBC 2017 Integrated Annual Report
Strategic R
eport
Co
rporate G
overnance
Financial Statem
entsS
wiss S
tatutory R
eporting
Supplem
entary Inform
ation
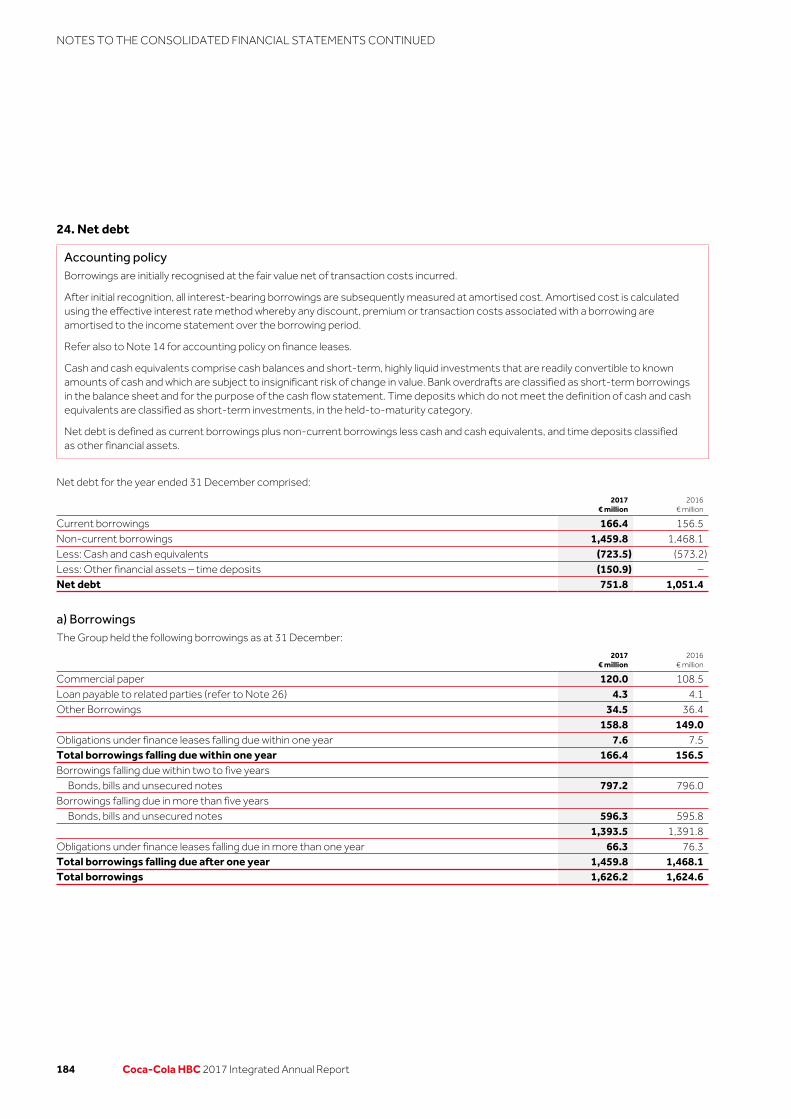
24. Net debt
Accounting policyBorrowings are initially recognised at the fair value net of transaction costs incurred.
After initial recognition, all interest-bearing borrowings are subsequently measured at amortised cost. Amortised cost is calculated using the effective interest rate method whereby any discount, premium or transaction costs associated with a borrowing are amortised to the income statement over the borrowing period.
Refer also to Note 14 for accounting policy on finance leases.
Cash and cash equivalents comprise cash balances and short-term, highly liquid investments that are readily convertible to known amounts of cash and which are subject to insignificant risk of change in value. Bank overdrafts are classified as short-term borrowings in the balance sheet and for the purpose of the cash flow statement. Time deposits which do not meet the definition of cash and cash equivalents are classified as short-term investments, in the held-to-maturity category.
Net debt is defined as current borrowings plus non-current borrowings less cash and cash equivalents, and time deposits classified as other financial assets.
Net debt for the year ended 31 December comprised:
2017
€ million2016
€ million
Current borrowings 166.4 156.5Non-current borrowings 1,459.8 1,468.1Less: Cash and cash equivalents (723.5) (573.2)Less: Other financial assets – time deposits (150.9) –Net debt 751.8 1,051.4
a) BorrowingsThe Group held the following borrowings as at 31 December:
2017
€ million2016
€ million
Commercial paper 120.0 108.5Loan payable to related parties (refer to Note 26) 4.3 4.1Other Borrowings 34.5 36.4 158.8 149.0Obligations under finance leases falling due within one year 7.6 7.5Total borrowings falling due within one year 166.4 156.5Borrowings falling due within two to five years
Bonds, bills and unsecured notes 797.2 796.0Borrowings falling due in more than five years
Bonds, bills and unsecured notes 596.3 595.8 1,393.5 1,391.8Obligations under finance leases falling due in more than one year 66.3 76.3Total borrowings falling due after one year 1,459.8 1,468.1Total borrowings 1,626.2 1,624.6
184 Coca-Cola HBC 2017 Integrated Annual Report
NOTES TO THE CONSOLIDATED FINANCIAL STATEMENTS CONTINUED

Reconciliation of liabilities to cash flows arising from financing activities:
Borrowings Finance leases
due within
one yeardue in more
than one yeardue within
one yeardue in more
than one year
Derivative assets/
(liabilities) Total
Balance at 1 January 2017 149.0 1,391.8 7.5 76.3 – 1,624.6Cash flows Proceeds from borrowings 82.2 – – – – 82.2Repayments of borrowings (83.8) – – – – (83.8)Principal repayments of finance lease obligations – – (7.2) – – (7.2)Interest paid (30.7) – (6.2) – – (36.9)Payments for settlement of derivatives – – – – (3.1) (3.1)Total cash flows (32.3) – (13.4) – (3.1) (48.8)Finance leases increase – – 0.1 0.8 – 0.9Effect of changes in exchange rates (0.4) – (0.2) (3.5) – (4.1)Other non-cash movements 42.5 1.7 13.6 (7.3) 3.1 53.6Balance at 31 December 2017 158.8 1,393.5 7.6 66.3 – 1,626.2
Other non-cash movements include the impact from interest expense and remeasurement of derivatives.
Commercial paper programme
In October 2013 the Group established a €1.0bn Euro-commercial paper programme (‘CP programme’) which was updated in September 2014 and then in May 2017, to further diversify its short-term funding sources. The Euro-commercial paper notes may be issued either as non-interest-bearing notes sold at a discount or as interest-bearing notes at a fixed or floating rate. All commercial paper issued under the CP programme must be repaid within 7 to 364 days. The CP programme has been granted the Short Term Euro Paper label (‘STEP’) and commercial paper is issued through Coca-Cola HBC’s 100%-owned subsidiary Coca-Cola HBC Finance B.V. and is fully, unconditionally and irrevocably guaranteed by Coca-Cola HBC AG. The outstanding amount under the CP programme as at 31 December 2017 was €120.0m (2016: €108.5m).
Committed credit facilities
In June 2015, the Group replaced its then existing €500.0m syndicated revolving credit facility with a new €500.0m syndicated loan facility, provided by various financial institutions, expiring on 24 June 2020, with the option to be extended for one more year. In June 2016, the Company exercised its option and the banks agreed to extend the facility for one more year until 24 June 2021. This facility can be used for general corporate purposes and carries a floating interest rate over EURIBOR and LIBOR. No amounts have been drawn under the syndicated loan facility since inception. The borrower in the syndicated loan facility is Coca-Cola HBC’s 100%-owned subsidiary Coca-Cola HBC Finance B.V. and it is fully, unconditionally and irrevocably guaranteed by Coca-Cola HBC AG and Coca-Cola HBC Holdings B.V. and not subject to any financial covenants.
Euro medium-term note programme
In June 2013, the Group established a new €3.0bn Euro medium-term note programme (the ‘EMTN programme’). The EMTN programme was updated in September 2014 and again in September 2015. Notes are issued under the EMTN programme through Coca-Cola HBC’s 100%-owned subsidiary Coca-Cola HBC Finance B.V. and are fully, unconditionally and irrevocably guaranteed by Coca-Cola HBC AG.
In June 2013, Coca Cola HBC Finance B.V. completed the issue of €800 million, 2.375%, seven-year fixed rate, Euro-denominated notes. The net proceeds of the new issue were used to repay the US$500m notes due in September 2013 and partially repay €183.0m of the 7.875% five-year fixed rate notes due in January 2014.
In March 2016, Coca-Cola HBC Finance B.V. completed the issue of a €600 million Euro-denominated fixed rate bond maturing in November 2024. The coupon rate of the new bond is 1.875% which, including the amortisation of the loss on the forward starting swap contracts over the term of the fixed rate bond, results in an effective interest rate of 2.99% (refer to Note 23). The net proceeds of the new issue were used to partially repay €214.6 million of the 4.25% seven-year fixed rate notes due in November 2016, the remaining €385.4m was repaid in November 2016 upon its maturity.
As at 31 December 2017, a total of €1.4bn in notes issued under the EMTN programme were outstanding.
The EMTN Programme has not been updated since September 2015 so further issues under the EMTN Programme are currently not possible pending a further update.
185Coca-Cola HBC 2017 Integrated Annual Report
Strategic R
eport
Co
rporate G
overnance
Financial Statem
entsS
wiss S
tatutory R
eporting
Supplem
entary Inform
ation

24. Net debt continued
Summary of notes outstanding as at 31 December Book value Fair value
Notes Start date Maturity date Fixed coupon2017
€ million2016
€ million2017
€ million2016
€ million
€800m 18 June 2013 18 June 2020 2.375% 797.2 796.0 841.5 855.9€600m 10 March 2016 11 November 2024 1.875% 596.3 595.8 643.6 634.8Total 1,393.5 1,391.8 1,485.1 1,490.7
The fair values are within Level 1 of the fair value hierarchy.
Obligations under finance leases
Future minimum lease payments under finance leases together with the present value of the net minimum lease payments as at 31 December, were as follows:
2017
€ million2016
€ million
Minimum
paymentsPresent value
of paymentsMinimum
paymentsPresent value
of payments
Less than one year 14.3 7.6 13.7 7.5Later than one year but less than two years 11.3 6.5 13.5 7.7Later than two years but less than three years 12.6 6.8 11.9 6.7Later than three years but less than four years 12.5 7.3 11.9 7.1Later than four years but less than five years 12.6 7.8 11.9 7.5Later than five years 49.9 37.9 62.6 47.3Total minimum lease payments 113.2 73.9 125.5 83.8Future finance charges on finance leases (39.3) – (41.7) –Present value of minimum lease payments 73.9 73.9 83.8 83.8
Total borrowings at 31 December were held in the following currencies:
Current Non-current
2017
€ million2016
€ million2017
€ million2016
€ million
Euro 152.0 122.8 1,414.1 1,416.1US dollar 11.0 4.5 24.1 28.4UK sterling 1.3 1.3 9.2 10.9Polish zloty 1.0 0.9 12.4 12.7Croatian kuna 0.3 15.3 – –Russian rouble – 11.6 – –Other 0.8 0.1 – –Total borrowings 166.4 156.5 1,459.8 1,468.1
The carrying amounts of interest bearing borrowings held at fixed and floating interest rate as at 31 December 2017, as well as the weighted average interest rates and maturities of fixed rate borrowings, were as follows:
Fixedinterest rate
€ million
Floatinginterest rate
€ millionTotal
€ million
Euro 1,537.3 28.8 1,566.1US dollar 31.2 3.9 35.1Polish zloty – 13.4 13.4UK sterling – 10.5 10.5Other 0.7 0.1 0.8 Total interest bearing borrowings 1,569.2 56.7 1,625.9
Other borrowings of €0.3m (2016: €15.3m) are subject to factoring agreements, based on which the customers are liable to the interest being charged (refer to Note 17).
186 Coca-Cola HBC 2017 Integrated Annual Report
NOTES TO THE CONSOLIDATED FINANCIAL STATEMENTS CONTINUED

Financial liabilities represent fixed and floating rate borrowings held by the Group. The Group’s policy is to hedge exposures to changes in the fair value of debt and interest rates by using a combination of cross-currency swap contracts, fixed-to-floating-rate interest rate swap contracts and interest rate option contracts. The weighted average interest rate of the fixed Euro liabilities is 2.4% and the weighted average maturity for which the interest is fixed is 4.1 years.
b) Cash and cash equivalentsCash and cash equivalents as at 31 December comprise the following:
2017
€ million2016
€ million
Cash at bank, in transit and in hand 397.6 329.7 Short-term deposits 325.9 243.5 Total cash and cash equivalents 723.5 573.2
Cash and cash equivalents are held in the following currencies:
2017
€ million2016
€ million
Euro 568.6 400.7Nigerian naira 82.8 110.7UK sterling 14.5 6.6Hungarian forint 10.6 6.1Romanian leu 9.9 5.6Russian rouble 9.8 11.7Serbian dinar 7.2 9.1Swiss franc 6.3 4.6Ukrainian hryvnia 3.0 2.5Czech koruna 2.3 2.1Croatian kuna 1.8 0.7US dollar 1.7 3.3Moldovan leu 1.2 0.8Belarusian rouble 1.1 1.4Other 2.7 7.3Total cash and cash equivalents 723.5 573.2
Time deposits of €150.9m, which do not meet the definition of cash and cash equivalents, are recorded as other financial assets.
Cash and cash equivalents include an amount of €83.9m held by the Group’s subsidiary, Nigerian Bottling Company Ltd, (€82.8m equivalent in Nigerian naira and €1.1m equivalent in other currencies). Furthermore, this amount includes €12.9m equivalent Nigerian naira, which relates to the outstanding balance of the bank account held for the repayment of its former minority shareholders, following the 2011 acquisition of non-controlling interests.
Cash and cash equivalents held by our subsidiaries in Greece of €16.6m were subject to capital controls as at 31 December 2017.
The amount of dividends payable to the Company by its operating subsidiaries is subject to, among other restrictions, general limitations imposed by the corporate laws and exchange control restrictions of the respective jurisdictions where those subsidiaries are organised and operate. Also, there are fund transfer restrictions in certain countries in which we operate, in particular Belarus, Greece, Serbia and Ukraine, where these restrictions do not have a material impact on the Group’s liquidity, as the amounts of cash and cash equivalents held in such countries are generally retained for capital expenditure, working capital and dividend distribution purposes. Fund transfer restrictions are also applicable in Nigeria; furthermore, the tight liquidity in 2016 and the first quarter of 2017 in the foreign exchange market in Nigeria has significantly limited our ability to execute payments in foreign currency, leading to a temporarily high Nigerian naira cash balance. We expect all this excess cash to be fully utilised to fund capital expenditure in 2018. Intra group dividends paid by certain of our subsidiaries are also subject to withholding taxes.
187Coca-Cola HBC 2017 Integrated Annual Report
Strategic R
eport
Co
rporate G
overnance
Financial Statem
entsS
wiss S
tatutory R
eporting
Supplem
entary Inform
ation
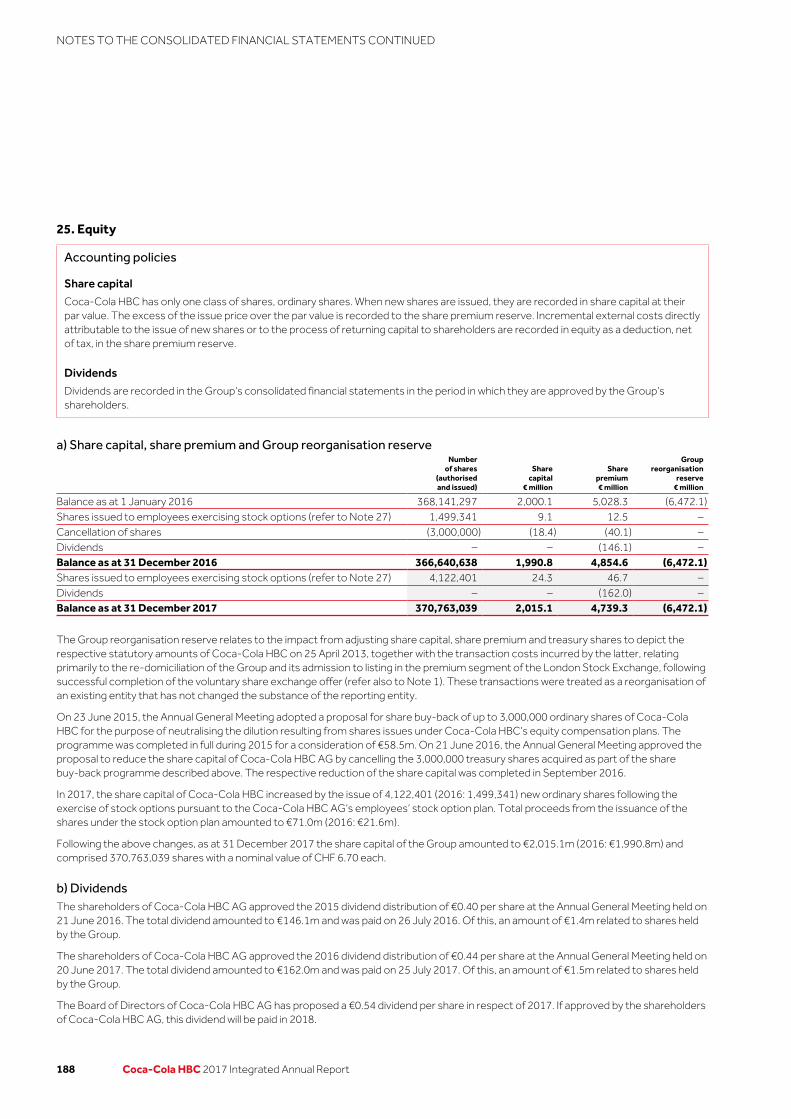
25. Equity
Accounting policies
Share capital
Coca-Cola HBC has only one class of shares, ordinary shares. When new shares are issued, they are recorded in share capital at their par value. The excess of the issue price over the par value is recorded to the share premium reserve. Incremental external costs directly attributable to the issue of new shares or to the process of returning capital to shareholders are recorded in equity as a deduction, net of tax, in the share premium reserve.
Dividends
Dividends are recorded in the Group’s consolidated financial statements in the period in which they are approved by the Group’s shareholders.
a) Share capital, share premium and Group reorganisation reserveNumber
of shares(authorisedand issued)
Sharecapital
€ million
Sharepremium€ million
Groupreorganisation
reserve€ million
Balance as at 1 January 2016 368,141,297 2,000.1 5,028.3 (6,472.1)Shares issued to employees exercising stock options (refer to Note 27) 1,499,341 9.1 12.5 –Cancellation of shares (3,000,000) (18.4) (40.1) –Dividends – – (146.1) –Balance as at 31 December 2016 366,640,638 1,990.8 4,854.6 (6,472.1)Shares issued to employees exercising stock options (refer to Note 27) 4,122,401 24.3 46.7 –Dividends – – (162.0) –Balance as at 31 December 2017 370,763,039 2,015.1 4,739.3 (6,472.1)
The Group reorganisation reserve relates to the impact from adjusting share capital, share premium and treasury shares to depict the respective statutory amounts of Coca-Cola HBC on 25 April 2013, together with the transaction costs incurred by the latter, relating primarily to the re-domiciliation of the Group and its admission to listing in the premium segment of the London Stock Exchange, following successful completion of the voluntary share exchange offer (refer also to Note 1). These transactions were treated as a reorganisation of an existing entity that has not changed the substance of the reporting entity.
On 23 June 2015, the Annual General Meeting adopted a proposal for share buy-back of up to 3,000,000 ordinary shares of Coca-Cola HBC for the purpose of neutralising the dilution resulting from shares issues under Coca-Cola HBC’s equity compensation plans. The programme was completed in full during 2015 for a consideration of €58.5m. On 21 June 2016, the Annual General Meeting approved the proposal to reduce the share capital of Coca-Cola HBC AG by cancelling the 3,000,000 treasury shares acquired as part of the share buy-back programme described above. The respective reduction of the share capital was completed in September 2016.
In 2017, the share capital of Coca-Cola HBC increased by the issue of 4,122,401 (2016: 1,499,341) new ordinary shares following the exercise of stock options pursuant to the Coca-Cola HBC AG’s employees’ stock option plan. Total proceeds from the issuance of the shares under the stock option plan amounted to €71.0m (2016: €21.6m).
Following the above changes, as at 31 December 2017 the share capital of the Group amounted to €2,015.1m (2016: €1,990.8m) and comprised 370,763,039 shares with a nominal value of CHF 6.70 each.
b) DividendsThe shareholders of Coca-Cola HBC AG approved the 2015 dividend distribution of €0.40 per share at the Annual General Meeting held on 21 June 2016. The total dividend amounted to €146.1m and was paid on 26 July 2016. Of this, an amount of €1.4m related to shares held by the Group.
The shareholders of Coca-Cola HBC AG approved the 2016 dividend distribution of €0.44 per share at the Annual General Meeting held on 20 June 2017. The total dividend amounted to €162.0m and was paid on 25 July 2017. Of this, an amount of €1.5m related to shares held by the Group.
The Board of Directors of Coca-Cola HBC AG has proposed a €0.54 dividend per share in respect of 2017. If approved by the shareholders of Coca-Cola HBC AG, this dividend will be paid in 2018.
188 Coca-Cola HBC 2017 Integrated Annual Report
NOTES TO THE CONSOLIDATED FINANCIAL STATEMENTS CONTINUED

c) ReservesThe reserves of the Group at 31 December were as follows:
2017€ million
2016€ million
Treasury shares (71.3) (70.7)Exchange equalisation reserve (1,026.3) (801.8)Other reserves
Hedging reserve, net (47.0) (55.3)Tax-free reserve 163.8 163.8Statutory reserves 27.3 26.9Stock option reserve 104.4 87.2Available-for-sale financial assets valuation reserve, net 0.8 0.7Other 21.9 21.8
Total other reserves 271.2 245.1Total reserves (826.4) (627.4)
Treasury shares
Treasury shares held by the Group represent shares acquired following approval of share buy-back programmes, forfeited shares under the equity compensation plan operated by the Group as well as shares representing the initial ordinary shares of Coca-Cola HBC acquired from Kar-Tess Holding. In September 2016 the 3,000,000 treasury shares, acquired as part of the 2015 share buy-back programme for a consideration of €58.5m, were cancelled (refer also to section a) ‘Share capital, share premium and Group reorganisation reserve’). As at 31 December 2017, 3,445,060 treasury shares were held by the Group.
Exchange equalisation reserve
The exchange equalisation reserve comprises all foreign exchange differences arising from the translation of the financial statements of entities with functional currencies other than the Euro.
Other reserves
Hedging reserveThe hedging reserve reflects changes in the fair values of derivatives accounted for as cash flow hedges, net of the deferred tax related to such balances.
Tax-free and statutory reservesThe tax-free reserve includes investment amount exempt from tax according to incentive legislation, other tax-free income or income taxed at source.
Statutory reserves are particular to the various countries in which the Group operates. The amount of statutory reserves of the parent entity, Coca-Cola HBC AG, is €nil. During 2017, an amount of €0.4m (2016: €6.9m) was reclassified to statutory reserves relating to the establishment of additional reserves by the Group’s subsidiaries.
Other reservesOther reserves are particular to the various countries in which the Group operates.
Stock option reserveThe stock option reserve represents the cumulative charge to the income statement for employee stock option and performance share awards (refer also to Note 27).
189Coca-Cola HBC 2017 Integrated Annual Report
Strategic R
eport
Co
rporate G
overnance
Financial Statem
entsS
wiss S
tatutory R
eporting
Supplem
entary Inform
ation
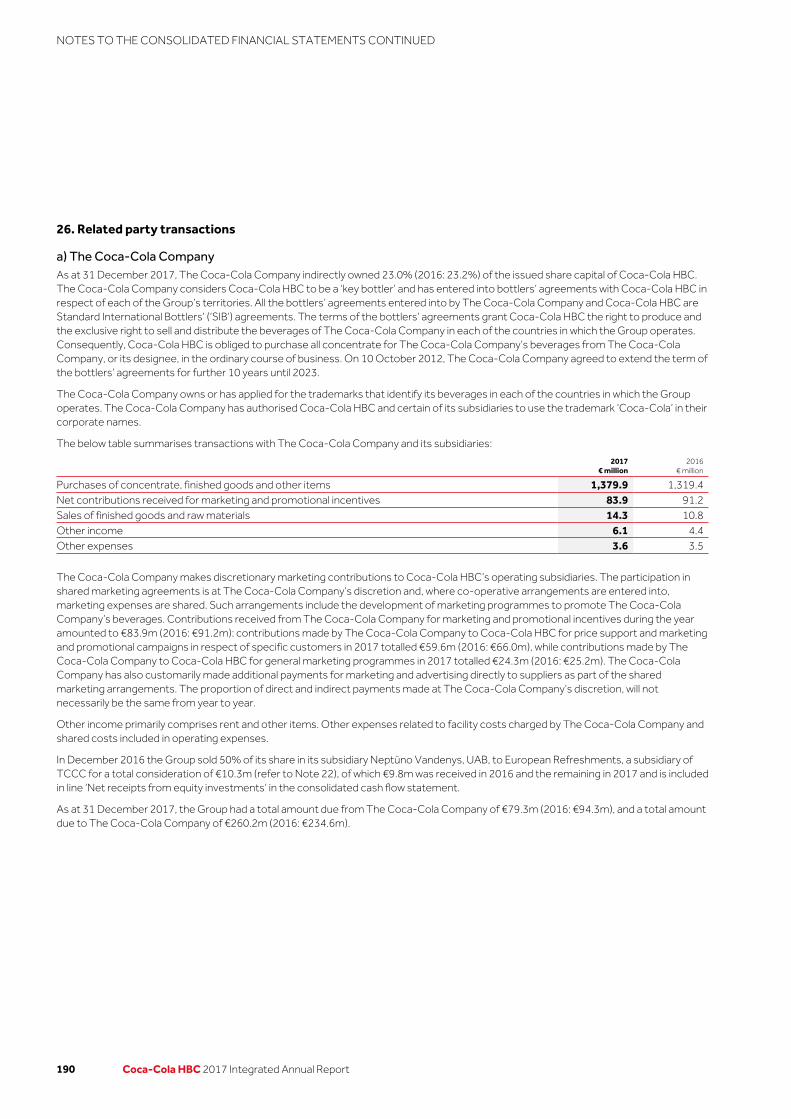
26. Related party transactions
a) The Coca-Cola CompanyAs at 31 December 2017, The Coca-Cola Company indirectly owned 23.0% (2016: 23.2%) of the issued share capital of Coca-Cola HBC. The Coca-Cola Company considers Coca-Cola HBC to be a ‘key bottler’ and has entered into bottlers’ agreements with Coca-Cola HBC in respect of each of the Group’s territories. All the bottlers’ agreements entered into by The Coca-Cola Company and Coca-Cola HBC are Standard International Bottlers’ (‘SIB’) agreements. The terms of the bottlers’ agreements grant Coca-Cola HBC the right to produce and the exclusive right to sell and distribute the beverages of The Coca-Cola Company in each of the countries in which the Group operates. Consequently, Coca-Cola HBC is obliged to purchase all concentrate for The Coca-Cola Company’s beverages from The Coca-Cola Company, or its designee, in the ordinary course of business. On 10 October 2012, The Coca-Cola Company agreed to extend the term of the bottlers’ agreements for further 10 years until 2023.
The Coca-Cola Company owns or has applied for the trademarks that identify its beverages in each of the countries in which the Group operates. The Coca-Cola Company has authorised Coca-Cola HBC and certain of its subsidiaries to use the trademark ‘Coca-Cola’ in their corporate names.
The below table summarises transactions with The Coca-Cola Company and its subsidiaries:
2017
€ million2016
€ million
Purchases of concentrate, finished goods and other items 1,379.9 1,319.4 Net contributions received for marketing and promotional incentives 83.9 91.2 Sales of finished goods and raw materials 14.3 10.8 Other income 6.1 4.4 Other expenses 3.6 3.5
The Coca-Cola Company makes discretionary marketing contributions to Coca-Cola HBC’s operating subsidiaries. The participation in shared marketing agreements is at The Coca-Cola Company’s discretion and, where co-operative arrangements are entered into, marketing expenses are shared. Such arrangements include the development of marketing programmes to promote The Coca-Cola Company’s beverages. Contributions received from The Coca-Cola Company for marketing and promotional incentives during the year amounted to €83.9m (2016: €91.2m): contributions made by The Coca-Cola Company to Coca-Cola HBC for price support and marketing and promotional campaigns in respect of specific customers in 2017 totalled €59.6m (2016: €66.0m), while contributions made by The Coca-Cola Company to Coca-Cola HBC for general marketing programmes in 2017 totalled €24.3m (2016: €25.2m). The Coca-Cola Company has also customarily made additional payments for marketing and advertising directly to suppliers as part of the shared marketing arrangements. The proportion of direct and indirect payments made at The Coca-Cola Company’s discretion, will not necessarily be the same from year to year.
Other income primarily comprises rent and other items. Other expenses related to facility costs charged by The Coca-Cola Company and shared costs included in operating expenses.
In December 2016 the Group sold 50% of its share in its subsidiary Neptūno Vandenys, UAB, to European Refreshments, a subsidiary of TCCC for a total consideration of €10.3m (refer to Note 22), of which €9.8m was received in 2016 and the remaining in 2017 and is included in line ‘Net receipts from equity investments’ in the consolidated cash flow statement.
As at 31 December 2017, the Group had a total amount due from The Coca-Cola Company of €79.3m (2016: €94.3m), and a total amount due to The Coca-Cola Company of €260.2m (2016: €234.6m).
190 Coca-Cola HBC 2017 Integrated Annual Report
NOTES TO THE CONSOLIDATED FINANCIAL STATEMENTS CONTINUED
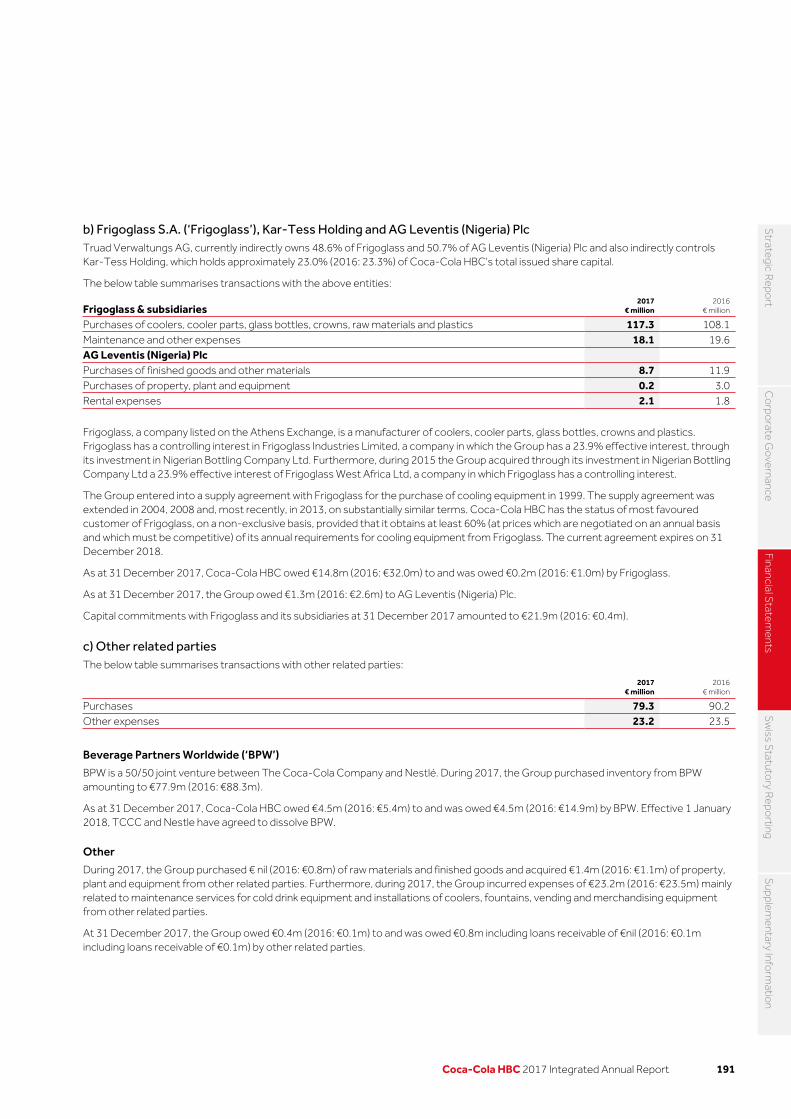
b) Frigoglass S.A. (‘Frigoglass’), Kar-Tess Holding and AG Leventis (Nigeria) PlcTruad Verwaltungs AG, currently indirectly owns 48.6% of Frigoglass and 50.7% of AG Leventis (Nigeria) Plc and also indirectly controls Kar-Tess Holding, which holds approximately 23.0% (2016: 23.3%) of Coca-Cola HBC’s total issued share capital.
The below table summarises transactions with the above entities:
Frigoglass & subsidiaries2017
€ million2016
€ million
Purchases of coolers, cooler parts, glass bottles, crowns, raw materials and plastics 117.3 108.1Maintenance and other expenses 18.1 19.6AG Leventis (Nigeria) Plc Purchases of finished goods and other materials 8.7 11.9Purchases of property, plant and equipment 0.2 3.0Rental expenses 2.1 1.8
Frigoglass, a company listed on the Athens Exchange, is a manufacturer of coolers, cooler parts, glass bottles, crowns and plastics. Frigoglass has a controlling interest in Frigoglass Industries Limited, a company in which the Group has a 23.9% effective interest, through its investment in Nigerian Bottling Company Ltd. Furthermore, during 2015 the Group acquired through its investment in Nigerian Bottling Company Ltd a 23.9% effective interest of Frigoglass West Africa Ltd, a company in which Frigoglass has a controlling interest.
The Group entered into a supply agreement with Frigoglass for the purchase of cooling equipment in 1999. The supply agreement was extended in 2004, 2008 and, most recently, in 2013, on substantially similar terms. Coca-Cola HBC has the status of most favoured customer of Frigoglass, on a non-exclusive basis, provided that it obtains at least 60% (at prices which are negotiated on an annual basis and which must be competitive) of its annual requirements for cooling equipment from Frigoglass. The current agreement expires on 31 December 2018.
As at 31 December 2017, Coca-Cola HBC owed €14.8m (2016: €32.0m) to and was owed €0.2m (2016: €1.0m) by Frigoglass.
As at 31 December 2017, the Group owed €1.3m (2016: €2.6m) to AG Leventis (Nigeria) Plc.
Capital commitments with Frigoglass and its subsidiaries at 31 December 2017 amounted to €21.9m (2016: €0.4m).
c) Other related partiesThe below table summarises transactions with other related parties:
2017
€ million2016
€ million
Purchases 79.3 90.2 Other expenses 23.2 23.5
Beverage Partners Worldwide (‘BPW’)
BPW is a 50/50 joint venture between The Coca-Cola Company and Nestlé. During 2017, the Group purchased inventory from BPW amounting to €77.9m (2016: €88.3m).
As at 31 December 2017, Coca-Cola HBC owed €4.5m (2016: €5.4m) to and was owed €4.5m (2016: €14.9m) by BPW. Effective 1 January 2018, TCCC and Nestle have agreed to dissolve BPW.
Other
During 2017, the Group purchased € nil (2016: €0.8m) of raw materials and finished goods and acquired €1.4m (2016: €1.1m) of property, plant and equipment from other related parties. Furthermore, during 2017, the Group incurred expenses of €23.2m (2016: €23.5m) mainly related to maintenance services for cold drink equipment and installations of coolers, fountains, vending and merchandising equipment from other related parties.
At 31 December 2017, the Group owed €0.4m (2016: €0.1m) to and was owed €0.8m including loans receivable of €nil (2016: €0.1m including loans receivable of €0.1m) by other related parties.
191Coca-Cola HBC 2017 Integrated Annual Report
Strategic R
eport
Co
rporate G
overnance
Financial Statem
entsS
wiss S
tatutory R
eporting
Supplem
entary Inform
ation

26. Related party transactions continued
d) Joint venturesDuring 2017, the Group purchased €19.7m of finished goods (2016: €42.2m). In addition, during 2017 the Group recorded sales of finished goods and raw materials of €12.6m (2016: €12.3m) to joint ventures. Furthermore, the Group recorded other income of €1.4m (2016: €1.6m) from joint ventures. During 2017, the Group sold property, plant and equipment of € nil (2016: € 2.5m) to joint ventures.
As at 31 December 2017, the Group owed €24.0m including loans payable of €4.3m (2016: €34.0m including loans payable €4.1m) to and was owed €8.6m including loans receivable of €3.6m (2016: €11.9m including loans receivable of €5.1m) by joint ventures. During 2017 the Group received dividends and capital returns of €19.3m (2016: €16.5m dividends) from Brewinvest S.A. Group of companies which are included in line ‘Net receipts from equity investments’ of the consolidated cash flow statement.
e) DirectorsAnastassis G. David, Anastasios I. Leventis, Christo Leventis and Robert Ryan Rudolph have all been nominated by Kar-Tess Holding to the Board of Coca-Cola HBC. José Octavio Reyes and Ahmet C. Bozer have been nominated by TCCC to the Board of Coca-Cola HBC. There have been no transactions between Coca-Cola HBC and the Directors except for remuneration (refer to Note 8).
27. Share based payments
Accounting policies
Stock option and performance share compensation plans
Coca-Cola HBC issues equity-settled share-based payments to its senior managers in the form of an employee stock option plan and a performance share plan.
The employee stock option plan is measured at fair value at the date of grant. Fair value reflects the parameters of the compensation plan, the risk-free interest rate, the expected volatility, the dividend yield and the early exercise experience of the Group’s plans. Expected volatility is determined by calculating the historical volatility of Coca-Cola HBC’s share price over previous years. The fair value determined at the grant date is expensed on a straight-line basis over the vesting period.
The performance share plan offers a specified number of performance share awards that vest three years after the grant. The fair value is determined at the grant date and reflects the parameters of the compensation plan, the dividend yield and the weighted average share price. The fair value determined at the grant date is expensed on a straight-line basis over the vesting period. At the end of each reporting period the Group revises its estimates of the number of shares that are expected to vest based on non-market conditions, and recognises the impact of the revision to original estimates, if any, in the income statement with a corresponding adjustment to equity.
Employee Share Purchase Plan
The Group operates an employee share purchase plan, the Employee Share Purchase Plan, an equity compensation plan in which eligible employees can participate. The Group makes contributions to the plan for participating employees and recognises expenses over the vesting period of the contributions.
The charge included in employee costs regarding share-based payments for the years ended 31 December is analysed as follows:
2017
€ million2016
€ million
Stock option awards 0.7 3.7Performance shares awards 20.1 4.4Employee Share Purchase Plan 4.6 4.6Total share based payments charge 25.4 12.7
192 Coca-Cola HBC 2017 Integrated Annual Report
NOTES TO THE CONSOLIDATED FINANCIAL STATEMENTS CONTINUED

Terms and conditions
Stock option plan:
Senior managers are granted awards of stock options, based on performance, potentiality and level of responsibility. Options are granted at an exercise price equal to the closing price of the Company’s shares trading on the London Stock Exchange on the day of the grant. Options vest in one-third increments each year for three years and can be exercised for up to 10 years from the date of award. When the options are exercised, the proceeds received, net of any transaction costs, are credited to share capital (at the nominal value) and share premium.
Performance share plan:
During 2015 the Group adopted a Performance share plan, under which senior managers are granted performance share awards, which have a three-year vesting period and are linked with Group specific key performance indicators. Performance share awards are granted at a price equal to the closing price of the Company’s shares trading on the London Stock Exchange on the day of the grant.
Employee Share Purchase Plan:
The Employee Share Purchase Plan is administered by a Plan Administrator. Under the terms of this plan, employees have the opportunity to invest 1% to 15% of their salary in ordinary Coca-Cola HBC shares by contributing to the plan monthly. Coca-Cola HBC will match up to a maximum of 3% of the employee’s salary by way of contribution. Employer contributions, in the form of a cash allocation, take place on a monthly basis and are used to purchase matching shares on the open market, which is the London Stock Exchange, at the time of vesting. Matching contributions vest one year after the grant. Dividends received in respect of shares under the Plan are used to purchase additional shares at the time of vesting. Shares are held under the Plan Administrator. In order to adapt the plan to the Greek legal framework Coca-Cola HBC matches the contribution of employees’ resident in Greece with an annual employer contribution, of up to 5% of the employee’s salary in December of each year, which vest immediately.
Stock option activityThe Group has not issued any new stock options in 2017 or 2016.
The following table summarises information regarding outstanding stock options exercisable at 31 December 2017:
Exercise price
(EUR)Exercise price
(GBP)
Vestingstatus as at
31 Dec 2017 End of period
Number ofstock options
outstanding
2005 December Grant 13.19 11.24 fully vested 31.12.20201 245,0012006 December Grant 16.37 13.95 fully vested 12.12.20211 397,5002007 December Grant 26.41 22.51 fully vested 31.12.20221 537,2502008 December Grant 9.02 7.69 fully vested 10.12.2018 539,5002009 December Grant 15.70 13.38 fully vested 09.12.2019 796,5002010 December Grant 19.31 16.46 fully vested 08.12.2020 1,048,0002011 March Grant 18.53 15.79 fully vested 15.03.2021 18,3342011 December Grant 11.98 10.21 fully vested 15.12.2021 502,1682013 June Grant – 15.00 fully vested 20.06.2023 587,5002013 December Grant – 16.99 fully vested 09.12.2023 763,0002014 December Grant – 13.33 fully vested 09.12.2024 928,904Total 6,363,657
1. Relates to stock options granted under the previous stock option plans which expire in December 2020, 2021 and 2022 respectively.
193Coca-Cola HBC 2017 Integrated Annual Report
Strategic R
eport
Co
rporate G
overnance
Financial Statem
entsS
wiss S
tatutory R
eporting
Supplem
entary Inform
ation
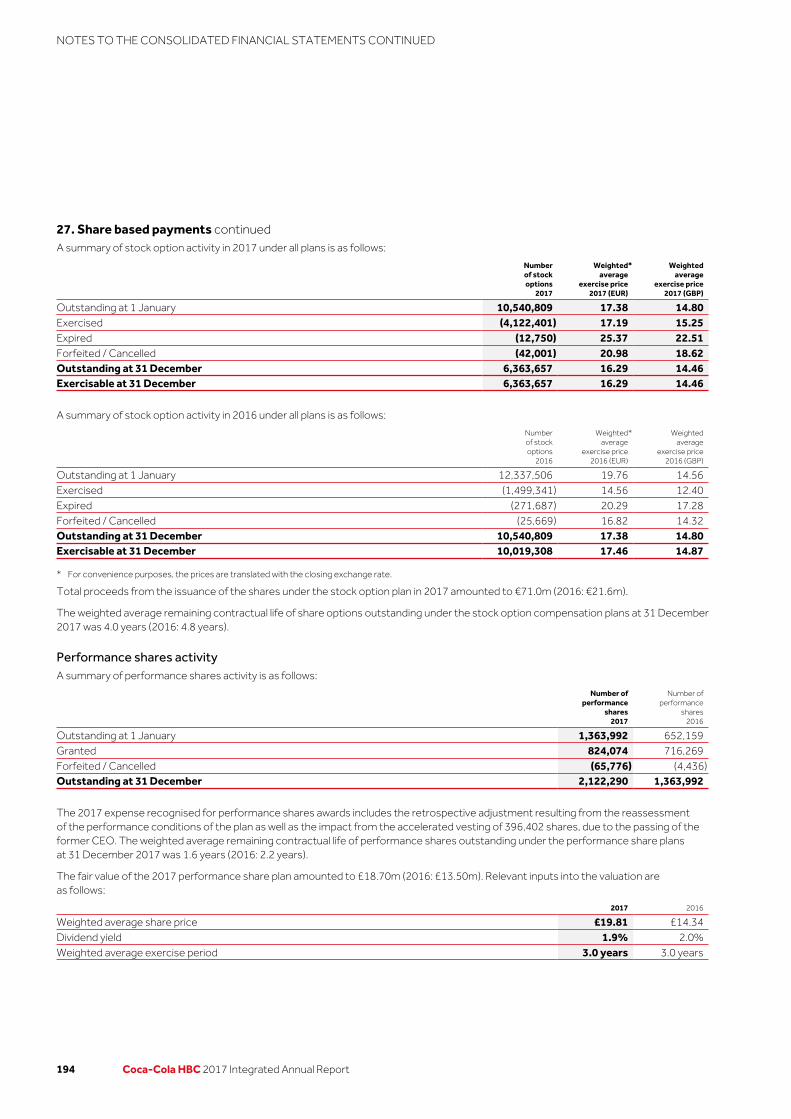
27. Share based payments continuedA summary of stock option activity in 2017 under all plans is as follows:
Numberof stockoptions
2017
Weighted*average
exercise price2017 (EUR)
Weightedaverage
exercise price2017 (GBP)
Outstanding at 1 January 10,540,809 17.38 14.80Exercised (4,122,401) 17.19 15.25Expired (12,750) 25.37 22.51Forfeited / Cancelled (42,001) 20.98 18.62Outstanding at 31 December 6,363,657 16.29 14.46Exercisable at 31 December 6,363,657 16.29 14.46
A summary of stock option activity in 2016 under all plans is as follows:
Numberof stockoptions
2016
Weighted*average
exercise price2016 (EUR)
Weightedaverage
exercise price2016 (GBP)
Outstanding at 1 January 12,337,506 19.76 14.56Exercised (1,499,341) 14.56 12.40Expired (271,687) 20.29 17.28Forfeited / Cancelled (25,669) 16.82 14.32Outstanding at 31 December 10,540,809 17.38 14.80Exercisable at 31 December 10,019,308 17.46 14.87
* For convenience purposes, the prices are translated with the closing exchange rate.
Total proceeds from the issuance of the shares under the stock option plan in 2017 amounted to €71.0m (2016: €21.6m).
The weighted average remaining contractual life of share options outstanding under the stock option compensation plans at 31 December 2017 was 4.0 years (2016: 4.8 years).
Performance shares activityA summary of performance shares activity is as follows:
Number ofperformance
shares2017
Number ofperformance
shares2016
Outstanding at 1 January 1,363,992 652,159Granted 824,074 716,269Forfeited / Cancelled (65,776) (4,436)Outstanding at 31 December 2,122,290 1,363,992
The 2017 expense recognised for performance shares awards includes the retrospective adjustment resulting from the reassessment of the performance conditions of the plan as well as the impact from the accelerated vesting of 396,402 shares, due to the passing of the former CEO. The weighted average remaining contractual life of performance shares outstanding under the performance share plans at 31 December 2017 was 1.6 years (2016: 2.2 years).
The fair value of the 2017 performance share plan amounted to £18.70m (2016: £13.50m). Relevant inputs into the valuation are as follows:
2017 2016
Weighted average share price £19.81 £14.34Dividend yield 1.9% 2.0%Weighted average exercise period 3.0 years 3.0 years
194 Coca-Cola HBC 2017 Integrated Annual Report
NOTES TO THE CONSOLIDATED FINANCIAL STATEMENTS CONTINUED

28. Contingencies In relation to the Greek Competition Authority’s decision of 25 January 2002, one of Coca-Cola Hellenic Bottling Company S.A.’s competitors has filed a lawsuit against Coca-Cola Hellenic Bottling Company S.A. claiming damages in an amount of €7.7m. The court of first instance heard the case on 21 January 2009 and subsequently rejected the lawsuit. The plaintiff has appealed the judgement and on 9 December 2013 the Athens Court of Appeals rejected the plaintiff’s appeal. Following the spin-off, Coca-Cola HBC Greece S.A.I.C. substituted Coca-Cola Hellenic Bottling Company S.A. as defendant in this lawsuit. Coca-Cola HBC Greece S.A.I.C. has not provided for any losses related to this case. The defendant has not filed for a cessation of the decision within the relevant deadline set by law, therefore the decision of the Athens Court of Appeal is final and irrecoverable and the case has closed. On 19 April 2014, the same plaintiff filed a new lawsuit against Coca-Cola Hellenic Bottling Company S.A. (following the spin-off, Coca-Cola HBC Greece S.A.I.C.) claiming payment of €7.5m as compensation for losses and moral damages for alleged anti-competitive commercial practices of Coca-Cola Hellenic Bottling Company S.A. between 1994 and 2013. The two lawsuits partially overlap in the time period for which damages are sought by the plaintiff. The hearing of the new lawsuit is now scheduled for 17 January 2019. Coca-Cola HBC Greece S.A.I.C. has not provided for any losses related to this case.
On 6 September 2016, the Greek Competition Commission initiated an audit of Coca-Cola HBC Greece S.A.I.C.’s operations as part of an investigation into certain commercial practices in the sparkling, juice and water categories. Coca-Cola HBC Greece S.A.I.C. has a policy of strict compliance with Greek and EU competition law and it is co-operating fully with the Greek Competition Commission.
In 1992, our subsidiary Nigerian Bottling Company (‘NBC’) acquired a manufacturing facility in Nigeria from Vacunak, a Nigerian company. In 1994, Vacunak filed a lawsuit against NBC, alleging that a representative of NBC had orally agreed to rescind the sale agreement and instead enter into a lease agreement with Vacunak. As part of its lawsuit Vacunak sought compensation for rent and loss of business opportunities. NBC discontinued all use of the facility in 1995. On 19 August 2013, NBC received the written judgement of the Nigerian court of first instance issued on 28 June 2012 providing for damages of approximately €19.3m. NBC has filed an appeal against the judgement. Based on advice from NBC’s outside legal counsel, we believe that it is unlikely that NBC will suffer material financial losses from this case. We have consequently not provided for any losses in relation to this case.
The tax filings of the Group and its subsidiaries are routinely subjected to audit by tax authorities in most of the jurisdictions in which the Group conducts business. These audits may result in assessments of additional taxes. The Group provides additional tax in relation to the outcome of such tax assessments, to the extent that a liability is probable and estimable.
The Group is also involved in various other legal proceedings. Management believes that any liability to the Group that may arise as a result of these pending legal proceedings will not have a material adverse effect on the results of operations, cash flows, or the financial position of the Group taken as a whole.
195Coca-Cola HBC 2017 Integrated Annual Report
Strategic R
eport
Co
rporate G
overnance
Financial Statem
entsS
wiss S
tatutory R
eporting
Supplem
entary Inform
ation
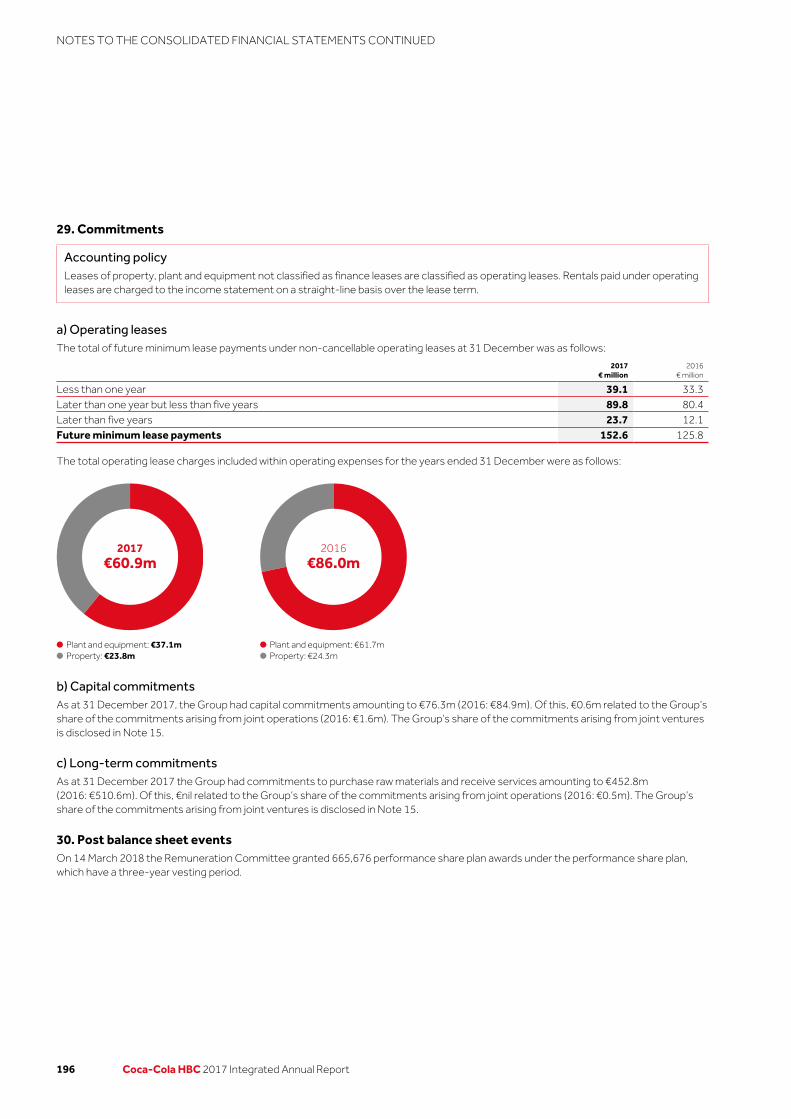
29. Commitments
Accounting policyLeases of property, plant and equipment not classified as finance leases are classified as operating leases. Rentals paid under operating leases are charged to the income statement on a straight-line basis over the lease term.
a) Operating leasesThe total of future minimum lease payments under non-cancellable operating leases at 31 December was as follows:
2017
€ million2016
€ million
Less than one year 39.1 33.3Later than one year but less than five years 89.8 80.4Later than five years 23.7 12.1Future minimum lease payments 152.6 125.8
The total operating lease charges included within operating expenses for the years ended 31 December were as follows:
b) Capital commitmentsAs at 31 December 2017, the Group had capital commitments amounting to €76.3m (2016: €84.9m). Of this, €0.6m related to the Group’s share of the commitments arising from joint operations (2016: €1.6m). The Group’s share of the commitments arising from joint ventures is disclosed in Note 15.
c) Long-term commitmentsAs at 31 December 2017 the Group had commitments to purchase raw materials and receive services amounting to €452.8m (2016: €510.6m). Of this, €nil related to the Group’s share of the commitments arising from joint operations (2016: €0.5m). The Group’s share of the commitments arising from joint ventures is disclosed in Note 15.
30. Post balance sheet eventsOn 14 March 2018 the Remuneration Committee granted 665,676 performance share plan awards under the performance share plan, which have a three-year vesting period.
Plant and equipment: €61.7mProperty: €24.3m
2016€86.0m
Plant and equipment: €37.1mProperty: €23.8m
2017€60.9m
196 Coca-Cola HBC 2017 Integrated Annual Report
NOTES TO THE CONSOLIDATED FINANCIAL STATEMENTS CONTINUED