Embed Size (px)
Citation preview
FINANCIAL STATEMENTS
Banco do Nordeste and FNE
POSITION: 06.30.2011
Financial Statements
Banco do Nordeste
POSITION: 06.30.2011
Management Report - First Half of 2011
BANCO DO NORDESTE DO BRASIL S.A. Head office: Av. P edro Ramalho, 5.700 Fortaleza - Ceará - Publicly-held Company - CNPJ 07.237.373/0 001-20
MANAGEMENT REPORT - First half of 2011 In the first half of 2011, Banco do Nordeste do Brasil S.A. (BNB) contracted a total of 1.5 million loans in the total amount of R$ 9.5 billion. Such amount represented an increase of 12.4% compared to the same period of 2010. Long-term financing directed to investments totaled R$ 4.7 billion, whereas short-term loans, which are supplementary to investments, amounted to R$ 4.4 billion. Capital market operations totaled R$ 389.0 million. Among all sources of funds used by the Bank, the Northeast Financing Constitutional Fund (FNE) was responsible for R$ 4.5 billion of financing granted - emphasizing the importance of this source of funds to the development of the Northeast region. In the first half, FNE, which covers 1,963 municipalities out of the 1,989 municipalities where it operates, accounted for 98.7% in terms of geographic occupation.
Backed by two microcredit programs, Crediamigo and Agroamigo, targeted at the urban and rural areas, respectively, BNB has been spreading out its reach in this important emerging segment in Brazil. In order to boost the informal microentrepreneurs’ production activities, the Bank contracted, in the first half, approximately 1.2 million loans, in the total amount of R$ 1.6 billion, an increase by 36.6% compared to the same period of the prior year. Micro and small companies (MPEs) borrowed R$ 1.2 billion, a growth by 25.2%. In the family farming segment, BNB has invested, through the National Family Farming Strengthening Program (PRONAF), R$ 599.4 million, a growth by 27.6%.
BNB’s farming loan portfolio had a balance of R$ 16.8 billion at the end of the first half, corresponding to the country’s second largest farming portfolio, after Banco do Brasil only, with operations throughout Brazil. In March 2011, the Bank’s loan portfolio, including FNE funds, had a balance of R$41.5 billion and was ranked the ninth largest bank in Brazil in terms of loan portfolio. BNB continues to hold a substantial market share of long-term credit balances of the Financial System in the area where it operates - in the Northeast and in northern Minas Gerais and Espírito Santo - with a 65.4% market share of the total. In the short-term balance, Bank’s market share is 6.8%; in the farm credit segment, the Bank’s market share is 71.9%.
Management Report - First Half of 2011
OPERATIONAL PERFORMANCE Global Operations
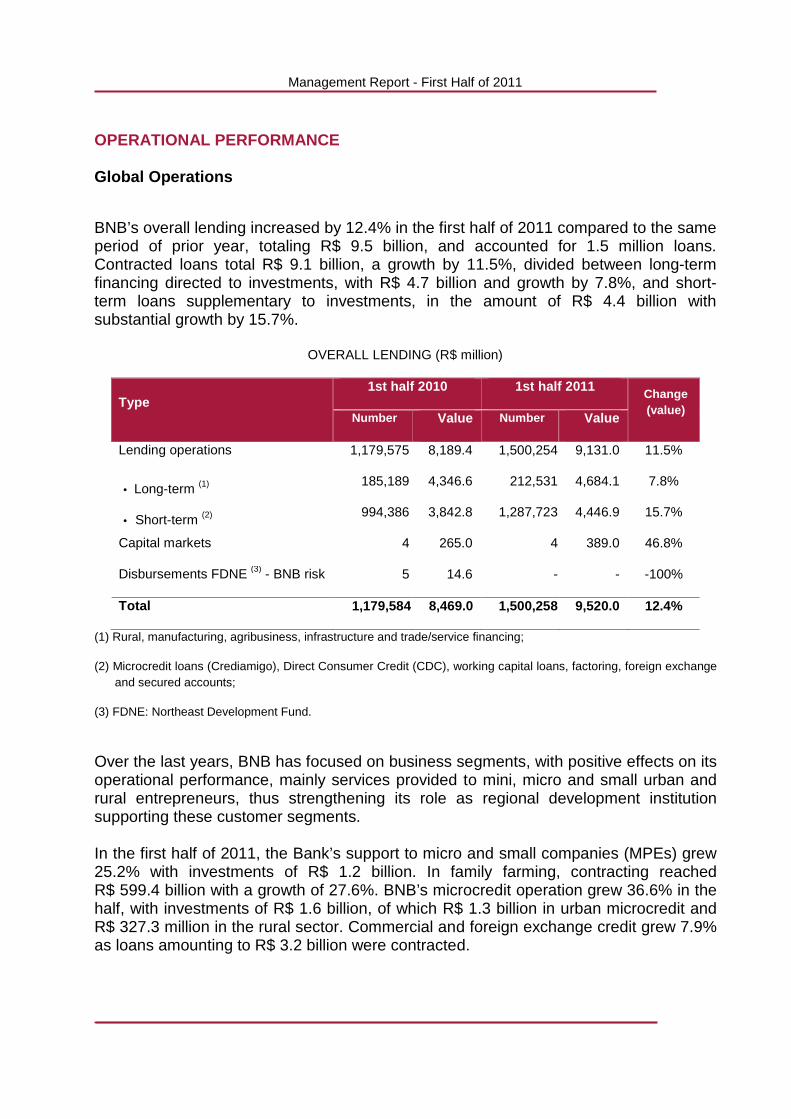
BNB’s overall lending increased by 12.4% in the first half of 2011 compared to the same period of prior year, totaling R$ 9.5 billion, and accounted for 1.5 million loans. Contracted loans total R$ 9.1 billion, a growth by 11.5%, divided between long-term financing directed to investments, with R$ 4.7 billion and growth by 7.8%, and short-term loans supplementary to investments, in the amount of R$ 4.4 billion with substantial growth by 15.7%.
OVERALL LENDING (R$ million)
Type 1st half 2010 1st half 2011
Change (value)
Number Value Number Value
Lending operations 1,179,575 8,189.4 1,500,254 9,131.0 11.5%
• Long-term (1) 185,189 4,346.6 212,531 4,684.1 7.8%
• Short-term (2) 994,386 3,842.8 1,287,723 4,446.9 15.7%
Capital markets 4 265.0 4 389.0 46.8%
Disbursements FDNE (3) - BNB risk 5 14.6 - - -100%
Total 1,179,584 8,469.0 1,500,258 9,520.0 12.4%
(1) Rural, manufacturing, agribusiness, infrastructure and trade/service financing;
(2) Microcredit loans (Crediamigo), Direct Consumer Credit (CDC), working capital loans, factoring, foreign exchange and secured accounts;
(3) FDNE: Northeast Development Fund.
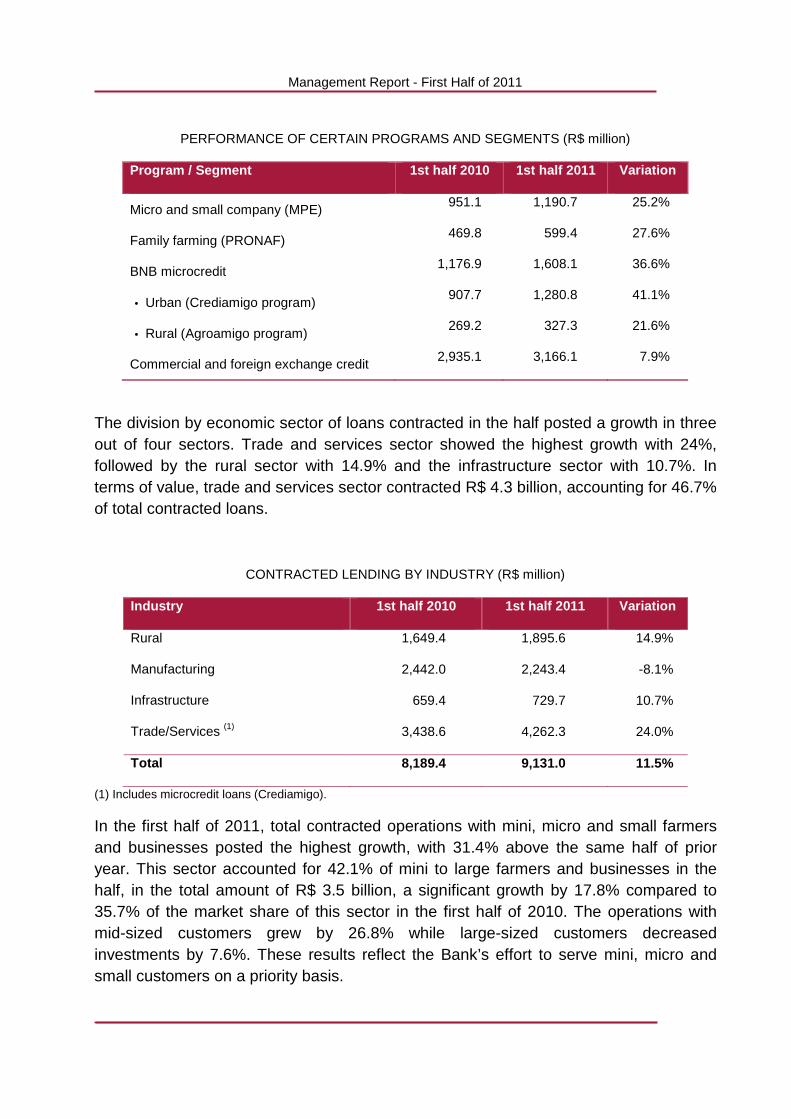
Over the last years, BNB has focused on business segments, with positive effects on its operational performance, mainly services provided to mini, micro and small urban and rural entrepreneurs, thus strengthening its role as regional development institution supporting these customer segments. In the first half of 2011, the Bank’s support to micro and small companies (MPEs) grew 25.2% with investments of R$ 1.2 billion. In family farming, contracting reached R$ 599.4 billion with a growth of 27.6%. BNB’s microcredit operation grew 36.6% in the half, with investments of R$ 1.6 billion, of which R$ 1.3 billion in urban microcredit and R$ 327.3 million in the rural sector. Commercial and foreign exchange credit grew 7.9% as loans amounting to R$ 3.2 billion were contracted.
Management Report - First Half of 2011
PERFORMANCE OF CERTAIN PROGRAMS AND SEGMENTS (R$ million)
Program / Segment 1st half 2010 1st half 2011 Variation
Micro and small company (MPE) 951.1 1,190.7 25.2%
Family farming (PRONAF) 469.8 599.4 27.6%
BNB microcredit 1,176.9 1,608.1 36.6%
• Urban (Crediamigo program) 907.7 1,280.8 41.1%
• Rural (Agroamigo program) 269.2 327.3 21.6%
Commercial and foreign exchange credit 2,935.1 3,166.1 7.9%
The division by economic sector of loans contracted in the half posted a growth in three out of four sectors. Trade and services sector showed the highest growth with 24%, followed by the rural sector with 14.9% and the infrastructure sector with 10.7%. In terms of value, trade and services sector contracted R$ 4.3 billion, accounting for 46.7% of total contracted loans.
CONTRACTED LENDING BY INDUSTRY (R$ million)
Industry 1st half 2010 1st half 2011 Variation
Rural 1,649.4 1,895.6 14.9%
Manufacturing 2,442.0 2,243.4 -8.1%
Infrastructure 659.4 729.7 10.7%
Trade/Services (1) 3,438.6 4,262.3 24.0%
Total 8,189.4 9,131.0 11.5%
(1) Includes microcredit loans (Crediamigo).
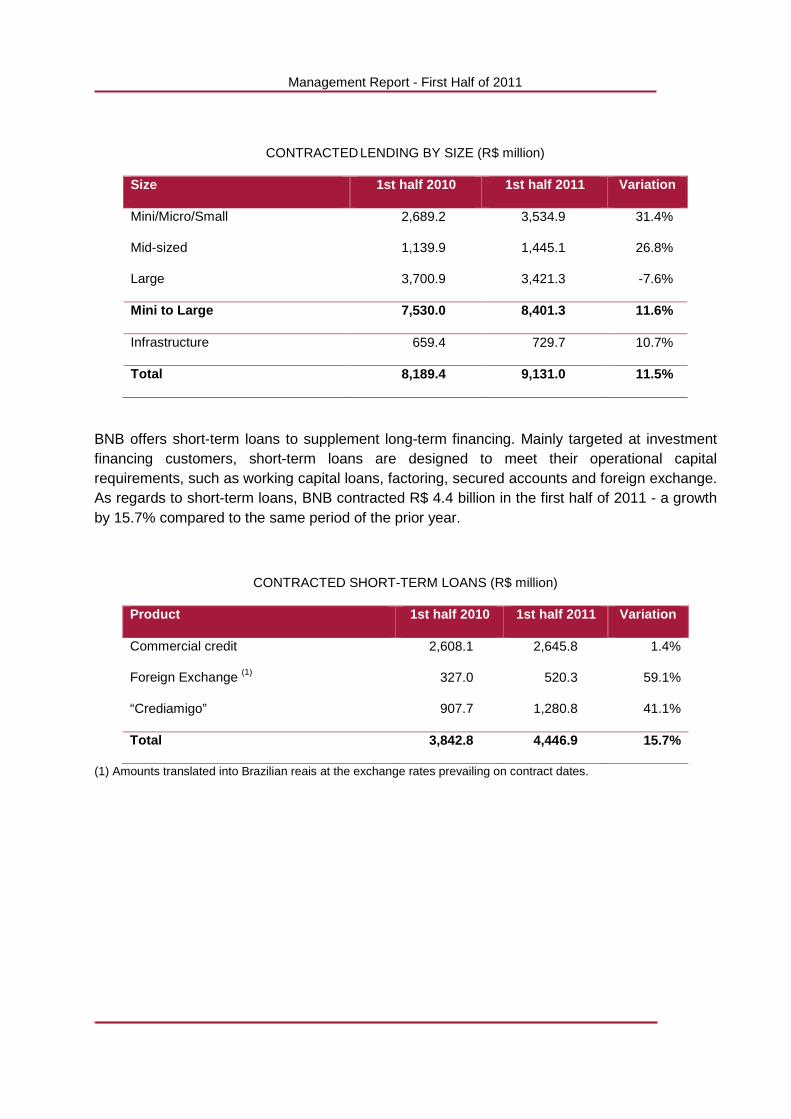
In the first half of 2011, total contracted operations with mini, micro and small farmers and businesses posted the highest growth, with 31.4% above the same half of prior year. This sector accounted for 42.1% of mini to large farmers and businesses in the half, in the total amount of R$ 3.5 billion, a significant growth by 17.8% compared to 35.7% of the market share of this sector in the first half of 2010. The operations with mid-sized customers grew by 26.8% while large-sized customers decreased investments by 7.6%. These results reflect the Bank’s effort to serve mini, micro and small customers on a priority basis.
Management Report - First Half of 2011
CONTRACTED LENDING BY SIZE (R$ million)
Size 1st half 2010 1st half 2011 Variation
Mini/Micro/Small 2,689.2 3,534.9 31.4%
Mid-sized 1,139.9 1,445.1 26.8%
Large 3,700.9 3,421.3 -7.6%
Mini to Large 7,530.0 8,401.3 11.6%
Infrastructure 659.4 729.7 10.7%
Total 8,189.4 9,131.0 11.5%
BNB offers short-term loans to supplement long-term financing. Mainly targeted at investment financing customers, short-term loans are designed to meet their operational capital requirements, such as working capital loans, factoring, secured accounts and foreign exchange. As regards to short-term loans, BNB contracted R$ 4.4 billion in the first half of 2011 - a growth by 15.7% compared to the same period of the prior year.
CONTRACTED SHORT-TERM LOANS (R$ million)
Product 1st half 2010 1st half 2011 Variation
Commercial credit 2,608.1 2,645.8 1.4%
Foreign Exchange (1) 327.0 520.3 59.1%
“Crediamigo” 907.7 1,280.8 41.1%
Total 3,842.8 4,446.9 15.7%
(1) Amounts translated into Brazilian reais at the exchange rates prevailing on contract dates.
Management Report - First Half of 2011
Northeast Financing Constitutional Fund (FNE)
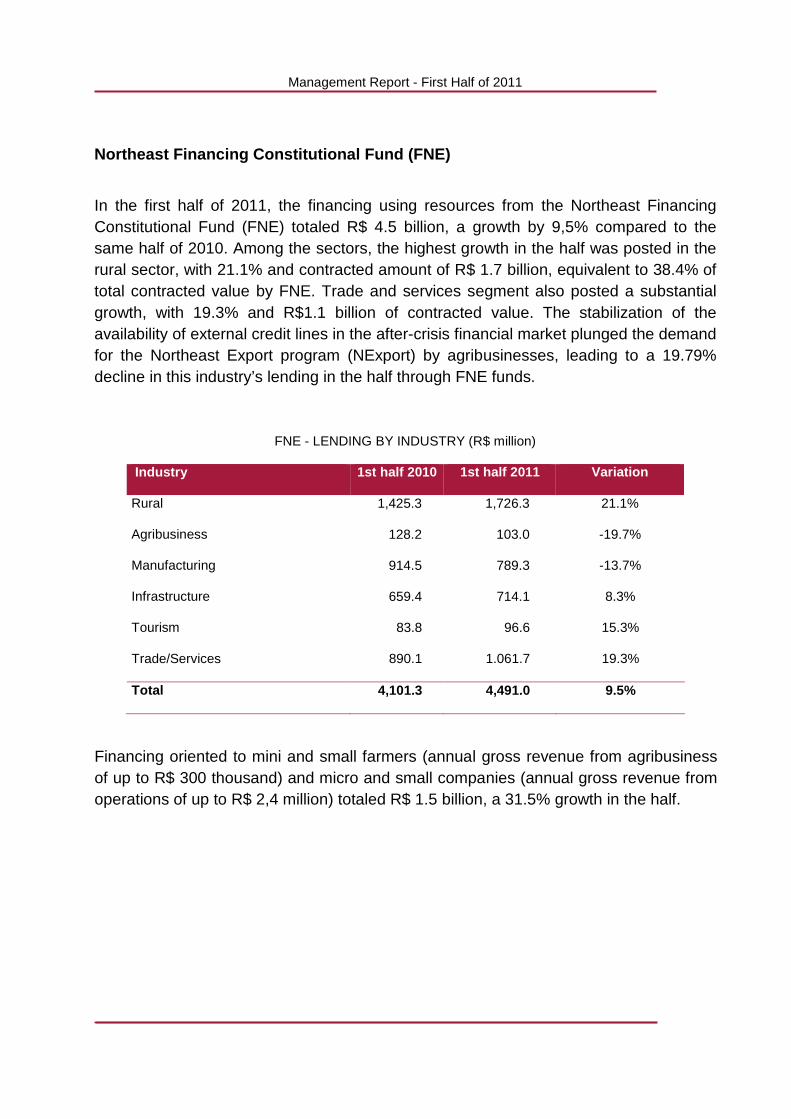
In the first half of 2011, the financing using resources from the Northeast Financing Constitutional Fund (FNE) totaled R$ 4.5 billion, a growth by 9,5% compared to the same half of 2010. Among the sectors, the highest growth in the half was posted in the rural sector, with 21.1% and contracted amount of R$ 1.7 billion, equivalent to 38.4% of total contracted value by FNE. Trade and services segment also posted a substantial growth, with 19.3% and R$1.1 billion of contracted value. The stabilization of the availability of external credit lines in the after-crisis financial market plunged the demand for the Northeast Export program (NExport) by agribusinesses, leading to a 19.79% decline in this industry’s lending in the half through FNE funds.
FNE - LENDING BY INDUSTRY (R$ million)
Industry 1st half 2010 1st half 2011 Variation
Rural 1,425.3 1,726.3 21.1%
Agribusiness 128.2 103.0 -19.7%
Manufacturing 914.5 789.3 -13.7%
Infrastructure 659.4 714.1 8.3%
Tourism 83.8 96.6 15.3%
Trade/Services 890.1 1.061.7 19.3%
Total 4,101.3 4,491.0 9.5%
Financing oriented to mini and small farmers (annual gross revenue from agribusiness of up to R$ 300 thousand) and micro and small companies (annual gross revenue from operations of up to R$ 2,4 million) totaled R$ 1.5 billion, a 31.5% growth in the half.
Management Report - First Half of 2011
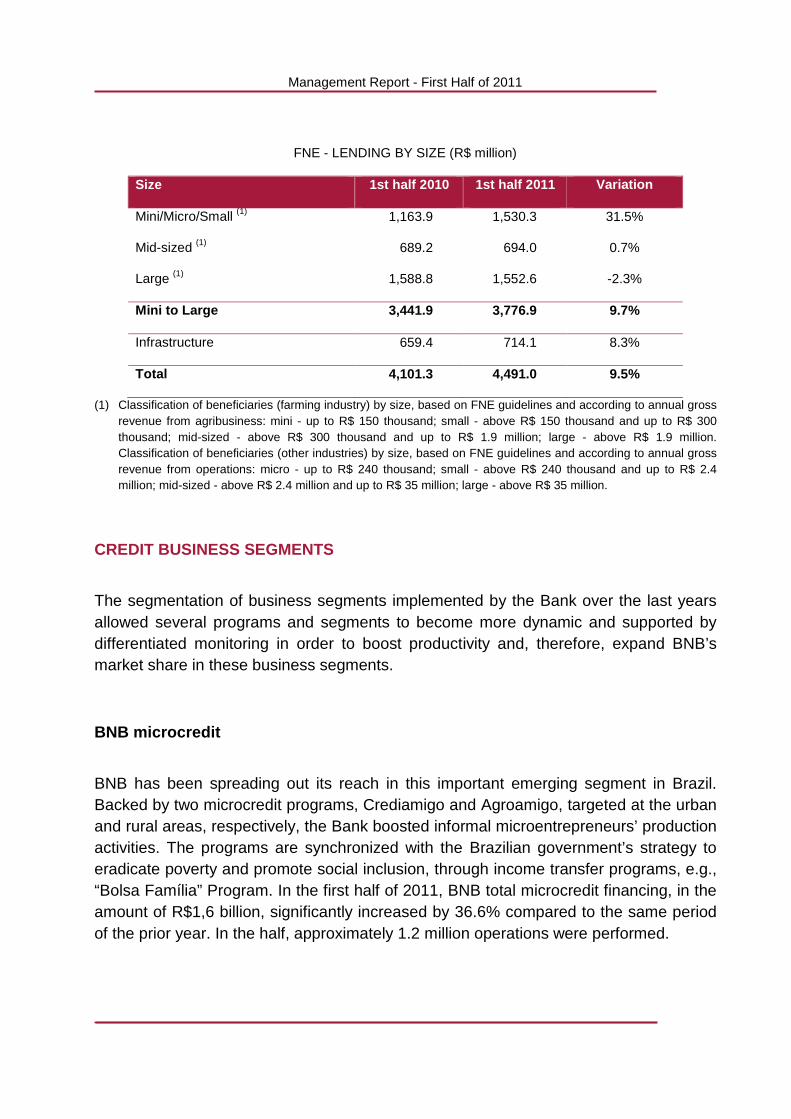
FNE - LENDING BY SIZE (R$ million)
Size 1st half 2010 1st half 2011 Variation
Mini/Micro/Small (1) 1,163.9 1,530.3 31.5%
Mid-sized (1) 689.2 694.0 0.7%
Large (1) 1,588.8 1,552.6 -2.3%
Mini to Large 3,441.9 3,776.9 9.7%
Infrastructure 659.4 714.1 8.3%
Total 4,101.3 4,491.0 9.5%
(1) Classification of beneficiaries (farming industry) by size, based on FNE guidelines and according to annual gross revenue from agribusiness: mini - up to R$ 150 thousand; small - above R$ 150 thousand and up to R$ 300 thousand; mid-sized - above R$ 300 thousand and up to R$ 1.9 million; large - above R$ 1.9 million. Classification of beneficiaries (other industries) by size, based on FNE guidelines and according to annual gross revenue from operations: micro - up to R$ 240 thousand; small - above R$ 240 thousand and up to R$ 2.4 million; mid-sized - above R$ 2.4 million and up to R$ 35 million; large - above R$ 35 million.
CREDIT BUSINESS SEGMENTS
The segmentation of business segments implemented by the Bank over the last years allowed several programs and segments to become more dynamic and supported by differentiated monitoring in order to boost productivity and, therefore, expand BNB’s market share in these business segments.
BNB microcredit
BNB has been spreading out its reach in this important emerging segment in Brazil. Backed by two microcredit programs, Crediamigo and Agroamigo, targeted at the urban and rural areas, respectively, the Bank boosted informal microentrepreneurs’ production activities. The programs are synchronized with the Brazilian government’s strategy to eradicate poverty and promote social inclusion, through income transfer programs, e.g., “Bolsa Família” Program. In the first half of 2011, BNB total microcredit financing, in the amount of R$1,6 billion, significantly increased by 36.6% compared to the same period of the prior year. In the half, approximately 1.2 million operations were performed.
Management Report - First Half of 2011
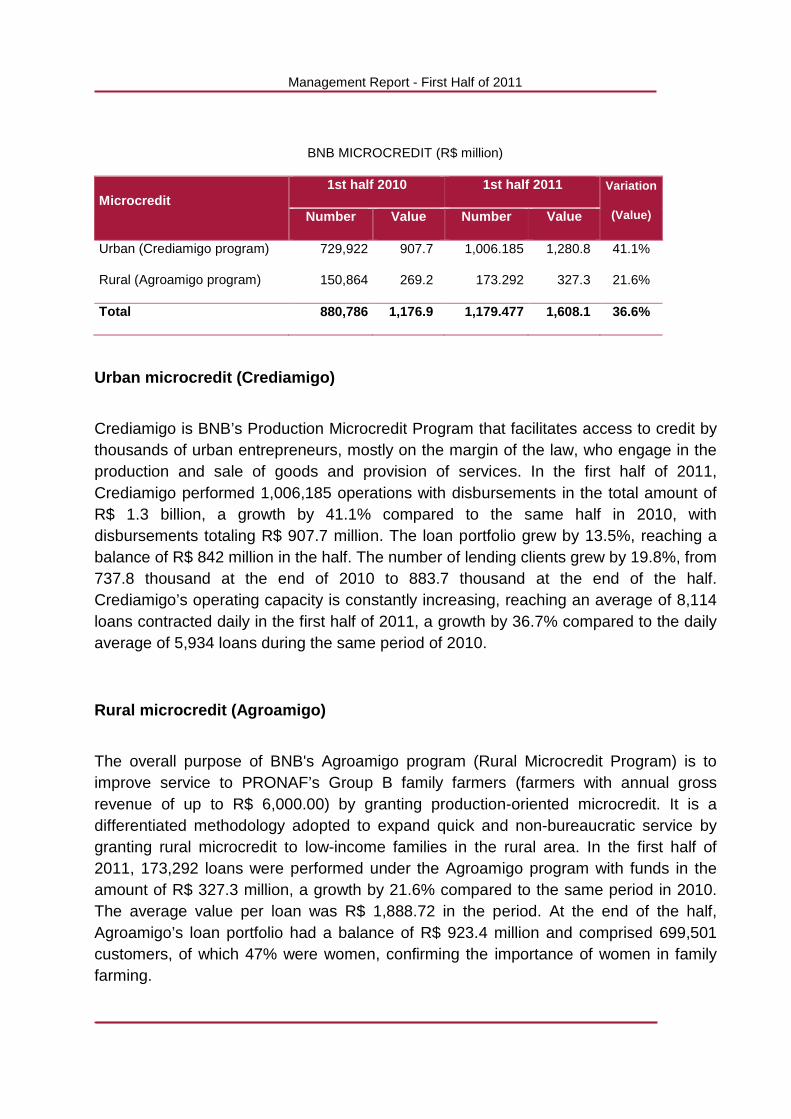
BNB MICROCREDIT (R$ million)
Microcredit 1st half 2010 1st half 2011 Variation
(Value) Number Value Number Value
Urban (Crediamigo program) 729,922 907.7 1,006.185 1,280.8 41.1%
Rural (Agroamigo program) 150,864 269.2 173.292 327.3 21.6%
Total 880,786 1,176.9 1,179.477 1,608.1 36.6%
Urban microcredit (Crediamigo)
Crediamigo is BNB’s Production Microcredit Program that facilitates access to credit by thousands of urban entrepreneurs, mostly on the margin of the law, who engage in the production and sale of goods and provision of services. In the first half of 2011, Crediamigo performed 1,006,185 operations with disbursements in the total amount of R$ 1.3 billion, a growth by 41.1% compared to the same half in 2010, with disbursements totaling R$ 907.7 million. The loan portfolio grew by 13.5%, reaching a balance of R$ 842 million in the half. The number of lending clients grew by 19.8%, from 737.8 thousand at the end of 2010 to 883.7 thousand at the end of the half. Crediamigo’s operating capacity is constantly increasing, reaching an average of 8,114 loans contracted daily in the first half of 2011, a growth by 36.7% compared to the daily average of 5,934 loans during the same period of 2010.
Rural microcredit (Agroamigo)
The overall purpose of BNB's Agroamigo program (Rural Microcredit Program) is to improve service to PRONAF’s Group B family farmers (farmers with annual gross revenue of up to R$ 6,000.00) by granting production-oriented microcredit. It is a differentiated methodology adopted to expand quick and non-bureaucratic service by granting rural microcredit to low-income families in the rural area. In the first half of 2011, 173,292 loans were performed under the Agroamigo program with funds in the amount of R$ 327.3 million, a growth by 21.6% compared to the same period in 2010. The average value per loan was R$ 1,888.72 in the period. At the end of the half, Agroamigo’s loan portfolio had a balance of R$ 923.4 million and comprised 699,501 customers, of which 47% were women, confirming the importance of women in family farming.
Management Report - First Half of 2011
Family farming
The National Family Farming Strengthening Program (PRONAF) is the Federal Government’s program to support family farming, which, in the Northeast, represents 89,1% of the rural establishments in the region, totaling 2,2 million family establishments. This segment employs 6.4 million people in the Northeast region. BNB is PRONAF’s main financial agent in the Northeast, with an active portfolio of R$ 4.6 billion, corresponding to 1.3 million transactions, as at June 30, 2011. In this half, the Bank contracted 193,923 loans, in the total amount of R$ 599.4 million, with family farmers, a growth by 27.6% compared to the same period of 2010. Of the amounts contracted, 65% were granted in the semi-arid climate region.
Mini and small farmers
BNB transacts business with mini and small farmers to strengthen regional economy and eradicate poverty in the rural area. By integrating the credit to the public policies at several governmental levels, the Bank promotes financial and social inclusion, as well as customers’ income improvement in this segment. In the first half of 2011, BNB contracted 4,769 loans, in the total amount of R$ 235.6 million, with mini and small farmers, except for farmers benefiting from Pronaf. Loan portfolio totaled R$ 4.2 billion, representing 179.9 thousand operations.
Micro and small enterprises (MSEs)
In the first half of 2011, BNB set aside short and long-term credit lines in the total amount of R$ 1.5 billion to micro and small enterprises (MSEs). During the same period, 52,847 loans were contracted with 16,669 customers, in the total amount of R$ 1.2 billion, a growth by 25.2% compared to the first half of 2010. Among the measures that contributed to the results obtained in the first half of 2011 are the following: circularization of MPEs' 2011 advertising campaign; franchise business expansion with 36 new trademarks in 2011; BNB’s participation in the 2011 ABF Expo Franchising; and creation of FNE Program - Individual Venturer.
Management Report - First Half of 2011
Businesses with mid-sized and large businesses The corporate segment covers mid-sized and large clients. The segment is comprised of farmers with annual revenue in excess of R$ 300 thousand and companies with annual revenues between R$ 2.4 million and R$ 200 million. The corporate segment manages and structures the businesses of customers with annual revenues in excess of R$ 200 million. During the period, 127 operations were contracted in the corporate segment, totaling R$ 2.1 billion.
Support to the Growth Acceleration Program (PAC) an d 2014 World Cup
BNB operates over the last years in full compliance with the Federal Government’s guidelines, in particular in relation to the financial support provided to the projects developed by the Growth Acceleration Program (PAC). During the first half of 2011, four loans were contracted with FNE’s funds in the amount of R$ 430.0 million. As regards to the financial support to the 2014 World Cup, as set forth in the criteria established by the Ministry of National Integration, in accordance with foreign regulatory bodies, during the first half of 2011, the Bank contracted three loans with FNE - Proatur’s funds, totaling R$ 11.2 million.
Commercial credit transactions
Commercial credit transactions, supplementary to investments, totaled R$ 2,645.8 million in the first half of 2011 and comprise Direct Consumer Credit (CDC) and working capital loans, in the amount of R$ 911.1 million; factoring, in the amount of R$ 455.4 million; and secured accounts, in the amount of R$ 1,279.3 million.
Foreign trade and exchange transactions
In the first half of 2011, total foreign trade transactions contracted grew by 45% compared to the same period in 2010. The amount of R$ 792 million was allocated by several financing sources to the foreign trade transactions performed by the Bank. The credit products comprise financing and issuance of guarantees, such as: Advances on Foreign Exchange Contracts (ACC/ACE), Importing Financing (Finimp) and international guarantees. The aggregate of all foreign exchange transactions during the first half of 2011, including loans, spot foreign exchange services, interbank transactions and currency arbitrage services reached R$ 2.4 billion.
Management Report - First Half of 2011
Capital markets
BNB has supported Northeast companies to access and use capital market instruments, promoting, therefore, the diversification of sources of funds, and contributing to the professional qualification, strengthening the companies’ corporate governance and stimulating the regional development. The Bank participated in the first half of 2011 in the structuring of fixed-income transactions in the amount of R$ 389 million. Accordingly, BNB was ranked ninth in the domestic ranking of origination of fixed-income transactions of the Brazilian capital market of the Brazilian Financial and Capital Markets Association (ANBIMA).
ECONOMIC AND FINANCIAL INDICATORS
Total assets
At the end of the first half of 2011, BNB’s total assets increased by 4.3% as compared to the end of 2010 (see the Total Assets table). The Bank’s assets also include FNE available funds (R$ 1,428 million) and the funds committed to that Fund’s credit operations, i.e., related to contracted transactions pending disbursement (R$ 2,780 million). The increase in BNB’s asset balance (R$ 1,020 million) between December 2010 and June 2011 is mainly represented by the increase in cash and cash equivalents, interbank investments and securities. This resulted from the increase in FNE's net funds and in the volume of Finor’s deposits and deposits for reinvestment, in addition to retained earnings in the first half of 2011.
The balance of BNB’s lending portfolio, less allowance for loan losses, decreased by 2.5% in the first half of 2011 (see Investments by source/program and Lending by Industry tables), mainly due to the following: increase of R$ 107 million in Crediamigo Program’s loans (R$ 878 million as at June 30, 2011 against R$ 771 million as at December 31, 2010); reduction of R$ 315 million in acquisition of payroll loans with co-obligation of the assigning bank (R$ 441 million as at June 30, 2011 and R$ 756 million as at December 31, 2010); increase of R$ 244 million in infrastructure financing (R$ 1,670 million as at June 30, 2011 against R$ 1,426 million as at December 31, 2010); and decrease of R$ 685 million in rural and agroindustrial financing (R$ 1,276 million as at June 30, 2011 against R$ 1,961 million as at December 31, 2010) due to the transfer to memorandum accounts as they relate to loans with funds provided by Fundo de Terra, Incra-Conta Fundiária and Fundo Rotativo de Terras improperly recorded in balance sheet accounts.
Management Report - First Half of 2011
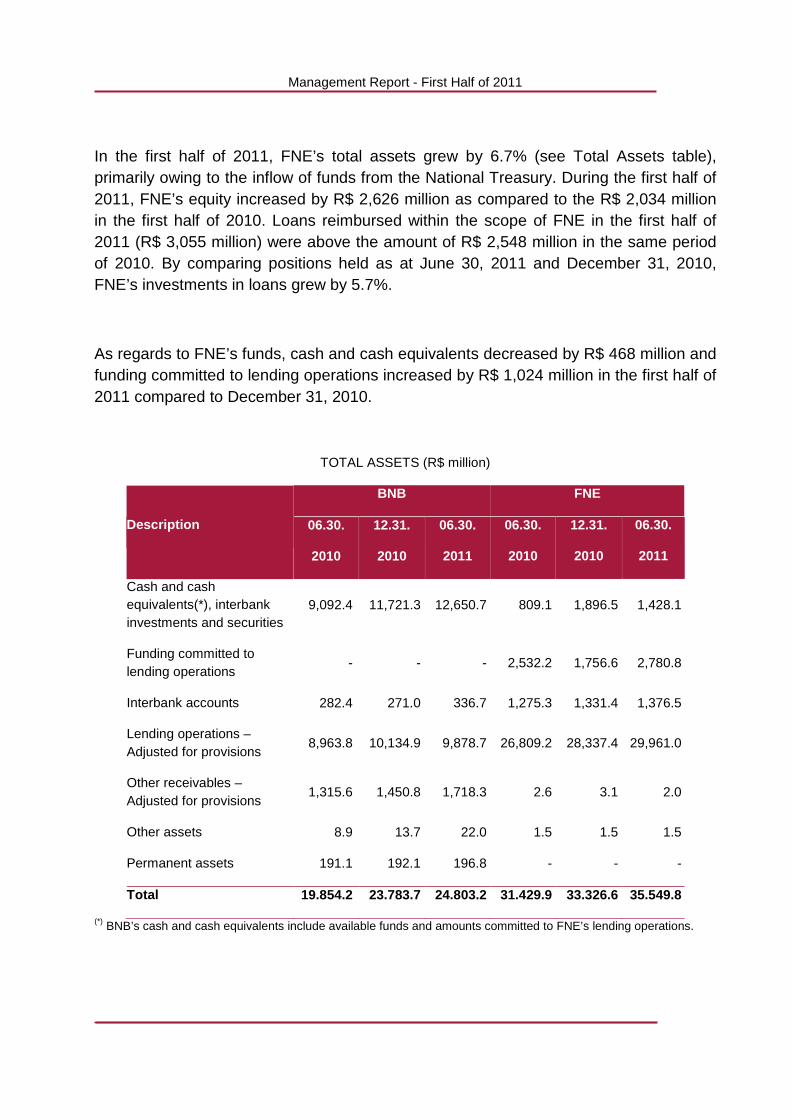
In the first half of 2011, FNE’s total assets grew by 6.7% (see Total Assets table), primarily owing to the inflow of funds from the National Treasury. During the first half of 2011, FNE’s equity increased by R$ 2,626 million as compared to the R$ 2,034 million in the first half of 2010. Loans reimbursed within the scope of FNE in the first half of 2011 (R$ 3,055 million) were above the amount of R$ 2,548 million in the same period of 2010. By comparing positions held as at June 30, 2011 and December 31, 2010, FNE’s investments in loans grew by 5.7%.
As regards to FNE’s funds, cash and cash equivalents decreased by R$ 468 million and funding committed to lending operations increased by R$ 1,024 million in the first half of 2011 compared to December 31, 2010.
TOTAL ASSETS (R$ million)
Description
BNB FNE
06.30.
2010
12.31.
2010
06.30.
2011
06.30.
2010
12.31.
2010
06.30.
2011
Cash and cash equivalents(*), interbank investments and securities
9,092.4 11,721.3 12,650.7 809.1 1,896.5 1,428.1
Funding committed to lending operations
- - - 2,532.2 1,756.6 2,780.8
Interbank accounts 282.4 271.0 336.7 1,275.3 1,331.4 1,376.5
Lending operations – Adjusted for provisions
8,963.8 10,134.9 9,878.7 26,809.2 28,337.4 29,961.0
Other receivables – Adjusted for provisions
1,315.6 1,450.8 1,718.3 2.6 3.1 2.0
Other assets 8.9 13.7 22.0 1.5 1.5 1.5
Permanent assets 191.1 192.1 196.8 - - -
Total 19.854.2 23.783.7 24.803.2 31.429.9 33.326.6 35.549.8
(*) BNB’s cash and cash equivalents include available funds and amounts committed to FNE’s lending operations.
Management Report - First Half of 2011
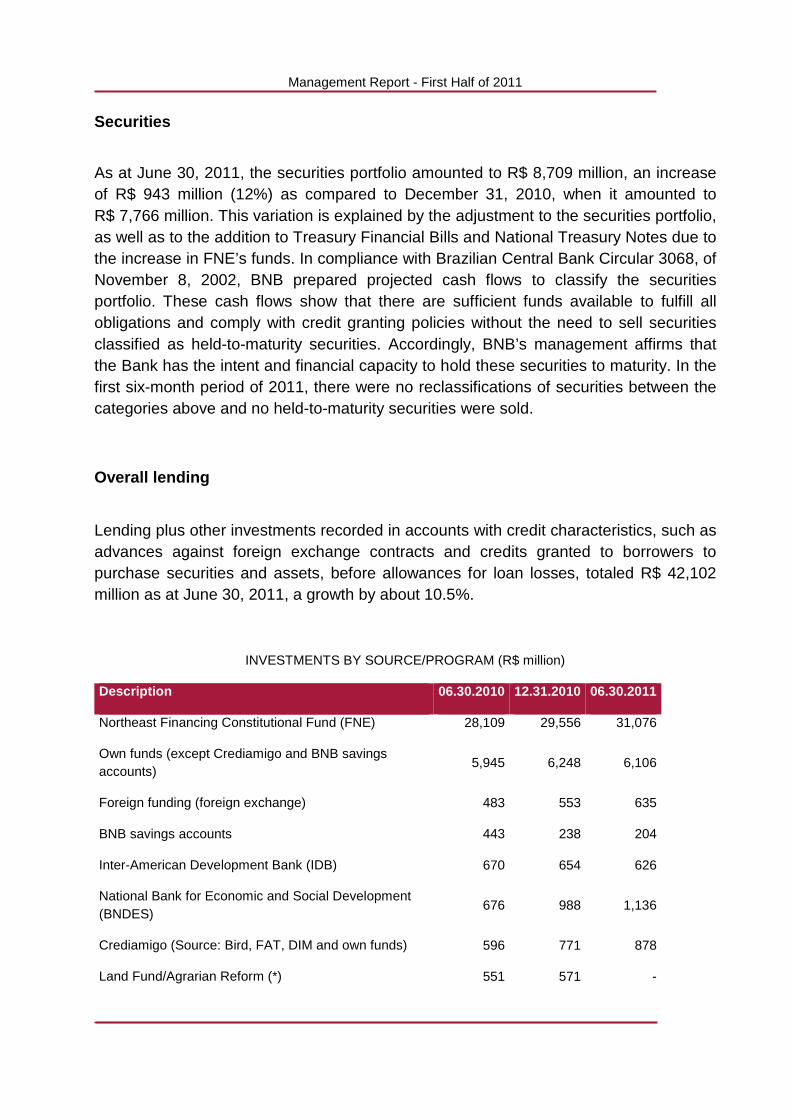
Securities
As at June 30, 2011, the securities portfolio amounted to R$ 8,709 million, an increase of R$ 943 million (12%) as compared to December 31, 2010, when it amounted to R$ 7,766 million. This variation is explained by the adjustment to the securities portfolio, as well as to the addition to Treasury Financial Bills and National Treasury Notes due to the increase in FNE’s funds. In compliance with Brazilian Central Bank Circular 3068, of November 8, 2002, BNB prepared projected cash flows to classify the securities portfolio. These cash flows show that there are sufficient funds available to fulfill all obligations and comply with credit granting policies without the need to sell securities classified as held-to-maturity securities. Accordingly, BNB’s management affirms that the Bank has the intent and financial capacity to hold these securities to maturity. In the first six-month period of 2011, there were no reclassifications of securities between the categories above and no held-to-maturity securities were sold.
Overall lending
Lending plus other investments recorded in accounts with credit characteristics, such as advances against foreign exchange contracts and credits granted to borrowers to purchase securities and assets, before allowances for loan losses, totaled R$ 42,102 million as at June 30, 2011, a growth by about 10.5%.
INVESTMENTS BY SOURCE/PROGRAM (R$ million)
Description 06.30.2010 12.31.2010 06.30.2011
Northeast Financing Constitutional Fund (FNE) 28,109 29,556 31,076
Own funds (except Crediamigo and BNB savings accounts)
5,945 6,248 6,106
Foreign funding (foreign exchange) 483 553 635
BNB savings accounts 443 238 204
Inter-American Development Bank (IDB) 670 654 626
National Bank for Economic and Social Development (BNDES)
676 988 1,136
Crediamigo (Source: Bird, FAT, DIM and own funds) 596 771 878
Land Fund/Agrarian Reform (*) 551 571 -
Management Report - First Half of 2011
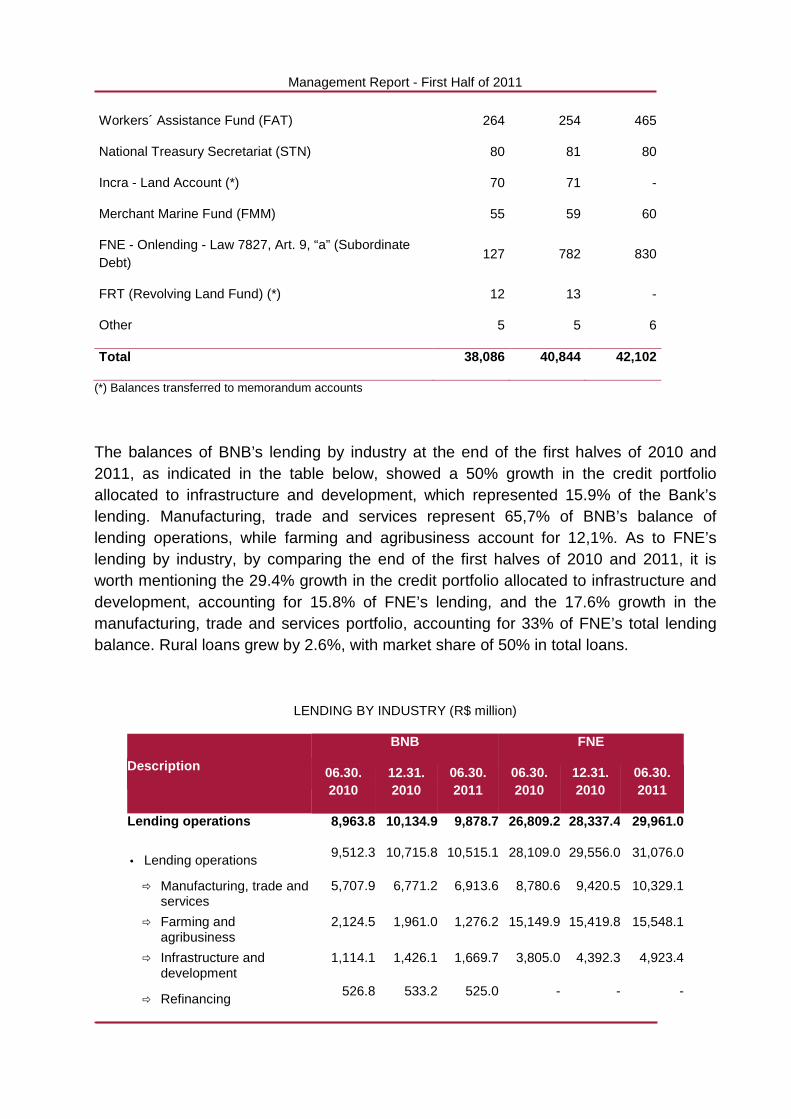
Workers´ Assistance Fund (FAT) 264 254 465
National Treasury Secretariat (STN) 80 81 80
Incra - Land Account (*) 70 71 -
Merchant Marine Fund (FMM) 55 59 60
FNE - Onlending - Law 7827, Art. 9, “a” (Subordinate Debt)
127 782 830
FRT (Revolving Land Fund) (*) 12 13 -
Other 5 5 6
Total 38,086 40,844 42,102
(*) Balances transferred to memorandum accounts
The balances of BNB’s lending by industry at the end of the first halves of 2010 and 2011, as indicated in the table below, showed a 50% growth in the credit portfolio allocated to infrastructure and development, which represented 15.9% of the Bank’s lending. Manufacturing, trade and services represent 65,7% of BNB’s balance of lending operations, while farming and agribusiness account for 12,1%. As to FNE’s lending by industry, by comparing the end of the first halves of 2010 and 2011, it is worth mentioning the 29.4% growth in the credit portfolio allocated to infrastructure and development, accounting for 15.8% of FNE’s lending, and the 17.6% growth in the manufacturing, trade and services portfolio, accounting for 33% of FNE’s total lending balance. Rural loans grew by 2.6%, with market share of 50% in total loans.
LENDING BY INDUSTRY (R$ million)
Description
BNB FNE
06.30. 2010
12.31. 2010
06.30. 2011
06.30. 2010
12.31. 2010
06.30. 2011
Lending operations 8,963.8 10,134.9 9,878.7 26,809.2 28,337.4 29,961.0
• Lending operations 9,512.3 10,715.8 10,515.1 28,109.0 29,556.0 31,076.0
� Manufacturing, trade and services
5,707.9 6,771.2 6,913.6 8,780.6 9,420.5 10,329.1
� Farming and agribusiness
2,124.5 1,961.0 1,276.2 15,149.9 15,419.8 15,548.1
� Infrastructure and development
1,114.1 1,426.1 1,669.7 3,805.0 4,392.3 4,923.4
� Refinancing 526.8 533.2 525.0 - - -
Management Report - First Half of 2011
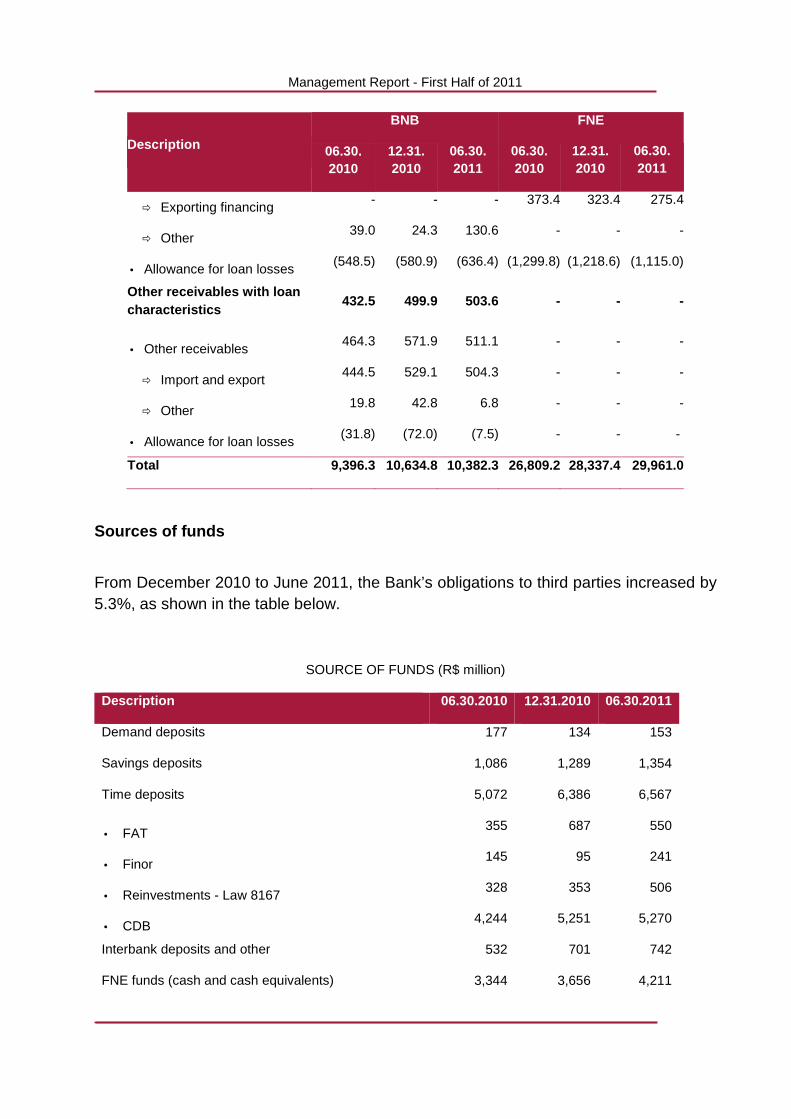
Description
BNB FNE
06.30. 2010
12.31. 2010
06.30. 2011
06.30. 2010
12.31. 2010
06.30. 2011
� Exporting financing - - - 373.4 323.4 275.4
� Other 39.0 24.3 130.6 - - -
• Allowance for loan losses (548.5) (580.9) (636.4) (1,299.8) (1,218.6) (1,115.0)
Other receivables with loan characteristics
432.5 499.9 503.6 - - -
• Other receivables 464.3 571.9 511.1 - - -
� Import and export 444.5 529.1 504.3 - - -
� Other 19.8 42.8 6.8 - - -
• Allowance for loan losses (31.8) (72.0) (7.5) - - -
Total 9,396.3 10,634.8 10,382.3 26,809.2 28,337.4 29,961.0
Sources of funds
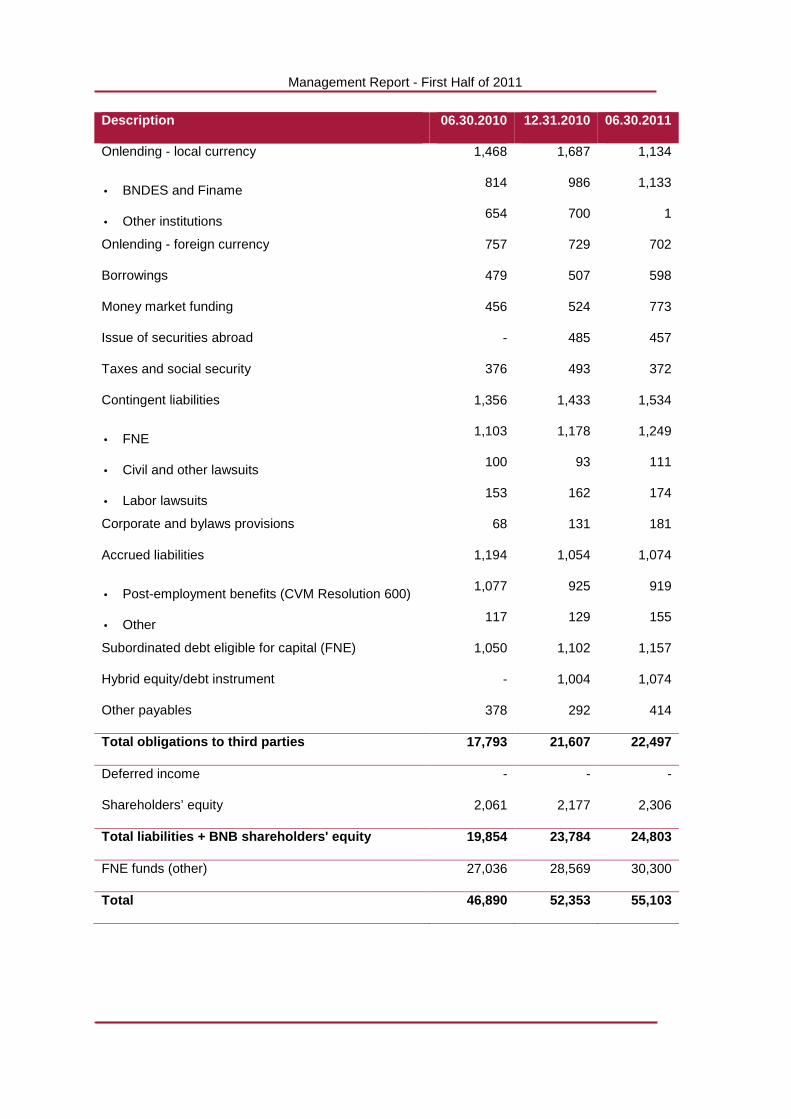
From December 2010 to June 2011, the Bank’s obligations to third parties increased by 5.3%, as shown in the table below.
SOURCE OF FUNDS (R$ million)
Description 06.30.2010 12.31.2010 06.30.2011
Demand deposits 177 134 153
Savings deposits 1,086 1,289 1,354
Time deposits 5,072 6,386 6,567
• FAT 355 687 550
• Finor 145 95 241
• Reinvestments - Law 8167 328 353 506
• CDB 4,244 5,251 5,270
Interbank deposits and other 532 701 742
FNE funds (cash and cash equivalents) 3,344 3,656 4,211
Management Report - First Half of 2011
Description 06.30.2010 12.31.2010 06.30.2011
Onlending - local currency 1,468 1,687 1,134
• BNDES and Finame 814 986 1,133
• Other institutions 654 700 1
Onlending - foreign currency 757 729 702
Borrowings 479 507 598
Money market funding 456 524 773
Issue of securities abroad - 485 457
Taxes and social security 376 493 372
Contingent liabilities 1,356 1,433 1,534
• FNE 1,103 1,178 1,249
• Civil and other lawsuits 100 93 111
• Labor lawsuits 153 162 174
Corporate and bylaws provisions 68 131 181
Accrued liabilities 1,194 1,054 1,074
• Post-employment benefits (CVM Resolution 600) 1,077 925 919
• Other 117 129 155
Subordinated debt eligible for capital (FNE) 1,050 1,102 1,157
Hybrid equity/debt instrument - 1,004 1,074
Other payables 378 292 414
Total obligations to third parties 17,793 21,607 22,497
Deferred income - - -
Shareholders’ equity 2,061 2,177 2,306
Total liabilities + BNB shareholders' equity 19,854 23,784 24,803
FNE funds (other) 27,036 28,569 30,300
Total 46,890 52,353 55,103
Management Report - First Half of 2011
Shareholders’ equity
As at June 30, 2011, BNB’s shareholders' equity was R$ 2,305.7 million (R$ 2,177.3 million as at December 31, 2010) and capital was R$ 2,010.0 million (R$ 1,850.0 million as at December 31, 2010), represented by 87,001,901 book-entry and paid-up shares without par value.
Net income (loss)
In the first half of 2011, BNB’s net income totaled R$ 300.7 million, a growth by 173% compared to the same period in 2010 (R$ 110.1 million). As at June 30, 2010, earnings per share increased from R$ 1.26 to R$ 3.46 as at June 30, 2011. As at June 30, 2011, return on average shareholders’ equity was 28.49% p.a. as at December 31, 2010 and June 30, 2010, this ratio was 14.87% p.a. and 10.87% p.a., respectively.
Capital adequacy ratio
Starting July 1, 2008, the National Monetary Council established, through Resolution 3490 and supplementary regulations, additional requirements for the allocation of capital, including new risk-exposed components. Directives in effect maintained the minimum capital adequacy ratio, which is the ratio of a financial institution’s regulatory capital to total risks assumed in asset transactions, including guarantees provided, and market and operational risks, for June 30, 2011 at 11%. As at June 30, 2011, BNB’s capital adequacy ratio (Basel Index) was 17.23% (13.78% as at June 30, 2010) while Regulatory Capital (PR) was R$ 4,515.8 million (R$ 3,067.8 million as at June 30, 2010). Required Regulatory Capital (PRE), which represents the consolidation of all exposures to risk, with capital allocation ratio of 11%, was R$ 2,833.3 million as at June 30, 2011 (R$ 2,432.6 million as at June 30, 2010). In July 2009 and June 2010, BNB entered into a subordinated debt agreement with FNE and was authorized by the Central Bank of Brazil to consider the amounts under these agreements as Tier II Capital, with positive effects on the Bank’s Basel Ratio. On December 22, 2010, pursuant to Law 12249, of June 11, 2010, as amended by Provisional Act 513, of November 26, 2010, BNB and the Brazilian Government entered into a Loan Agreement, classified as Hybrid Equity and Debt Instrument (IHCD), in the amount of R$ 1 billion, which was fully paid up. On February 21, 2011, through Deorf/Cofil Letter 2011/00979, the Central Bank authorized the classification of such hybrid instrument as Tier II Capital. This agreement has no maturity date.
Management Report - First Half of 2011
International and domestic risk assessment - Rating
In the first half of 2011, the three main international rating agencies upgraded BNB’s rating. In 2010, Moody's Investors Service assigned BNB a global investment grade. At the end of the first half of 2011, the Agency increased BNB’s rating to Baa2 for long-term foreign currency deposit and to Prime-2 for short-term foreign currency deposit. In the domestic market, it has assigned the Aaa.br rating for long-term deposits and BR-1 for short-term deposits. All ratings are stable. In 2010, Fitch assigned BNB a global investment grade. In the first half of 2011, ratings attributed to BNB were improved, where long-term IDR in foreign currency and local currency was rated as ‘BBB’, with a stable perspective. Short-term IDRs, both in foreign and local currency, were rated as “F2”. Long-term and short-term domestic ratings were rated as “AAA(bra)” and “F1+(bra)”, respectively. In accordance with the Agency, this rating reflects BNB's important role in the development of the Northeast region. In the first half of 2011, Standard & Poor’s changed BNB’s rating in the global ranking in foreign currency from “stable” to “positive”, representing BBB-/Positiva/A-3 rating. In domestic currency, the rating was maintained at BBB-/Estável/A-3. In accordance with this Agency’s opinion, BNB plays an important role in the public policies of the Northeast region and is supported by its majority shareholder, the Federal Government.
Convergence with International Accounting Standards
In the first half of 2011, BNB started to disclose its annual financial statements in accordance with International Financial Reporting Standards (IFRS), issued by the International Accounting Standard Board (IASB), in its website. The first available financial statements refer to the year ended December 31, 2010 (as compared to the year ended December 31, 2009).
Management Report - First Half of 2011
TECHNICAL OFFICE OF ECONOMIC STUDIES FOR THE NORTHE AST (ETENE)
BNB, through its Technical Office of Economic Studies for the Northeast (Etene), whose basic responsibilities comprise the preparation, promotion and dissemination of technical and scientific knowledge to support the Bank’s measures in its operational area, aiming at sustainable development, analyzed, in the first half of 2011, the results and effects of the following programs: National Family Farming Strengthening Program - 2009 results and effects; Financing Program to Supplementary Infrastructure of Northeast Region (FNE - Proinfra); FNE - Rural: dairy and beef cattle raising and soybean cultivation activities; National Family Farming Strengthening Program - 2010 results and effects; and 2010 FNE’s Report on Results and Effects. The following projects are under analysis: FNE’s Investment Effects Assessment about Employment Generation between 2000 and 2008; Agroamigo and Crediamigo’s Effects Assessment; FNE Verde’s Assessment; and preparation of a database to determine FNE’s economic effects at municipal level.
Scientific, technology and development funds
As regards to the three research sponsored funds - Science and Technology Development Fund (Fundeci), Northeast Socioeconomic Activities Support Fund (Fase) and Regional Development Fund (FDR) - BNB invested R$ 18.2 million in 381 projects in the first half of 2011.
GOVERNANCE AND RISK MANAGEMENT
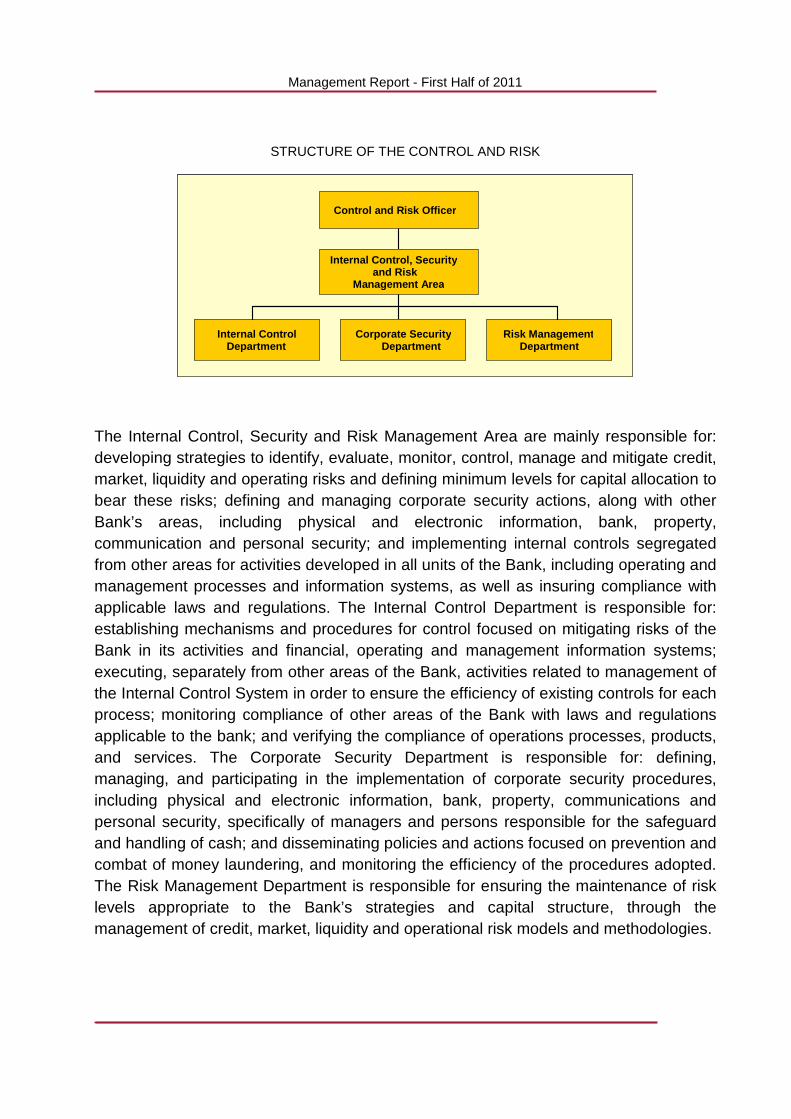
BNB’s organizational structure is designed based on corporate governance principles intended to ensure its organization’s soundness through appropriate management of the risks involved and generation of profits. The Bank has a specific officer to handle control and risks, in compliance with National Monetary Council (CMN) Resolutions 3380, 3464 and 3721, which establish that financial institutions must implement an operational, market and credit risk management structure. The Internal Control, Security and Risk Management Area, which reports to such specific officer in charge of Control and Risks, is responsible for overseeing three departments: Internal Control, Corporate Security and Risk Management.
Management Report - First Half of 2011
STRUCTURE OF THE CONTROL AND RISK
The Internal Control, Security and Risk Management Area are mainly responsible for: developing strategies to identify, evaluate, monitor, control, manage and mitigate credit, market, liquidity and operating risks and defining minimum levels for capital allocation to bear these risks; defining and managing corporate security actions, along with other Bank’s areas, including physical and electronic information, bank, property, communication and personal security; and implementing internal controls segregated from other areas for activities developed in all units of the Bank, including operating and management processes and information systems, as well as insuring compliance with applicable laws and regulations. The Internal Control Department is responsible for: establishing mechanisms and procedures for control focused on mitigating risks of the Bank in its activities and financial, operating and management information systems; executing, separately from other areas of the Bank, activities related to management of the Internal Control System in order to ensure the efficiency of existing controls for each process; monitoring compliance of other areas of the Bank with laws and regulations applicable to the bank; and verifying the compliance of operations processes, products, and services. The Corporate Security Department is responsible for: defining, managing, and participating in the implementation of corporate security procedures, including physical and electronic information, bank, property, communications and personal security, specifically of managers and persons responsible for the safeguard and handling of cash; and disseminating policies and actions focused on prevention and combat of money laundering, and monitoring the efficiency of the procedures adopted. The Risk Management Department is responsible for ensuring the maintenance of risk levels appropriate to the Bank’s strategies and capital structure, through the management of credit, market, liquidity and operational risk models and methodologies.
Diretoria de Controle e Risco
Área de Controles Internos, Segurança
e Gestão de Riscos
Ambiente deSegurança Corporativa
Ambiente de Controles Internos
Ambiente de
Gestão de Riscos
Control and Risk Officer
Internal Control, Security and Risk
Management Area
Corporate SecurityDepartment
Internal ControlDepartment
Risk ManagementDepartment
Management Report - First Half of 2011
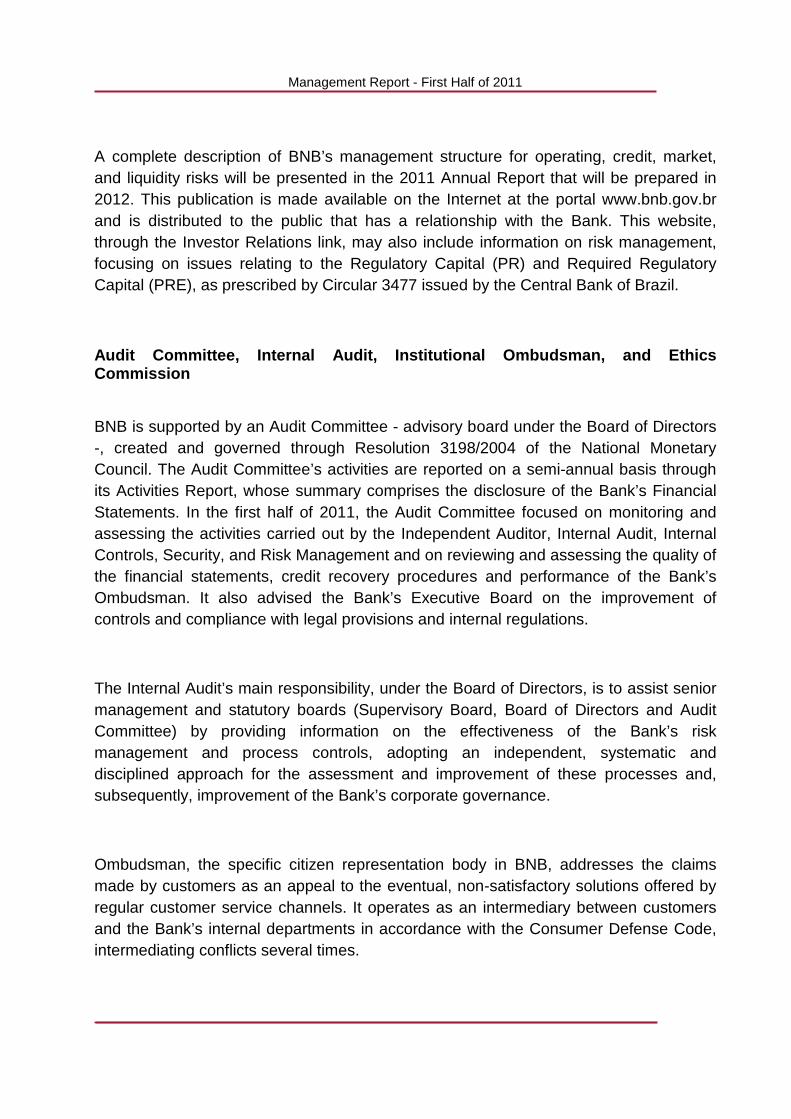
A complete description of BNB’s management structure for operating, credit, market, and liquidity risks will be presented in the 2011 Annual Report that will be prepared in 2012. This publication is made available on the Internet at the portal www.bnb.gov.br and is distributed to the public that has a relationship with the Bank. This website, through the Investor Relations link, may also include information on risk management, focusing on issues relating to the Regulatory Capital (PR) and Required Regulatory Capital (PRE), as prescribed by Circular 3477 issued by the Central Bank of Brazil.
Audit Committee, Internal Audit, Institutional Ombu dsman, and Ethics Commission
BNB is supported by an Audit Committee - advisory board under the Board of Directors -, created and governed through Resolution 3198/2004 of the National Monetary Council. The Audit Committee’s activities are reported on a semi-annual basis through its Activities Report, whose summary comprises the disclosure of the Bank’s Financial Statements. In the first half of 2011, the Audit Committee focused on monitoring and assessing the activities carried out by the Independent Auditor, Internal Audit, Internal Controls, Security, and Risk Management and on reviewing and assessing the quality of the financial statements, credit recovery procedures and performance of the Bank’s Ombudsman. It also advised the Bank’s Executive Board on the improvement of controls and compliance with legal provisions and internal regulations.
The Internal Audit’s main responsibility, under the Board of Directors, is to assist senior management and statutory boards (Supervisory Board, Board of Directors and Audit Committee) by providing information on the effectiveness of the Bank’s risk management and process controls, adopting an independent, systematic and disciplined approach for the assessment and improvement of these processes and, subsequently, improvement of the Bank’s corporate governance.
Ombudsman, the specific citizen representation body in BNB, addresses the claims made by customers as an appeal to the eventual, non-satisfactory solutions offered by regular customer service channels. It operates as an intermediary between customers and the Bank’s internal departments in accordance with the Consumer Defense Code, intermediating conflicts several times.
Management Report - First Half of 2011
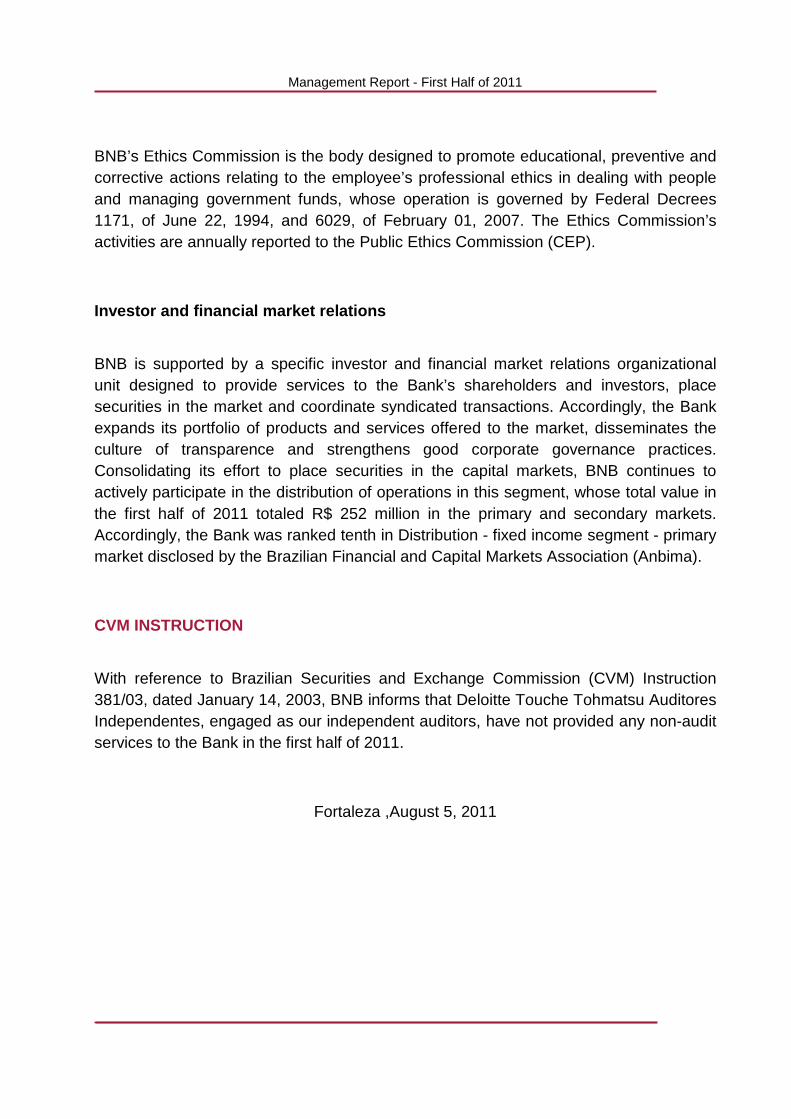
BNB’s Ethics Commission is the body designed to promote educational, preventive and corrective actions relating to the employee’s professional ethics in dealing with people and managing government funds, whose operation is governed by Federal Decrees 1171, of June 22, 1994, and 6029, of February 01, 2007. The Ethics Commission’s activities are annually reported to the Public Ethics Commission (CEP).
Investor and financial market relations
BNB is supported by a specific investor and financial market relations organizational unit designed to provide services to the Bank’s shareholders and investors, place securities in the market and coordinate syndicated transactions. Accordingly, the Bank expands its portfolio of products and services offered to the market, disseminates the culture of transparence and strengthens good corporate governance practices. Consolidating its effort to place securities in the capital markets, BNB continues to actively participate in the distribution of operations in this segment, whose total value in the first half of 2011 totaled R$ 252 million in the primary and secondary markets. Accordingly, the Bank was ranked tenth in Distribution - fixed income segment - primary market disclosed by the Brazilian Financial and Capital Markets Association (Anbima).
CVM INSTRUCTION
With reference to Brazilian Securities and Exchange Commission (CVM) Instruction 381/03, dated January 14, 2003, BNB informs that Deloitte Touche Tohmatsu Auditores Independentes, engaged as our independent auditors, have not provided any non-audit services to the Bank in the first half of 2011.
Fortaleza ,August 5, 2011
BANCO DO NORDESTE DO BRASIL S,A,
BALANCE SHEETS AS AT JUNE 30, 2011 AND 2010
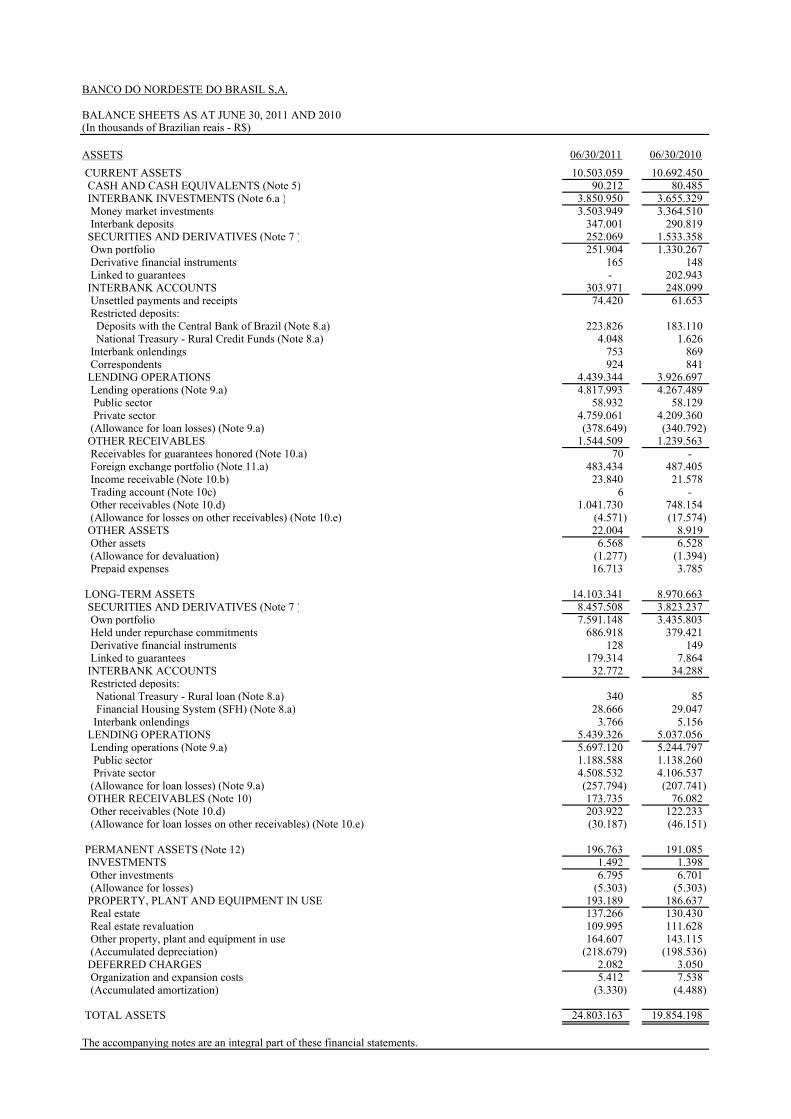
ASSETS 06/30/2011 06/30/2010 CURRENT ASSETS 10.503.059 10.692.450 CASH AND CASH EQUIVALENTS (Note 5) 90.212 80.485 INTERBANK INVESTMENTS (Note 6.a ) 3.850.950 3.655.329 Money market investments 3.503.949 3.364.510 Interbank deposits 347.001 290.819 SECURITIES AND DERIVATIVES (Note 7 ) 252.069 1.533.358 Own portfolio 251.904 1.330.267 Derivative financial instruments 165 148 Linked to guarantees - 202.943 INTERBANK ACCOUNTS 303.971 248.099 Unsettled payments and receipts 74.420 61.653 Restricted deposits: Deposits with the Central Bank of Brazil (Note 8.a) 223.826 183.110 National Treasury - Rural Credit Funds (Note 8.a) 4.048 1.626 Interbank onlendings 753 869 Correspondents 924 841 LENDING OPERATIONS 4.439.344 3.926.697 Lending operations (Note 9.a) 4.817.993 4.267.489 Public sector 58.932 58.129 Private sector 4.759.061 4.209.360 (Allowance for loan losses) (Note 9.a) (378.649) (340.792) OTHER RECEIVABLES 1.544.509 1.239.563 Receivables for guarantees honored (Note 10.a) 70 - Foreign exchange portfolio (Note 11.a) 483.434 487.405 Income receivable (Note 10.b) 23.840 21.578 Trading account (Note 10c) 6 - Other receivables (Note 10.d) 1.041.730 748.154 (Allowance for losses on other receivables) (Note 10.e) (4.571) (17.574) OTHER ASSETS 22.004 8.919 Other assets 6.568 6.528 (Allowance for devaluation) (1.277) (1.394) Prepaid expenses 16.713 3.785
LONG-TERM ASSETS 14.103.341 8.970.663 SECURITIES AND DERIVATIVES (Note 7 ) 8.457.508 3.823.237 Own portfolio 7.591.148 3.435.803 Held under repurchase commitments 686.918 379.421 Derivative financial instruments 128 149 Linked to guarantees 179.314 7.864 INTERBANK ACCOUNTS 32.772 34.288 Restricted deposits: National Treasury - Rural loan (Note 8.a) 340 85 Financial Housing System (SFH) (Note 8.a) 28.666 29.047 Interbank onlendings 3.766 5.156 LENDING OPERATIONS 5.439.326 5.037.056 Lending operations (Note 9.a) 5.697.120 5.244.797 Public sector 1.188.588 1.138.260 Private sector 4.508.532 4.106.537 (Allowance for loan losses) (Note 9.a) (257.794) (207.741) OTHER RECEIVABLES (Note 10) 173.735 76.082 Other receivables (Note 10.d) 203.922 122.233 (Allowance for loan losses on other receivables) (Note 10.e) (30.187) (46.151)
PERMANENT ASSETS (Note 12) 196.763 191.085 INVESTMENTS 1.492 1.398 Other investments 6.795 6.701 (Allowance for losses) (5.303) (5.303) PROPERTY, PLANT AND EQUIPMENT IN USE 193.189 186.637 Real estate 137.266 130.430 Real estate revaluation 109.995 111.628 Other property, plant and equipment in use 164.607 143.115 (Accumulated depreciation) (218.679) (198.536) DEFERRED CHARGES 2.082 3.050 Organization and expansion costs 5.412 7.538 (Accumulated amortization) (3.330) (4.488)
TOTAL ASSETS 24.803.163 19.854.198
The accompanying notes are an integral part of these financial statements.
(In thousands of Brazilian reais - R$)
BALANCE SHEETS AS AT JUNE 30, 2011 AND 2010
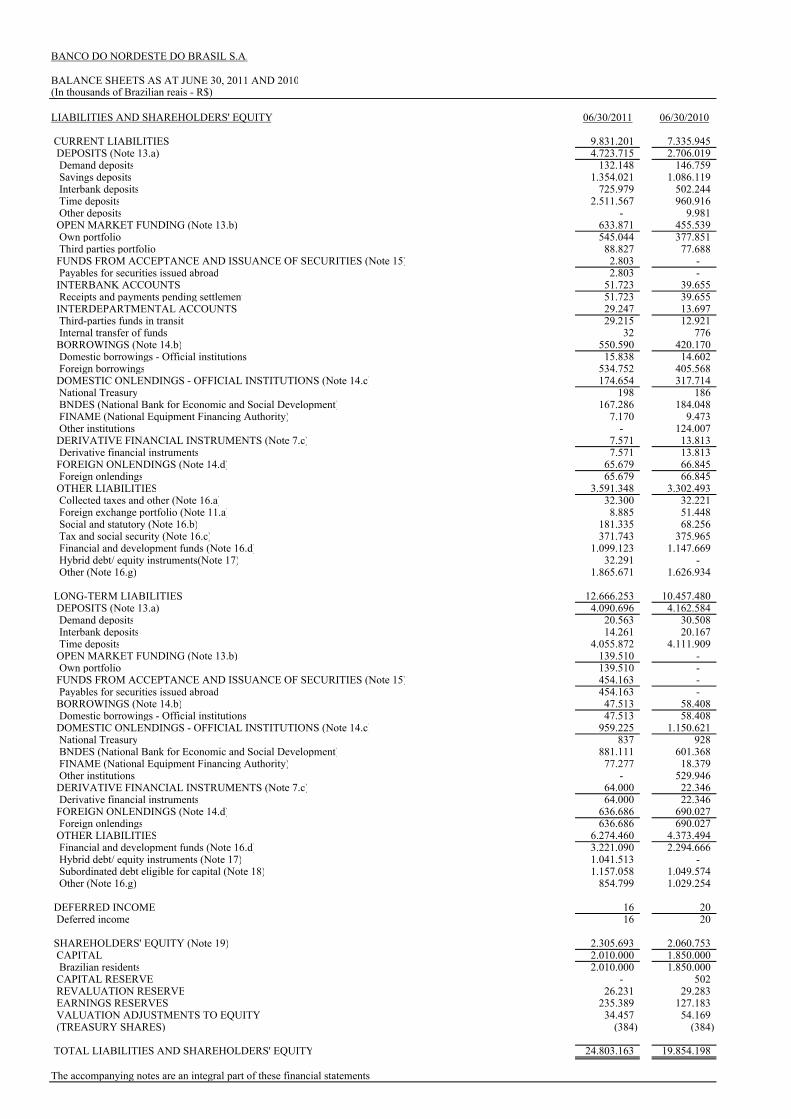
LIABILITIES AND SHAREHOLDERS' EQUITY 06/30/2011 06/30/2010
CURRENT LIABILITIES 9.831.201 7.335.945 DEPOSITS (Note 13.a) 4.723.715 2.706.019 Demand deposits 132.148 146.759 Savings deposits 1.354.021 1.086.119 Interbank deposits 725.979 502.244 Time deposits 2.511.567 960.916 Other deposits - 9.981 OPEN MARKET FUNDING (Note 13.b) 633.871 455.539 Own portfolio 545.044 377.851 Third parties portfolio 88.827 77.688 FUNDS FROM ACCEPTANCE AND ISSUANCE OF SECURITIES (Note 15) 2.803 - Payables for securities issued abroad 2.803 - INTERBANK ACCOUNTS 51.723 39.655 Receipts and payments pending settlement 51.723 39.655 INTERDEPARTMENTAL ACCOUNTS 29.247 13.697 Third-parties funds in transit 29.215 12.921 Internal transfer of funds 32 776 BORROWINGS (Note 14.b) 550.590 420.170 Domestic borrowings - Official institutions 15.838 14.602 Foreign borrowings 534.752 405.568 DOMESTIC ONLENDINGS - OFFICIAL INSTITUTIONS (Note 14.c) 174.654 317.714 National Treasury 198 186 BNDES (National Bank for Economic and Social Development) 167.286 184.048 FINAME (National Equipment Financing Authority) 7.170 9.473 Other institutions - 124.007 DERIVATIVE FINANCIAL INSTRUMENTS (Note 7.c) 7.571 13.813 Derivative financial instruments 7.571 13.813 FOREIGN ONLENDINGS (Note 14.d) 65.679 66.845 Foreign onlendings 65.679 66.845 OTHER LIABILITIES 3.591.348 3.302.493 Collected taxes and other (Note 16.a) 32.300 32.221 Foreign exchange portfolio (Note 11.a) 8.885 51.448 Social and statutory (Note 16.b) 181.335 68.256 Tax and social security (Note 16.c) 371.743 375.965 Financial and development funds (Note 16.d) 1.099.123 1.147.669 Hybrid debt/ equity instruments(Note 17) 32.291 - Other (Note 16.g) 1.865.671 1.626.934
LONG-TERM LIABILITIES 12.666.253 10.457.480 DEPOSITS (Note 13.a) 4.090.696 4.162.584 Demand deposits 20.563 30.508 Interbank deposits 14.261 20.167 Time deposits 4.055.872 4.111.909 OPEN MARKET FUNDING (Note 13.b) 139.510 - Own portfolio 139.510 - FUNDS FROM ACCEPTANCE AND ISSUANCE OF SECURITIES (Note 15) 454.163 - Payables for securities issued abroad 454.163 - BORROWINGS (Note 14.b) 47.513 58.408 Domestic borrowings - Official institutions 47.513 58.408 DOMESTIC ONLENDINGS - OFFICIAL INSTITUTIONS (Note 14.c) 959.225 1.150.621 National Treasury 837 928 BNDES (National Bank for Economic and Social Development) 881.111 601.368 FINAME (National Equipment Financing Authority) 77.277 18.379 Other institutions - 529.946 DERIVATIVE FINANCIAL INSTRUMENTS (Note 7.c) 64.000 22.346 Derivative financial instruments 64.000 22.346 FOREIGN ONLENDINGS (Note 14.d) 636.686 690.027 Foreign onlendings 636.686 690.027 OTHER LIABILITIES 6.274.460 4.373.494 Financial and development funds (Note 16.d) 3.221.090 2.294.666 Hybrid debt/ equity instruments (Note 17) 1.041.513 - Subordinated debt eligible for capital (Note 18) 1.157.058 1.049.574 Other (Note 16.g) 854.799 1.029.254
DEFERRED INCOME 16 20 Deferred income 16 20
SHAREHOLDERS' EQUITY (Note 19) 2.305.693 2.060.753 CAPITAL 2.010.000 1.850.000 Brazilian residents 2.010.000 1.850.000 CAPITAL RESERVE - 502 REVALUATION RESERVE 26.231 29.283 EARNINGS RESERVES 235.389 127.183 VALUATION ADJUSTMENTS TO EQUITY 34.457 54.169 (TREASURY SHARES) (384) (384)
TOTAL LIABILITIES AND SHAREHOLDERS' EQUITY 24.803.163 19.854.198
The accompanying notes are an integral part of these financial statements
BANCO DO NORDESTE DO BRASIL S.A.
(In thousands of Brazilian reais - R$)
BANCO DO NORDESTE DO BRASIL S,A,
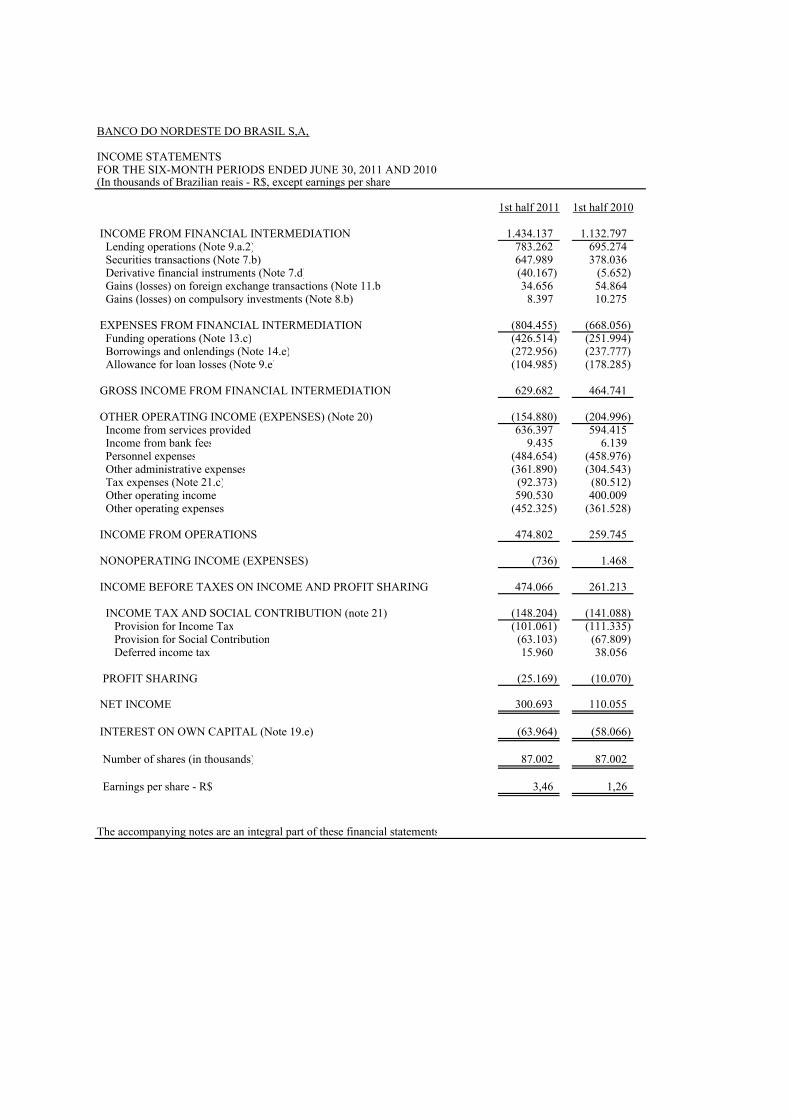
INCOME STATEMENTSFOR THE SIX-MONTH PERIODS ENDED JUNE 30, 2011 AND 2010(In thousands of Brazilian reais - R$, except earnings per share)
1st half 2011 1st half 2010
INCOME FROM FINANCIAL INTERMEDIATION 1.434.137 1.132.797 Lending operations (Note 9.a.2) 783.262 695.274 Securities transactions (Note 7.b) 647.989 378.036 Derivative financial instruments (Note 7.d) (40.167) (5.652) Gains (losses) on foreign exchange transactions (Note 11.b) 34.656 54.864 Gains (losses) on compulsory investments (Note 8.b) 8.397 10.275
EXPENSES FROM FINANCIAL INTERMEDIATION (804.455) (668.056) Funding operations (Note 13.c) (426.514) (251.994) Borrowings and onlendings (Note 14.e) (272.956) (237.777) Allowance for loan losses (Note 9.e) (104.985) (178.285)
GROSS INCOME FROM FINANCIAL INTERMEDIATION 629.682 464.741
OTHER OPERATING INCOME (EXPENSES) (Note 20) (154.880) (204.996) Income from services provided 636.397 594.415 Income from bank fees 9.435 6.139 Personnel expenses (484.654) (458.976) Other administrative expenses (361.890) (304.543) Tax expenses (Note 21.c) (92.373) (80.512) Other operating income 590.530 400.009 Other operating expenses (452.325) (361.528)
INCOME FROM OPERATIONS 474.802 259.745
NONOPERATING INCOME (EXPENSES) (736) 1.468
INCOME BEFORE TAXES ON INCOME AND PROFIT SHARING 474.066 261.213
INCOME TAX AND SOCIAL CONTRIBUTION (note 21) (148.204) (141.088) Provision for Income Tax (101.061) (111.335) Provision for Social Contribution (63.103) (67.809) Deferred income tax 15.960 38.056
PROFIT SHARING (25.169) (10.070)
NET INCOME 300.693 110.055
INTEREST ON OWN CAPITAL (Note 19.e) (63.964) (58.066)
Number of shares (in thousands) 87.002 87.002
Earnings per share - R$ 3,46 1,26
The accompanying notes are an integral part of these financial statements
BANCO DO NORDESTE DO BRASIL S,A,
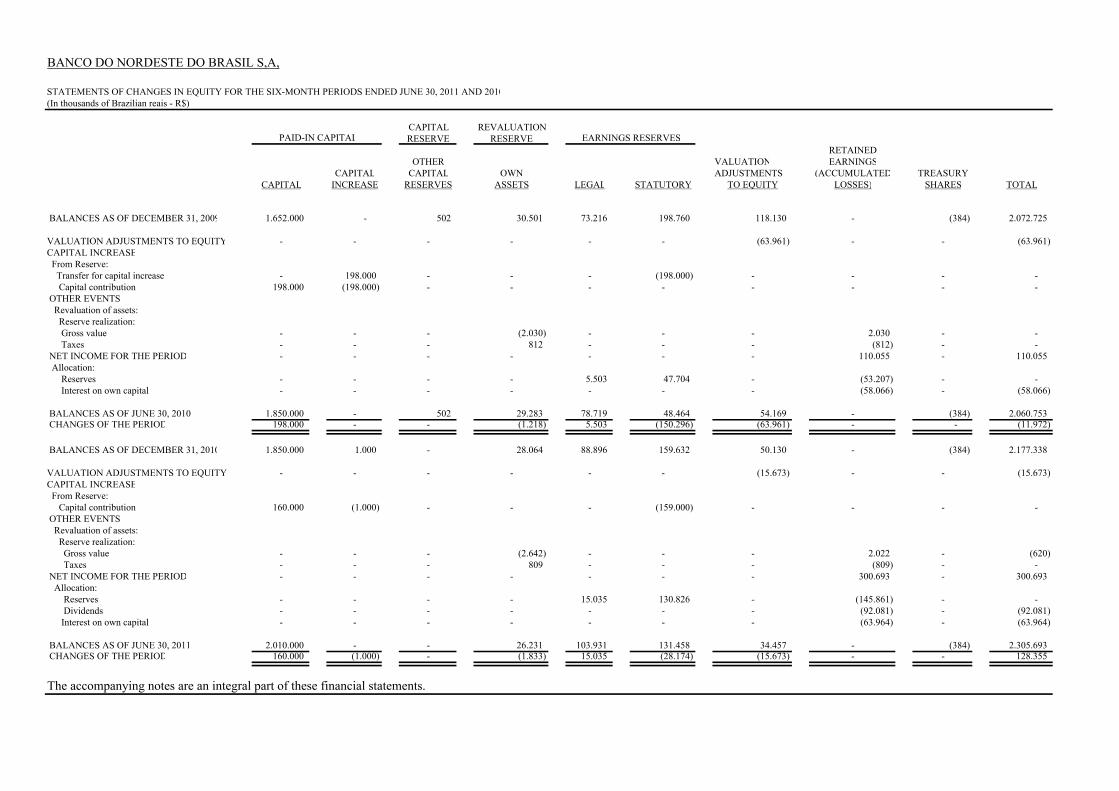
STATEMENTS OF CHANGES IN EQUITY FOR THE SIX-MONTH PERIODS ENDED JUNE 30, 2011 AND 2010(In thousands of Brazilian reais - R$)
CAPITAL REVALUATION RESERVE RESERVE
RETAINED OTHER VALUATION EARNINGS
CAPITAL CAPITAL OWN ADJUSTMENTS (ACCUMULATED TREASURYCAPITAL INCREASE RESERVES ASSETS LEGAL STATUTORY TO EQUITY LOSSES) SHARES TOTAL
BALANCES AS OF DECEMBER 31, 2009 1.652.000 - 502 30.501 73.216 198.760 118.130 - (384) 2.072.725
VALUATION ADJUSTMENTS TO EQUITY - - - - - - (63.961) - - (63.961)CAPITAL INCREASE From Reserve: Transfer for capital increase - 198.000 - - - (198.000) - - - - Capital contribution 198.000 (198.000) - - - - - - - - OTHER EVENTS Revaluation of assets: Reserve realization: Gross value - - - (2.030) - - - 2.030 - - Taxes - - - 812 - - - (812) - - NET INCOME FOR THE PERIOD - - - - - - - 110.055 - 110.055 Allocation: Reserves - - - - 5.503 47.704 - (53.207) - - Interest on own capital - - - - - - - (58.066) - (58.066)
BALANCES AS OF JUNE 30, 2010 1.850.000 - 502 29.283 78.719 48.464 54.169 - (384) 2.060.753 CHANGES OF THE PERIOD 198.000 - - (1.218) 5.503 (150.296) (63.961) - - (11.972)
BALANCES AS OF DECEMBER 31, 2010 1.850.000 1.000 - 28.064 88.896 159.632 50.130 - (384) 2.177.338
VALUATION ADJUSTMENTS TO EQUITY - - - - - - (15.673) - - (15.673) CAPITAL INCREASE From Reserve: Capital contribution 160.000 (1.000) - - - (159.000) - - - - OTHER EVENTS Revaluation of assets: Reserve realization: Gross value - - - (2.642) - - - 2.022 - (620) Taxes - - - 809 - - - (809) - - NET INCOME FOR THE PERIOD - - - - - - - 300.693 - 300.693 Allocation: Reserves - - - - 15.035 130.826 - (145.861) - - Dividends - - - - - - - (92.081) - (92.081) Interest on own capital - - - - - - - (63.964) - (63.964)
BALANCES AS OF JUNE 30, 2011 2.010.000 - - 26.231 103.931 131.458 34.457 - (384) 2.305.693 CHANGES OF THE PERIOD 160.000 (1.000) - (1.833) 15.035 (28.174) (15.673) - - 128.355
The accompanying notes are an integral part of these financial statements.
PAID-IN CAPITAL EARNINGS RESERVES
BANCO DO NORDESTE DO BRASIL S,A,
FOR THE SIX-MONTH PERIODS ENDED JUNE 30, 2011 AND 2010
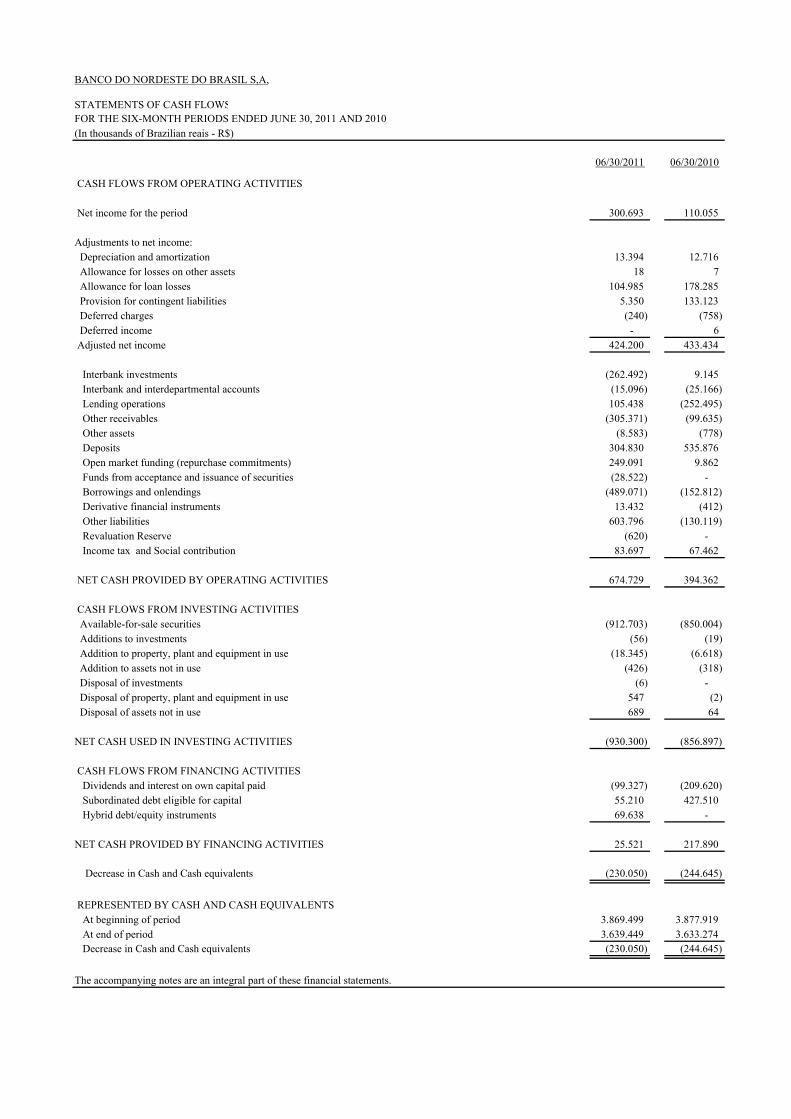
06/30/2011 06/30/2010
CASH FLOWS FROM OPERATING ACTIVITIES
Net income for the period 300.693 110.055
Adjustments to net income: Depreciation and amortization 13.394 12.716 Allowance for losses on other assets 18 7 Allowance for loan losses 104.985 178.285 Provision for contingent liabilities 5.350 133.123 Deferred charges (240) (758) Deferred income - 6 Adjusted net income 424.200 433.434
Interbank investments (262.492) 9.145 Interbank and interdepartmental accounts (15.096) (25.166) Lending operations 105.438 (252.495) Other receivables (305.371) (99.635) Other assets (8.583) (778) Deposits 304.830 535.876 Open market funding (repurchase commitments) 249.091 9.862 Funds from acceptance and issuance of securities (28.522) - Borrowings and onlendings (489.071) (152.812) Derivative financial instruments 13.432 (412) Other liabilities 603.796 (130.119) Revaluation Reserve (620) - Income tax and Social contribution 83.697 67.462
NET CASH PROVIDED BY OPERATING ACTIVITIES 674.729 394.362
CASH FLOWS FROM INVESTING ACTIVITIES Available-for-sale securities (912.703) (850.004) Additions to investments (56) (19) Addition to property, plant and equipment in use (18.345) (6.618) Addition to assets not in use (426) (318) Disposal of investments (6) - Disposal of property, plant and equipment in use 547 (2) Disposal of assets not in use 689 64
NET CASH USED IN INVESTING ACTIVITIES (930.300) (856.897)
CASH FLOWS FROM FINANCING ACTIVITIES Dividends and interest on own capital paid (99.327) (209.620) Subordinated debt eligible for capital 55.210 427.510 Hybrid debt/equity instruments 69.638 -
NET CASH PROVIDED BY FINANCING ACTIVITIES 25.521 217.890
Decrease in Cash and Cash equivalents (230.050) (244.645)
REPRESENTED BY CASH AND CASH EQUIVALENTS At beginning of period 3.869.499 3.877.919 At end of period 3.639.449 3.633.274 Decrease in Cash and Cash equivalents (230.050) (244.645)
The accompanying notes are an integral part of these financial statements.
STATEMENTS OF CASH FLOWS
(In thousands of Brazilian reais - R$)
BANCO DO NORDESTE DO BRASIL S,A,
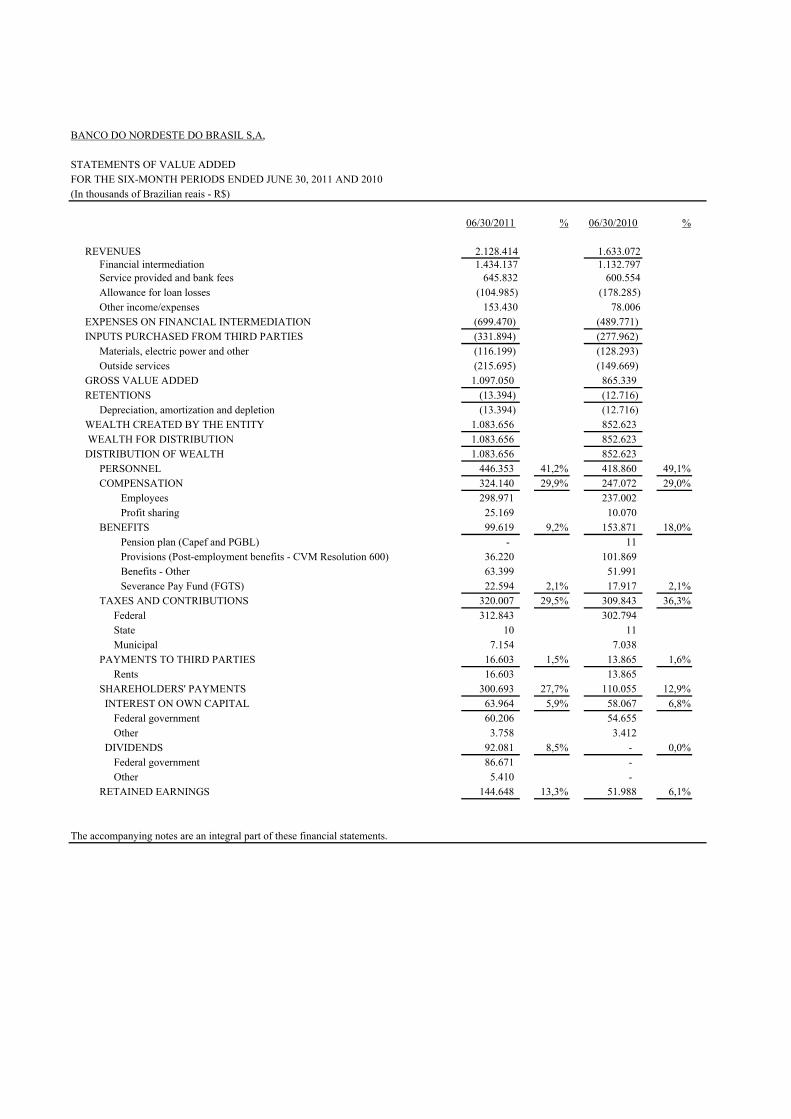
FOR THE SIX-MONTH PERIODS ENDED JUNE 30, 2011 AND 2010
06/30/2011 % 06/30/2010 %
REVENUES 2.128.414 1.633.072 Financial intermediation 1.434.137 1.132.797 Service provided and bank fees 645.832 600.554 Allowance for loan losses (104.985) (178.285)Other income/expenses 153.430 78.006
EXPENSES ON FINANCIAL INTERMEDIATION (699.470) (489.771)INPUTS PURCHASED FROM THIRD PARTIES (331.894) (277.962)
Materials, electric power and other (116.199) (128.293)Outside services (215.695) (149.669)
GROSS VALUE ADDED 1.097.050 865.339 RETENTIONS (13.394) (12.716)
Depreciation, amortization and depletion (13.394) (12.716)WEALTH CREATED BY THE ENTITY 1.083.656 852.623 WEALTH FOR DISTRIBUTION 1.083.656 852.623 DISTRIBUTION OF WEALTH 1.083.656 852.623
PERSONNEL 446.353 41,2% 418.860 49,1%COMPENSATION 324.140 29,9% 247.072 29,0% Employees 298.971 237.002 Profit sharing 25.169 10.070 BENEFITS 99.619 9,2% 153.871 18,0% Pension plan (Capef and PGBL) - 11 Provisions (Post-employment benefits - CVM Resolution 600) 36.220 101.869 Benefits - Other 63.399 51.991 Severance Pay Fund (FGTS) 22.594 2,1% 17.917 2,1%TAXES AND CONTRIBUTIONS 320.007 29,5% 309.843 36,3%
Federal 312.843 302.794 State 10 11 Municipal 7.154 7.038
PAYMENTS TO THIRD PARTIES 16.603 1,5% 13.865 1,6%Rents 16.603 13.865
SHAREHOLDERS' PAYMENTS 300.693 27,7% 110.055 12,9% INTEREST ON OWN CAPITAL 63.964 5,9% 58.067 6,8%
Federal government 60.206 54.655 Other 3.758 3.412
DIVIDENDS 92.081 8,5% - 0,0%Federal government 86.671 - Other 5.410 -
RETAINED EARNINGS 144.648 13,3% 51.988 6,1%
The accompanying notes are an integral part of these financial statements.
STATEMENTS OF VALUE ADDED
(In thousands of Brazilian reais - R$)
BANCO DO NORDESTE DO BRASIL S.A.
NOTES TO THE FINANCIAL STATEMENTS FOR THE SIX-MONTH PERIODS ENDED JUNE 30, 2011 AND 2010 (Amounts in thousands of Brazilian Reais - R$, unless otherwise stated)
Contents of the Notes to the Financial Statements Note 1- The Bank and its Characteristics Note 17 - Hybrid Debt/Equity Instruments
Note 2- Basis of Preparation and Presentation of Financial Statements Note 18- Subordinated Debt Eligible for Capital
Note 3- Summary of Significant Accounting Practices Note 19 - Shareholders’ Equity
Note 4 - Segment Reporting Note 20 - Other operating income (expenses)
Note 5 - Cash and Cash Equivalents Note 21- Income tax and social contribution
Note 6 -Interbank Investments Note 22 - Provisions, Contingent Assets and
Note 7 - Securities and Derivatives Liabilities and Legal Obligations - Tax and Social Security
Note 8 - Interbank Accounts - Restricted Deposits Note 23 - Employees’ and Officers’ Compensation
Note 9 - Loan Portfolio and Allowance for Loan Losses Note 24 - Profit Sharing
Note 10- Other Receivables Note 25 - Employee Benefits
Note 11 - Foreign exchange portfolio Note 26 - Northeast Constitutional Financing Fund (FNE)
Note 12 - Permanent Assets Note 27- Workers’ Assistance Fund (FAT)
Note 13 - Deposits and Open Market Funding Note 28 - Risk Management and Basel Ratio
Note 14 - Borrowings and Domestic Onlendings Note 29 - Related-Parties Transactions
Note 15 - Funds from Acceptance and Issuance of Securities Note 30 - Other Information
Note 16 - Other Liabilities
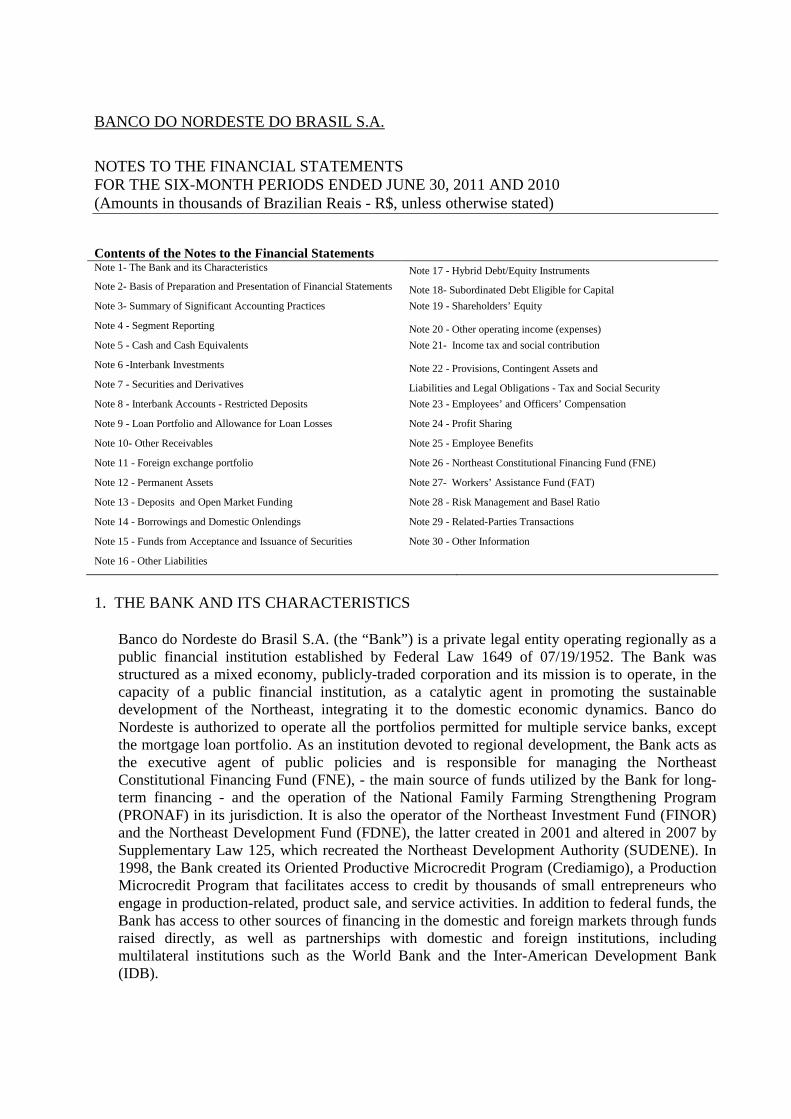
1. THE BANK AND ITS CHARACTERISTICS
Banco do Nordeste do Brasil S.A. (the “Bank”) is a private legal entity operating regionally as a public financial institution established by Federal Law 1649 of 07/19/1952. The Bank was structured as a mixed economy, publicly-traded corporation and its mission is to operate, in the capacity of a public financial institution, as a catalytic agent in promoting the sustainable development of the Northeast, integrating it to the domestic economic dynamics. Banco do Nordeste is authorized to operate all the portfolios permitted for multiple service banks, except the mortgage loan portfolio. As an institution devoted to regional development, the Bank acts as the executive agent of public policies and is responsible for managing the Northeast Constitutional Financing Fund (FNE), - the main source of funds utilized by the Bank for long-term financing - and the operation of the National Family Farming Strengthening Program (PRONAF) in its jurisdiction. It is also the operator of the Northeast Investment Fund (FINOR) and the Northeast Development Fund (FDNE), the latter created in 2001 and altered in 2007 by Supplementary Law 125, which recreated the Northeast Development Authority (SUDENE). In 1998, the Bank created its Oriented Productive Microcredit Program (Crediamigo), a Production Microcredit Program that facilitates access to credit by thousands of small entrepreneurs who engage in production-related, product sale, and service activities. In addition to federal funds, the Bank has access to other sources of financing in the domestic and foreign markets through funds raised directly, as well as partnerships with domestic and foreign institutions, including multilateral institutions such as the World Bank and the Inter-American Development Bank (IDB).
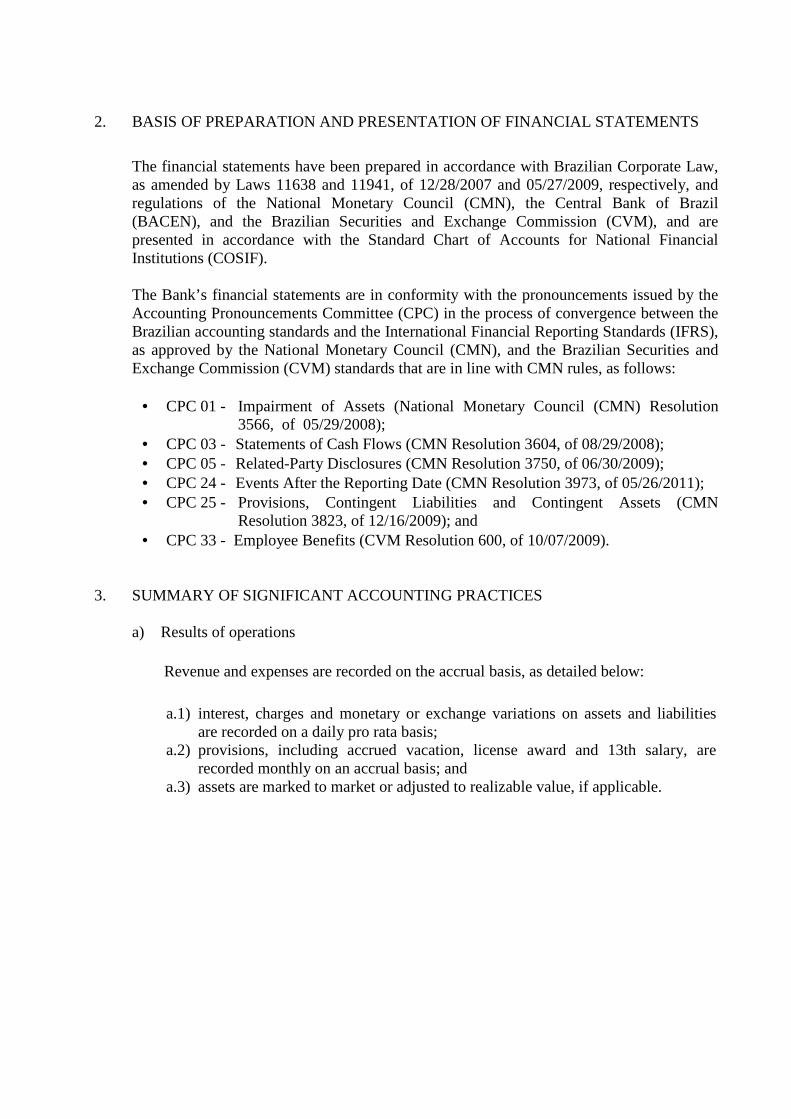
2. BASIS OF PREPARATION AND PRESENTATION OF FINANCIAL STATEMENTS
The financial statements have been prepared in accordance with Brazilian Corporate Law, as amended by Laws 11638 and 11941, of 12/28/2007 and 05/27/2009, respectively, and regulations of the National Monetary Council (CMN), the Central Bank of Brazil (BACEN), and the Brazilian Securities and Exchange Commission (CVM), and are presented in accordance with the Standard Chart of Accounts for National Financial Institutions (COSIF). The Bank’s financial statements are in conformity with the pronouncements issued by the Accounting Pronouncements Committee (CPC) in the process of convergence between the Brazilian accounting standards and the International Financial Reporting Standards (IFRS), as approved by the National Monetary Council (CMN), and the Brazilian Securities and Exchange Commission (CVM) standards that are in line with CMN rules, as follows:
• CPC 01 - Impairment of Assets (National Monetary Council (CMN) Resolution
3566, of 05/29/2008); • CPC 03 - Statements of Cash Flows (CMN Resolution 3604, of 08/29/2008); • CPC 05 - Related-Party Disclosures (CMN Resolution 3750, of 06/30/2009); • CPC 24 - Events After the Reporting Date (CMN Resolution 3973, of 05/26/2011); • CPC 25 - Provisions, Contingent Liabilities and Contingent Assets (CMN
Resolution 3823, of 12/16/2009); and • CPC 33 - Employee Benefits (CVM Resolution 600, of 10/07/2009).
3. SUMMARY OF SIGNIFICANT ACCOUNTING PRACTICES
a) Results of operations
Revenue and expenses are recorded on the accrual basis, as detailed below: a.1) interest, charges and monetary or exchange variations on assets and liabilities
are recorded on a daily pro rata basis; a.2) provisions, including accrued vacation, license award and 13th salary, are
recorded monthly on an accrual basis; and a.3) assets are marked to market or adjusted to realizable value, if applicable.
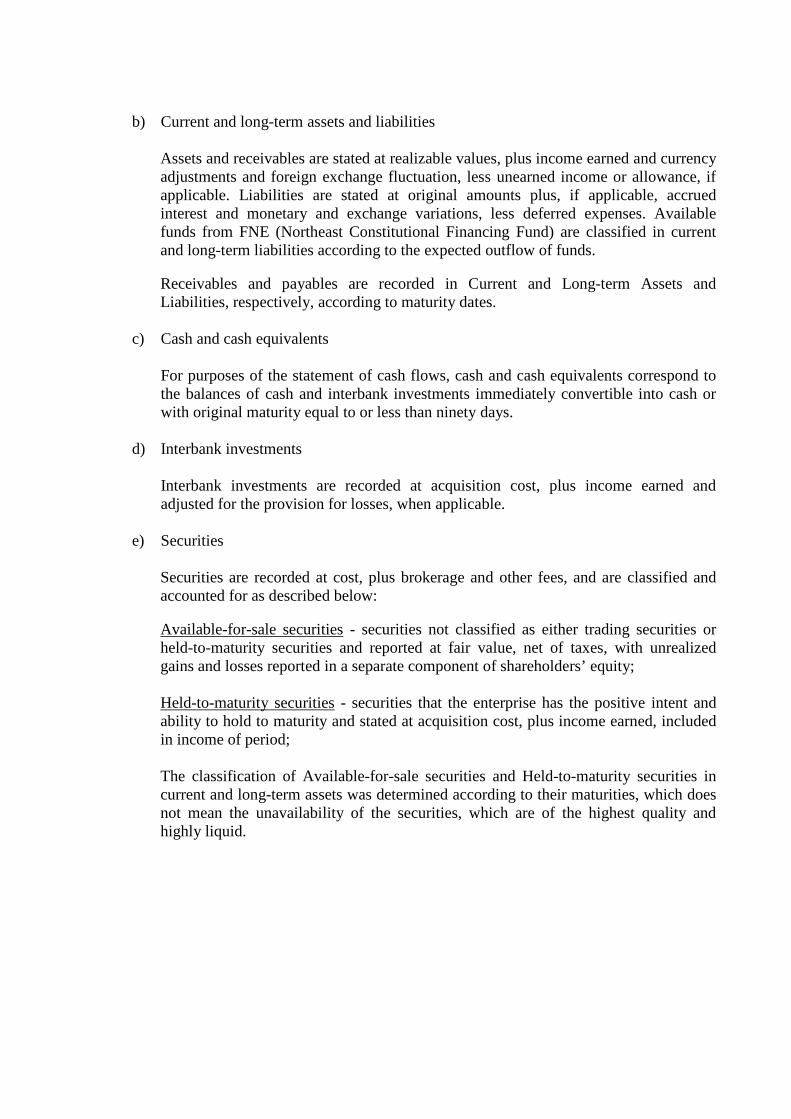
b) Current and long-term assets and liabilities
Assets and receivables are stated at realizable values, plus income earned and currency adjustments and foreign exchange fluctuation, less unearned income or allowance, if applicable. Liabilities are stated at original amounts plus, if applicable, accrued interest and monetary and exchange variations, less deferred expenses. Available funds from FNE (Northeast Constitutional Financing Fund) are classified in current and long-term liabilities according to the expected outflow of funds. Receivables and payables are recorded in Current and Long-term Assets and Liabilities, respectively, according to maturity dates.
c) Cash and cash equivalents
For purposes of the statement of cash flows, cash and cash equivalents correspond to the balances of cash and interbank investments immediately convertible into cash or with original maturity equal to or less than ninety days.
d) Interbank investments
Interbank investments are recorded at acquisition cost, plus income earned and adjusted for the provision for losses, when applicable.
e) Securities Securities are recorded at cost, plus brokerage and other fees, and are classified and accounted for as described below: Available-for-sale securities - securities not classified as either trading securities or held-to-maturity securities and reported at fair value, net of taxes, with unrealized gains and losses reported in a separate component of shareholders’ equity; Held-to-maturity securities - securities that the enterprise has the positive intent and ability to hold to maturity and stated at acquisition cost, plus income earned, included in income of period; The classification of Available-for-sale securities and Held-to-maturity securities in current and long-term assets was determined according to their maturities, which does not mean the unavailability of the securities, which are of the highest quality and highly liquid.
f) Derivative financial instruments Banco do Nordeste limits its operations in the derivative market to swap transactions intended solely to hedge its asset and liability positions, when necessary. Swap transactions are stated at fair value on monthly trial balances and balances and gains and losses are recorded in revenue or expense accounts. The fair value of swap transactions is calculated using the rates disclosed by the Brazilian Financial and Capital Markets Association (ANBIMA).
g) Lending operations, advances on foreign exchange contracts, other receivables with loan characteristics and allowances for loan losses. Lending operations, advances on foreign exchange contracts, and other receivables with loan characteristics are classified in accordance with Management’s judgment on risk level, taking into consideration the economic scenario, past experience and specific risks related to the operation, creditors and guarantors, considering the standards established by CMN Resolution 2682 of 12/21/1999, which require the periodic analysis of the portfolio and its rating into nine risk levels, where AA is the minimum risk and H is the maximum risk, as well as the classification of operations in arrears for more than 15 days as past due operations. Income from lending operations over 59 days past due, regardless of the risk level, is only recognized when realized. H-rated operations remain under this rating for six months, when they are then written off against the existing allowance and controlled for five years, no longer being included in the balance sheet. Renegotiated operations remain at least at the same risk level in which they were classified. Renegotiated loans that have been written off against the allowance are rated as H, and possible recoveries are recognized as income when received.
h) Prepaid expenses Refer to funds used in advanced payments, whose benefits or service rendering will occur in coming years.
i) Permanent assets
Investments are stated at cost, net of allowance for losses;
Property, plant and equipment includes depreciation calculated under the straight-line method at the following annual rates: buildings - 4%; data processing systems and vehicles - 20%; tractors and motorcycles - 25%; and other items - 10%. Real estate includes the revaluation amount. Deferred charges include costs on third-party properties and software purchase and development incurred through September 30, 2008 and include amortization calculated under the straight-line method at the annual rate of 20%. CMN Resolution 3617, of 09/30/2008, determines that any balances of property, plant and equipment and deferred charges existing before the Resolution came into effect that have been recorded based on prior standards should be maintained until such balances are actually written off.
j) Income tax, social contribution, PASEP and COFINS (taxes on revenue)
IRPJ (corporate income tax) is calculated at the rate of 15% plus additional 10%, and Social Contribution (CSLL) is calculated at the rate of 15%, after the adjustments defined in tax law. Tax credits and deferred liabilities are calculated, basically, on temporary differences between accounting and tax income, on allowances for loans and doubtful accounts and on securities and derivatives fair value adjustments. In accordance with current regulation, the expected realization of tax credits is based on the projection of future earnings and on technical studies carried out every six months. PIS/Pasep and COFINS are calculated at the rates of 0.65% and 4.00%, respectively.
k) Employee benefits The Bank grants its employees short-term and post-employment benefits. Short-term benefits are recognized and measured at their original amounts (excluding the effect of the discount to present value or actuarial calculation) based on the monthly accrual basis of accounting. Post-employment benefits refer to defined benefit and variable contribution pension plans, and a defined benefit health care plan.
The policy adopted for the recognition of actuarial gains and losses beginning December 2010 is consistent with the provisions of item 93 of the Appendix to CVM Resolution 600, that is, actuarial gains and losses are immediately recognized as revenue or expense. The policy adopted for the recognition of actuarial gains and losses was based on items 52 to 55 of the Appendix to CVM Resolution 371, i.e., the Bank recognized a portion of actuarial gains and losses in excess of the higher of: 10% of the defined benefit total actuarial obligation present value, and 10% of plan assets fair value. The effects of the first-time adoption of CVM Resolution 600, beginning 01/01/2009, have been fully recognized in the statements as of 12/31/2010.
l) Impairment assessment Impairment losses are recognized when the carrying amount of an asset exceeds its recoverable value. Relevant non-financial assets are reviewed for impairment at least annually, to determine if there is any indication that the asset might be impaired.
m) Contingent assets and contingent liabilities and legal obligations Contingent assets, contingent liabilities and legal obligations are recognized, measured and disclosed according to the criteria defined in CMN Resolution 3823, of 12/16/2009. Contingent assets are recognized in the financial statements only when their realization can be reliably measured from evidences, which may be the final and unappealable decision on a lawsuit or the confirmation of its recoverability, either through the receipt or offset against another liability. Contingent liabilities are recognized in the financial statements when, based on the opinion of legal counsel and Management, the risk of loss on a judicial or administrative proceeding is considered probable, with probable outflow of funds to settle the obligations, the amounts involved can be reliably measured upon court reference/notification and reviewed monthly. Legal obligations derive from tax obligations and a provision in their full amount is recognized in the financial statements, regardless of the likelihood of success in ongoing lawsuits.
n) Use of estimates
The preparation of the financial statements includes estimates and assumptions, such as the measurement of allowances for loan losses, estimates of certain financial instruments fair values, provision for contingencies, impairment losses, other provisions, and the calculation of technical provisions for health care plan and pension plans. Actual results could differ from such estimates and assumptions.
4. SEGMENT REPORTING For management purposes, the Bank is organized into two operating segments based on products and services: a) Own Portfolio - comprises own portfolio products and services such as lending and
market operations, fund management and provision of other banking services and collaterals; and
b) FNE - comprises lending operations within the scope of FNE and the provision of portfolio management services.
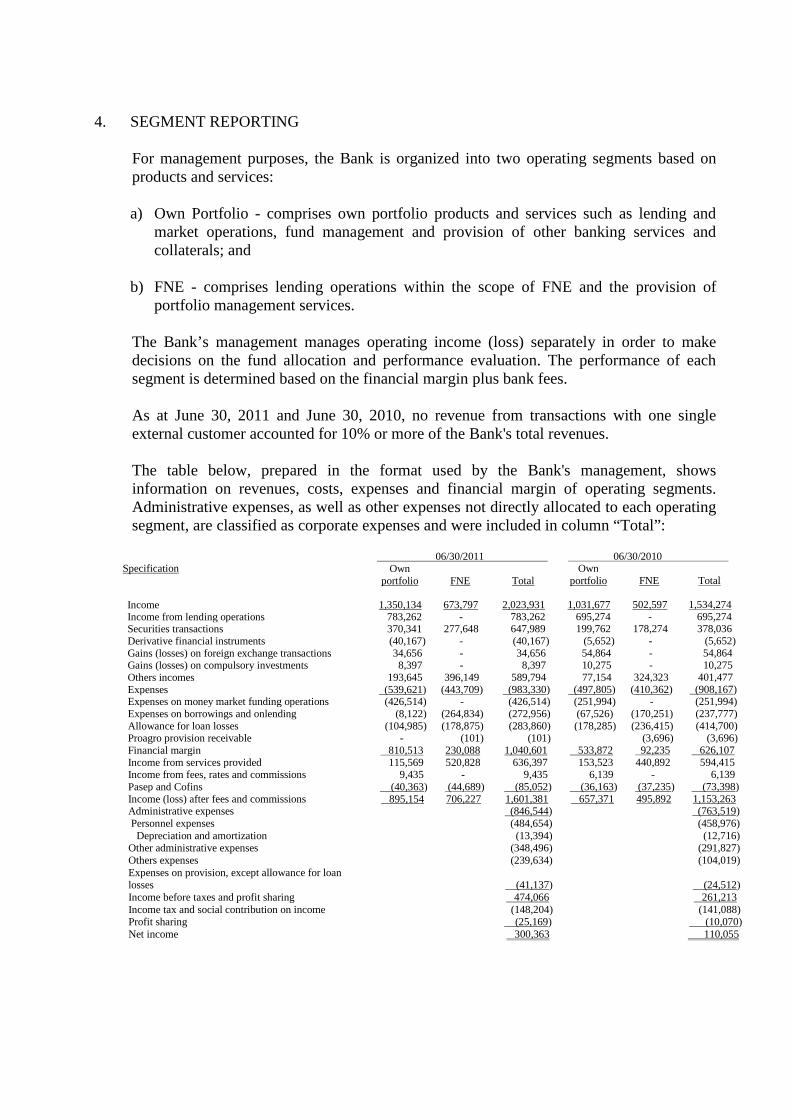
The Bank’s management manages operating income (loss) separately in order to make decisions on the fund allocation and performance evaluation. The performance of each segment is determined based on the financial margin plus bank fees. As at June 30, 2011 and June 30, 2010, no revenue from transactions with one single external customer accounted for 10% or more of the Bank's total revenues. The table below, prepared in the format used by the Bank's management, shows information on revenues, costs, expenses and financial margin of operating segments. Administrative expenses, as well as other expenses not directly allocated to each operating segment, are classified as corporate expenses and were included in column “Total”:
Specification 06/30/2011 06/30/2010
Own portfolio FNE Total
Own portfolio FNE Total
Income 1,350,134 673,797 2,023,931 1,031,677 502,597 1,534,274 Income from lending operations 783,262 - 783,262 695,274 - 695,274 Securities transactions 370,341 277,648 647,989 199,762 178,274 378,036 Derivative financial instruments (40,167) - (40,167) (5,652) - (5,652) Gains (losses) on foreign exchange transactions 34,656 - 34,656 54,864 - 54,864 Gains (losses) on compulsory investments 8,397 - 8,397 10,275 - 10,275 Others incomes 193,645 396,149 589,794 77,154 324,323 401,477 Expenses (539,621) (443,709) (983,330) (497,805) (410,362) (908,167) Expenses on money market funding operations (426,514) - (426,514) (251,994) - (251,994) Expenses on borrowings and onlending (8,122) (264,834) (272,956) (67,526) (170,251) (237,777) Allowance for loan losses (104,985) (178,875) (283,860) (178,285) (236,415) (414,700) Proagro provision receivable - (101) (101) (3,696) (3,696) Financial margin 810,513 230,088 1,040,601 533,872 92,235 626,107 Income from services provided 115,569 520,828 636,397 153,523 440,892 594,415 Income from fees, rates and commissions 9,435 - 9,435 6,139 - 6,139 Pasep and Cofins (40,363) (44,689) (85,052) (36,163) (37,235) (73,398) Income (loss) after fees and commissions 895,154 706,227 1,601,381 657,371 495,892 1,153,263 Administrative expenses
(846,544)
(763,519) Personnel expenses (484,654) (458,976) Depreciation and amortization (13,394) (12,716) Other administrative expenses (348,496) (291,827) Others expenses (239,634) (104,019) Expenses on provision, except allowance for loan losses (41,137) (24,512) Income before taxes and profit sharing 474,066 261,213 Income tax and social contribution on income (148,204) (141,088) Profit sharing (25,169) (10,070) Net income 300,363 110,055
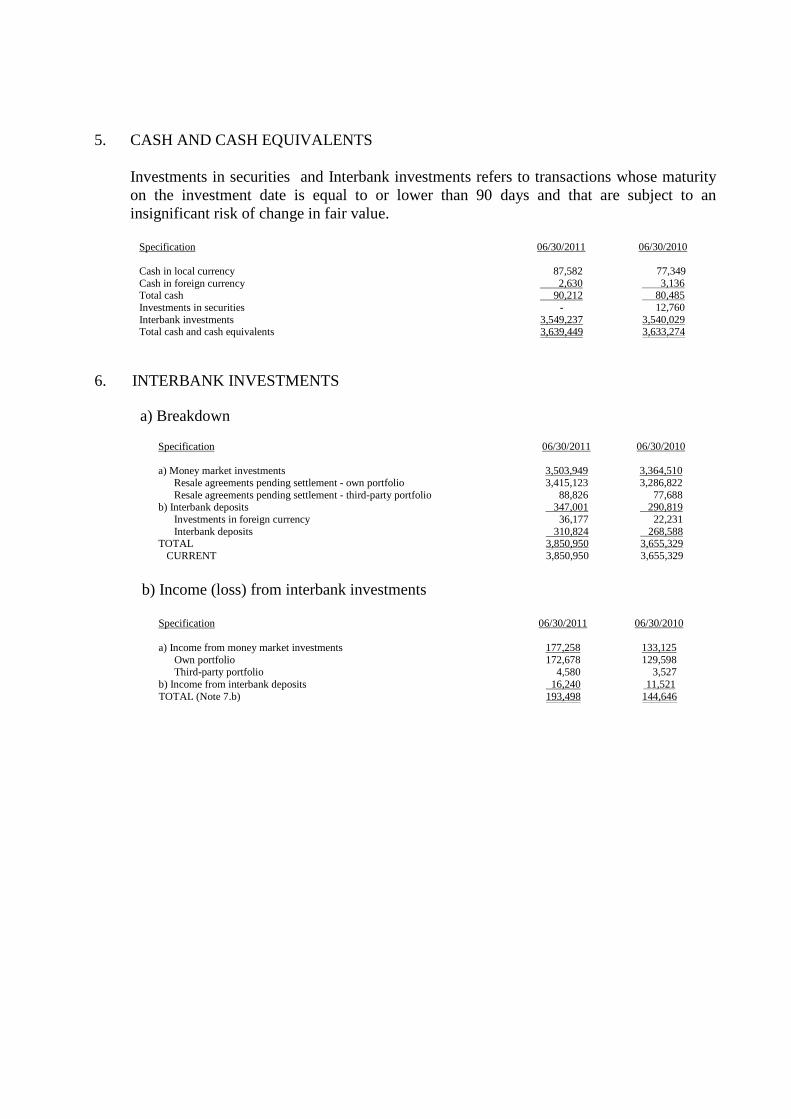
5. CASH AND CASH EQUIVALENTS
Investments in securities and Interbank investments refers to transactions whose maturity on the investment date is equal to or lower than 90 days and that are subject to an insignificant risk of change in fair value.
Specification 06/30/2011 06/30/2010 Cash in local currency 87,582 77,349 Cash in foreign currency 2,630 3,136 Total cash 90,212 80,485 Investments in securities - 12,760 Interbank investments 3,549,237 3,540,029 Total cash and cash equivalents 3,639,449 3,633,274
6. INTERBANK INVESTMENTS
a) Breakdown
Specification 06/30/2011 06/30/2010 a) Money market investments 3,503,949 3,364,510
Resale agreements pending settlement - own portfolio 3,415,123 3,286,822 Resale agreements pending settlement - third-party portfolio 88,826 77,688
b) Interbank deposits 347,001 290,819 Investments in foreign currency 36,177 22,231 Interbank deposits 310,824 268,588
TOTAL 3,850,950 3,655,329 CURRENT 3,850,950 3,655,329
b) Income (loss) from interbank investments
Specification 06/30/2011 06/30/2010 a) Income from money market investments 177,258 133,125
Own portfolio 172,678 129,598 Third-party portfolio 4,580 3,527
b) Income from interbank deposits 16,240 11,521 TOTAL (Note 7.b) 193,498 144,646
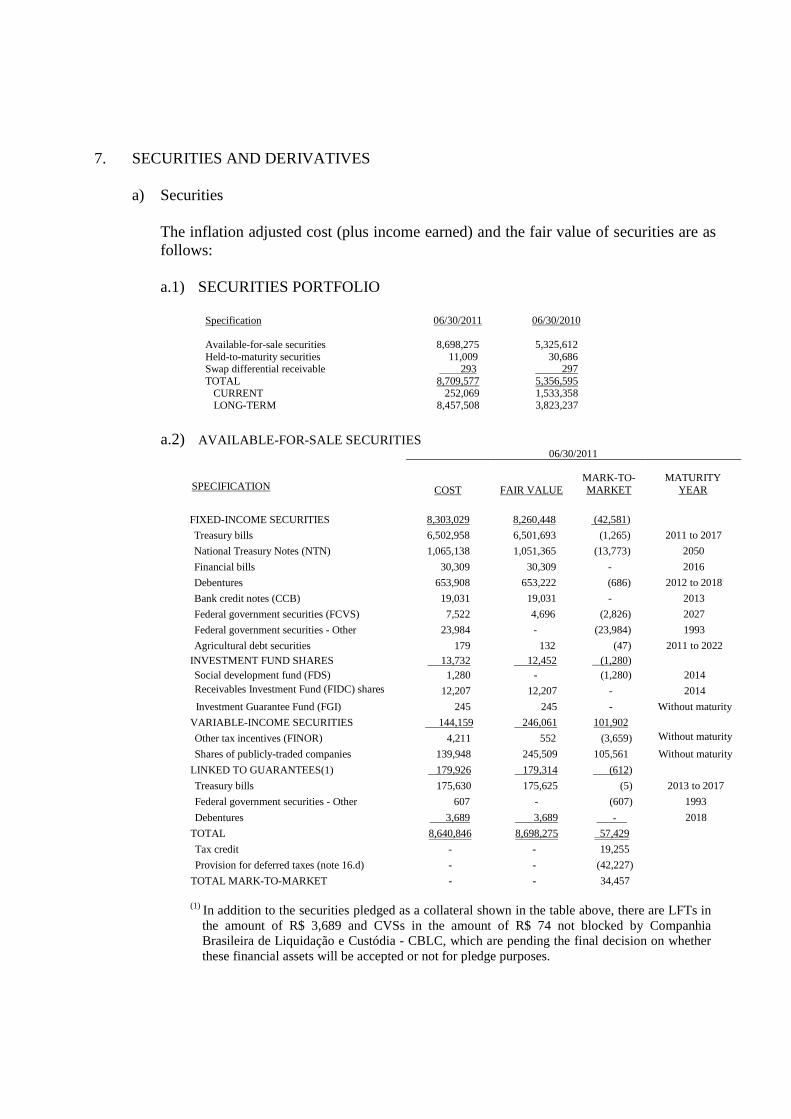
7. SECURITIES AND DERIVATIVES
a) Securities The inflation adjusted cost (plus income earned) and the fair value of securities are as follows:
a.1) SECURITIES PORTFOLIO
Specification 06/30/2011 06/30/2010 Available-for-sale securities 8,698,275 5,325,612 Held-to-maturity securities 11,009 30,686 Swap differential receivable 293 297 TOTAL 8,709,577 5,356,595 CURRENT 252,069 1,533,358 LONG-TERM 8,457,508 3,823,237
a.2) AVAILABLE-FOR-SALE SECURITIES
(1) In addition to the securities pledged as a collateral shown in the table above, there are LFTs in
the amount of R$ 3,689 and CVSs in the amount of R$ 74 not blocked by Companhia Brasileira de Liquidação e Custódia - CBLC, which are pending the final decision on whether these financial assets will be accepted or not for pledge purposes.
SPECIFICATION
06/30/2011
COST FAIR VALUE MARK-TO-MARKET
MATURITY YEAR
FIXED-INCOME SECURITIES 8,303,029 8,260,448 (42,581)
Treasury bills 6,502,958 6,501,693 (1,265) 2011 to 2017
National Treasury Notes (NTN) 1,065,138 1,051,365 (13,773) 2050
Financial bills 30,309 30,309 - 2016
Debentures 653,908 653,222 (686) 2012 to 2018
Bank credit notes (CCB) 19,031 19,031 - 2013
Federal government securities (FCVS) 7,522 4,696 (2,826) 2027
Federal government securities - Other 23,984 - (23,984) 1993
Agricultural debt securities 179 132 (47) 2011 to 2022 INVESTMENT FUND SHARES 13,732 12,452 (1,280) Social development fund (FDS) 1,280 - (1,280) 2014 Receivables Investment Fund (FIDC) shares
12,207 12,207 - 2014
Investment Guarantee Fund (FGI) 245 245 - Without maturity
VARIABLE-INCOME SECURITIES 144,159 246,061 101,902
Other tax incentives (FINOR) 4,211 552 (3,659) Without maturity
Shares of publicly-traded companies 139,948 245,509 105,561 Without maturity
LINKED TO GUARANTEES(1) 179,926 179,314 (612)
Treasury bills 175,630 175,625 (5) 2013 to 2017
Federal government securities - Other 607 - (607) 1993
Debentures 3,689 3,689 - 2018
TOTAL 8,640,846 8,698,275 57,429
Tax credit - - 19,255
Provision for deferred taxes (note 16.d) - - (42,227)
TOTAL MARK-TO-MARKET - - 34,457
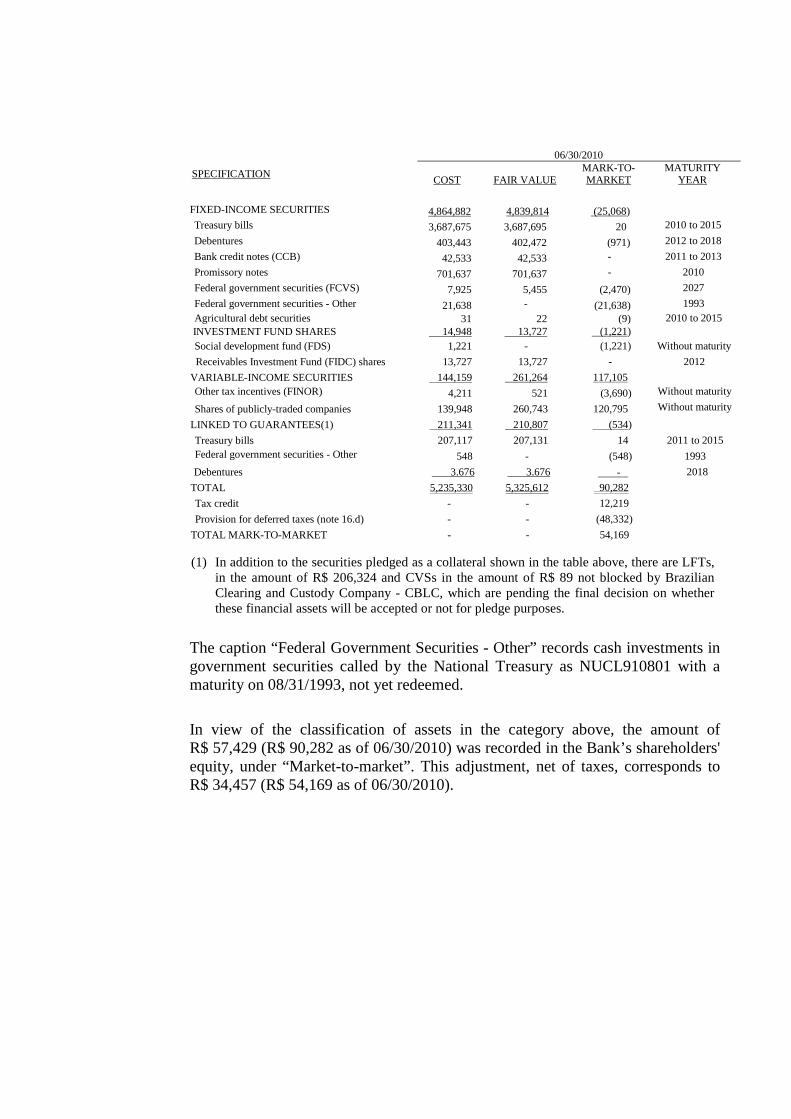
SPECIFICATION
06/30/2010
COST
FAIR VALUE MARK-TO-MARKET
MATURITY YEAR
FIXED-INCOME SECURITIES 4,864,882 4,839,814 (25,068)
Treasury bills 3,687,675 3,687,695 20 2010 to 2015
Debentures 403,443 402,472 (971) 2012 to 2018
Bank credit notes (CCB) 42,533 42,533 - 2011 to 2013
Promissory notes 701,637 701,637 - 2010
Federal government securities (FCVS) 7,925 5,455 (2,470) 2027
Federal government securities - Other 21,638 - (21,638) 1993 Agricultural debt securities 31 22 (9) 2010 to 2015
INVESTMENT FUND SHARES 14,948 13,727 (1,221) Social development fund (FDS) 1,221 - (1,221) Without maturity
Receivables Investment Fund (FIDC) shares 13,727 13,727 - 2012
VARIABLE-INCOME SECURITIES 144,159 261,264 117,105 Other tax incentives (FINOR)
4,211 521 (3,690) Without maturity
Shares of publicly-traded companies 139,948 260,743 120,795 Without maturity
LINKED TO GUARANTEES(1) 211,341 210,807 (534)
Treasury bills 207,117 207,131 14 2011 to 2015 Federal government securities - Other
548 - (548) 1993
Debentures 3.676 3.676 - 2018
TOTAL 5,235,330 5,325,612 90,282
Tax credit - - 12,219
Provision for deferred taxes (note 16.d) - - (48,332)
TOTAL MARK-TO-MARKET - - 54,169
(1) In addition to the securities pledged as a collateral shown in the table above, there are LFTs, in the amount of R$ 206,324 and CVSs in the amount of R$ 89 not blocked by Brazilian Clearing and Custody Company - CBLC, which are pending the final decision on whether these financial assets will be accepted or not for pledge purposes.
The caption “Federal Government Securities - Other” records cash investments in government securities called by the National Treasury as NUCL910801 with a maturity on 08/31/1993, not yet redeemed.
In view of the classification of assets in the category above, the amount of R$ 57,429 (R$ 90,282 as of 06/30/2010) was recorded in the Bank’s shareholders' equity, under “Market-to-market”. This adjustment, net of taxes, corresponds to R$ 34,457 (R$ 54,169 as of 06/30/2010).
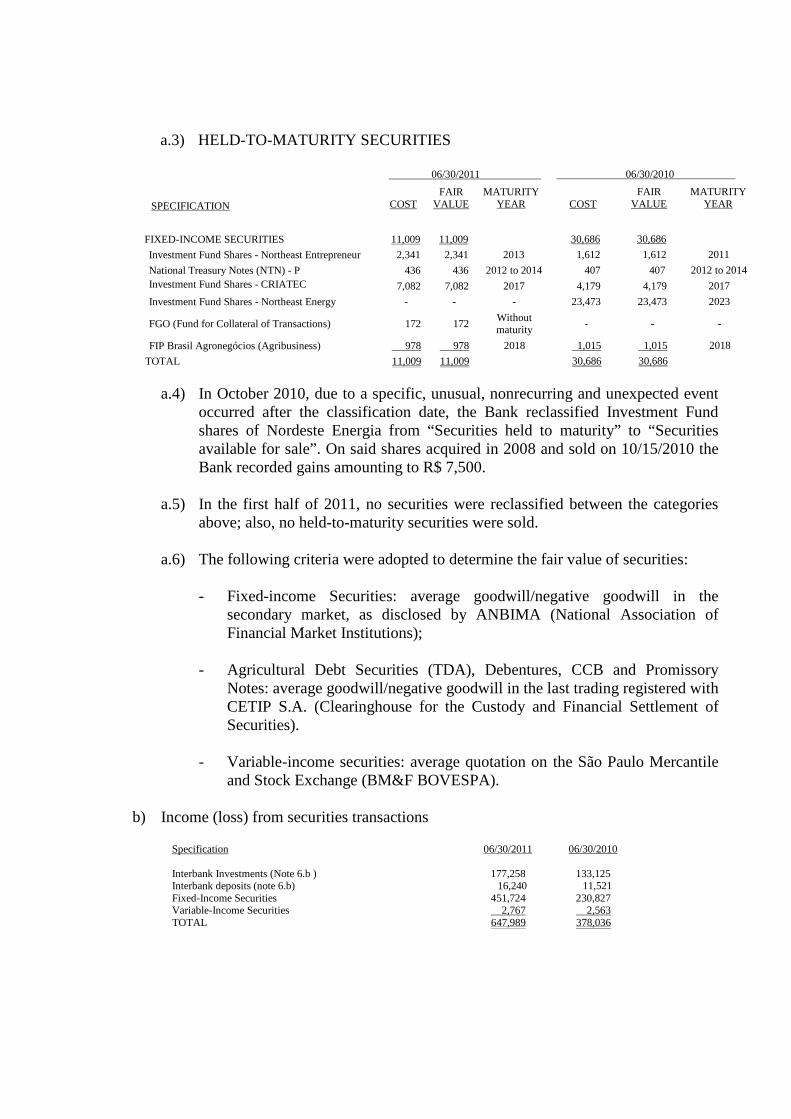
a.3) HELD-TO-MATURITY SECURITIES
SPECIFICATION
06/30/2011 06/30/2010
COST
FAIR VALUE
MATURITY YEAR
COST
FAIR VALUE
MATURITY YEAR
FIXED-INCOME SECURITIES 11,009 11,009 30,686 30,686
Investment Fund Shares - Northeast Entrepreneur 2,341 2,341 2013 1,612 1,612 2011
National Treasury Notes (NTN) - P 436 436 2012 to 2014 407 407 2012 to 2014 Investment Fund Shares - CRIATEC
7,082 7,082 2017 4,179 4,179 2017
Investment Fund Shares - Northeast Energy - - - 23,473 23,473 2023
FGO (Fund for Collateral of Transactions) 172 172 Without maturity
- - -
FIP Brasil Agronegócios (Agribusiness) 978 978 2018 1,015 1,015 2018
TOTAL 11,009 11,009 30,686 30,686
a.4) In October 2010, due to a specific, unusual, nonrecurring and unexpected event
occurred after the classification date, the Bank reclassified Investment Fund shares of Nordeste Energia from “Securities held to maturity” to “Securities available for sale”. On said shares acquired in 2008 and sold on 10/15/2010 the Bank recorded gains amounting to R$ 7,500.
a.5) In the first half of 2011, no securities were reclassified between the categories above; also, no held-to-maturity securities were sold.
a.6) The following criteria were adopted to determine the fair value of securities:
- Fixed-income Securities: average goodwill/negative goodwill in the secondary market, as disclosed by ANBIMA (National Association of Financial Market Institutions);
- Agricultural Debt Securities (TDA), Debentures, CCB and Promissory
Notes: average goodwill/negative goodwill in the last trading registered with CETIP S.A. (Clearinghouse for the Custody and Financial Settlement of Securities).
- Variable-income securities: average quotation on the São Paulo Mercantile
and Stock Exchange (BM&F BOVESPA).
b) Income (loss) from securities transactions
Specification 06/30/2011 06/30/2010 Interbank Investments (Note 6.b ) 177,258 133,125 Interbank deposits (note 6.b) 16,240 11,521 Fixed-Income Securities 451,724 230,827 Variable-Income Securities 2,767 2,563 TOTAL 647,989 378,036
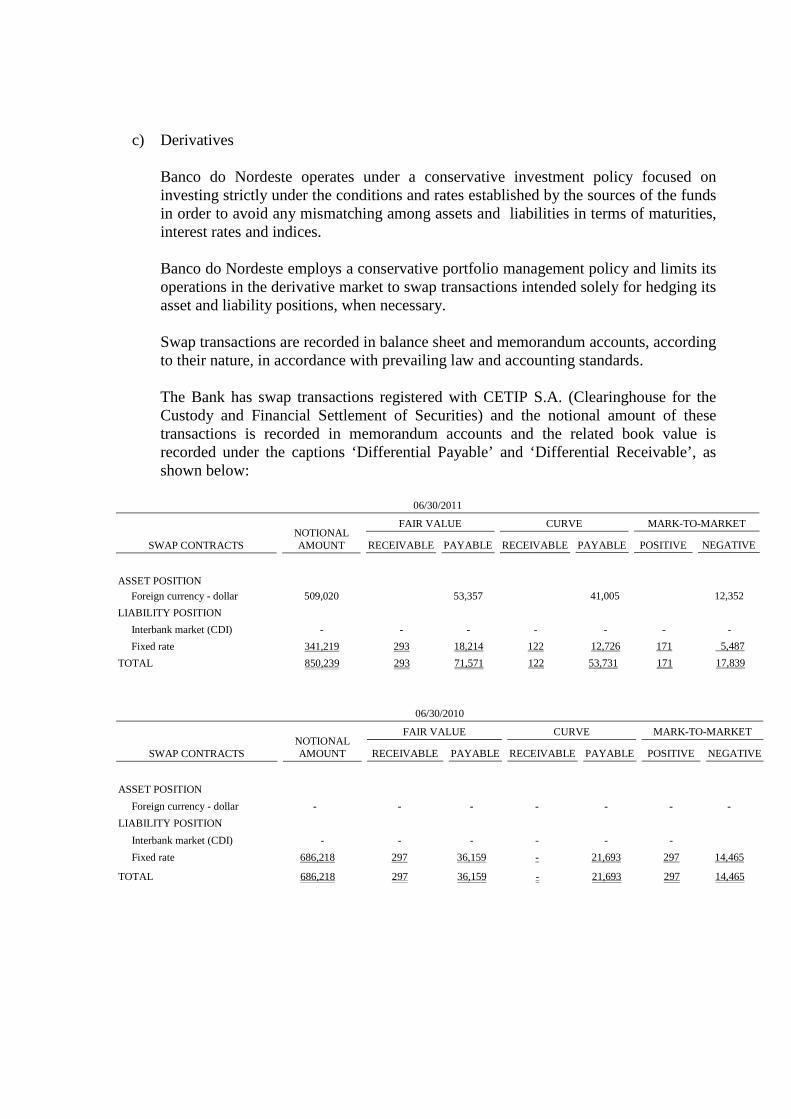
c) Derivatives
Banco do Nordeste operates under a conservative investment policy focused on investing strictly under the conditions and rates established by the sources of the funds in order to avoid any mismatching among assets and liabilities in terms of maturities, interest rates and indices. Banco do Nordeste employs a conservative portfolio management policy and limits its operations in the derivative market to swap transactions intended solely for hedging its asset and liability positions, when necessary. Swap transactions are recorded in balance sheet and memorandum accounts, according to their nature, in accordance with prevailing law and accounting standards. The Bank has swap transactions registered with CETIP S.A. (Clearinghouse for the Custody and Financial Settlement of Securities) and the notional amount of these transactions is recorded in memorandum accounts and the related book value is recorded under the captions ‘Differential Payable’ and ‘Differential Receivable’, as shown below:
06/30/2011
SWAP CONTRACTS
NOTIONAL AMOUNT
FAIR VALUE CURVE MARK-TO-MARKET
RECEIVABLE PAYABLE RECEIVABLE PAYABLE POSITIVE NEGATIVE
ASSET POSITION
Foreign currency - dollar 509,020 53,357 41,005 12,352
LIABILITY POSITION
Interbank market (CDI) - - - - - - -
Fixed rate 341,219 293 18,214 122 12,726 171 5,487
TOTAL 850,239 293 71,571 122 53,731 171 17,839
06/30/2010
SWAP CONTRACTS
NOTIONAL AMOUNT
FAIR VALUE CURVE MARK-TO-MARKET
RECEIVABLE PAYABLE RECEIVABLE PAYABLE POSITIVE NEGATIVE
ASSET POSITION
Foreign currency - dollar - - - - - - -
LIABILITY POSITION
Interbank market (CDI) - - - - - -
Fixed rate 686,218 297 36,159 - 21,693 297 14,465
TOTAL 686,218 297 36,159 - 21,693 297 14,465
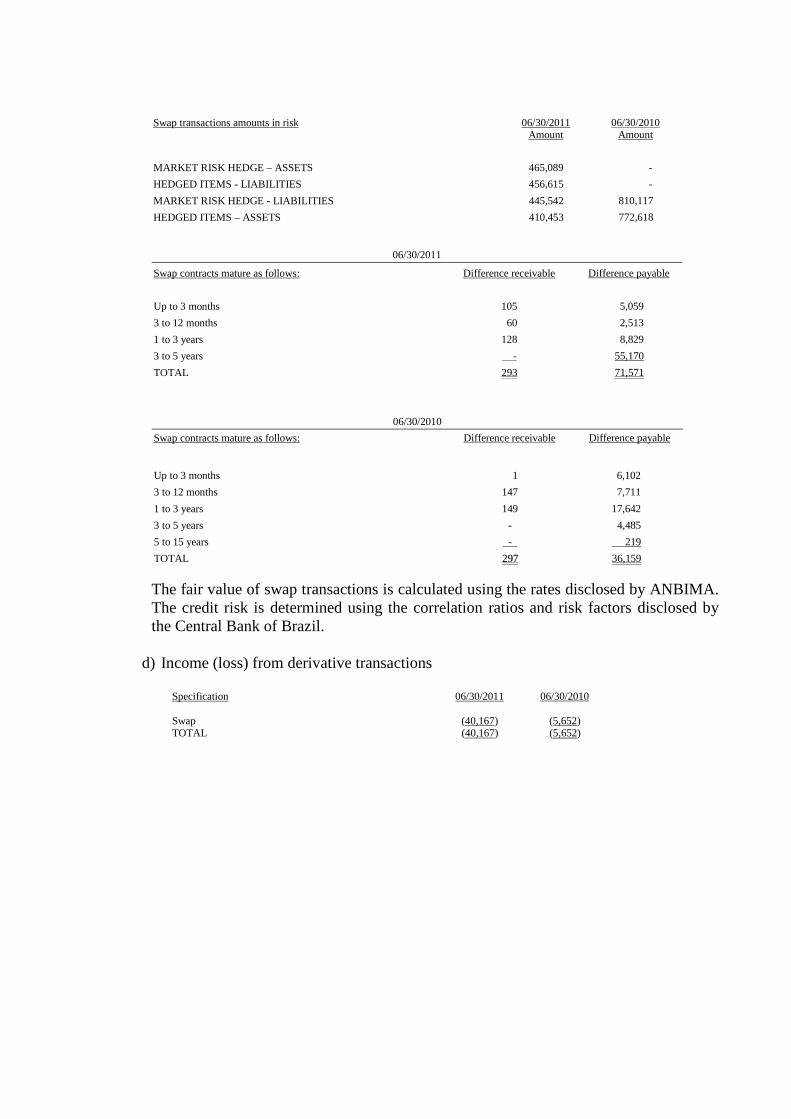
Swap transactions amounts in risk 06/30/2011 06/30/2010 Amount Amount
MARKET RISK HEDGE – ASSETS 465,089 -
HEDGED ITEMS - LIABILITIES 456,615 -
MARKET RISK HEDGE - LIABILITIES 445,542 810,117
HEDGED ITEMS – ASSETS 410,453 772,618
06/30/2011
Swap contracts mature as follows: Difference receivable Difference payable
Up to 3 months 105 5,059
3 to 12 months 60 2,513
1 to 3 years 128 8,829
3 to 5 years - 55,170
TOTAL 293 71,571
06/30/2010
Swap contracts mature as follows: Difference receivable Difference payable
Up to 3 months 1 6,102
3 to 12 months 147 7,711
1 to 3 years 149 17,642
3 to 5 years - 4,485
5 to 15 years - 219
TOTAL 229977 36,159 The fair value of swap transactions is calculated using the rates disclosed by ANBIMA. The credit risk is determined using the correlation ratios and risk factors disclosed by the Central Bank of Brazil.
d) Income (loss) from derivative transactions
Specification 06/30/2011 06/30/2010 Swap (40,167) (5,652) TOTAL (40,167) (5,652)
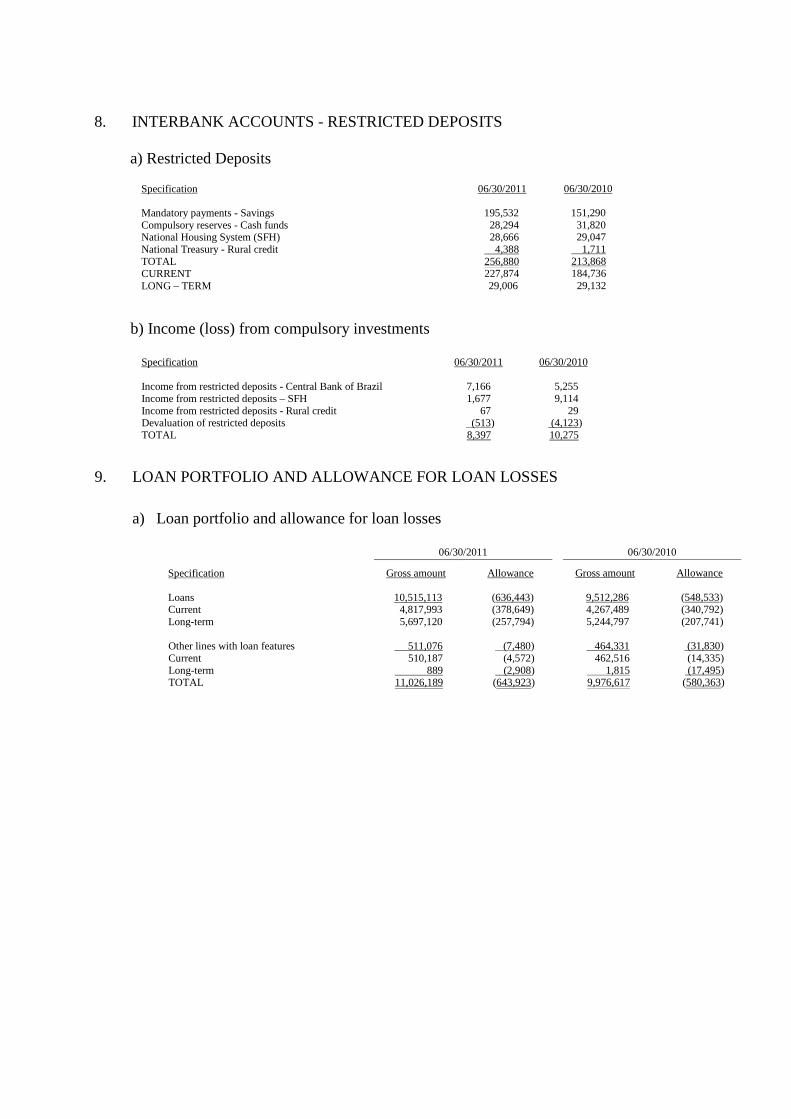
8. INTERBANK ACCOUNTS - RESTRICTED DEPOSITS a) Restricted Deposits
Specification 06/30/2011 06/30/2010 Mandatory payments - Savings 195,532 151,290 Compulsory reserves - Cash funds 28,294 31,820 National Housing System (SFH) 28,666 29,047 National Treasury - Rural credit 4,388 1,711 TOTAL CURRENT LONG – TERM
256,880 227,874
29,006
213,868 184,736 29,132
b) Income (loss) from compulsory investments
Specification 06/30/2011 06/30/2010
Income from restricted deposits - Central Bank of Brazil
7,166
5,255 Income from restricted deposits – SFH 1,677 9,114 Income from restricted deposits - Rural credit 67 29 Devaluation of restricted deposits (513) (4,123) TOTAL 8,397 10,275
9. LOAN PORTFOLIO AND ALLOWANCE FOR LOAN LOSSES
a) Loan portfolio and allowance for loan losses
06/30/2011 06/30/2010
Specification Gross amount Allowance Gross amount Allowance Loans 10,515,113 (636,443) 9,512,286 (548,533) Current 4,817,993 (378,649) 4,267,489 (340,792) Long-term 5,697,120 (257,794) 5,244,797 (207,741) Other lines with loan features 511,076 (7,480) 464,331 (31,830) Current 510,187 (4,572) 462,516 (14,335) Long-term 889 (2,908) 1,815 (17,495) TOTAL 11,026,189 (643,923) 9,976,617 (580,363)
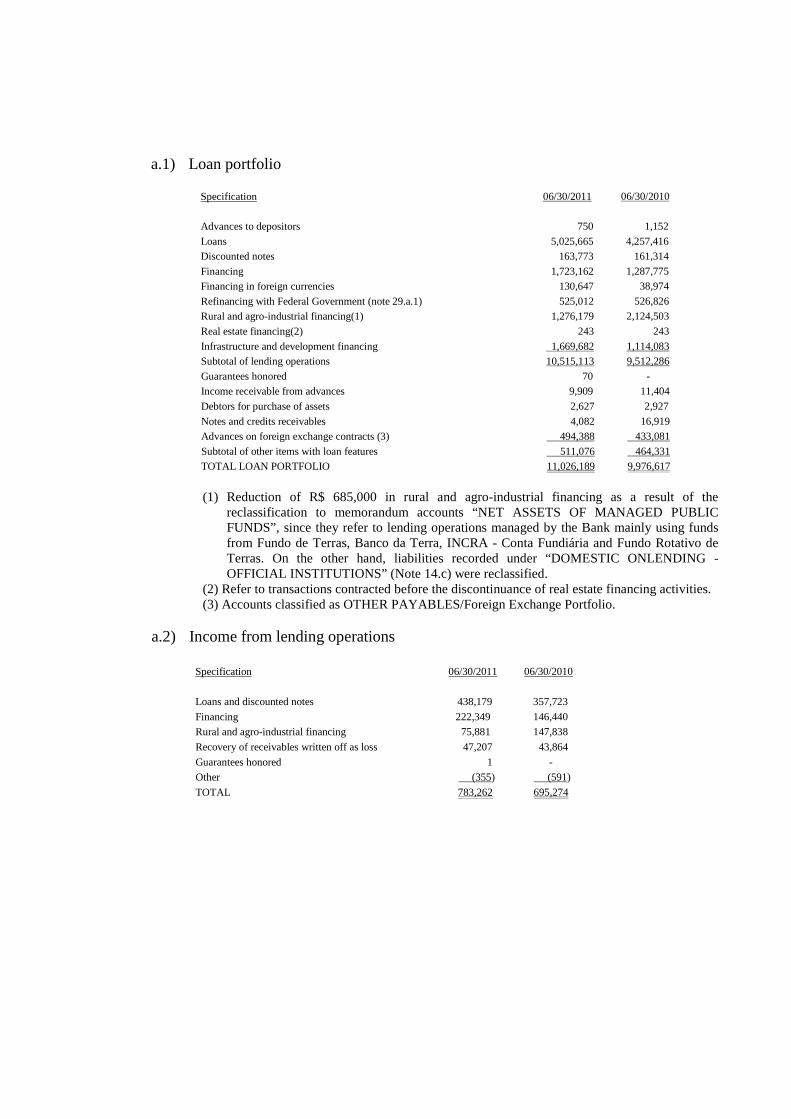
a.1) Loan portfolio
Specification 06/30/2011 06/30/2010
Advances to depositors 750 1,152
Loans 5,025,665 4,257,416
Discounted notes 163,773 161,314
Financing 1,723,162 1,287,775
Financing in foreign currencies 130,647 38,974
Refinancing with Federal Government (note 29.a.1) 525,012 526,826
Rural and agro-industrial financing(1) 1,276,179 2,124,503
Real estate financing(2) 243 243
Infrastructure and development financing 1,669,682 1,114,083
Subtotal of lending operations 10,515,113 9,512,286
Guarantees honored 70 -
Income receivable from advances 9,909 11,404
Debtors for purchase of assets 2,627 2,927
Notes and credits receivables 4,082 16,919
Advances on foreign exchange contracts (3) 494,388 433,081
Subtotal of other items with loan features 511,076 464,331
TOTAL LOAN PORTFOLIO 11,026,189 9,976,617
(1) Reduction of R$ 685,000 in rural and agro-industrial financing as a result of the
reclassification to memorandum accounts “NET ASSETS OF MANAGED PUBLIC FUNDS”, since they refer to lending operations managed by the Bank mainly using funds from Fundo de Terras, Banco da Terra, INCRA - Conta Fundiária and Fundo Rotativo de Terras. On the other hand, liabilities recorded under “DOMESTIC ONLENDING - OFFICIAL INSTITUTIONS” (Note 14.c) were reclassified.
(2) Refer to transactions contracted before the discontinuance of real estate financing activities. (3) Accounts classified as OTHER PAYABLES/Foreign Exchange Portfolio.
a.2) Income from lending operations
Specification 06/30/2011 06/30/2010
Loans and discounted notes 438,179 357,723
Financing 222,349 146,440
Rural and agro-industrial financing 75,881 147,838
Recovery of receivables written off as loss 47,207 43,864
Guarantees honored 1 -
Other (355) (591)
TOTAL 783,262 695,274
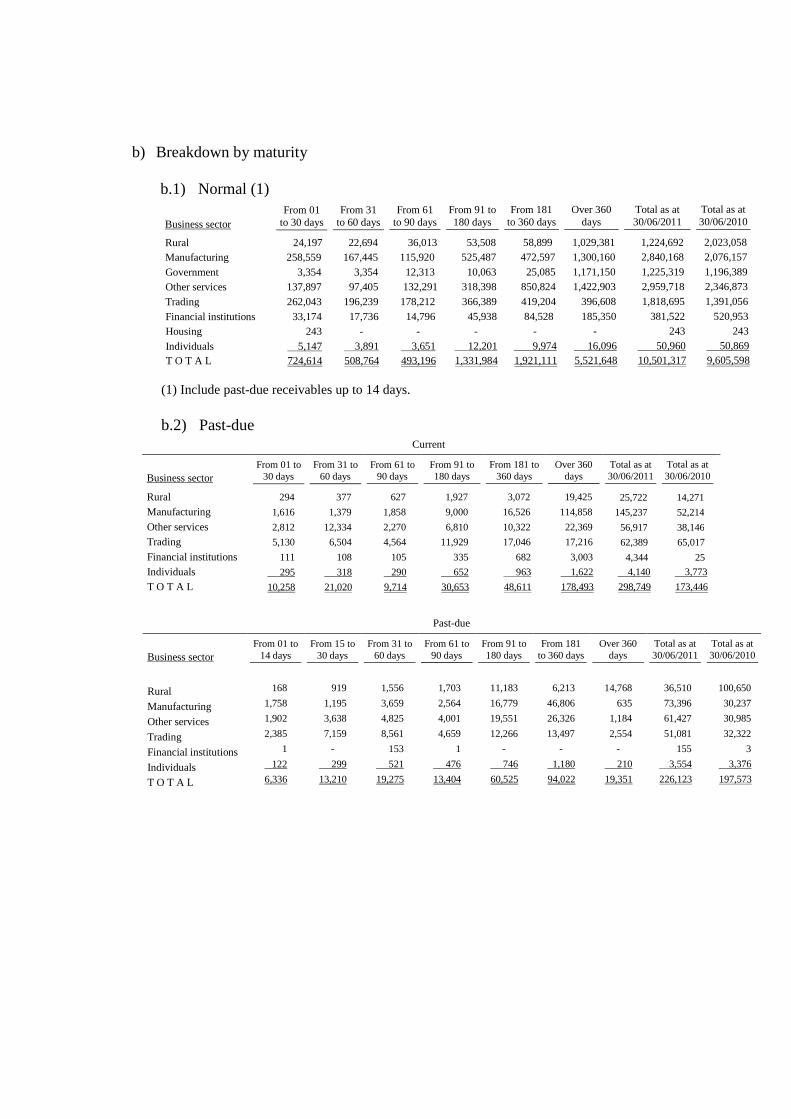
b) Breakdown by maturity
b.1) Normal (1)
Business sector From 01
to 30 days From 31
to 60 days From 61
to 90 days From 91 to 180 days
From 181 to 360 days
Over 360 days
Total as at 30/06/2011
Total as at 30/06/2010
Rural 24,197 22,694 36,013 53,508 58,899 1,029,381 1,224,692 2,023,058
Manufacturing 258,559 167,445 115,920 525,487 472,597 1,300,160 2,840,168 2,076,157
Government 3,354 3,354 12,313 10,063 25,085 1,171,150 1,225,319 1,196,389
Other services 137,897 97,405 132,291 318,398 850,824 1,422,903 2,959,718 2,346,873
Trading 262,043 196,239 178,212 366,389 419,204 396,608 1,818,695 1,391,056
Financial institutions 33,174 17,736 14,796 45,938 84,528 185,350 381,522 520,953
Housing 243 - - - - - 243 243
Individuals 5,147 3,891 3,651 12,201 9,974 16,096 50,960 50,869
T O T A L 724,614 508,764 493,196 1,331,984 1,921,111 5,521,648 10,501,317 9,605,598 (1) Include past-due receivables up to 14 days.
b.2) Past-due
Current
Business sector
From 01 to 30 days
From 31 to 60 days
From 61 to 90 days
From 91 to 180 days
From 181 to 360 days
Over 360 days
Total as at 30/06/2011
Total as at 30/06/2010
Rural 294 377 627 1,927 3,072 19,425 25,722 14,271
Manufacturing 1,616 1,379 1,858 9,000 16,526 114,858 145,237 52,214
Other services 2,812 12,334 2,270 6,810 10,322 22,369 56,917 38,146
Trading 5,130 6,504 4,564 11,929 17,046 17,216 62,389 65,017
Financial institutions 111 108 105 335 682 3,003 4,344 25
Individuals 295 318 290 652 963 1,622 4,140 3,773
T O T A L 10,258 21,020 9,714 30,653 48,611 178,493 298,749 173,446
Past-due
Business sector
From 01 to 14 days
From 15 to 30 days
From 31 to 60 days
From 61 to 90 days
From 91 to 180 days
From 181 to 360 days
Over 360 days
Total as at 30/06/2011
Total as at 30/06/2010
Rural 168 919 1,556 1,703
11,183 6,213 14,768 36,510 100,650
Manufacturing 1,758 1,195 3,659 2,564 16,779 46,806 635 73,396 30,237
Other services 1,902 3,638 4,825 4,001 19,551 26,326 1,184 61,427 30,985
Trading 2,385 7,159 8,561 4,659 12,266 13,497 2,554 51,081 32,322
Financial institutions 1 - 153 1 - - - 155 3
Individuals 122 299 521 476 746 1,180 210 3,554 3,376
T O T A L 6,336 13,210 19,275 13,404 60,525 94,022 19,351 226,123 197,573
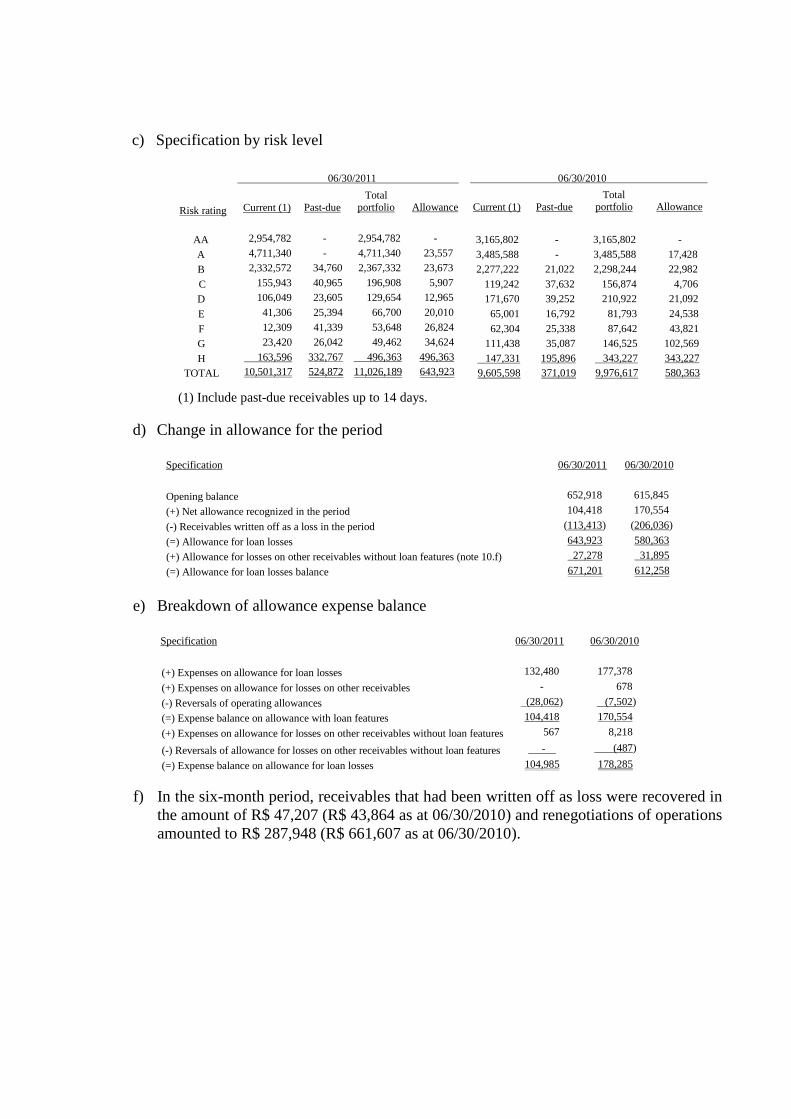
c) Specification by risk level
Risk rating
06/30/2011 06/30/2010
Current (1)
Past-due Total
portfolio
Allowance
Current (1)
Past-due Total
portfolio
Allowance
AA 2,954,782 - 2,954,782 - 3,165,802 - 3,165,802 -
A 4,711,340 - 4,711,340 23,557 3,485,588 - 3,485,588 17,428
B 2,332,572 34,760 2,367,332 23,673 2,277,222 21,022 2,298,244 22,982
C 155,943 40,965 196,908 5,907 119,242 37,632 156,874 4,706
D 106,049 23,605 129,654 12,965 171,670 39,252 210,922 21,092
E 41,306 25,394 66,700 20,010 65,001 16,792 81,793 24,538
F 12,309 41,339 53,648 26,824 62,304 25,338 87,642 43,821
G 23,420 26,042 49,462 34,624 111,438 35,087 146,525 102,569
H 163,596 332,767 496,363 496,363 147,331 195,896 343,227 343,227
TOTAL 10,501,317 524,872 11,026,189 643,923 9,605,598 371,019 9,976,617 580,363
(1) Include past-due receivables up to 14 days.
d) Change in allowance for the period
Specification 06/30/2011 06/30/2010
Opening balance 652,918 615,845
(+) Net allowance recognized in the period 104,418 170,554
(-) Receivables written off as a loss in the period (113,413) (206,036)
(=) Allowance for loan losses 643,923 580,363
(+) Allowance for losses on other receivables without loan features (note 10.f) 27,278 31,895
(=) Allowance for loan losses balance 671,201 612,258
e) Breakdown of allowance expense balance
Specification 06/30/2011 06/30/2010
(+) Expenses on allowance for loan losses 132,480 177,378
(+) Expenses on allowance for losses on other receivables - 678
(-) Reversals of operating allowances (28,062) (7,502)
(=) Expense balance on allowance with loan features 104,418 170,554
(+) Expenses on allowance for losses on other receivables without loan features 567 8,218
(-) Reversals of allowance for losses on other receivables without loan features - (487)
(=) Expense balance on allowance for loan losses 104,985 178,285
f) In the six-month period, receivables that had been written off as loss were recovered in
the amount of R$ 47,207 (R$ 43,864 as at 06/30/2010) and renegotiations of operations amounted to R$ 287,948 (R$ 661,607 as at 06/30/2010).
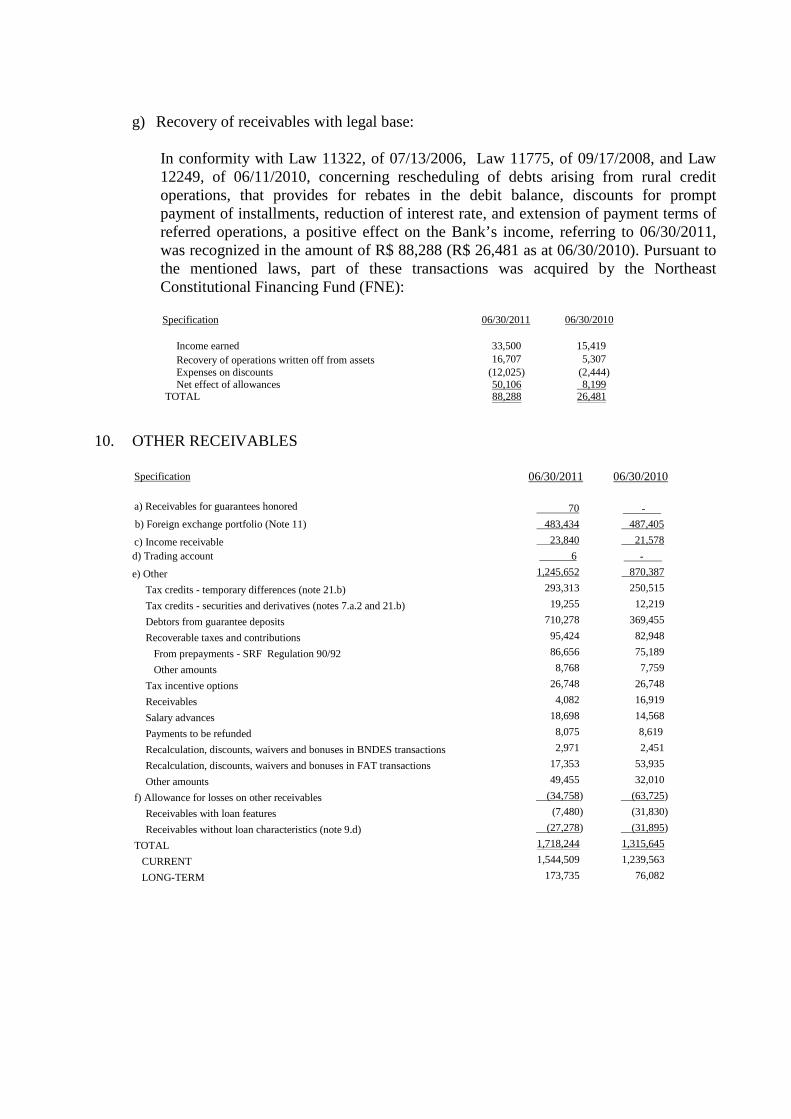
g) Recovery of receivables with legal base: In conformity with Law 11322, of 07/13/2006, Law 11775, of 09/17/2008, and Law 12249, of 06/11/2010, concerning rescheduling of debts arising from rural credit operations, that provides for rebates in the debit balance, discounts for prompt payment of installments, reduction of interest rate, and extension of payment terms of referred operations, a positive effect on the Bank’s income, referring to 06/30/2011, was recognized in the amount of R$ 88,288 (R$ 26,481 as at 06/30/2010). Pursuant to the mentioned laws, part of these transactions was acquired by the Northeast Constitutional Financing Fund (FNE):
Specification 06/30/2011 06/30/2010 Income earned 33,500 15,419 Recovery of operations written off from assets 16,707 5,307 Expenses on discounts (12,025) (2,444) Net effect of allowances 50,106 8,199
TOTAL 88,288 26,481
10. OTHER RECEIVABLES
Specification 06/30/2011 06/30/2010
a) Receivables for guarantees honored
70 - b) Foreign exchange portfolio (Note 11) 483,434 487,405
c) Income receivable 23,840 21,578
d) Trading account 6 -
e) Other 1,245,652 870,387
Tax credits - temporary differences (note 21.b) 293,313 250,515
Tax credits - securities and derivatives (notes 7.a.2 and 21.b) 19,255 12,219
Debtors from guarantee deposits 710,278 369,455
Recoverable taxes and contributions 95,424 82,948
From prepayments - SRF Regulation 90/92 86,656 75,189
Other amounts 8,768 7,759
Tax incentive options 26,748 26,748
Receivables 4,082 16,919
Salary advances 18,698 14,568
Payments to be refunded 8,075 8,619
Recalculation, discounts, waivers and bonuses in BNDES transactions 2,971 2,451
Recalculation, discounts, waivers and bonuses in FAT transactions 17,353 53,935
Other amounts 49,455 32,010
f) Allowance for losses on other receivables (34,758) (63,725)
Receivables with loan features (7,480) (31,830)
Receivables without loan characteristics (note 9.d) (27,278) (31,895)
TOTAL 1,718,244 1,315,645
CURRENT 1,544,509 1,239,563
LONG-TERM 173,735 76,082
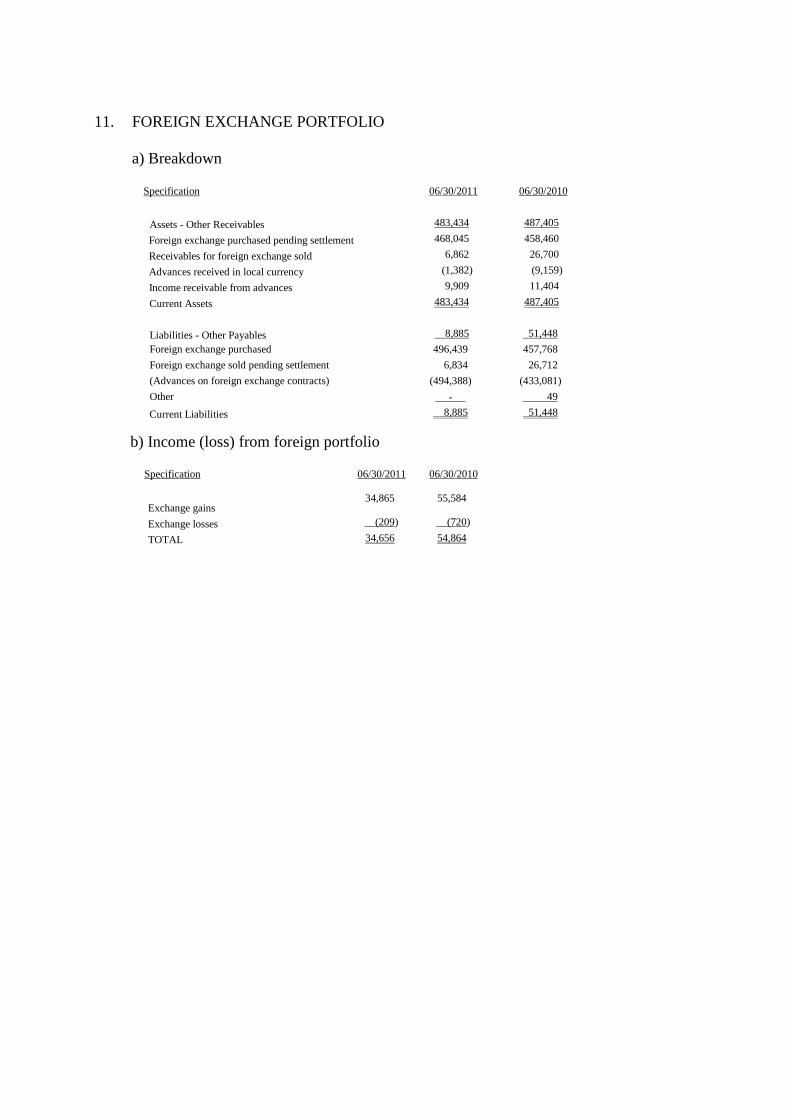
11. FOREIGN EXCHANGE PORTFOLIO
a) Breakdown Specification 06/30/2011 06/30/2010
Assets - Other Receivables 483,434 487,405
Foreign exchange purchased pending settlement 468,045 458,460
Receivables for foreign exchange sold 6,862 26,700
Advances received in local currency (1,382) (9,159)
Income receivable from advances 9,909 11,404
Current Assets 483,434 487,405
Liabilities - Other Payables 8,885 51,448
Foreign exchange purchased 496,439 457,768
Foreign exchange sold pending settlement 6,834 26,712
(Advances on foreign exchange contracts) (494,388) (433,081)
Other - 49
Current Liabilities 8,885 51,448
b) Income (loss) from foreign portfolio
Specification 06/30/2011 06/30/2010
Exchange gains 34,865 55,584
Exchange losses (209) (720)
TOTAL 34,656 54,864
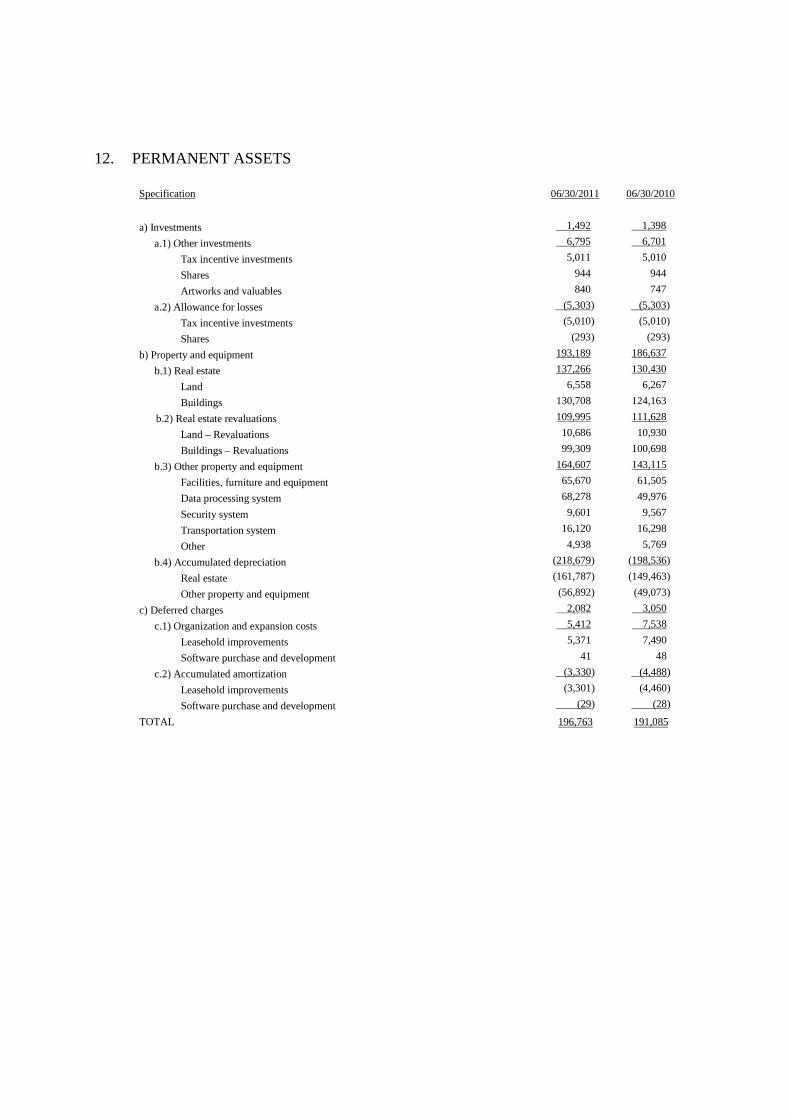
12. PERMANENT ASSETS
Specification 06/30/2011 06/30/2010
a) Investments 1,492 1,398
a.1) Other investments 6,795 6,701
Tax incentive investments 5,011 5,010
Shares 944 944
Artworks and valuables 840 747
a.2) Allowance for losses (5,303) (5,303)
Tax incentive investments (5,010) (5,010)
Shares (293) (293)
b) Property and equipment 193,189 186,637
b.1) Real estate 137,266 130,430
Land 6,558 6,267
Buildings 130,708 124,163
b.2) Real estate revaluations 109,995 111,628
Land – Revaluations 10,686 10,930
Buildings – Revaluations 99,309 100,698
b.3) Other property and equipment 164,607 143,115
Facilities, furniture and equipment 65,670 61,505
Data processing system 68,278 49,976
Security system 9,601 9,567
Transportation system 16,120 16,298
Other 4,938 5,769
b.4) Accumulated depreciation (218,679) (198,536)
Real estate (161,787) (149,463)
Other property and equipment (56,892) (49,073)
c) Deferred charges 2,082 3,050
c.1) Organization and expansion costs 5,412 7,538
Leasehold improvements 5,371 7,490
Software purchase and development 41 48
c.2) Accumulated amortization (3,330) (4,488)
Leasehold improvements (3,301) (4,460)
Software purchase and development (29) (28)
TOTAL 196,763 191,085
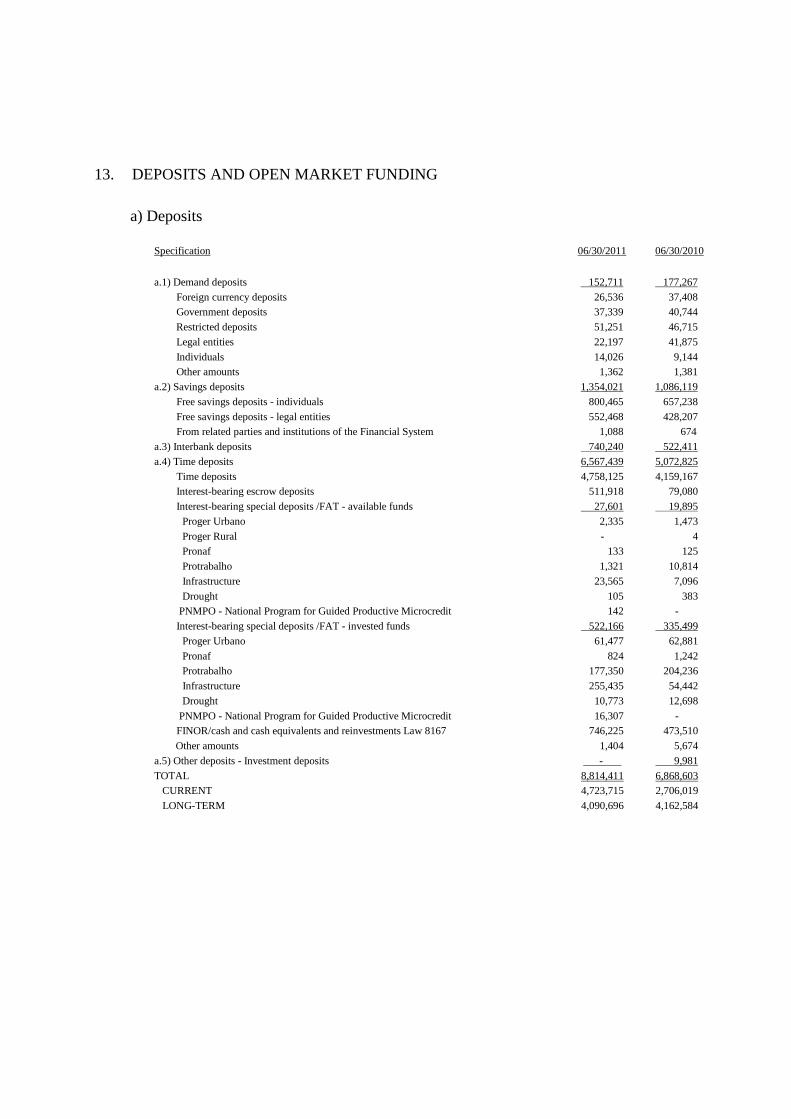
13. DEPOSITS AND OPEN MARKET FUNDING
a) Deposits
Specification 06/30/2011 06/30/2010
a.1) Demand deposits 152,711 177,267
Foreign currency deposits 26,536 37,408 Government deposits 37,339 40,744
Restricted deposits 51,251 46,715
Legal entities 22,197 41,875
Individuals 14,026 9,144 Other amounts 1,362 1,381
a.2) Savings deposits 1,354,021 1,086,119
Free savings deposits - individuals 800,465 657,238
Free savings deposits - legal entities 552,468 428,207 From related parties and institutions of the Financial System 1,088 674
a.3) Interbank deposits 740,240 522,411
a.4) Time deposits 6,567,439 5,072,825
Time deposits 4,758,125 4,159,167 Interest-bearing escrow deposits 511,918 79,080
Interest-bearing special deposits /FAT - available funds 27,601 19,895
Proger Urbano 2,335 1,473
Proger Rural - 4 Pronaf 133 125
Protrabalho 1,321 10,814
Infrastructure 23,565 7,096
Drought 105 383 PNMPO - National Program for Guided Productive Microcredit 142 -
Interest-bearing special deposits /FAT - invested funds 522,166 335,499
Proger Urbano 61,477 62,881
Pronaf 824 1,242 Protrabalho 177,350 204,236
Infrastructure 255,435 54,442
Drought 10,773 12,698
PNMPO - National Program for Guided Productive Microcredit 16,307 - FINOR/cash and cash equivalents and reinvestments Law 8167 746,225 473,510
Other amounts 1,404 5,674
a.5) Other deposits - Investment deposits - 9,981
TOTAL 8,814,411 6,868,603 CURRENT 4,723,715 2,706,019
LONG-TERM 4,090,696 4,162,584
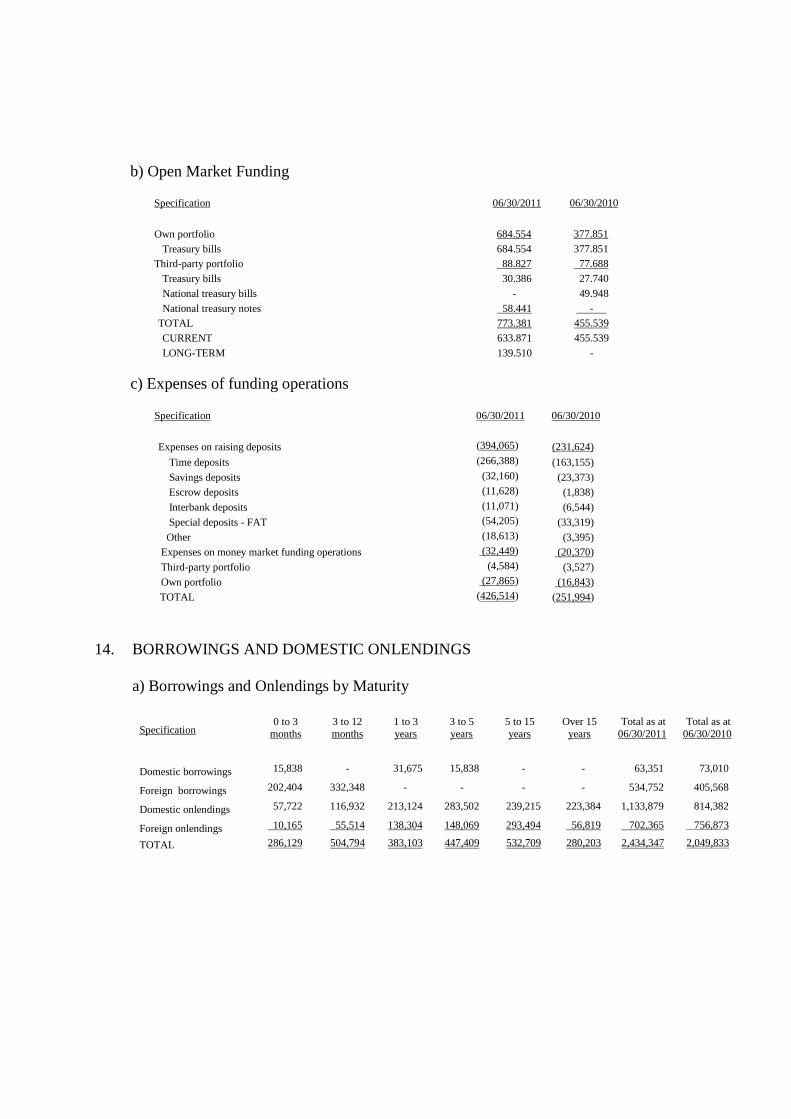
b) Open Market Funding
Specification 06/30/2011 06/30/2010
Own portfolio 684.554 377.851
Treasury bills 684.554 377.851 Third-party portfolio 88.827 77.688
Treasury bills 30.386 27.740
National treasury bills - 49.948
National treasury notes 58.441 - TOTAL 773.381 455.539
CURRENT 633.871 455.539
LONG-TERM 139.510 -
c) Expenses of funding operations
Specification 06/30/2011 06/30/2010
Expenses on raising deposits (394,065) (231,624)
Time deposits (266,388) (163,155)
Savings deposits (32,160) (23,373) Escrow deposits (11,628) (1,838)
Interbank deposits (11,071) (6,544)
Special deposits - FAT (54,205) (33,319)
Other (18,613) (3,395) Expenses on money market funding operations (32,449) (20,370)
Third-party portfolio (4,584) (3,527)
Own portfolio (27,865) (16,843)
TOTAL (426,514) (251,994)
14. BORROWINGS AND DOMESTIC ONLENDINGS
a) Borrowings and Onlendings by Maturity
Specification 0 to 3
months 3 to 12 months
1 to 3 years
3 to 5 years
5 to 15 years
Over 15 years
Total as at 06/30/2011
Total as at 06/30/2010
Domestic borrowings 15,838 - 31,675 15,838 - - 63,351 73,010
Foreign borrowings 202,404 332,348 - - - - 534,752 405,568
Domestic onlendings 57,722 116,932 213,124 283,502 239,215 223,384 1,133,879 814,382
Foreign onlendings 10,165 55,514 138,304 148,069 293,494 56,819 702,365 756,873
TOTAL 286,129 504,794 383,103 447,409 532,709 280,203 2,434,347 2,049,833
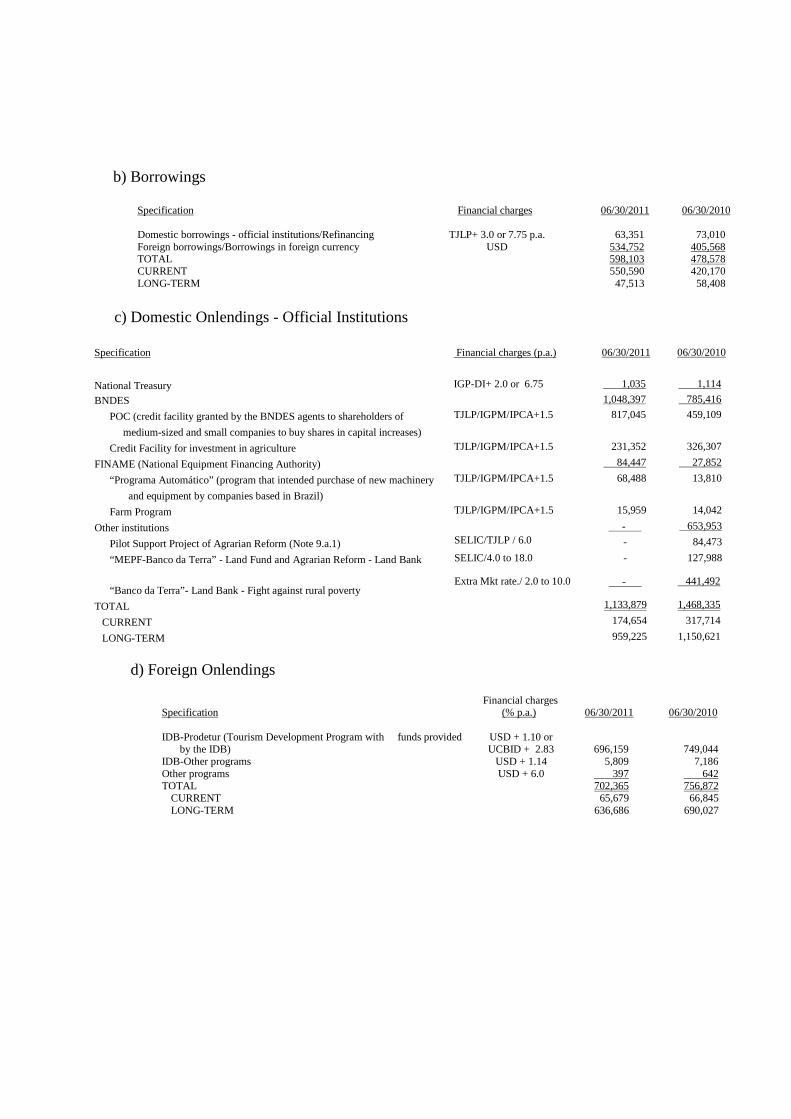
b) Borrowings
Specification Financial charges 06/30/2011 06/30/2010 Domestic borrowings - official institutions/Refinancing TJLP+ 3.0 or 7.75 p.a. 63,351 73,010 Foreign borrowings/Borrowings in foreign currency USD 534,752 405,568 TOTAL 598,103 478,578 CURRENT 550,590 420,170 LONG-TERM 47,513 58,408
c) Domestic Onlendings - Official Institutions Specification Financial charges (p.a.) 06/30/2011 06/30/2010
National Treasury IGP-DI+ 2.0 or 6.75 1,035 1,114
BNDES 1,048,397 785,416
POC (credit facility granted by the BNDES agents to shareholders of TJLP/IGPM/IPCA+1.5 817,045 459,109
medium-sized and small companies to buy shares in capital increases)
Credit Facility for investment in agriculture TJLP/IGPM/IPCA+1.5 231,352 326,307
FINAME (National Equipment Financing Authority) 84,447 27,852
“Programa Automático” (program that intended purchase of new machinery TJLP/IGPM/IPCA+1.5 68,488 13,810
and equipment by companies based in Brazil)
Farm Program TJLP/IGPM/IPCA+1.5 15,959 14,042
Other institutions - 653,953
Pilot Support Project of Agrarian Reform (Note 9.a.1) SELIC/TJLP / 6.0
- 84,473
“MEPF-Banco da Terra” - Land Fund and Agrarian Reform - Land Bank SELIC/4.0 to 18.0 - 127,988
“Banco da Terra”- Land Bank - Fight against rural poverty Extra Mkt rate./ 2.0 to 10.0 - 441,492
TOTAL 1,133,879 1,468,335
CURRENT 174,654 317,714
LONG-TERM 959,225 1,150,621
d) Foreign Onlendings Specification
Financial charges (% p.a.)
06/30/2011
06/30/2010
IDB-Prodetur (Tourism Development Program with funds provided
by the IDB) USD + 1.10 or UCBID + 2.83
696,159
749,044
IDB-Other programs USD + 1.14 5,809 7,186 Other programs USD + 6.0 397 642 TOTAL 702,365 756,872
CURRENT 65,679 66,845 LONG-TERM 636,686 690,027
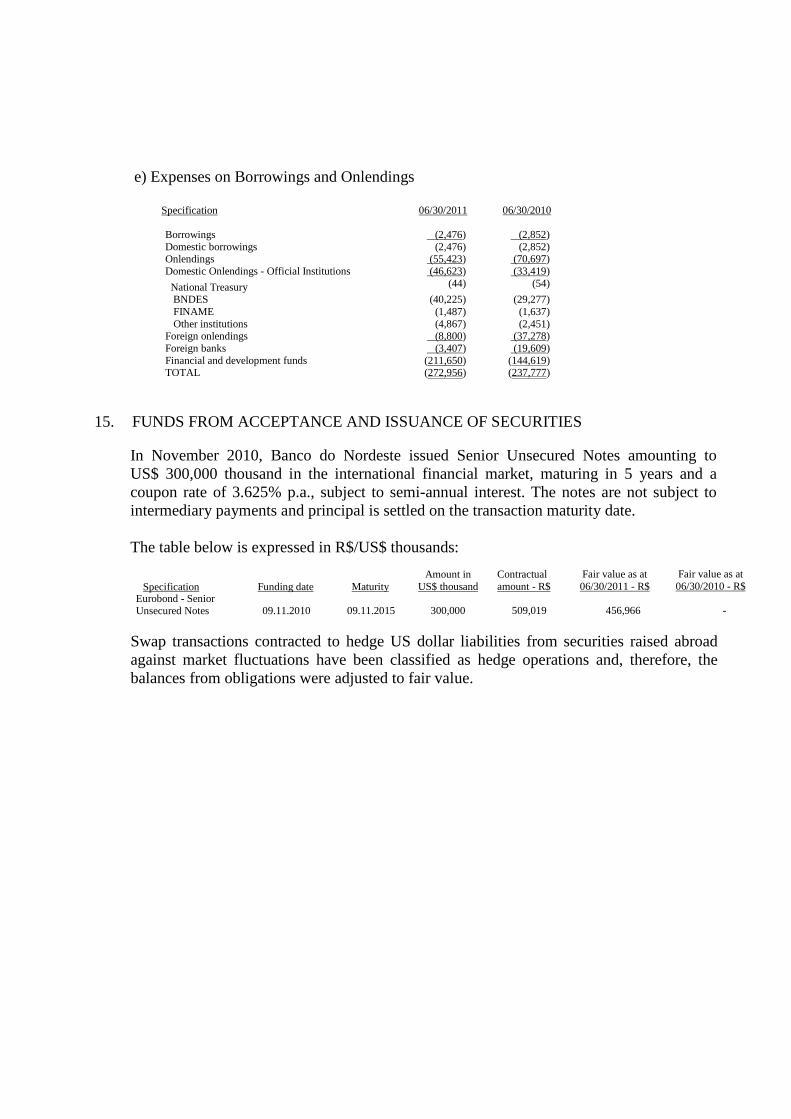
e) Expenses on Borrowings and Onlendings
Specification 06/30/2011 06/30/2010 Borrowings (2,476) (2,852) Domestic borrowings (2,476) (2,852) Onlendings (55,423) (70,697) Domestic Onlendings - Official Institutions (46,623) (33,419)
National Treasury (44) (54)
BNDES (40,225) (29,277) FINAME (1,487) (1,637) Other institutions (4,867) (2,451) Foreign onlendings (8,800) (37,278) Foreign banks (3,407) (19,609) Financial and development funds (211,650) (144,619) TOTAL (272,956) (237,777)
15. FUNDS FROM ACCEPTANCE AND ISSUANCE OF SECURITIES
In November 2010, Banco do Nordeste issued Senior Unsecured Notes amounting to US$ 300,000 thousand in the international financial market, maturing in 5 years and a coupon rate of 3.625% p.a., subject to semi-annual interest. The notes are not subject to intermediary payments and principal is settled on the transaction maturity date. The table below is expressed in R$/US$ thousands:
Specification
Funding date
Maturity
Amount in
US$ thousand
Contractual amount - R$
Fair value as at 06/30/2011 - R$
Fair value as at 06/30/2010 - R$
Eurobond - Senior Unsecured Notes
09.11.2010
09.11.2015
300,000
509,019
456,966
-
Swap transactions contracted to hedge US dollar liabilities from securities raised abroad against market fluctuations have been classified as hedge operations and, therefore, the balances from obligations were adjusted to fair value.
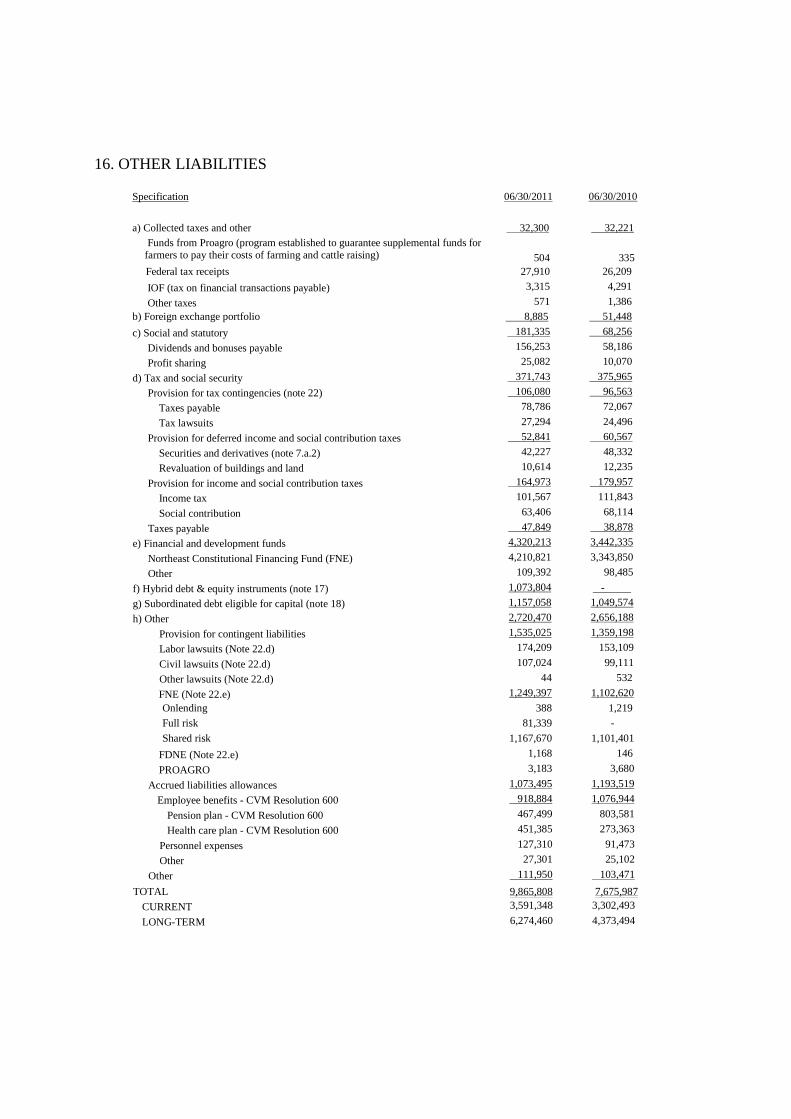
16. OTHER LIABILITIES
Specification 06/30/2011 06/30/2010
a) Collected taxes and other 32,300 32,221
Funds from Proagro (program established to guarantee supplemental funds for farmers to pay their costs of farming and cattle raising)
504 335 Federal tax receipts 27,910 26,209
IOF (tax on financial transactions payable) 3,315 4,291
Other taxes 571 1,386
b) Foreign exchange portfolio 8,885 51,448
c) Social and statutory 181,335 68,256
Dividends and bonuses payable 156,253 58,186
Profit sharing 25,082 10,070
d) Tax and social security 371,743 375,965
Provision for tax contingencies (note 22) 106,080 96,563
Taxes payable 78,786 72,067
Tax lawsuits 27,294 24,496
Provision for deferred income and social contribution taxes 52,841 60,567
Securities and derivatives (note 7.a.2) 42,227 48,332
Revaluation of buildings and land 10,614 12,235
Provision for income and social contribution taxes 164,973 179,957
Income tax 101,567 111,843
Social contribution 63,406 68,114
Taxes payable 47,849 38,878
e) Financial and development funds 4,320,213 3,442,335
Northeast Constitutional Financing Fund (FNE) 4,210,821 3,343,850
Other 109,392 98,485
f) Hybrid debt & equity instruments (note 17) 1,073,804 - g) Subordinated debt eligible for capital (note 18) 1,157,058 1,049,574
h) Other 2,720,470 2,656,188
Provision for contingent liabilities 1,535,025 1,359,198
Labor lawsuits (Note 22.d) 174,209 153,109
Civil lawsuits (Note 22.d) 107,024 99,111
Other lawsuits (Note 22.d) 44 532
FNE (Note 22.e) 1,249,397 1,102,620
Onlending 388 1,219
Full risk 81,339 -
Shared risk 1,167,670 1,101,401
FDNE (Note 22.e) 1,168 146
PROAGRO 3,183 3,680
Accrued liabilities allowances 1,073,495 1,193,519
Employee benefits - CVM Resolution 600 918,884 1,076,944
Pension plan - CVM Resolution 600 467,499 803,581
Health care plan - CVM Resolution 600 451,385 273,363
Personnel expenses 127,310 91,473
Other 27,301 25,102
Other 111,950 103,471
TOTAL 9,865,808 7,675,987
CURRENT 3,591,348 3,302,493
LONG-TERM 6,274,460 4,373,494
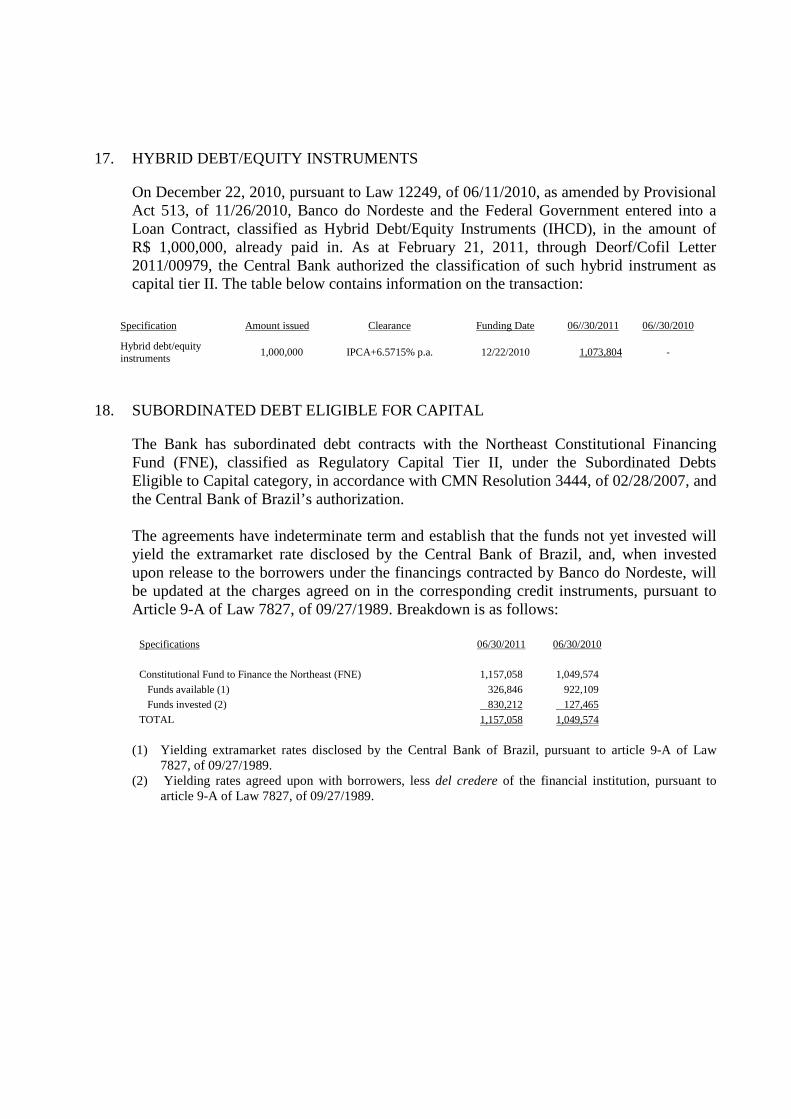
17. HYBRID DEBT/EQUITY INSTRUMENTS
On December 22, 2010, pursuant to Law 12249, of 06/11/2010, as amended by Provisional Act 513, of 11/26/2010, Banco do Nordeste and the Federal Government entered into a Loan Contract, classified as Hybrid Debt/Equity Instruments (IHCD), in the amount of R$ 1,000,000, already paid in. As at February 21, 2011, through Deorf/Cofil Letter 2011/00979, the Central Bank authorized the classification of such hybrid instrument as capital tier II. The table below contains information on the transaction:
Specification Amount issued Clearance Funding Date 06//30/2011 06//30/2010
Hybrid debt/equity instruments
1,000,000 IPCA+6.5715% p.a. 12/22/2010 1,073,804 -
18. SUBORDINATED DEBT ELIGIBLE FOR CAPITAL
The Bank has subordinated debt contracts with the Northeast Constitutional Financing Fund (FNE), classified as Regulatory Capital Tier II, under the Subordinated Debts Eligible to Capital category, in accordance with CMN Resolution 3444, of 02/28/2007, and the Central Bank of Brazil’s authorization. The agreements have indeterminate term and establish that the funds not yet invested will yield the extramarket rate disclosed by the Central Bank of Brazil, and, when invested upon release to the borrowers under the financings contracted by Banco do Nordeste, will be updated at the charges agreed on in the corresponding credit instruments, pursuant to Article 9-A of Law 7827, of 09/27/1989. Breakdown is as follows:
Specifications 06/30/2011 06/30/2010
Constitutional Fund to Finance the Northeast (FNE) 1,157,058 1,049,574
Funds available (1) 326,846 922,109
Funds invested (2) 830,212 127,465
TOTAL 1,157,058 1,049,574
(1) Yielding extramarket rates disclosed by the Central Bank of Brazil, pursuant to article 9-A of Law 7827, of 09/27/1989.
(2) Yielding rates agreed upon with borrowers, less del credere of the financial institution, pursuant to article 9-A of Law 7827, of 09/27/1989.
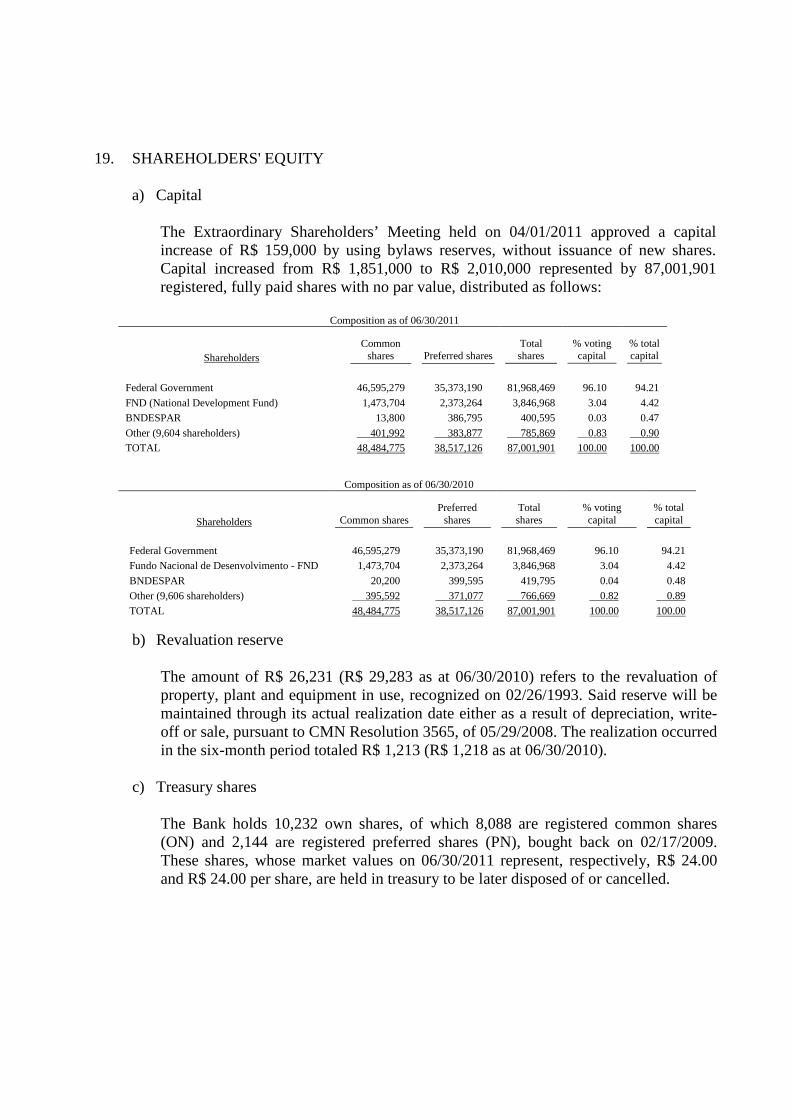
19. SHAREHOLDERS' EQUITY
a) Capital The Extraordinary Shareholders’ Meeting held on 04/01/2011 approved a capital increase of R$ 159,000 by using bylaws reserves, without issuance of new shares. Capital increased from R$ 1,851,000 to R$ 2,010,000 represented by 87,001,901 registered, fully paid shares with no par value, distributed as follows:
Composition as of 06/30/2011
Shareholders Common
shares Preferred shares Total shares
% voting capital
% total capital
Federal Government 46,595,279 35,373,190 81,968,469 96.10 94.21
FND (National Development Fund) 1,473,704 2,373,264 3,846,968 3.04 4.42
BNDESPAR 13,800 386,795 400,595 0.03 0.47
Other (9,604 shareholders) 401,992 383,877 785,869 0.83 0.90
TOTAL 48,484,775 38,517,126 87,001,901 100.00 100.00
Composition as of 06/30/2010
Shareholders Common shares Preferred
shares Total shares
% voting capital
% total capital
Federal Government 46,595,279 35,373,190 81,968,469 96.10 94.21
Fundo Nacional de Desenvolvimento - FND 1,473,704 2,373,264 3,846,968 3.04 4.42
BNDESPAR 20,200 399,595 419,795 0.04 0.48
Other (9,606 shareholders) 395,592 371,077 766,669 0.82 0.89
TOTAL 48,484,775 38,517,126 87,001,901 100.00 100.00
b) Revaluation reserve
The amount of R$ 26,231 (R$ 29,283 as at 06/30/2010) refers to the revaluation of property, plant and equipment in use, recognized on 02/26/1993. Said reserve will be maintained through its actual realization date either as a result of depreciation, write-off or sale, pursuant to CMN Resolution 3565, of 05/29/2008. The realization occurred in the six-month period totaled R$ 1,213 (R$ 1,218 as at 06/30/2010).
c) Treasury shares
The Bank holds 10,232 own shares, of which 8,088 are registered common shares (ON) and 2,144 are registered preferred shares (PN), bought back on 02/17/2009. These shares, whose market values on 06/30/2011 represent, respectively, R$ 24.00 and R$ 24.00 per share, are held in treasury to be later disposed of or cancelled.
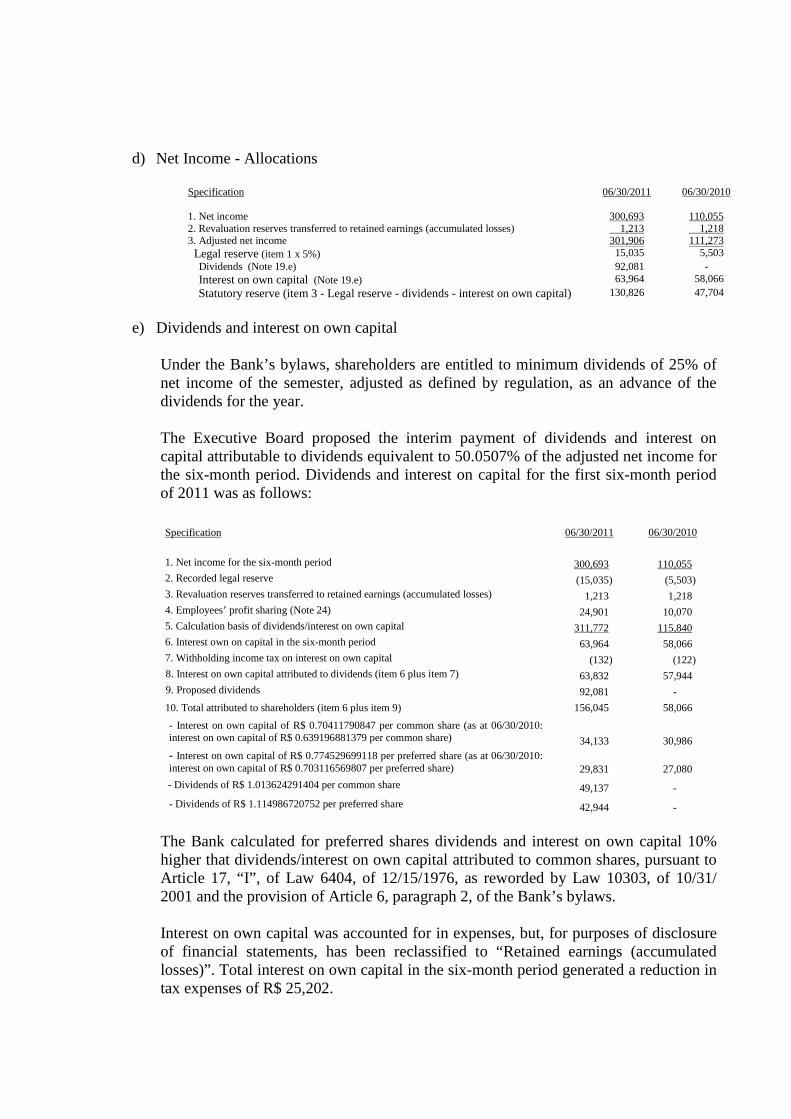
d) Net Income - Allocations
Specification 06/30/2011 06/30/2010 1. Net income 300,693 110,055 2. Revaluation reserves transferred to retained earnings (accumulated losses) 1,213 1,218 3. Adjusted net income 301,906 111,273 Legal reserve (item 1 x 5%) 15,035 5,503 Dividends (Note 19.e) 92,081 - Interest on own capital (Note 19.e) 63,964 58,066
Statutory reserve (item 3 - Legal reserve - dividends - interest on own capital) 130,826 47,704
e) Dividends and interest on own capital
Under the Bank’s bylaws, shareholders are entitled to minimum dividends of 25% of net income of the semester, adjusted as defined by regulation, as an advance of the dividends for the year.
The Executive Board proposed the interim payment of dividends and interest on capital attributable to dividends equivalent to 50.0507% of the adjusted net income for the six-month period. Dividends and interest on capital for the first six-month period of 2011 was as follows:
Specification 06/30/2011 06/30/2010 1. Net income for the six-month period 300,693 110,055 2. Recorded legal reserve (15,035) (5,503) 3. Revaluation reserves transferred to retained earnings (accumulated losses) 1,213 1,218 4. Employees’ profit sharing (Note 24) 24,901 10,070 5. Calculation basis of dividends/interest on own capital 311,772 115,840 6. Interest own on capital in the six-month period 63,964 58,066 7. Withholding income tax on interest on own capital (132) (122) 8. Interest on own capital attributed to dividends (item 6 plus item 7) 63,832 57,944 9. Proposed dividends 92,081 -
10. Total attributed to shareholders (item 6 plus item 9) 156,045 58,066
- Interest on own capital of R$ 0.70411790847 per common share (as at 06/30/2010: interest on own capital of R$ 0.639196881379 per common share) 34,133 30,986 - Interest on own capital of R$ 0.774529699118 per preferred share (as at 06/30/2010: interest on own capital of R$ 0.703116569807 per preferred share) 29,831 27,080
- Dividends of R$ 1.013624291404 per common share 49,137 -
- Dividends of R$ 1.114986720752 per preferred share 42,944 -
The Bank calculated for preferred shares dividends and interest on own capital 10% higher that dividends/interest on own capital attributed to common shares, pursuant to Article 17, “I”, of Law 6404, of 12/15/1976, as reworded by Law 10303, of 10/31/ 2001 and the provision of Article 6, paragraph 2, of the Bank’s bylaws. Interest on own capital was accounted for in expenses, but, for purposes of disclosure of financial statements, has been reclassified to “Retained earnings (accumulated losses)”. Total interest on own capital in the six-month period generated a reduction in tax expenses of R$ 25,202.
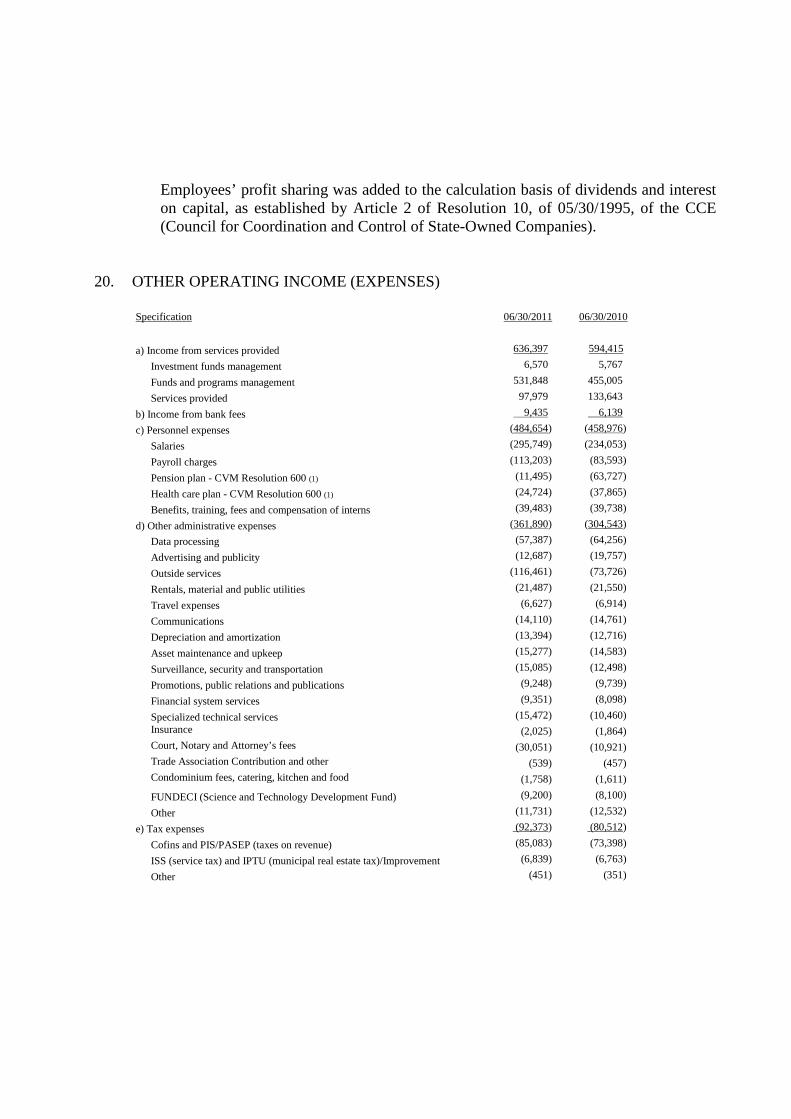
Employees’ profit sharing was added to the calculation basis of dividends and interest on capital, as established by Article 2 of Resolution 10, of 05/30/1995, of the CCE (Council for Coordination and Control of State-Owned Companies).
20. OTHER OPERATING INCOME (EXPENSES)
Specification 06/30/2011 06/30/2010
a) Income from services provided 636,397 594,415
Investment funds management 6,570 5,767
Funds and programs management 531,848 455,005
Services provided 97,979 133,643
b) Income from bank fees 9,435 6,139
c) Personnel expenses (484,654) (458,976)
Salaries (295,749) (234,053)
Payroll charges (113,203) (83,593)
Pension plan - CVM Resolution 600 (1) (11,495) (63,727)
Health care plan - CVM Resolution 600 (1) (24,724) (37,865)
Benefits, training, fees and compensation of interns (39,483) (39,738)
d) Other administrative expenses (361,890) (304,543)
Data processing (57,387) (64,256)
Advertising and publicity (12,687) (19,757)
Outside services (116,461) (73,726)
Rentals, material and public utilities (21,487) (21,550)
Travel expenses (6,627) (6,914)
Communications (14,110) (14,761)
Depreciation and amortization (13,394) (12,716)
Asset maintenance and upkeep (15,277) (14,583)
Surveillance, security and transportation (15,085) (12,498)
Promotions, public relations and publications (9,248) (9,739)
Financial system services (9,351) (8,098)
Specialized technical services (15,472) (10,460) Insurance (2,025) (1,864) Court, Notary and Attorney’s fees (30,051) (10,921) Trade Association Contribution and other (539) (457) Condominium fees, catering, kitchen and food (1,758) (1,611)
FUNDECI (Science and Technology Development Fund) (9,200) (8,100)
Other (11,731) (12,532)
e) Tax expenses (92,373) (80,512)
Cofins and PIS/PASEP (taxes on revenue) (85,083) (73,398)
ISS (service tax) and IPTU (municipal real estate tax)/Improvement (6,839) (6,763)
Other (451) (351)
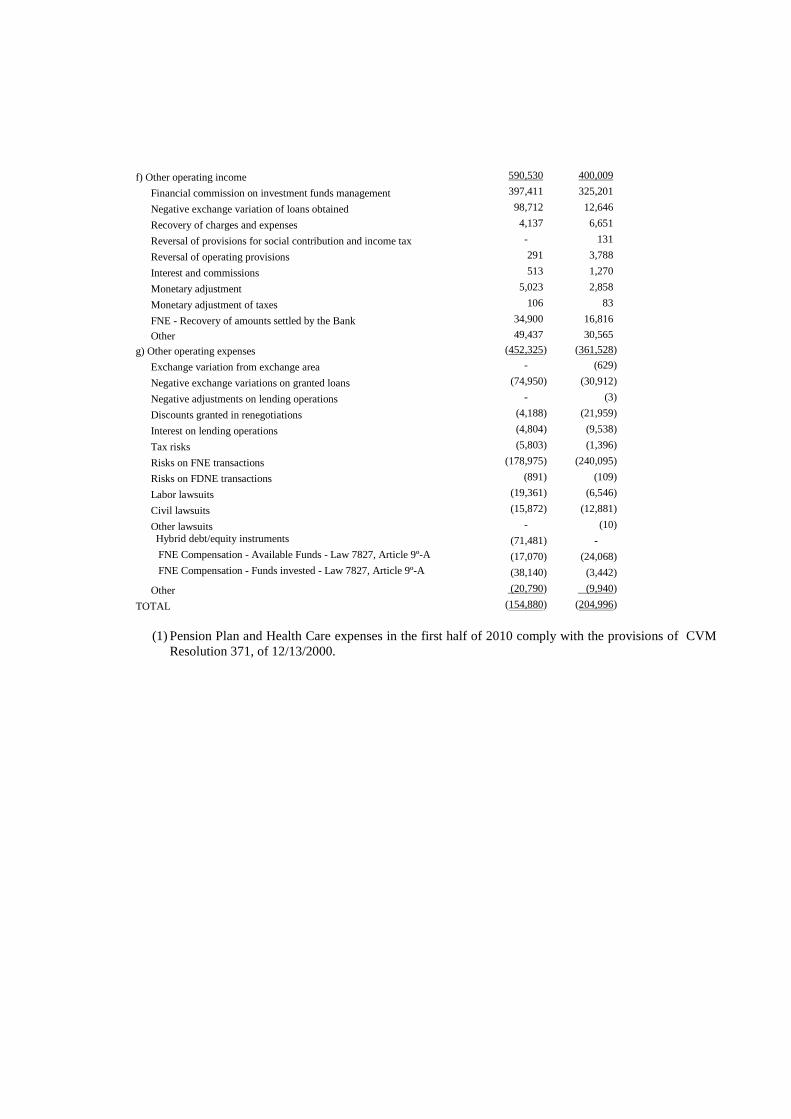
f) Other operating income 590,530 400,009
Financial commission on investment funds management 397,411 325,201
Negative exchange variation of loans obtained 98,712 12,646
Recovery of charges and expenses 4,137 6,651
Reversal of provisions for social contribution and income tax - 131
Reversal of operating provisions 291 3,788
Interest and commissions 513 1,270
Monetary adjustment 5,023 2,858
Monetary adjustment of taxes 106 83
FNE - Recovery of amounts settled by the Bank 34,900 16,816
Other 49,437 30,565
g) Other operating expenses (452,325) (361,528)
Exchange variation from exchange area - (629)
Negative exchange variations on granted loans (74,950) (30,912)
Negative adjustments on lending operations - (3)
Discounts granted in renegotiations (4,188) (21,959)
Interest on lending operations (4,804) (9,538)
Tax risks (5,803) (1,396)
Risks on FNE transactions (178,975) (240,095)
Risks on FDNE transactions (891) (109)
Labor lawsuits (19,361) (6,546)
Civil lawsuits (15,872) (12,881)
Other lawsuits - (10) Hybrid debt/equity instruments (71,481) -
FNE Compensation - Available Funds - Law 7827, Article 9º-A (17,070) (24,068) FNE Compensation - Funds invested - Law 7827, Article 9º-A (38,140) (3,442)
Other (20,790) (9,940)
TOTAL (154,880) (204,996)
(1) Pension Plan and Health Care expenses in the first half of 2010 comply with the provisions of CVM
Resolution 371, of 12/13/2000.
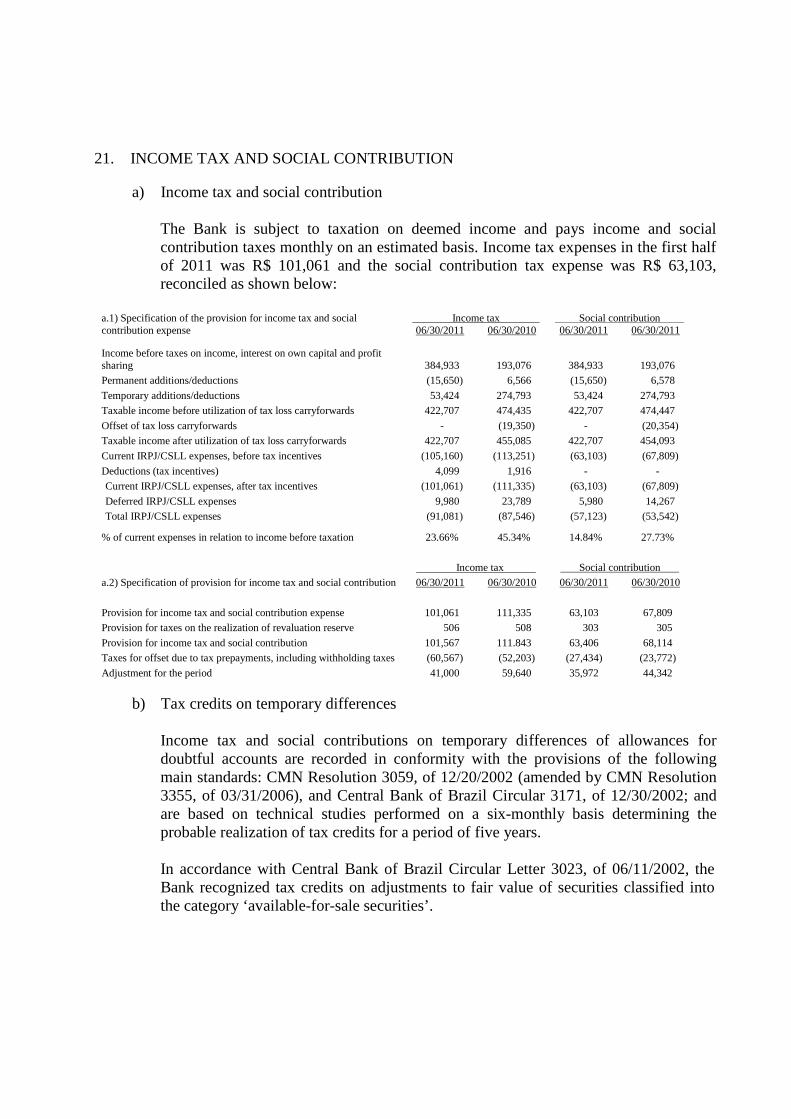
21. INCOME TAX AND SOCIAL CONTRIBUTION
a) Income tax and social contribution The Bank is subject to taxation on deemed income and pays income and social
contribution taxes monthly on an estimated basis. Income tax expenses in the first half of 2011 was R$ 101,061 and the social contribution tax expense was R$ 63,103, reconciled as shown below:
a.1) Specification of the provision for income tax and social contribution expense
Income tax Social contribution 06/30/2011 06/30/2010 06/30/2011 06/30/2011
Income before taxes on income, interest on own capital and profit sharing 384,933 193,076 384,933 193,076
Permanent additions/deductions (15,650) 6,566 (15,650) 6,578
Temporary additions/deductions 53,424 274,793 53,424 274,793
Taxable income before utilization of tax loss carryforwards 422,707 474,435 422,707 474,447
Offset of tax loss carryforwards - (19,350) - (20,354)
Taxable income after utilization of tax loss carryforwards 422,707 455,085 422,707 454,093
Current IRPJ/CSLL expenses, before tax incentives (105,160) (113,251) (63,103) (67,809)
Deductions (tax incentives) 4,099 1,916 - -
Current IRPJ/CSLL expenses, after tax incentives (101,061) (111,335) (63,103) (67,809)
Deferred IRPJ/CSLL expenses 9,980 23,789 5,980 14,267
Total IRPJ/CSLL expenses (91,081) (87,546) (57,123) (53,542)
% of current expenses in relation to income before taxation 23.66% 45.34% 14.84% 27.73%
a.2) Specification of provision for income tax and social contribution
Income tax Social contribution 06/30/2011 06/30/2010 06/30/2011 06/30/2010
Provision for income tax and social contribution expense 101,061 111,335 63,103 67,809
Provision for taxes on the realization of revaluation reserve 506 508 303 305
Provision for income tax and social contribution 101,567 111.843 63,406 68,114
Taxes for offset due to tax prepayments, including withholding taxes (60,567) (52,203) (27,434) (23,772)
Adjustment for the period 41,000 59,640 35,972 44,342
b) Tax credits on temporary differences
Income tax and social contributions on temporary differences of allowances for doubtful accounts are recorded in conformity with the provisions of the following main standards: CMN Resolution 3059, of 12/20/2002 (amended by CMN Resolution 3355, of 03/31/2006), and Central Bank of Brazil Circular 3171, of 12/30/2002; and are based on technical studies performed on a six-monthly basis determining the probable realization of tax credits for a period of five years.
In accordance with Central Bank of Brazil Circular Letter 3023, of 06/11/2002, the Bank recognized tax credits on adjustments to fair value of securities classified into the category ‘available-for-sale securities’.
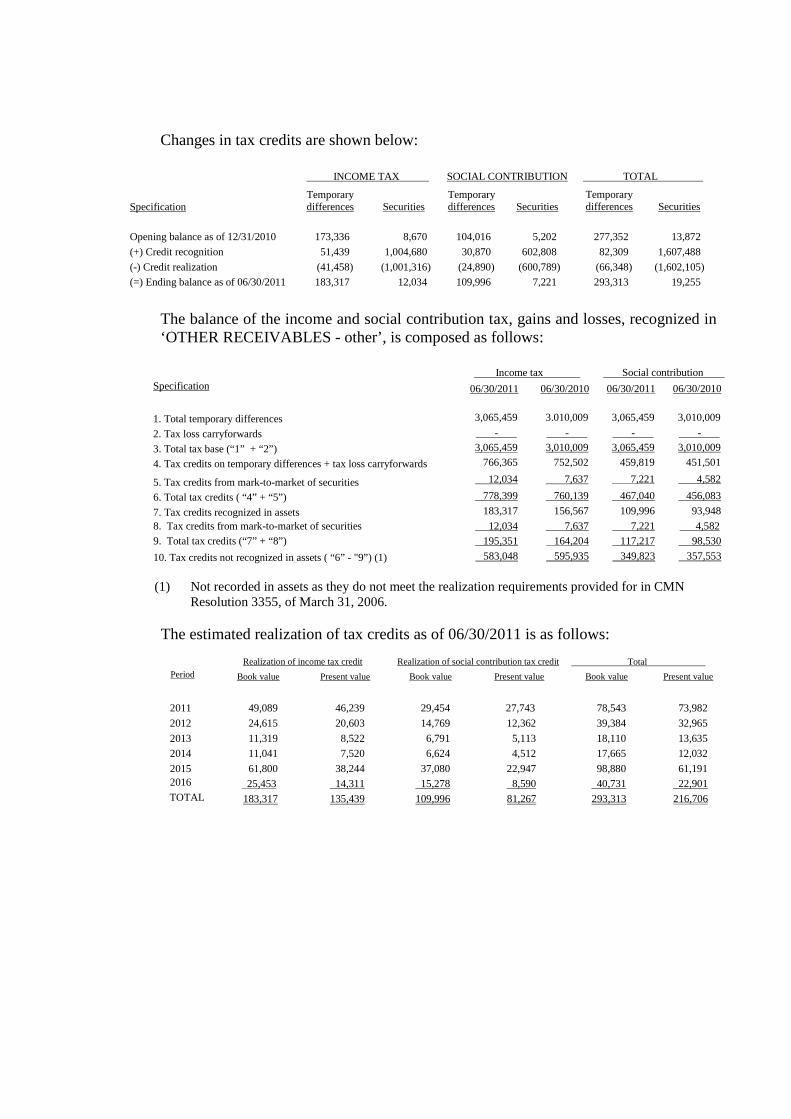
Changes in tax credits are shown below:
INCOME TAX SOCIAL CONTRIBUTION TOTAL Specification
Temporary differences Securities
Temporary differences Securities
Temporary differences Securities
Opening balance as of 12/31/2010 173,336 8,670 104,016 5,202 277,352 13,872
(+) Credit recognition 51,439 1,004,680 30,870 602,808 82,309 1,607,488
(-) Credit realization (41,458) (1,001,316) (24,890) (600,789) (66,348) (1,602,105)
(=) Ending balance as of 06/30/2011 183,317 12,034 109,996 7,221 293,313 19,255
The balance of the income and social contribution tax, gains and losses, recognized in ‘OTHER RECEIVABLES - other’, is composed as follows:
Specification
Income tax Social contribution 06/30/2011 06/30/2010 06/30/2011 06/30/2010
1. Total temporary differences 3,065,459 3.010,009 3,065,459 3,010,009
2. Tax loss carryforwards - - - - 3. Total tax base (“1” + “2”) 3,065,459 3,010,009 3,065,459 3,010,009
4. Tax credits on temporary differences + tax loss carryforwards 766,365 752,502 459,819 451,501
5. Tax credits from mark-to-market of securities 12,034 7,637 7,221 4,582
6. Total tax credits ( “4” + “5”) 778,399 760,139 467,040 456,083
7. Tax credits recognized in assets 183,317 156,567 109,996 93,948
8. Tax credits from mark-to-market of securities 12,034 7,637 7,221 4,582
9. Total tax credits (“7” + “8”) 195,351 164,204 117,217 98,530
10. Tax credits not recognized in assets ( “6” - "9”) (1) 583,048 595,935 349,823 357,553
(1) Not recorded in assets as they do not meet the realization requirements provided for in CMN
Resolution 3355, of March 31, 2006. The estimated realization of tax credits as of 06/30/2011 is as follows:
Period
Realization of income tax credit Realization of social contribution tax credit Total Book value Present value Book value Present value Book value Present value
2011 49,089 46,239 29,454 27,743 78,543 73,982
2012 24,615 20,603 14,769 12,362 39,384 32,965
2013 11,319 8,522 6,791 5,113 18,110 13,635
2014 11,041 7,520 6,624 4,512 17,665 12,032
2015 61,800 38,244 37,080 22,947 98,880 61,191 2016 25,453 14,311 15,278 8,590 40,731 22,901 TOTAL 183,317 135,439 109,996 81,267 293,313 216,706
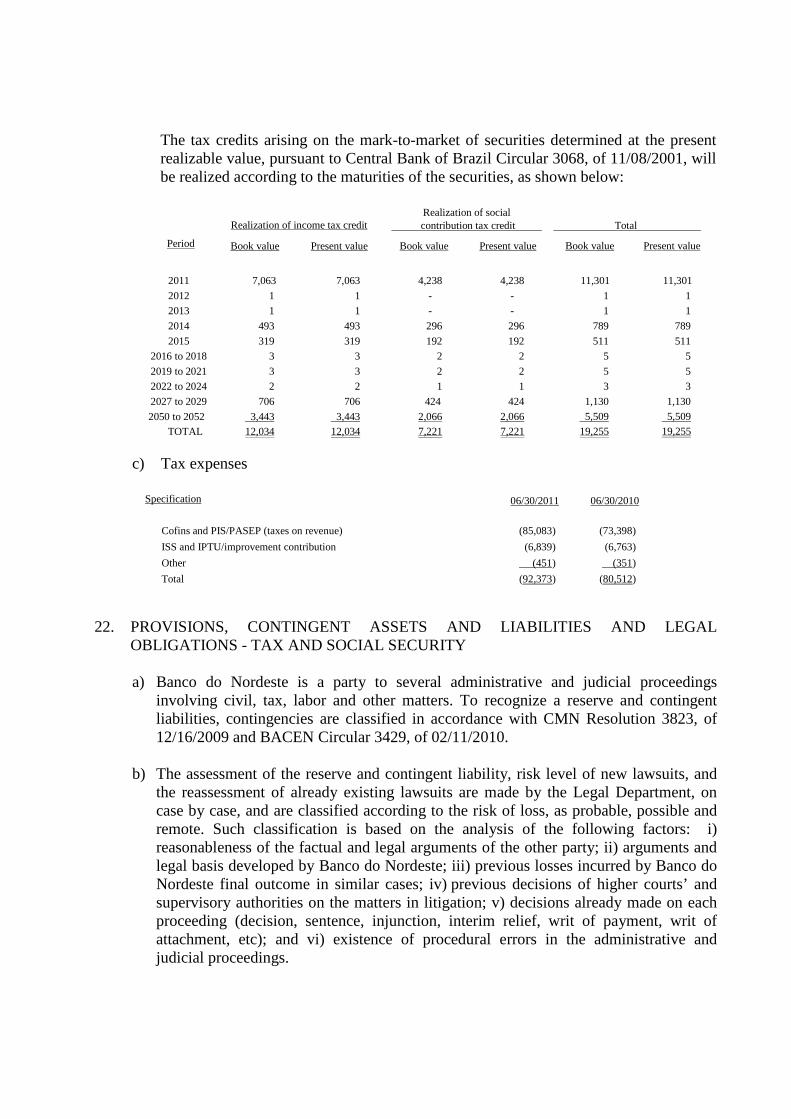
The tax credits arising on the mark-to-market of securities determined at the present realizable value, pursuant to Central Bank of Brazil Circular 3068, of 11/08/2001, will be realized according to the maturities of the securities, as shown below:
Period
Realization of income tax credit
Realization of social contribution tax credit
Total
Book value Present value Book value Present value Book value Present value
2011 7,063 7,063 4,238 4,238 11,301 11,301
2012 1 1 - - 1 1
2013 1 1 - - 1 1
2014 493 493 296 296 789 789
2015 319 319 192 192 511 511
2016 to 2018 3 3 2 2 5 5
2019 to 2021 3 3 2 2 5 5
2022 to 2024 2 2 1 1 3 3
2027 to 2029 706 706 424 424 1,130 1,130
2050 to 2052 3,443 3,443 2,066 2,066 5,509 5,509
TOTAL 12,034 12,034 7,221 7,221 19,255 19,255
c) Tax expenses
Specification 06/30/2011 06/30/2010
Cofins and PIS/PASEP (taxes on revenue) (85,083) (73,398)
ISS and IPTU/improvement contribution (6,839) (6,763)
Other (451) (351)
Total (92,373) (80,512)
22. PROVISIONS, CONTINGENT ASSETS AND LIABILITIES AND LEGAL
OBLIGATIONS - TAX AND SOCIAL SECURITY
a) Banco do Nordeste is a party to several administrative and judicial proceedings involving civil, tax, labor and other matters. To recognize a reserve and contingent liabilities, contingencies are classified in accordance with CMN Resolution 3823, of 12/16/2009 and BACEN Circular 3429, of 02/11/2010.
b) The assessment of the reserve and contingent liability, risk level of new lawsuits, and
the reassessment of already existing lawsuits are made by the Legal Department, on case by case, and are classified according to the risk of loss, as probable, possible and remote. Such classification is based on the analysis of the following factors: i) reasonableness of the factual and legal arguments of the other party; ii) arguments and legal basis developed by Banco do Nordeste; iii) previous losses incurred by Banco do Nordeste final outcome in similar cases; iv) previous decisions of higher courts’ and supervisory authorities on the matters in litigation; v) decisions already made on each proceeding (decision, sentence, injunction, interim relief, writ of payment, writ of attachment, etc); and vi) existence of procedural errors in the administrative and judicial proceedings.
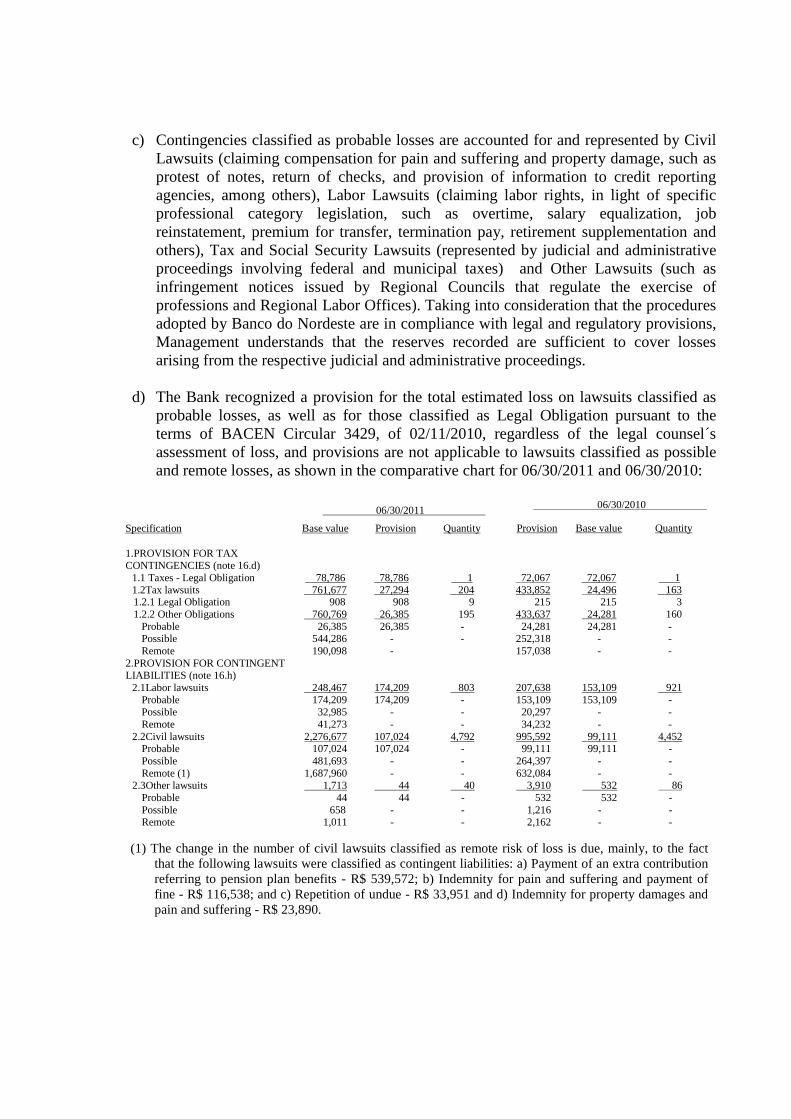
c) Contingencies classified as probable losses are accounted for and represented by Civil
Lawsuits (claiming compensation for pain and suffering and property damage, such as protest of notes, return of checks, and provision of information to credit reporting agencies, among others), Labor Lawsuits (claiming labor rights, in light of specific professional category legislation, such as overtime, salary equalization, job reinstatement, premium for transfer, termination pay, retirement supplementation and others), Tax and Social Security Lawsuits (represented by judicial and administrative proceedings involving federal and municipal taxes) and Other Lawsuits (such as infringement notices issued by Regional Councils that regulate the exercise of professions and Regional Labor Offices). Taking into consideration that the procedures adopted by Banco do Nordeste are in compliance with legal and regulatory provisions, Management understands that the reserves recorded are sufficient to cover losses arising from the respective judicial and administrative proceedings.
d) The Bank recognized a provision for the total estimated loss on lawsuits classified as probable losses, as well as for those classified as Legal Obligation pursuant to the terms of BACEN Circular 3429, of 02/11/2010, regardless of the legal counsel´s assessment of loss, and provisions are not applicable to lawsuits classified as possible and remote losses, as shown in the comparative chart for 06/30/2011 and 06/30/2010:
06/30/2011 06/30/2010
Specification Base value Provision Quantity Provision Base value Quantity
1.PROVISION FOR TAX CONTINGENCIES (note 16.d)
1.1 Taxes - Legal Obligation 78,786 78,786 1 72,067 72,067 1 1.2Tax lawsuits 761,677 27,294 204 433,852 24,496 163
1.2.1 Legal Obligation 908 908 9 215 215 3 1.2.2 Other Obligations 760,769 26,385 195 433,637 24,281 160
Probable 26,385 26,385 - 24,281 24,281 - Possible 544,286 - - 252,318 - - Remote 190,098 - 157,038 - -
2.PROVISION FOR CONTINGENT LIABILITIES (note 16.h)
2.1Labor lawsuits 248,467 174,209 803 207,638 153,109 921 Probable 174,209 174,209 - 153,109 153,109 - Possible 32,985 - - 20,297 - - Remote 41,273 - - 34,232 - -
2.2Civil lawsuits 2,276,677 107,024 4,792 995,592 99,111 4,452 Probable 107,024 107,024 - 99,111 99,111 - Possible 481,693 - - 264,397 - - Remote (1) 1,687,960 - - 632,084 - -
2.3Other lawsuits 1,713 44 40 3,910 532 86 Probable 44 44 - 532 532 - Possible 658 - - 1,216 - - Remote 1,011 - - 2,162 - -
(1) The change in the number of civil lawsuits classified as remote risk of loss is due, mainly, to the fact
that the following lawsuits were classified as contingent liabilities: a) Payment of an extra contribution referring to pension plan benefits - R$ 539,572; b) Indemnity for pain and suffering and payment of fine - R$ 116,538; and c) Repetition of undue - R$ 33,951 and d) Indemnity for property damages and pain and suffering - R$ 23,890.
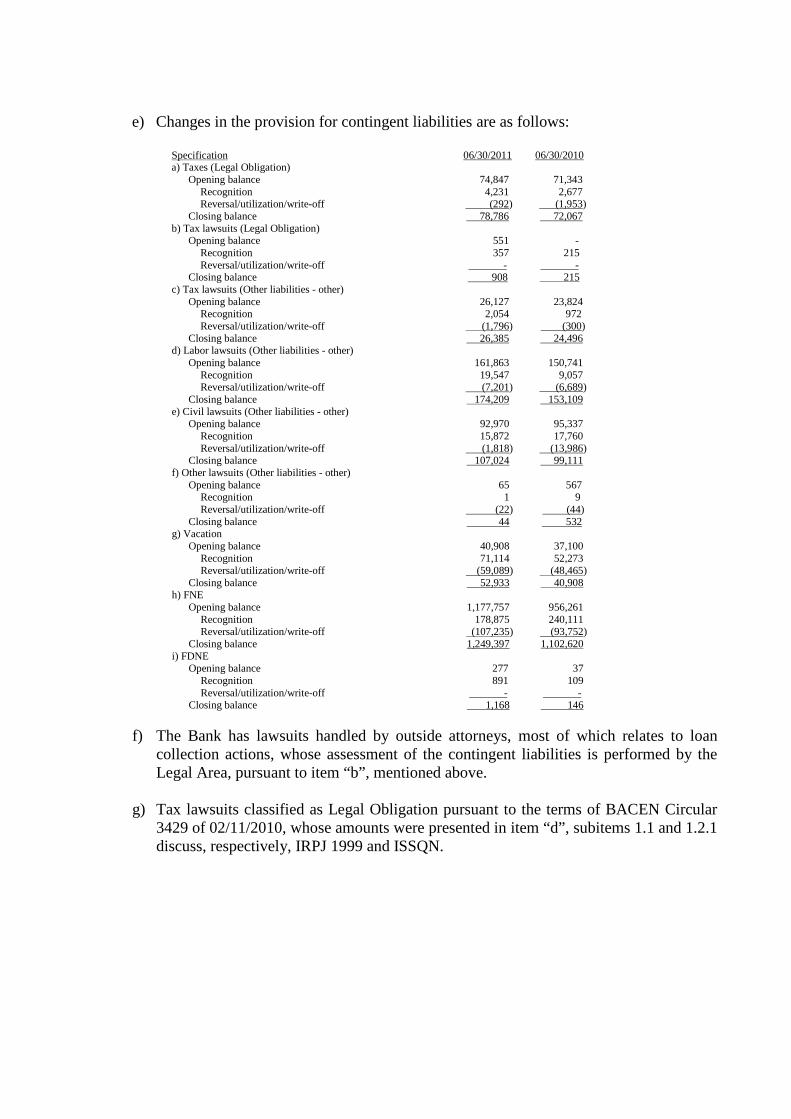
e) Changes in the provision for contingent liabilities are as follows:
Specification 06/30/2011 06/30/2010 a) Taxes (Legal Obligation)
Opening balance 74,847 71,343 Recognition 4,231 2,677 Reversal/utilization/write-off (292) (1,953)
Closing balance 78,786 72,067 b) Tax lawsuits (Legal Obligation)
Opening balance 551 - Recognition 357 215 Reversal/utilization/write-off - -
Closing balance 908 215 c) Tax lawsuits (Other liabilities - other)
Opening balance 26,127 23,824 Recognition 2,054 972 Reversal/utilization/write-off (1,796) (300)
Closing balance 26,385 24,496 d) Labor lawsuits (Other liabilities - other)
Opening balance 161,863 150,741 Recognition 19,547 9,057 Reversal/utilization/write-off (7,201) (6,689)
Closing balance 174,209 153,109 e) Civil lawsuits (Other liabilities - other)
Opening balance 92,970 95,337 Recognition 15,872 17,760 Reversal/utilization/write-off (1,818) (13,986)
Closing balance 107,024 99,111 f) Other lawsuits (Other liabilities - other)
Opening balance 65 567 Recognition 1 9 Reversal/utilization/write-off (22) (44)
Closing balance 44 532 g) Vacation
Opening balance 40,908 37,100 Recognition 71,114 52,273 Reversal/utilization/write-off (59,089) (48,465)
Closing balance 52,933 40,908 h) FNE
Opening balance 1,177,757 956,261 Recognition 178,875 240,111 Reversal/utilization/write-off (107,235) (93,752)
Closing balance 1,249,397 1,102,620 i) FDNE
Opening balance 277 37 Recognition 891 109 Reversal/utilization/write-off - -
Closing balance 1,168 146
f) The Bank has lawsuits handled by outside attorneys, most of which relates to loan collection actions, whose assessment of the contingent liabilities is performed by the Legal Area, pursuant to item “b”, mentioned above.
g) Tax lawsuits classified as Legal Obligation pursuant to the terms of BACEN Circular
3429 of 02/11/2010, whose amounts were presented in item “d”, subitems 1.1 and 1.2.1 discuss, respectively, IRPJ 1999 and ISSQN.
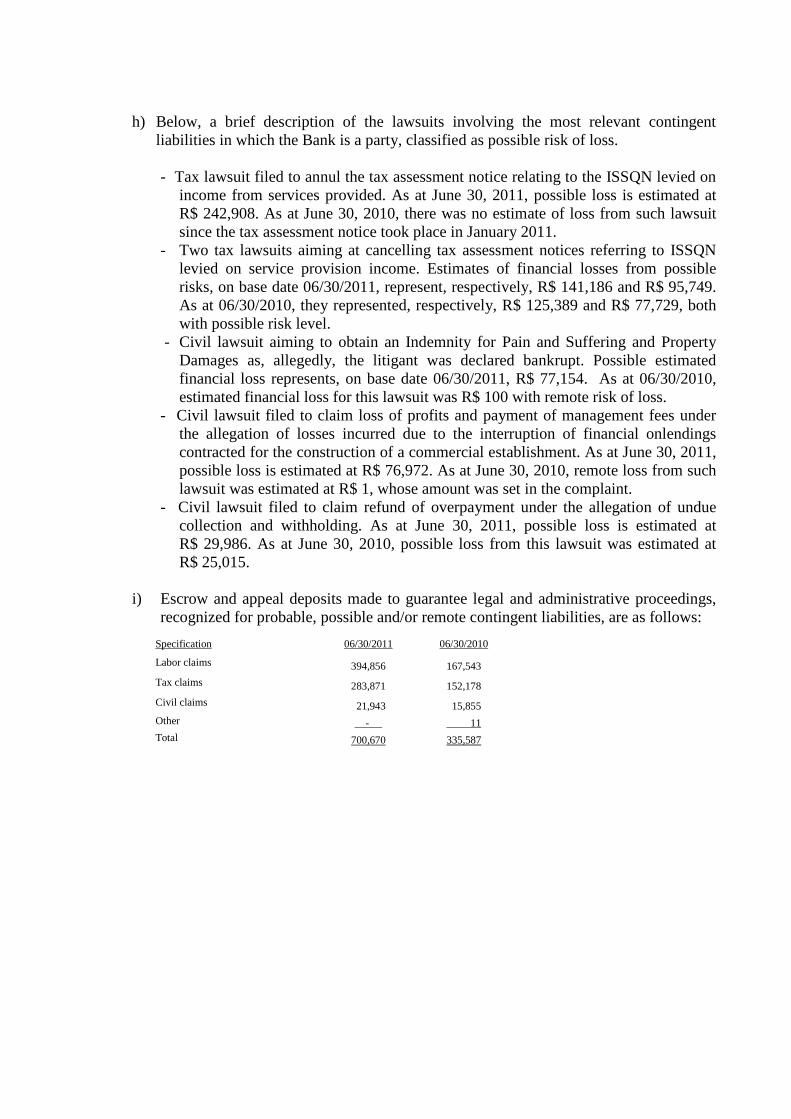
h) Below, a brief description of the lawsuits involving the most relevant contingent liabilities in which the Bank is a party, classified as possible risk of loss.
- Tax lawsuit filed to annul the tax assessment notice relating to the ISSQN levied on
income from services provided. As at June 30, 2011, possible loss is estimated at R$ 242,908. As at June 30, 2010, there was no estimate of loss from such lawsuit since the tax assessment notice took place in January 2011.
- Two tax lawsuits aiming at cancelling tax assessment notices referring to ISSQN levied on service provision income. Estimates of financial losses from possible risks, on base date 06/30/2011, represent, respectively, R$ 141,186 and R$ 95,749. As at 06/30/2010, they represented, respectively, R$ 125,389 and R$ 77,729, both with possible risk level.
- Civil lawsuit aiming to obtain an Indemnity for Pain and Suffering and Property Damages as, allegedly, the litigant was declared bankrupt. Possible estimated financial loss represents, on base date 06/30/2011, R$ 77,154. As at 06/30/2010, estimated financial loss for this lawsuit was R$ 100 with remote risk of loss.
- Civil lawsuit filed to claim loss of profits and payment of management fees under the allegation of losses incurred due to the interruption of financial onlendings contracted for the construction of a commercial establishment. As at June 30, 2011, possible loss is estimated at R$ 76,972. As at June 30, 2010, remote loss from such lawsuit was estimated at R$ 1, whose amount was set in the complaint.
- Civil lawsuit filed to claim refund of overpayment under the allegation of undue collection and withholding. As at June 30, 2011, possible loss is estimated at R$ 29,986. As at June 30, 2010, possible loss from this lawsuit was estimated at R$ 25,015.
i) Escrow and appeal deposits made to guarantee legal and administrative proceedings,
recognized for probable, possible and/or remote contingent liabilities, are as follows: Specification 06/30/2011 06/30/2010
Labor claims 394,856 167,543
Tax claims 283,871 152,178
Civil claims 21,943 15,855 Other - 11 Total 700,670 335,587
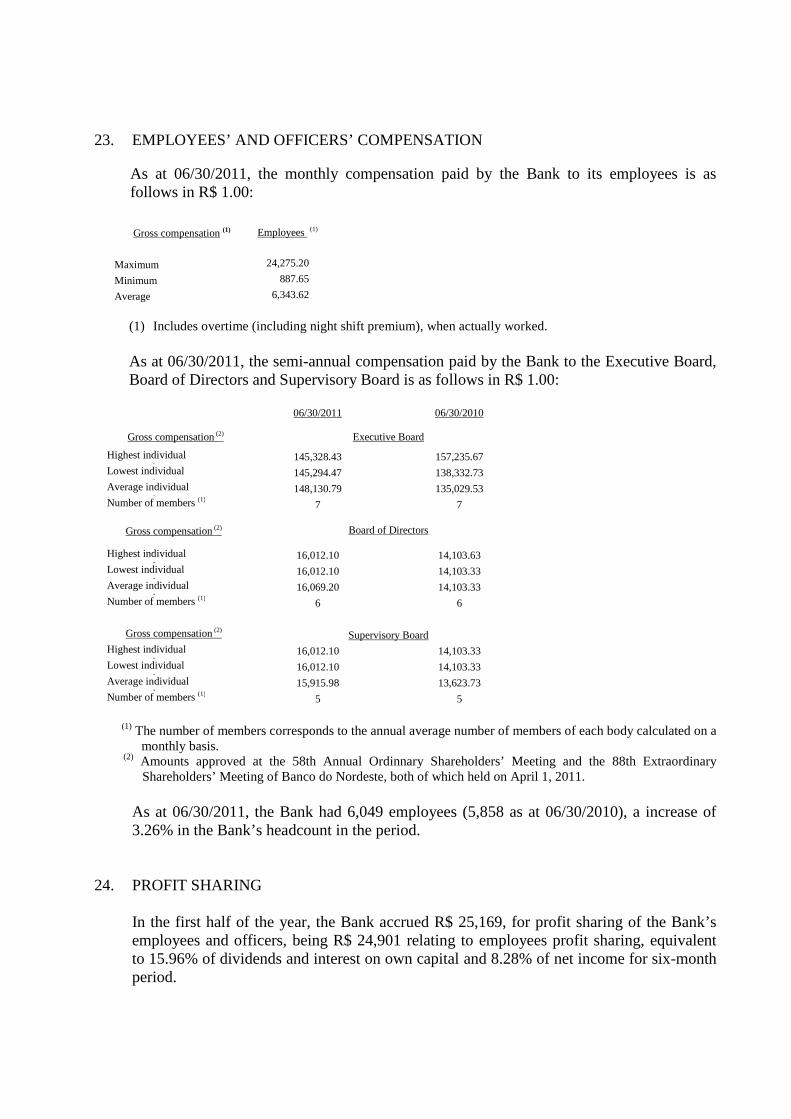
23. EMPLOYEES’ AND OFFICERS’ COMPENSATION
As at 06/30/2011, the monthly compensation paid by the Bank to its employees is as follows in R$ 1.00:
Gross compensation (1)
Employees (1)
Maximum 24,275.20
Minimum 887.65
Average 6,343.62
(1) Includes overtime (including night shift premium), when actually worked. As at 06/30/2011, the semi-annual compensation paid by the Bank to the Executive Board, Board of Directors and Supervisory Board is as follows in R$ 1.00:
06/30/2011 06/30/2010
Gross compensation (2) Executive Board
Highest individual compensation
145,328.43 157,235.67 Lowest individual compensation
145,294.47 138,332.73 Average individual compensation
148,130.79 135,029.53 Number of members (1) 7 7
Gross compensation (2) Board of Directors
Highest individual compensation
16,012.10 14,103.63 Lowest individual compensation
16,012.10 14,103.33 Average individual compensation
16,069.20 14,103.33 Number of members (1) 6 6
Gross compensation (2) Supervisory Board
Highest individual compensation
16,012.10 14,103.33 Lowest individual compensation
16,012.10 14,103.33 Average individual compensation
15,915.98 13,623.73 Number of members (1) 5 5
(1) The number of members corresponds to the annual average number of members of each body calculated on a monthly basis.
(2) Amounts approved at the 58th Annual Ordinnary Shareholders’ Meeting and the 88th Extraordinary Shareholders’ Meeting of Banco do Nordeste, both of which held on April 1, 2011.
As at 06/30/2011, the Bank had 6,049 employees (5,858 as at 06/30/2010), a increase of 3.26% in the Bank’s headcount in the period.
24. PROFIT SHARING
In the first half of the year, the Bank accrued R$ 25,169, for profit sharing of the Bank’s employees and officers, being R$ 24,901 relating to employees profit sharing, equivalent to 15.96% of dividends and interest on own capital and 8.28% of net income for six-month period.
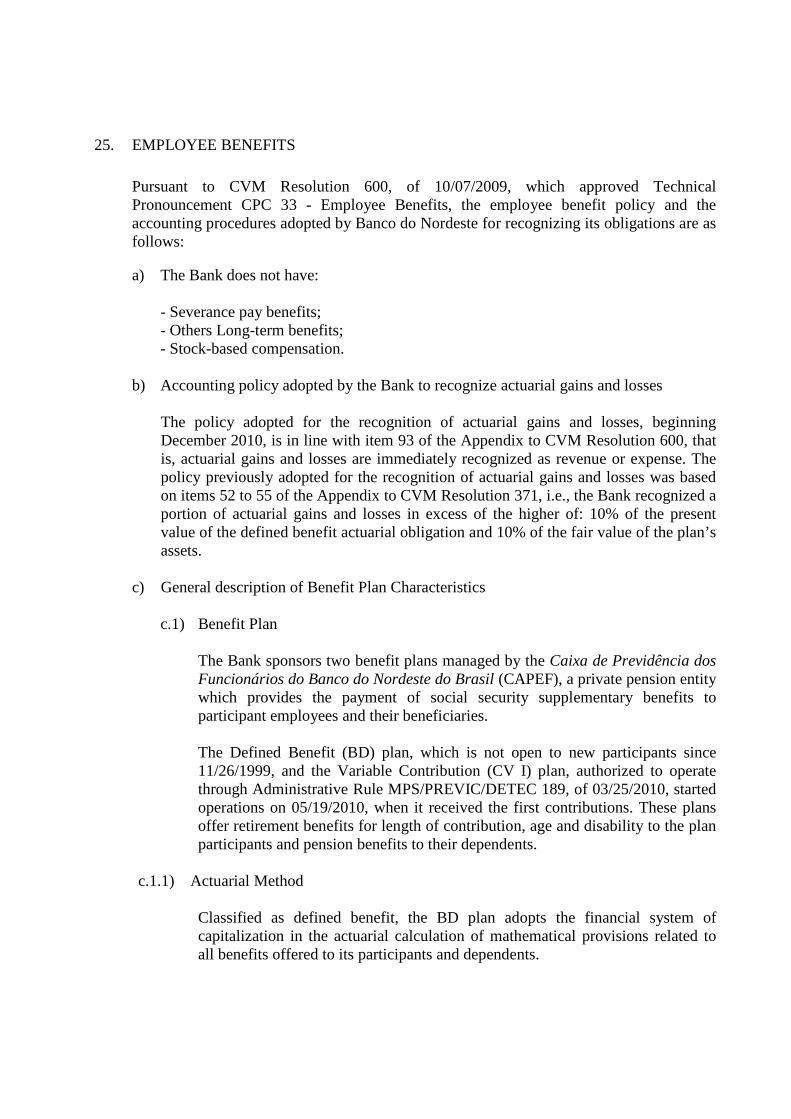
25. EMPLOYEE BENEFITS
Pursuant to CVM Resolution 600, of 10/07/2009, which approved Technical Pronouncement CPC 33 - Employee Benefits, the employee benefit policy and the accounting procedures adopted by Banco do Nordeste for recognizing its obligations are as follows: a) The Bank does not have:
- Severance pay benefits; - Others Long-term benefits; - Stock-based compensation.
b) Accounting policy adopted by the Bank to recognize actuarial gains and losses
The policy adopted for the recognition of actuarial gains and losses, beginning December 2010, is in line with item 93 of the Appendix to CVM Resolution 600, that is, actuarial gains and losses are immediately recognized as revenue or expense. The policy previously adopted for the recognition of actuarial gains and losses was based on items 52 to 55 of the Appendix to CVM Resolution 371, i.e., the Bank recognized a portion of actuarial gains and losses in excess of the higher of: 10% of the present value of the defined benefit actuarial obligation and 10% of the fair value of the plan’s assets.
c) General description of Benefit Plan Characteristics
c.1) Benefit Plan
The Bank sponsors two benefit plans managed by the Caixa de Previdência dos Funcionários do Banco do Nordeste do Brasil (CAPEF), a private pension entity which provides the payment of social security supplementary benefits to participant employees and their beneficiaries. The Defined Benefit (BD) plan, which is not open to new participants since 11/26/1999, and the Variable Contribution (CV I) plan, authorized to operate through Administrative Rule MPS/PREVIC/DETEC 189, of 03/25/2010, started operations on 05/19/2010, when it received the first contributions. These plans offer retirement benefits for length of contribution, age and disability to the plan participants and pension benefits to their dependents.
c.1.1) Actuarial Method
Classified as defined benefit, the BD plan adopts the financial system of
capitalization in the actuarial calculation of mathematical provisions related to all benefits offered to its participants and dependents.
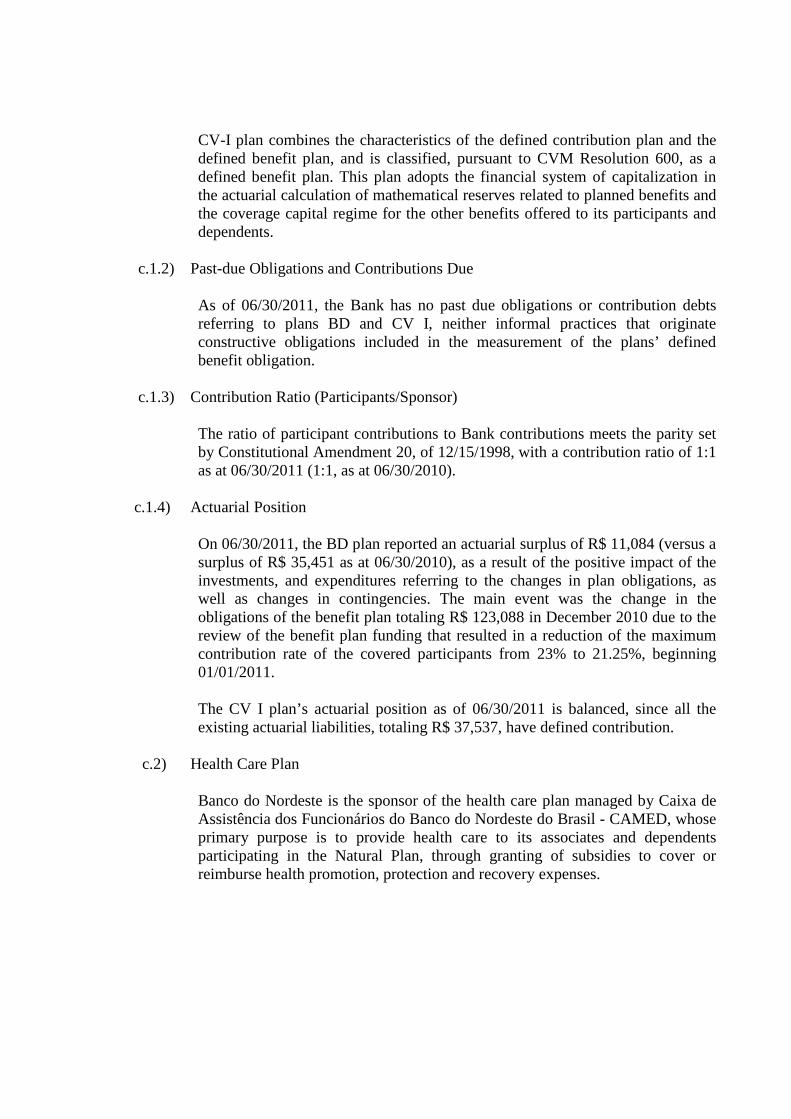
CV-I plan combines the characteristics of the defined contribution plan and the defined benefit plan, and is classified, pursuant to CVM Resolution 600, as a defined benefit plan. This plan adopts the financial system of capitalization in the actuarial calculation of mathematical reserves related to planned benefits and the coverage capital regime for the other benefits offered to its participants and dependents.
c.1.2) Past-due Obligations and Contributions Due
As of 06/30/2011, the Bank has no past due obligations or contribution debts referring to plans BD and CV I, neither informal practices that originate constructive obligations included in the measurement of the plans’ defined benefit obligation.
c.1.3) Contribution Ratio (Participants/Sponsor)
The ratio of participant contributions to Bank contributions meets the parity set
by Constitutional Amendment 20, of 12/15/1998, with a contribution ratio of 1:1 as at 06/30/2011 (1:1, as at 06/30/2010).
c.1.4) Actuarial Position
On 06/30/2011, the BD plan reported an actuarial surplus of R$ 11,084 (versus a surplus of R$ 35,451 as at 06/30/2010), as a result of the positive impact of the investments, and expenditures referring to the changes in plan obligations, as well as changes in contingencies. The main event was the change in the obligations of the benefit plan totaling R$ 123,088 in December 2010 due to the review of the benefit plan funding that resulted in a reduction of the maximum contribution rate of the covered participants from 23% to 21.25%, beginning 01/01/2011. The CV I plan’s actuarial position as of 06/30/2011 is balanced, since all the existing actuarial liabilities, totaling R$ 37,537, have defined contribution.
c.2) Health Care Plan
Banco do Nordeste is the sponsor of the health care plan managed by Caixa de Assistência dos Funcionários do Banco do Nordeste do Brasil - CAMED, whose primary purpose is to provide health care to its associates and dependents participating in the Natural Plan, through granting of subsidies to cover or reimburse health promotion, protection and recovery expenses.
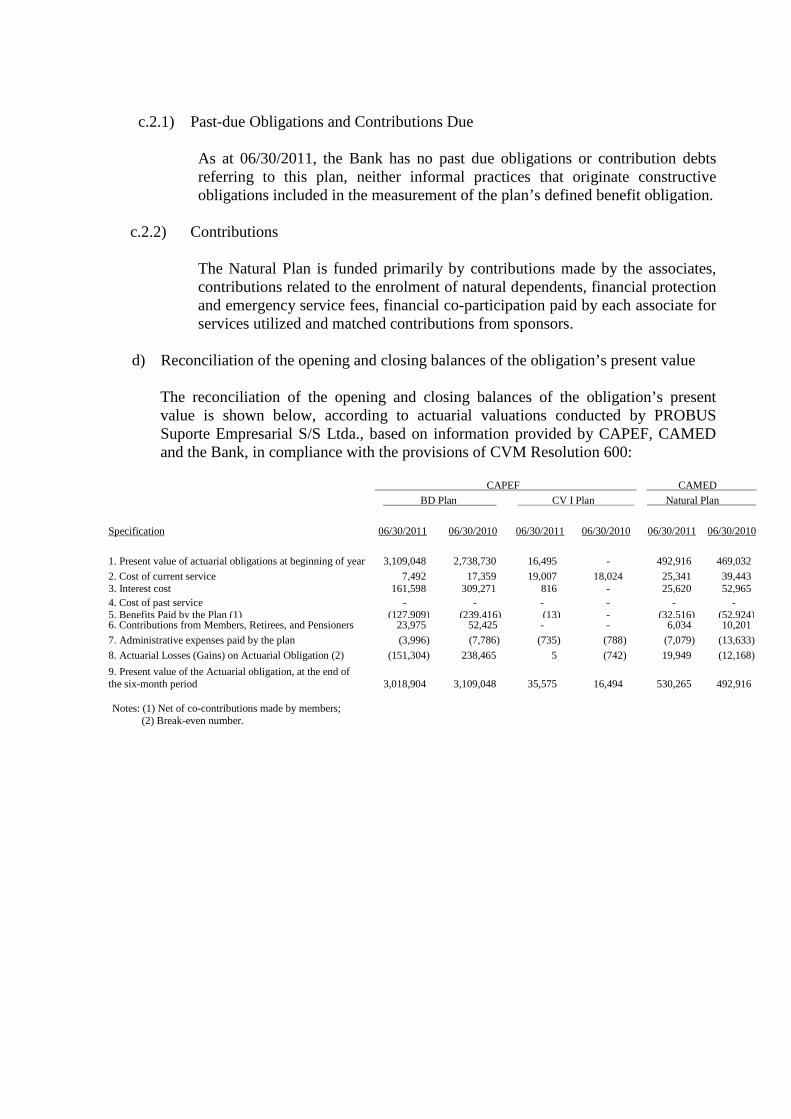
c.2.1) Past-due Obligations and Contributions Due
As at 06/30/2011, the Bank has no past due obligations or contribution debts referring to this plan, neither informal practices that originate constructive obligations included in the measurement of the plan’s defined benefit obligation.
c.2.2) Contributions The Natural Plan is funded primarily by contributions made by the associates,
contributions related to the enrolment of natural dependents, financial protection and emergency service fees, financial co-participation paid by each associate for services utilized and matched contributions from sponsors.
d) Reconciliation of the opening and closing balances of the obligation’s present value
The reconciliation of the opening and closing balances of the obligation’s present value is shown below, according to actuarial valuations conducted by PROBUS Suporte Empresarial S/S Ltda., based on information provided by CAPEF, CAMED and the Bank, in compliance with the provisions of CVM Resolution 600:
CAPEF CAMED BD Plan CV I Plan Natural Plan
Specification 06/30/2011 06/30/2010 06/30/2011 06/30/2010 06/30/2011 06/30/2010
1. Present value of actuarial obligations at beginning of year 3,109,048 2,738,730 16,495 - 492,916 469,032
2. Cost of current service 7,492 17,359 19,007 18,024 25,341 39,443 3. Interest cost 161,598 309,271 816 - 25,620 52,965 4. Cost of past service - - - - - - 5. Benefits Paid by the Plan (1) (127,909) (239,416) (13) - (32,516) (52,924) 6. Contributions from Members, Retirees, and Pensioners 23,975 52,425 - - 6,034 10,201
7. Administrative expenses paid by the plan (3,996) (7,786) (735) (788) (7,079) (13,633)
8. Actuarial Losses (Gains) on Actuarial Obligation (2) (151,304) 238,465 5 (742) 19,949 (12,168)
9. Present value of the Actuarial obligation, at the end of the six-month period 3,018,904 3,109,048 35,575 16,494 530,265 492,916
Notes: (1) Net of co-contributions made by members; (2) Break-even number.
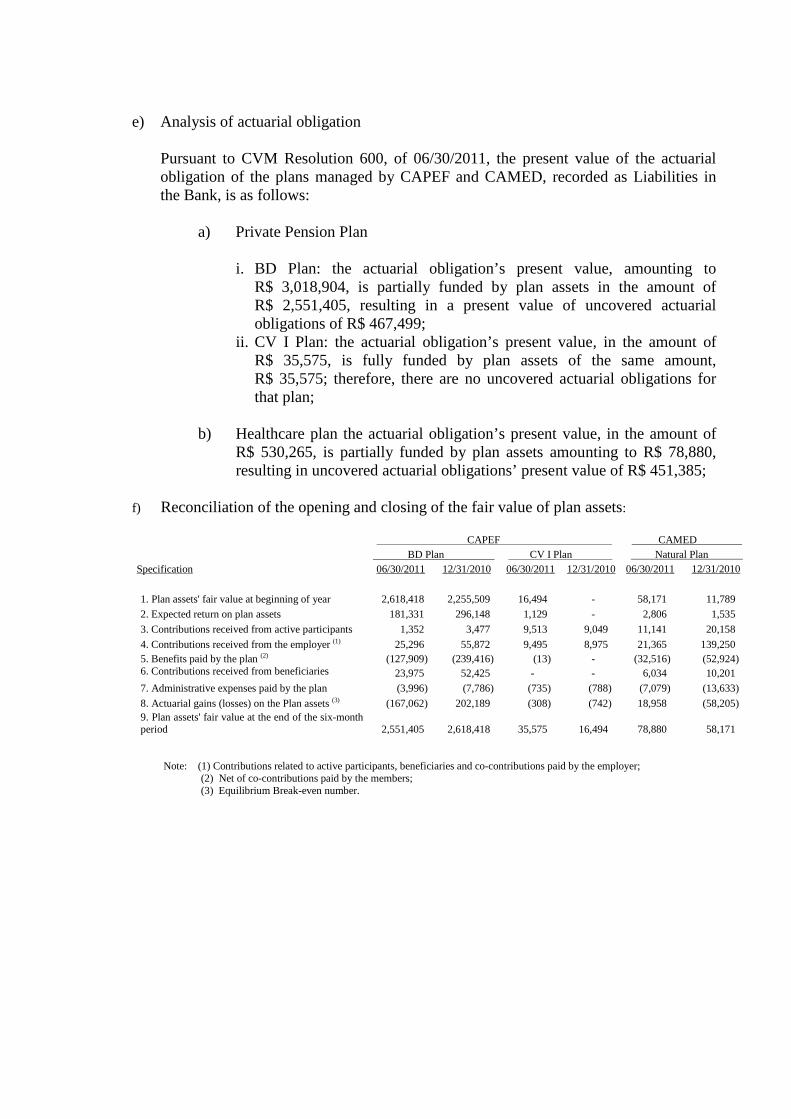
e) Analysis of actuarial obligation
Pursuant to CVM Resolution 600, of 06/30/2011, the present value of the actuarial obligation of the plans managed by CAPEF and CAMED, recorded as Liabilities in the Bank, is as follows:
a) Private Pension Plan
i. BD Plan: the actuarial obligation’s present value, amounting to R$ 3,018,904, is partially funded by plan assets in the amount of R$ 2,551,405, resulting in a present value of uncovered actuarial obligations of R$ 467,499;
ii. CV I Plan: the actuarial obligation’s present value, in the amount of R$ 35,575, is fully funded by plan assets of the same amount, R$ 35,575; therefore, there are no uncovered actuarial obligations for that plan;
b) Healthcare plan the actuarial obligation’s present value, in the amount of R$ 530,265, is partially funded by plan assets amounting to R$ 78,880, resulting in uncovered actuarial obligations’ present value of R$ 451,385;
f) Reconciliation of the opening and closing of the fair value of plan assets:
CAPEF CAMED BD Plan CV I Plan Natural Plan Specification 06/30/2011 12/31/2010 06/30/2011 12/31/2010 06/30/2011 12/31/2010
1. Plan assets' fair value at beginning of year 2,618,418 2,255,509 16,494 - 58,171 11,789
2. Expected return on plan assets 181,331 296,148 1,129 - 2,806 1,535
3. Contributions received from active participants 1,352 3,477 9,513 9,049 11,141 20,158
4. Contributions received from the employer (1) 25,296 55,872 9,495 8,975 21,365 139,250 5. Benefits paid by the plan (2) (127,909) (239,416) (13) - (32,516) (52,924) 6. Contributions received from beneficiaries Pensioners
23,975 52,425 - - 6,034 10,201
7. Administrative expenses paid by the plan (3,996) (7,786) (735) (788) (7,079) (13,633)
8. Actuarial gains (losses) on the Plan assets (3) (167,062) 202,189 (308) (742) 18,958 (58,205) 9. Plan assets' fair value at the end of the six-month period 2,551,405 2,618,418 35,575 16,494 78,880 58,171
Note: (1) Contributions related to active participants, beneficiaries and co-contributions paid by the employer; (2) Net of co-contributions paid by the members; (3) Equilibrium Break-even number.
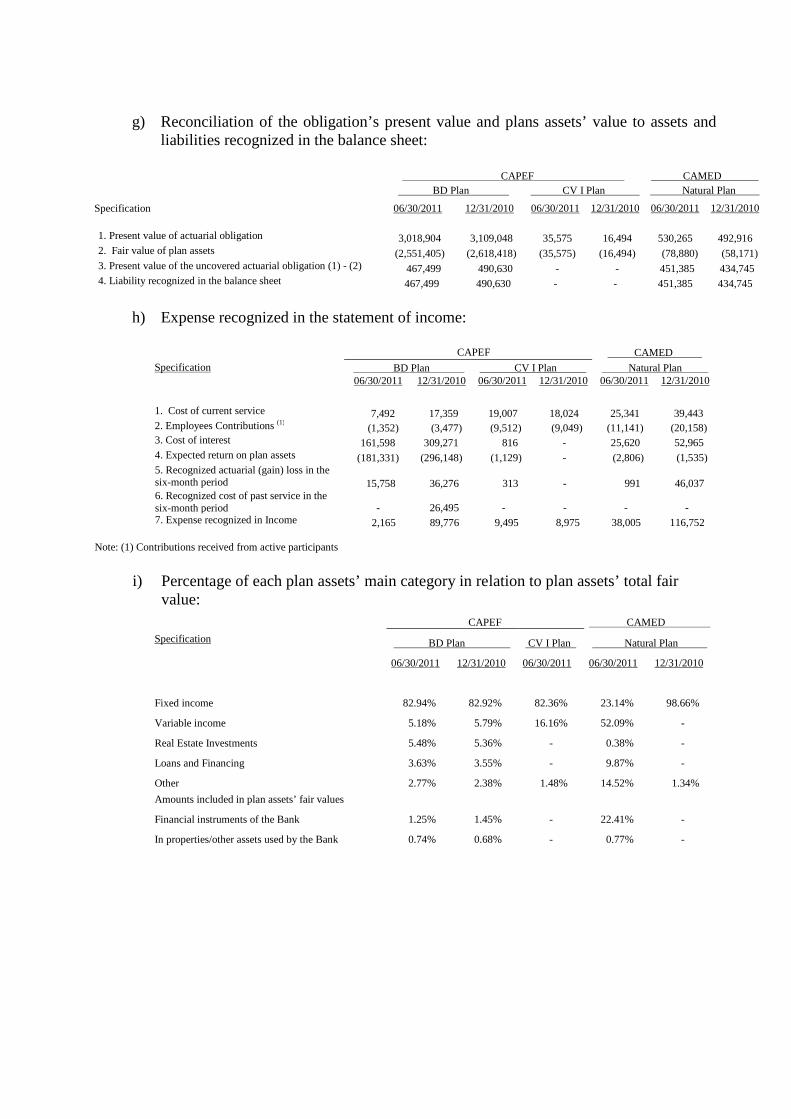
g) Reconciliation of the obligation’s present value and plans assets’ value to assets and liabilities recognized in the balance sheet:
CAPEF CAMED BD Plan CV I Plan Natural Plan
Specification 06/30/2011 12/31/2010 06/30/2011 12/31/2010 06/30/2011 12/31/2010 1. Present value of actuarial obligation 3,018,904 3,109,048 35,575 16,494 530,265 492,916 2. Fair value of plan assets (2,551,405) (2,618,418) (35,575) (16,494) (78,880) (58,171) 3. Present value of the uncovered actuarial obligation (1) - (2) 467,499 490,630 - - 451,385 434,745 4. Liability recognized in the balance sheet 467,499 490,630 - - 451,385 434,745
h) Expense recognized in the statement of income:
Specification
CAPEF CAMED BD Plan CV I Plan Natural Plan 06/30/2011 12/31/2010 06/30/2011 12/31/2010 06/30/2011 12/31/2010
1. Cost of current service 7,492 17,359 19,007 18,024 25,341 39,443 2. Employees Contributions (1) (1,352) (3,477) (9,512) (9,049) (11,141) (20,158) 3. Cost of interest 161,598 309,271 816 - 25,620 52,965 4. Expected return on plan assets (181,331) (296,148) (1,129) - (2,806) (1,535) 5. Recognized actuarial (gain) loss in the six-month period 15,758 36,276 313 - 991 46,037 6. Recognized cost of past service in the six-month period - 26,495 - - - - 7. Expense recognized in Income 2,165 89,776 9,495 8,975 38,005 116,752
Note: (1) Contributions received from active participants
i) Percentage of each plan assets’ main category in relation to plan assets’ total fair
value:
Specification
CAPEF CAMED
BD Plan CV I Plan Natural Plan
06/30/2011 12/31/2010 06/30/2011 06/30/2011 12/31/2010
Fixed income 82.94% 82.92% 82.36% 23.14% 98.66%
Variable income 5.18% 5.79% 16.16% 52.09% -
Real Estate Investments 5.48% 5.36% - 0.38% -
Loans and Financing 3.63% 3.55% - 9.87% -
Other 2.77% 2.38% 1.48% 14.52% 1.34%
Amounts included in plan assets’ fair values
Financial instruments of the Bank 1.25% 1.45% - 22.41% -
In properties/other assets used by the Bank 0.74% 0.68% - 0.77% -
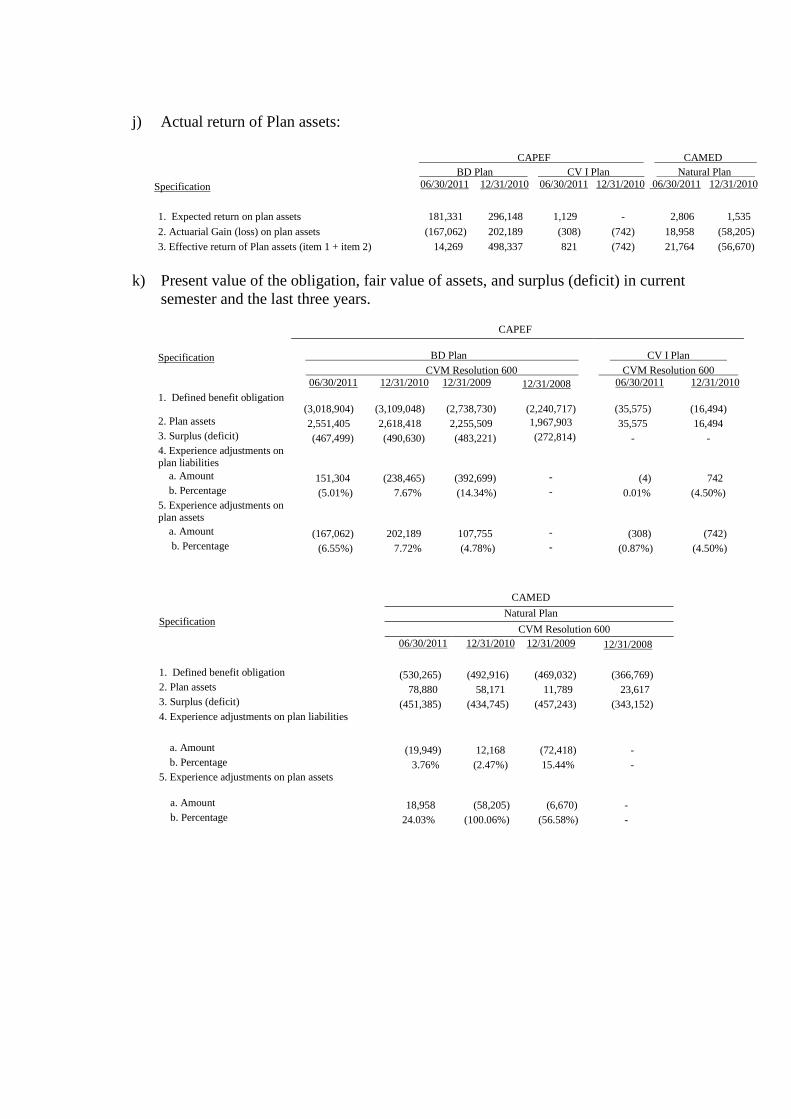
j) Actual return of Plan assets:
CAPEF CAMED BD Plan CV I Plan Natural Plan Specification 06/30/2011 12/31/2010 06/30/2011 12/31/2010 06/30/2011 12/31/2010
1. Expected return on plan assets 181,331 296,148 1,129 - 2,806 1,535
2. Actuarial Gain (loss) on plan assets (167,062) 202,189 (308) (742) 18,958 (58,205)
3. Effective return of Plan assets (item 1 + item 2) 14,269 498,337 821 (742) 21,764 (56,670)
k) Present value of the obligation, fair value of assets, and surplus (deficit) in current
semester and the last three years.
Specification
CAPEF
BD Plan CV I Plan CVM Resolution 600 CVM Resolution 600 06/30/2011 12/31/2010 12/31/2009 12/31/2008 06/30/2011 12/31/2010
1. Defined benefit obligation (3,018,904) (3,109,048) (2,738,730) (2,240,717) (35,575) (16,494)
2. Plan assets 2,551,405 2,618,418 2,255,509 1,967,903 35,575 16,494 3. Surplus (deficit) (467,499) (490,630) (483,221) (272,814) - - 4. Experience adjustments on plan liabilities
a. Amount 151,304 (238,465) (392,699) - (4) 742 b. Percentage (5.01%) 7.67% (14.34%) - 0.01% (4.50%) 5. Experience adjustments on plan assets
a. Amount (167,062) 202,189 107,755 - (308) (742) b. Percentage (6.55%) 7.72% (4.78%) - (0.87%) (4.50%)
Specification
CAMED
Natural Plan
CVM Resolution 600 06/30/2011 12/31/2010 12/31/2009 12/31/2008
1. Defined benefit obligation (530,265) (492,916) (469,032) (366,769) 2. Plan assets 78,880 58,171 11,789 23,617 3. Surplus (deficit) (451,385) (434,745) (457,243) (343,152) 4. Experience adjustments on plan liabilities
a. Amount (19,949) 12,168 (72,418) - b. Percentage 3.76% (2.47%) 15.44% - 5. Experience adjustments on plan assets
a. Amount 18,958 (58,205) (6,670) - b. Percentage 24.03% (100.06%) (56.58%) -
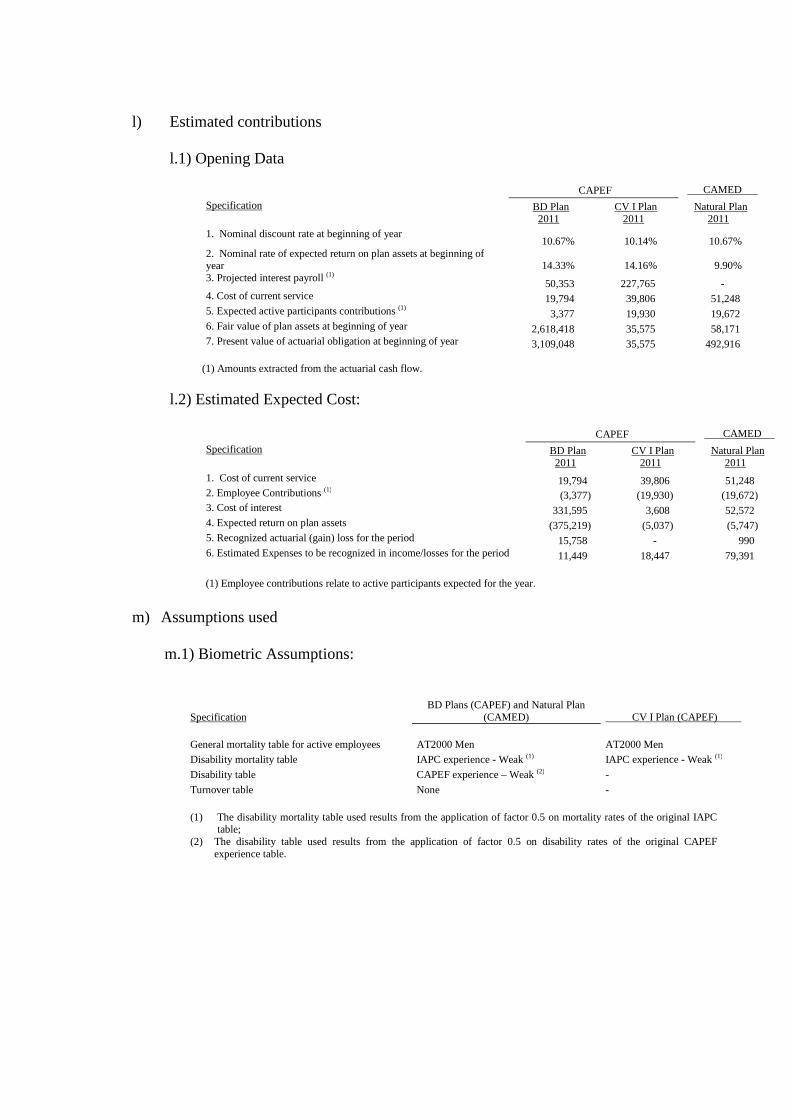
l) Estimated contributions l.1) Opening Data
Specification
CAPEF CAMED BD Plan CV I Plan Natural Plan 2011 2011 2011
1. Nominal discount rate at beginning of year 10.67% 10.14% 10.67%
2. Nominal rate of expected return on plan assets at beginning of year 14.33% 14.16% 9.90% 3. Projected interest payroll (1) 50,353 227,765 - 4. Cost of current service 19,794 39,806 51,248 5. Expected active participants contributions (1) 3,377 19,930 19,672 6. Fair value of plan assets at beginning of year 2,618,418 35,575 58,171 7. Present value of actuarial obligation at beginning of year 3,109,048 35,575 492,916
(1) Amounts extracted from the actuarial cash flow.
l.2) Estimated Expected Cost:
Specification
CAPEF CAMED BD Plan CV I Plan Natural Plan 2011 2011 2011
1. Cost of current service 19,794 39,806 51,248 2. Employee Contributions (1) (3,377) (19,930) (19,672) 3. Cost of interest 331,595 3,608 52,572 4. Expected return on plan assets (375,219) (5,037) (5,747) 5. Recognized actuarial (gain) loss for the period 15,758 - 990 6. Estimated Expenses to be recognized in income/losses for the period 11,449 18,447 79,391
(1) Employee contributions relate to active participants expected for the year.
m) Assumptions used
m.1) Biometric Assumptions:
Specification BD Plans (CAPEF) and Natural Plan
(CAMED) CV I Plan (CAPEF) General mortality table for active employees AT2000 Men AT2000 Men
Disability mortality table IAPC experience - Weak (1) IAPC experience - Weak (1)
Disability table CAPEF experience – Weak (2) -
Turnover table None -
(1) The disability mortality table used results from the application of factor 0.5 on mortality rates of the original IAPC
table; (2) The disability table used results from the application of factor 0.5 on disability rates of the original CAPEF
experience table.
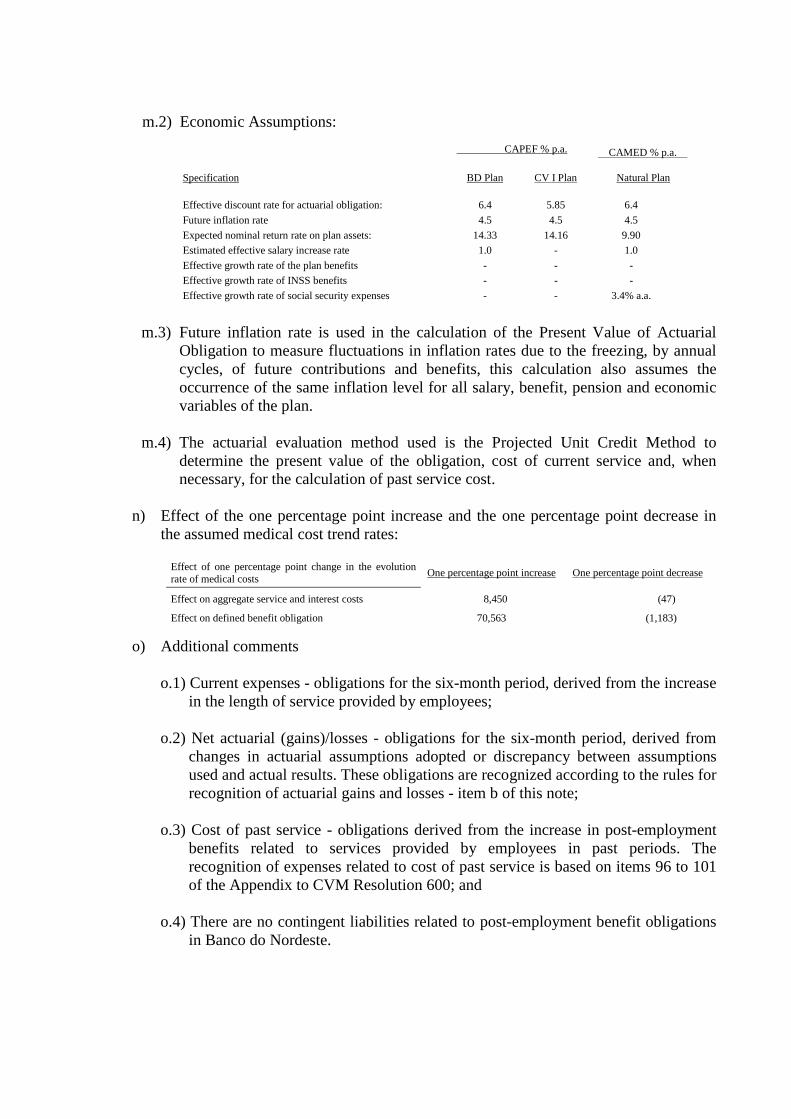
m.2) Economic Assumptions:
CAPEF % p.a.
CAMED % p.a.
Specification BD Plan CV I Plan Natural Plan
Effective discount rate for actuarial obligation: 6.4 5.85 6.4
Future inflation rate 4.5 4.5 4.5
Expected nominal return rate on plan assets: 14.33 14.16 9.90
Estimated effective salary increase rate 1.0 - 1.0
Effective growth rate of the plan benefits - - -
Effective growth rate of INSS benefits - - -
Effective growth rate of social security expenses - - 3.4% a.a.
m.3) Future inflation rate is used in the calculation of the Present Value of Actuarial
Obligation to measure fluctuations in inflation rates due to the freezing, by annual cycles, of future contributions and benefits, this calculation also assumes the occurrence of the same inflation level for all salary, benefit, pension and economic variables of the plan.
m.4) The actuarial evaluation method used is the Projected Unit Credit Method to
determine the present value of the obligation, cost of current service and, when necessary, for the calculation of past service cost.
n) Effect of the one percentage point increase and the one percentage point decrease in
the assumed medical cost trend rates:
Effect of one percentage point change in the evolution rate of medical costs
One percentage point increase One percentage point decrease
Effect on aggregate service and interest costs 8,450 (47)
Effect on defined benefit obligation 70,563 (1,183)
o) Additional comments o.1) Current expenses - obligations for the six-month period, derived from the increase
in the length of service provided by employees; o.2) Net actuarial (gains)/losses - obligations for the six-month period, derived from
changes in actuarial assumptions adopted or discrepancy between assumptions used and actual results. These obligations are recognized according to the rules for recognition of actuarial gains and losses - item b of this note;
o.3) Cost of past service - obligations derived from the increase in post-employment
benefits related to services provided by employees in past periods. The recognition of expenses related to cost of past service is based on items 96 to 101 of the Appendix to CVM Resolution 600; and
o.4) There are no contingent liabilities related to post-employment benefit obligations
in Banco do Nordeste.
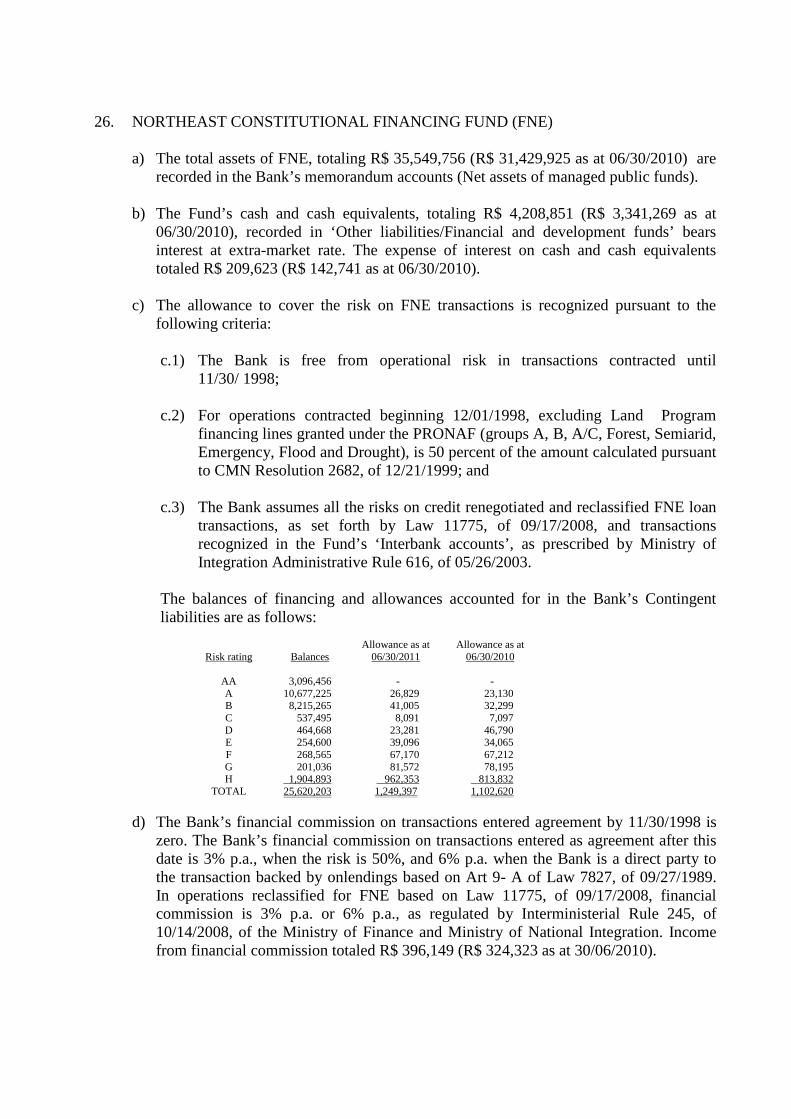
26. NORTHEAST CONSTITUTIONAL FINANCING FUND (FNE)
a) The total assets of FNE, totaling R$ 35,549,756 (R$ 31,429,925 as at 06/30/2010) are recorded in the Bank’s memorandum accounts (Net assets of managed public funds).
b) The Fund’s cash and cash equivalents, totaling R$ 4,208,851 (R$ 3,341,269 as at
06/30/2010), recorded in ‘Other liabilities/Financial and development funds’ bears interest at extra-market rate. The expense of interest on cash and cash equivalents totaled R$ 209,623 (R$ 142,741 as at 06/30/2010).
c) The allowance to cover the risk on FNE transactions is recognized pursuant to the
following criteria:
c.1) The Bank is free from operational risk in transactions contracted until 11/30/ 1998;
c.2) For operations contracted beginning 12/01/1998, excluding Land Program financing lines granted under the PRONAF (groups A, B, A/C, Forest, Semiarid, Emergency, Flood and Drought), is 50 percent of the amount calculated pursuant to CMN Resolution 2682, of 12/21/1999; and
c.3) The Bank assumes all the risks on credit renegotiated and reclassified FNE loan
transactions, as set forth by Law 11775, of 09/17/2008, and transactions recognized in the Fund’s ‘Interbank accounts’, as prescribed by Ministry of Integration Administrative Rule 616, of 05/26/2003.
The balances of financing and allowances accounted for in the Bank’s Contingent liabilities are as follows:
Risk rating
Balances
Allowance as at
06/30/2011
Allowance as at
06/30/2010
AA 3,096,456 - - A 10,677,225 26,829 23,130 B 8,215,265 41,005 32,299 C 537,495 8,091 7,097 D 464,668 23,281 46,790 E 254,600 39,096 34,065 F 268,565 67,170 67,212 G 201,036 81,572 78,195 H 1,904,893 962,353 813,832
TOTAL 25,620,203 1,249,397 1,102,620
d) The Bank’s financial commission on transactions entered agreement by 11/30/1998 is zero. The Bank’s financial commission on transactions entered as agreement after this date is 3% p.a., when the risk is 50%, and 6% p.a. when the Bank is a direct party to the transaction backed by onlendings based on Art 9- A of Law 7827, of 09/27/1989. In operations reclassified for FNE based on Law 11775, of 09/17/2008, financial commission is 3% p.a. or 6% p.a., as regulated by Interministerial Rule 245, of 10/14/2008, of the Ministry of Finance and Ministry of National Integration. Income from financial commission totaled R$ 396,149 (R$ 324,323 as at 30/06/2010).
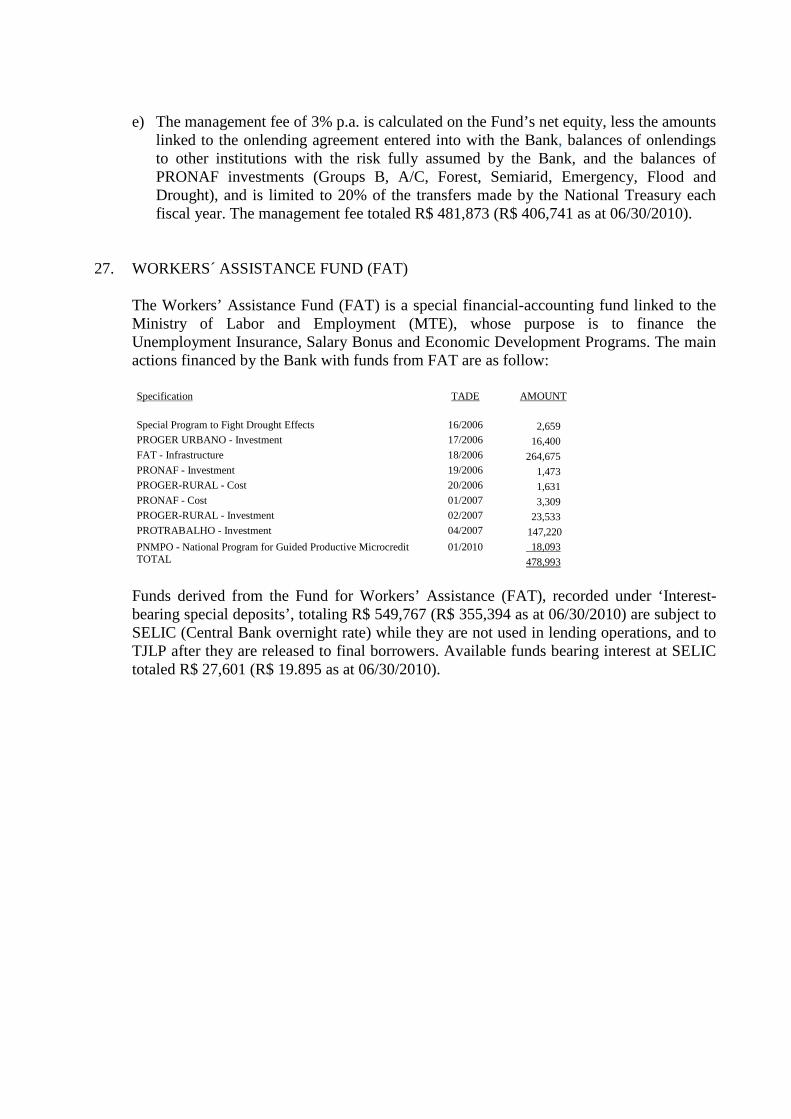
e) The management fee of 3% p.a. is calculated on the Fund’s net equity, less the amounts linked to the onlending agreement entered into with the Bank, balances of onlendings to other institutions with the risk fully assumed by the Bank, and the balances of PRONAF investments (Groups B, A/C, Forest, Semiarid, Emergency, Flood and Drought), and is limited to 20% of the transfers made by the National Treasury each fiscal year. The management fee totaled R$ 481,873 (R$ 406,741 as at 06/30/2010).
27. WORKERS´ ASSISTANCE FUND (FAT)
The Workers’ Assistance Fund (FAT) is a special financial-accounting fund linked to the Ministry of Labor and Employment (MTE), whose purpose is to finance the Unemployment Insurance, Salary Bonus and Economic Development Programs. The main actions financed by the Bank with funds from FAT are as follow:
Specification TADE AMOUNT Special Program to Fight Drought Effects 16/2006 2,659 PROGER URBANO - Investment 17/2006 16,400 FAT - Infrastructure 18/2006 264,675 PRONAF - Investment 19/2006 1,473 PROGER-RURAL - Cost 20/2006 1,631 PRONAF - Cost 01/2007 3,309 PROGER-RURAL - Investment 02/2007 23,533 PROTRABALHO - Investment 04/2007 147,220
PNMPO - National Program for Guided Productive Microcredit 01/2010 18,093 TOTAL
478,993
Funds derived from the Fund for Workers’ Assistance (FAT), recorded under ‘Interest-bearing special deposits’, totaling R$ 549,767 (R$ 355,394 as at 06/30/2010) are subject to SELIC (Central Bank overnight rate) while they are not used in lending operations, and to TJLP after they are released to final borrowers. Available funds bearing interest at SELIC totaled R$ 27,601 (R$ 19.895 as at 06/30/2010).
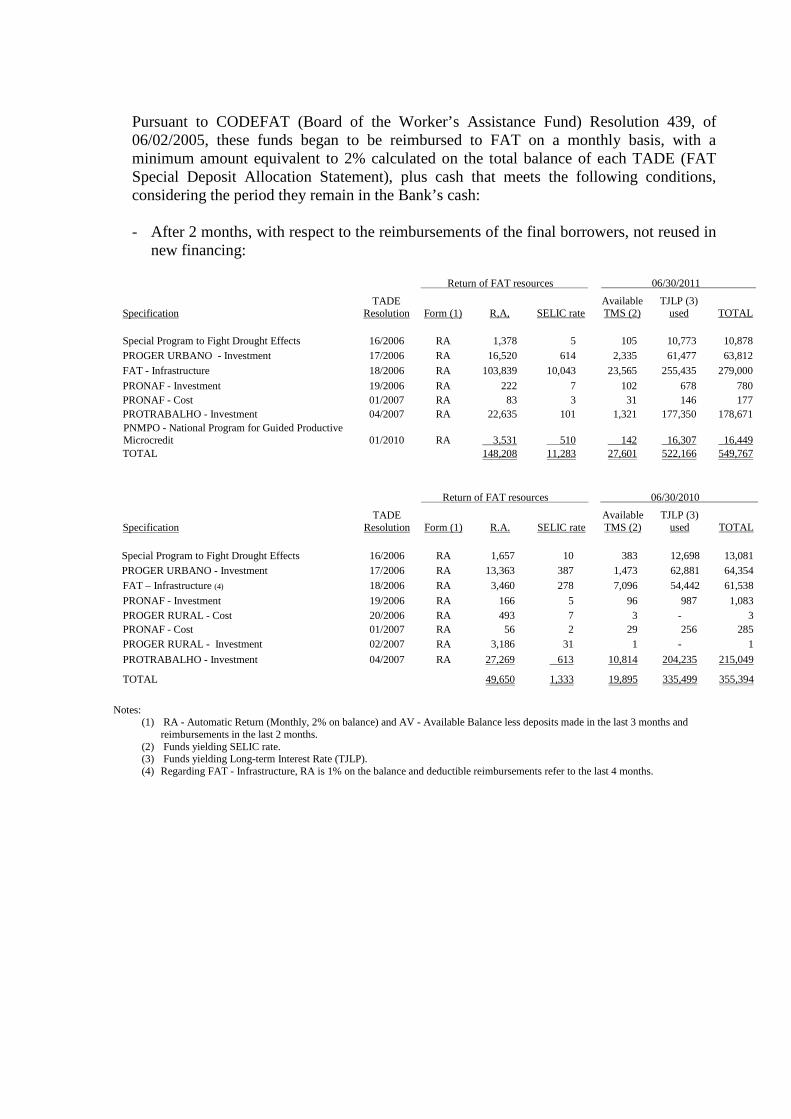
Pursuant to CODEFAT (Board of the Worker’s Assistance Fund) Resolution 439, of 06/02/2005, these funds began to be reimbursed to FAT on a monthly basis, with a minimum amount equivalent to 2% calculated on the total balance of each TADE (FAT Special Deposit Allocation Statement), plus cash that meets the following conditions, considering the period they remain in the Bank’s cash: - After 2 months, with respect to the reimbursements of the final borrowers, not reused in
new financing:
Return of FAT resources 06/30/2011
Specification TADE
Resolution Form (1) R,A, SELIC rate Available TMS (2)
TJLP (3) used
TOTAL
Special Program to Fight Drought Effects 16/2006 RA 1,378 5 105 10,773 10,878 PROGER URBANO - Investment 17/2006 RA 16,520 614 2,335 61,477 63,812
FAT - Infrastructure 18/2006 RA 103,839 10,043 23,565 255,435 279,000
PRONAF - Investment 19/2006 RA 222 7 102 678 780 PRONAF - Cost 01/2007 RA 83 3 31 146 177 PROTRABALHO - Investment 04/2007 RA 22,635 101 1,321 177,350 178,671
PNMPO - National Program for Guided Productive Microcredit
01/2010
RA
3,531
510
142
16,307
16,449
TOTAL 148,208 11,283 27,601 522,166 549,767
Return of FAT resources 06/30/2010
Specification TADE
Resolution Form (1) R.A. SELIC rate Available TMS (2)
TJLP (3) used
TOTAL
Special Program to Fight Drought Effects 16/2006 RA 1,657 10 383 12,698 13,081 PROGER URBANO - Investment 17/2006 RA 13,363 387 1,473 62,881 64,354
FAT – Infrastructure (4) 18/2006 RA 3,460 278 7,096 54,442 61,538
PRONAF - Investment 19/2006 RA 166 5 96 987 1,083 PROGER RURAL - Cost 20/2006 RA 493 7 3 - 3 PRONAF - Cost 01/2007 RA 56 2 29 256 285 PROGER RURAL - Investment 02/2007 RA 3,186 31 1 - 1
PROTRABALHO - Investment 04/2007 RA 27,269 613 10,814 204,235 215,049
TOTAL 49,650 1,333 19,895 335,499 355,394
Notes:
(1) RA - Automatic Return (Monthly, 2% on balance) and AV - Available Balance less deposits made in the last 3 months and reimbursements in the last 2 months.
(2) Funds yielding SELIC rate. (3) Funds yielding Long-term Interest Rate (TJLP). (4) Regarding FAT - Infrastructure, RA is 1% on the balance and deductible reimbursements refer to the last 4 months.
28 RISK MANAGEMENT AND BASEL RATIO
a) Risk and capital management
Introduction and overview
The Bank is exposed to the following risks arising from the use of financial instruments:
- credit risk; - liquidity risk; - market risk; and - operational risk. Risk management structure
The Executive Board is responsible for approving risk policies and subsequent reporting to the Board of Directors. The Control and Risk Executive Board coordinates the implementation of risk policies and monitors the performance of risk management areas. The Corporate Risk Management Committee analyzes and approves the risk management matters reported to senior management levels, as well as those to be implemented by lower management levels. Specific area coordinates the operational risk management and manages at corporate level: credit, liquidity, market and operational risks, proposes the definition of credit, liquidity, market and operational risk management methodologies and models and disseminates the risk management culture throughout the Bank. Risk management policy
The corporate risk management policy sets forth guidelines and standards related to the Bank’s activities for credit, liquidity, market and operational risk management.
The risks do not comprise solely threats since opportunities are also risk events, mainly at strategic level. Without ignoring the opportunities presented to the Bank, which are duly evaluated, the guidelines set in the Bank's corporate risk management policy are also focused on the management of risks affecting the attainment of corporate goals, including the related controls.
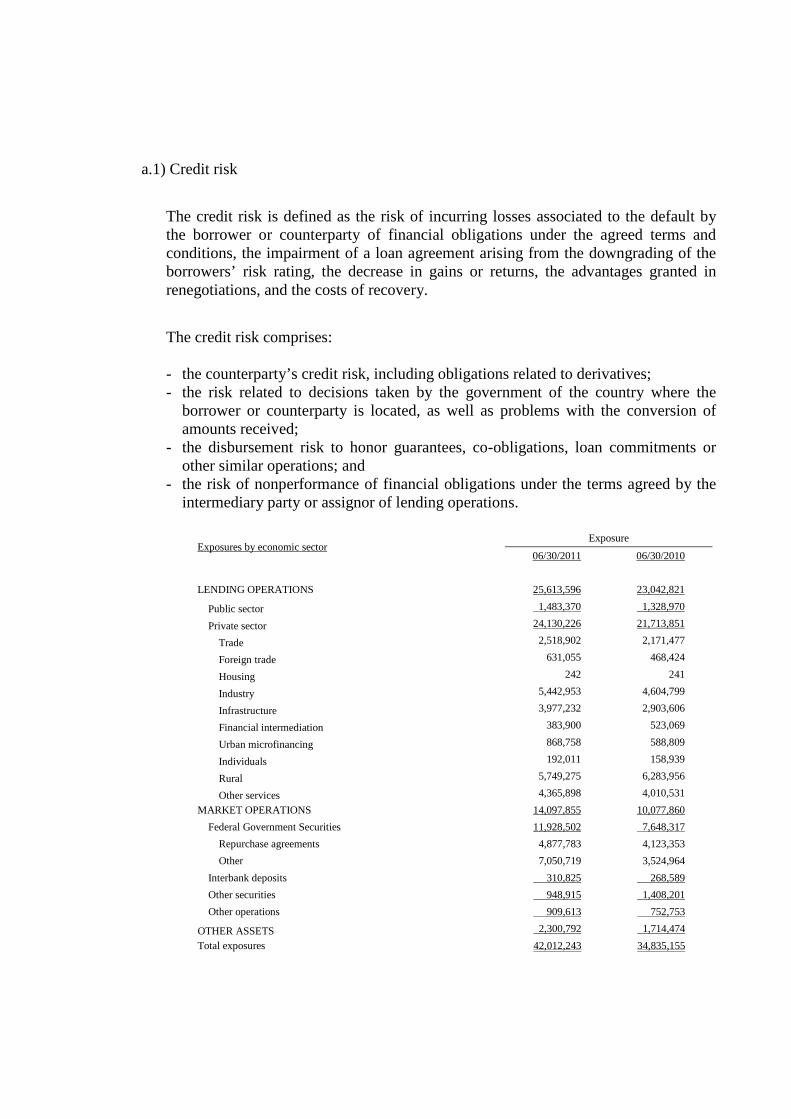
a.1) Credit risk
The credit risk is defined as the risk of incurring losses associated to the default by the borrower or counterparty of financial obligations under the agreed terms and conditions, the impairment of a loan agreement arising from the downgrading of the borrowers’ risk rating, the decrease in gains or returns, the advantages granted in renegotiations, and the costs of recovery.
The credit risk comprises: - the counterparty’s credit risk, including obligations related to derivatives; - the risk related to decisions taken by the government of the country where the
borrower or counterparty is located, as well as problems with the conversion of amounts received;
- the disbursement risk to honor guarantees, co-obligations, loan commitments or other similar operations; and
- the risk of nonperformance of financial obligations under the terms agreed by the intermediary party or assignor of lending operations.
Exposures by economic sector Exposure
06/30/2011 06/30/2010
LENDING OPERATIONS 25,613,596 23,042,821
Public sector 1,483,370 1,328,970
Private sector 24,130,226 21,713,851
Trade 2,518,902 2,171,477
Foreign trade 631,055 468,424
Housing 242 241
Industry 5,442,953 4,604,799
Infrastructure 3,977,232 2,903,606
Financial intermediation 383,900 523,069
Urban microfinancing 868,758 588,809
Individuals 192,011 158,939
Rural 5,749,275 6,283,956
Other services 4,365,898 4,010,531
MARKET OPERATIONS 14,097,855 10,077,860
Federal Government Securities 11,928,502 7,648,317
Repurchase agreements 4,877,783 4,123,353
Other 7,050,719 3,524,964
Interbank deposits 310,825 268,589
Other securities 948,915 1,408,201
Other operations 909,613 752,753
OTHER ASSETS 2,300,792 1,714,474
Total exposures 42,012,243 34,835,155
a.2) Credit risk management
The credit risk management guidelines comprise: 1) Risk limits:
All lending operations are supported by risk limits. In general, these limits are approved by committees, from branches to the Executive Board, based on specific models to customers in the rural, industrial, commercial and service sectors.
2) Risk assessment:
The risk limits are preceded by risk assessment, based on models prepared in accordance with the customer's and operation's characteristics, namely: i) small-sized customers, in terms of amounts of liabilities in the Bank, mainly comprised of small rural producers and micro urban entrepreneurs - the risk assessment comprises analysis of customer’s personal information and the operation’s conformity with the standards of each financing program, whose conditions aim at selectively meeting the borrowers’ needs; ii) medium-sized customers, in terms of amounts of liabilities in the Bank - adoption of specific risk assessment models, in accordance with the customers’ activities, upon selection of standard alternatives for risk factors considered; and iii) large-sized customers, in terms of amounts of liabilities in the Bank, including the holders of structured operations - adoption of a risk assessment model, based on the individual and detailed analysis of each risk, supported by the findings, data and analysis arguments, including the application of criteria for acceptance of differentiated collaterals, allowing credit analysis under special conditions, considering the individuality and complexity of projects and operation with similar size.
3) Risk rating:
All lending operations are subject to risk rating, based on the customer’s risk rating and grade of the lending operation, in accordance with its characteristics, value, term, collaterals and condition.
In addition, credit risk management involves the constant flow of information, allows the identification, measurement, control and risk mitigation to ensure that Banco do Nordeste maintains its exposure to credit risks within reasonable parameters. Accordingly, several instruments are used, including: credit policies, management reports, risk rating system, performance indicators by macro sectors.
4) Asset evaluation by portfolio:
The portfolio evaluation enables the Bank to identify, in its portfolio of products and customers, risk concentrations in order to adopt preventive and corrective measures related to the Bank's global risk management.
5) Collaterals:
The collateral policy for lending operations sets out parameters for the selection of collaterals and their evaluation. In view of the quality and sufficiency of collaterals provided, based on the customer’s risk assessment, the global risk rating, including customer and operation, may be granted higher or lower risk ratings.
6) Decision making process:
Any approval in terms of risk limits is based on the level of authority by body. In accordance with their characteristics and amount, the limits may be analyzed and defined by the branches' credit assessment committees or the Operational Supporting Centers' risk limit approval committees, or also be decided by the customer risk limit approval committee of the General Executive Board, Executive Board or Board of Directors.
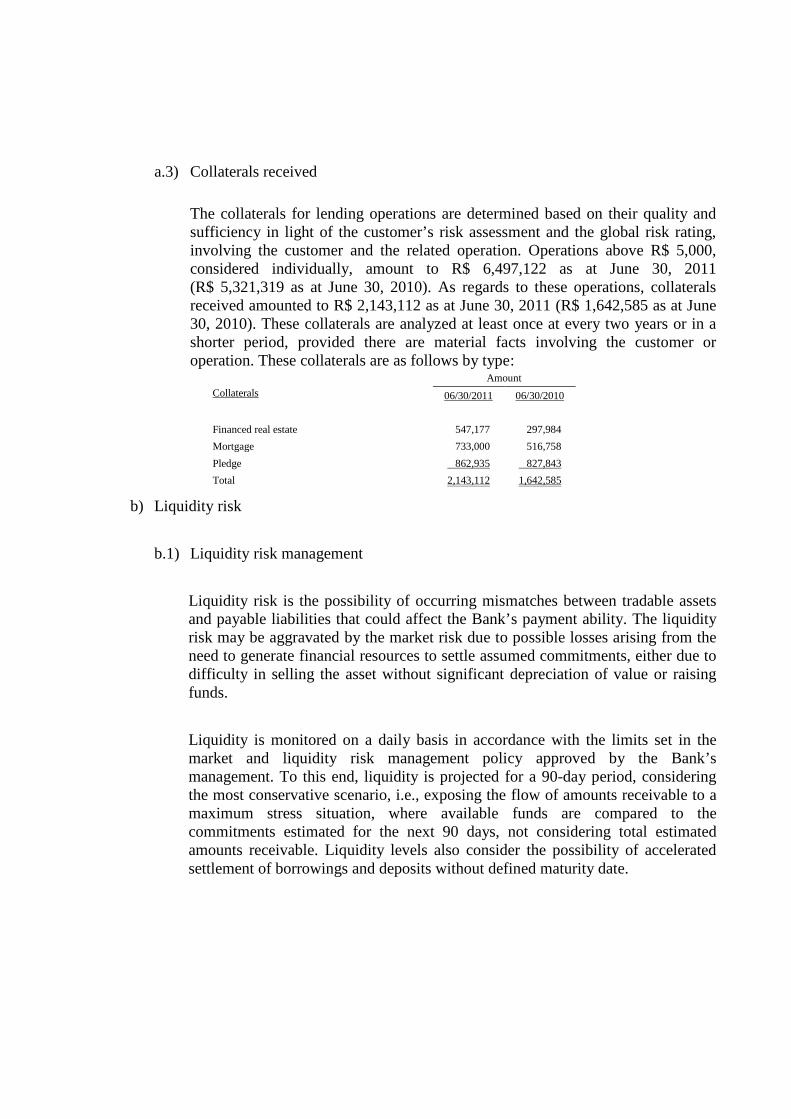
a.3) Collaterals received
The collaterals for lending operations are determined based on their quality and
sufficiency in light of the customer’s risk assessment and the global risk rating, involving the customer and the related operation. Operations above R$ 5,000, considered individually, amount to R$ 6,497,122 as at June 30, 2011 (R$ 5,321,319 as at June 30, 2010). As regards to these operations, collaterals received amounted to R$ 2,143,112 as at June 30, 2011 (R$ 1,642,585 as at June 30, 2010). These collaterals are analyzed at least once at every two years or in a shorter period, provided there are material facts involving the customer or operation. These collaterals are as follows by type:
Collaterals
Amount
06/30/2011 06/30/2010
Financed real estate 547,177 297,984
Mortgage 733,000 516,758
Pledge 862,935 827,843
Total 2,143,112 1,642,585
b) Liquidity risk
b.1) Liquidity risk management
Liquidity risk is the possibility of occurring mismatches between tradable assets and payable liabilities that could affect the Bank’s payment ability. The liquidity risk may be aggravated by the market risk due to possible losses arising from the need to generate financial resources to settle assumed commitments, either due to difficulty in selling the asset without significant depreciation of value or raising funds.
Liquidity is monitored on a daily basis in accordance with the limits set in the market and liquidity risk management policy approved by the Bank’s management. To this end, liquidity is projected for a 90-day period, considering the most conservative scenario, i.e., exposing the flow of amounts receivable to a maximum stress situation, where available funds are compared to the commitments estimated for the next 90 days, not considering total estimated amounts receivable. Liquidity levels also consider the possibility of accelerated settlement of borrowings and deposits without defined maturity date.
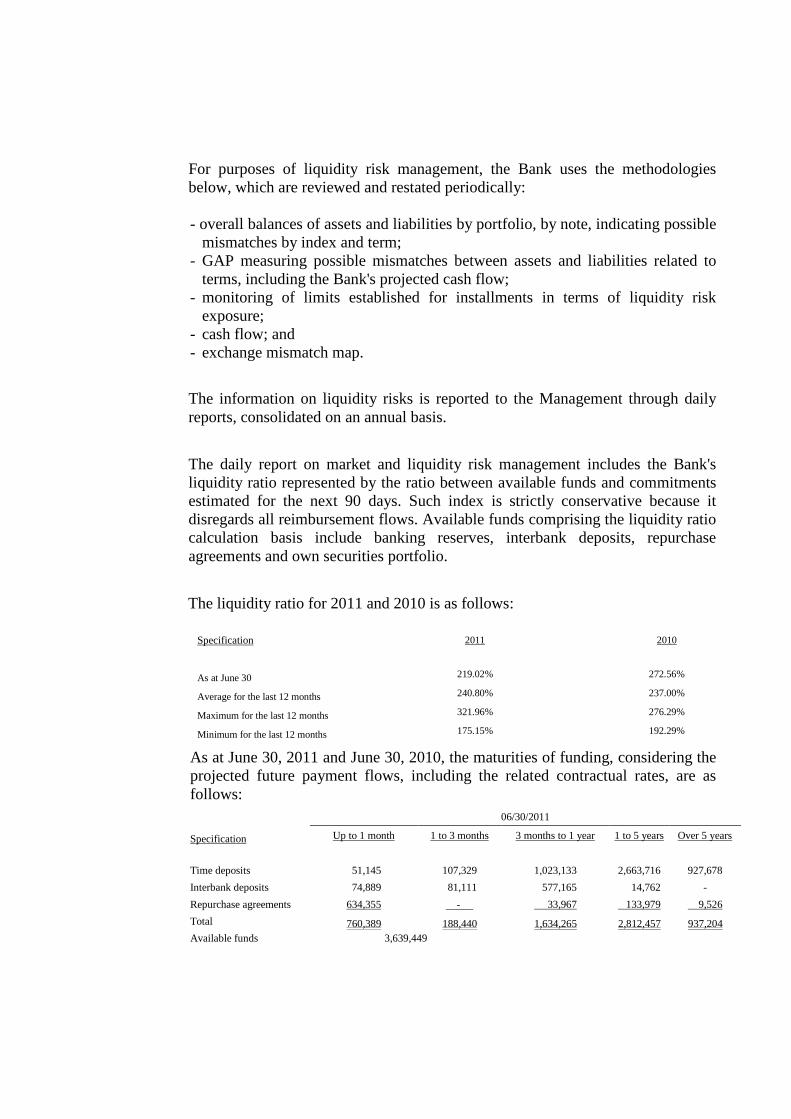
For purposes of liquidity risk management, the Bank uses the methodologies below, which are reviewed and restated periodically: - overall balances of assets and liabilities by portfolio, by note, indicating possible
mismatches by index and term; - GAP measuring possible mismatches between assets and liabilities related to
terms, including the Bank's projected cash flow; - monitoring of limits established for installments in terms of liquidity risk
exposure; - cash flow; and - exchange mismatch map.
The information on liquidity risks is reported to the Management through daily reports, consolidated on an annual basis.
The daily report on market and liquidity risk management includes the Bank's liquidity ratio represented by the ratio between available funds and commitments estimated for the next 90 days. Such index is strictly conservative because it disregards all reimbursement flows. Available funds comprising the liquidity ratio calculation basis include banking reserves, interbank deposits, repurchase agreements and own securities portfolio.
The liquidity ratio for 2011 and 2010 is as follows:
Specification 2011 2010
As at June 30 219.02%
272.56%
Average for the last 12 months 240.80%
237.00%
Maximum for the last 12 months 321.96%
276.29%
Minimum for the last 12 months 175.15%
192.29%
As at June 30, 2011 and June 30, 2010, the maturities of funding, considering the projected future payment flows, including the related contractual rates, are as follows: Specification
06/30/2011
Up to 1 month 1 to 3 months 3 months to 1 year 1 to 5 years Over 5 years
Time deposits 51,145 107,329 1,023,133 2,663,716 927,678
Interbank deposits 74,889 81,111 577,165 14,762 -
Repurchase agreements 634,355 - 33,967 133,979 9,526
Total 760,389 188,440 1,634,265 2,812,457 937,204 Available funds 3,639,449
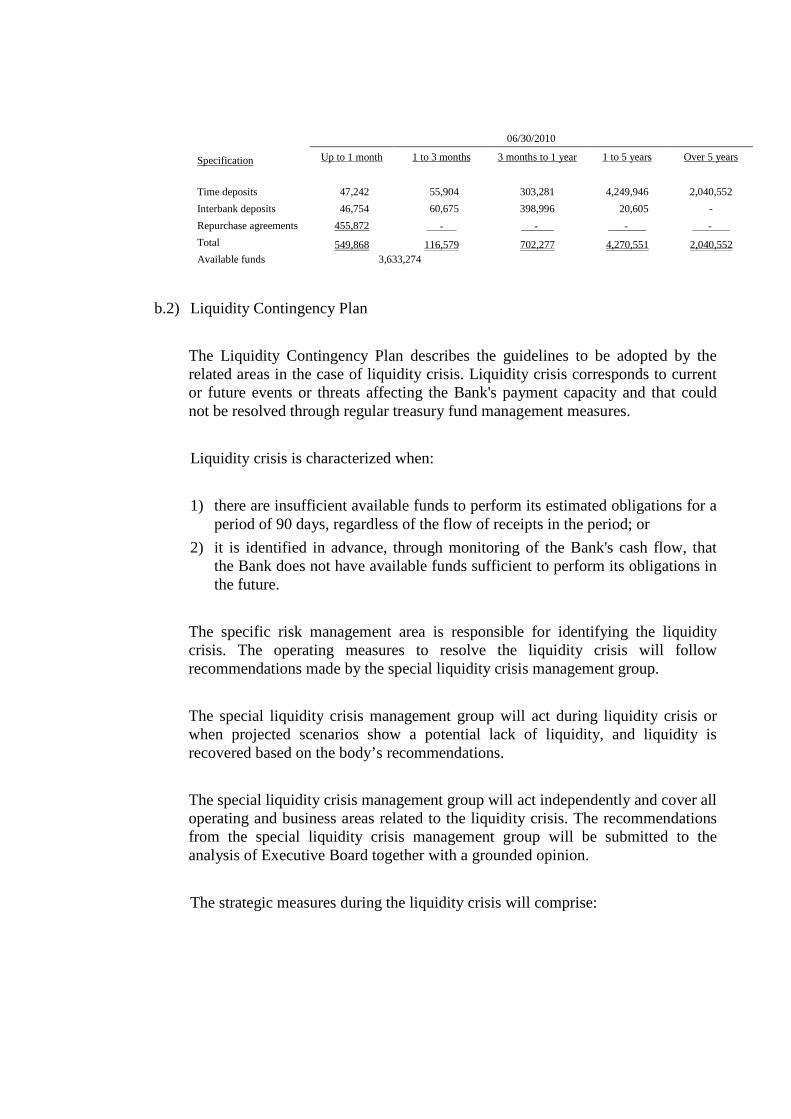
Specification
06/30/2010
Up to 1 month 1 to 3 months 3 months to 1 year 1 to 5 years Over 5 years
Time deposits 47,242 55,904 303,281 4,249,946 2,040,552
Interbank deposits 46,754 60,675 398,996 20,605 -
Repurchase agreements 455,872 - - - - Total 549,868 116,579 702,277 4,270,551 2,040,552 Available funds 3,633,274
b.2) Liquidity Contingency Plan
The Liquidity Contingency Plan describes the guidelines to be adopted by the related areas in the case of liquidity crisis. Liquidity crisis corresponds to current or future events or threats affecting the Bank's payment capacity and that could not be resolved through regular treasury fund management measures.
Liquidity crisis is characterized when:
1) there are insufficient available funds to perform its estimated obligations for a period of 90 days, regardless of the flow of receipts in the period; or
2) it is identified in advance, through monitoring of the Bank's cash flow, that the Bank does not have available funds sufficient to perform its obligations in the future.
The specific risk management area is responsible for identifying the liquidity crisis. The operating measures to resolve the liquidity crisis will follow recommendations made by the special liquidity crisis management group.
The special liquidity crisis management group will act during liquidity crisis or when projected scenarios show a potential lack of liquidity, and liquidity is recovered based on the body’s recommendations.
The special liquidity crisis management group will act independently and cover all operating and business areas related to the liquidity crisis. The recommendations from the special liquidity crisis management group will be submitted to the analysis of Executive Board together with a grounded opinion.
The strategic measures during the liquidity crisis will comprise:
1) External scope:
- performance of operations and renegotiation of operations with financial institutions with which the Bank conducts interbank transactions;
- performance of operations with monetary authorities; - renegotiation of operational conditions with customers with which the Bank
conducts lending and borrowing operations; and - other strategies focused on solving the liquidity crisis.
2) Internal scope:
- discontinuity of, changes in or suspension in the sale of products; - suspension of the concession of operating limits; - renegotiation of lending and borrowing operations, including accelerated
receipts and extension of borrowing terms; - renegotiation of agreements with suppliers; and - other strategies focused on solving the liquidity crisis.
The procedures adopted for solving the liquidity crisis include, but are not limited to, the following: - increase in the funding rate; - funding in new markets; - reduction or suspension of lending operations; - transfer of credit portfolio; - postponement or suspension of release of funds for contracted operations; - renegotiation of existing liabilities; - sale of assets; and - operations with monetary authorities.
The abovementioned procedures do not follow a priority order and the special liquidity crisis management group will define the criteria, method and timetable for implementation of the recommendations in light of actual facts, their related effects and the time necessary to achieve the necessary goals.
The recommendations made by the special liquidity crisis management group should be in line with the Bank’s operating policies as a development bank.
c) Market risk
c.1) Market risk management
Market risk is the possibility of depreciation of assets and/or increase in liability costs arising from changes in interest rates, exchange rates, and stock and commodity prices.
In managing market risks, the Bank considers multiple scenarios, based on the following methodologies:
1) global Value at Risk (VaR), by portfolio, note and index;
2) global duration (assets and liabilities), by portfolio, note and index;
3) stress test;
4) GAP measuring possible mismatches between assets and liabilities in respect of terms, including the Bank's projected cash flow;
5) overall balances of assets and liabilities, by portfolio and note, including possible mismatches by indices;
6) monitoring of limits set for installments in terms of market risk exposure; and
7) exchange mismatch map.
The preparation of daily, monthly, quarterly and annual managerial reports for management and supervisory bodies is critical to market risk management. Such reports include, among others, detailed information on and analysis of exposure levels of trading and non-trading portfolios, exchange exposure levels, liquidity levels and indices, and monitoring of limits of operations carried out with other financial institutions.
In addition to these reports, the monitoring of market and liquidity risk exposure limits includes a warning system implemented in order to expedite the preparation of managerial information necessary for the decision-making process by the proper levels of authority, based on the following procedures:
Risk exposure limits Control procedure
• Trading portfolio: 1% of portfolio’s value
• Non-trading portfolio: 5% of portfolio’s value
If the exposure level exceeds 80% of the limit, the risk management area issues a warning to the area responsible for the financial operations.
c.2) Trading and non-trading portfolios
For purposes of market risk management, operations are classified into two portfolios:
1) Trading book: comprises trading or hedging transactions related to trading portfolios that are intended to be traded before their contractual terms, under normal market conditions, without non-trading clause. The trading portfolio composition is daily monitored by the risk management area using the marked-to-market value of operations.
In order to monitor and control Trading Portfolio risks, Banco do Nordeste uses the parametric VaR, which measures the maximum expected loss of a portfolio within a period of time, considering a confidence level of 99%.
The Value at Risk (VaR) of fixed rate transactions of the BNB Trading Portfolio, as at 06/30/2011, was R$ 130, compared to the portfolio’s net balance (assets less liabilities) of R$ 2,731,000.
As at 06/30/2011, the VaR ratio was just 0.005% of the net amount of the Trading Portfolio, well below the one-percent cap set by the Bank’s Risk Management Corporate Policy.
The low exposure to the market risk of this portfolio arises from the fact that fixed-rate transactions have a one-day maturity and are backed by Federal Government securities.
2) Non-trading portfolio: comprises operations not included in the trading portfolio and subject to market risks. Risk measurement and assessment of non-trading portfolio related to interest rates, price indices and exchange rate changes comply with the policies set by the Central Bank using widely known methodologies adopted by financial institutions based on the following parameters and assumptions:
- VaR parameter;
- normal distribution;
- statistical parameters;
- standard deviation of returns;
- rate maintenance term: 1 year;
- portfolio settlement term: 10 days;
- historical rate analysis period: 1 year;
- 12 points and their respective correlations;
- Confidence level of 99%.
VaR calculation is determined based on information provided by ANBIMA as regards to the rates used in the financial market for each risk factor.
c.2.1) Market risk indicators
The market risk indicators, at marked-to-market values, are summarized as follows:
Specification 06/30/2011
From 07.01.2010 to 06.30.2011 Average Maximum Minimum
Marked-to-market currency exposure 16,715 43,387 90,299 1,567 Trading portfolio interest rate risk (PJUR1) 537 721 1,367 195 Commodity price variation risk (PCOM) 395 13,169 30,543 374 Non-trading portfolio interest rate risk (RBAN) 49,994 66,112 81,296 42,625 Specification
06/30/2010 From 07.01.2009 to 06.30.2010
Average Maximum Minimum Marked-to-market currency exposure 51,670 45,505 87,973 10,508 Trading portfolio interest rate risk (PJUR1) 1,195 784 1,863 179 Commodity price variation risk (PCOM) 19,855 21,258 31,082 18,374 Non-trading portfolio interest rate risk (RBAN) 16,927 32,810 54,453 16,048
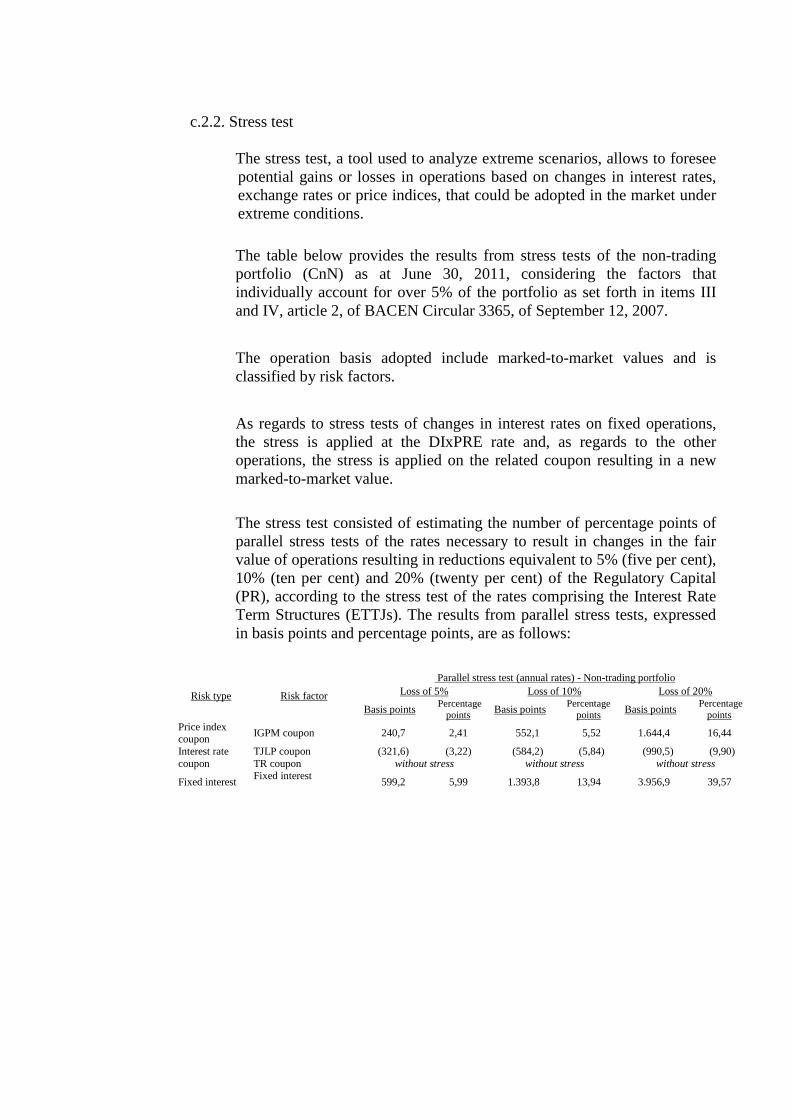
c.2.2. Stress test
The stress test, a tool used to analyze extreme scenarios, allows to foresee potential gains or losses in operations based on changes in interest rates, exchange rates or price indices, that could be adopted in the market under extreme conditions.
The table below provides the results from stress tests of the non-trading portfolio (CnN) as at June 30, 2011, considering the factors that individually account for over 5% of the portfolio as set forth in items III and IV, article 2, of BACEN Circular 3365, of September 12, 2007.
The operation basis adopted include marked-to-market values and is classified by risk factors.
As regards to stress tests of changes in interest rates on fixed operations, the stress is applied at the DIxPRE rate and, as regards to the other operations, the stress is applied on the related coupon resulting in a new marked-to-market value.
The stress test consisted of estimating the number of percentage points of parallel stress tests of the rates necessary to result in changes in the fair value of operations resulting in reductions equivalent to 5% (five per cent), 10% (ten per cent) and 20% (twenty per cent) of the Regulatory Capital (PR), according to the stress test of the rates comprising the Interest Rate Term Structures (ETTJs). The results from parallel stress tests, expressed in basis points and percentage points, are as follows:
Risk type Risk factor
Parallel stress test (annual rates) - Non-trading portfolio Loss of 5% Loss of 10% Loss of 20%
Basis points Percentage
points Basis points Percentage
points Basis points Percentage
points Price index coupon
IGPM coupon 240,7 2,41 552,1 5,52 1.644,4 16,44
Interest rate coupon
TJLP coupon (321,6) (3,22) (584,2) (5,84) (990,5) (9,90) TR coupon without stress without stress without stress
Fixed interest Fixed interest
599,2 5,99 1.393,8 13,94 3.956,9 39,57
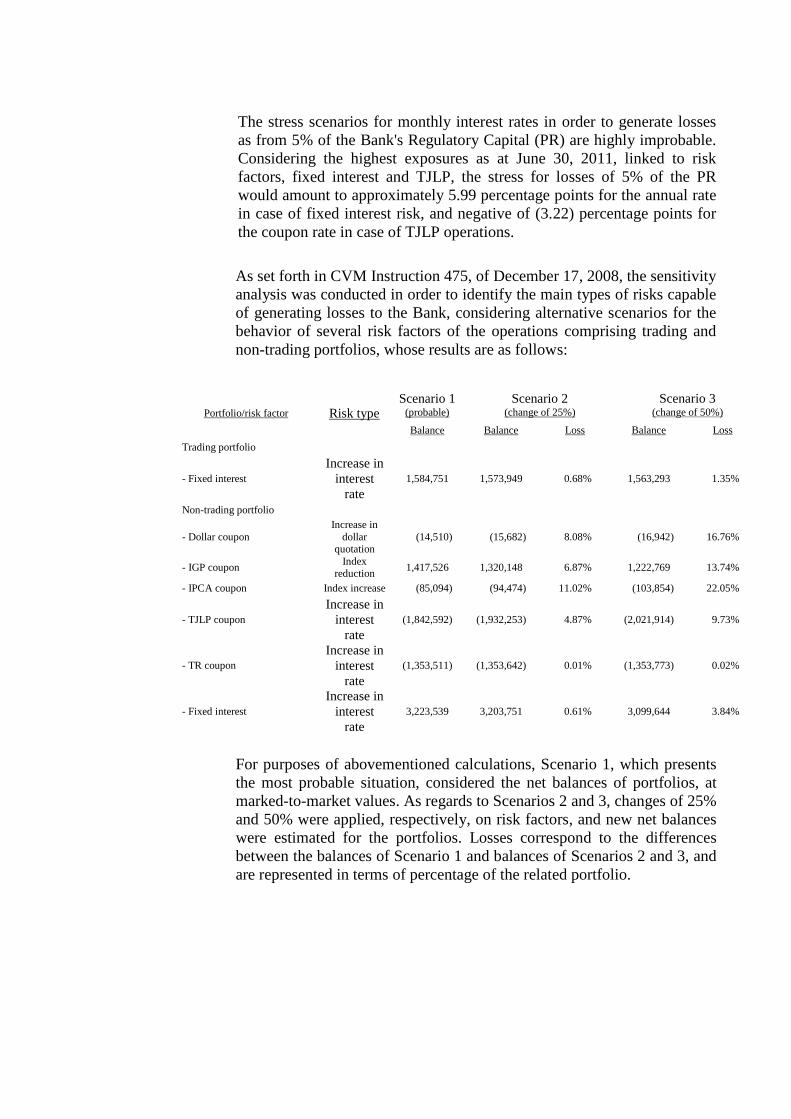
The stress scenarios for monthly interest rates in order to generate losses as from 5% of the Bank's Regulatory Capital (PR) are highly improbable. Considering the highest exposures as at June 30, 2011, linked to risk factors, fixed interest and TJLP, the stress for losses of 5% of the PR would amount to approximately 5.99 percentage points for the annual rate in case of fixed interest risk, and negative of (3.22) percentage points for the coupon rate in case of TJLP operations.
As set forth in CVM Instruction 475, of December 17, 2008, the sensitivity analysis was conducted in order to identify the main types of risks capable of generating losses to the Bank, considering alternative scenarios for the behavior of several risk factors of the operations comprising trading and non-trading portfolios, whose results are as follows:
Portfolio/risk factor Risk type Scenario 1
(probable) Scenario 2
(change of 25%) Scenario 3
(change of 50%)
Balance Balance Loss Balance Loss
Trading portfolio
- Fixed interest Increase in
interest rate
1,584,751 1,573,949 0.68% 1,563,293 1.35%
Non-trading portfolio
- Dollar coupon Increase in
dollar quotation
(14,510) (15,682) 8.08% (16,942) 16.76%
- IGP coupon Index
reduction 1,417,526 1,320,148 6.87% 1,222,769 13.74%
- IPCA coupon Index increase (85,094) (94,474) 11.02% (103,854) 22.05%
- TJLP coupon Increase in
interest rate
(1,842,592) (1,932,253) 4.87% (2,021,914) 9.73%
- TR coupon Increase in
interest rate
(1,353,511) (1,353,642) 0.01% (1,353,773) 0.02%
- Fixed interest Increase in
interest rate
3,223,539 3,203,751 0.61% 3,099,644 3.84%
For purposes of abovementioned calculations, Scenario 1, which presents the most probable situation, considered the net balances of portfolios, at marked-to-market values. As regards to Scenarios 2 and 3, changes of 25% and 50% were applied, respectively, on risk factors, and new net balances were estimated for the portfolios. Losses correspond to the differences between the balances of Scenario 1 and balances of Scenarios 2 and 3, and are represented in terms of percentage of the related portfolio.
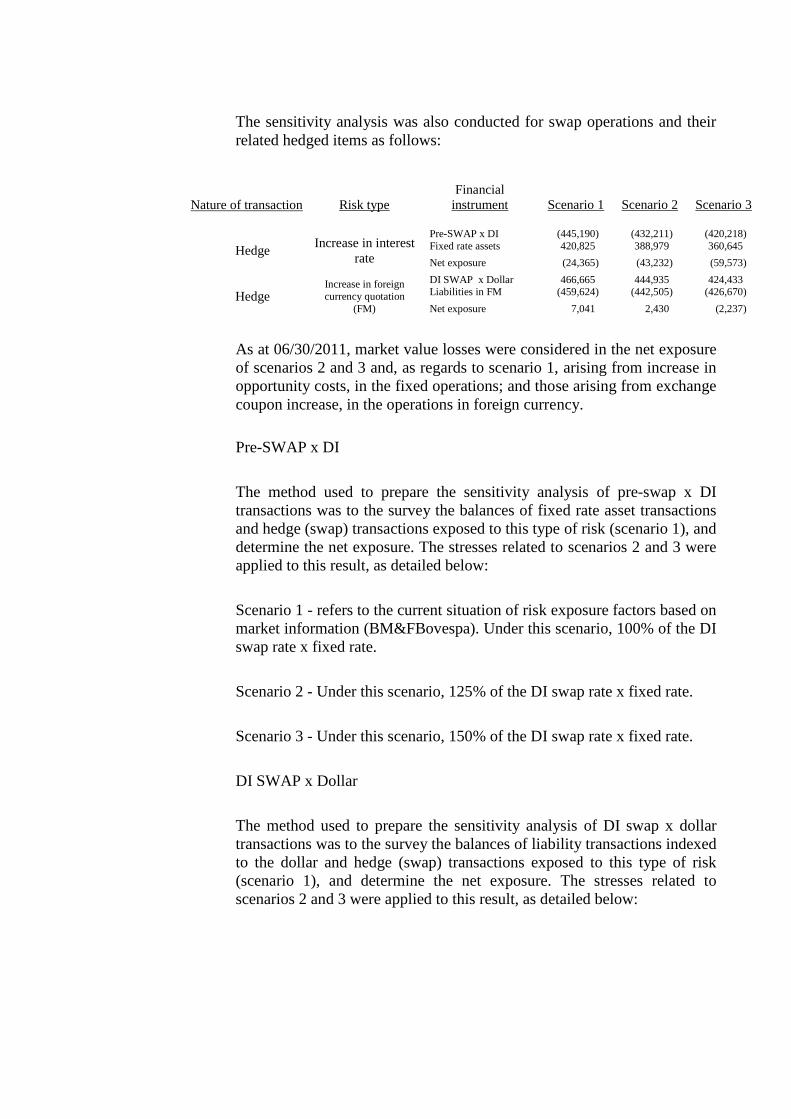
The sensitivity analysis was also conducted for swap operations and their related hedged items as follows:
Nature of transaction
Risk type Financial instrument
Scenario 1
Scenario 2
Scenario 3
Hedge
Increase in interest rate
Pre-SWAP x DI (445,190) (432,211) (420,218) Fixed rate assets 420,825 388,979 360,645
Net exposure (24,365) (43,232) (59,573)
Hedge
Increase in foreign currency quotation
(FM)
DI SWAP x Dollar 466,665 444,935 424,433 Liabilities in FM (459,624) (442,505) (426,670)
Net exposure 7,041 2,430 (2,237)
As at 06/30/2011, market value losses were considered in the net exposure of scenarios 2 and 3 and, as regards to scenario 1, arising from increase in opportunity costs, in the fixed operations; and those arising from exchange coupon increase, in the operations in foreign currency.
Pre-SWAP x DI
The method used to prepare the sensitivity analysis of pre-swap x DI transactions was to the survey the balances of fixed rate asset transactions and hedge (swap) transactions exposed to this type of risk (scenario 1), and determine the net exposure. The stresses related to scenarios 2 and 3 were applied to this result, as detailed below:
Scenario 1 - refers to the current situation of risk exposure factors based on market information (BM&FBovespa). Under this scenario, 100% of the DI swap rate x fixed rate.
Scenario 2 - Under this scenario, 125% of the DI swap rate x fixed rate.
Scenario 3 - Under this scenario, 150% of the DI swap rate x fixed rate.
DI SWAP x Dollar
The method used to prepare the sensitivity analysis of DI swap x dollar transactions was to the survey the balances of liability transactions indexed to the dollar and hedge (swap) transactions exposed to this type of risk (scenario 1), and determine the net exposure. The stresses related to scenarios 2 and 3 were applied to this result, as detailed below:
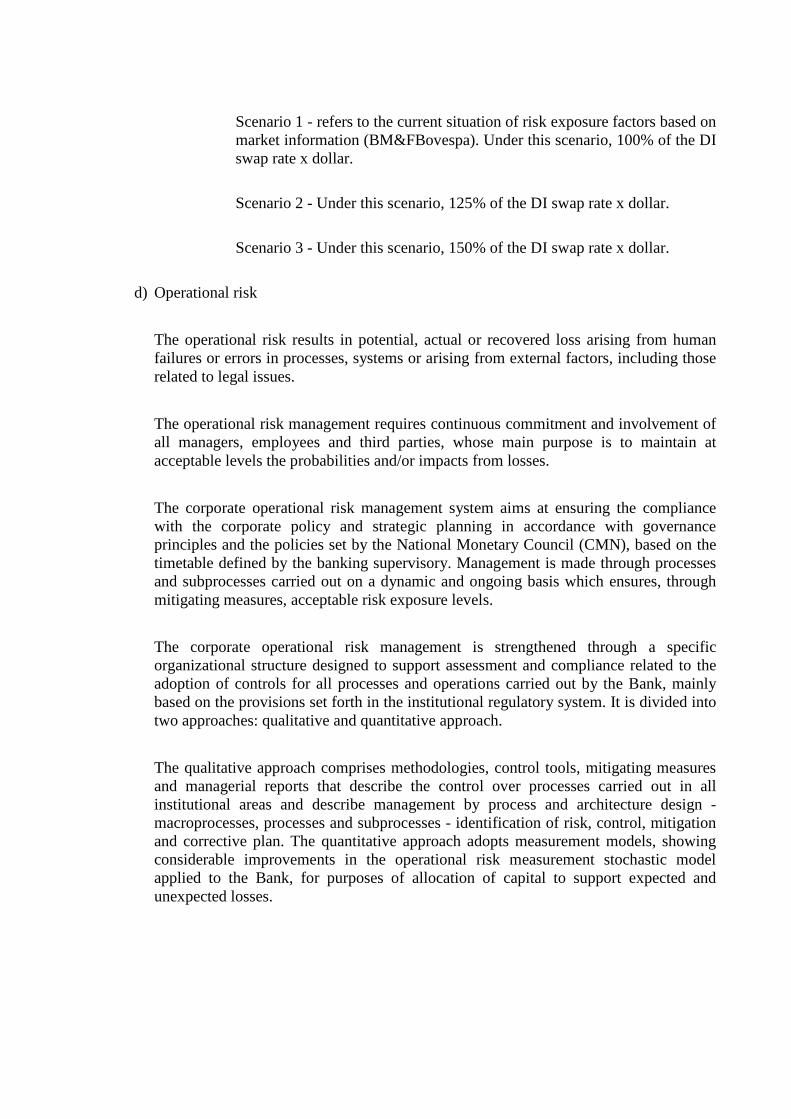
Scenario 1 - refers to the current situation of risk exposure factors based on market information (BM&FBovespa). Under this scenario, 100% of the DI swap rate x dollar.
Scenario 2 - Under this scenario, 125% of the DI swap rate x dollar.
Scenario 3 - Under this scenario, 150% of the DI swap rate x dollar.
d) Operational risk
The operational risk results in potential, actual or recovered loss arising from human failures or errors in processes, systems or arising from external factors, including those related to legal issues.
The operational risk management requires continuous commitment and involvement of all managers, employees and third parties, whose main purpose is to maintain at acceptable levels the probabilities and/or impacts from losses.
The corporate operational risk management system aims at ensuring the compliance with the corporate policy and strategic planning in accordance with governance principles and the policies set by the National Monetary Council (CMN), based on the timetable defined by the banking supervisory. Management is made through processes and subprocesses carried out on a dynamic and ongoing basis which ensures, through mitigating measures, acceptable risk exposure levels.
The corporate operational risk management is strengthened through a specific organizational structure designed to support assessment and compliance related to the adoption of controls for all processes and operations carried out by the Bank, mainly based on the provisions set forth in the institutional regulatory system. It is divided into two approaches: qualitative and quantitative approach.
The qualitative approach comprises methodologies, control tools, mitigating measures and managerial reports that describe the control over processes carried out in all institutional areas and describe management by process and architecture design - macroprocesses, processes and subprocesses - identification of risk, control, mitigation and corrective plan. The quantitative approach adopts measurement models, showing considerable improvements in the operational risk measurement stochastic model applied to the Bank, for purposes of allocation of capital to support expected and unexpected losses.
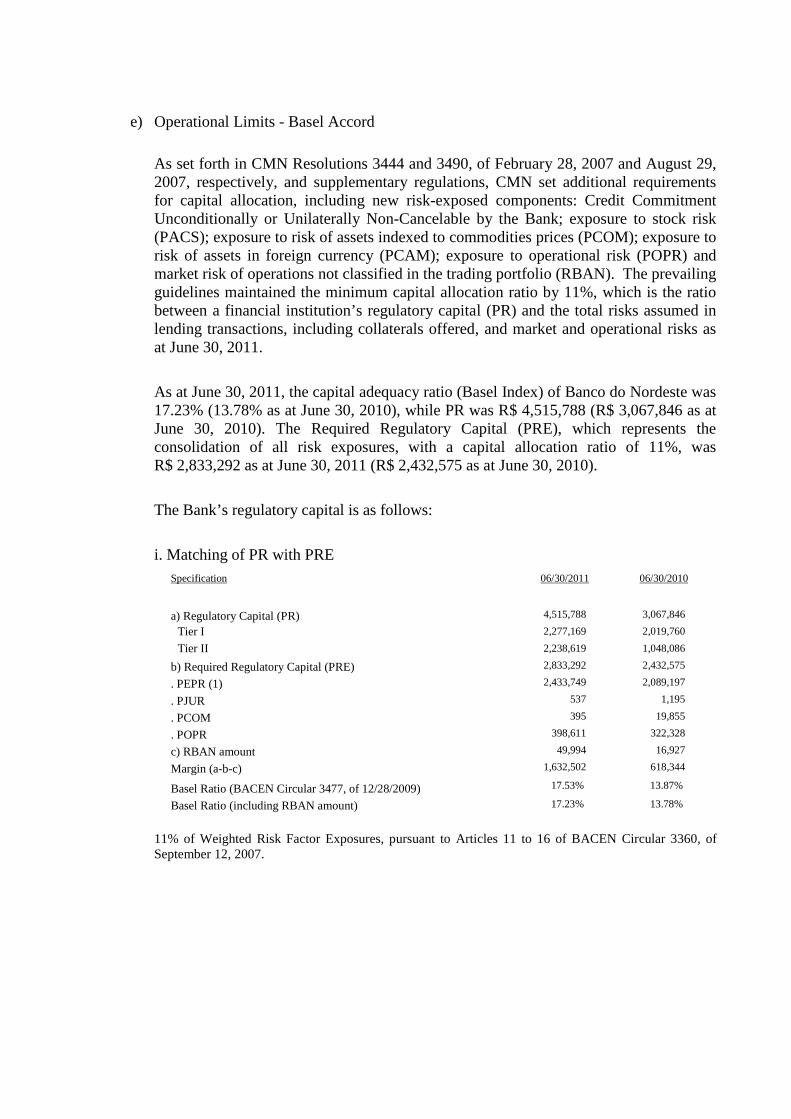
e) Operational Limits - Basel Accord
As set forth in CMN Resolutions 3444 and 3490, of February 28, 2007 and August 29, 2007, respectively, and supplementary regulations, CMN set additional requirements for capital allocation, including new risk-exposed components: Credit Commitment Unconditionally or Unilaterally Non-Cancelable by the Bank; exposure to stock risk (PACS); exposure to risk of assets indexed to commodities prices (PCOM); exposure to risk of assets in foreign currency (PCAM); exposure to operational risk (POPR) and market risk of operations not classified in the trading portfolio (RBAN). The prevailing guidelines maintained the minimum capital allocation ratio by 11%, which is the ratio between a financial institution’s regulatory capital (PR) and the total risks assumed in lending transactions, including collaterals offered, and market and operational risks as at June 30, 2011.
As at June 30, 2011, the capital adequacy ratio (Basel Index) of Banco do Nordeste was 17.23% (13.78% as at June 30, 2010), while PR was R$ 4,515,788 (R$ 3,067,846 as at June 30, 2010). The Required Regulatory Capital (PRE), which represents the consolidation of all risk exposures, with a capital allocation ratio of 11%, was R$ 2,833,292 as at June 30, 2011 (R$ 2,432,575 as at June 30, 2010).
The Bank’s regulatory capital is as follows:
i. Matching of PR with PRE Specification 06/30/2011 06/30/2010
a) Regulatory Capital (PR) 4,515,788 3,067,846
Tier I 2,277,169 2,019,760
Tier II 2,238,619 1,048,086
b) Required Regulatory Capital (PRE) 2,833,292 2,432,575
. PEPR (1) 2,433,749 2,089,197
. PJUR 537 1,195
. PCOM 395 19,855
. POPR 398,611 322,328
c) RBAN amount 49,994 16,927
Margin (a-b-c) 1,632,502 618,344
Basel Ratio (BACEN Circular 3477, of 12/28/2009) 17.53% 13.87%
Basel Ratio (including RBAN amount) 17.23% 13.78%
11% of Weighted Risk Factor Exposures, pursuant to Articles 11 to 16 of BACEN Circular 3360, of September 12, 2007.
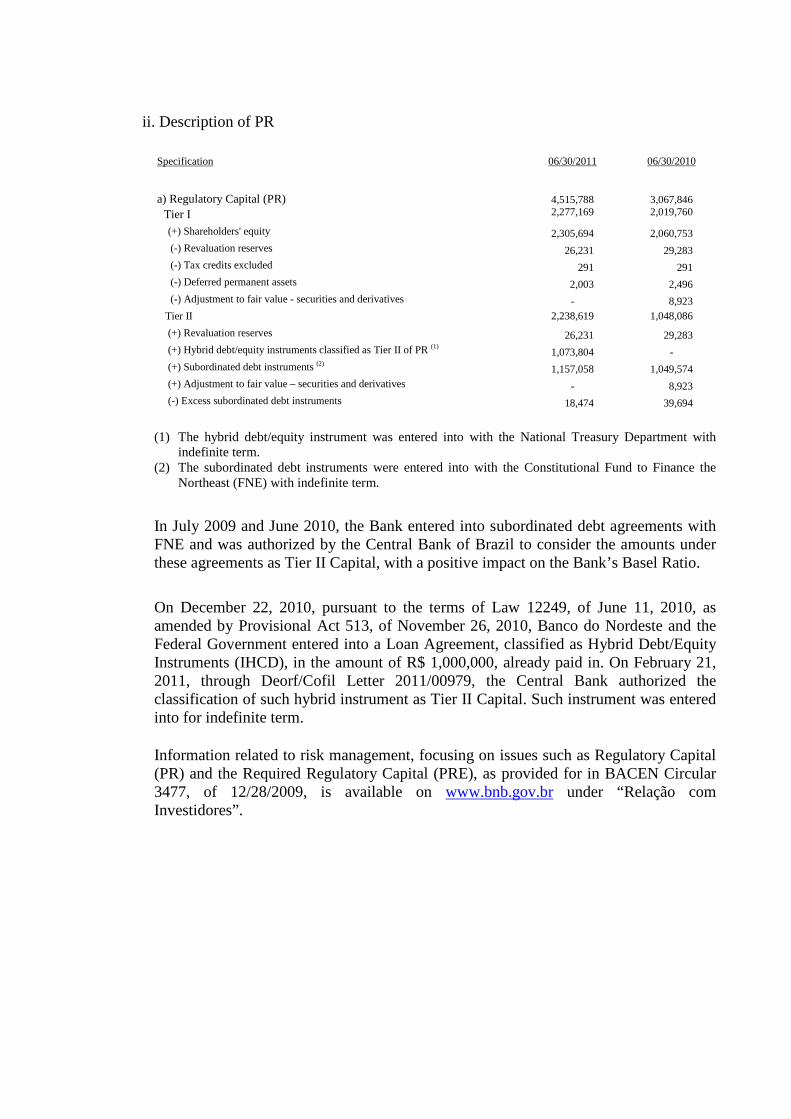
ii. Description of PR
(1) The hybrid debt/equity instrument was entered into with the National Treasury Department with
indefinite term. (2) The subordinated debt instruments were entered into with the Constitutional Fund to Finance the
Northeast (FNE) with indefinite term.
In July 2009 and June 2010, the Bank entered into subordinated debt agreements with FNE and was authorized by the Central Bank of Brazil to consider the amounts under these agreements as Tier II Capital, with a positive impact on the Bank’s Basel Ratio.
On December 22, 2010, pursuant to the terms of Law 12249, of June 11, 2010, as amended by Provisional Act 513, of November 26, 2010, Banco do Nordeste and the Federal Government entered into a Loan Agreement, classified as Hybrid Debt/Equity Instruments (IHCD), in the amount of R$ 1,000,000, already paid in. On February 21, 2011, through Deorf/Cofil Letter 2011/00979, the Central Bank authorized the classification of such hybrid instrument as Tier II Capital. Such instrument was entered into for indefinite term.
Information related to risk management, focusing on issues such as Regulatory Capital (PR) and the Required Regulatory Capital (PRE), as provided for in BACEN Circular 3477, of 12/28/2009, is available on www.bnb.gov.br under “Relação com Investidores”.
Specification 06/30/2011 06/30/2010
a) Regulatory Capital (PR) 4,515,788 3,067,846
Tier I 2,277,169 2,019,760
(+) Shareholders' equity 2,305,694 2,060,753 (-) Revaluation reserves 26,231 29,283 (-) Tax credits excluded 291 291 (-) Deferred permanent assets 2,003 2,496 (-) Adjustment to fair value - securities and derivatives - 8,923 Tier II 2,238,619 1,048,086
(+) Revaluation reserves 26,231 29,283 (+) Hybrid debt/equity instruments classified as Tier II of PR (1) 1,073,804 - (+) Subordinated debt instruments (2) 1,157,058 1,049,574 (+) Adjustment to fair value – securities and derivatives - 8,923 (-) Excess subordinated debt instruments 18,474 39,694
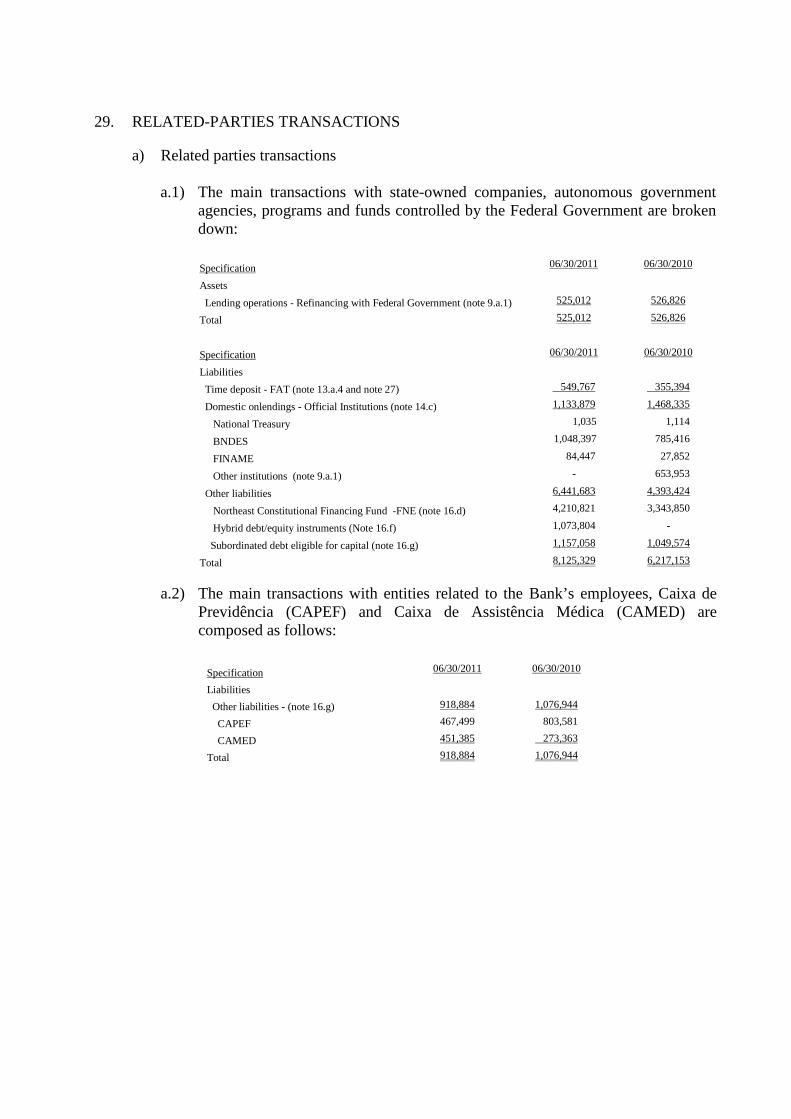
29. RELATED-PARTIES TRANSACTIONS
a) Related parties transactions
a.1) The main transactions with state-owned companies, autonomous government agencies, programs and funds controlled by the Federal Government are broken down:
Specification 06/30/2011 06/30/2010
Assets
Lending operations - Refinancing with Federal Government (note 9.a.1) 525,012 526,826
Total 525,012 526,826
Specification 06/30/2011 06/30/2010
Liabilities
Time deposit - FAT (note 13.a.4 and note 27) 549,767 355,394
Domestic onlendings - Official Institutions (note 14.c) 1,133,879 1,468,335
National Treasury 1,035 1,114
BNDES 1,048,397 785,416
FINAME 84,447 27,852
Other institutions (note 9.a.1) - 653,953
Other liabilities 6,441,683 4,393,424
Northeast Constitutional Financing Fund -FNE (note 16.d) 4,210,821 3,343,850
Hybrid debt/equity instruments (Note 16.f) 1,073,804 -
Subordinated debt eligible for capital (note 16.g) 1,157,058 1,049,574
Total 8,125,329 6,217,153
a.2) The main transactions with entities related to the Bank’s employees, Caixa de
Previdência (CAPEF) and Caixa de Assistência Médica (CAMED) are composed as follows:
Specification 06/30/2011 06/30/2010
Liabilities
Other liabilities - (note 16.g) 918,884 1,076,944
CAPEF 467,499 803,581
CAMED 451,385 273,363
Total 918,884 1,076,944
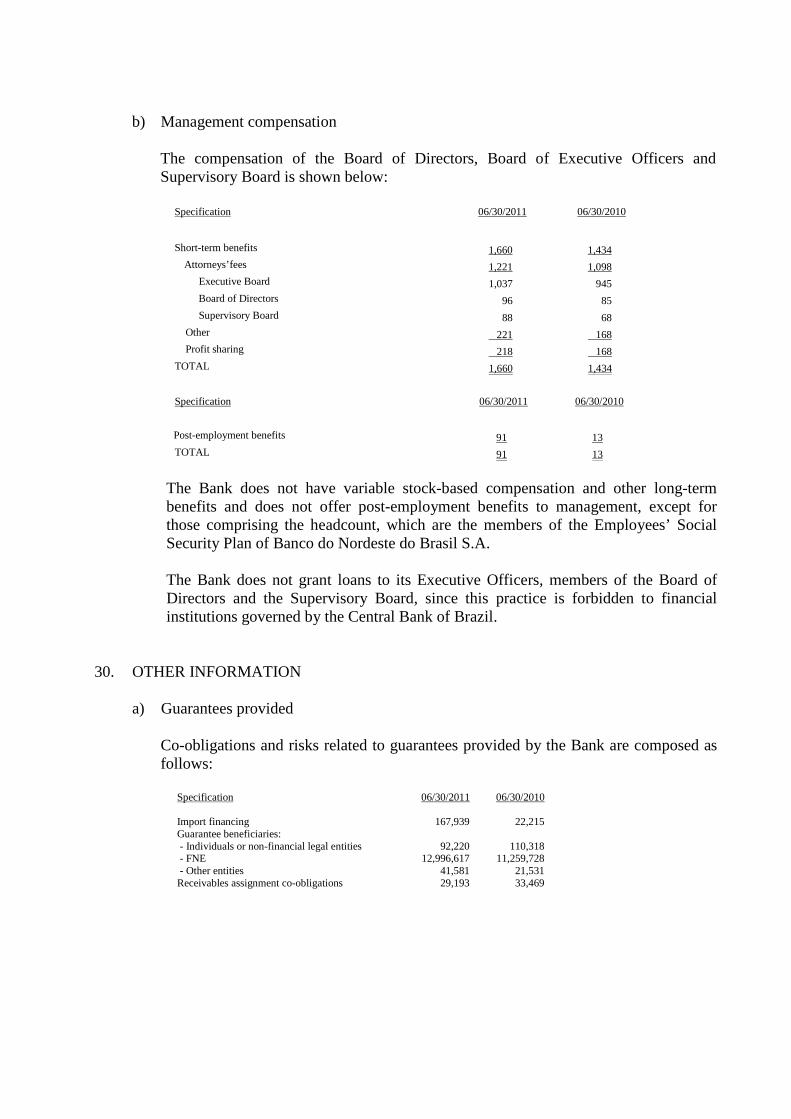
b) Management compensation The compensation of the Board of Directors, Board of Executive Officers and Supervisory Board is shown below:
Specification 06/30/2011 06/30/2010
Short-term benefits 1,660 1,434
Attorneys’fees 1,221 1,098 Executive Board 1,037 945 Board of Directors 96 85 Supervisory Board 88 68 Other 221 168 Profit sharing 218 168 TOTAL 1,660 1,434
Specification 06/30/2011 06/30/2010
Post-employment benefits 91 13 TOTAL 91 13
The Bank does not have variable stock-based compensation and other long-term benefits and does not offer post-employment benefits to management, except for those comprising the headcount, which are the members of the Employees’ Social Security Plan of Banco do Nordeste do Brasil S.A. The Bank does not grant loans to its Executive Officers, members of the Board of Directors and the Supervisory Board, since this practice is forbidden to financial institutions governed by the Central Bank of Brazil.
30. OTHER INFORMATION
a) Guarantees provided
Co-obligations and risks related to guarantees provided by the Bank are composed as follows:
Specification 06/30/2011 06/30/2010 Import financing 167,939 22,215 Guarantee beneficiaries: - Individuals or non-financial legal entities 92,220 110,318 - FNE 12,996,617 11,259,728 - Other entities 41,581 21,531 Receivables assignment co-obligations 29,193 33,469
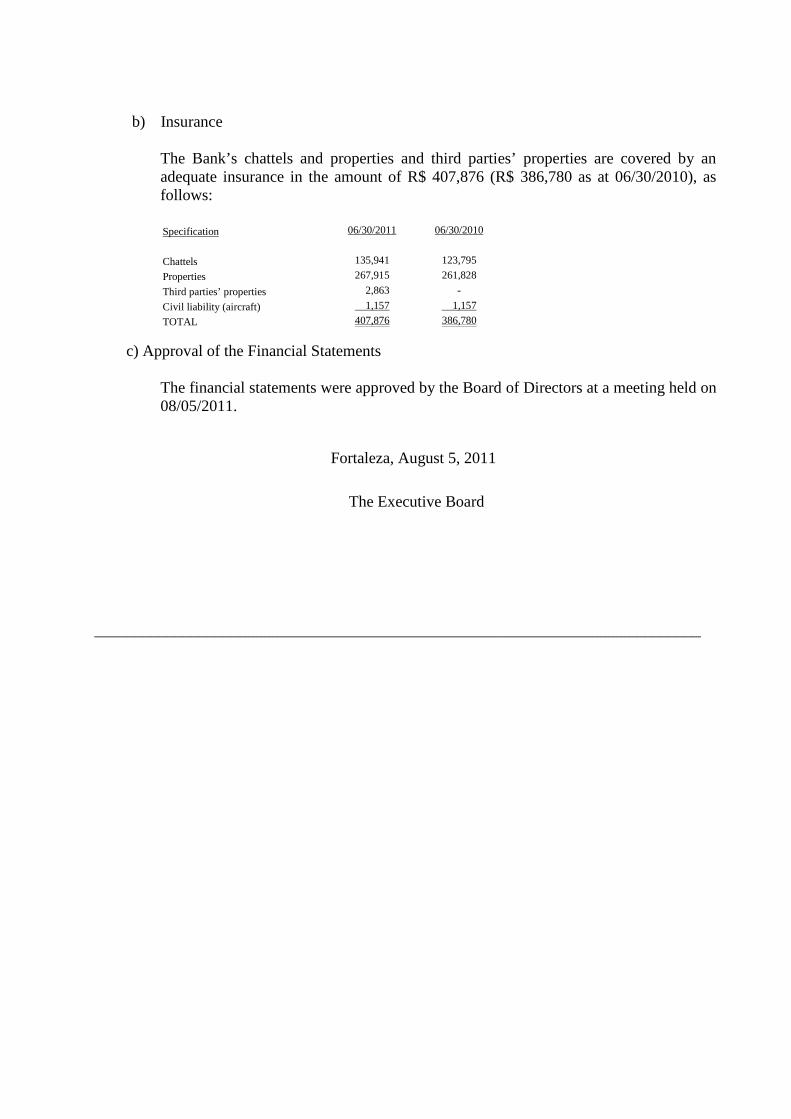
b) Insurance The Bank’s chattels and properties and third parties’ properties are covered by an
adequate insurance in the amount of R$ 407,876 (R$ 386,780 as at 06/30/2010), as follows:
Specification 06/30/2011 06/30/2010
Chattels 135,941 123,795
Properties 267,915 261,828
Third parties’ properties 2,863 -
Civil liability (aircraft) 1,157 1,157
TOTAL 407,876 386,780
c) Approval of the Financial Statements
The financial statements were approved by the Board of Directors at a meeting held on 08/05/2011.
Fortaleza, August 5, 2011
The Executive Board
____________________________________________________________________________
INDEPENDENT AUDITORS’ REPORT ON THE FINANCIAL STATEMENTS To the Board of Directors, Shareholders and Management of Banco do Nordeste do Brasil S.A. Fortaleza, CE We have audited the financial statements of Banco do Nordeste do Brasil S.A. (the “Bank”), which comprise the balance sheet as at June 30, 2011 and the related statements of income, changes in shareholders’ equity, and cash flows for the six-month period then ended, as well as a summary of significant accounting practices and other explanatory notes.
Management’s responsibility for the financial statements The Bank’s management is responsible for the preparation and fair presentation of these financial statements in accordance with the Brazilian accounting practices applicable to entities authorized to operate by the Central Bank of Brazil (BACEN) as well as the internal controls deemed necessary for preparing financial statements that are free from material misstatement, whether due to fraud or error. Independent auditors’ responsibility Our responsibility is to express an opinion on these financial statements based on our audit, which was conducted in accordance with Brazilian and International Standards on Auditing. Those standards require that we comply with ethical requirements and plan and perform the audit to obtain reasonable assurance about whether the financial statements are free from material misstatement.
An audit involves performing selected procedures to obtain audit evidence about the amounts and disclosures in the financial statements. The procedures selected depend on the auditor’s judgment, including the assessment of the risks of material misstatements of the financial statements, whether due to fraud or error. In making those risk assessments, the auditor considers internal control relevant to the preparation and fair presentation of the Bank’s financial statements in order to design audit procedures that are appropriate in the circumstances, but not for the purpose of expressing an opinion on the effectiveness of the Bank’s internal control. An audit also includes evaluating the appropriateness of accounting practices used and the reasonableness of accounting estimates made by Management, as well as evaluating the overall presentation of the financial statements taken as a whole. We believe that the audit evidence we have obtained is sufficient and appropriate to provide a basis for our audit opinion.
Opinion In our opinion, the financial statements referred to in paragraph 1 present fairly, in all material respects, the financial position of Banco do Nordeste do Brasil S.A. as at June 30, 2011, its financial performance and its cash flows for the six-month period then ended, in conformity with Brazilian accounting practices applicable to entities authorized to operate by the Central Bank of Brazil (BACEN). Other matters Statement of value added We have also audited the statement of value added (“DVA”) for the six-month period ended June 30, 2011, whose presentation is required for publicly-held companies by the Brazilian corporate law. Such information has been subjected to the auditing procedures above mentioned and, in our opinion, is fairly stated, in all material respects, in relation to the financial statements taken as a whole. The accompanying financial statements have been translated into English for the convenience of readers outside Brazil.
Fortaleza, August 5, 2011 DELOITTE TOUCHE TOHMATSU Claudio Lino Lippi Auditores Independentes Engagement Partner
SUPERVISORY BOARD’S REPORT In the discharge of its legal and corporate statutory duties and after having examined the Management Report, the Balance Sheet, the Statements of Income, Changes in Shareholders’ Equity, Cash Flows, and Valued Added of Banco do Nordeste do Brasil S.A. for the six-month period ended June 30, 2011, and based on the opinion of the Independent Auditor - Deloitte Touche Tohmatsu - dated August 5, 2011, the Supervisory Board of Banco do Nordeste do Brasil S.A. is of the opinion that the Management Report and Financial Statements present fairly the activities developed, the financial position, and results of operations of Banco do Nordeste do Brasil S.A. in the first half of 2011.
Fortaleza (CE), August 5, 2011
SUPERVISORY BOARD
SUMMARY OF THE AUDIT COMMITTEE REPORT
First half of 2011
The Audit Committee of Banco do Nordeste do Brasil S.A., created as set forth in National Monetary Council (CMN) Resolution 3198/2004, is an advisory body to the Board of Directors, whose duties and responsibilities are set out in the Bank’s Bylaws. Committee Activities Consistent with its institutional mission, in the first half of 2011, the Audit Committee focused on monitoring and assessing the activities carried out by the Internal Audit, Independent Auditor, Internal Controls, Security and Risk Management and on reviewing and assessing the quality of the financial statements and the performance of the Bank’s ombudsman. As part of the advisory duties of the Board of Directors, the Audit Committee has also monitored compliance with requirements of supervisory and external control agencies, including those originating from the Board of Directors itself. In the six-month period, the Audit Committee held 16 meetings, 12 of which ordinary and 4 extraordinary, to discuss matters related to the areas above. In addition to these events, the Audit Committee contacted and held meetings with several Bank officers and the Supervisory Board, and also attended 9 Board of Directors' meetings. During this period, the Audit Committee conducted analyses of the reports and information made available on a monthly basis by the finance area. At the end of the six-month period, it also reviewed, together with representatives of the accounting area, the independent auditor and Supervisory Board, the financial statements for the six-month period ended June 30, 2011, taken as a whole. Together with the members of the Supervisory Board and the independent auditor, it attended the Board of Directors’ meeting which approved said financial statements. The main achievements in the six-month period include the following activities:
The implementation of the credit, operating and market risk management structure, based on the timetables established by the Central Bank of Brazil, in compliance with the Basel II Capital Accord;
Requests and recommendations made by the Bank’s Board of Directors to the Board of Executive Officers.
The implementation of the recommendations of the internal audit, independent auditor and external control agencies;
Internal Control The Bank has been structuring its internal control system to achieve the integration of guidelines focused on strengthening internal control, security, and risk management. This structure is periodically reviewed and updated to ensure it is capable of mitigating the risks inherent to the Bank’s activities. In this respect, the Bank has been undertaking actions to complete the implementation of structures to manage operational, credit, and market risks. The purpose is to implement the recommendations made in the Basel II Capital Accord and meet the schedule set out in Central Bank regulations. The completion of the aforementioned actions will enhance the mitigation of the risks to which the Bank is exposed in the normal course of operations, with a positive impact on the achievement of its business and corporate goals. Internal Audit The Internal Audit function has been developing its activities at a satisfactory level of quality, taking into consideration the need to conform to the size and complexity of the Bank’s operations. During the period under review, its activities were guided by the Annual Internal Audit Plan, which is prepared pursuant to instructions from federal supervisory bodies and submitted to the Federal Controller General after being approved by the Bank´s Board of Directors. Independent Auditor In examining the opinions and reports issued by DELOITTE TOUCHE TOHMATSU AUDITORES INDEPENDENTES during the six-month period, no material facts have been identified that could compromise its independence, the results and the quality of its work. Financial Statements The Audit Committee analyzed the Financial Statements, Notes to the Financial Statements, Financial Reports, and the Management Report dated June 30, 2011. It also analyzed the opinion issued by the Independent Auditor of Banco do Nordeste do Brasil S.A. and of Fundo Constitucional de Financiamento do Nordeste - FNE. After examining and discussing the practices used to prepare the financial statements, it was established that these are consistent with applicable corporate laws, and regulations of the National Monetary Council, the Central Bank of Brazil, and the Brazilian Securities and Exchange Commission.
Fortaleza (CE), August 5, 2011
Audit Committee
CONSTITUTIONAL FUND OF FINANCE OF THE NORTHEAST - FNE Managed by Banco do Nordeste do Brasil S.A.
Financial Statements
F N E
POSITION: 06.30.2011
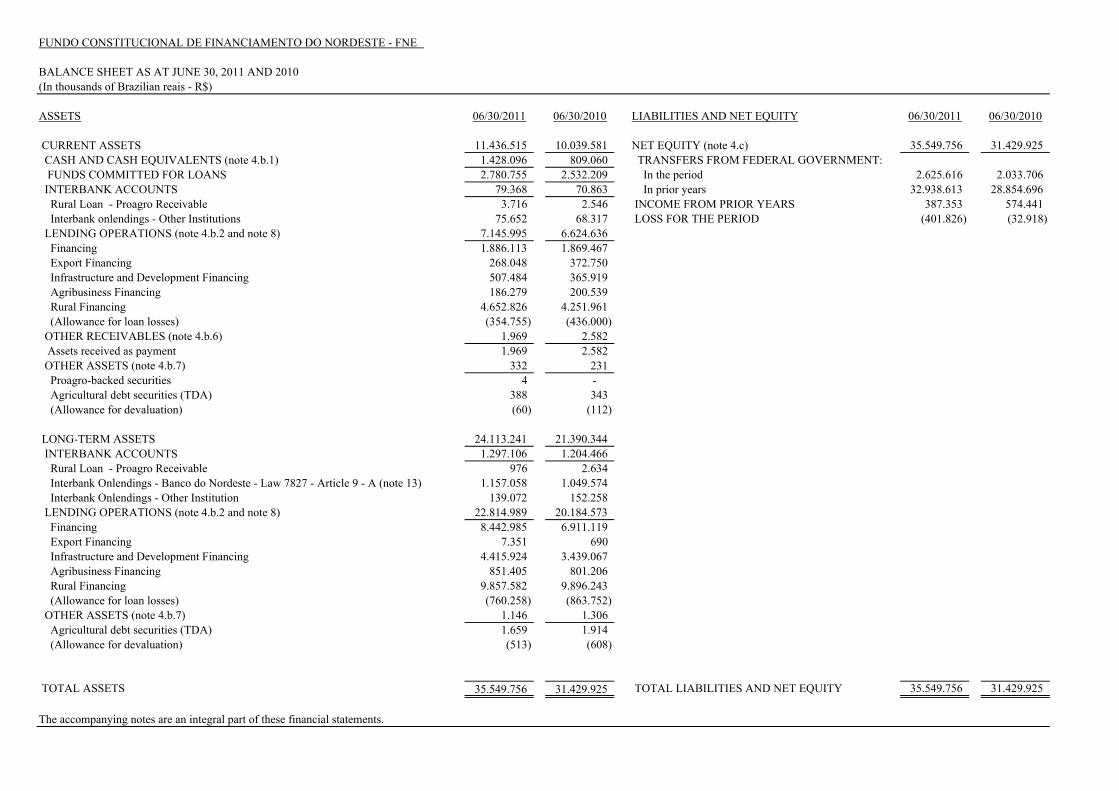
FUNDO CONSTITUCIONAL DE FINANCIAMENTO DO NORDESTE - FNE
BALANCE SHEET AS AT JUNE 30, 2011 AND 2010
ASSETS 06/30/2011 06/30/2010 LIABILITIES AND NET EQUITY 06/30/2011 06/30/2010
CURRENT ASSETS 11.436.515 10.039.581 NET EQUITY (note 4.c) 35.549.756 31.429.925 CASH AND CASH EQUIVALENTS (note 4.b.1) 1.428.096 809.060 TRANSFERS FROM FEDERAL GOVERNMENT: FUNDS COMMITTED FOR LOANS 2.780.755 2.532.209 In the period 2.625.616 2.033.706 INTERBANK ACCOUNTS 79.368 70.863 In prior years 32.938.613 28.854.696 Rural Loan - Proagro Receivable 3.716 2.546 INCOME FROM PRIOR YEARS 387.353 574.441 Interbank onlendings - Other Institutions 75.652 68.317 LOSS FOR THE PERIOD (401.826) (32.918) LENDING OPERATIONS (note 4.b.2 and note 8) 7.145.995 6.624.636 Financing 1.886.113 1.869.467 Export Financing 268.048 372.750 Infrastructure and Development Financing 507.484 365.919 Agribusiness Financing 186.279 200.539 Rural Financing 4.652.826 4.251.961 (Allowance for loan losses) (354.755) (436.000) OTHER RECEIVABLES (note 4.b.6) 1.969 2.582 Assets received as payment 1.969 2.582 OTHER ASSETS (note 4.b.7) 332 231 Proagro-backed securities 4 - Agricultural debt securities (TDA) 388 343 (Allowance for devaluation) (60) (112)
LONG-TERM ASSETS 24.113.241 21.390.344 INTERBANK ACCOUNTS 1.297.106 1.204.466 Rural Loan - Proagro Receivable 976 2.634 Interbank Onlendings - Banco do Nordeste - Law 7827 - Article 9 - A (note 13) 1.157.058 1.049.574 Interbank Onlendings - Other Institution 139.072 152.258 LENDING OPERATIONS (note 4.b.2 and note 8) 22.814.989 20.184.573 Financing 8.442.985 6.911.119 Export Financing 7.351 690 Infrastructure and Development Financing 4.415.924 3.439.067 Agribusiness Financing 851.405 801.206 Rural Financing 9.857.582 9.896.243 (Allowance for loan losses) (760.258) (863.752) OTHER ASSETS (note 4.b.7) 1.146 1.306 Agricultural debt securities (TDA) 1.659 1.914 (Allowance for devaluation) (513) (608)
TOTAL ASSETS 35.549.756 31.429.925 TOTAL LIABILITIES AND NET EQUITY 35.549.756 31.429.925
The accompanying notes are an integral part of these financial statements.
(In thousands of Brazilian reais - R$)
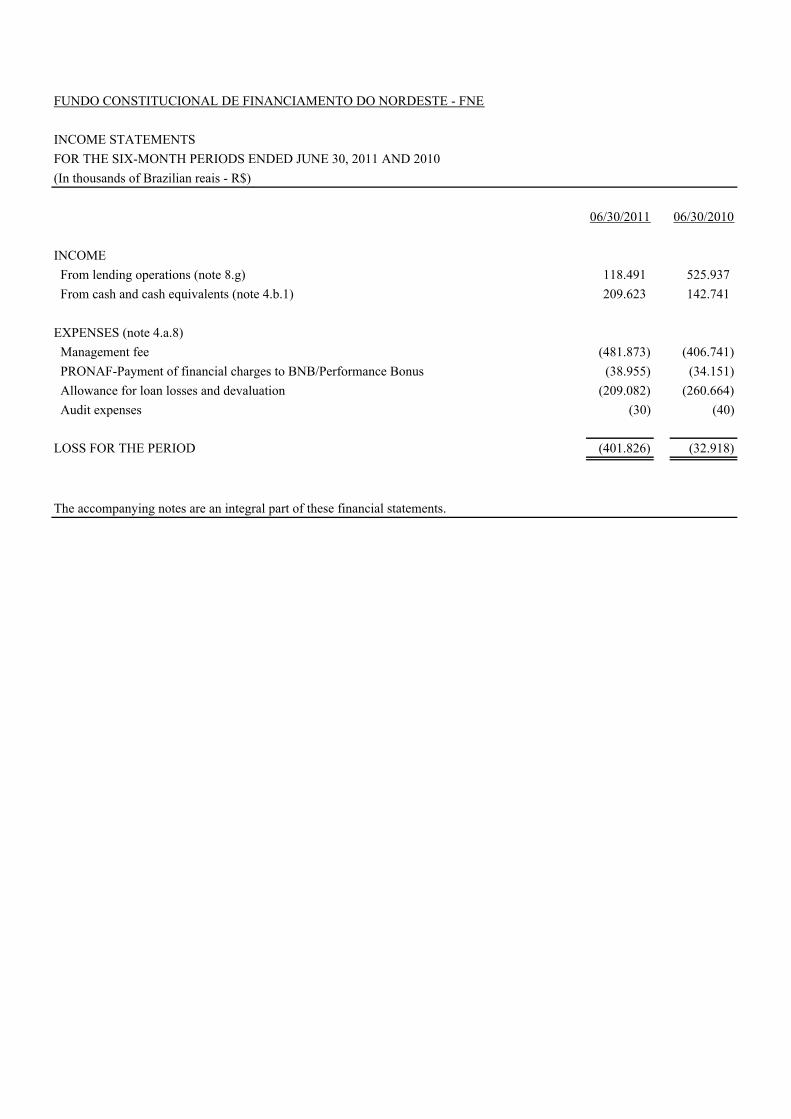
FUNDO CONSTITUCIONAL DE FINANCIAMENTO DO NORDESTE - FNE
INCOME STATEMENTSFOR THE SIX-MONTH PERIODS ENDED JUNE 30, 2011 AND 2010(In thousands of Brazilian reais - R$)
06/30/2011 06/30/2010
INCOME From lending operations (note 8.g) 118.491 525.937 From cash and cash equivalents (note 4.b.1) 209.623 142.741
EXPENSES (note 4.a.8) Management fee (481.873) (406.741) PRONAF-Payment of financial charges to BNB/Performance Bonus (38.955) (34.151) Allowance for loan losses and devaluation (209.082) (260.664) Audit expenses (30) (40)
LOSS FOR THE PERIOD (401.826) (32.918)
The accompanying notes are an integral part of these financial statements.
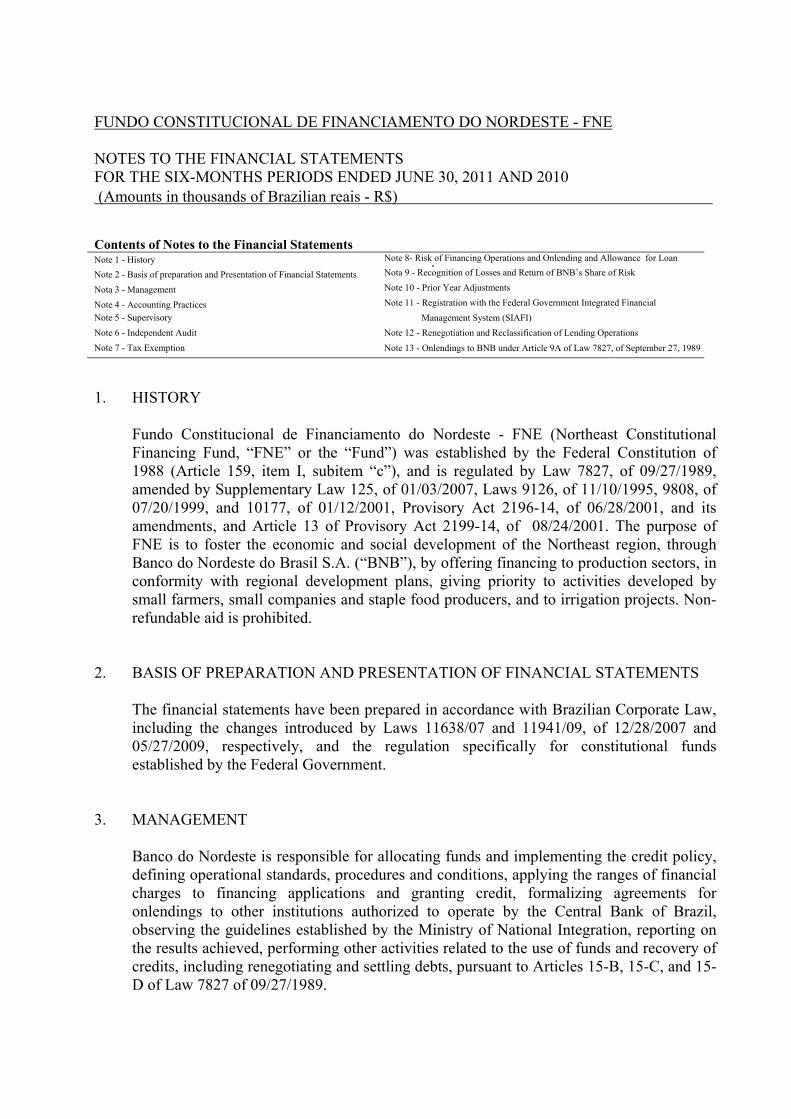
FUNDO CONSTITUCIONAL DE FINANCIAMENTO DO NORDESTE - FNE NOTES TO THE FINANCIAL STATEMENTS FOR THE SIX-MONTHS PERIODS ENDED JUNE 30, 2011 AND 2010 (Amounts in thousands of Brazilian reais - R$)
Contents of Notes to the Financial Statements Note 1 - History Note 8- Risk of Financing Operations and Onlending and Allowance for Loan
LNote 2 - Basis of preparation and Presentation of Financial Statements Nota 9 - Recognition of Losses and Return of BNB’s Share of Risk
Nota 3 - Management Note 10 - Prior Year Adjustments
Note 4 - Accounting Practices Note 11 - Registration with the Federal Government Integrated Financial Note 5 - Supervisory Management System (SIAFI) Note 6 - Independent Audit Note 12 - Renegotiation and Reclassification of Lending Operations Note 7 - Tax Exemption Note 13 - Onlendings to BNB under Article 9A of Law 7827, of September 27, 1989
1. HISTORY
Fundo Constitucional de Financiamento do Nordeste - FNE (Northeast Constitutional Financing Fund, “FNE” or the “Fund”) was established by the Federal Constitution of 1988 (Article 159, item I, subitem “c”), and is regulated by Law 7827, of 09/27/1989, amended by Supplementary Law 125, of 01/03/2007, Laws 9126, of 11/10/1995, 9808, of 07/20/1999, and 10177, of 01/12/2001, Provisory Act 2196-14, of 06/28/2001, and its amendments, and Article 13 of Provisory Act 2199-14, of 08/24/2001. The purpose of FNE is to foster the economic and social development of the Northeast region, through Banco do Nordeste do Brasil S.A. (“BNB”), by offering financing to production sectors, in conformity with regional development plans, giving priority to activities developed by small farmers, small companies and staple food producers, and to irrigation projects. Non-refundable aid is prohibited.
2. BASIS OF PREPARATION AND PRESENTATION OF FINANCIAL STATEMENTS
The financial statements have been prepared in accordance with Brazilian Corporate Law, including the changes introduced by Laws 11638/07 and 11941/09, of 12/28/2007 and 05/27/2009, respectively, and the regulation specifically for constitutional funds established by the Federal Government.
3. MANAGEMENT
Banco do Nordeste is responsible for allocating funds and implementing the credit policy, defining operational standards, procedures and conditions, applying the ranges of financial charges to financing applications and granting credit, formalizing agreements for onlendings to other institutions authorized to operate by the Central Bank of Brazil, observing the guidelines established by the Ministry of National Integration, reporting on the results achieved, performing other activities related to the use of funds and recovery of credits, including renegotiating and settling debts, pursuant to Articles 15-B, 15-C, and 15-D of Law 7827 of 09/27/1989.
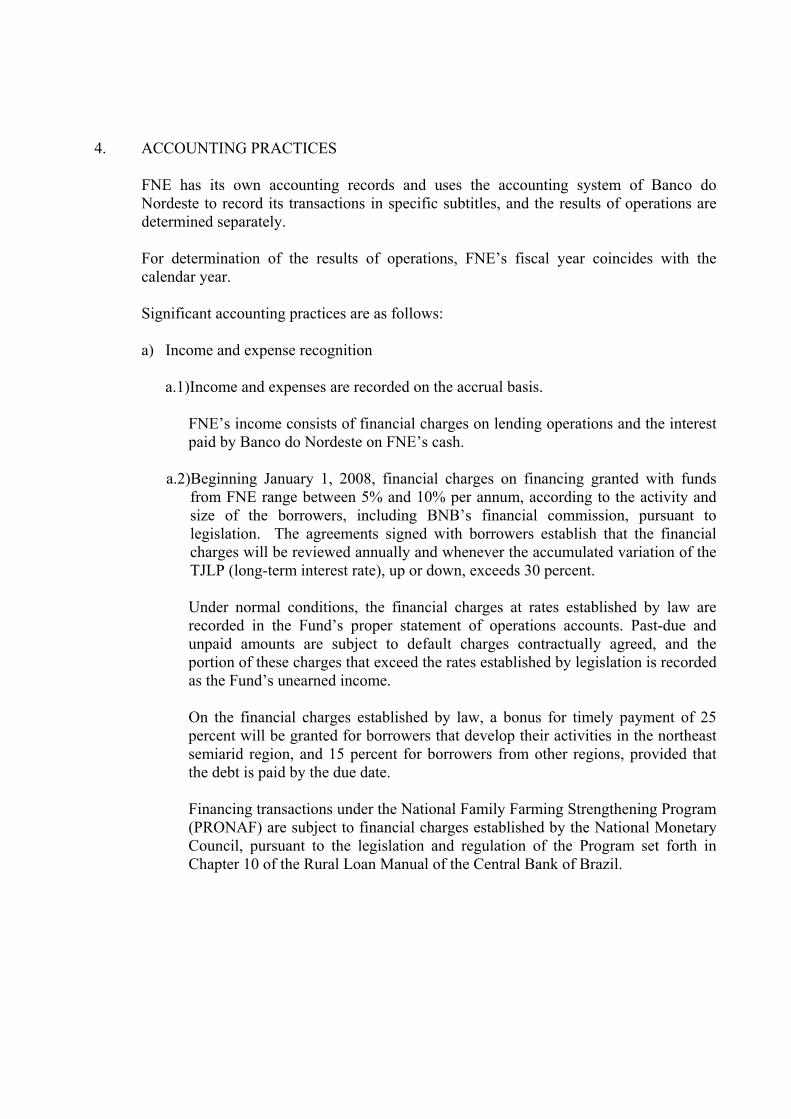
4. ACCOUNTING PRACTICES
FNE has its own accounting records and uses the accounting system of Banco do Nordeste to record its transactions in specific subtitles, and the results of operations are determined separately.
For determination of the results of operations, FNE’s fiscal year coincides with the calendar year.
Significant accounting practices are as follows:
a) Income and expense recognition
a.1)Income and expenses are recorded on the accrual basis.
FNE’s income consists of financial charges on lending operations and the interest paid by Banco do Nordeste on FNE’s cash.
a.2)Beginning January 1, 2008, financial charges on financing granted with funds
from FNE range between 5% and 10% per annum, according to the activity and size of the borrowers, including BNB’s financial commission, pursuant to legislation. The agreements signed with borrowers establish that the financial charges will be reviewed annually and whenever the accumulated variation of the TJLP (long-term interest rate), up or down, exceeds 30 percent.
Under normal conditions, the financial charges at rates established by law are recorded in the Fund’s proper statement of operations accounts. Past-due and unpaid amounts are subject to default charges contractually agreed, and the portion of these charges that exceed the rates established by legislation is recorded as the Fund’s unearned income.
On the financial charges established by law, a bonus for timely payment of 25 percent will be granted for borrowers that develop their activities in the northeast semiarid region, and 15 percent for borrowers from other regions, provided that the debt is paid by the due date.
Financing transactions under the National Family Farming Strengthening Program (PRONAF) are subject to financial charges established by the National Monetary Council, pursuant to the legislation and regulation of the Program set forth in Chapter 10 of the Rural Loan Manual of the Central Bank of Brazil.
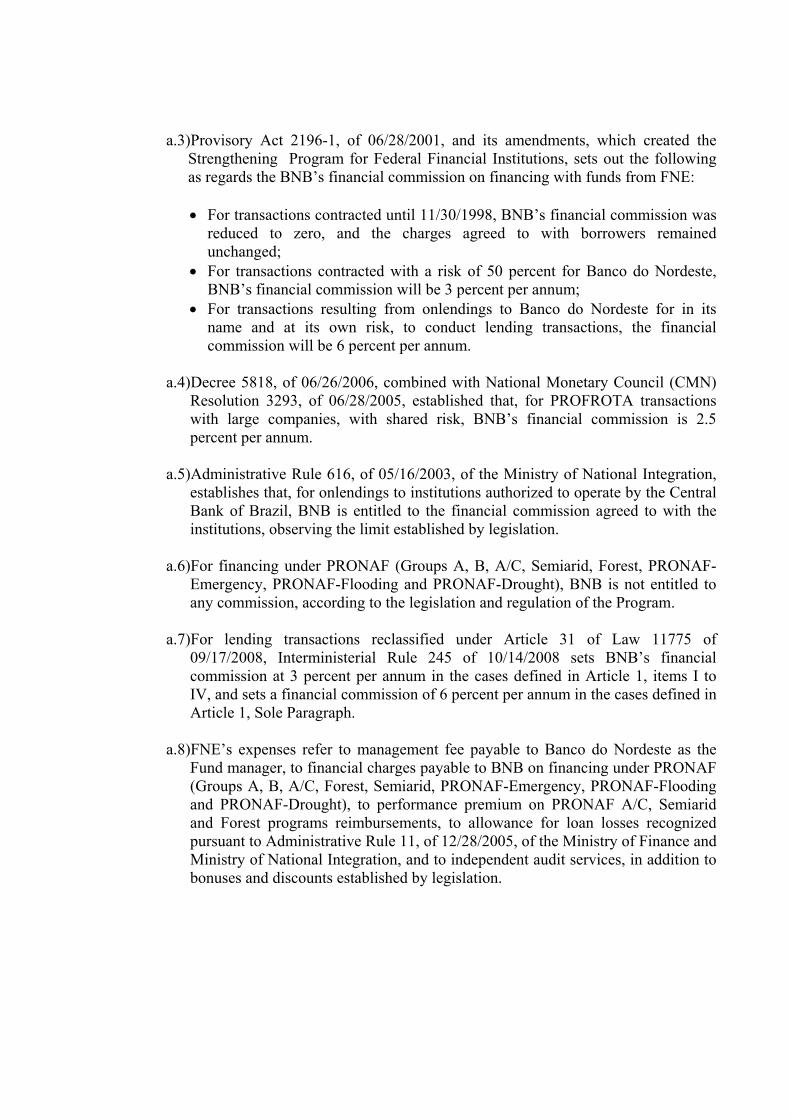
a.3)Provisory Act 2196-1, of 06/28/2001, and its amendments, which created the
Strengthening Program for Federal Financial Institutions, sets out the following as regards the BNB’s financial commission on financing with funds from FNE:
• For transactions contracted until 11/30/1998, BNB’s financial commission was
reduced to zero, and the charges agreed to with borrowers remained unchanged;
• For transactions contracted with a risk of 50 percent for Banco do Nordeste, BNB’s financial commission will be 3 percent per annum;
• For transactions resulting from onlendings to Banco do Nordeste for in its name and at its own risk, to conduct lending transactions, the financial commission will be 6 percent per annum.
a.4)Decree 5818, of 06/26/2006, combined with National Monetary Council (CMN) Resolution 3293, of 06/28/2005, established that, for PROFROTA transactions with large companies, with shared risk, BNB’s financial commission is 2.5 percent per annum.
a.5)Administrative Rule 616, of 05/16/2003, of the Ministry of National Integration,
establishes that, for onlendings to institutions authorized to operate by the Central Bank of Brazil, BNB is entitled to the financial commission agreed to with the institutions, observing the limit established by legislation.
a.6)For financing under PRONAF (Groups A, B, A/C, Semiarid, Forest, PRONAF-
Emergency, PRONAF-Flooding and PRONAF-Drought), BNB is not entitled to any commission, according to the legislation and regulation of the Program.
a.7)For lending transactions reclassified under Article 31 of Law 11775 of
09/17/2008, Interministerial Rule 245 of 10/14/2008 sets BNB’s financial commission at 3 percent per annum in the cases defined in Article 1, items I to IV, and sets a financial commission of 6 percent per annum in the cases defined in Article 1, Sole Paragraph.
a.8)FNE’s expenses refer to management fee payable to Banco do Nordeste as the
Fund manager, to financial charges payable to BNB on financing under PRONAF (Groups A, B, A/C, Forest, Semiarid, PRONAF-Emergency, PRONAF-Flooding and PRONAF-Drought), to performance premium on PRONAF A/C, Semiarid and Forest programs reimbursements, to allowance for loan losses recognized pursuant to Administrative Rule 11, of 12/28/2005, of the Ministry of Finance and Ministry of National Integration, and to independent audit services, in addition to bonuses and discounts established by legislation.
The management fee of 3 percent per annum, paid to Banco do Nordeste by FNE, is recorded on a monthly basis of 0,25% on the Fund’s net equity, less onlendings to BNB, onlendings to other institutions under Administrative Rule 616 of 05/26/2003 of the Ministry of National Integration, and application balances on PRONAF - Groups B, A/C, Forest, Semiarid and Emergency, limited each year to 20 percent of the transfers made by the National Treasury, pursuant to Decree 5641, of 12/26/2005.
The financial charges paid to BNB on transactions under PRONAF - Groups A, B, A/C, Forest, Semiarid, PRONAF - Emergency, PRONAF-Flooding and PRONAF-Drought and the performance premium on PRONAF A/C, Semiarid and Forest reimbursements, established by the National Monetary Council, follow the percentages and criteria established by the legislation and regulation of the Program.
b) Current and long-term assets
Stated at realizable value, plus income and monetary adjustments earned. b.1) Cash and cash equivalents consist of cash assets, which represent funds available
for use in lending operations, and Funds Committed for Loans, which represent restricted cash in connection with yet-unpaid installments of contracted operations corresponding to the amounts outstanding by the balance sheet date, plus the payments expected during the 90 subsequent days and any mismatches between the amounts to be released after such 90 days and the estimated inflow to the Fund during such period. The Fund’s cash held by Banco do Nordeste are paid based on extra-market rate, released by the Central Bank of Brazil.
b.2)Total Lending Operations are stated at the amount of principal plus financial
charges, less unearned income and allowance for loan losses (note 8).
b.3) Law 11322, of 07/13/2006, provides for the renegotiation of debts arising from rural credit transactions contracted in the area under the jurisdiction of the Superintendency for the Development of the Northeast (SUDENE), and grants decrease on debit balance, bonuses for timely payment, decreased interest rates and extension of payment periods.
b.4)Law 11775 of 09/17/2008, provides for the settlement, regularization,
renegotiation or reclassification of debts arising from lending operations classified, among others, under Laws 9138 of 11/29/1995, 10437 of 04/25/2002 and 11322 of 07/13/2006, Provisory Act 2196-3 of 08/24/2001, CMN Resolution 2471 of 02/26/1998, National Family Farming Strengthening Program (PRONAF), Japanese and Brazilian Cooperation Program for the Development of the Cerrado Region (PRODECER) - Stage III, and contracted with FAT funds by financial agents, and grants discounts on debt balances and bonuses for timely payment, waivers, and maintenance or rescheduling of payment periods.
b.5) Law 12249, of 06/11/2010, provides for, in Articles 69 and 70, the reissuance of agricultural debts renegotiated based on Article 2 of Law 11322, of 07/13/2006, or classified under said Article, as well as the granting of discounts for settlement of unreleased agricultural debts renegotiated based on Article 2 of Law 11322, backed by FNE funds or FNE funds along with other sources of funds. Articles 71 and 72 of said Law provides for the reissuance of debts relating to agricultural activities with producers classified under Group B of PRONAF, as well as the granting of discounts for unreleased debts, backed by FNE funds.
b.6)The caption “Other receivables” includes FNE’s rights on chattels and properties
received by BNB as payment of debts. After assets are sold, the sale proceeds are apportioned between the Fund and BNB, proportionally to the risk assumed, pursuant to Article 7 of Administrative Rule 11, of 12/28/2005.
b.7)Securities recorded under line account “Other Assets” are stated at their face
value, plus expected yield on each security, including, when applicable, the effects of adjustments of assets to market or realizable values.
c) Net Equity
The net equity of FNE is originated as follows:
• Transfers from the Federal Government in the proportion of 1.8 percent of the
collection of taxes on income of any nature (IR) and industrialized products tax (IPI);
• Returns and results of transactions; • Interest paid by Banco do Nordeste on FNE’s temporarily not invested cash.
5. SUPERVISORY
Banco do Nordeste keeps at the disposal of the supervisory agencies the Fund’s statements of changes in financial position and income as of the end of the month. Pursuant to the legislation, the balance sheets of FNE, duly audited, are published semiannually and submitted to the National Congress for inspection and control.
6. INDEPENDENT AUDIT
FNE contracts an independent auditor at its own cost to certify that constitutional and legal requirements have been met, to issue an opinion on its financial statements, audit the accounts and perform other usual auditing procedures.
7. TAX EXEMPTION
FNE is tax-exempt and its earnings, income and financing operations are not subject to any tax or other charges, pursuant to Law 7827, of 09/27/1989, and subsequent amendments.
8. RISK OF FINANCING OPERATIONS AND ONLENDING AND ALLOWANCE FOR LOAN LOSSES
a) Pursuant to the legislation that regulates Constitutional Financing Funds, National
Family Farming Strengthening Program (PRONAF) and Special Credit Program for Agrarian Reform (PROCERA/Programa da Terra), the risk of transactions with FNE’s funds is as follows:
a.1) Transactions contracted until 11/30/1998:
• In transactions related to Programa da Terra, the risk lies totally with PROCERA;
• In other transactions, the risk is assumed by FNE.
a.2) Transactions contracted beginning 12/01/1998:
• In financing under Programa da Terra, the risk lies with PROCERA; • In transactions under PRONAF (Groups A, B, A/C, Forest, Semiarid and
Emergency/Flood/Drought), the risk lies totally with FNE; • In onlendings to Banco do Nordeste whose funds are sued in BNB’s own
lending operations, the risk is fully assumed by Banco do Nordeste; • In onlendings to other institutions authorized to operate by the Central Bank of
Brazil, contracted until 11/30/1998, the risk is fully assumed by FNE. Under a specific clause of the onlending agreements, the risk on financing granted to final borrowers is fully assumed by the lender;
• In onlendings to other institutions authorized to operate by the Central Bank of Brazil, contracted after Administrative Rule 616, of 05/26/2003, becomes effective, the risk lies totally with BNB. Under referred Administrative Rule and under a specific clause of the onlending agreements, the risk on financing granted to final borrowers is fully assumed by the lender;
• In the transactions addressed by Article 31 of Law 11775 of 09/17/2008, the risk lies 100% with Banco do Nordeste, if the risk of the original transaction is fully attributed to the Bank, or shared, when the renegotiated transaction involves this type of risk;
• In other transactions, the risk is 50 percent for FNE and 50 percent for BNB.
b) Pursuant to sole paragraph of Article 3 of Administrative Rule 11, of 12/28/2005, the allowance for loan losses is recorded by FNE in accordance with the criteria set forth in item I, subitems “a” and “b” of the same Article, pursuant to which an allowance must be recorded for amounts past-due for more than 180 days, according to the risk. Changes in the allowance for loan losses for the period are as follows.
c) Considering that PROCERA is responsible for the risk of financing transactions under
Programa da Terra with FNE’s funds, no allowance for loan losses is recognized.
d) Under Administrative Rule 46, of 03/07/2007, an allowance for loan losses is recorded for transactions renegotiated under Law 11332, of 07/13/2006, as described below:
d.1) for transactions with other sources of funds acquired by FNE: in an amount
equal to the negative goodwill determined on acquisition by the Fund, recorded as a contra entry to loan transactions. The amounts for the year are described in subaccount “Net provision for discounts - Acquired Transactions Law 11322” in the table in item b of this Note; and
d.2) for renegotiated FNE transactions: the amount of the allowance already existing
in the month immediately prior to the renegotiation plus amounts written off from assets as a loss, recorded as a contra entry to “Expenses on allowance for loan losses”. In the first half of the year, the allowance decreased by R$ 78,039, R$ 54,801 of which referred to full FNE risk transactions and R$ 23,238 referred to shared risk transactions. These decreases include R$ 99,731 arising from discounts and releases of transactions classified under Law 12249, of 06/11/2010, of which R$ 60,559 refers to transactions whose full risk lies with the Fund and R$ 39,172 refers to shared-risk transactions. In the same period of 2010, an allowance was reduced by R$ 9,658, of which R$ 8,606 referring to transactions whose full risk lies with the Fund and R$ 1,052 referring to shared-risk transactions. These amounts are included in subtitle “Allowance for loan losses” in the table in item b of this note.
Specification 06/30/2011 06/30/2010 Allowance for loan losses at the beginning of the six-month period 1,218,591 1,300,349 . Full FNE risk 953,269 1,029,846 . Shared risk 265,322 270,503 (+) Net allowance recognized in the period 209,704 262,132
Net provision for discounts - Acquired Transactions Law 11322 (18,119) (426) . Full FNE risk (18,119) (426)
Allowance for loan losses 227,823 262,558 . Full FNE risk 151,186 163,725 . Shared risk 76,637 98,833
(-) Receivables written off as a loss in the period (313,282) 262,728 . Full FNE risk (207,778) 169,831 . Shared risk (105,504) 92,897 (=) Ending balance of allowance for loan losses 1,115,013 1,299,753 . Full FNE risk 878,558 1,023,314 . Shared risk 236,455 276,439
e) Administrative Rule 244, of 10/14/2008, establishes that an allowance for loan losses is recorded for transactions renegotiated under Law 11775, of 09/17/2008, as described below: e.1) for renegotiated FNE transactions: the amount of the allowance already existing
in the month immediately prior to the renegotiation plus amounts written off from assets as a loss, recorded as a contra entry to “Expenses on operating provisions”; and
e.2) for renegotiated FNE transactions, the allowance was reduced by R$ 34,708, of
which R$ 23,337 refers to transactions whose full risk lies with the Fund and R$ 11,371 refers to shared-risk transactions. These amounts include a decrease of R$ 25,272 arising from discounts and releases of transactions classified under Law 12249, of 06/11/2010, of which R$ 16,207 referred to transactions whose full risk lies with the Fund and R$ 9,065 refers to shared-risk transactions. In the same period of 2010, an allowance was recorded in the amount of R$ 17,657, of which R$ 9,502 refers to transactions whose full risk lies with the Fund and R$ 8,155 referred to shared-risk transactions. These amounts are included in subtitle “Allowance for loan losses” in the table in item b of this Note.
f) The renegotiations, documented in six-month period based on Law 11775, of
09/17/2008, Law 9138, of 11/29/1995, Law 10437, of 04/25/2002 and Law 11322, of 07/13/2006, Provisional Act 2196-3, of 08/24/2001 and the releases and discounts granted in conformity with Law 12249, of 06/11/2010, reduced the Fund’s income by R$ 344,303 (R$ 19,135 as at 06/30/2010). This effect includes costs on renegotiation of transactions contracted between the Fund and other funding sources, mixed funding sources, acquired or reclassified to the Fund, as authorized by referred Laws, as shown below:
Specification 06/30/2011 06/30/2010
Recovery of operations written off from assets 29,910 32,558 Expenses - bonuses and waivers (529,559) (45,444) Net effect on allowances 155,346 (6,249) Total net effect (344,303) (19,135)
g) In the Statement of Income, “Income from lending operations” is recorded at the net amount as follows: Specification 06/30/2011 06/30/2010 Income from lending operations 1,263,844 1,089,226 Expenses on BNB’s financial commission (396,149) (324,323) Expenses on financial commission of other institutions (1,927) (1,955) Expenses on negative monetary adjustment (2,139) (1,366) Expenses on discounts granted in renegotiations (1) (495,269) (2,131) Expenses on discounts to Cocoa Plantations Recovery Program transactions - Law 11775 of 09/17/2008 - (501) Expenses on rebates/bonuses for timely payment - Transactions contracted by Banco do Nordeste
(227,203)
(232,210)
Expenses on Rebates/bonuses for timely payment - Onlendings Law 7827 - Article 9 A
(6,315)
(327)
Expenses on rebates/ bonuses for timely payment - Onlendings to other institutions
(33)
(41)
Expenses on principal rebates - Receivables from FAT - BNDES - Law 10193 of 02/14/2001
(4)
(238)
Expenses on transactions - Other sources - Acquisitions Law 11322 of 07/13/2006
(39)
(197)
FNE’s expenses honored by the Bank - Reissue Law 12249, of 06/11/2010
(9,920)
-
FNE’s expenses honored by the Bank - Rebate Law 12249, of 06/11/2010
(6,342)
-
Adjustments related disposal of assets (13) - T O T A L 118,491 525,937
(1) The amount as at June 30, 2011 is related to the quantity of renegotiations recorded during the first
semester of 2011, as defined by Law 12249, of 06/11/2011.
9. RECOGNITION OF LOSSES AND RETURN OF BNB´S SHARE OF RISK
a) Regardless of the provisions set forth in paragraph of Article 3, Administrative Rule 11, based on which losses can be recorded in FNE’s accounting books at the amounts of principal and charges past-due for more than 360 days, according to the risk percentage assumed by the Fund, the Bank recognized losses on these transactions considering the amounts of principal and charges past-due for more than 329 days.
b) Funds related to BNB’s share of risk are returned to FNE on the second business day after losses are recognized by the Fund, according to the criteria set forth in item II, subitem “a”, Article 5 of Administrative Rule 11.
c) In the period, BNB returned to FNE the amount of R$ 107,235 (R$ 93,753 as at
06/30/2010) related to BNB’s share of risk in transactions that were written off as loss.
10. PRIOR YEAR ADJUSTMENTS
The net negative adjustment of R$ 665 as at 06/30/2011, (R$ 25,791 as at 06/30/2010) refers to recalculations of charges on lending transactions.
11. REGISTRATION WITH THE FEDERAL GOVERNMENT INTEGRATED FINANCIAL MANAGEMENT SYSTEM (SIAFI)
In compliance with Administrative Rule 11, of 12/28/2005, the accounting information related to FNE is available on SIAFI, considering the Fund’s specific characteristics.
12. RENEGOTIATION AND RECLASSIFICATION OF LENDING OPERATIONS
Law 11775, of 09/17/2008, established measures to encourage the settlement or renegotiation of debts from rural credit transactions and land mortgage loan, with the following impacts on FNE: a) renegotiation of financing contracted with FNE’s funds;
b) contracting of new transactions with FNE’s funds to settle debts related to the Program for
the Recovery of Cocoa Farming in Bahia, entered into with risks partially or fully assumed by the National Treasury, the State of Bahia and FNE;
c) contracting of new transactions with FNE funds to settle debts related to the Japanese and
Brazilian Cooperation Program for the Development of the Cerrado Region (PRODECER) - Stage III;
d) reclassification to FNE of transactions entered into under the PRONAF at the risk of the
Federal Government;
e) reclassification for the Fund of transactions carried out with funds from FAT;
f) reclassification to the FNE of transactions entered into with mixed funds from other sources.
The same statute authorizes the replacement of financial charges on outstanding rural and non-rural transactions, contracted until 01/14/2001, subject to post fixed rates and backed with resources FNE, by pre fixed rates set by legislation applicable to this kind of transactions.
In the first half of year, credits were reclassified to FNE or new operations were contracted to settle financings with funds from other sources, with full risk for the Fund, totaling R$ 41,424 under referred law, as follows:
Specification Amount Article 7 (Cocoa Farming Operations in Bahia) 40,324 Article 19 (Operations whose Risk lies with the Federal Government - FAT Funds) 642 Article 31 (PRODECER transactions - Stage III/Res 2471 transactions) 458 TOTAL 41,424
Still under Law 11775, of 09/17/2008, credits were reclassified to FNE or new operations were contracted to settle financings with funds from other sources, with full risk for Banco do Nordeste, in the amount of R$ 15,554, as follows:
Specification Amount Article 31 (Mixed Funds from Other Sources/FNE transactions) 6,540 Article 31 (PRODECER transactions - Stage III) 6,789 Article 31 (FAT transactions) 2,225 TOTAL 15,554
A survey conducted by Banco do Nordeste indicates that the following amounts are eligible for transfer to FNE based on Articles 7 and 31 of Law 11775, of 09/17/2008, as of 06/30/2011:
Specification Amount Article 7 (Cocoa Farming Operations in Bahia) 261,131 Article 31 (Transactions with mixed FNE funds ) 497,443 Article 31 (Transactions with FAT funds) 123,295 TOTAL 881,869
13. ONLENDINGS TO BNB UNDER ARTICLE 9-A OF LAW 7827, OF 09/27/1989
On 06/16/2010, the Central Bank of Brazil issued Official Letter DEORF/Cofil - 2010/05338, which approved the qualification of the onlending transaction by FNE, in the amount of R$ 400,000, as Tier II Capital in the Regulatory Equity (PR) of Banco do Nordeste do Brasil S/A, in the subordinated debt class, in accordance with CMN Resolution 3444, of 02/28/2007. The outstanding balance of onlendings made to Banco do Nordeste, including the operation of R$ 600,000, contracted in 2009, were as follows at 06/30/2011:
Specification Amount Available funds 326,846 Funds invested 830,212 TOTAL 1,157,058
The line account “Available funds” records amounts temporarily not invested by the BNB in loan transactions, and yield a extra-market interest rate disclosed by the Central Bank of Brazil. The line account “Funds invested” corresponds to the amounts released by Banco do Nordeste to the borrowers of the financing agreements, adjusted based on contractual indices, as set forth by legislation and the Subordinated Debt Instruments entered into.
INDEPENDENT AUDITOR’S REPORT To the Management of Fundo Constitucional de Financiamento do Nordeste - FNE (Managed by Banco do Nordeste do Brasil S.A.) Fortaleza, CE We have audited the accompanying financial statements of Fundo Constitucional de Financiamento do Nordeste - FNE (“Fund” or “FNE”), which comprise the balance sheet as at June 30, 2011, and the related statement of income, statement of changes in net equity and statement of cash flows for the six-month period then ended, and a summary of significant accounting practices and other explanatory notes. Management’s Responsibility for the Financial Statements The Fund’s management is responsible for the preparation and fair presentation of these financial statements in accordance with accounting practices adopted in Brazil applicable to constitutional funds, and for such internal control as management determines is necessary to enable the preparation of financial statements that are free from material misstatement, whether due to fraud or error. Auditor’s Responsibility Our responsibility is to express an opinion on these financial statements based on our audit. We conducted our audit in accordance with Brazilian and International Standards on Auditing. Those standards require that we comply with ethical requirements and plan and perform the audit to obtain reasonable assurance about whether the financial statements are free from material misstatement.
An audit involves performing procedures to obtain audit evidence about the amounts and disclosures in the financial statements. The procedures selected depend on the auditor’s judgment, including the assessment of the risks of material misstatement of the financial statements, whether due to fraud or error. In making those risk assessments, the auditor considers internal control relevant to the Fund’s preparation and fair presentation of the financial statements in order to design audit procedures that are appropriate in the circumstances, but not for the purpose of expressing an opinion on the effectiveness of the Fund’s internal control. An audit also includes evaluating the appropriateness of accounting practices used and the reasonableness of accounting estimates made by management, as well as evaluating the overall presentation of the financial statements taken as a whole. We believe that the audit evidence we have obtained is sufficient and appropriate to provide a basis for our audit opinion. Opinion In our opinion, the financial statements present fairly, in all material respects, the financial position of Fundo Constitucional de Financiamento do Nordeste - FNE as at June 30, 2011, and its financial performance and its cash flows for the six-month period then ended, in accordance with accounting practices adopted in Brazil applicable to constitutional funds. Emphasis of Matter Law 12249, of June 11, 2010, established measures to release (debt relief) and promote the settlement of debts arising from agricultural credit and land mortgage loans, among others. These measures are applicable to: i) transactions backed by FNE funds; ii) transactions backed by FNE funds along with other sources of funds; iii) transactions backed by other sources of funds, whose risk is assumed by the Brazilian government; or iv) transactions under the National Family Farming Strengthening Program (PRONAF). Debt settlements subject to discounts are contingent on the borrower’s declaration and payment of the outstanding balance portion. The Fund is compliant with the provisions of the aforementioned Law 12249/10 since the amounts corresponding to debt reliefs were already recorded in the accounting books. The impacts from debt settlements on its financial statements will only be fully known when debt settlement processes are completed. The accompanying financial statements have been translated into English for the convenience of readers outside Brazil.
Fortaleza, August 5, 2011 DELOITTE TOUCHE TOHMATSU Claudio Lino Lippi Auditores Independentes Engagement Partner
MANAGEMENT COUNCIL: Dyogo Henrique de Oliveira (President) – Jurandir Vieira Santiago (Vice-President) – Augusto Akira Chiba – Demetrius Ferreira e Cruz – Valter Correia da Silva – Zilana Melo Ribeiro BOARD OF DIRECTOR: Jurandir Vieira Santiago (President) – José Sydrião de Alencar Junior (Director of Development Management) – Luiz Carlos Everton de Farias (Director of Control and Risk) – Oswaldo Serrano de Oliveira (Director of Finance and Market of Capitals) – Paulo Sérgio Rebouças Ferraro (Director of Business) – Stélio Gama Lyra Junior (Director of Management and Information Tecnology) SUPERVISORY BOARD: Rodrigo Silveira Veiga Cabral (President) – Cláudia da Costa Martinelli Wehbe – Cláudio Xavier Seefelder Filho - Marco Antônio Fiori - Roberta Carvalho de Alencar AUDIT’S COMMITTEE: João Alves de Melo (President) – Antonio Carlos Correia – Luciano Silva Reis SUPERINTENDENT: João Francisco Freitas Peixoto (Financial Control) ACCOUNTANT: Aíla Maria Ribeiro de Almeida – CRC-CE 016318/O-7