Embed Size (px)
Citation preview
Financial Statements Audit Report
State of Washington
For the period July 1, 2019 through June 30, 2020
Published December 18, 2020
Report No. 1027566
Insurance Building, P.O. Box 40021 Olympia, Washington 98504-0021 (564) 999-0950 [email protected]
Office of the Washington State Auditor
Pat McCarthy
December 18, 2020
The Honorable Jay Inslee
State of Washington
Olympia, Washington
Report on Financial Statements
Please find attached our report on the State of Washington’s financial statements.
We are issuing this report in order to provide information on the State’s financial condition.
Sincerely,
Pat McCarthy
State Auditor
Olympia, WA
Americans with Disabilities
In accordance with the Americans with Disabilities Act, we will make this document available in
alternative formats. For more information, please contact our Office at (564) 999-0950, TDD
Relay at (800) 833-6388, or email our webmaster at [email protected].

Office of the Washington State Auditor
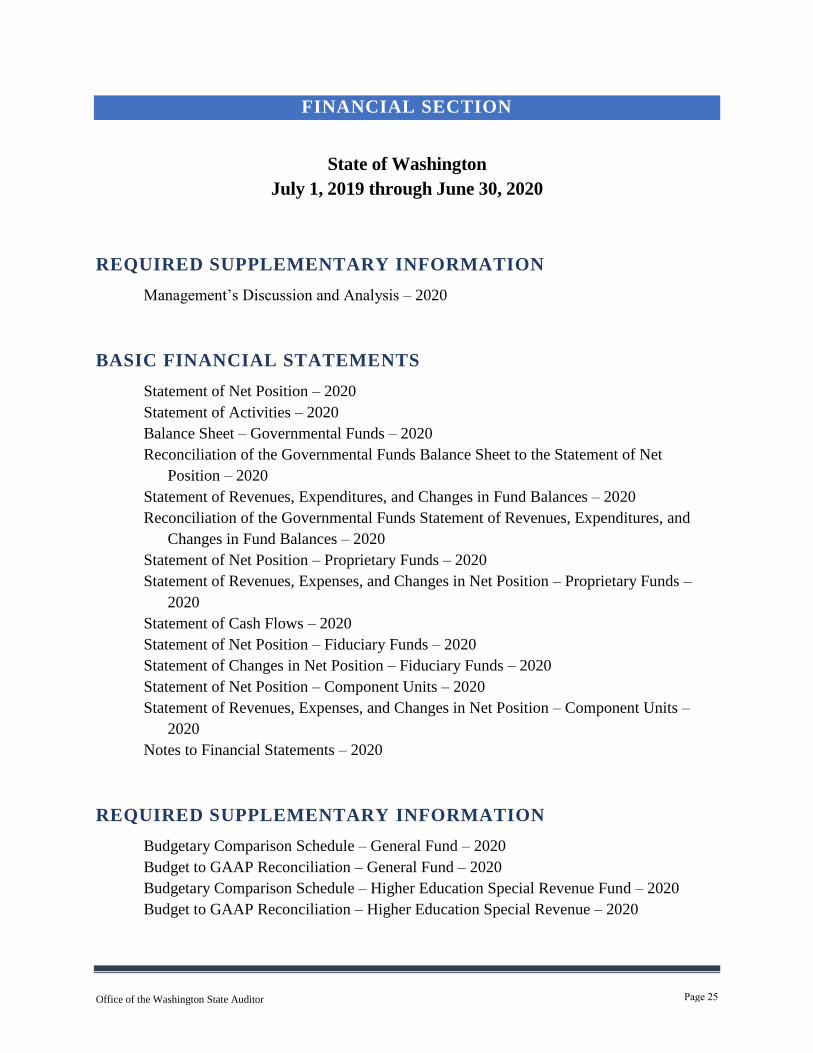
TABLE OF CONTENTS
Schedule of Audit Findings and Responses .................................................................................... 4
Summary Schedule of Prior Audit Findings .................................................................................. 15
Independent Auditor's Report on Internal Control Over Financial Reporting and on Compliance
and Other Matters Based on an Audit of Financial Statements Performed in Accordance with
Government Auditing Standards................................................................................................... 18
Independent Auditor's Report on Financial Statements ................................................................ 21
Financial Section ........................................................................................................................... 25
About the State Auditor's Office ..................................................................................................202
Page 3
Office of the Washington State Auditor
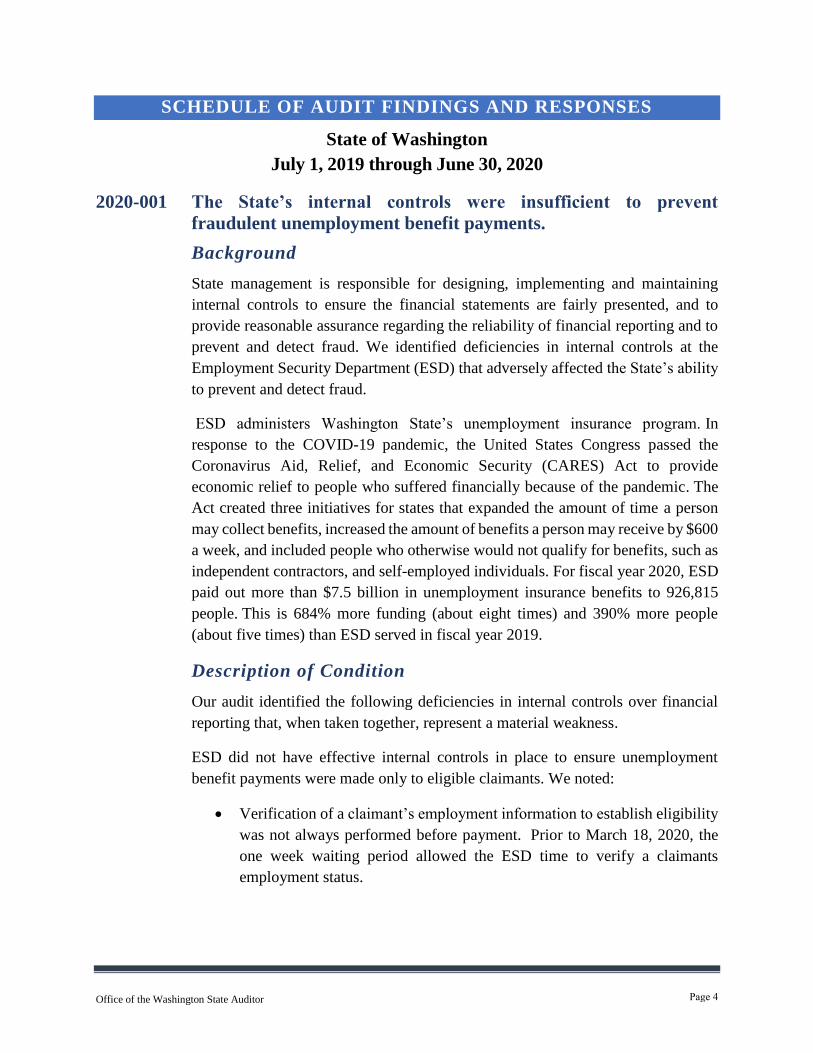
SCHEDULE OF AUDIT FINDINGS AND RESPONSES
State of Washington
July 1, 2019 through June 30, 2020
2020-001 The State’s internal controls were insufficient to prevent
fraudulent unemployment benefit payments.
Background
State management is responsible for designing, implementing and maintaining
internal controls to ensure the financial statements are fairly presented, and to
provide reasonable assurance regarding the reliability of financial reporting and to
prevent and detect fraud. We identified deficiencies in internal controls at the
Employment Security Department (ESD) that adversely affected the State’s ability
to prevent and detect fraud.
ESD administers Washington State’s unemployment insurance program. In
response to the COVID-19 pandemic, the United States Congress passed the
Coronavirus Aid, Relief, and Economic Security (CARES) Act to provide
economic relief to people who suffered financially because of the pandemic. The
Act created three initiatives for states that expanded the amount of time a person
may collect benefits, increased the amount of benefits a person may receive by $600
a week, and included people who otherwise would not qualify for benefits, such as
independent contractors, and self-employed individuals. For fiscal year 2020, ESD
paid out more than $7.5 billion in unemployment insurance benefits to 926,815
people. This is 684% more funding (about eight times) and 390% more people
(about five times) than ESD served in fiscal year 2019.
Description of Condition
Our audit identified the following deficiencies in internal controls over financial
reporting that, when taken together, represent a material weakness.
ESD did not have effective internal controls in place to ensure unemployment
benefit payments were made only to eligible claimants. We noted:
Verification of a claimant’s employment information to establish eligibility
was not always performed before payment. Prior to March 18, 2020, the
one week waiting period allowed the ESD time to verify a claimants
employment status.
Page 4

Office of the Washington State Auditor
ESD performs a discovery process to identify claims at high risk of identity
theft for investigation. Prior to May 14, 2020, this process was not
performed until after claims had already been paid.
Cause of Condition
After the surge in claims due to the pandemic and the implementation of the
CARES Act, existing controls over claims were modified and/or eliminated. Issues
contributing to the control weaknesses include:
Large volume of claims
Short time to implement new federal initiatives with little guidance
By emergency proclamation, the Governor waived the required one week
waiting period and benefits began being paid within one business day
The new Pandemic Unemployment Assistance Program, which extended
unemployment benefits to individuals not traditionally eligible for them, did
not require claimants to submit documentation to substantiate employment
or self-employment wages
Effect of Condition
As of November 19, 2020, ESD estimates it paid out over 122,000 known or
probable fraudulent claims totaling over $600 million in fiscal year ending June 30,
2020. Of this amount, approximately $250 million has been recovered to date,
resulting in an estimated net loss of $350.9 million. Efforts to identify and
investigate known and suspected claims and recover fraudulent amounts are
ongoing.
Recommendation
We recommend ESD continue working with the federal Department of Justice to
recover the remaining fraudulent payments.
We further recommend ESD improve internal controls to better detect and prevent
fraud before payments are made.
State’s Response
Washington was out in front in implementing the Pandemic Unemployment
Assistance Program (PUA) and other CARES Act benefits and has one of the
highest weekly benefit amounts. This, combined with the fact Washington State has
no income tax, made Washington an attractive state for a targeted fraud attack.
ESD has been transparent and forthcoming about the dollar amounts lost to a
targeted fraud attack in May of 2020 and has reported that correctly on its financial
Page 5
Office of the Washington State Auditor
statements. During fiscal year 2020, ESD paid out $7.5 billion in benefits for
Unemployment Insurance and CARES Act programs. The amount lost to the
targeted fraud attack is less than 8% of total benefits paid. Through aggressive
recovery efforts, this loss has been reduced to 5% of total benefits paid during fiscal
year 2020.
The discovery process was working as intended during this time period, which was
to run as a batch every night. During normal operations, high risk claims would be
identified and investigated prior to payment. Waiving the one-week waiting period
and the high volume of claims impacted the Department’s ability to identify high
risk claims and investigate them before they were paid.
We appreciate the two primary recommendations from the State Auditor as they
affirm the actions and investments ESD has already made and on which they are
seen as a national leader.
ESD recovered a total of $356.4 million but must complete investigations of
suspected fraudulent claims in order to assign the recovered funds. So far they
have been able to assign $250.7 million to known or probable fraudulent claims.
ESD continues its investigations into suspected fraudulent claims and to work with
the federal Department of Justice to recover the remaining fraudulent payments.
Prior to the surge in fraudulent claims, ESD was already engaged in strong
controls required and recommended by the U.S. Department of Labor (USDOL) to
prevent imposter fraud, including those identified in UIPL 23-20 on Program
Integrity for the Unemployment Insurance (UI) Program and UI programs
authorized by the CARES Act. Those activities include use of the NASWA Integrity
Data Hub (IDH), namely: identification verification, incarceration cross match,
and Suspicious Actor Repository (SAR) checks.
Since the discovery of the surge in fraudulent claims in May 2020, ESD has
instituted many additional controls and countermeasures to fraud, to include:
Stood up a 100-person customer service in-take team to handle reports of
fraud.
Established a secure portal for receiving verification information from
victims and businesses to more quickly identify fraudulent claims, suspend
payments and identify payments to recover.
Implemented a two-day hold on payments to help investigate fraudulent
claims prior to payment, with the help of the McKinsey consulting company
Page 6
Office of the Washington State Auditor
Enacted emergency rule WAC 192-140-096 to allow suspension of
payments suspected to be fraudulent until an investigation can be
completed.
Reallocated resources and increased staffing for fraud investigations. Often
surging capacity to include hundreds of other agency staff and the
Washington National Guard.
Repurposed staff for data analytics to detect trends in fraud and improve
the discovery process.
The data shows all of these and other controls implemented are proving to be
effective as there has been a dramatic reduction in fraudulent claim attempts since
June 2, 2020.
For PUA claims, under the CARES Act language, states were required to rely on
applicants’ self-certification of eligibility for benefits. States were also required to
pay claimants the minimum PUA weekly benefit amounts until documents could be
verified and used to increase the weekly benefit amount if applicable. Those who
didn’t provide any documentation continued to receive the minimum weekly benefit
amount. ESD was not allowed to establish stricter controls. The high risk of fraud
for the PUA program was noted by the U.S. Department of Labor’s Office of
Inspector General in reports in April and May 2020, both because of the inherent
risk in implementing benefit programs and because of the CARES Act requirements.
The challenges are not unique to Washington but are, instead, nationwide.
Auditor’s Remarks
We are aware that the pandemic presented a significant challenge to the ESD.
We reaffirm our finding and will follow-up on the status of this finding during the
next audit of the state’s comprehensive annual financial report.
Applicable Laws and Regulations
WAC 192-110-020
How will the department verify my identity?
When you apply for benefits, the information you provide must be
sufficient for the department to confirm your identity to its satisfaction.
(1) If we can verify your identity with this information, we will file
your application for benefits.
Page 7

Office of the Washington State Auditor
(2) If we cannot verify your identity, we will request additional
verification.
(a) If the additional information provides satisfactory evidence of
your identity, your claim will be effective based on the date
you first applied for benefits, unless it is backdated as provided
in WAC 192-110-095.
(b) If the additional information does not satisfy the department of
your identity, we will deny your benefits.
RCW 43.88.160 Fiscal management – Powers and duties of officers and agencies,
states in part:
(4) In addition, the director of financial management, as agent of the
governor, shall:
(a) Develop and maintain a system of internal controls and
internal audits comprising methods and procedures to be
adopted by each agency that will safeguard its assets, check
the accuracy and reliability of its accounting data, promote
operational efficiency, and encourage adherence to prescribed
managerial policies for accounting and financial controls. The
system developed by the director shall include criteria for
determining the scope and comprehensiveness of internal
controls required by classes of agencies, depending on the
level of resources at risk.
Government Auditing Standards, July 2018 Revision, paragraph 6.40 establishes
reporting requirements related to significant deficiencies or material weaknesses in
internal control.
Government Auditing Standards, July 2018 Revision, paragraph 6.41 establishes
reporting requirements related to instances of fraud or noncompliance with
provisions of laws, regulations, contracts, or grant agreements.
The American Institute of Certified Public Accountants defines significant
deficiencies and material weaknesses in its Codification of Statements on Auditing
Standards, section 265, Communicating Internal Control Related Matters Identified
in an Audit, paragraph 7.
Page 8
Office of the Washington State Auditor
SCHEDULE OF AUDIT FINDINGS AND RESPONSES
State of Washington
July 1, 2019 through June 30, 2020
2020-002 The State did not have adequate internal controls over financial
reporting to ensure financial activity is properly classified,
recorded in the correct period and reconciles to its financial
statements.
Background
State management is responsible for designing, implementing and maintaining
internal controls to ensure the financial statements are fairly presented, and to
provide reasonable assurance regarding the reliability of financial reporting. We
identified deficiencies in internal controls that could adversely affect the State’s
ability to prevent, or quickly detect and correct, misstatements in the financial
statements.
Government Auditing Standards, prescribed by the Comptroller General of the
United States, requires the auditor to communicate material weakness in internal
controls, as defined below in the Applicable Laws and Regulations section, as a
finding.
State Board for Community and Technical Colleges
The State Board for Community and Technical Colleges (SBCTC) advocates for,
coordinates and directs Washington’s system of 34 public community and technical
colleges. One of SBCTC’s responsibilities is to collect and consolidate community
and technical college financial data for reporting in the State’s general ledger
accounting system. During the previous three audits, we identified and
communicated deficiencies in controls over the reporting of community and
technical college financial data.
Office of Financial Management
The Office of Financial Management (OFM) is responsible for preparing the State’s
financial statements in accordance with generally accepted accounting principles
(GAAP). These statements provide a thorough and detailed presentation of the
State’s overall financial condition. OFM is responsible for the overall coordination
of financial data across the State used to prepare these statements. At year-end,
OFM is also responsible for ensuring the accuracy of the financial information
presented in the statements.
Page 9

Office of the Washington State Auditor
Employment Security Department
The Employment Security Department (ESD) is led by a Governor-appointed
Commissioner. The Department has approximately 2,032 employees in offices
across the state. It operates on a biennial budget of approximately $1.956 million.
The Department administers Washington State’s unemployment insurance
program. They processed approximately $1.09 billion in Unemployment Insurance
Premium payments and approximately $105 billion in taxable wage information
from employers. The Department paid out more than $7.5 billion in Unemployment
Insurance and CARES Act benefits to over 926,815 individuals to assist them
during the transition to a new job. During fiscal year 2020, ESD estimates it paid
about $600 million in known or likely fraudulent claims.
Description of Condition
Our audit identified the following deficiencies in internal controls over financial
reporting that, when taken together, represent a material weakness in internal
controls over financial reporting:
SBCTC
The SBCTC did not complete a timely and accurate reconciliation of college
financial data with amounts recorded in the State’s accounting system before the
State closed its books.
OFM
In preparing the State's financial statements, OFM did not identify and separately
report fraudulent unemployment benefit payments from legitimate unemployment
benefit payments.
ESD
The ESD did not report all receivables in the State's accounting system at
June 30, 2020, that resulted from fraudulent claim payments.
Cause of Condition
SBCTC
The SBCTC did not dedicate sufficient time or resources to reconciling the balances
and making appropriate adjustments to the State’s accounting system. The
difficulty of this reconciliation has increased as seven colleges had converted to a
new, modernized computer system by fiscal year end while the remainder of
schools remained on legacy software.
Page 10

Office of the Washington State Auditor
OFM
OFM did not separately report fraudulent unemployment benefit payments because
it does not believe the State has incurred a fraud loss. OFM stated the vast majority
of the fraudulent claims were expanded benefits under the federal CARES Act. The
Unemployment Compensation Fund is reimbursed for the claim payments and
related expenses from the federal government. OFM does not expect the federal
Department of Labor to hold the State liable and require repayment.
ESD
The ESD did not report the receivables until the subsequent fiscal year to allow
time to investigate and finalize the amounts.
Effect of Condition
SBCTC
We found numerous unexplained variances between consolidated college financial
data and amounts recorded in the State’s accounting system. Some of these
variances include:
In governmental activities funds, the State’s accounting system had larger
balances than the consolidated college financial data. These variances
included depreciable assets ($74 million), charges for services
($63 million), operating grants and contributions ($163 million), and
education expenses ($198 million).
In the higher education special revenue funds, the State’s accounting system
had larger balances than the consolidated college financial data. These
variances included cash ($82 million), charges for services ($62 million),
federal grants-in-aid ($2 million), and education expenditures ($65 million).
In the higher education student services funds, the State’s accounting
system had a larger balance than the consolidated college financial data for
cash ($19 million).
These errors were not corrected in the financial statements.
OFM
In the unemployment compensation fund, about $350 million was
inappropriately classified as premiums and claims expense instead of being
separately reported as estimated fraud loss expense.
These errors were not corrected in the financial statements.
Page 11
Office of the Washington State Auditor
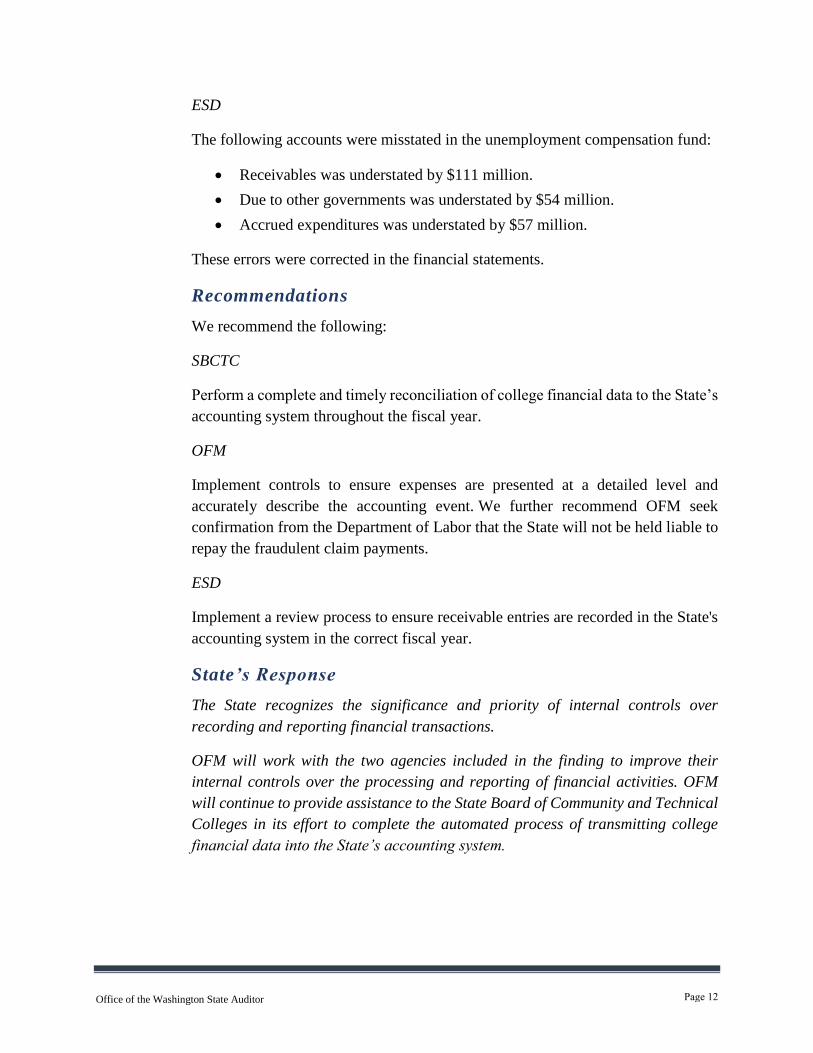
ESD
The following accounts were misstated in the unemployment compensation fund:
Receivables was understated by $111 million.
Due to other governments was understated by $54 million.
Accrued expenditures was understated by $57 million.
These errors were corrected in the financial statements.
Recommendations
We recommend the following:
SBCTC
Perform a complete and timely reconciliation of college financial data to the State’s
accounting system throughout the fiscal year.
OFM
Implement controls to ensure expenses are presented at a detailed level and
accurately describe the accounting event. We further recommend OFM seek
confirmation from the Department of Labor that the State will not be held liable to
repay the fraudulent claim payments.
ESD
Implement a review process to ensure receivable entries are recorded in the State's
accounting system in the correct fiscal year.
State’s Response
The State recognizes the significance and priority of internal controls over
recording and reporting financial transactions.
OFM will work with the two agencies included in the finding to improve their
internal controls over the processing and reporting of financial activities. OFM
will continue to provide assistance to the State Board of Community and Technical
Colleges in its effort to complete the automated process of transmitting college
financial data into the State’s accounting system.
Page 12
Office of the Washington State Auditor
Auditor’s Remarks
We appreciate the State’s commitment to resolve this finding and thank OFM for
its cooperation and assistance during the audit. We will review the corrective action
taken during the next audit of the state’s comprehensive annual financial report.
Applicable Laws and Regulations
RCW 43.88.160 Fiscal management – Powers and duties of officers and agencies,
states in part:
(4) In addition, the director of financial management, as agent of the
governor, shall:
(a) Develop and maintain a system of internal controls and internal
audits comprising methods and procedures to be adopted by
each agency that will safeguard its assets, check the accuracy
and reliability of its accounting data, promote operational
efficiency, and encourage adherence to prescribed managerial
policies for accounting and financial controls. The system
developed by the director shall include criteria for determining
the scope and comprehensiveness of internal controls required
by classes of agencies, depending on the level of resources at
risk.
Government Auditing Standards, December 2011 Revision, paragraph 4.23
establishes reporting requirements related to significant deficiencies or material
weaknesses in internal control, instances of fraud or abuse, and noncompliance with
provisions of law, regulations, contracts, or grant agreements.
The American Institute of Certified Public Accountants defines
significant deficiencies and material weaknesses in its
Codification of Statements on Auditing Standards, section 265,
Communicating Internal Control Related Matters Identified in
an Audit, paragraph 7.
Governmental Accounting Standards Board Codification
P80.114 PROPRIETARY FUND ACCOUNTING AND FINANCIAL
REPORTING
The statement of revenues, expenses, and changes in fund net
position should be presented in the following sequence using the
all-inclusive format...Operating expenses (detailed)
Page 13

Office of the Washington State Auditor
The Office of Financial Management’s State Administrative and Accounting Manual (SAAM),
states in part:
Section 20.15.30 Annual requirements for agencies related
to statewide reporting
The Office of Financial Management (OFM) prepares the
state’s Comprehensive Annual Financial Report (CAFR)
annually. While OFM has final responsibility for the contents
of the CAFR, the data in the financial statements and many of
the notes to the financial statements are generated from
Agency Financial Reporting System (AFRS) transactions
input by agencies. Because agencies are in control of
transactions entered into AFRS, OFM relies on agency internal
control systems and the monitoring of those systems to assert
in writing that the CAFR is correct and complete.
Page 14
Office of the Washington State Auditor
SUMMARY SCHEDULE OF PRIOR AUDIT FINDINGS
State of Washington
July 1, 2019 through June 30, 2020
This schedule presents the status of findings reported in prior audit periods.
Audit Period:
July 1, 2018 through June 30, 2019
Report Ref. No.:
1025129
Finding Ref. No.:
2019-001
Finding Caption:
The State’s internal controls over financial reporting were insufficient to ensure accurate
recording and monitoring of financial activity in its financial statements.
Background:
State Board for Community and Technical Colleges (SBCTC)
SBCTC has been developing an automated process to transmit college financial data into the
State’s accounting system. However at fiscal year-end, this process was not yet complete.
SBCTC did not dedicate sufficient time or resources to reconciling the balances and making
appropriate adjustments to the State’s accounting system.
We found numerous unexplained variances between consolidated college financial data and
amounts recorded in the State’s accounting system. Some of these variances include:
In non-major funds, the State’s accounting system reported revenue was $86 million
less, expenditures were $29 million more, and assets were $16 million less than in the
consolidated college financial data.
In the higher education special revenue funds, the State’s accounting system reported
expenditures were $15 million more than in the consolidated college financial data.
The State did not correct these errors in its financial statements.
Health Care Authority (HCA)
HCA and its vendor did not adequately outline in their original contract the responsibilities,
controls and requirements for monitoring the ProviderOne system. Specifically, the contract did
not require the vendor to provide a SOC 1 report to demonstrate that controls were effective. At
the time of the contract, HCA did not completely understand the extent of its monitoring
responsibilities for ProviderOne.
The State has less assurance that vendor controls are properly designed and operating
effectively. The failure of these controls over the ProviderOne system could lead to:
Inaccurate financial reporting in the state’s General Fund
Page 15

Office of the Washington State Auditor
Misuse, loss or misappropriation, inaccurate payments, and unauthorized software
changes to the ProviderOne system
Status of Corrective Action: (check one)
☐ Fully
Corrected
Partially
Corrected ☐ Not Corrected
☐ Finding is considered no
longer valid
Corrective Action Taken:
Status: Corrective actions in progress
State Board for Community and Technical Colleges
Since July 2017, the State Board for Community and Technical Colleges (State Board) has been
working on developing and implementing an automated process to accurately and completely
upload ctcLink financial transactions into the state’s accounting system, Agency Financial
Reporting System (AFRS).
As of April 2019, the State Board implemented an automated AFRS customized upload process
after a yearlong design and testing effort. This upload process provided the State Board the
ability to extract college data, process errors, and report data through June 2019 to the Office
of Financial Management.
On July 1, 2019, a newly re-designed global chart of accounts was implemented, which has
significantly improved the college system’s ability to consistently track and report revenues and
expenses. However, this implementation affected the AFRS upload process; requiring the
customization to be re-configured to work with the new chart of accounts.
As of October 2019, the re-configured customization was completed, tested, and successfully
deployed. In April 2020, it was discovered that an update to the global chart of accounts affected
the customized programming that uploads data into AFRS. The issues have since been identified
and addressed, and the State Board is currently reviewing and uploading corrected data for
November 2019 through May 2020.
The State Board has been working on fine-tuning the automated upload process and providing
training to college clients on the newly implemented process.
As of February 2020, the State Board hired a System ctcLink Account Coordinator, a new
position dedicated to coordinate, review, and support the AFRS upload process. In June 2020,
an additional accounting staff member was assigned to support the year-end upload process.
As of June 2020, State Board leadership, finance staff, and programmers meet weekly to monitor
progress, identify needed resources and make critical decisions. This process has led to steady
progress, resulting in improved functionalities being deployed in July and August 2020.
The State Board will continue to:
Improve and add functionalities to the customized automated upload process.
Provide technical assistance to all colleges in their efforts to reconcile accounting records with
the state accounting system.
Page 16

Office of the Washington State Auditor
Healthcare Authority
The Authority recognizes the significance and priority of internal controls over recording and
reporting financial transactions.
The Authority disagrees that annual assurances over ProviderOne controls are necessary or that
the Authority did not address monitoring in its ProviderOne contract language. Currently, the
vendor provides an independent service organization control (SOC) audit every other year. The
estimated additional cost to purchase an annual SOC audit report is $470,000 each biennium.
In both 2019 and 2020, the Authority requested funding from the Legislature to contract for the
additional SOC audit report. This request was not funded.
The Authority will continue to request funds to obtain this report in order to resolve the audit
finding.
Page 17
Office of the Washington State Auditor
INDEPENDENT AUDITOR’S REPORT ON INTERNAL CONTROL
OVER FINANCIAL REPORTING AND ON COMPLIANCE AND
OTHER MATTERS BASED ON AN AUDIT OF FINANCIAL
STATEMENTS PERFORMED IN ACCORDANCE WITH
GOVERNMENT AUDITING STANDARDS
State of Washington
July 1, 2019 through June 30, 2020
The Honorable Jay Inslee
State of Washington
Olympia, Washington
We have audited, in accordance with auditing standards generally accepted in the United States of
America and the standards applicable to financial audits contained in Government Auditing
Standards, issued by the Comptroller General of the United States, the financial statements of the
governmental activities, the business-type activities, each major fund, and the aggregate discretely
presented component units and remaining fund information of the State of Washington, as of and
for the year ended June 30, 2020, and the related notes to the financial statements, which
collectively comprise the State’s basic financial statements, and have issued our report thereon
dated December 17, 2020.
Our report includes a reference to other auditors who audited the financial statements of the
Department of Retirement Systems, the Local Government Investment Pool, the University of
Washington, and the funds managed by the State Investment Board, as described in our report on
the State’s financial statements. This report includes our consideration of the results of the other
auditors’ testing of internal control over financial reporting and compliance and other matters that
are reported on separately by those other auditors. However, this report, insofar as it relates to the
results of the other auditors, is based solely on the reports of the other auditors.
As explained in Note 1.D.1, the financial statements include pension trust fund investments, the
fair values of which have been estimated by management in the absence of readily determinable
fair values. Management’s estimates are based upon information provided by the fund managers
or, in the case of investments in partnerships, the general partners.
Page 18
Office of the Washington State Auditor
INTERNAL CONTROL OVER FINANCIAL REPORTING
In planning and performing our audit of the financial statements, we considered the State’s internal
control over financial reporting (internal control) to determine the audit procedures that are
appropriate in the circumstances for the purpose of expressing our opinions on the financial
statements, but not for the purpose of expressing an opinion on the effectiveness of the State’s
internal control. Accordingly, we do not express an opinion on the effectiveness of the State’s
internal control.
Our consideration of internal control was for the limited purpose described in the preceding
paragraph and was not designed to identify all deficiencies in internal control that might be
material weaknesses or significant deficiencies and therefore, material weaknesses or significant
deficiencies may exist that were not identified. However, as described in the accompanying
Schedule of Audit Findings and Responses, we and the other auditors identified certain
deficiencies in internal control that we consider to be material weaknesses.
A deficiency in internal control exists when the design or operation of a control does not allow
management or employees, in the normal course of performing their assigned functions, to prevent,
or detect and correct, misstatements on a timely basis. A material weakness is a deficiency, or a
combination of deficiencies, in internal control such that there is a reasonable possibility that a
material misstatement of the State’s financial statements will not be prevented, or detected and
corrected on a timely basis. A significant deficiency is a deficiency, or a combination of
deficiencies, in internal control that is less severe than a material weakness, yet important enough
to merit attention by those charged with governance. We consider the deficiencies described in the
accompanying Schedule of Audit Findings and Responses as Findings 2020-001 and 2020-002 to
be material weaknesses.
We also noted certain matters that we have reported to the management of the State in a separate
letter dated December 17, 2020.
COMPLIANCE AND OTHER MATTERS
As part of obtaining reasonable assurance about whether the State’s financial statements are free
from material misstatement, we performed tests of the State’s compliance with certain provisions
of laws, regulations, contracts and grant agreements, noncompliance with which could have a
direct and material effect on the determination of financial statement amounts. However, providing
an opinion on compliance with those provisions was not an objective of our audit, and accordingly,
we do not express such an opinion.
Page 19

Office of the Washington State Auditor
The results of our tests and the reports of the other auditors disclosed instances of noncompliance
or other matters that are required to be reported under Government Auditing Standards and which
are described in the accompanying Schedule of Audit Findings and Responses as
Finding 2020-001.
STATE’S RESPONSE TO FINDINGS
The State’s response to the findings identified in our audit is described in the accompanying
Schedule of Audit Findings and Responses. The State’s response was not subjected to the auditing
procedures applied in the audit of the financial statements and, accordingly, we express no opinion
on the response.
PURPOSE OF THIS REPORT
The purpose of this report is solely to describe the scope of our testing of internal control and
compliance and the results of that testing, and not to provide an opinion on the effectiveness of the
State’s internal control or on compliance. This report is an integral part of an audit performed in
accordance with Government Auditing Standards in considering the State’s internal control and
compliance. Accordingly, this communication is not suitable for any other purpose. However, this
report is a matter of public record and its distribution is not limited. It also serves to disseminate
information to the public as a reporting tool to help citizens assess government operations.
Pat McCarthy
State Auditor
Olympia, WA
December 17, 2020
Page 20
Office of the Washington State Auditor
INDEPENDENT AUDITOR’S REPORT ON
FINANCIAL STATEMENTS
State of Washington
July 1, 2019 through June 30, 2020
The Honorable Jay Inslee
State of Washington
Olympia, Washington
REPORT ON THE FINANCIAL STATEMENTS
We have audited the accompanying financial statements of the governmental activities, the
business-type activities, each major fund, and the aggregate discretely presented component units
and remaining fund information of the State of Washington, as of and for the year ended June 30,
2020, and the related notes to the financial statements, which collectively comprise the State’s
basic financial statements as listed on page 25.
Management’s Responsibility for the Financial Statements
Management is responsible for the preparation and fair presentation of these financial statements
in accordance with accounting principles generally accepted in the United States of America; this
includes the design, implementation, and maintenance of internal control relevant to the
preparation and fair presentation of financial statements that are free from material misstatement,
whether due to fraud or error.
Auditor’s Responsibility
Our responsibility is to express opinions on these financial statements based on our audit. We did
not audit the financial statements of the Department of Retirement Systems, the Local Government
Investment Pool, the University of Washington, or the funds managed by the State Investment
Board. Those financial statements represent part or all of the total assets, net position, and revenues
or additions of the governmental activities, the business-type activities, each major fund, and the
aggregate discretely presented component units and remaining fund information as follows:
Page 21

Office of the Washington State Auditor
Opinion Unit
Percent of
Total
Assets
Percent of
Net
Position
Percent of
Revenues /
Additions
Governmental Activities 14.1% 27.2% 7.6%
Business-Type Activities 80.4% 100.0% 26.3%
Higher Education Special Revenue Fund 53.3% 50.1% 49.1%
Higher Education Endowment Fund 98.4% 97.5% 72.7%
Higher Education Student Services Fund 70.8% 100.0% 90.3%
Workers’ Compensation Fund 96.2% 100.0% 40.3%
Aggregate Discretely Presented Component Units
and Remaining Fund Information 94.2% 91.7% 23.7%
Those statements were audited by other auditors, whose reports have been furnished to us, and our
opinion, insofar as it relates to the amounts included for the entities and funds listed above, is based
solely on the reports of the other auditors.
We conducted our audit in accordance with auditing standards generally accepted in the United
States of America and the standards applicable to financial audits contained in Government
Auditing Standards, issued by the Comptroller General of the United States. Those standards
require that we plan and perform the audit to obtain reasonable assurance about whether the
financial statements are free from material misstatement.
An audit involves performing procedures to obtain audit evidence about the amounts and
disclosures in the financial statements. The procedures selected depend on the auditor’s judgment,
including the assessment of the risks of material misstatement of the financial statements, whether
due to fraud or error. In making those risk assessments, the auditor considers internal control
relevant to the State’s preparation and fair presentation of the financial statements in order to
design audit procedures that are appropriate in the circumstances, but not for the purpose of
expressing an opinion on the effectiveness of the State’s internal control. Accordingly, we express
no such opinion. An audit also includes evaluating the appropriateness of accounting policies used
and the reasonableness of significant accounting estimates made by management, as well as
evaluating the overall presentation of the financial statements.
We believe that the audit evidence we have obtained is sufficient and appropriate to provide a basis
for our audit opinions.
Opinions
In our opinion, based on our audit and the reports of the other auditors, the financial statements
referred to above present fairly, in all material respects, the respective financial position of the
governmental activities, the business-type activities, each major fund, and the aggregate discretely
Page 22

Office of the Washington State Auditor
presented component units and remaining fund information of the State of Washington, as of
June 30, 2020, and the respective changes in financial position and, where applicable, cash flows
thereof for the year then ended in accordance with accounting principles generally accepted in the
United States of America.
Matters of Emphasis
As explained in Note 1.D.1, the financial statements include pension trust fund investments valued
at $53.0 billion, which comprise 32.2 percent of the total assets and 35.6 percent of the net position
of the aggregate discretely component units and remaining fund information. The fair values of
those investments have been estimated by management in the absence of readily determinable fair
values. Management’s estimates are based upon information provided by the fund managers or, in
the case of investments in partnerships, the general partners. Our opinion is not modified with
respect to this matter.
Other Matters
Required Supplementary Information
Accounting principles generally accepted in the United States of America require that the
management’s discussion and analysis and required supplementary information listed on page 25
be presented to supplement the basic financial statements. Such information, although not a part
of the basic financial statements, is required by the Governmental Accounting Standards Board
who considers it to be an essential part of financial reporting for placing the basic financial
statements in an appropriate operational, economic or historical context. We have applied certain
limited procedures to the required supplementary information in accordance with auditing
standards generally accepted in the United States of America, which consisted of inquiries of
management about the methods of preparing the information and comparing the information for
consistency with management’s responses to our inquiries, the basic financial statements, and
other knowledge we obtained during our audit of the basic financial statements. We do not express
an opinion or provide any assurance on the information because the limited procedures do not
provide us with sufficient evidence to express an opinion or provide any assurance.
OTHER REPORTING REQUIRED BY GOVERNMENT AUDITING
STANDARDS
In accordance with Government Auditing Standards, we have also issued our report dated
December 17, 2020 on our consideration of the State’s internal control over financial reporting
and on our tests of its compliance with certain provisions of laws, regulations, contracts and grant
Page 23

Office of the Washington State Auditor
agreements and other matters. The purpose of that report is to describe the scope of our testing of
internal control over financial reporting and compliance and the results of that testing, and not to
provide an opinion on internal control over financial reporting or on compliance. That report is an
integral part of an audit performed in accordance with Government Auditing Standards in
considering the State’s internal control over financial reporting and compliance.
Pat McCarthy
State Auditor
Olympia, WA
December 17, 2020
Page 24
Office of the Washington State Auditor
FINANCIAL SECTION
State of Washington
July 1, 2019 through June 30, 2020
REQUIRED SUPPLEMENTARY INFORMATION
Management’s Discussion and Analysis – 2020
BASIC FINANCIAL STATEMENTS
Statement of Net Position – 2020
Statement of Activities – 2020
Balance Sheet – Governmental Funds – 2020
Reconciliation of the Governmental Funds Balance Sheet to the Statement of Net
Position – 2020
Statement of Revenues, Expenditures, and Changes in Fund Balances – 2020
Reconciliation of the Governmental Funds Statement of Revenues, Expenditures, and
Changes in Fund Balances – 2020
Statement of Net Position – Proprietary Funds – 2020
Statement of Revenues, Expenses, and Changes in Net Position – Proprietary Funds –
2020
Statement of Cash Flows – 2020
Statement of Net Position – Fiduciary Funds – 2020
Statement of Changes in Net Position – Fiduciary Funds – 2020
Statement of Net Position – Component Units – 2020
Statement of Revenues, Expenses, and Changes in Net Position – Component Units –
2020
Notes to Financial Statements – 2020
REQUIRED SUPPLEMENTARY INFORMATION
Budgetary Comparison Schedule – General Fund – 2020
Budget to GAAP Reconciliation – General Fund – 2020
Budgetary Comparison Schedule – Higher Education Special Revenue Fund – 2020
Budget to GAAP Reconciliation – Higher Education Special Revenue – 2020
Page 25
Office of the Washington State Auditor
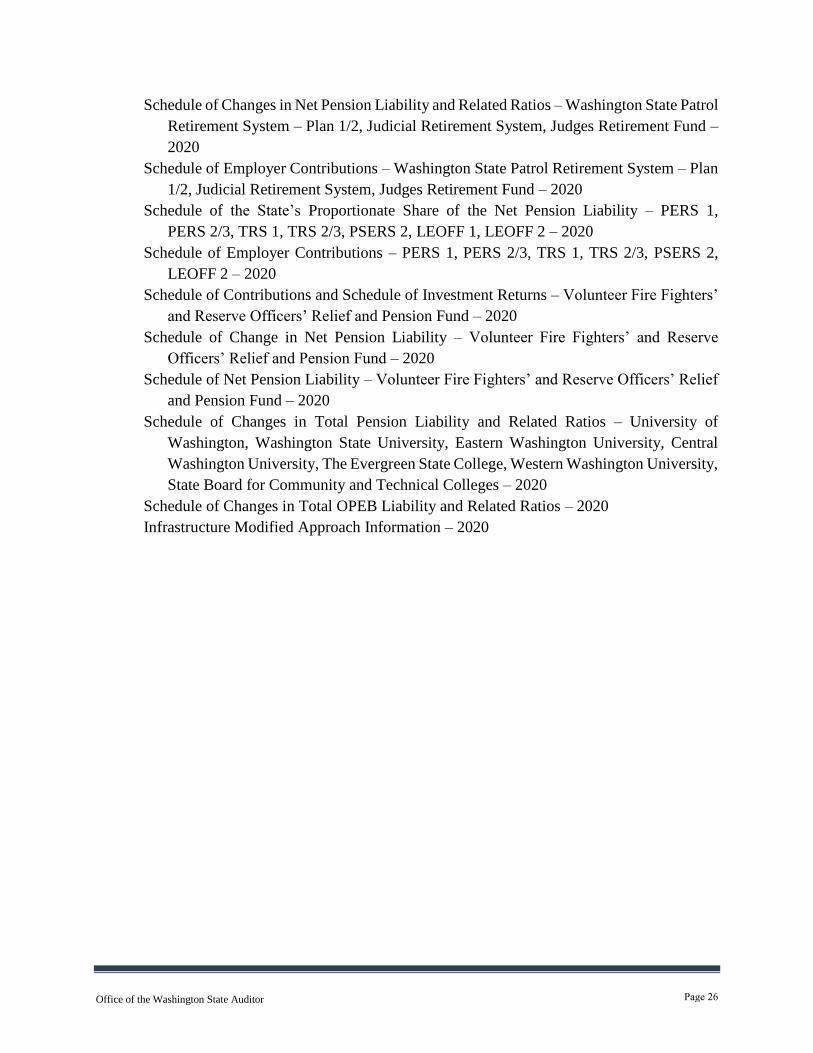
Schedule of Changes in Net Pension Liability and Related Ratios – Washington State Patrol
Retirement System – Plan 1/2, Judicial Retirement System, Judges Retirement Fund –
2020
Schedule of Employer Contributions – Washington State Patrol Retirement System – Plan
1/2, Judicial Retirement System, Judges Retirement Fund – 2020
Schedule of the State’s Proportionate Share of the Net Pension Liability – PERS 1,
PERS 2/3, TRS 1, TRS 2/3, PSERS 2, LEOFF 1, LEOFF 2 – 2020
Schedule of Employer Contributions – PERS 1, PERS 2/3, TRS 1, TRS 2/3, PSERS 2,
LEOFF 2 – 2020
Schedule of Contributions and Schedule of Investment Returns – Volunteer Fire Fighters’
and Reserve Officers’ Relief and Pension Fund – 2020
Schedule of Change in Net Pension Liability – Volunteer Fire Fighters’ and Reserve
Officers’ Relief and Pension Fund – 2020
Schedule of Net Pension Liability – Volunteer Fire Fighters’ and Reserve Officers’ Relief
and Pension Fund – 2020
Schedule of Changes in Total Pension Liability and Related Ratios – University of
Washington, Washington State University, Eastern Washington University, Central
Washington University, The Evergreen State College, Western Washington University,
State Board for Community and Technical Colleges – 2020
Schedule of Changes in Total OPEB Liability and Related Ratios – 2020
Infrastructure Modified Approach Information – 2020
Page 26
MD&A Management’s Discussion & Analysis
As managers of the state of Washington, we offer this
narrative overview and analysis of the financial activities
for the fiscal year ended June 30, 2020. We present this
information in conjunction with the information included in our letter of transmittal, which can be found preceding
this narrative, and with the state’s financial statements,
which follow. All amounts, unless otherwise indicated, are
expressed in thousands of dollars.
Financial Highlights
• Total assets and deferred outflows of the state of Washington exceeded its liabilities and deferred
inflows by $25.08 billion (reported as net position).
Of this amount, $(14.45) billion was reported as
"unrestricted net position." A negative balance
indicates that no funds were available for discretionary
purposes.
• The state of Washington’s governmental funds
reported a combined ending fund balance of $19.84
billion, an increase of 1.6 percent compared with the
prior year.
• The state’s capital assets increased by $1.06 billion,
total bond debt increased by $696.0 million, and the
state’s net investment in capital assets is $24.20 billion.
Overview of the Financial Statements
This discussion and analysis is intended to serve as an
introduction to the state of Washington’s basic financial
statements, which include three components: 1)
government-wide financial statements, 2) fund financial statements, and 3) notes to the financial statements. The
focus is on both the state as a whole (government-wide)
and the major individual funds. The dual perspectives
allow the reader to address relevant questions, broaden
the basis for comparison (year-to-year or government-to-
government), and enhance the state’s accountability.
GOVERNMENT-WIDE FINANCIAL STATEMENTS
The government-wide financial statements are designed
to provide readers with a broad overview of the state of
Washington’s finances, in a manner similar to a private
sector business.
Statement of Net Position. The Statement of Net Position presents information on all of the state of
Washington’s assets, deferred outflows of resources,
liabilities, and deferred inflows of resources, with the
difference reported as net position. Over time, increases
or decreases in net position may serve as a useful
indicator of whether the financial position of the state of Washington is improving or deteriorating.
Statement of Activities. The Statement of Activities
presents information showing how the state’s net position
changed during the most recent fiscal year. All changes in
net position are reported as soon as the underlying event
giving rise to the change occurs, regardless of the timing
of related cash flows. Thus, revenues and expenses are
reported in this statement for some items that will result
in cash flows in future fiscal periods (e.g., uncollected
taxes and earned but unused vacation leave). The
Statement of Activities is focused on both the gross and net cost of various activities (including governmental,
business-type, and component unit). This is intended to
summarize and simplify the reader’s analysis of the
revenues and costs of various state activities and the
degree to which activities are subsidized by general
revenues.
Both of these government-wide financial statements
distinguish functions of the state of Washington that are
principally supported by taxes and intergovernmental
revenues (governmental activities) from other functions
that are intended to recover all or a significant portion of their costs through user fees and charges (business-type
activities).
The governmental activities of the state of Washington
include education, human services, transportation, natural
resources, adult corrections, and general government.
The business-type activities of the state of Washington
include the workers’ compensation and unemployment
compensation programs, and various higher education
student services such as housing and dining.
FUND FINANCIAL STATEMENTS
A fund is a group of related accounts used to maintain control over resources that are segregated for specific
activities or objectives. The state of Washington, like
other state and local governments, uses fund accounting
to ensure and demonstrate compliance with finance-
related legal requirements. All of the funds of the state
can be divided into three categories: governmental funds, proprietary funds, and fiduciary funds.
Page 27
Governmental Funds. Governmental funds are used to
account for essentially the same functions reported as
governmental activities in the government-wide financial
statements. However, unlike the government-wide financial statements, governmental fund financial
statements focus on near-term inflows and outflows of
spendable resources, as well as on fund balances at the
end of the fiscal year. Such information may be useful in
evaluating a government’s near-term financing
requirements. In particular, unassigned fund balance may serve as a useful measure of a government’s net resources
available for spending at the end of the fiscal year.
Because the focus of governmental funds is narrower
than that of the government-wide financial statements, it
is useful to compare the information presented for
governmental funds with similar information presented
for governmental activities in the government-wide
financial statements. By doing so, readers may better
understand the long-term impact of the government’s
near-term financing decisions. Both the governmental
fund balance sheet and the governmental fund statement of revenues, expenditures, and changes in fund balances
provide a reconciliation to facilitate this comparison
between governmental funds and governmental activities.
Information is presented separately in the governmental
fund balance sheet and in the governmental fund statement of revenues, expenditures, and changes in fund
balances for three major funds and an aggregate total for
all nonmajor funds. The state’s major governmental funds
are the General Fund, Higher Education Special Revenue
Fund, and the Higher Education Endowment Fund.
Individual fund data for the state’s nonmajor governmental funds are provided in the form of
combining statements elsewhere in this report.
Proprietary Funds. The state of Washington maintains
two different types of proprietary funds. Enterprise funds
are used to report the same functions presented as business-type activities in the government-wide financial
statements. Internal service funds represent an accounting
device used to accumulate and allocate costs internally
among the state of Washington’s various functions. The
state of Washington uses internal service funds to
account for general services such as motor pool, data
processing services, and risk management. Because
internal service funds predominately benefit
governmental rather than business-type functions, they
have been included within governmental activities in the
government-wide financial statements.
Proprietary fund financial statements provide the same
type of information as the government-wide financial
statements, but in greater detail. The proprietary fund
financial statements provide separate information for the
Workers’ Compensation Fund, Unemployment
Compensation Fund, and the Higher Education Student
Services Fund, which are considered to be major funds, as well as an aggregated total for all nonmajor enterprise
funds.
The internal service funds are combined for presentation
purposes. Individual fund data for the state’s nonmajor
proprietary funds are provided in the form of combining statements elsewhere in this report.
Fiduciary Funds. Fiduciary funds are used to account
for resources held for the benefit of parties outside the
government. Fiduciary funds are not reflected in the
government-wide financial statements because the
resources of those funds are not available to support the
state of Washington’s own programs. Washington’s
fiduciary funds also include state administered pension
plans. The accounting used for fiduciary funds is much
like that used for proprietary funds. Individual fund data
for the state’s fiduciary funds are provided in the form of combining statements elsewhere in this report.
Component Units. Component units that are legally
separate from the state and primarily serve or benefit
those outside the state are discretely presented. They are
either financially accountable to the state or have relationships with the state such that exclusion would
cause the state’s financial statements to be misleading or
incomplete. The state discretely reports three major
component units: the Valley Medical Center, the
Washington State Public Stadium Authority, and the
Health Benefit Exchange, as well as four nonmajor component units.
NOTES TO THE FINANCIAL STATEMENTS
The notes provide additional information that is essential
to a full understanding of the data provided in the
government-wide and fund financial statements.
OTHER INFORMATION
This report also presents required supplementary
information on budgetary comparisons, pension plans
and other postemployment benefits information, and infrastructure assets reported using the modified
approach.
The combining statements referred to earlier are
presented immediately following the required
supplementary information.
Page 28
STATE OF WASHINGTON
Statement of Net Position (in millions of dollars)
Governmental
Activities Business-Type
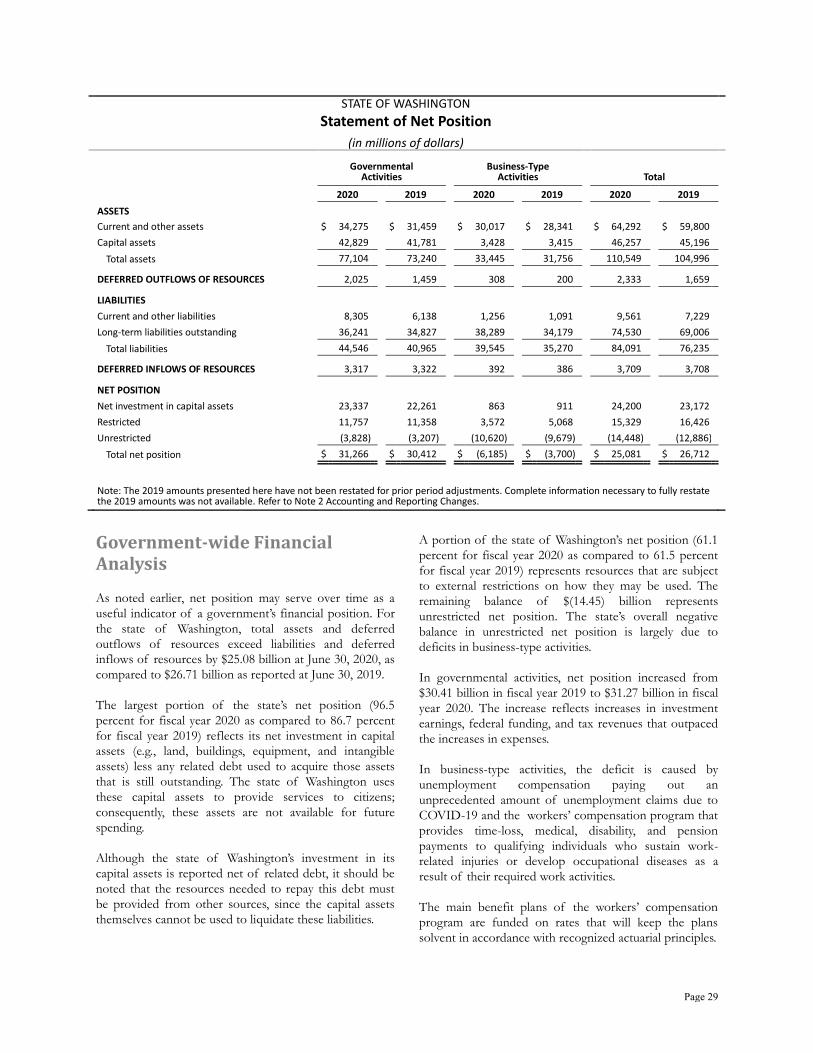
Activities Total 2020 2019 2020 2019 2020 2019 ASSETS Current and other assets $ 34,275 $ 31,459 $ 30,017 $ 28,341 $ 64,292 $ 59,800 Capital assets 42,829 41,781 3,428 3,415 46,257 45,196 Total assets 77,104 73,240 33,445 31,756 110,549 104,996 DEFERRED OUTFLOWS OF RESOURCES 2,025 1,459 308 200 2,333 1,659 LIABILITIES Current and other liabilities 8,305 6,138 1,256 1,091 9,561 7,229 Long-term liabilities outstanding 36,241 34,827 38,289 34,179 74,530 69,006 Total liabilities 44,546 40,965 39,545 35,270 84,091 76,235 DEFERRED INFLOWS OF RESOURCES 3,317 3,322 392 386 3,709 3,708 NET POSITION Net investment in capital assets 23,337 22,261 863 911 24,200 23,172 Restricted 11,757 11,358 3,572 5,068 15,329 16,426 Unrestricted (3,828) (3,207) (10,620) (9,679) (14,448) (12,886) Total net position $ 31,266 $ 30,412 $ (6,185) $ (3,700) $ 25,081 $ 26,712
Note: The 2019 amounts presented here have not been restated for prior period adjustments. Complete information necessary to fully restate the 2019 amounts was not available. Refer to Note 2 Accounting and Reporting Changes.
Government-wide Financial Analysis
As noted earlier, net position may serve over time as a
useful indicator of a government’s financial position. For
the state of Washington, total assets and deferred
outflows of resources exceed liabilities and deferred inflows of resources by $25.08 billion at June 30, 2020, as
compared to $26.71 billion as reported at June 30, 2019.
The largest portion of the state’s net position (96.5
percent for fiscal year 2020 as compared to 86.7 percent
for fiscal year 2019) reflects its net investment in capital assets (e.g., land, buildings, equipment, and intangible
assets) less any related debt used to acquire those assets
that is still outstanding. The state of Washington uses
these capital assets to provide services to citizens;
consequently, these assets are not available for future
spending.
Although the state of Washington’s investment in its
capital assets is reported net of related debt, it should be
noted that the resources needed to repay this debt must
be provided from other sources, since the capital assets
themselves cannot be used to liquidate these liabilities.
A portion of the state of Washington’s net position (61.1
percent for fiscal year 2020 as compared to 61.5 percent
for fiscal year 2019) represents resources that are subject
to external restrictions on how they may be used. The
remaining balance of $(14.45) billion represents
unrestricted net position. The state’s overall negative
balance in unrestricted net position is largely due to
deficits in business-type activities.
In governmental activities, net position increased from
$30.41 billion in fiscal year 2019 to $31.27 billion in fiscal
year 2020. The increase reflects increases in investment
earnings, federal funding, and tax revenues that outpaced
the increases in expenses.
In business-type activities, the deficit is caused by
unemployment compensation paying out an
unprecedented amount of unemployment claims due to
COVID-19 and the workers’ compensation program that
provides time-loss, medical, disability, and pension
payments to qualifying individuals who sustain work-related injuries or develop occupational diseases as a
result of their required work activities.
The main benefit plans of the workers’ compensation
program are funded on rates that will keep the plans
solvent in accordance with recognized actuarial principles.
Page 29
The supplemental pension cost-of-living adjustments
(COLAs) granted for time-loss and disability payments,
however, are funded on a pay-as-you-go basis. By statute,
the state is only allowed to collect enough revenue to fund the current COLA payments.
As previously mentioned, the state’s activities are divided
between governmental and business-type. The majority
of support for governmental activities comes from taxes
and intergovernmental grants, while business-type activities are supported primarily through user charges.
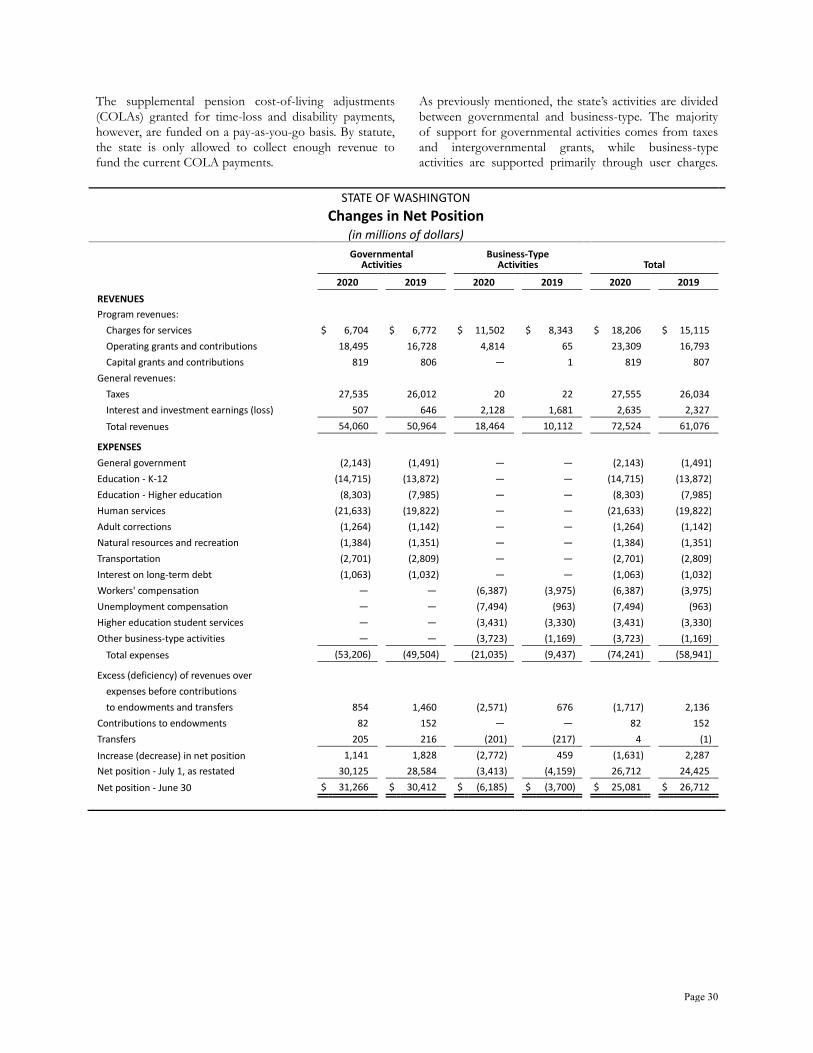
STATE OF WASHINGTON
Changes in Net Position (in millions of dollars)
Governmental
Activities Business-Type
Activities Total 2020 2019 2020 2019 2020 2019 REVENUES Program revenues: Charges for services $ 6,704 $ 6,772 $ 11,502 $ 8,343 $ 18,206 $ 15,115 Operating grants and contributions 18,495 16,728 4,814 65 23,309 16,793 Capital grants and contributions 819 806 — 1 819 807 General revenues: Taxes 27,535 26,012 20 22 27,555 26,034 Interest and investment earnings (loss) 507 646 2,128 1,681 2,635 2,327 Total revenues 54,060 50,964 18,464 10,112 72,524 61,076 EXPENSES General government (2,143) (1,491) — — (2,143) (1,491) Education - K-12 (14,715) (13,872) — — (14,715) (13,872) Education - Higher education (8,303) (7,985) — — (8,303) (7,985) Human services (21,633) (19,822) — — (21,633) (19,822) Adult corrections (1,264) (1,142) — — (1,264) (1,142) Natural resources and recreation (1,384) (1,351) — — (1,384) (1,351) Transportation (2,701) (2,809) — — (2,701) (2,809) Interest on long-term debt (1,063) (1,032) — — (1,063) (1,032) Workers' compensation — — (6,387) (3,975) (6,387) (3,975) Unemployment compensation — — (7,494) (963) (7,494) (963) Higher education student services — — (3,431) (3,330) (3,431) (3,330) Other business-type activities — — (3,723) (1,169) (3,723) (1,169) Total expenses (53,206) (49,504) (21,035) (9,437) (74,241) (58,941) Excess (deficiency) of revenues over expenses before contributions to endowments and transfers 854 1,460 (2,571) 676 (1,717) 2,136 Contributions to endowments 82 152 — — 82 152 Transfers 205 216 (201) (217) 4 (1) Increase (decrease) in net position 1,141 1,828 (2,772) 459 (1,631) 2,287 Net position - July 1, as restated 30,125 28,584 (3,413) (4,159) 26,712 24,425 Net position - June 30 $ 31,266 $ 30,412 $ (6,185) $ (3,700) $ 25,081 $ 26,712
Page 30

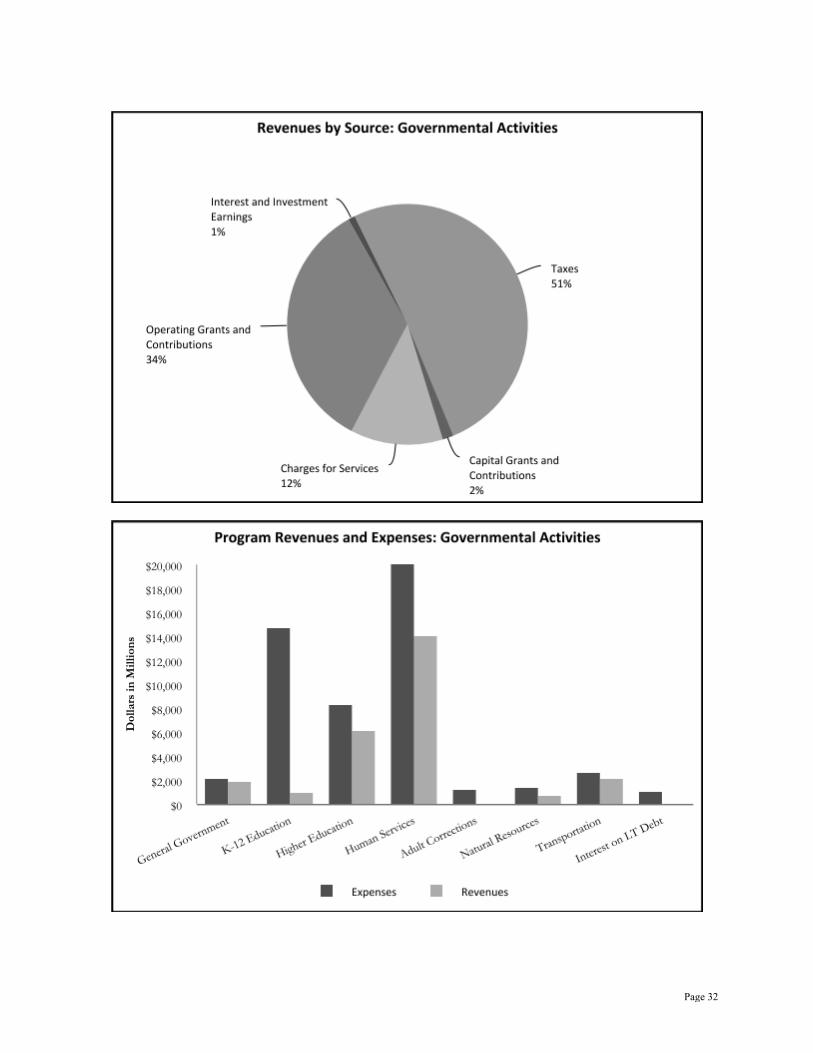
Governmental Activities. Governmental activities
resulted in an increase in the state of Washington’s net
position of $1.14 billion. A number of factors were in
play including increases in tax revenues and federal grants greater than spending increases on K-12 education and
human services.
• Tax revenues increased by $1.52 billion in fiscal year
2020 as compared to fiscal year 2019 reflecting
continuing strength in the property values and real estate sales. Sales and use tax, which are the main tax
revenue for governmental activities, reported a slight
decrease of $5.5 million. Business and occupation tax
increased by $220.8 million. Property tax revenue
increased by $770.5 million as property values
continue to rise. Revenue from real estate excise taxes,
levied on the sale of real estate, increased by $141.8
million.
• Operating grants and contributions grew by $1.77
billion in fiscal year 2020 compared with 2019 as
federal grants increased in response to COVID-19, and were matched with an increase in human services
operating grant expenses as the state responded to the
COVID-19 crisis. The state of Washington received
$2.2 billion in federal Coronavirus Relief Funds from
the U.S. Department of the Treasury under the
Coronavirus Aid, Relief, and Economic Security Act (CARES) Act during fiscal year 2020. As of June 30,
2020, $1.8 billion of this is unspent and is classified
as unearned revenue.
• Expenses grew by $842.7 million for K-12 education
in 2020 as compared to fiscal year 2019. This is the
state's continued commitment to meet the needs of
K-12 education.
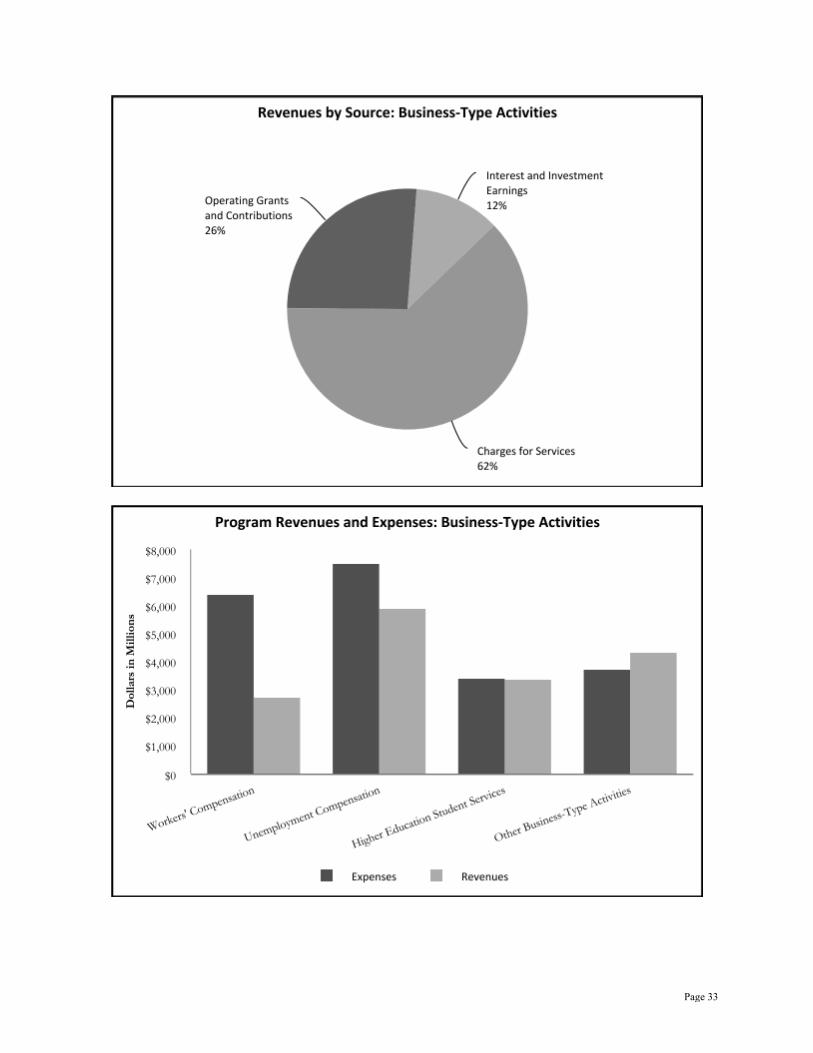
Business-Type Activities. Business-type activities
decreased the state of Washington’s net position by $2.77
billion. Key factors contributing to the operating results
of business-type activities are:
• The workers’ compensation activity decrease in net
position in fiscal year 2020 was $1.83 billion compared
to an increase of $147.7 million in fiscal year 2019.
Claim costs increased by $2.33 billion in fiscal year
2020 as compared with fiscal year 2019. This increase is largely the result of actuarial assumption changes in
the Supplemental Pension Fund which are reflected as
an increase in current fiscal year claims expense.
Investment income increased by $390.7 million as
compared to fiscal year 2019. The workers’
compensation portfolio is 81.1 percent debt securities.
• The unemployment compensation activity reported an
operating loss in fiscal year 2020 of $1.61 billion
compared to an operating gain of $134.6 million in
fiscal year 2019. Unemployment insurance benefits
increased by $6.53 billion in fiscal year 2020 over fiscal year 2019 due to an increase in unemployment caused
by closing of businesses in response to COVID-19.
With this higher rate of claims, the Employment
Security Department was subject to a higher rate of
unemployment fraud. The Unemployment
Compensation Fund accounts receivable and allowance for doubtful accounts balances include
$198.2 million and $166.5 million, respectively, related
to the increased imposter fraud the fund experienced
after the start of the COVID-19 pandemic. The
unemployment rate for the state for June 2020 was 9.8
percent, almost double the unemployment rate for June 2019.
• The Higher Education Student Services activities
reported relatively proportional increases in both
operating revenues and expenses when compared to
the prior year.
Page 31
Page 32
Page 33

Financial Analysis of the State’s Funds
As noted earlier, the state of Washington uses fund
accounting to ensure and demonstrate compliance with
finance-related legal requirements.
Governmental Funds. As previously discussed, the focus of the state of Washington’s governmental funds is
to provide information on near-term inflows, outflows,
and fund balances. Such information is useful in assessing
the state of Washington’s financing requirements.
Fund Balances. At June 30, 2020, the state’s governmental funds reported combined ending fund
balances of $19.84 billion. Of this amount, $3.25 billion
or 16.4 percent is nonspendable, either due to its form or
legal constraints; and $6.31 billion or 31.8 percent is
restricted for specific programs by external constraints,
constitutional provisions, or contractual obligations. An
additional $7.82 billion or 39.4 percent of total fund
balance has been committed to specific purposes.
Committed amounts cannot be used for any other purpose unless approved by the Legislature. An additional
$1.83 billion or 9.2 percent of total fund balance has been
assigned to specific purposes by management.
The General Fund is the chief operating fund of the state
of Washington. The fund balance decreased by $70.4 million in fiscal year 2020, as compared to a $580.5
million decrease in fiscal year 2019. Increased revenues
from taxes and federal aid and spending increases in K-12
education and health services, caused by the COVID-19
response, were the key contributing factors. Assigned
fund balance of $1.74 billion is reported for fiscal year
2020 and relates to certain accrued and non-cash
revenues which are not considered by management to be
available for budgetary purposes.
STATE OF WASHINGTON
General Fund
(in millions of dollars)
Fiscal Year Difference Increase
(Decrease) 2020 - 2019
2020 2019 REVENUES Taxes $ 23,496 $ 21,801 $ 1,695 Federal grants 14,512 13,296 1,216 Investment revenue (loss) 114 114 — Other 855 852 3 Total 38,977 36,063 2,914 EXPENDITURES Human services 21,366 19,754 1,612 Education 15,090 14,762 328 Other 1,859 1,710 149 Total 38,315 36,226 2,089 Net transfers in (out) (838) (598) (240) Other financing sources 106 180 (74) Net increase (decrease) in fund balance $ (70) $ (581) $ 511
General Fund expenditures continue to be concentrated in services and programs most vital to citizens – primarily human services and public education.
In addition to the General Fund, the state reports the
Higher Education Special Revenue and the Higher
Education Endowment Funds as major governmental
funds. Significant changes in these funds are as follows:
• The change in fund balance of the Higher Education
Special Revenue Fund in fiscal year 2020 was an
increase of $31.3 million compared to an increase of
$1.10 billion in fiscal year 2019.
• The fund balance for the Higher Education
Endowment Fund increased by $26.8 million in fiscal
Page 34
year 2020. The increase is a result of positive growth
in investment earnings.
Proprietary Funds. The state of Washington’s
proprietary funds financial statements provide the same type of information found in the government-wide
financial statements, but in more detail. Significant
changes reported in fiscal year 2020 are as follows:
• The Workers’ Compensation Fund reported a decrease in net position of $1.83 billion in fiscal year
2020. Operating revenues decreased by $45.3 million
and operating expenses increased by $2.41 billion as
compared to fiscal year 2019. As previously stated,
claim costs increased by $2.33 billion in fiscal year
2020 as compared with fiscal year 2019. This increase is largely the result of actuarial assumption changes in
the Supplemental Pension Fund which are reflected as
an increase in current fiscal year claims expense.
Investment income increased $390.7 million over
fiscal year 2019.
• Washington’s Unemployment Compensation Fund
reported a decrease in net position of $1.50 billion.
While unemployment benefit claims expense increased
by $6.53 billion in fiscal year 2020 as compared to
2019, unemployment premiums and assessments
increased by $108.6 million and federal aid increased by $4.7 billion in fiscal year 2020 as compared to
2019. As previously stated, unemployment insurance
benefits increased due to an increase in unemployment
caused by closing of businesses in response to
COVID-19. Investment income increased by $1.32
million over fiscal year 2019.
• The Higher Education Student Services Fund reported
consistent activity when compared to the prior year.
The nonmajor enterprise funds had an addition of a
new fund, the Health Insurance Fund, that was
changed from an internal service fund due to the addition of local school district employees.
General Fund Budgetary Highlights
Differences between the original budget of the General
Fund and the final amended budget reflect increases in
mandatory costs driven by rising caseloads and school enrollment as well as other high priority needs. Changes
to estimates are summarized as follows:
• Estimated biennial resources increased by $3.30 billion
over the course of the fiscal year. The major increase
in estimated resources is additional property tax and federal grants-in-aid.
• Appropriated expenditure authority increased by $1.29
billion over the course of the fiscal year to address
increases in the state’s health program's and general
government agencies' response to COVID-19.
The state did not overspend its legal spending authority
for the 2019-21 biennium. Actual General Fund revenues
and expenditures were 52.0 and 47.0 percent of final
budgeted resources and appropriations, respectively, for
the 2019-21 biennium.
Page 35
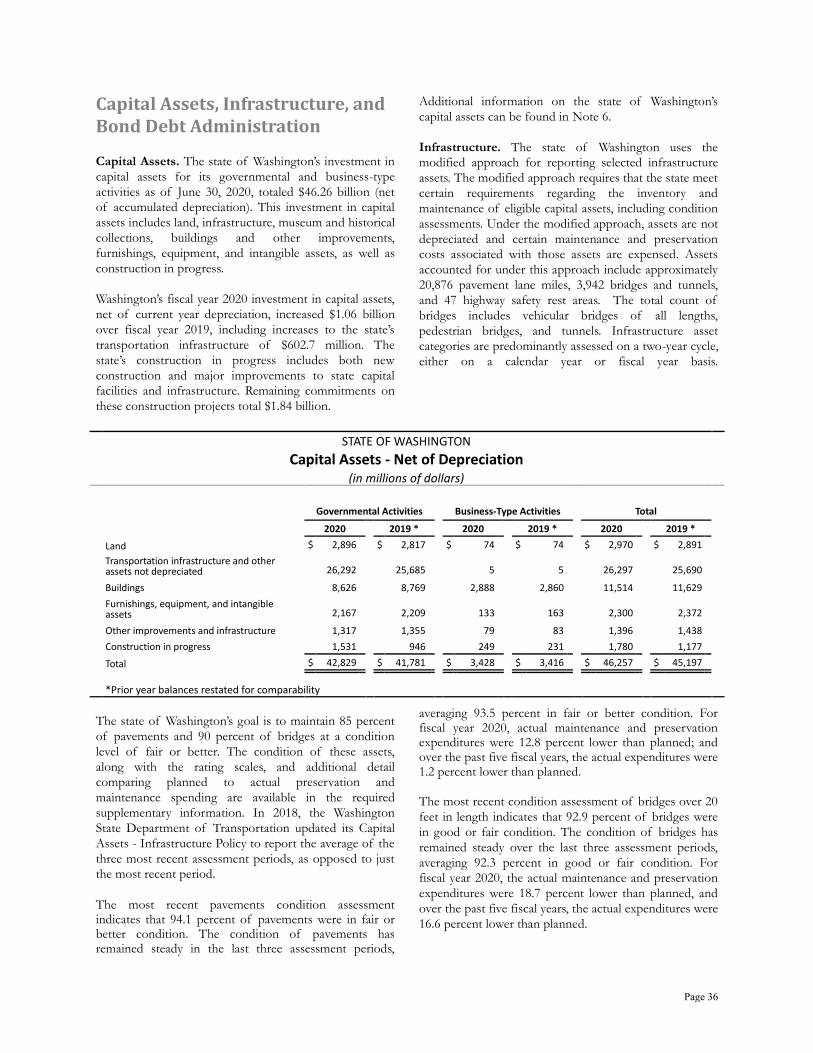
Capital Assets, Infrastructure, and Bond Debt Administration
Capital Assets. The state of Washington’s investment in
capital assets for its governmental and business-type
activities as of June 30, 2020, totaled $46.26 billion (net of accumulated depreciation). This investment in capital
assets includes land, infrastructure, museum and historical
collections, buildings and other improvements,
furnishings, equipment, and intangible assets, as well as
construction in progress.
Washington’s fiscal year 2020 investment in capital assets,
net of current year depreciation, increased $1.06 billion
over fiscal year 2019, including increases to the state’s
transportation infrastructure of $602.7 million. The
state’s construction in progress includes both new
construction and major improvements to state capital facilities and infrastructure. Remaining commitments on
these construction projects total $1.84 billion.
Additional information on the state of Washington’s
capital assets can be found in Note 6.
Infrastructure. The state of Washington uses the modified approach for reporting selected infrastructure
assets. The modified approach requires that the state meet
certain requirements regarding the inventory and
maintenance of eligible capital assets, including condition
assessments. Under the modified approach, assets are not
depreciated and certain maintenance and preservation costs associated with those assets are expensed. Assets
accounted for under this approach include approximately
20,876 pavement lane miles, 3,942 bridges and tunnels,
and 47 highway safety rest areas. The total count of
bridges includes vehicular bridges of all lengths,
pedestrian bridges, and tunnels. Infrastructure asset
categories are predominantly assessed on a two-year cycle,
either on a calendar year or fiscal year basis.
STATE OF WASHINGTON
Capital Assets - Net of Depreciation (in millions of dollars)
Governmental Activities Business-Type Activities Total 2020 2019 * 2020 2019 * 2020 2019 * Land $ 2,896 $ 2,817 $ 74 $ 74 $ 2,970 $ 2,891
Transportation infrastructure and other assets not depreciated 26,292 25,685 5 5 26,297 25,690
Buildings 8,626 8,769 2,888 2,860 11,514 11,629
Furnishings, equipment, and intangible assets 2,167 2,209 133 163 2,300 2,372
Other improvements and infrastructure 1,317 1,355 79 83 1,396 1,438 Construction in progress 1,531 946 249 231 1,780 1,177 Total $ 42,829 $ 41,781 $ 3,428 $ 3,416 $ 46,257 $ 45,197
*Prior year balances restated for comparability The state of Washington’s goal is to maintain 85 percent
of pavements and 90 percent of bridges at a condition
level of fair or better. The condition of these assets,
along with the rating scales, and additional detail comparing planned to actual preservation and
maintenance spending are available in the required
supplementary information. In 2018, the Washington
State Department of Transportation updated its Capital
Assets - Infrastructure Policy to report the average of the
three most recent assessment periods, as opposed to just the most recent period.
The most recent pavements condition assessment indicates that 94.1 percent of pavements were in fair or better condition. The condition of pavements has remained steady in the last three assessment periods,
averaging 93.5 percent in fair or better condition. For fiscal year 2020, actual maintenance and preservation expenditures were 12.8 percent lower than planned; and over the past five fiscal years, the actual expenditures were 1.2 percent lower than planned.
The most recent condition assessment of bridges over 20
feet in length indicates that 92.9 percent of bridges were
in good or fair condition. The condition of bridges has
remained steady over the last three assessment periods,
averaging 92.3 percent in good or fair condition. For fiscal year 2020, the actual maintenance and preservation
expenditures were 18.7 percent lower than planned, and
over the past five fiscal years, the actual expenditures were
16.6 percent lower than planned.
Page 36

Bond Debt. At the end of fiscal year 2020, the state of
Washington had general obligation bond debt outstanding
including accreted interest and issuance premiums of
$20.15 billion, an increase of 2.1 percent from fiscal year 2019. This debt is secured by a pledge of the full faith
and credit of the state. Additionally, the state had
authorized $13.83 billion general obligation debt that
remains unissued.
General obligation debt is subject to the limitation prescribed by the state Constitution. The aggregate debt
contracted by the state as of June 30, 2020, does not
exceed that amount for which payments of principal and
interest in any fiscal year would require the state to
expend more than 8.3 percent of the arithmetic mean of
its general state revenues for the six immediately
preceding fiscal years. The arithmetic mean of its general
state revenues for fiscal years 2015-2020 is $19.39 billion.
The debt service limitation, 8.3 percent of this mean, is
$1.60 billion. The state’s maximum annual debt service as
of June 30, 2020, subject to the constitutional debt
limitation is $1.22 billion, or $382.0 million less than the
debt service limitation.
For further information on the debt limit, refer to Schedule 11 in the statistical section of this report or the
Report on the State of Washington's Debt Limitation,
available from the Office of the State Treasurer at
https://www.tre.wa.gov/ wp-content/ uploads/ Debt-
Limit-Certification-2020-for-the-web.pdf.
By statutory provision, the State Finance Committee
(SFC) is authorized to supervise and control the issuance
of all state bonds, notes, or other evidences of
indebtedness. The SFC is composed of the Governor,
Lieutenant Governor, and State Treasurer, the latter
serving as chairperson.
As of June 30, 2020, the state of Washington's general
obligation debt was rated Aaa by Moody's Investor
Service, AA+ by Standard & Poor's Rating Group, and
AA+ by Fitch Ratings.
STATE OF WASHINGTON
Bond Debt (in millions of dollars)
Governmental Activities Business-Type Activities Total 2020 2019 2020 2019 2020 2019 General obligation (GO) bonds $ 19,794 $ 19,333 $ — $ — $ 19,794 $ 19,333
Accreted interest on zero interest rate GO bonds 359 401 — — 359 401
Revenue bonds 2,033 2,188 2,235 2,137 4,268 4,325 Unamortized premium on bonds sold 2,132 1,798 180 180 2,312 1,978 Total $ 24,318 $ 23,720 $ 2,415 $ 2,317 $ 26,733 $ 26,037
The state had revenue debt outstanding at June 30, 2020,
of $4.27 billion, a decrease of $57.0 million compared to
fiscal year 2019. The decrease is primarily related to the
state colleges and universities not issuing as many revenue bonds as in prior years. This debt is not supported or
intended to be supported by the full faith and credit of
the state. Revenue bond debt is generally secured by
specific sources of revenue. The exceptions are the
University of Washington and Washington State
University which issue general revenue bonds that are payable from general revenues of each university.
General obligation and revenue bonds totaling $620.2
million were refunded during the year. Washington’s
refunding activity produced $73.0 million in gross debt
service savings.
Additional information on the state’s bond debt
obligations is presented in Note 7.
Conditions with Expected Future Impact
Economic Outlook. Washington, like many states, is
reeling from the impact of COVID-19 on businesses.
The state's aerospace industry has been impacted severely with the decrease in demand for air transportation, while
the knowledge-based industries including information
technology, health, business, and financial services has
faired better. Washington’s strong housing market and
continued sales have had a positive effect on revenue
growth. Further loss of jobs could have a negative impact on revenues and could result in an increase in demand for
Page 37
services from the state. Until the COVID-19 infection
rate is under control, the economic outlook will be
difficult to predict.
Rainy Day Account. In November 2007, Washington
state voters ratified Engrossed Substitute Senate Joint
Resolution 8206, amending the Washington Constitution
and establishing the Budget Stabilization Account (BSA).
The state's Constitution details a limited number of
circumstances under which funds can be appropriated from the BSA, one of which is a favorable vote of at least
three-fifths of the members of each house of the
Legislature.
On June 30, 2020, $236.8 million was transferred to the
BSA from the General Fund in accordance with the
provisions of the Constitution. During fiscal year 2020,
by three-fifths vote of each house, the Legislature
appropriated $200.0 million from the BSA for additional
state expenditures, COVID-19 emergency services,
emergency fire service mobilization, fire suppression, and fire damage recovery costs. The BSA had a fund balance
of $1.68 billion as of June 30, 2020.
Requests for Information
This financial report is designed to provide a general
overview of the state of Washington’s finances.
Questions concerning any of the information provided in
this report or requests for additional financial information
should be addressed to the Office of Financial Management, Accounting Division, P.O. Box 43127,
Olympia, WA 98504-3127.
Page 38
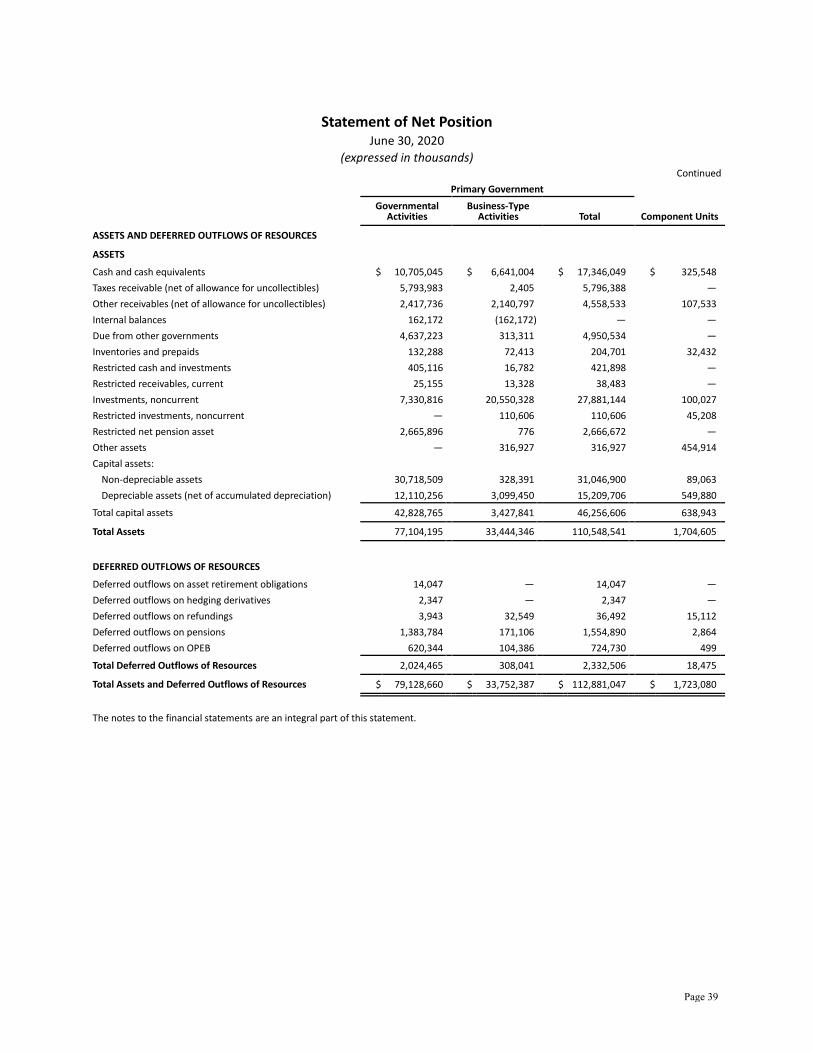
Statement of Net Position June 30, 2020
(expressed in thousands) Continued
Primary Government
Governmental
Activities Business-Type
Activities Total Component Units
ASSETS AND DEFERRED OUTFLOWS OF RESOURCES ASSETS Cash and cash equivalents $ 10,705,045 $ 6,641,004 $ 17,346,049 $ 325,548 Taxes receivable (net of allowance for uncollectibles) 5,793,983 2,405 5,796,388 — Other receivables (net of allowance for uncollectibles) 2,417,736 2,140,797 4,558,533 107,533 Internal balances 162,172 (162,172) — — Due from other governments 4,637,223 313,311 4,950,534 — Inventories and prepaids 132,288 72,413 204,701 32,432 Restricted cash and investments 405,116 16,782 421,898 — Restricted receivables, current 25,155 13,328 38,483 — Investments, noncurrent 7,330,816 20,550,328 27,881,144 100,027 Restricted investments, noncurrent — 110,606 110,606 45,208 Restricted net pension asset 2,665,896 776 2,666,672 — Other assets — 316,927 316,927 454,914 Capital assets:
Non-depreciable assets 30,718,509 328,391 31,046,900 89,063 Depreciable assets (net of accumulated depreciation) 12,110,256 3,099,450 15,209,706 549,880
Total capital assets 42,828,765 3,427,841 46,256,606 638,943 Total Assets 77,104,195 33,444,346 110,548,541 1,704,605 DEFERRED OUTFLOWS OF RESOURCES Deferred outflows on asset retirement obligations 14,047 — 14,047 — Deferred outflows on hedging derivatives 2,347 — 2,347 — Deferred outflows on refundings 3,943 32,549 36,492 15,112 Deferred outflows on pensions 1,383,784 171,106 1,554,890 2,864 Deferred outflows on OPEB 620,344 104,386 724,730 499 Total Deferred Outflows of Resources 2,024,465 308,041 2,332,506 18,475 Total Assets and Deferred Outflows of Resources $ 79,128,660 $ 33,752,387 $ 112,881,047 $ 1,723,080
The notes to the financial statements are an integral part of this statement.
Page 39
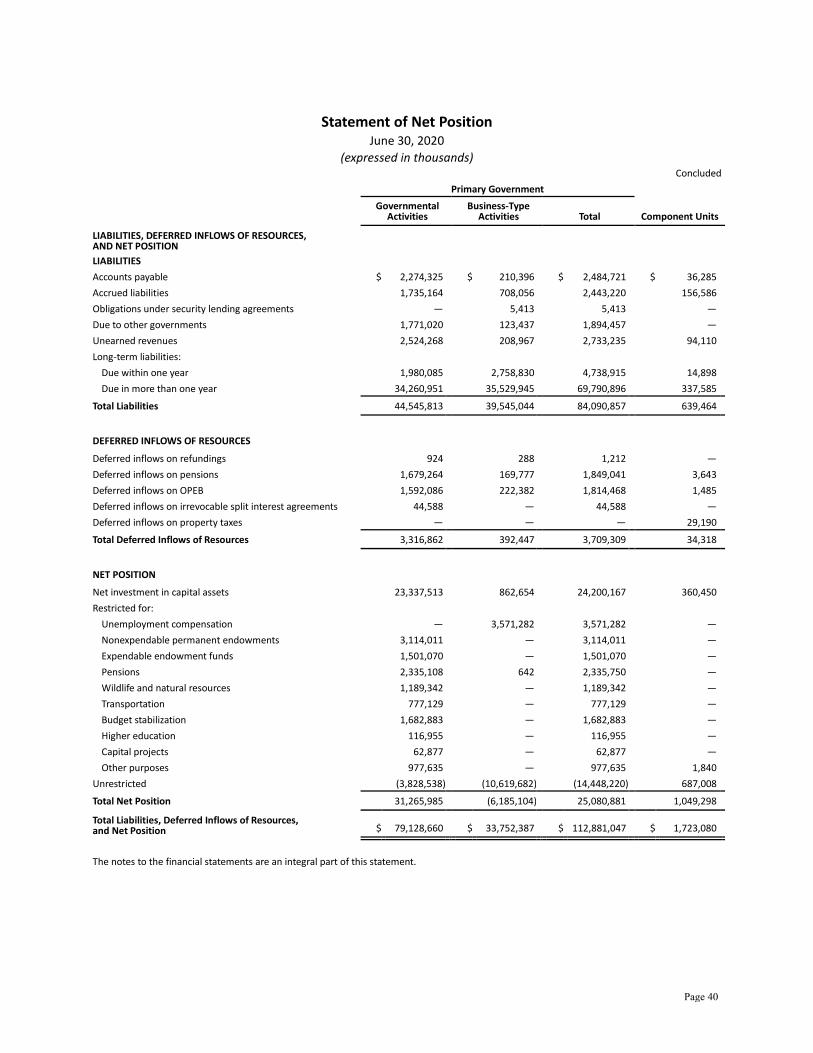
Statement of Net Position June 30, 2020
(expressed in thousands) Concluded
Primary Government
Governmental
Activities Business-Type
Activities Total Component Units
LIABILITIES, DEFERRED INFLOWS OF RESOURCES, AND NET POSITION LIABILITIES Accounts payable $ 2,274,325 $ 210,396 $ 2,484,721 $ 36,285 Accrued liabilities 1,735,164 708,056 2,443,220 156,586 Obligations under security lending agreements — 5,413 5,413 — Due to other governments 1,771,020 123,437 1,894,457 — Unearned revenues 2,524,268 208,967 2,733,235 94,110 Long-term liabilities:
Due within one year 1,980,085 2,758,830 4,738,915 14,898 Due in more than one year 34,260,951 35,529,945 69,790,896 337,585
Total Liabilities 44,545,813 39,545,044 84,090,857 639,464 DEFERRED INFLOWS OF RESOURCES Deferred inflows on refundings 924 288 1,212 — Deferred inflows on pensions 1,679,264 169,777 1,849,041 3,643 Deferred inflows on OPEB 1,592,086 222,382 1,814,468 1,485 Deferred inflows on irrevocable split interest agreements 44,588 — 44,588 — Deferred inflows on property taxes — — — 29,190 Total Deferred Inflows of Resources 3,316,862 392,447 3,709,309 34,318 NET POSITION Net investment in capital assets 23,337,513 862,654 24,200,167 360,450 Restricted for:
Unemployment compensation — 3,571,282 3,571,282 — Nonexpendable permanent endowments 3,114,011 — 3,114,011 — Expendable endowment funds 1,501,070 — 1,501,070 — Pensions 2,335,108 642 2,335,750 — Wildlife and natural resources 1,189,342 — 1,189,342 — Transportation 777,129 — 777,129 — Budget stabilization 1,682,883 — 1,682,883 — Higher education 116,955 — 116,955 — Capital projects 62,877 — 62,877 — Other purposes 977,635 — 977,635 1,840
Unrestricted (3,828,538) (10,619,682) (14,448,220) 687,008 Total Net Position 31,265,985 (6,185,104) 25,080,881 1,049,298 Total Liabilities, Deferred Inflows of Resources, and Net Position $ 79,128,660 $ 33,752,387 $ 112,881,047 $ 1,723,080
The notes to the financial statements are an integral part of this statement.
Page 40
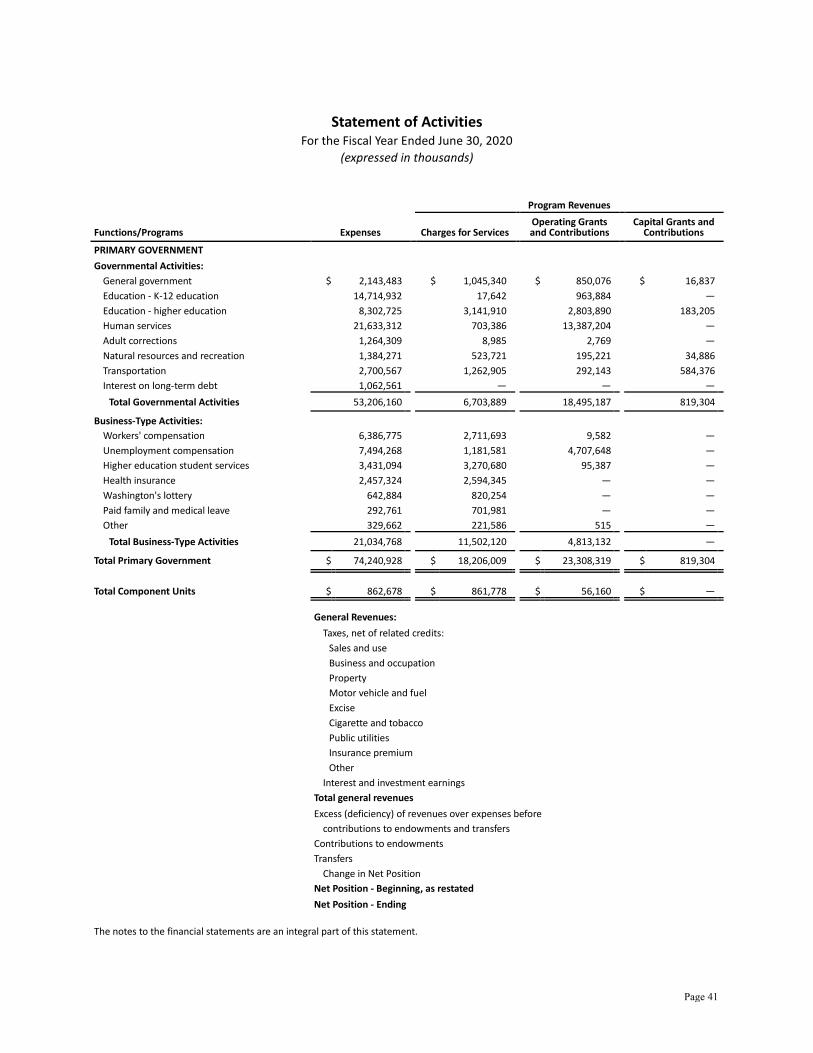
Statement of Activities For the Fiscal Year Ended June 30, 2020
(expressed in thousands) Program Revenues
Functions/Programs Expenses Charges for Services Operating Grants and Contributions
Capital Grants and Contributions
PRIMARY GOVERNMENT Governmental Activities:
General government $ 2,143,483 $ 1,045,340 $ 850,076 $ 16,837 Education - K-12 education 14,714,932 17,642 963,884 — Education - higher education 8,302,725 3,141,910 2,803,890 183,205 Human services 21,633,312 703,386 13,387,204 — Adult corrections 1,264,309 8,985 2,769 — Natural resources and recreation 1,384,271 523,721 195,221 34,886 Transportation 2,700,567 1,262,905 292,143 584,376 Interest on long-term debt 1,062,561 — — —
Total Governmental Activities 53,206,160 6,703,889 18,495,187 819,304 Business-Type Activities:
Workers' compensation 6,386,775 2,711,693 9,582 — Unemployment compensation 7,494,268 1,181,581 4,707,648 — Higher education student services 3,431,094 3,270,680 95,387 — Health insurance 2,457,324 2,594,345 — — Washington's lottery 642,884 820,254 — — Paid family and medical leave 292,761 701,981 — — Other 329,662 221,586 515 —
Total Business-Type Activities 21,034,768 11,502,120 4,813,132 — Total Primary Government $ 74,240,928 $ 18,206,009 $ 23,308,319 $ 819,304
Total Component Units $ 862,678 $ 861,778 $ 56,160 $ — General Revenues: Taxes, net of related credits: Sales and use Business and occupation Property Motor vehicle and fuel Excise Cigarette and tobacco Public utilities Insurance premium Other Interest and investment earnings Total general revenues Excess (deficiency) of revenues over expenses before contributions to endowments and transfers Contributions to endowments Transfers Change in Net Position Net Position - Beginning, as restated Net Position - Ending The notes to the financial statements are an integral part of this statement.
Page 41

Net (Expense) Revenue and Changes in Net Position
Primary Government Governmental
Activities Business-Type
Activities Total Component Units
$ (231,230) $ — $ (231,230)
(13,733,406) — (13,733,406) (2,173,720) — (2,173,720) (7,542,722) — (7,542,722) (1,252,555) — (1,252,555)
(630,443) — (630,443) (561,143) — (561,143)
(1,062,561) — (1,062,561) (27,187,780) — (27,187,780)
— (3,665,500) (3,665,500) — (1,605,039) (1,605,039) — (65,027) (65,027) — 137,021 137,021 — 177,370 177,370 — 409,220 409,220 — (107,561) (107,561) — (4,719,516) (4,719,516)
$ (27,187,780) $ (4,719,516) $ (31,907,296)
$ 55,260
12,100,739 — 12,100,739 — 4,672,823 — 4,672,823 — 4,133,088 — 4,133,088 24,003 1,549,624 — 1,549,624 — 1,777,328 19,784 1,797,112 —
390,317 — 390,317 — 481,007 — 481,007 — 691,393 — 691,393 —
1,738,613 — 1,738,613 558 507,272 2,127,841 2,635,113 12,661
28,042,204 2,147,625 30,189,829 37,222 854,424 (2,571,891) (1,717,467) 92,482
81,966 — 81,966 —
204,805 (200,688) 4,117 — 1,141,195 (2,772,579) (1,631,384) 92,482
30,124,790 (3,412,525) 26,712,265 956,816 $ 31,265,985 $ (6,185,104) $ 25,080,881 $ 1,049,298
Page 42

Balance Sheet GOVERNMENTAL FUNDS
June 30, 2020 (expressed in thousands)
General Higher Education Special Revenue
Higher Education Endowment
Nonmajor Governmental
Funds Total
ASSETS AND DEFERRED OUTFLOWS OF RESOURCES ASSETS Cash and cash equivalents $ 4,646,370 $ 784,423 $ 766,954 $ 3,900,849 $ 10,098,596 Investments 111,709 2,558,438 4,348,689 295,625 7,314,461 Taxes receivable (net of allowance) 5,490,313 75,269 — 228,401 5,793,983 Receivables (net of allowance) 769,978 678,449 25,750 925,191 2,399,368 Due from other funds 519,836 813,104 18 351,825 1,684,783 Due from other governments 1,740,232 174,416 76 2,570,337 4,485,061 Inventories and prepaids 17,383 33,030 — 48,843 99,256 Restricted cash and investments 85,026 691 460 181,345 267,522 Restricted receivables — 20,599 — 870 21,469 Total Assets 13,380,847 5,138,419 5,141,947 8,503,286 32,164,499 DEFERRED OUTFLOWS OF RESOURCES Deferred outflows on hedging derivatives — — — 2,347 2,347 Total Deferred Outflows of Resources — — — 2,347 2,347 Total Assets and Deferred Outflows of Resources $ 13,380,847 $ 5,138,419 $ 5,141,947 $ 8,505,633 $ 32,166,846
LIABILITIES, DEFERRED INFLOWS OF RESOURCES, AND FUND BALANCES LIABILITIES Accounts payable $ 1,581,611 $ 135,729 $ 68,344 $ 437,109 $ 2,222,793 Accrued liabilities 444,798 621,530 60,673 163,578 1,290,579 Due to other funds 335,885 24,869 515,676 597,143 1,473,573 Due to other governments 1,390,982 51,789 — 171,634 1,614,405 Unearned revenue 1,952,369 280,615 — 287,598 2,520,582 Claims and judgments payable 52,104 — — 129,214 181,318 Total Liabilities 5,757,749 1,114,532 644,693 1,786,276 9,303,250 DEFERRED INFLOWS OF RESOURCES Unavailable revenue 2,843,981 22,013 18,773 90,064 2,974,831 Deferred inflows on irrevocable split interest agreements — — 44,588 — 44,588
Total Deferred Inflows of Resources 2,843,981 22,013 63,361 90,064 3,019,419 FUND BALANCES Nonspendable fund balance 52,407 33,031 2,885,769 277,085 3,248,292 Restricted fund balance 1,734,102 76,128 1,548,124 2,949,537 6,307,891 Committed fund balance 598,772 3,800,084 — 3,423,078 7,821,934 Assigned fund balance 1,740,952 92,631 — — 1,833,583 Unassigned fund balance 652,884 — — (20,407) 632,477 Total Fund Balances 4,779,117 4,001,874 4,433,893 6,629,293 19,844,177 Total Liabilities, Deferred Inflows of Resources, and Fund Balances $ 13,380,847 $ 5,138,419 $ 5,141,947 $ 8,505,633 $ 32,166,846
The notes to the financial statements are an integral part of this statement.
Page 43

Reconciliation of the Balance Sheet to the
Statement of Net Position
GOVERNMENTAL FUNDS June 30, 2020
(expressed in thousands) Total Fund Balances for Governmental Funds $ 19,844,177 Amounts reported for governmental activities in the Statement of Net Position are different because:
Capital assets used in governmental activities are not financial resources and therefore are not reported in the funds. These assets consist of:
Non-depreciable assets $ 30,706,195 Depreciable assets 22,856,055 Less: Accumulated depreciation (11,530,226)
Total capital assets 42,032,024
Some of the state's revenues will be collected after year-end, but are not available soon enough to pay for the current period's expenditures, and therefore are considered deferred inflows in the funds. 2,974,831
Certain pension trust funds have been funded in excess of the annual required contributions, creating a year-end asset. This asset is not a financial resource and therefore is not reported in the funds. 2,665,896
Deferred outflows of resources represent a consumption of fund equity that will be reported as an outflow of resources in a future period and therefore are not reported in the funds.
1,936,763
Deferred inflows of resources represent an acquisition of fund equity that will be recognized as an inflow of resources in a future period and therefore are not reported in the funds.
(3,131,777)
Unmatured interest on general obligation bonds is not recognized in the funds until due. (395,321)
Internal service funds are used by management to charge the costs of certain activities to individual funds. The assets and liabilities of the internal service funds are included in governmental activities in the Statement of Net Position. (996,560)
Some liabilities are not due and payable in the current period and therefore are not reported in the funds. Those liabilities consist of:
Bonds and other financing contracts payable $ (24,078,664) Accreted interest on bonds (359,293) Compensated absences (738,770) Other postemployment benefits obligations (4,885,626) Net pension liability (2,791,100) Unclaimed property (245,763) Pollution remediation obligations (175,852) Claims and judgments (39,287) Asset retirement obligation (27,939) Other obligations (321,754)
Total long-term liabilities (33,664,048) Net Position of Governmental Activities $ 31,265,985 The notes to the financial statements are an integral part of this statement.
Page 44

Statement of Revenues, Expenditures, and Changes in Fund Balances
GOVERNMENTAL FUNDS For the Fiscal Year Ended June 30, 2020
(expressed in thousands)
General Higher Education Special Revenue
Higher Education Endowment
Nonmajor Governmental
Funds Total
REVENUES Retail sales and use taxes $ 11,984,575 $ — $ — $ 116,164 $ 12,100,739 Business and occupation taxes 4,596,484 71,318 — 5,021 4,672,823 Property taxes 3,738,779 — — — 3,738,779 Excise taxes 1,141,648 115,575 — 520,105 1,777,328 Motor vehicle and fuel taxes — — — 1,549,624 1,549,624 Other taxes 2,034,465 717,918 — 438,947 3,191,330 Licenses, permits, and fees 138,978 1,112 — 1,805,042 1,945,132 Other contracts and grants 325,966 1,390,562 — 158,474 1,875,002 Timber sales 4,559 — 14,290 134,578 153,427 Federal grants-in-aid 14,511,874 1,559,558 — 1,368,055 17,439,487 Charges for services 50,472 2,847,241 — 692,967 3,590,680 Investment income (loss) 114,104 133,980 137,746 121,442 507,272 Miscellaneous revenue 221,349 177,264 4,688 542,128 945,429 Contributions and donations — — 81,966 — 81,966 Unclaimed property 114,157 — — — 114,157 Total Revenues 38,977,410 7,014,528 238,690 7,452,547 53,683,175 EXPENDITURES Current:
General government 1,059,776 226 182 875,662 1,935,846 Human services 21,365,925 16,392 — 1,197,316 22,579,633 Natural resources and recreation 512,328 — — 784,188 1,296,516 Transportation 63,093 — — 2,211,882 2,274,975 Education 15,090,446 6,720,055 756 732,105 22,543,362
Intergovernmental 129,715 — — 390,035 519,750 Capital outlays 71,077 189,718 6,407 1,840,748 2,107,950 Debt service:
Principal 15,534 61,839 — 1,230,802 1,308,175 Interest 7,561 33,436 — 1,054,278 1,095,275
Total Expenditures 38,315,455 7,021,666 7,345 10,317,016 55,661,482 Excess of Revenues Over (Under) Expenditures 661,955 (7,138) 231,345 (2,864,469) (1,978,307)
OTHER FINANCING SOURCES (USES) Bonds issued 97,409 11,306 — 1,441,051 1,549,766 Refunding bonds issued — — — 620,210 620,210 Payments to escrow agents for refunded bond debt
— — — (632,504) (632,504) Issuance premiums 2,429 3,268 — 495,686 501,383 Other debt issued 5,534 22,141 — 172 27,847 Refunding COPs issued — 37,842 — — 37,842 Transfers in 788,260 1,020,547 23,594 2,786,909 4,619,310 Transfers out (1,625,945) (1,056,662) (228,176) (1,519,169) (4,429,952) Total Other Financing Sources (Uses) (732,313) 38,442 (204,582) 3,192,355 2,293,902 Net Change in Fund Balances (70,358) 31,304 26,763 327,886 315,595 Fund Balances - Beginning, as restated 4,849,475 3,970,570 4,407,130 6,301,407 19,528,582 Fund Balances - Ending $ 4,779,117 $ 4,001,874 $ 4,433,893 $ 6,629,293 $ 19,844,177 The notes to the financial statements are an integral part of this statement.
Page 45

Reconciliation of the Statement of Revenues, Expenditures, and
Changes in Fund Balances to the Statement of Activities
GOVERNMENTAL FUNDS For the Fiscal Year Ended June 30, 2020
(expressed in thousands) Net Change in Fund Balances - Total Governmental Funds $ 315,595 Amounts reported for governmental activities in the Statement of Activities are different because:
Capital outlays are reported as expenditures in governmental funds. However, in the Statement of Activities, the cost of capital assets is allocated over their estimated useful lives as depreciation expense. In the current period, these amounts are:
Capital outlays $ 1,752,472 Less: Depreciation expense (699,899) 1,052,573
Some revenues in the Statement of Activities do not provide current financial resources, and therefore are unavailable in governmental funds. Also, revenues related to prior periods that became available during the current period are reported in governmental funds but are eliminated in the Statement of Activities. This amount is the net adjustment. 467,316
Internal service funds are used by management to charge the costs of certain activities to individual funds. The change in net position of the internal service funds is reported with governmental activities. (526,450)
Bond proceeds and other financing contracts provide current financial resources to governmental funds, while the repayment of the related debt principal consumes those financial resources. These transactions, however, have no effect on net position. In the current period, these amounts consist of:
Bonds and other financing contracts issued $ (2,737,741) Principal payments on bonds and other financing contracts 2,106,015 Accreted interest on bonds 41,860 (589,866)
Some expenses/revenue reductions reported in the Statement of Activities do not require the use of current financial resources and, therefore, are not recognized in governmental funds. Also payments of certain obligations related to prior periods are recognized in governmental funds but are eliminated in the Statement of Activities. In the current period, the net adjustments consist of:
Compensated absences $ (77,393) Other postemployment benefits (125,239) Pensions 663,581 Pollution remediation (43,014) Claims and judgments (2,342) Accrued interest 5,134 Unclaimed property (2,195) Asset retirement obligations (1,592) Other obligations 5,087 422,027
Change in Net Position of Governmental Activities $ 1,141,195 The notes to the financial statements are an integral part of this statement.
Page 46

Statement of Net Position
PROPRIETARY FUNDS June 30, 2020
(expressed in thousands) Business-Type Activities Enterprise Funds
Workers' Compensation Unemployment Compensation
Higher Education Student Services
ASSETS AND DEFERRED OUTFLOWS OF RESOURCES ASSETS Current Assets: Cash and cash equivalents $ 69,220 $ 2,972,974 $ 908,489 Investments 1,561,509 — 12,905 Taxes receivable (net of allowance) — — — Receivables (net of allowance) 835,938 714,774 333,937 Due from other funds 143 13,937 14,540 Due from other governments 1,976 49,595 78,964 Inventories 115 — 53,267 Prepaid expenses 1,570 — 6,561 Restricted cash and investments 461 — 16,321 Restricted receivables — — 13,328 Total Current Assets 2,470,932 3,751,280 1,438,312 Noncurrent Assets: Investments, noncurrent 18,754,346 — 214,230 Restricted investments, noncurrent — — 110,606 Restricted net pension asset — — 776 Other noncurrent assets 4,226 — 229,343 Capital assets:
Land and other non-depreciable assets 3,204 — 74,277 Buildings 65,111 — 4,515,828 Other improvements 1,289 — 117,418 Furnishings, equipment, and intangibles 105,113 — 741,313 Infrastructure — — 59,753 Accumulated depreciation (138,479) — (2,395,037) Construction in progress 916 — 196,643
Total Noncurrent Assets 18,795,726 — 3,865,150 Total Assets 21,266,658 3,751,280 5,303,462 DEFERRED OUTFLOWS OF RESOURCES Deferred outflows on refundings — — 32,495 Deferred outflows on pensions 31,105 — 123,688 Deferred outflows on OPEB 16,997 — 70,483 Total Deferred Outflows of Resources 48,102 — 226,666 Total Assets and Deferred Outflows of Resources $ 21,314,760 $ 3,751,280 $ 5,530,128 The notes to the financial statements are an integral part of this statement.
Page 47
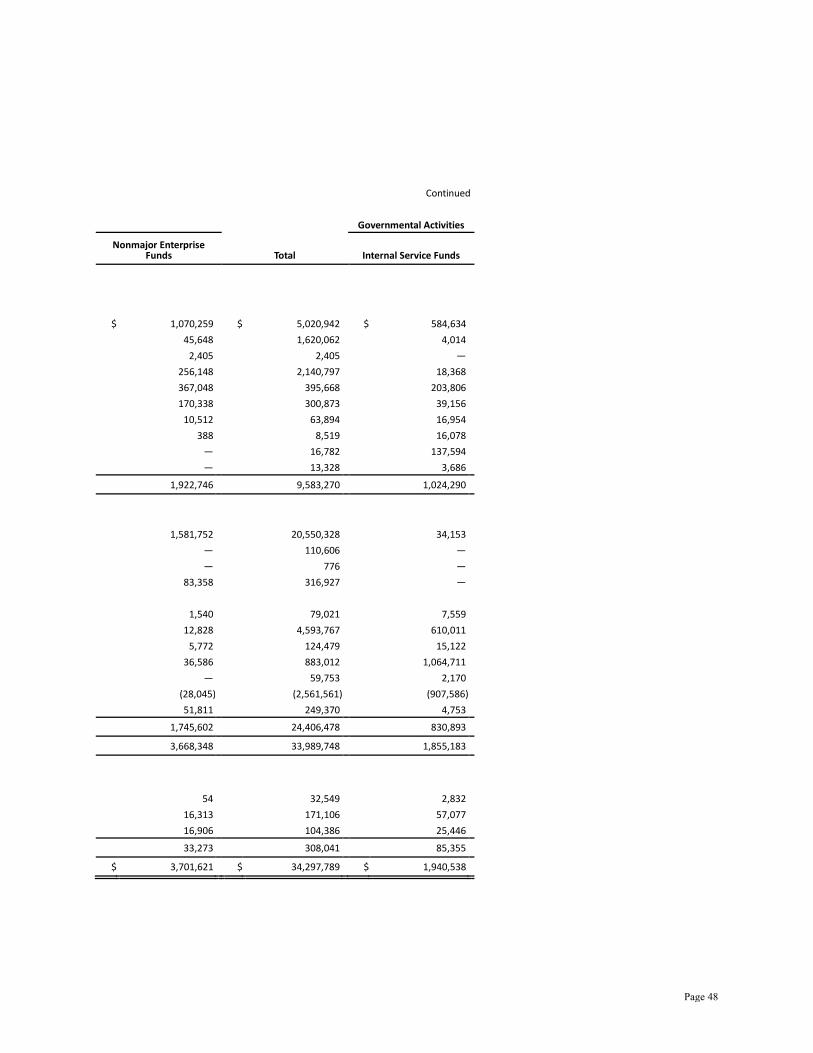
Continued Governmental Activities
Nonmajor Enterprise Funds Total Internal Service Funds
$ 1,070,259 $ 5,020,942 $ 584,634
45,648 1,620,062 4,014 2,405 2,405 —
256,148 2,140,797 18,368 367,048 395,668 203,806 170,338 300,873 39,156
10,512 63,894 16,954 388 8,519 16,078
— 16,782 137,594 — 13,328 3,686
1,922,746 9,583,270 1,024,290
1,581,752 20,550,328 34,153 — 110,606 — — 776 —
83,358 316,927 —
1,540 79,021 7,559 12,828 4,593,767 610,011
5,772 124,479 15,122 36,586 883,012 1,064,711
— 59,753 2,170 (28,045) (2,561,561) (907,586) 51,811 249,370 4,753
1,745,602 24,406,478 830,893 3,668,348 33,989,748 1,855,183
54 32,549 2,832 16,313 171,106 57,077 16,906 104,386 25,446 33,273 308,041 85,355
$ 3,701,621 $ 34,297,789 $ 1,940,538
Page 48

Statement of Net Position
PROPRIETARY FUNDS June 30, 2020
(expressed in thousands) Business-Type Activities Enterprise Funds
Workers' Compensation Unemployment Compensation
Higher Education Student Services
LIABILITIES, DEFERRED INFLOWS OF RESOURCES, AND NET POSITION LIABILITIES Current Liabilities: Accounts payable $ 9,437 $ — $ 171,640 Accrued liabilities 271,595 82,064 279,332 Obligations under security lending agreements — — — Bonds and notes payable — — 153,402 Net pension liability 33 — 733 Total OPEB liability 2,280 — 9,328 Due to other funds 5,832 1,375 179,692 Due to other governments 1,691 96,559 2,280 Unearned revenue 8,083 — 169,281 Claims and judgments payable 2,230,385 — — Total Current Liabilities 2,529,336 179,998 965,688 Noncurrent Liabilities: Claims and judgments payable 30,562,756 — — Bonds and notes payable — — 2,552,460 Net pension liability 69,061 — 257,360 Total OPEB liability 129,957 — 531,628 Other long-term liabilities 8,652 — 91,787 Total Noncurrent Liabilities 30,770,426 — 3,433,235 Total Liabilities 33,299,762 179,998 4,398,923 DEFERRED INFLOWS OF RESOURCES Deferred inflows on refundings — — 288 Deferred inflows on pensions 37,201 — 115,354 Deferred inflows on OPEB 41,997 — 161,830 Total Deferred Inflows of Resources 79,198 — 277,472 NET POSITION Net investment in capital assets 37,155 — 751,166 Restricted for:
Unemployment compensation — 3,571,282 — Pensions — — 642
Unrestricted (12,101,355) — 101,925 Total Net Position (12,064,200) 3,571,282 853,733 Total Liabilities, Deferred Inflows of Resources, and Net Position $ 21,314,760 $ 3,751,280 $ 5,530,128
The notes to the financial statements are an integral part of this statement.
Page 49

Concluded Governmental Activities
Nonmajor Enterprise Funds Total Internal Service Funds
$ 29,319 $ 210,396 $ 51,532
255,903 888,894 101,516 5,413 5,413 — 3,552 156,954 130,072
— 766 1,189 1,058 12,666 3,096
375,740 562,639 247,963 5,671 106,201 39,796
31,603 208,967 3,686 177,220 2,407,605 177,395 885,479 4,560,501 756,245
16,831 30,579,587 1,141,764 2,660 2,555,120 505,134
30,725 357,146 188,661 60,309 721,894 176,461
1,215,759 1,316,198 28,336 1,326,284 35,529,945 2,040,356 2,211,763 40,090,446 2,796,601
— 288 107 17,222 169,777 62,106 18,555 222,382 78,284 35,777 392,447 140,497
74,333 862,654 243,890
— 3,571,282 — — 642 —
1,379,748 (10,619,682) (1,240,450) 1,454,081 (6,185,104) (996,560)
$ 3,701,621 $ 34,297,789 $ 1,940,538
Page 50

Statement of Revenues, Expenses, and Changes in Net Position
PROPRIETARY FUNDS For the Fiscal Year Ended June 30, 2020
(expressed in thousands) Business-Type Activities Enterprise Funds
Workers' Compensation Unemployment Compensation
Higher Education Student Services
OPERATING REVENUES Sales $ — $ — $ 38,282
Less: Cost of goods sold — — (33,507) Gross profit — — 4,775 Charges for services 8 — 2,996,378 Premiums and assessments 2,658,958 1,155,021 — Lottery ticket proceeds — — — Federal aid for unemployment insurance benefits — 4,707,648 — Miscellaneous revenue 52,699 26,559 218,597 Total Operating Revenues 2,711,665 5,889,228 3,219,750 OPERATING EXPENSES Salaries and wages 200,115 — 1,247,602 Employee benefits 59,563 — 334,146 Personal services 15,829 — 121,281 Goods and services 100,992 — 1,347,117 Travel 4,381 — 22,016 Premiums and claims 5,900,718 7,494,268 — Guaranteed education tuition program expense — — — Lottery prize payments — — — Depreciation and amortization 7,508 — 212,351 Miscellaneous expenses 97,669 — 23,678 Total Operating Expenses 6,386,775 7,494,268 3,308,191 Operating Income (Loss) (3,675,110) (1,605,040) (88,441) NONOPERATING REVENUES (EXPENSES) Earnings (loss) on investments 1,836,909 109,463 42,055 Interest expense — — (89,396) Tax and license revenue 112 — — Other revenues (expenses) 9,610 — 112,810 Total Nonoperating Revenues (Expenses) 1,846,631 109,463 65,469 Income (Loss) Before Contributions and Transfers (1,828,479) (1,495,577) (22,972) Capital contributions — — — Transfers in — — 636,248 Transfers out (3,439) — (661,487) Net Contributions and Transfers (3,439) — (25,239) Change in Net Position (1,831,918) (1,495,577) (48,211) Net Position - Beginning, as restated (10,232,282) 5,066,859 901,944 Net Position - Ending $ (12,064,200) $ 3,571,282 $ 853,733 The notes to the financial statements are an integral part of this statement.
Page 51
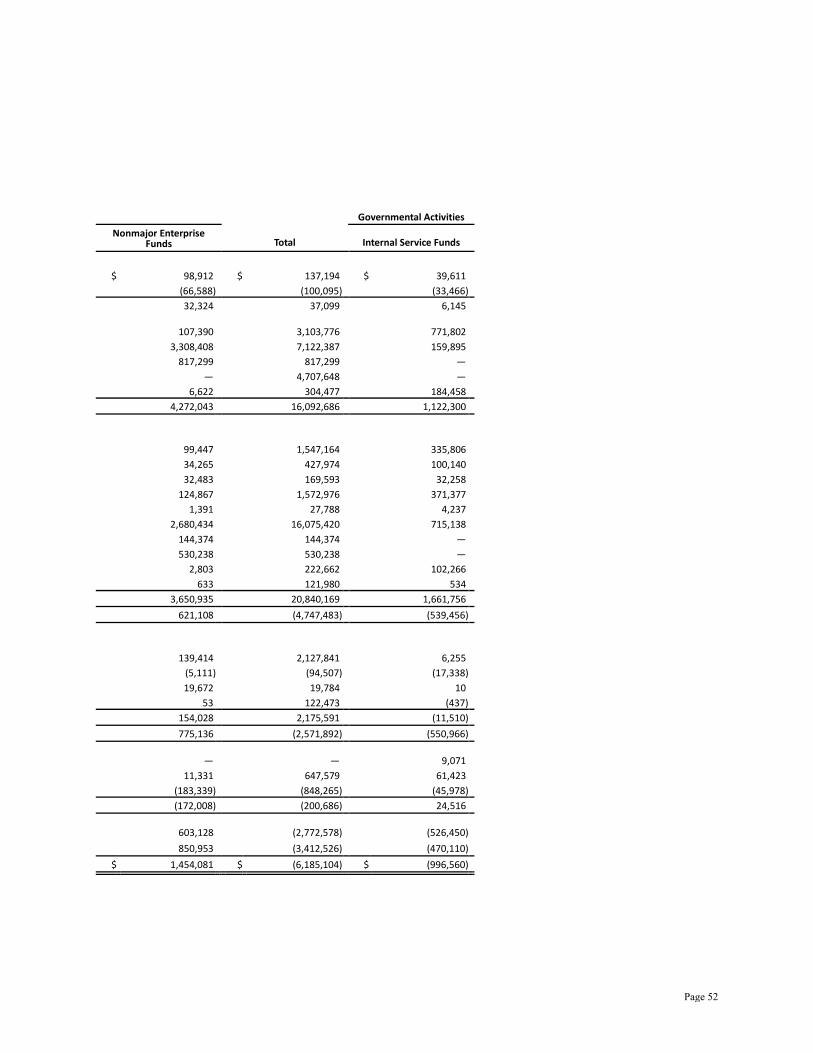
Governmental Activities
Nonmajor Enterprise Funds Total Internal Service Funds
$ 98,912 $ 137,194 $ 39,611
(66,588) (100,095) (33,466) 32,324 37,099 6,145
107,390 3,103,776 771,802
3,308,408 7,122,387 159,895 817,299 817,299 —
— 4,707,648 — 6,622 304,477 184,458
4,272,043 16,092,686 1,122,300
99,447 1,547,164 335,806 34,265 427,974 100,140 32,483 169,593 32,258
124,867 1,572,976 371,377 1,391 27,788 4,237
2,680,434 16,075,420 715,138 144,374 144,374 — 530,238 530,238 —
2,803 222,662 102,266 633 121,980 534
3,650,935 20,840,169 1,661,756 621,108 (4,747,483) (539,456)
139,414 2,127,841 6,255 (5,111) (94,507) (17,338) 19,672 19,784 10
53 122,473 (437) 154,028 2,175,591 (11,510) 775,136 (2,571,892) (550,966)
— — 9,071
11,331 647,579 61,423 (183,339) (848,265) (45,978) (172,008) (200,686) 24,516
603,128 (2,772,578) (526,450) 850,953 (3,412,526) (470,110)
$ 1,454,081 $ (6,185,104) $ (996,560)
Page 52

Statement of Cash Flows
PROPRIETARY FUNDS For the Fiscal Year Ended June 30, 2020
(expressed in thousands) Business-Type Activities Enterprise Funds
Workers' Compensation Unemployment Compensation
Higher Education Student Services
CASH FLOWS FROM OPERATING ACTIVITIES Receipts from customers $ 2,592,379 $ 841,185 $ 3,235,220 Payments to suppliers (2,395,022) (7,415,958) (1,638,474) Payments to employees (271,521) — (1,575,036) Other receipts 52,699 4,734,089 218,596
Net Cash Provided (Used) by Operating Activities (21,465) (1,840,684) 240,306 CASH FLOWS FROM NONCAPITAL FINANCING ACTIVITIES
Transfers in — — 636,248 Transfers out (3,439) — (661,487) Operating grants and donations received 9,069 — 86,218 Taxes and license fees collected 112 — —
Net Cash Provided (Used) by Noncapital Financing Activities 5,742 — 60,979 CASH FLOWS FROM CAPITAL AND RELATED FINANCING ACTIVITIES
Interest paid — — (90,608) Principal payments on long-term capital financing — — (110,725) Proceeds from long-term capital financing — — 221,476 Proceeds from sale of capital assets 38 — 15,660 Acquisitions of capital assets (1,355) — (200,022)
Net Cash Provided (Used) by Capital and Related Financing Activities (1,317) — (164,219) CASH FLOWS FROM INVESTING ACTIVITIES
Receipt of interest 778,044 109,463 15,188 Proceeds from sale of investment securities 7,918,972 — 57,791 Purchases of investment securities (8,669,132) — (79,644)
Net Cash Provided (Used) by Investing Activities 27,884 109,463 (6,665) Net Increase (Decrease) in Cash and Pooled Investments 10,844 (1,731,221) 130,401
Cash and cash equivalents, July 1, as restated 58,837 4,704,195 794,409 Cash and cash equivalents, June 30 $ 69,681 $ 2,972,974 $ 924,810 Reconciliation of Operating Income (Loss) to Net Cash Provided (Used) by Operating Activities:
Operating Income (Loss) $ (3,675,110) $ (1,605,040) $ (88,441) Adjustments to Reconcile Operating Income (Loss) to Net Cash Provided (Used) by Operating Activities:
Depreciation 7,508 — 212,351 Revenue reduced for uncollectible accounts 94,986 — 1,559
Change in Assets: Decrease (Increase) Receivables (66,294) (313,954) 85,269 Inventories 48 — (11,655) Prepaid expenses 2,801 — (1,277) Other assets — — (150)
Change in Deferred Outflows of Resources: Increase (Decrease) (10,140) — (88,876) Change in Liabilities: Increase (Decrease)
Payables 3,626,590 78,310 128,674 Change in Deferred Inflows of Resources: Decrease (Increase) (1,854) — 2,852 Net Cash Provided (Used) by Operating Activities $ (21,465) $ (1,840,684) $ 240,306 The notes to the financial statements are an integral part of this statement.
Page 53
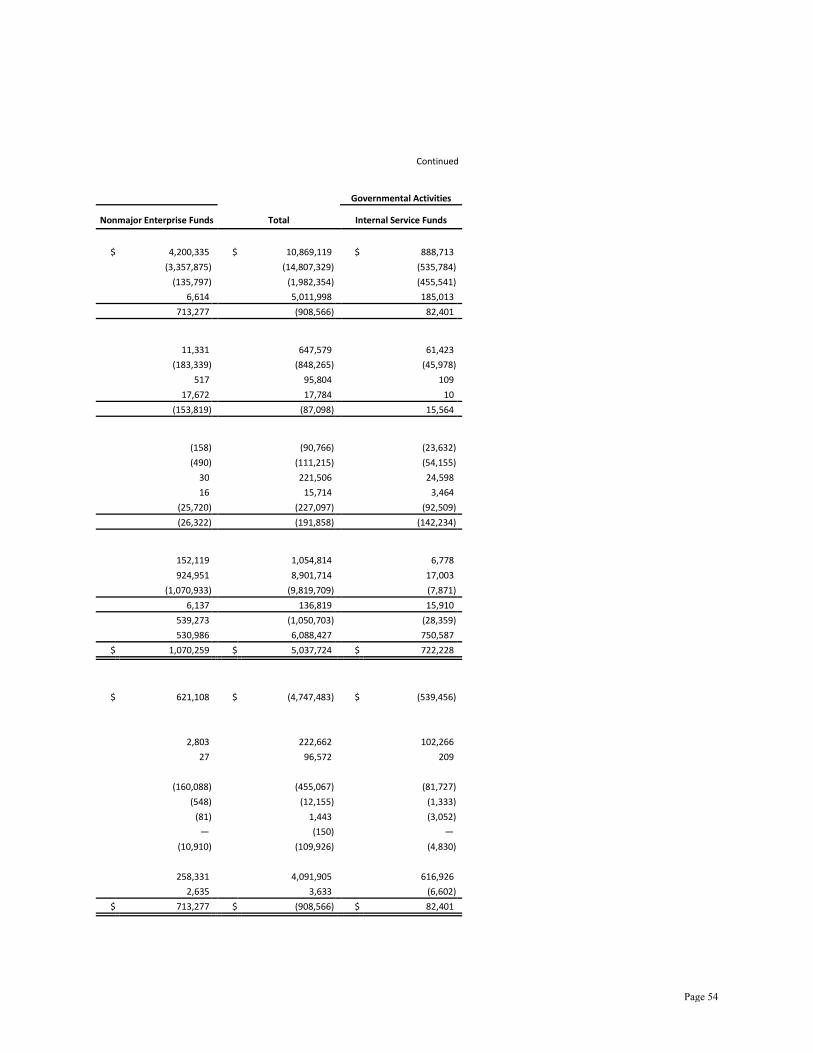
Continued Governmental Activities
Nonmajor Enterprise Funds Total Internal Service Funds
$ 4,200,335 $ 10,869,119 $ 888,713
(3,357,875) (14,807,329) (535,784) (135,797) (1,982,354) (455,541)
6,614 5,011,998 185,013 713,277 (908,566) 82,401
11,331 647,579 61,423
(183,339) (848,265) (45,978) 517 95,804 109
17,672 17,784 10 (153,819) (87,098) 15,564
(158) (90,766) (23,632) (490) (111,215) (54,155)
30 221,506 24,598 16 15,714 3,464
(25,720) (227,097) (92,509) (26,322) (191,858) (142,234)
152,119 1,054,814 6,778 924,951 8,901,714 17,003
(1,070,933) (9,819,709) (7,871) 6,137 136,819 15,910
539,273 (1,050,703) (28,359) 530,986 6,088,427 750,587
$ 1,070,259 $ 5,037,724 $ 722,228 $ 621,108 $ (4,747,483) $ (539,456)
2,803 222,662 102,266 27 96,572 209
(160,088) (455,067) (81,727)
(548) (12,155) (1,333) (81) 1,443 (3,052)
— (150) — (10,910) (109,926) (4,830)
258,331 4,091,905 616,926
2,635 3,633 (6,602) $ 713,277 $ (908,566) $ 82,401
Page 54
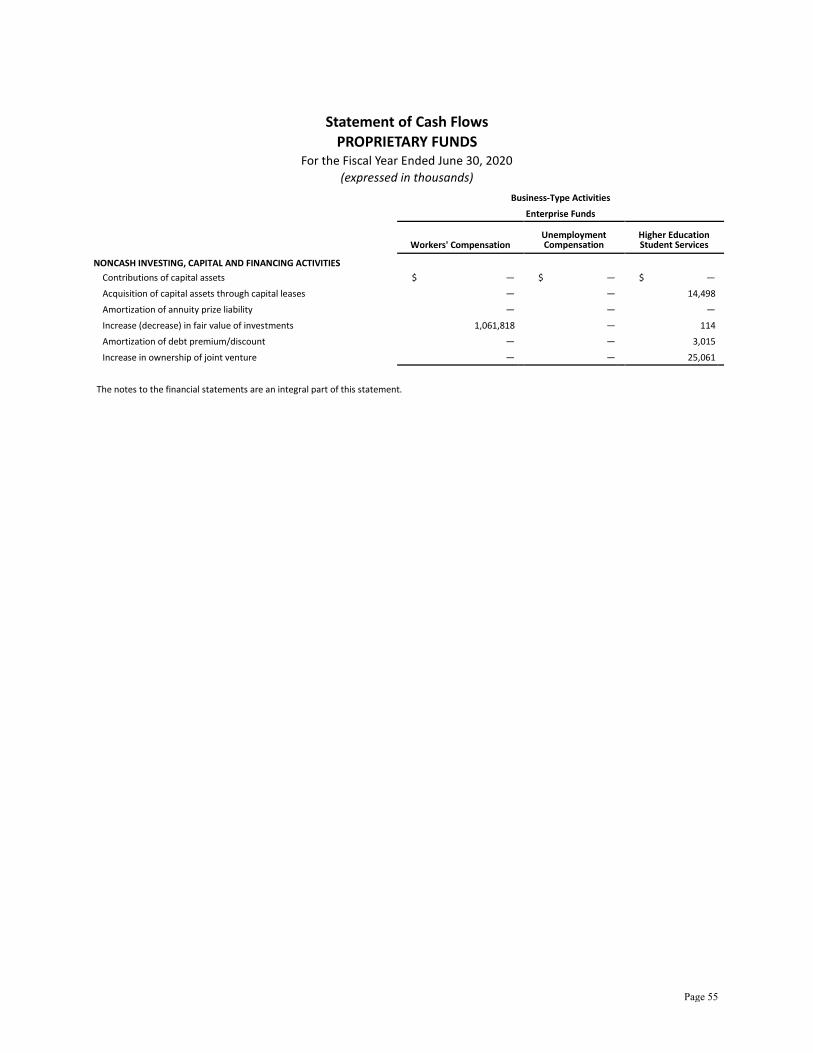
Statement of Cash Flows
PROPRIETARY FUNDS For the Fiscal Year Ended June 30, 2020
(expressed in thousands) Business-Type Activities Enterprise Funds
Workers' Compensation Unemployment Compensation
Higher Education Student Services
NONCASH INVESTING, CAPITAL AND FINANCING ACTIVITIES Contributions of capital assets $ — $ — $ — Acquisition of capital assets through capital leases — — 14,498 Amortization of annuity prize liability — — — Increase (decrease) in fair value of investments 1,061,818 — 114 Amortization of debt premium/discount — — 3,015 Increase in ownership of joint venture — — 25,061
The notes to the financial statements are an integral part of this statement.
Page 55

Concluded Governmental Activities
Nonmajor Enterprise Funds Total Internal Service Funds
$ — $ — $ 9,064
— 14,498 119 5,020 5,020 —
(12,765) 1,049,167 227 67 3,082 6,376 — 25,061 —
Page 56
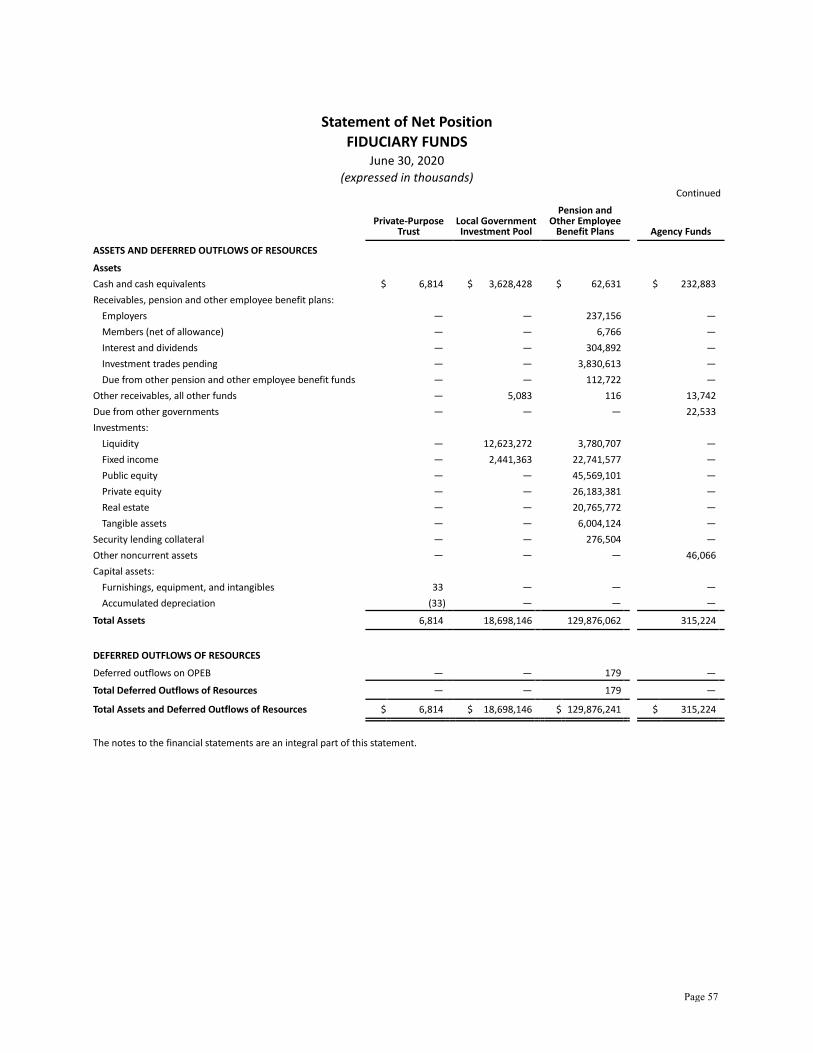
Statement of Net Position
FIDUCIARY FUNDS June 30, 2020
(expressed in thousands) Continued
Private-Purpose
Trust Local Government Investment Pool
Pension and Other Employee
Benefit Plans Agency Funds
ASSETS AND DEFERRED OUTFLOWS OF RESOURCES Assets Cash and cash equivalents $ 6,814 $ 3,628,428 $ 62,631 $ 232,883 Receivables, pension and other employee benefit plans:
Employers — — 237,156 — Members (net of allowance) — — 6,766 — Interest and dividends — — 304,892 — Investment trades pending — — 3,830,613 — Due from other pension and other employee benefit funds — — 112,722 —
Other receivables, all other funds — 5,083 116 13,742 Due from other governments — — — 22,533 Investments:
Liquidity — 12,623,272 3,780,707 — Fixed income — 2,441,363 22,741,577 — Public equity — — 45,569,101 — Private equity — — 26,183,381 — Real estate — — 20,765,772 — Tangible assets — — 6,004,124 —
Security lending collateral — — 276,504 — Other noncurrent assets — — — 46,066 Capital assets:
Furnishings, equipment, and intangibles 33 — — — Accumulated depreciation (33) — — —
Total Assets 6,814 18,698,146 129,876,062 315,224 DEFERRED OUTFLOWS OF RESOURCES Deferred outflows on OPEB — — 179 — Total Deferred Outflows of Resources — — 179 — Total Assets and Deferred Outflows of Resources $ 6,814 $ 18,698,146 $ 129,876,241 $ 315,224 The notes to the financial statements are an integral part of this statement.
Page 57

Statement of Net Position
FIDUCIARY FUNDS June 30, 2020
(expressed in thousands) Concluded
Private-Purpose
Trust Local Government Investment Pool
Pension and Other Employee
Benefit Plans Agency Funds
LIABILITIES AND DEFERRED INFLOWS OF RESOURCES Liabilities Accounts payable $ 95 $ — $ — $ 23,614 Contracts payable — — — 33,660 Accrued liabilities 159 549,691 4,299,120 189,326 Obligations under security lending agreements — — 276,504 — Due to other funds — 82 — — Due to other pension and other employee benefit funds — — 112,722 — Due to other governments — 142,536 — 22,558 Unearned revenue — — 572 — Other long-term liabilities — — — 46,066 Total Liabilities 254 692,309 4,688,918 315,224 DEFERRED INFLOWS OF RESOURCES Deferred inflows on OPEB — — 123 — Total Deferred Inflows of Resources — — 123 — Total Liabilities and Deferred Inflows of Resources 254 692,309 4,689,041 $ 315,224 NET POSITION Net position restricted for:
Pensions — — 120,321,676 Deferred compensation participants — — 4,865,524 Local government pool participants — 18,005,837 — Individuals, organizations, and other governments 6,560 — —
Total Net Position $ 6,560 $ 18,005,837 $ 125,187,200
The notes to the financial statements are an integral part of this statement.
Page 58
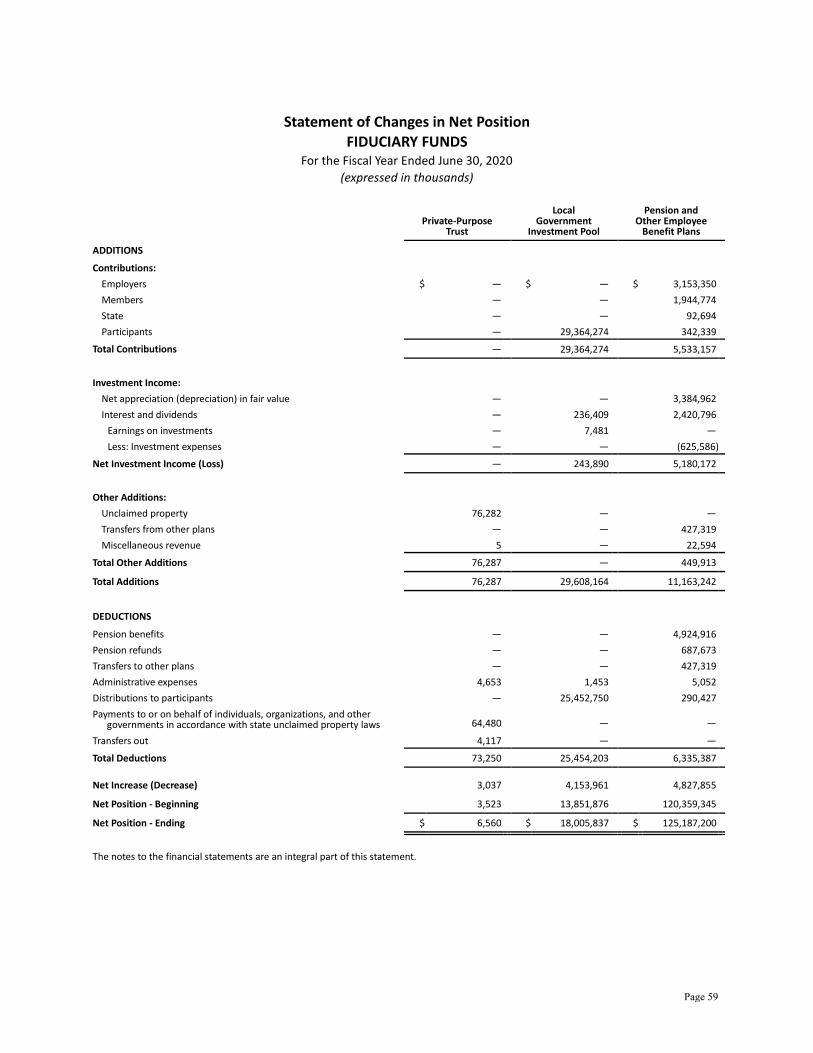
Statement of Changes in Net Position
FIDUCIARY FUNDS For the Fiscal Year Ended June 30, 2020
(expressed in thousands)
Private-Purpose
Trust
Local Government
Investment Pool
Pension and Other Employee
Benefit Plans
ADDITIONS Contributions:
Employers $ — $ — $ 3,153,350 Members — — 1,944,774 State — — 92,694 Participants — 29,364,274 342,339
Total Contributions — 29,364,274 5,533,157 Investment Income:
Net appreciation (depreciation) in fair value — — 3,384,962 Interest and dividends — 236,409 2,420,796
Earnings on investments — 7,481 — Less: Investment expenses — — (625,586)
Net Investment Income (Loss) — 243,890 5,180,172 Other Additions:
Unclaimed property 76,282 — — Transfers from other plans — — 427,319 Miscellaneous revenue 5 — 22,594
Total Other Additions 76,287 — 449,913 Total Additions 76,287 29,608,164 11,163,242 DEDUCTIONS Pension benefits — — 4,924,916 Pension refunds — — 687,673 Transfers to other plans — — 427,319 Administrative expenses 4,653 1,453 5,052 Distributions to participants — 25,452,750 290,427 Payments to or on behalf of individuals, organizations, and other governments in accordance with state unclaimed property laws 64,480 — —
Transfers out 4,117 — — Total Deductions 73,250 25,454,203 6,335,387 Net Increase (Decrease) 3,037 4,153,961 4,827,855 Net Position - Beginning 3,523 13,851,876 120,359,345 Net Position - Ending $ 6,560 $ 18,005,837 $ 125,187,200 The notes to the financial statements are an integral part of this statement.
Page 59
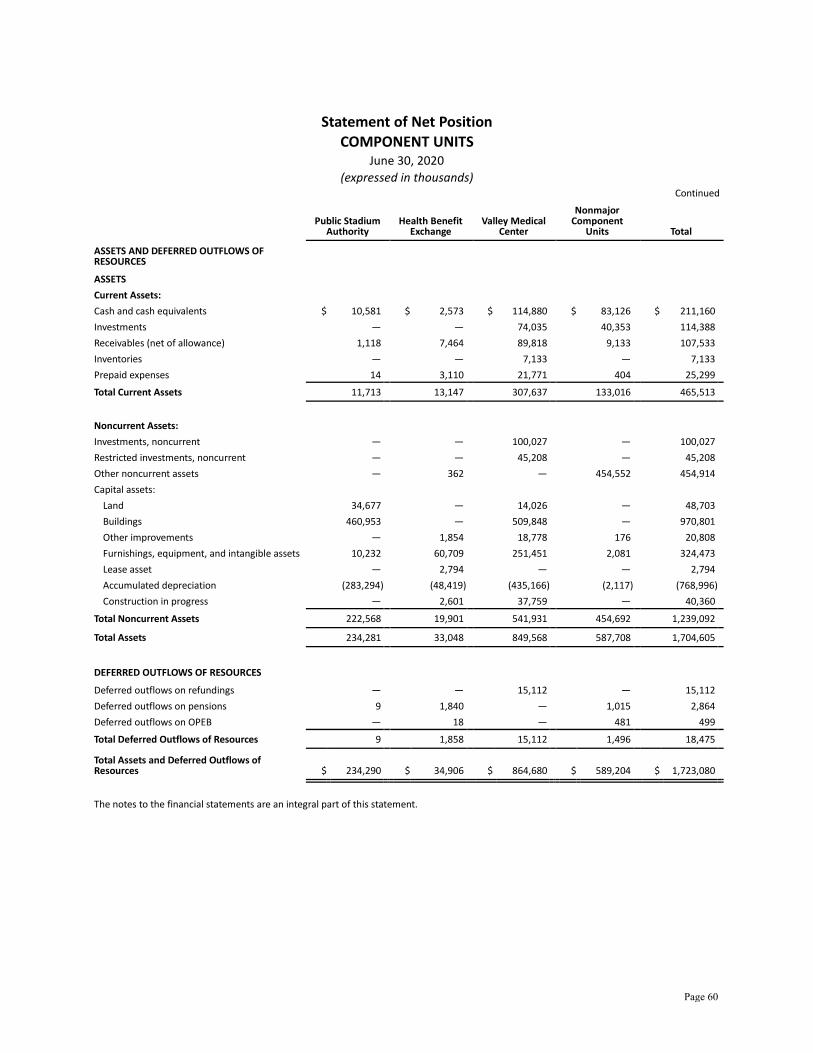
Statement of Net Position
COMPONENT UNITS June 30, 2020
(expressed in thousands) Continued
Public Stadium
Authority Health Benefit
Exchange Valley Medical
Center
Nonmajor Component
Units Total
ASSETS AND DEFERRED OUTFLOWS OF RESOURCES ASSETS Current Assets: Cash and cash equivalents $ 10,581 $ 2,573 $ 114,880 $ 83,126 $ 211,160 Investments — — 74,035 40,353 114,388 Receivables (net of allowance) 1,118 7,464 89,818 9,133 107,533 Inventories — — 7,133 — 7,133 Prepaid expenses 14 3,110 21,771 404 25,299 Total Current Assets 11,713 13,147 307,637 133,016 465,513 Noncurrent Assets: Investments, noncurrent — — 100,027 — 100,027 Restricted investments, noncurrent — — 45,208 — 45,208 Other noncurrent assets — 362 — 454,552 454,914 Capital assets:
Land 34,677 — 14,026 — 48,703 Buildings 460,953 — 509,848 — 970,801 Other improvements — 1,854 18,778 176 20,808 Furnishings, equipment, and intangible assets 10,232 60,709 251,451 2,081 324,473 Lease asset — 2,794 — — 2,794 Accumulated depreciation (283,294) (48,419) (435,166) (2,117) (768,996) Construction in progress — 2,601 37,759 — 40,360
Total Noncurrent Assets 222,568 19,901 541,931 454,692 1,239,092 Total Assets 234,281 33,048 849,568 587,708 1,704,605 DEFERRED OUTFLOWS OF RESOURCES Deferred outflows on refundings — — 15,112 — 15,112 Deferred outflows on pensions 9 1,840 — 1,015 2,864 Deferred outflows on OPEB — 18 — 481 499 Total Deferred Outflows of Resources 9 1,858 15,112 1,496 18,475 Total Assets and Deferred Outflows of Resources $ 234,290 $ 34,906 $ 864,680 $ 589,204 $ 1,723,080
The notes to the financial statements are an integral part of this statement.
Page 60

Statement of Net Position
COMPONENT UNITS June 30, 2020
(expressed in thousands) Concluded
Public Stadium
Authority Health Benefit
Exchange Valley Medical
Center
Nonmajor Component
Units Total
LIABILITIES, DEFERRED INFLOWS OF RESOURCES, AND NET POSITION LIABILITIES Current Liabilities: Accounts payable $ 31 $ 11,920 $ 23,992 $ 342 $ 36,285 Accrued liabilities 4,294 1,224 126,254 39,146 170,918 Total OPEB liability — — — 3 3 Lease liability — 563 — — 563 Unearned revenue — — 85,441 8,669 94,110 Total Current Liabilities 4,325 13,707 235,687 48,160 301,879 Noncurrent Liabilities: Net pension liability 114 3,769 — 2,568 6,451 Total OPEB liability — 1,428 — 3,655 5,083 Lease liability — 1,179 — — 1,179 Other long-term liabilities — 361 324,511 — 324,872 Total Noncurrent Liabilities 114 6,737 324,511 6,223 337,585 Total Liabilities 4,439 20,444 560,198 54,383 639,464 DEFERRED INFLOWS OF RESOURCES Deferred inflows on property taxes — — 29,190 — 29,190 Deferred inflows on pensions 64 2,290 — 1,289 3,643 Deferred inflows on OPEB — 379 — 1,106 1,485 Total Deferred Inflows of Resources 64 2,669 29,190 2,395 34,318 NET POSITION Net investment in capital assets 222,421 19,539 118,350 140 360,450 Restricted for:
Other purposes — — 856 984 1,840 Unrestricted 7,366 (7,746) 156,086 531,302 687,008 Total Net Position 229,787 11,793 275,292 532,426 1,049,298 Total Liabilities, Deferred Inflows of Resources, and Net Position $ 234,290 $ 34,906 $ 864,680 $ 589,204 $ 1,723,080
The notes to the financial statements are an integral part of this statement.
Page 61
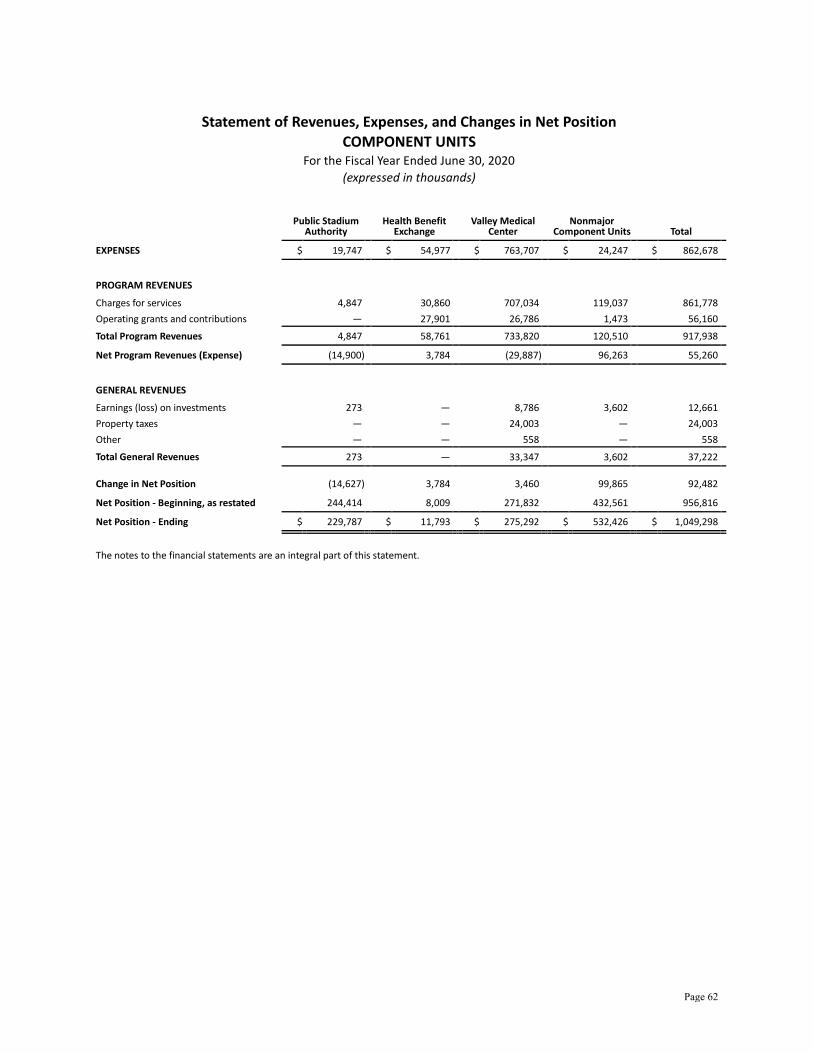
Statement of Revenues, Expenses, and Changes in Net Position
COMPONENT UNITS For the Fiscal Year Ended June 30, 2020
(expressed in thousands)
Public Stadium
Authority Health Benefit
Exchange Valley Medical
Center Nonmajor
Component Units Total
EXPENSES $ 19,747 $ 54,977 $ 763,707 $ 24,247 $ 862,678 PROGRAM REVENUES Charges for services 4,847 30,860 707,034 119,037 861,778 Operating grants and contributions — 27,901 26,786 1,473 56,160 Total Program Revenues 4,847 58,761 733,820 120,510 917,938 Net Program Revenues (Expense) (14,900) 3,784 (29,887) 96,263 55,260 GENERAL REVENUES Earnings (loss) on investments 273 — 8,786 3,602 12,661 Property taxes — — 24,003 — 24,003 Other — — 558 — 558 Total General Revenues 273 — 33,347 3,602 37,222 Change in Net Position (14,627) 3,784 3,460 99,865 92,482 Net Position - Beginning, as restated 244,414 8,009 271,832 432,561 956,816 Net Position - Ending $ 229,787 $ 11,793 $ 275,292 $ 532,426 $ 1,049,298 The notes to the financial statements are an integral part of this statement.
Page 62

Note 1 Summary of Significant Accounting Policies The accompanying financial statements of the state of Washington have been prepared in conformity with generally accepted accounting principles (GAAP). The Office of Financial Management (OFM) is the primary authority for the state’s accounting and reporting requirements. OFM has adopted the pronouncements of the Governmental Accounting Standards Board (GASB), which is nationally accepted as the standard-setting body for establishing governmental accounting and financial reporting principles. Following is a summary of the significant accounting policies:
A. REPORTING ENTITY
In defining the state of Washington for financial reporting purposes, management considers all funds, organizations, institutions, agencies, departments, and offices that are legally part of the state (the primary government) and organizations that are financially accountable to the state. Additionally, other organizations that do not meet the financial accountability criteria may be included in the reporting entity if the nature and significance of their relationship with the state are such that exclusion would cause the state’s financial statements to be misleading. Financial accountability exists when the primary government appoints a voting majority of an organization’s governing body and is either (1) able to impose its will on that organization or (2) there is a potential for the organization to provide specific financial benefits to, or impose specific financial burdens on, the primary government. The primary government is also financially accountable if an organization is fiscally dependent on and there is a potential for the organization to provide specific financial benefits to, or impose specific financial burdens on, the primary government regardless of whether the organization has (1) a separately elected governing board, (2) a governing board appointed by a higher level of government, or (3) a jointly appointed board. An organization is fiscally dependent if it is unable to determine its budget without another government having the substantive authority to approve or modify that budget, to levy taxes or set rates or charges without substantive approval by another government, or to issue bonded debt without substantive approval by another government. The organization has a financial benefit or burden relationship with the primary government if, for example, any one of these conditions exists: (1) the primary government is legally entitled to or can access the organization’s resources, (2) the primary government is legally obligated or has otherwise assumed
the obligation to finance or provide financial support to the organization, (3) the primary government is obligated in some manner for the debt of the organization. Based on these criteria, the following are included in the financial statements of the primary government: State Agencies. Except as otherwise described herein, all state elected offices, departments, agencies, commissions, boards, committees, authorities, councils (agencies), and all funds and subsidiary accounts of the state are included in the primary government. Executives of these agencies are either elected, directly appointed by the Governor, appointed by a board which is appointed by the Governor, or appointed by a board which is in part appointed by the Governor. Additionally, a small number of board positions are established by statute or independently elected. The Legislature creates these agencies, assigns their programs, approves operational funding, and requires financial accountability. The Legislature also authorizes all bond issuances for capital construction projects for the benefit of state agencies. The legal liability for these bonds and the ownership of agency assets reside with the state. Colleges and Universities. The governing boards of the five state universities, the state college, and the 34 state community and technical colleges are appointed by the Governor. The governing board of each college and university appoints a president to function as chief administrator. The Legislature approves budgets and budget amendments for the appropriated funds of each college and university, which include the state’s General Fund as well as certain capital projects funds. The State Treasurer issues general obligation debt for major campus construction projects. However, the colleges and universities are authorized to issue revenue bonds. The University of Washington (UW) and Washington State University issue general revenue bonds that are payable from general revenues, including student tuition, grant indirect cost recovery, sales and services revenue, and investment income. All other revenue bonds issued by colleges and universities pledge the income derived from acquired or constructed assets such as housing, dining, and parking facilities. These revenue bonds are payable solely from, and secured by, fees and revenues derived from the operation of constructed facilities. The legal liability for the bonds and the ownership of the college and university assets reside with the state. Colleges and universities do not have separate corporate powers and sue and are sued as part of the state with legal representation provided through the state Attorney General’s Office. Since the colleges and universities are legally part of the state, their financial operations, including their blended component units, are reported in
Page 63

the state’s financial statements using the fund structure prescribed by GASB. Retirement Systems. The state of Washington, through the Department of Retirement Systems (DRS), administers eight retirement systems for public employees of the state and political subdivisions: the Public Employees’ Retirement System, the Teachers’ Retirement System, the School Employees’ Retirement System, the Law Enforcement Officers’ and Fire Fighters’ Retirement System, the Washington State Patrol Retirement System, the Public Safety Employees’ Retirement System, the Judicial Retirement System, and the Judges’ Retirement Fund. The director of DRS is appointed by the Governor. There are three additional retirement systems administered outside of the DRS. The Volunteer Fire Fighters’ and Reserve Officers’ Relief and Pension Fund is administered through the State Board for Volunteer Fire Fighters and Reserve Officers, which is appointed by the Governor. The Judicial Retirement Account is administered through the Administrative Office of the Courts under the direction of the Board for Judicial Administration. The Higher Education Retirement Plan Supplemental Benefit Fund Plans are administered by the state’s colleges and universities. The Legislature establishes laws pertaining to the creation and administration of all public retirement systems. The participants of the public retirement systems, together with the state, provide funding for all costs of the systems based upon actuarial valuations. The state establishes benefit levels and approves the actuarial assumptions used in determining contribution levels. All of the aforementioned retirement systems are included in the primary government’s financial statements. Blended Component Units Blended component units, although legally separate entities, are part of the state’s operations in substance. Accordingly, they are reported as part of the state and blended into the appropriate funds. Financial information for the state’s blended component units may be obtained from the Office of Financial Management, Accounting Division, P.O. Box 43127, Olympia, WA 98504-3127. The following entities are blended in the state’s financial statements: Tobacco Settlement Authority was created by the Legislature in March 2002 as a public instrumentality separate and distinct from the state. It is governed by a five-member board appointed by the Governor. It was created solely for the purpose of issuing bonds to securitize a portion of the state’s future tobacco
settlement revenue. Proceeds of the debt instrument were transferred to the state to help fund health care, long-term care, and other programs of the state. Refer to Note 7.A for additional information. University of Washington Physicians (UWP) was established for the exclusive benefit of the University of Washington School of Medicine (UWSOM). UWP employs UWSOM faculty and bills and collects for their clinical services as an agent for UWSOM. UW Medicine Neighborhood Clinics (UW Neighborhood Clinics) were established for the exclusive benefit of the UWSOM, UWP and its affiliated medical centers, Harborview Medical Center, and the UW Medical Center (UWMC). The UW Neighborhood Clinics were organized to coordinate and develop patient care in a community clinical setting. They enhance the academic environment of UWSOM by providing additional sites of primary care practice and training for faculty, residents, and students. Washington Biomedical Research Properties I and II, and Washington Biomedical Research Facilities 3, 3.2, and 3.3 were formed to acquire, construct, or renovate certain real properties for the benefit of the UW in fulfilling its educational, medical, or scientific research missions. TOP and FYI Properties were formed to design and construct office facilities to house state employees. The facilities were financed with tax-exempt obligations that meet the requirements of Revenue Ruling 63-20 and Revenue Procedure 82-26 issued by the Internal Revenue Service. Change in Reporting. On February 8, 2018, the University of Washington’s Board of Regents approved the dissolution of Northwest Hospital & Medical Center (NWH), a Washington non-profit corporation, and integration of NWH and UWMC. The integration occurred on January 1, 2020, at which time NWH ceased operations and the University accepted the assets, liabilities, and remaining operations of the corporate entity. At the time of the integration, NWH became the Northwest Campus of UWMC and ceased to be a blended component unit of the University. The integration was accounted for as a government merger and, as such, will be reflected in the University’s consolidated financial statements as if the merger had occurred on July 1, 2019. Discrete Component Units Discretely presented component units are reported in a separate column in the government-wide financial statements. Discretely presented component units are legally separate from the state and primarily serve or
Page 64
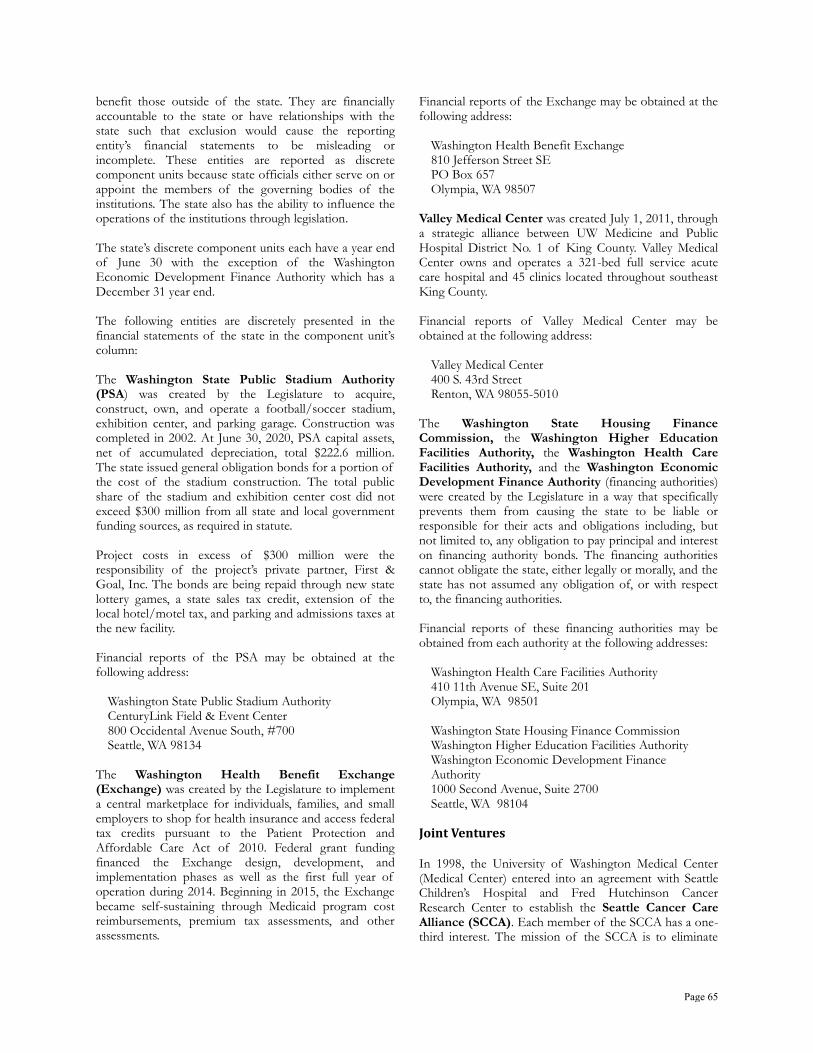
benefit those outside of the state. They are financially accountable to the state or have relationships with the state such that exclusion would cause the reporting entity’s financial statements to be misleading or incomplete. These entities are reported as discrete component units because state officials either serve on or appoint the members of the governing bodies of the institutions. The state also has the ability to influence the operations of the institutions through legislation. The state’s discrete component units each have a year end of June 30 with the exception of the Washington Economic Development Finance Authority which has a December 31 year end. The following entities are discretely presented in the financial statements of the state in the component unit’s column: The Washington State Public Stadium Authority (PSA) was created by the Legislature to acquire, construct, own, and operate a football/soccer stadium, exhibition center, and parking garage. Construction was completed in 2002. At June 30, 2020, PSA capital assets, net of accumulated depreciation, total $222.6 million. The state issued general obligation bonds for a portion of the cost of the stadium construction. The total public share of the stadium and exhibition center cost did not exceed $300 million from all state and local government funding sources, as required in statute. Project costs in excess of $300 million were the responsibility of the project’s private partner, First & Goal, Inc. The bonds are being repaid through new state lottery games, a state sales tax credit, extension of the local hotel/motel tax, and parking and admissions taxes at the new facility. Financial reports of the PSA may be obtained at the following address:
Washington State Public Stadium Authority CenturyLink Field & Event Center 800 Occidental Avenue South, #700 Seattle, WA 98134
The Washington Health Benefit Exchange (Exchange) was created by the Legislature to implement a central marketplace for individuals, families, and small employers to shop for health insurance and access federal tax credits pursuant to the Patient Protection and Affordable Care Act of 2010. Federal grant funding financed the Exchange design, development, and implementation phases as well as the first full year of operation during 2014. Beginning in 2015, the Exchange became self-sustaining through Medicaid program cost reimbursements, premium tax assessments, and other assessments.
Financial reports of the Exchange may be obtained at the following address:
Washington Health Benefit Exchange 810 Jefferson Street SE PO Box 657 Olympia, WA 98507
Valley Medical Center was created July 1, 2011, through a strategic alliance between UW Medicine and Public Hospital District No. 1 of King County. Valley Medical Center owns and operates a 321-bed full service acute care hospital and 45 clinics located throughout southeast King County. Financial reports of Valley Medical Center may be obtained at the following address:
Valley Medical Center 400 S. 43rd Street Renton, WA 98055-5010
The Washington State Housing Finance Commission, the Washington Higher Education Facilities Authority, the Washington Health Care Facilities Authority, and the Washington Economic Development Finance Authority (financing authorities) were created by the Legislature in a way that specifically prevents them from causing the state to be liable or responsible for their acts and obligations including, but not limited to, any obligation to pay principal and interest on financing authority bonds. The financing authorities cannot obligate the state, either legally or morally, and the state has not assumed any obligation of, or with respect to, the financing authorities. Financial reports of these financing authorities may be obtained from each authority at the following addresses:
Washington Health Care Facilities Authority 410 11th Avenue SE, Suite 201 Olympia, WA 98501
Washington State Housing Finance Commission Washington Higher Education Facilities Authority Washington Economic Development Finance Authority 1000 Second Avenue, Suite 2700 Seattle, WA 98104
Joint Ventures In 1998, the University of Washington Medical Center (Medical Center) entered into an agreement with Seattle Children’s Hospital and Fred Hutchinson Cancer Research Center to establish the Seattle Cancer Care Alliance (SCCA). Each member of the SCCA has a one-third interest. The mission of the SCCA is to eliminate
Page 65
cancer as a cause of human suffering and death and to become recognized as the premier cancer research and treatment center in the Pacific Northwest. The SCCA integrates the cancer research, teaching, and clinical cancer programs of all three institutions to provide state-of-the-art cancer care. Under the agreement, the Medical Center provides the patient care to all adult inpatients of the SCCA. Inpatient Services - The SCCA operates a 20-bed unit located within the Medical Center in which its adult inpatients receive care. The fiscal intermediary has determined that the 20-bed unit qualifies as a hospital within a hospital for Medicare reimbursement purposes. The SCCA provides medical oversight and management of the inpatient unit. Under agreements, the Medical Center provides inpatient care services to the SCCA including necessary personnel, equipment, and ancillary services. Outpatient Services - The SCCA operates an ambulatory cancer care service facility in Seattle. The Medical Center provides various services to the SCCA’s outpatient facility including certain pharmacy, laboratory, and pathology services as well as billing, purchasing, and other administrative services. The state accounts for the Medical Center’s interest in the SCCA under the equity method of accounting. Income of $25.1 million was recorded in fiscal year 2020, bringing the total equity investment to $208.4 million which is recognized in the state’s financial statements in the Higher Education Student Services Fund. Separate financial statements for the SCCA may be obtained from:
Seattle Cancer Care Alliance 825 Eastlake Avenue East PO Box 19023 Seattle, WA 98109-1023
The University of Washington and Seattle Children’s Hospital established Children’s University Medical Group (CUMG) to assist the organizations in carrying out their pediatric patient care, as well as charitable, educational, and scientific missions. CUMG employs UWSOM faculty physicians and bills and collects for their services as an agent for UWSOM. The University records revenue from CUMG based on the income distribution plan effective December 31, 2008. The University’s patient services receivable includes amounts due from CUMG of $17.8 million in 2020.
Separate financial statements for CUMG may be obtained from:
Children’s University Medical Group 4500 Sand Point Way NE, Suite 100 Seattle, WA 98105
B. GOVERNMENT-WIDE AND FUND FINANCIAL STATEMENTS
Government-wide Financial Statements The state presents two basic government-wide financial statements: the Statement of Net Position and the Statement of Activities. These government-wide financial statements report information on all non-fiduciary activities of the primary government and its component units. The financial information for the primary government is distinguished between governmental and business-type activities. Governmental activities generally are financed through taxes, intergovernmental revenues, and other non-exchange revenues. Business-type activities are financed in whole or in part by fees charged to external parties for goods and services. Statement of Net Position. The Statement of Net Position presents the state’s non-fiduciary assets, deferred outflows of resources, liabilities, deferred inflows of resources, and net position. As a general rule, balances between governmental and business-type activities are eliminated. Statement of Activities. The Statement of Activities reports the extent to which each major state program is supported by general state revenues or is self-financed through fees and intergovernmental aid. For governmental activities, a major program is defined as a function. For business-type activities, a major program is an identifiable activity. Program revenues offset the direct expenses of major programs. Direct expenses are those that are clearly identifiable within a specific function or activity. Program revenues are identified using the following criteria: • Charges to customers for goods and services of the
program. A customer is one who directly benefits from the goods or services or is otherwise directly affected by the program, such as a state citizen or taxpayer, or other governments or nongovernmental entities.
Page 66

• Amounts received from outside entities that are restricted to one or more specific programs. These amounts can be operating or capital in nature.
• Earnings on investments that are restricted to a
specific program. General revenues consist of taxes and other items not meeting the definition of program revenues. Generally, the effect of internal activities is eliminated. Exceptions to this rule include charges between the workers’ compensation insurance programs and various other state programs and functions. Elimination of these charges would distort the direct costs and revenues reported for the various activities involved. Fund Financial Statements The state uses 730 accounts that are combined into 53 rollup funds. The state presents separate financial statements for governmental funds, proprietary funds, and fiduciary funds. Major individual governmental funds and major individual proprietary funds are reported in separate columns in the fund financial statements, with nonmajor funds being combined into a single column regardless of fund type. Internal service and fiduciary funds are reported by fund type. Major funds include: Major Governmental Funds: • General Fund is the state’s primary operating fund.
This fund accounts for all financial resources and transactions not accounted for in other funds.
• Higher Education Special Revenue Fund primarily
accounts for tuition, student fees, and grants and contracts received for educational and research purposes.
• Higher Education Endowment Permanent Fund
accounts for gifts and bequests that the donors have specified must remain intact. Each gift is governed by various restrictions on the investment and use of the income earned on investments.
Major Enterprise Funds: • Workers’ Compensation Fund accounts for the
workers' compensation program that provides medical, time-loss, and disability benefit payments to qualifying individuals sustaining work-related injuries.
• Unemployment Compensation Fund accounts for the unemployment compensation program. It accounts for the deposit of funds, requisitioned from the Federal Unemployment Trust Fund, to provide services to eligible participants within the state and to pay unemployment benefits.
• Higher Education Student Services Fund is used
by colleges and universities principally for bookstore, cafeteria, parking, student housing, food service, and hospital business enterprise activities.
The state includes the following nonmajor funds: Nonmajor Governmental Funds: • Special Revenue Funds account for the proceeds of
specific revenue sources (other than trusts for individuals, private organizations, other governments, or for major capital projects) that are restricted or committed to expenditures for specific purposes. These include a variety of state programs including public safety and health assistance programs; natural resource and wildlife protection and management programs; the state’s transportation programs which include the operation of the state’s ferry system and maintenance and preservation of interstate and non-interstate highway systems; driver licensing, highway and non-highway operations, and capital improvements; K-12 school construction; and construction and loan programs for local public works projects.
• Debt Service Funds account for the accumulation of
resources that are restricted or committed to expenditures for, and the payment of, principal and interest on the state’s bonds issued in support of governmental activities.
• Capital Projects Funds account for financial
resources that are restricted or committed to expenditures for the acquisition, construction, or improvement of major state-owned capital facilities (other than highway infrastructure or those financed by proprietary funds).
• Common School Permanent Fund accounts for the
principal derived from the sale of timber. Interest earned is used for the benefit of common schools.
Page 67

Nonmajor Proprietary Funds: • Enterprise Funds account for the state’s business
type operations for which a fee is charged to external users for goods or services including: the state lottery, vocational/education programs at correctional institutions, the Guaranteed Education Tuition program, paid family and medical leave compensation, health insurance, and other activities.
• Internal Service Funds account for the provision of
legal, motor pool, data processing, risk management, and other services by one department or agency to other departments or agencies of the state on a cost-reimbursement basis.
Nonmajor Fiduciary Funds: • Pension (and other employee benefit) Trust
Funds are used to report resources that are required to be held in trust by the state for the members and beneficiaries of defined benefit pension plans, defined contribution pension plans, and other employee benefit plans.
• Investment Trust Funds account for the external
portion of the local government investments, which is reported by the state as the sponsoring government.
• Private-Purpose Trust Funds are used to report
trust arrangements, other than pension and investment trusts, under which principal and income benefit individuals, private organizations, or other governments such as the administration of unclaimed property.
• Agency Funds account for resources held by the
state in a custodial capacity for other governments, private organizations, or individuals.
Operating and Nonoperating Revenues and Expenses. The state’s proprietary funds make a distinction between operating and nonoperating revenues and expenses. Operating revenues and expenses generally result from providing goods and services directly related to the principal operations of the funds. For example, operating revenues for the state’s workers’ compensation and health insurance funds consist of premiums and assessments collected. Operating expenses consist of claims paid to covered individuals, claims adjustment expenses, costs of commercial insurance coverage, and administrative expenses. All revenues and expenses not meeting this definition are reported as nonoperating, including interest expense and investment gains and losses.
C. MEASUREMENT FOCUS AND BASIS OF ACCOUNTING
For government-wide reporting purposes, the state uses the economic resources measurement focus and the accrual basis of accounting. Revenues are recorded when earned and expenses are recorded when a liability is incurred, regardless of the timing of the related cash flows. Property taxes are recognized as revenue in the year for which they are levied. Grants and similar items are recognized as revenue as soon as all eligibility requirements imposed by the provider have been met. For fund statement reporting purposes, the state uses the current financial resources measurement focus and modified accrual basis of accounting for governmental funds. With the current financial resources measurement focus, generally only current assets, current liabilities, deferred outflows of resources, and deferred inflows of resources are included on the governmental funds balance sheet. Operating statements for these funds present inflows (i.e., revenues and other financing sources) and outflows (i.e., expenditures and other financing uses) of expendable financial resources. Under the modified accrual basis of accounting, revenues are recognized when susceptible to accrual (i.e., when they become both measurable and available). “Measurable” means the amount of the transaction can be reasonably estimated. “Available” means collectible within the current period or soon enough thereafter to be used to pay liabilities of the current period. Primary revenues that are determined to be susceptible to accrual include sales taxes, business and occupation taxes, motor fuel taxes, federal grants-in-aid, and charges for services. Revenues from property taxes are determined to be available if collectible within 60 days. Taxes imposed on exchange transactions are accrued when the underlying exchange transaction occurs if collectible within one year. Revenue for timber cutting contracts is accrued when the timber is harvested. Revenues from licenses, permits, and fees related to a future time period are recognized when received in cash. Revenues related to expenditure-driven grant agreements are recognized when the qualifying expenditures are made, provided that the availability criteria are met. Expenditure-driven grant revenue is considered available if it can be collected by the state at the same time cash is disbursed to cover the associated grant expenditure. Pledges are accrued when the eligibility requirements are met and resources are available. All other accrued revenue sources are determined to be available if collectible within 12 months.
Page 68

Property taxes are levied in December for the following calendar year. The first half-year collections are due by April 30, and the second half-year collections are due by October 31. Since the state is on a fiscal year ending June 30, the first half-year collections are recognized as revenue if collectible within 60 days of the fiscal year end. The second half-year collections are recognized as receivables offset by unavailable revenue. The lien date on property taxes is January 1 of the tax levy year. Under modified accrual accounting, expenditures are generally recognized when the related liability is incurred. However, unmatured interest on general long-term obligations is recognized when due. Certain liabilities including compensated absences, other postemployment benefits, and claims and judgments are recognized when the obligations are expected to be liquidated with available spendable financial resources. The state reports both unavailable and unearned revenues on its governmental fund balance sheet. Unavailable revenues arise when a potential revenue does not meet both the “measurable” and the “available” criteria for revenue recognition in the current period. Unearned revenues arise when resources are received by the state before it has a legal claim to them, such as when grant monies are received prior to incurring qualifying expenditures/expenses. All proprietary and trust funds are accounted for using the economic resources measurement focus. With this measurement focus, all assets, liabilities, deferred outflows of resources, and deferred inflows of resources associated with the operations of these funds are included on their respective statements of net position. Operating statements present increases (i.e., revenues) and decreases (i.e., expenses) in total net position. All proprietary and trust funds are reported using the accrual basis of accounting. Under the accrual basis of accounting, revenues are recognized when earned and expenses are recognized when incurred.
D. ASSETS, LIABILITES, DEFERRED OUTFLOWS/INFLOWS OF RESOURCES AND NET POSITION/FUND BALANCE
1. Cash and Investments Investments of surplus or pooled cash balances are reported on the accompanying Statements of Net Position, Balance Sheets, and Statements of Cash Flows as “Cash and Cash Equivalents.” The Office of the State Treasurer invests state treasury cash surplus where funds can be disbursed at any time without prior notice or penalty. For reporting purposes, pooled investments are stated at fair value or amortized cost, which approximates
fair value. For purposes of reporting cash flows, the state considers cash and pooled investments to be cash equivalents. Pooled investments include short-term, highly-liquid investments that are both readily convertible to cash and are so near their maturity dates that they present insignificant risk of changes in value because of changes in interest rates. The method of accounting for investments varies depending upon the fund classification. Investments in the state’s Local Government Investment Pool (LGIP), a qualified external investment pool, are reported at amortized cost which approximates fair value. The Office of the State Treasurer prepares a stand-alone LGIP financial report. A copy of the report is available from the Office of the State Treasurer, PO Box 40200, Olympia, WA 98504-0200, online at: https://tre.wa.gov/partners/for- local- governments/local- government- investment-pool-lgip/lgip-comprehensive-annual-financial-report/ or phone number (360) 902-9000. TTY users dial 711 to be connected to the state TTY operator. The fair value of certain pension trust fund investments that are organized as limited partnerships and have no readily ascertainable fair values (including real estate, private equity, and tangible assets) has been determined by using the net asset value per share of the Pension Funds' ownership interest in partners’ capital. These values are based on the individual investee’s capital account balance reported at fair value at the closest available reporting period, adjusted for subsequent activity. At June 30, 2020, these alternative investments are valued at $52.95 billion. Because of the inherent uncertainties in the estimation of fair values, it is possible that the estimates will change in the near-term or the subsequent sale of assets will be different than the June 30, 2020, reported net asset value. Short-term money market investments and participating interest-earning investment contracts that have a remaining maturity at time of purchase of one year or less are reported at amortized cost. Nonparticipating contracts, such as nonnegotiable certificates of deposit with redemption terms that do not consider market rates, are reported using a cost-based measure. All other investments are reported at fair value. Fair values are based on published market prices, quotations from national security exchanges and security pricing services, or by the respective fund managers for securities that are not actively traded. Privately held mortgages are valued at cost, which approximates fair value. Additional disclosure describing investments is provided in Note 3.
Page 69

2. Receivables and Payables Receivables in the state’s governmental fund type accounts consist primarily of taxes and federal revenues. Receivables in all other funds have arisen in the ordinary course of business. Receivables are recorded when either the asset or revenue recognition criteria (refer to Note 1.C) have been met. All receivables are reported net of an allowance for accounts estimated to be uncollectible. For government-wide reporting purposes, amounts recorded as interfund/interagency receivables and payables are eliminated in the governmental and business-type activities columns on the Statement of Net Position, except for the net residual balances due between the governmental and business-type activities, which are reported as internal balances. Amounts recorded in governmental and business-type activities as due to or from fiduciary funds have been reported as due to or from other governments. 3. Inventories and Prepaids Consumable inventories, consisting of expendable materials and supplies held for consumption, are valued and reported in the state’s financial statements if the fiscal year-end balance on hand at an inventory control point is estimated to be $50,000 or more. Consumable inventories are valued at cost using either the first-in, first-out or weighted average methods. Donated consumable inventories are recorded at fair value. All merchandise inventories are considered reportable for financial statement purposes. Merchandise inventories are generally valued at cost using the first-in, first-out method. Inventories of governmental funds are valued at cost and recorded using the consumption method. Proprietary funds expense inventories when used or sold. For governmental fund financial reporting, inventory balances are also recorded as a nonspendable fund balance indicating that they do not constitute “available spendable resources,” except for $3.5 million in federally donated consumable inventories, which are offset by unearned revenue because they are not earned until they are distributed to clients. Prepaid items are those certain types of supplies and/or services (not inventory) that are acquired or purchased during an accounting period but not used or consumed during that accounting period. In governmental fund type accounts, prepaid items are generally accounted for using the purchases method. Under the purchases method, prepaid items are treated as expenditures when purchased and residual balances, if any, at year end are not accounted for as assets.
In proprietary and trust fund type accounts, prepaid items are accounted for using the consumption method. The portion of supplies or services consumed or used during a period is recorded as an expense. The balance that remains is reported as an asset until consumed or used.
4. Restricted Assets Certain cash, investments, and other assets are classified as restricted assets on the Statement of Net Position and Balance Sheet because their use is limited by debt covenants, escrow arrangements, or other regulations.
5. Capital Assets Capital assets are tangible and intangible assets held and used in state operations, which have a service life of more than one year and meet the state’s capitalization policy. It is the state’s policy to capitalize: • All land, including land use rights with indefinite lives
acquired with the purchase of the underlying land, and ancillary costs.
• The state highway system operated by the Department
of Transportation. • Infrastructure, other than the state highway system,
with a cost of $100,000 or more. • Buildings, building improvements, improvements
other than buildings, and leasehold improvements with a cost of $100,000 or more.
• Intangible assets, either purchased or internally
developed, with a cost of $1 million or more that are identifiable by meeting one of the following conditions:
◦ The asset is capable of being separated or divided
and sold, transferred, licensed, rented, or exchanged.
◦ The asset arises from contractual or other legal
rights, regardless of whether those rights are transferable or separable.
• All capital assets acquired with Certificates of
Participation, a debt financing program administered by the Office of the State Treasurer.
• All other capital assets with a unit cost (including ancillary costs) of $5,000 or greater, or collections with a total cost of $5,000 or greater.
Page 70
Assets acquired by capital leases are capitalized if the assets’ fair value meets the state’s capitalization thresholds described above. Purchased capital assets are valued at cost where historical records are available and at estimated historical cost where no historical records exist. Capital asset costs include the purchase price plus those costs necessary to place the asset in its intended location and condition for use (ancillary costs). Normal maintenance and repair costs that do not materially add to the value or extend the life of the state’s capital assets are not capitalized. Donated capital assets, works of art, and historical treasures are valued at their estimated acquisition value on the date of donation, plus all appropriate ancillary costs. When the acquisition value is not practically determinable due to lack of sufficient records, estimated cost is used. Where necessary, estimates of value are derived by factoring price levels from the current period to the time of acquisition. The value of assets constructed by agencies for their own use includes all direct construction costs and costs that are related to the construction. In enterprise and trust funds, net interest costs (if material) incurred during the period of construction are capitalized. In fiscal year 2020, $96.2 million in interest costs were incurred, and $2.6 million net interest costs were capitalized. State agencies are not required to capitalize art collections, library reserve collections, and museum and historical collections that are considered inexhaustible, in that their value does not diminish over time, if all of the following conditions are met: • The collection is held for public exhibition, education,
or research in furtherance of public service, rather than financial gain.
• The collection is protected, kept unencumbered, cared
for, and preserved. • The collection is subject to policy requirements that
the proceeds from sales of collection items be used to acquire other items for the collection.
Depreciation/amortization is calculated using the straight-line method over the estimated useful lives of the assets. Generally, estimated useful lives are as follows:
Buildings & building components 5-50 years Furnishings, equipment & collections 3-50 years Other improvements 3-50 years Intangibles 3-50 years Infrastructure 20-50 years
The cost and related accumulated depreciation/ amortization of disposed capital assets are removed from the accounting records. The state capitalizes the state highway system as a network but does not depreciate it since the system is being preserved approximately at or above a condition level established by the state. That condition level is documented and disclosed in the Required Supplementary Information. Additionally, the highway system is managed using an asset management system that includes: • Maintenance of an up-to-date inventory of system
assets. • Performance of condition assessments of the assets
at least every three years with summarization of the results using a measurement scale.
• Annual estimation of the amount to maintain and preserve the assets at the condition level established and disclosed.
All state highway system expenditures that preserve the useful life of the system are expensed in the period incurred. Additions and improvements that increase the capacity or efficiency of the system are capitalized. This approach of reporting condition instead of depreciating the highway system is called the modified approach. For government-wide financial reporting purposes, capital assets of the state are reported as assets in the applicable governmental or business-type activities column on the Statement of Net Position. Depreciation/amortization expense related to capital assets is reported in the Statement of Activities. Capital assets and the related depreciation/amortization expense are also reported in the proprietary fund financial statements. In governmental funds, capital assets are not capitalized in the accounts that acquire or construct them. Instead, capital acquisitions and construction are reflected as expenditures in the year assets are acquired or construction costs are incurred. No depreciation/amortization is reported.
6. Deferred Outflows/Inflows of Resources In addition to assets, the Balance Sheet and Statement of Net Position will sometimes report a separate section for deferred outflows of resources. This separate financial statement element represents a consumption of fund equity that applies to a future period(s) and so will not be recognized as an outflow of resources (expense/ expenditure) until then. The category of deferred outflow of resources reported in the government-wide and
Page 71
proprietary fund statements of net position relates to debt refunding, pensions, other postemployment benefits (OPEB), and hedging derivative instruments. In addition to liabilities, the Balance Sheet and Statement of Net Position will sometimes report a separate section for deferred inflows of resources. This separate financial statement element represents an acquisition of fund equity that applies to a future period(s) and so will not be recognized as an inflow of resources (revenue) until that time. Deferred inflows of resources reported by the state relate to unavailable revenue, debt refunding, pensions, OPEB, and hedging derivative instruments. Unavailable revenue arises only under the modified accrual basis of accounting, and so is reported only on the governmental funds Balance Sheet. Governmental funds report deferred inflows for unavailable revenues primarily from two sources: taxes and long-term receivables. These amounts are recognized as inflows of resources in the periods that the amounts become available. 7. Compensated Absences State employees accrue vested vacation leave at a variable rate based on years of service. In general, accrued vacation leave cannot exceed 240 hours at the employee’s anniversary date. Employees accrue sick leave at the rate of one day per month without limitation on the amount that can be accumulated. Sick leave is not vested (i.e., the state does not pay employees for unused sick leave upon termination except upon employee death or retirement). At death or retirement, the state is liable for 25 percent of the employee’s accumulated sick leave. In addition, the state has a sick leave buyout option in which, each January, employees who accumulate sick leave in excess of 480 hours may redeem sick leave earned but not taken during the previous year at the rate of one day’s pay in exchange for each four days of sick leave. It is the state’s policy to liquidate its compensated absences obligations with future resources rather than advance funding it with available spendable financial resources. For government-wide reporting purposes, the state reports compensated absences obligations as liabilities in the applicable governmental or business-type activities columns on the Statement of Net Position. For fund statement reporting purposes, governmental funds recognize an expenditure for annual and sick leave when it is payable (i.e., upon employee’s use, resignation, death or retirement). Proprietary and trust funds recognize the expense and accrue a liability for annual leave and estimated sick leave buyout, including related
payroll taxes and benefits, as applicable, as the leave is earned. 8. Long-Term Liabilities In the government-wide and proprietary fund financial statements, long-term obligations of the state are reported as liabilities on the Statement of Net Position. Bonds payable are reported net of applicable original issuance premiums or discounts. When material, bond premiums and discounts are deferred and amortized over the life of the bonds. For governmental fund financial reporting, the face (par) amount of debt issued is reported as other financing sources. Premiums and discounts on original debt issuance are also reported as other financing sources and uses, respectively. Issuance costs are reported as debt service expenditures.
9. Fund Equity In governmental fund type accounts, fund equity is called fund balance. Fund balance is reported in classifications which reflect the extent to which the state is bound to honor constraints on the purposes for which the amounts can be spent. Classifications include: • Nonspendable fund balance represents amounts that
are either not in a spendable form or are legally or contractually required to remain intact.
• Restricted fund balance represents amounts for
which constraints are placed on their use by the state Constitution, enabling legislation, or external resource providers such as creditors, grantors, or laws or regulations of other governments.
• Committed fund balance represents amounts that can only be used for specific purposes pursuant to constraints imposed by state law as adopted by the state Legislature. The commitment remains in place until the Legislature changes or eliminates the state law.
• Assigned fund balance represents amounts that are
intended for a specific purpose by management, but are neither restricted nor committed. Generally, assignment is expressed by joint legislative and executive staff action.
• Unassigned fund balance represents the residual
amount for the General Fund that is not contained in the other classifications. Additionally, any deficit fund balance within the other governmental fund types is reported as unassigned.
Page 72
When resources meeting more than one of the classifications (excluding nonspendable) are comingled in an account, assuming that the expenditure meets the constraints of the classification, the assumed order of spending is restricted first, committed second, and finally assigned. For government-wide reporting as well as in proprietary funds, fund equity is called net position. Net position is comprised of three components: net investment in capital assets, restricted, and unrestricted. • Net investment in capital assets consists of capital
assets, net of accumulated depreciation and reduced by outstanding balances of bonds, notes, and other debt that are attributed to the acquisition, construction, or improvement of those assets. Deferred outflows of resources and deferred inflows of resources that are attributable to the acquisition, construction, or improvement of those assets or related debt are included in this component of net position.
• Restricted net position consists of restricted assets
reduced by liabilities and deferred inflows of resources related to those assets. Assets are reported as restricted when constraints are placed on asset use either by external parties or by law through constitutional provision or enabling legislation.
• Unrestricted net position is the net amount of the
assets, deferred outflows of resources, liabilities, and deferred inflows of resources that does not meet the definition of the two preceding categories.
When both restricted and unrestricted resources are available for use, it is the state’s policy to use restricted resources first and then use unrestricted resources as they are needed. In fiduciary funds, net position is held in trust for individuals and external organizations.
E. OTHER INFORMATION
1. Insurance Activities Workers’ Compensation. Title 51 RCW establishes the state of Washington’s workers’ compensation program. The statute requires all employers to secure coverage for job-related injuries and diseases, with few exceptions, through the Workers’ Compensation Fund or through self-insurance. Direct private insurance is not authorized, although self-insurers are permitted to reinsure up to 80 percent of their obligations through private insurers.
The Workers’ Compensation Fund, an enterprise fund, is used to account for the workers’ compensation program which provides time-loss, medical, vocational, disability, and pension benefits to qualifying individuals sustaining work-related injuries or illnesses. The main benefit plans of the workers’ compensation program are funded based on rates that will keep these plans solvent in accordance with recognized actuarial principles. The supplemental pension plan supports cost-of-living adjustments (COLA) granted for time-loss and disability payments; however, these are funded on a pay-as-you-go basis. By statute, the state is only allowed to collect enough revenue to fund the current COLA payments. Premiums are based on individual employers’ reported payroll hours and insurance rates based on each employer’s risk classification(s) and past experience, except for the Supplemental Pension Fund premiums which are based on a flat rate per hours worked independent of risk class or past experience. In addition to its regular premium plan which is required for all employers, the Workers’ Compensation Fund offers a voluntary retrospective premium-rating plan under which premiums are subject to three annual adjustments based on group and individual employers’ loss experience. Initial adjustments to the standard premiums are paid to or collected from the groups and individual employers approximately ten months after the end of each plan year. The Department of Labor and Industries, as administrator of the workers’ compensation program, establishes claims liabilities based on estimates of the ultimate cost of claims (including future claims adjustment expenses) that have already occurred. The length of time for which such costs must be estimated varies depending on the benefit involved. Because actual claims costs depend on such complex factors as inflation, changes in doctrines of legal liabilities, claims adjudication, and judgments, the process used in computing claims liabilities does not necessarily result in an exact amount. Claims payable are recomputed quarterly using a variety of actuarial and statistical techniques. These techniques are used to produce current estimates that reflect recent settlements, claim frequency, expected inflation, and other economic, legal, and social factors. Adjustments to claims payable are charged or credited to claims expense in the periods in which they are made. The Workers’ Compensation Program purchases catastrophe reinsurance for risks in excess of its retention on the workers’ compensation insurance policy to reduce its exposure to the financial risks associated with a catastrophe. Reinsurance permits recovery of a portion of losses from reinsurers, although it does not discharge the primary liability of the Workers’ Compensation Program as direct insurer of the risks reinsured.
Page 73
Amounts that are recoverable from reinsurers and that relate to paid claims and claim adjustment expenses are classified as assets, with an allowance for estimated uncollectible amounts. Estimated amounts recoverable from reinsurers that relate to the liabilities for unpaid claims and claims adjustment expenses are deducted from those liabilities. Ceded unearned premiums are netted with related unearned premiums. Receivables and payables from the same reinsurer, including amounts withheld, are netted. Reinsurance premiums ceded and reinsurance recoveries on claims are netted against related earned premiums and incurred claims costs in the Statement of Revenues, Expenses, and Changes in Net Position. The Department of Labor and Industries prepares a stand-alone financial report for its workers’ compensation program. Copies of the report that include financial statements and required supplementary information may be obtained by writing to Washington State Department of Labor and Industries, PO Box 44833, Olympia, WA 98504-4833 or by visiting their website at: https://www.lni.wa.gov/agency/state-fund-financial-reports. Risk Management. The state of Washington operates a self-insurance liability program pursuant to RCW 4.92.130. The state manages its tort claims as an insurance business activity rather than a general governmental activity. The state’s policy is generally not to purchase commercial insurance for the risk of losses to which it is exposed. Instead, the state’s management believes it is more economical to manage its risks internally and set aside assets for claims settlement in the Risk Management Fund, an internal service fund. Coverage is provided up to $10 million for each claim with no deductible. Commercial insurance is purchased for various liabilities arising from the operations of the Washington state governmental functions in order to limit the exposure to catastrophic losses. Otherwise, the self-insurance liability program services all claims against the state for injuries and property damage to third parties. The majority of state funds and agencies participate in the self-insurance liability program in proportion to their anticipated exposure to liability losses. Health Insurance. The state of Washington administers and provides medical, vision, dental, basic life, and basic long-term disability insurance coverage for eligible state employees and their dependents. In addition, the Washington State Health Benefits Exchange, tribal governments, political subdivisions, and employee organizations representing state civil service employees can contract with the state to provide these benefits to their employees. The state establishes eligibility requirements and approves plan benefits of all participating health care organizations.
Due to the addition of School Employees Benefits Board accounts in fiscal year 2020, the Health Insurance Fund, formerly accounted for as an internal service fund, is now accounted for as an enterprise fund. The state’s share of the cost of coverage for state employees is based on a per capita amount determined annually by the Legislature and allocated to state agencies. The Health Care Authority (HCA), as administrator of the health care benefits programs, collects the monthly “premium” from agencies for each active employee. State employees self pay for coverage beyond the state’s contribution. For non-state employees, their respective employers, who have contracted with the HCA to provide employee benefits, pay the cost of coverage. Former employees and employees who are temporarily not in pay status are able to pay for the full cost of coverage on a self-paid basis for medical and dental benefits. Most coverage is also available on a self-paid basis to eligible retirees. For additional information, refer to Note 12. The state secures commercial insurance for certain coverage offered in addition to plans offered via the Uniform Medical Plan, the state's self-insured offering. The Uniform Medical Plan enrolled approximately 67 percent of the eligible subscribers in fiscal year 2020. Claims are paid from premiums collected, and claims adjudication is contracted through a third-party administrator. Considerations in calculating liabilities include frequency of claims, administrative costs, industry inflation trends, advances in medical technology, and other social and economic factors. Liabilities include an amount for claims incurred but not reported. 2. Postemployment Benefits COBRA. In compliance with federal law, the Consolidated Omnibus Budget Reconciliation Act of 1985 (COBRA), the state offers health and dental benefits on a temporary basis to qualified beneficiaries whose benefit coverage would otherwise end because of a qualifying event such as loss of employment. COBRA coverage is available on a self-paid basis and is the same medical and dental coverage available to state employees. Medical Expense Plan. As disclosed in Note 1.D, at the time of separation from state service due to retirement or death, the state offers a 25 percent buyout of an employee’s accumulated sick leave. Individual state agencies may offer eligible employees a medical expense plan (MEP) that meets the requirements of the Internal Revenue Code. Agencies offering an MEP deposit the retiring employee’s sick leave buyout in the MEP for reimbursement of medical expenses.
Page 74
Retirement Benefits. Refer to Note 11 Retirement Plans and Note 12 Other Postemployment Benefits. 3. Interfund/Interagency Activities The state engages in two major categories of interfund/ interagency activity: reciprocal and nonreciprocal. Reciprocal interfund/interagency activity is the internal counterpart to exchange and exchange-like transactions and includes both interfund loans and services provided and used. Nonreciprocal activity is nonexchange in nature and includes both transfers and reimbursements. 4. Donor-restricted Endowments The state of Washington reports endowments in higher education endowment permanent accounts. These
accounts are established outside of the state treasury for use by the higher education institutions. There is no state law that governs endowment spending; rather, the policies of individual university and college boards govern the spending of net appreciation on investments. Under the current spending policies, distributions to programs approximate an annual percentage rate of 4 percent of a five-year rolling average of the endowments' market valuation. The net appreciation available for authorization for expenditure by governing boards totaled $646.3 million. This amount is reported as restricted for expendable endowment funds on the government-wide Statement of Net Position.
Note 2 Accounting and Reporting Changes Reporting Changes. In May 2020, the Governmental Accounting Standards Board (GASB) issued Statement No. 95 Postponement of the Effective Dates of Certain Authoritative Guidance. In light of the COVID-19 pandemic, this Statement aimed to provide temporary relief to governments and other stakeholders by postponing the effective dates of certain provisions in Statements and Implementation Guides that are scheduled to become effective for periods beginning July 1, 2019, and later. As a result, the effective dates of Statement No. 84, Fiduciary Activities and Statement No. 90, Majority Equity Interests will be implemented in fiscal year 2021 instead of fiscal year 2020. Fund Reclassification. During fiscal year 2020, an account was abolished and its assets and liabilities were transferred to another account. As a result the beginning fund balance of the Multimodal Transportation Fund, a nonmajor special revenue fund, was reduced by $362 thousand, and the beginning fund balance of the Motor Vehicle Fund, also a nonmajor special revenue fund, was increased by $362 thousand. During fiscal year 2020, an account was reclassified to a special revenue fund type as it now has a dedicated revenue source. This resulted in a beginning fund balance
reduction of $46 thousand in the General Fund and an increase of $46 thousand in the Human Services Fund, a nonmajor special revenue fund. During fiscal year 2020, an account was reclassified from a permanent fund to a special revenue fund due to a legislative change. This resulted in a beginning fund balance reduction of $3.6 million in the Higher Education Endowment Fund. The adjustment also resulted in a beginning fund balance increase of $3.6 million in the Human Services Fund, a nonmajor special revenue fund, with a change of fund designation from restricted to committed. With the addition of the School Employees' Benefits Board accounts, the fund type of the Health Insurance Fund changed from an internal service fund to a nonmajor enterprise fund. As a result, the beginning net position in the internal service fund was reduced by $287.5 million, and beginning net position was increased by $287.5 million in the nonmajor enterprise fund. Prior Period Adjustments. The Public Stadium Authority, a major component unit, recorded a reduction of $655 thousand to the beginning net position to correct overstated revenue in fiscal year 2019. The Authority also recorded an increase in net position of $28 thousand for transactions reported in the component unit's fiscal year 2019 financial statements after the state of Washington's fiscal year 2019 Comprehensive Annual Financial Report was published.
Page 75

Fund equity at July 1, 2019, has been restated as follows (expressed in thousands):
Fund equity (deficit) at June 30, 2019, as
previously reported Fund
Reclassification Prior Period Adjustment
Fund equity (deficit) at July 1, 2019, as
restated
Governmental Funds:
General $ 4,849,521 $ (46) — $ 4,849,475 Higher Education Special Revenue 3,970,570 — — 3,970,570 Higher Education Endowment 4,410,736 (3,606) — 4,407,130 Nonmajor Governmental 6,297,756 3,651 — 6,301,407
Proprietary Funds:
Enterprise Funds Workers' Compensation (10,232,282) — — (10,232,282) Unemployment Compensation 5,066,859 — — 5,066,859 Higher Education Student Services 901,944 — — 901,944 Nonmajor Enterprise 563,502 287,451 — 850,953
Internal Service Funds (182,659) (287,451) — (470,110)
Fiduciary Funds:
Private Purpose Trust 3,523 — — 3,523 Local Government Investment Pool 13,851,876 — — 13,851,876 Pension and Other Employee Benefit Plans 120,359,345 — — 120,359,345
Component Units:
Public Stadium Authority 245,041 — (627) 244,414 Health Benefit Exchange 8,009 — — 8,009 Valley Medical Center 271,832 — — 271,832 Nonmajor Component Units 432,561 — — 432,561
Page 76

Note 3 Deposits and Investments
A. DEPOSITS
Custodial Credit Risk. Custodial credit risk is the risk associated with the failure of a depository financial institution. In the event of a depository financial institution’s failure, it is the risk that the state would not be able to recover its deposits or collateralized securities that are in the possession of the outside parties. The state minimizes custodial credit risk by restrictions set forth in state law. Statutes require state agencies to deposit funds in financial institutions that are physically
located in Washington unless otherwise expressly permitted by statute and authorized by the Washington Public Deposit Protection Commission (PDPC). The PDPC, established under chapter 39.58 of the Revised Code of Washington (RCW), makes and enforces regulations and administers a collateral pool program to ensure public funds are protected if a financial institution becomes insolvent. Securities pledged are held by a trustee agent for the benefit of the collateral pool. At June 30, 2020, $1.80 billion of the state’s deposits with financial institutions were insured or collateralized, with the remaining $486 thousand uninsured/uncollateralized.
B. INVESTMENTS - PENSION AND OTHER EMPLOYEE BENEFIT TRUST FUNDS (PENSION TRUST FUNDS)
1. Summary of Investment Policies Under RCW 43.33A.030, trusteeship of the pension trust funds is vested within the voting members of the Washington State Investment Board (WSIB). The Legislature has established a standard of care for investment of these funds in RCW 43.33A.140. Additionally, the WSIB and its staff must comply with other state laws, such as the Ethics in Public Service Act, chapter 42.52 RCW, in making investment decisions and seeking to meet investment objectives. The pension trust funds consist of retirement contributions from employer and employee participants in the Washington State Retirement System and related earnings on those contributions. The Retirement System is administered by the Department of Retirement Systems. The WSIB has exclusive control of the investment of all money invested in the pension trust funds. In accordance with RCW 43.33A.110, the WSIB manages the pension fund portfolio to achieve maximum return at a prudent level of risk. The WSIB establishes asset allocation targets that must be considered at all times when making investment decisions. The asset mix may deviate from the target. Deviations greater than predetermined acceptable levels require rebalancing back to the target. When an asset class exceeds its range, the goal of rebalancing is to meet the target allocation within consideration of the other remaining asset classes. Eligible Investments. The WSIB is authorized by statute as having investment management responsibility for pension trust funds. The WSIB is authorized to invest as provided by statute (chapter 43.33A RCW) and WSIB
policy in the following: U.S. treasury bills; discount notes; repurchase agreements; reverse repurchase agreements; banker’s acceptances; commercial paper; guaranteed insurance contracts; U.S. government and agency (government sponsored corporations eligible for collateral purposes at the Federal Reserve) securities; non-U.S. dollar bonds; investment grade corporate bonds; non-investment grade corporate bonds; publicly traded mortgage-backed securities; privately placed mortgages; private placements of corporate debt; U.S. and foreign common stock; U.S. preferred stock; convertible securities; private equity including but not limited to investment corporations, partnerships, and limited liability companies for venture capital, leveraged buy-outs, real estate and other tangible assets, or other forms of private equity; asset-backed securities; and derivative securities including futures, options, options on futures, forward contracts, and swap transactions. There were no violations of these investment restrictions during fiscal year 2020. Commingled Trust Fund. Pension trust funds are invested in the Commingled Trust Fund (CTF). The CTF is a diversified pool of investments used as an investment vehicle for 14 separate retirement plans and one supplemental pension funding account. These plans hold shares in the CTF which represent a percentage ownership in the pool of investments. Plans are allowed to purchase or sell shares in the CTF, based on the fair value of the underlying assets, on the first business day of each month. In addition to share ownership in the CTF, each retirement plan holds short-term investments that are used to manage the cash needs of each retirement plan. The CTF consists of the Public Employees’ Retirement System (PERS) Plans 1, 2, and 3; Teachers’ Retirement System (TRS) Plans 1, 2, and 3; School Employees’ Retirement System (SERS) Plans 2 and 3; Law Enforcement Officers’ and Fire Fighters’ Retirement Plans 1 and 2; Washington State Patrol Retirement System Plans 1 and 2; Public Safety Employees’ Retirement
Page 77

System Plan 2; Volunteer Fire Fighters’ and Reserve Officers’ Relief and Pension Fund; and the Higher Education Retirement Supplemental Benefit Fund. The CTF includes both the defined benefit and defined contribution portions of PERS Plan 3, TRS Plan 3, and SERS Plan 3, which are hybrid defined benefit/defined contribution plans. The participants of those plans have the option to direct their contributions to the CTF or invest their defined contributions in other external options not managed by the WSIB. CTF Investment Policies and Restrictions. The CTF is comprised of public markets equities, fixed income securities, private equity investments, real estate, tangible assets, and an innovation portfolio. The CTF’s performance objective is to exceed the return of two custom benchmarks, each consisting of public indices weighted according to asset allocation targets. The asset allocation for the CTF is formally reviewed at least every four years. The allocation policy is reviewed more frequently if there has been a fundamental change in the structure of the capital markets or in the underlying cash flow or liability structure of the pension trust funds. When market values fall outside policy ranges, assets are rebalanced first by using normal cash flows and then through reallocations of assets across asset classes. In cases of a major rebalancing, the pension trust funds can utilize futures, forward contracts, and options in order to maintain exposure within each asset class and reduce transaction costs. Major rebalancing can occur to bring asset classes within their target ranges or when the pension trust funds are transitioning managers. Public Markets Equity. To achieve the performance and diversification objectives of the pension trust funds, the public markets equity program seeks to achieve the highest return possible consistent with prudent risk management and the desire for downside protection, with passive equity strategies as the default whenever strategies with better risk/return profiles cannot be identified; provide diversification to the pension trust funds’ overall investment program; maintain liquidity in public equity; and maintain transparency into all public equity strategies to the extent possible. The public markets equity portion of the pension trust funds invests in publicly traded equities globally, including equity securities in the U.S., developed non-U.S., and emerging markets. The program has a global benchmark, currently the Morgan Stanley Capital International (MSCI) All Country World Investable Market Index. A mix of external managers approved by the WSIB is used to manage the program. Passive management delivers broad diversified equity market exposure at low cost and is used when active managers cannot be identified and monitored appropriately. Passive management is also used
when it is considered an appropriate alternative to active management, typically in more efficient markets. Active management is used when the pension trust funds can identify, access, and monitor successful managers in markets that are less efficient. Active management seeks to enhance the risk/return profile of the program. Fixed Income. The fixed income segment is managed to achieve the highest return possible consistent with the desire to manage interest rate and credit risk, provide diversification to the overall investment program, provide liquidity to the pension trust fund investment program, and to meet or exceed the return of the Bloomberg Barclays U.S. Universal Index. Sources of outperformance are expected to include interest rate anticipation, sector rotation, credit selection, and diversification. RCW 43.33A.140 prohibits a corporate fixed income issues cost from exceeding 3 percent of the CTF’s market value at the time of purchase and 6 percent of its market value thereafter. However, the WSIB manages with a more restrictive concentration constraint, limiting exposure to any corporate issuer to 3 percent of the CTF fixed income portfolio’s market value at all times. The fixed income portfolio is constrained by policy from investing more than 1 percent of the portfolio’s par value in any single issuer with a quality rating below investment grade (as defined by Bloomberg Barclays Capital Global Family of Fixed Income Indices). Total market value of below investment grade credit bonds (as defined by Bloomberg Barclays Capital Global Family of Fixed Income Indices) shall not exceed 15 percent of the market value of the fixed income portfolio. Although below investment grade mortgage-backed, asset-backed, or commercial mortgage-backed securities may not be purchased, portfolio holdings that are downgraded to those levels or are no longer rated may continue to be held. The total market value of below investment grade mortgage-backed, asset-backed, and commercial mortgage-backed securities shall not exceed 5 percent of the market value of the fixed income portfolio. The duration of the portfolio is targeted to be within plus or minus 20 percent of the duration of the Bloomberg Barclays U.S. Universal Index. The major sector allocations of the fixed income portfolio are limited to the following ranges:
U.S. treasuries and government agencies 10% - 45% Credit bonds 10% - 80% Asset-backed securities 0% - 10% Commercial mortgage-backed securities 0% - 10% Mortgage-backed securities 5% - 45%
Page 78
Asset allocation policy constraints may, from time to time, place unintended burdens on the portfolios. Therefore, policy exceptions are allowed under certain circumstances. These events include changes in market interest rates, portfolio rebalancing to strategic targets, and bond rating downgrades. The portfolio can remain outside of policy guidelines until it can be rebalanced without harming the portfolio. Private Equity. Pension trust funds can be invested in any appropriate private equity investment opportunity that has the potential for returns superior to traditional investment opportunities and which is not prohibited by the WSIB’s policies or by law. These investment types are generally divided into venture capital, corporate finance, growth equity, special situations, distressed, mezzanine, and other investments. Private equity investments are made through limited partnership or direct investment vehicles. The private equity investment portfolio is managed to exceed the returns of the MSCI All Country World Index Investable Market Index, lagged by one calendar quarter, by 300 basis points in the long run. To meet the return and plan objectives, the private equity portfolio has diversified investments in companies in a variety of growth stages. The portfolio also includes a broad cross-section of opportunities in different industries and geographic regions. Real Estate. The WSIB’s real estate program is an externally managed pool of selected partnership investments intended to provide alternative portfolio characteristics when compared to traditional stock and bond investments. The majority of the WSIB’s partnerships invest in institutional-quality real estate assets that are leased to third parties. The income generated from bond-like lease payments coupled with the hard asset qualities of commercial real estate combine to generate returns that are expected to fall between the return expectations for fixed income and equities over the long term. The real estate portfolio is managed to deliver risk-adjusted returns that are consistent with the WSIB’s long-term return expectations for the asset class. The pension trust funds' real estate partnerships typically invest in private real estate assets that are held for long-term income and appreciation. Many of the pension trust funds' investment partnerships do not involve co-investment with other financial entities, thereby providing the WSIB with control provisions, related transactions, and ongoing operational decisions for annual capital expenditures.
The pension trust funds may invest in any real estate opportunity demonstrating acceptable risk-adjusted returns, provided it is not prohibited by state law or WSIB policy. Investment structures may include real estate operating companies, joint ventures, commingled funds (closed or open-ended), and co-investments with existing WSIB real estate partners. Diversification within the real estate program is achieved through consideration of property type, capital structure, life cycle, geographic region, partner concentration, and capital level. The WSIB’s real estate portfolio current benchmark seeks to earn an 8 percent annual investment return over a rolling 10-year period. Tangible Assets. The primary goal of the tangible asset portfolio is to generate a long-term, predictable and persistent income stream. The secondary goal is to generate appreciation approximately commensurate with inflation. The structure of the investments is primarily targeted to those private funds or separate accounts providing the WSIB with the most robust governance provisions related to acquisitions, dispositions, debt levels, and ongoing operational decisions for annual capital expenditures. For diversification purposes, the tangible asset portfolio focuses on income-producing physical assets in the upstream and midstream segments of four main industries: minerals and mining, energy, agriculture, and society essentials. The WSIB’s current return objective for tangible assets calls for a target benchmark of 400 basis points above the U.S. Consumer Price Index over a long-term investment horizon defined as at least five years. Innovation Portfolio. The innovation portfolio investment strategy is to provide the WSIB with the ability to invest in assets that fall outside of traditional asset classes and to provide the WSIB with comfort and demonstrated success before committing large dollar amounts to the strategy. The overall benchmark for the innovation portfolio is the weighted average of the underlying benchmark for each asset in the portfolio. Currently, there are eight investment strategies in the innovation portfolio involving private partnerships. 2. Valuation of Investments The pension trust fund reports investments at fair value and categorizes its fair value measurements within the fair value hierarchy established by generally accepted accounting principles. Unrealized gains and losses are included in the Statement of Changes in Net Position.
Page 79
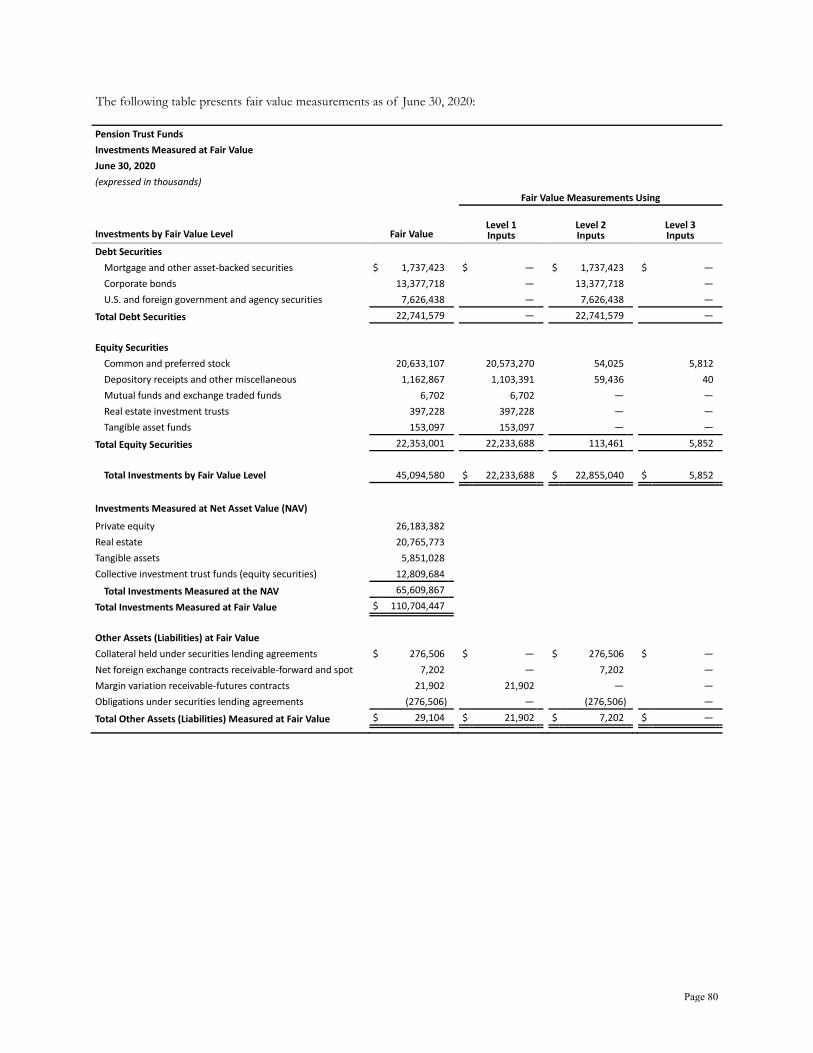
The following table presents fair value measurements as of June 30, 2020:
Pension Trust Funds Investments Measured at Fair Value June 30, 2020 (expressed in thousands) Fair Value Measurements Using
Investments by Fair Value Level Fair Value Level 1 Inputs
Level 2 Inputs
Level 3 Inputs
Debt Securities Mortgage and other asset-backed securities $ 1,737,423 $ — $ 1,737,423 $ — Corporate bonds 13,377,718 — 13,377,718 — U.S. and foreign government and agency securities 7,626,438 — 7,626,438 —
Total Debt Securities 22,741,579 — 22,741,579 — Equity Securities
Common and preferred stock 20,633,107 20,573,270 54,025 5,812 Depository receipts and other miscellaneous 1,162,867 1,103,391 59,436 40 Mutual funds and exchange traded funds 6,702 6,702 — — Real estate investment trusts 397,228 397,228 — — Tangible asset funds 153,097 153,097 — —
Total Equity Securities 22,353,001 22,233,688 113,461 5,852
Total Investments by Fair Value Level 45,094,580 $ 22,233,688 $ 22,855,040 $ 5,852 Investments Measured at Net Asset Value (NAV) Private equity 26,183,382 Real estate 20,765,773 Tangible assets 5,851,028 Collective investment trust funds (equity securities) 12,809,684
Total Investments Measured at the NAV 65,609,867 Total Investments Measured at Fair Value $ 110,704,447
Other Assets (Liabilities) at Fair Value Collateral held under securities lending agreements $ 276,506 $ — $ 276,506 $ — Net foreign exchange contracts receivable-forward and spot 7,202 — 7,202 — Margin variation receivable-futures contracts 21,902 21,902 — — Obligations under securities lending agreements (276,506) — (276,506) — Total Other Assets (Liabilities) Measured at Fair Value $ 29,104 $ 21,902 $ 7,202 $ —
Page 80
Investments classified as level 1. Investments classified as level 1 in the previous table are exchange traded equity securities whose values are based on published market prices and quotations from national security exchanges as of the appropriate market close, as of each reporting period end. Investments classified as level 2. Investments classified as level 2 in the previous table are primarily comprised of publicly traded debt securities and exchange traded stocks traded in inactive markets. Publicly traded debt securities are sourced from reputable pricing vendors using models that are market-based measurements representing their good faith opinion as to the exit value of a debt security in an orderly transaction under current market conditions. Such models take into account quoted prices, nominal yield spreads, benchmark yield curves, prepayment speeds, and other market corroborated inputs. Investments classified as level 3. Investments classified as level 3 in the previous table were publicly traded equity securities that have noncurrent or “stale” values and are included in the table at the last traded price. The stale pricing occurred due to trading suspensions, delisting from an active exchange, or lack of investor demand. The current market values of these securities are unknown. Investments measured at net asset value (NAV). Investments measured at net asset value in the pension trust funds are the collective investment trust funds and alternative investments, including private equity, real estate, and tangible assets. Collective Investment Trust Funds. The pension trust fund invests in three separate collective investment trust funds (fund). Each fund determines a fair value by obtaining fair values of the underlying holdings using reputable pricing sources and computing an overall net asset value per share. The holdings within each fund are publicly traded equity securities. Two funds are passively managed to approximate the capitalization weighted total rates of return of the MSCI U.S. Investable Market Index and the MSCI Emerging Markets Investable Market Index. Each fund has daily openings and contributions, and withdrawals can be made on any business day. The fund managers, at their discretion, may require withdrawal proceeds to be made partially or wholly in kind. Under certain circumstances, the fund managers may choose to suspend valuation
and/or the right to make contributions and withdrawals from the fund. Such circumstances include actual or anticipated closure, restriction, or suspension of trading activity in any markets or exchanges where the fund investments are traded; where the purchase, sale, or pricing of the fund’s investments would not be reasonably practicable or advisable; or where suspending contributions or withdrawals would be in the best interest of the fund or participants. The third fund seeks to achieve long-term capital appreciation through active investment management in emerging market countries. The index against which the fund compares its performance is the MSCI Emerging Market Index. The pension trust funds may redeem some or all of their holdings on each monthly valuation date. The fund manager may delay redemption proceeds if it determines that it is reasonably necessary to prevent a material adverse impact on the fund or other investors. The fund manager, at their discretion, may require withdrawal proceeds to be made partially or wholly in kind. Alternative Assets. The fair value of investments that are organized as limited partnerships and have no readily ascertainable fair value is determined by using the net asset value per share (or its equivalent) of the pension trust funds' ownership interest in partners’ capital. These values are based on the individual investee’s capital account balance reported at fair value by the general partner at the closest available reporting period, adjusted for subsequent contributions, distributions, management fees, changes in values of foreign currency, and published market prices for certain securities. The limited partnerships’ annual financial statements are audited by independent auditors. These investments are valued at approximately $52.95 billion as of June 30, 2020. Because of the inherent uncertainties in estimating fair values, it is possible that the estimates will change in the near-term or the subsequent sale of assets will be different than the June 30, 2020, reported net asset value. With the exception of two publicly traded funds, these investments can never be redeemed. Instead, the nature of these investments provides for distributions through the sale or liquidation of the underlying assets or net operating cash flows. It is anticipated that the various investments within each asset class will be liquidated over the following periods:
Page 81
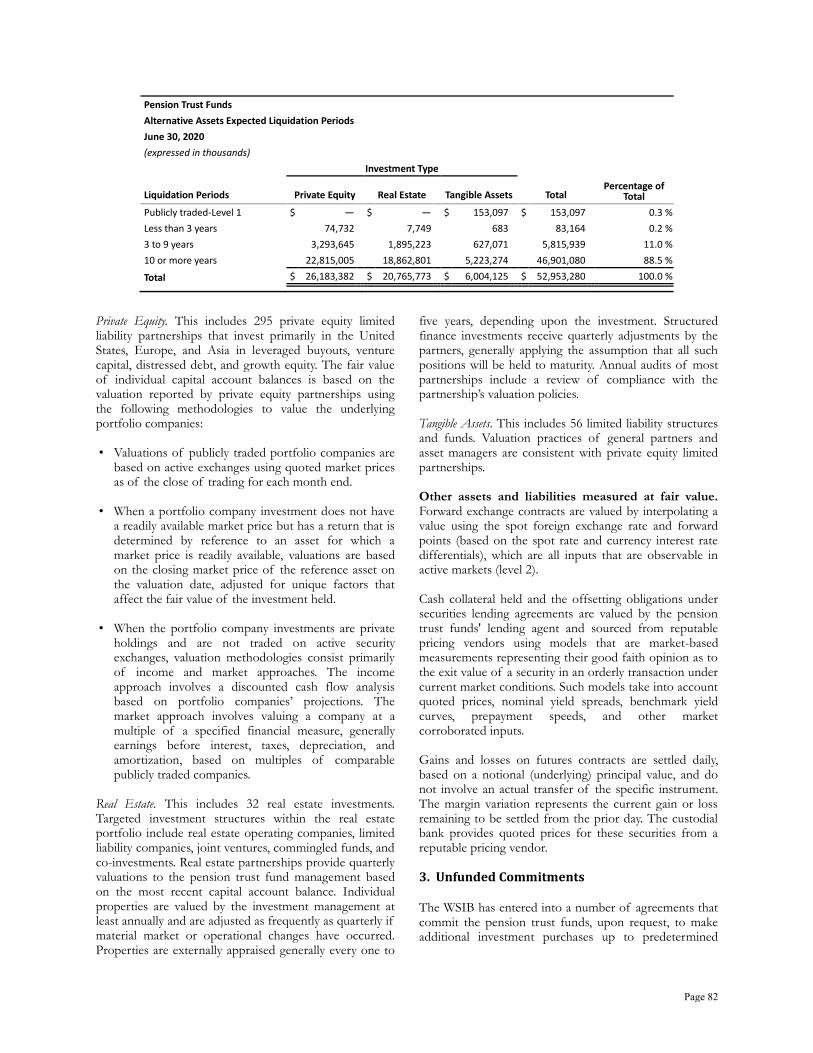
Pension Trust Funds Alternative Assets Expected Liquidation Periods June 30, 2020 (expressed in thousands) Investment Type
Liquidation Periods Private Equity Real Estate Tangible Assets Total Percentage of
Total Publicly traded-Level 1 $ — $ — $ 153,097 $ 153,097 0.3 % Less than 3 years 74,732 7,749 683 83,164 0.2 % 3 to 9 years 3,293,645 1,895,223 627,071 5,815,939 11.0 % 10 or more years 22,815,005 18,862,801 5,223,274 46,901,080 88.5 % Total $ 26,183,382 $ 20,765,773 $ 6,004,125 $ 52,953,280 100.0 %
Private Equity. This includes 295 private equity limited liability partnerships that invest primarily in the United States, Europe, and Asia in leveraged buyouts, venture capital, distressed debt, and growth equity. The fair value of individual capital account balances is based on the valuation reported by private equity partnerships using the following methodologies to value the underlying portfolio companies: • Valuations of publicly traded portfolio companies are
based on active exchanges using quoted market prices as of the close of trading for each month end.
• When a portfolio company investment does not have a readily available market price but has a return that is determined by reference to an asset for which a market price is readily available, valuations are based on the closing market price of the reference asset on the valuation date, adjusted for unique factors that affect the fair value of the investment held.
• When the portfolio company investments are private holdings and are not traded on active security exchanges, valuation methodologies consist primarily of income and market approaches. The income approach involves a discounted cash flow analysis based on portfolio companies’ projections. The market approach involves valuing a company at a multiple of a specified financial measure, generally earnings before interest, taxes, depreciation, and amortization, based on multiples of comparable publicly traded companies.
Real Estate. This includes 32 real estate investments. Targeted investment structures within the real estate portfolio include real estate operating companies, limited liability companies, joint ventures, commingled funds, and co-investments. Real estate partnerships provide quarterly valuations to the pension trust fund management based on the most recent capital account balance. Individual properties are valued by the investment management at least annually and are adjusted as frequently as quarterly if material market or operational changes have occurred. Properties are externally appraised generally every one to
five years, depending upon the investment. Structured finance investments receive quarterly adjustments by the partners, generally applying the assumption that all such positions will be held to maturity. Annual audits of most partnerships include a review of compliance with the partnership’s valuation policies. Tangible Assets. This includes 56 limited liability structures and funds. Valuation practices of general partners and asset managers are consistent with private equity limited partnerships. Other assets and liabilities measured at fair value. Forward exchange contracts are valued by interpolating a value using the spot foreign exchange rate and forward points (based on the spot rate and currency interest rate differentials), which are all inputs that are observable in active markets (level 2). Cash collateral held and the offsetting obligations under securities lending agreements are valued by the pension trust funds' lending agent and sourced from reputable pricing vendors using models that are market-based measurements representing their good faith opinion as to the exit value of a security in an orderly transaction under current market conditions. Such models take into account quoted prices, nominal yield spreads, benchmark yield curves, prepayment speeds, and other market corroborated inputs. Gains and losses on futures contracts are settled daily, based on a notional (underlying) principal value, and do not involve an actual transfer of the specific instrument. The margin variation represents the current gain or loss remaining to be settled from the prior day. The custodial bank provides quoted prices for these securities from a reputable pricing vendor. 3. Unfunded Commitments The WSIB has entered into a number of agreements that commit the pension trust funds, upon request, to make additional investment purchases up to predetermined
Page 82

amounts. As of June 30, 2020, the pension trust funds had total unfunded commitments of $32.64 billion in the following asset classes: $19.08 billion in private equity, $8.70 billion in real estate, and $4.86 billion in tangible assets. 4. Securities Lending State law and WSIB policy permit the pension trust funds to participate in securities lending programs to augment investment income. The WSIB has entered into an agreement with State Street Corporation to act as agent for the pension trust funds in securities lending transactions. As State Street Corporation is the custodian bank for the pension trust funds, it is counterparty to securities lending transactions. The fair value of the securities on loan at June 30, 2020, was approximately $423.1 million. The pension trust funds report securities on loan in their respective categories in the Statement of Net Position. At June 30, 2020, cash collateral received totaling $276.5 million is reported as securities lending obligation, and the fair value of the reinvested cash collateral totaling $276.5 million is reported as security lending collateral in the Statement of Net Position. Securities received as collateral for which the pension trust funds do not have the ability to pledge or sell unless the borrower defaults are not reported as assets and liabilities in the Statement of Net Position. Total securities received as collateral at June 30, 2020, was $158.0 million. During the fiscal year, debt and equity securities were loaned and collateralized by the pension trust funds’ agent with cash and U.S. government or U.S. agency securities including U.S. agency mortgage-backed securities (exclusive of letters of credit). When the loaned securities had collateral denominated in the same currency, the collateral requirement was 102 percent of the fair value, including accrued interest, of the securities loaned. All other securities were required to be collateralized at 105 percent of the fair value, including accrued interest, of the loaned securities. The following table summarizes the securities held by the pension trust funds from reinvestment of cash collateral and securities received as collateral at June 30, 2020 (in millions):
U.S. treasuries $ 133.3 Repurchase agreements 105.5 Yankee CD 76.7 Commercial paper 71.0 Mortgage-backed securities 24.7 Cash equivalents and other 23.3
Total Collateral Held $ 434.5
During fiscal year 2020, securities lending transactions could be terminated on demand by either the pension trust funds or the borrower. As of June 30, 2020, the cash collateral held had an average duration of 10.3 days and an average weighted final maturity of 33.1 days. Because the securities lending agreements were terminable at will, their duration did not generally match the duration of the investments made with the cash collateral. Non-cash collateral could not be pledged or sold absent borrower default. No more than 20 percent of the total on loan value could be held by a specific borrower. Collateral investment guidelines specifically prohibit European domiciled holdings. There are no restrictions on the amount of securities that can be lent. Securities were lent with the agreement that they would be returned in the future for exchange of the collateral. State Street Corporation indemnified the pension trust funds by agreeing to purchase replacement securities or return the cash collateral in the event a borrower failed to return the loaned securities or pay distributions thereon. State Street Corporation’s responsibilities included performing appropriate borrower and collateral investment credit analyses, demanding adequate types and levels of collateral, and complying with applicable federal regulations concerning securities lending. During fiscal year 2020, there were no significant violations of legal or contractual provisions and no failures by any borrowers to return loaned securities or to pay distributions thereon. Further, the pension trust funds incurred no losses during fiscal year 2020 resulting from a default by either the borrowers or the securities lending agents. 5. Interest Rate Risk Interest rate risk is the risk that changes in interest rates over time will adversely affect the fair value of an investment. The risk is managed within the portfolios using effective duration, which is the measure of a debt investment’s exposure to fair value changes arising from changes in interest rates. Increases in prevailing interest rates generally translate into decreases in fair values of fixed income investments. While the pension trust funds do not have a formal policy relating to interest rate risk, the pension trust funds’ fixed income investments are actively managed to meet or exceed the return of the Bloomberg Barclays U.S. Universal Index, with volatility similar to or less than the index. The fixed income portfolio's duration is targeted within plus or minus 20 percent of the duration of the portfolio’s performance benchmark. As of June 30, 2020, the duration of the pension trust funds’ fixed income investments was within the duration target of this index.
Page 83
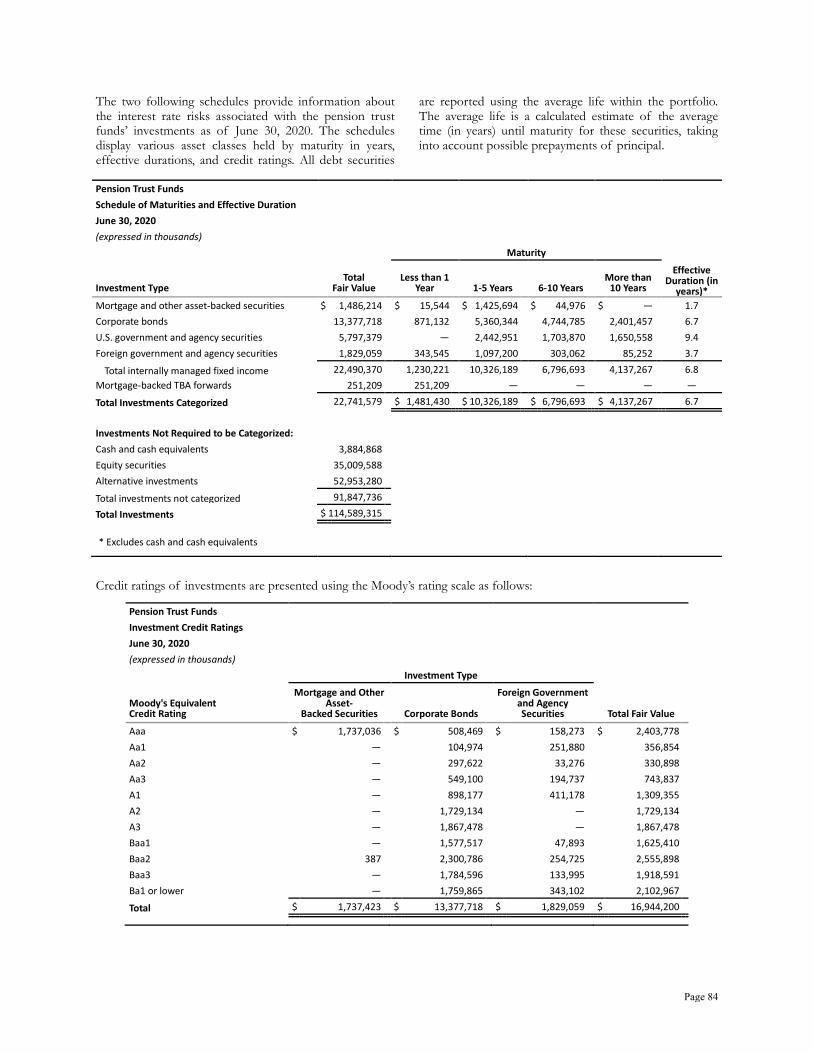
The two following schedules provide information about the interest rate risks associated with the pension trust funds’ investments as of June 30, 2020. The schedules display various asset classes held by maturity in years, effective durations, and credit ratings. All debt securities
are reported using the average life within the portfolio. The average life is a calculated estimate of the average time (in years) until maturity for these securities, taking into account possible prepayments of principal.
Pension Trust Funds Schedule of Maturities and Effective Duration June 30, 2020 (expressed in thousands) Maturity
Investment Type Total
Fair Value Less than 1
Year 1-5 Years 6-10 Years More than
10 Years Effective
Duration (in years)*
Mortgage and other asset-backed securities $ 1,486,214 $ 15,544 $ 1,425,694 $ 44,976 $ — 1.7 Corporate bonds 13,377,718 871,132 5,360,344 4,744,785 2,401,457 6.7 U.S. government and agency securities 5,797,379 — 2,442,951 1,703,870 1,650,558 9.4 Foreign government and agency securities 1,829,059 343,545 1,097,200 303,062 85,252 3.7
Total internally managed fixed income 22,490,370 1,230,221 10,326,189 6,796,693 4,137,267 6.8 Mortgage-backed TBA forwards 251,209 251,209 — — — — Total Investments Categorized 22,741,579 $ 1,481,430 $ 10,326,189 $ 6,796,693 $ 4,137,267 6.7
Investments Not Required to be Categorized: Cash and cash equivalents 3,884,868 Equity securities 35,009,588 Alternative investments 52,953,280 Total investments not categorized 91,847,736 Total Investments $ 114,589,315
* Excludes cash and cash equivalents
Credit ratings of investments are presented using the Moody’s rating scale as follows:
Pension Trust Funds Investment Credit Ratings June 30, 2020 (expressed in thousands) Investment Type
Moody's Equivalent Credit Rating
Mortgage and Other Asset-
Backed Securities Corporate Bonds
Foreign Government and Agency Securities Total Fair Value
Aaa $ 1,737,036 $ 508,469 $ 158,273 $ 2,403,778 Aa1 — 104,974 251,880 356,854 Aa2 — 297,622 33,276 330,898 Aa3 — 549,100 194,737 743,837 A1 — 898,177 411,178 1,309,355 A2 — 1,729,134 — 1,729,134 A3 — 1,867,478 — 1,867,478 Baa1 — 1,577,517 47,893 1,625,410 Baa2 387 2,300,786 254,725 2,555,898 Baa3 — 1,784,596 133,995 1,918,591 Ba1 or lower — 1,759,865 343,102 2,102,967 Total $ 1,737,423 $ 13,377,718 $ 1,829,059 $ 16,944,200
Page 84

6. Credit Risk Credit risk is the risk that an issuer or other counterparty to an investment will not fulfill its obligations. The pension trust funds’ investment policies limit the fixed income securities to investment grade or higher at the time of purchase. Investment grade securities are those fixed income securities with a Moody’s rating of Aaa to Baa or a Standard and Poor’s rating of AAA to BBB. The rated debt investments of the pension trust funds as of June 30, 2020, were rated by Moody’s and/or an equivalent national rating organization. Concentration of Credit Risk. Concentration of credit risk is the risk of loss attributed to the magnitude of an investment in a single issuer. The policy of the pension trust funds states no corporate fixed income issue cost shall exceed 3 percent of cost at the time of purchase or 6 percent of fair value thereafter of the fund, and no high yield issues shall exceed 1 percent of cost or 2 percent of fair value of the fund. There was no concentration of credit risk exceeding these policy guidelines as of June 30, 2020. Custodial Credit Risk. Custodial credit risk is the risk that, in the event a depository institution or counterparty fails, the pension trust funds would not be able to recover the value of their deposits, investments, or collateral securities. The pension trust funds do not have a policy relating to custodial credit risk. The WSIB mitigates
custodial credit risk by having its investment securities (excluding cash, cash equivalents, and repurchase agreements held as securities lending collateral) registered and held in the name of the WSIB for the benefit of the pension trust funds. 7. Foreign Currency Risk Foreign currency risk is the risk that changes in exchange rates will adversely affect the fair value of an investment or a deposit. The pension trust funds do not have a formal policy to limit foreign currency risk. The WSIB manages their exposure to fair value loss by requiring their international securities investment managers to maintain diversified portfolios by sector and by issuer, to limit foreign currency and security risk. The following schedule presents the exposure of the pension trust funds’ investments to foreign currency risk. The schedule provides information on deposits and investments held in various foreign currencies. Private equity, real estate, and tangible assets are presented according to the financial reporting currency of the individual funds. This is not a presentation of currency exposure relating to the underlying holdings. The schedule is stated in U.S. dollars. In addition, the CTF has foreign currency exposure at June 30, 2020, of $683.3 million invested in one emerging market commingled equity investment trust fund.
Page 85

Pension Trust Funds Foreign Currency Exposure by Country June 30, 2020 (expressed in thousands) Investment Type in U.S. Dollar Equivalent
Foreign Currency Denomination
Cash and Cash Equivalents
Debt Securities
Equity Securities
Alternative Assets
Open Foreign Exchange
Contracts-Net Total Australia-Dollar $ 2,766 $ 73,207 $ 469,326 $ 180,509 $ 47 $ 725,855 Brazil-Real 237 51,262 208,147 — (2) 259,644 Canada-Dollar 9,243 — 675,523 — 83 684,849 Chile-Peso 219 50,037 13,049 — — 63,305 China-Renminbi 85 — — — 221 306 China-Yuan Renminbi 1,467 27,584 289,491 — 56 318,598 Columbia-Peso 195 59,949 5,677 — — 65,821 Denmark-Krone 47 — 264,911 — 118 265,076 E.M.U.-Euro 6,605 — 2,766,041 3,590,107 1,756 6,364,509 Hong Kong-Dollar 11,050 — 1,190,307 — — 1,201,357 India-Rupee — 37,618 90,520 — — 128,138 Indonesia-Rupiah 72 22,045 58,564 — — 80,681 Japan-Yen 16,482 — 2,257,804 — 2,619 2,276,905 Mexico-Peso 114 33,514 68,202 — 271 102,101 New Taiwan-Dollar 136 — 289,376 — — 289,512 New Zealand-Dollar 169 — 29,827 — 1,186 31,182 Norway-Krone 307 — 46,300 — 154 46,761 Singapore-Dollar 2,600 — 144,563 — 213 147,376 South Africa-Rand 4,262 — 93,361 27,561 610 125,794 South Korea-Won — — 441,096 — (9) 441,087 Sweden-Krona 799 — 295,107 — (435) 295,471 Switzerland-Franc 1,594 — 956,263 — (1,051) 956,806 Thailand-Baht 97 — 55,707 — — 55,804 Turkey-Lira 114 — 66,825 — (1,051) 65,888 United Kingdom-Pound 6,256 — 1,589,088 — 1,575 1,596,919 Uruguay-Peso — 44,503 — — — 44,503 Other 805 8,102 98,975 — 841 108,723 Total $ 65,721 $ 407,821 $ 12,464,050 $ 3,798,177 $ 7,202 $ 16,742,971
8. Derivatives Pension trust funds are authorized to utilize various derivative financial instruments including financial futures, forward contracts, interest rate swaps, credit default swaps, equity swaps, and options. Derivative transactions involve, to varying degrees, market and credit risk. At June 30, 2020, the pension trust funds held investments in financial futures, forward currency contracts, and total return swap contracts that are recorded at fair value with changes in value recognized in investment income in the Statement of Revenues, Expenses, and Changes in Net Position in the period of change. The derivative instruments are considered investment derivatives and not hedging derivatives.
Derivatives are generally used to achieve the desired market exposure of a security, index, or currency; adjust portfolio duration; or rebalance the total portfolio to the target asset allocation. Derivative contracts are instruments that derive their value from underlying assets, indices, reference interest rates, or a combination of these factors. A derivative instrument could be a contract negotiated on behalf of the pension trust funds and a specific counterparty. This would typically be referred to as an over the counter (OTC) contract, such as forward and total return swap contracts. Alternatively, a derivative instrument, such as futures, could be listed and traded on an exchange and referred to as “exchange traded.”
Page 86
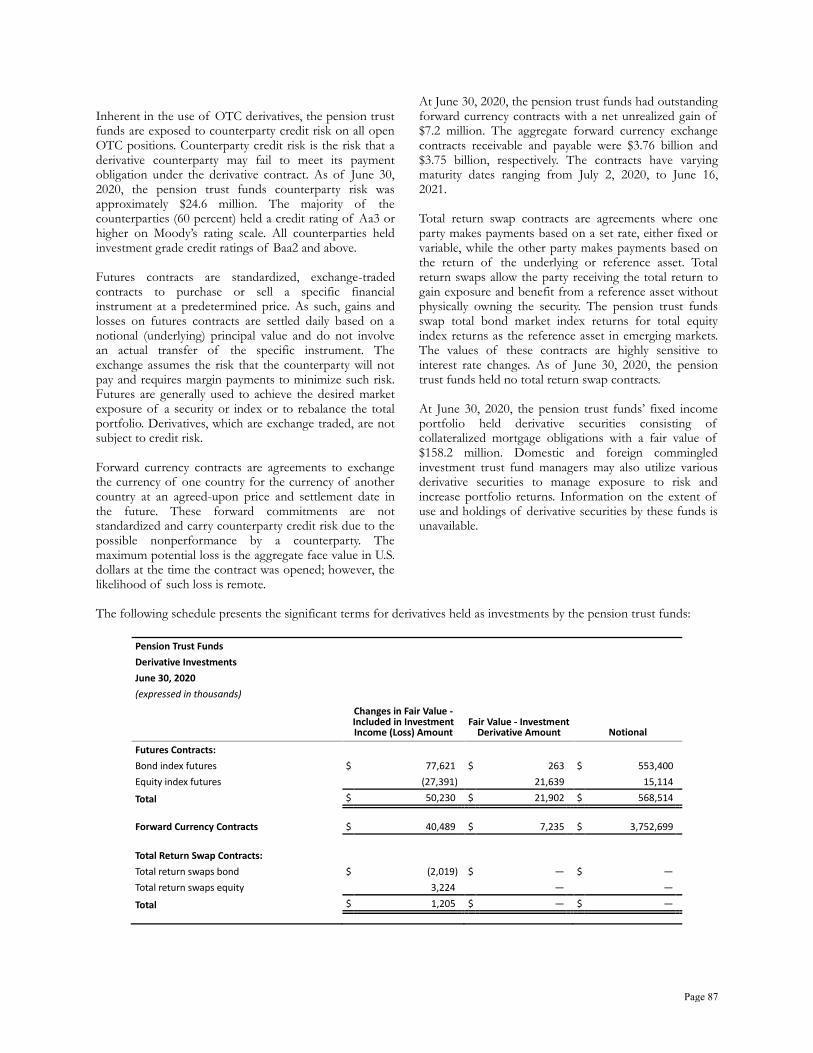
Inherent in the use of OTC derivatives, the pension trust funds are exposed to counterparty credit risk on all open OTC positions. Counterparty credit risk is the risk that a derivative counterparty may fail to meet its payment obligation under the derivative contract. As of June 30, 2020, the pension trust funds counterparty risk was approximately $24.6 million. The majority of the counterparties (60 percent) held a credit rating of Aa3 or higher on Moody’s rating scale. All counterparties held investment grade credit ratings of Baa2 and above. Futures contracts are standardized, exchange-traded contracts to purchase or sell a specific financial instrument at a predetermined price. As such, gains and losses on futures contracts are settled daily based on a notional (underlying) principal value and do not involve an actual transfer of the specific instrument. The exchange assumes the risk that the counterparty will not pay and requires margin payments to minimize such risk. Futures are generally used to achieve the desired market exposure of a security or index or to rebalance the total portfolio. Derivatives, which are exchange traded, are not subject to credit risk. Forward currency contracts are agreements to exchange the currency of one country for the currency of another country at an agreed-upon price and settlement date in the future. These forward commitments are not standardized and carry counterparty credit risk due to the possible nonperformance by a counterparty. The maximum potential loss is the aggregate face value in U.S. dollars at the time the contract was opened; however, the likelihood of such loss is remote.
At June 30, 2020, the pension trust funds had outstanding forward currency contracts with a net unrealized gain of $7.2 million. The aggregate forward currency exchange contracts receivable and payable were $3.76 billion and $3.75 billion, respectively. The contracts have varying maturity dates ranging from July 2, 2020, to June 16, 2021. Total return swap contracts are agreements where one party makes payments based on a set rate, either fixed or variable, while the other party makes payments based on the return of the underlying or reference asset. Total return swaps allow the party receiving the total return to gain exposure and benefit from a reference asset without physically owning the security. The pension trust funds swap total bond market index returns for total equity index returns as the reference asset in emerging markets. The values of these contracts are highly sensitive to interest rate changes. As of June 30, 2020, the pension trust funds held no total return swap contracts. At June 30, 2020, the pension trust funds’ fixed income portfolio held derivative securities consisting of collateralized mortgage obligations with a fair value of $158.2 million. Domestic and foreign commingled investment trust fund managers may also utilize various derivative securities to manage exposure to risk and increase portfolio returns. Information on the extent of use and holdings of derivative securities by these funds is unavailable.
The following schedule presents the significant terms for derivatives held as investments by the pension trust funds:
Pension Trust Funds Derivative Investments June 30, 2020 (expressed in thousands)
Changes in Fair Value - Included in Investment Income (Loss) Amount
Fair Value - Investment Derivative Amount Notional
Futures Contracts: Bond index futures $ 77,621 $ 263 $ 553,400 Equity index futures (27,391) 21,639 15,114 Total $ 50,230 $ 21,902 $ 568,514 Forward Currency Contracts $ 40,489 $ 7,235 $ 3,752,699 Total Return Swap Contracts: Total return swaps bond $ (2,019) $ — $ — Total return swaps equity 3,224 — — Total $ 1,205 $ — $ —
Page 87

C. INVESTMENTS - WORKERS' COMPENSATION FUND
1. Summary of Investment Policies Under RCW 43.33A.030, trusteeship of the Workers’ Compensation Fund investments is vested in the voting members of the Washington State Investment Board (WSIB). The Legislature established a standard of care for investment of these funds in RCW 43.33A.140. Additionally, the WSIB and its staff must comply with other state laws, such as the Ethics in Public Service Act, chapter 42.52 RCW, in making investment decisions and seeking to meet investment objectives. The Workers’ Compensation Fund consists of contributions from employers and their employees participating in the state workers’ compensation program and related earnings on those contributions. The workers’ compensation program provides medical, time-loss, and disability benefit payments to qualifying individuals sustaining work-related injuries. In accordance with state laws, the Workers’ Compensation Fund investments are managed to limit fluctuations in the industrial insurance premiums. Subject to this purpose, these portfolios seek to achieve a maximum return at a prudent level of risk. Based on this requirement, the order of the objectives is: • Maintain the solvency of the funds. • Maintain premium rate stability. • Ensure sufficient assets are available to fund the
expected liability payments. • Subject to the objectives above, achieve a maximum
return at a prudent level of risk. Eligible Investments. Eligible investments are securities and deposits that are in accordance with the WSIB’s investment policy and chapter 43.33A RCW. Eligible investments include: • U.S. equities. • International equities. • U.S. treasuries and government agencies. • Credit bonds. • Mortgage-backed securities rated investment grade, as
defined by Bloomberg Barclays Family of Fixed Income Indices.
• Asset-backed securities rated investment grade, as defined by Bloomberg Barclays Family of Fixed Income Indices.
• Commercial mortgage-backed securities rated
investment grade, as defined by Bloomberg Barclays Family of Fixed Income Indices.
• Investment grade non-U.S. dollar bonds. • Real estate. Investment Policies and Restrictions. To meet stated objectives, investments of the Workers’ Compensation Fund are subject to the following constraints: • All assets under the management of the WSIB are to
be invested to maximize return at a prudent level of risk in accordance with RCW 43.33A.110 and RCW 43.33A.140.
• No corporate fixed income issue cost shall exceed 3
percent of the fund’s fair value at the time of purchase, nor shall its fair value exceed 6 percent of the fund’s fair value at any time.
• Asset allocations are to be reviewed every four years
or sooner if there are significant changes in funding levels or the liability durations.
• Assets are to be rebalanced across asset classes when
the fair value of the assets falls outside the policy ranges. The timing of any rebalancing will be based on market opportunities, cash flows, and the consideration of transaction costs; therefore, they need not occur immediately.
The WSIB has elected a gradual implementation plan to reach the strategic asset allocation. During this implementation period, if real estate is above or below its target due to timing or illiquidity, fixed income will be used to offset the balance.
Equity. The benchmark and structure for global equities will be the Morgan Stanley Capital International (MSCI) All Country World Investable Market Index net with U.S. gross. The global equity portfolio will be passively managed in commingled index funds. The commingled fund managers may use futures for hedging or establishing a long position. Fixed Income. It is the goal of the fixed income portfolios to match the target durations. The fixed income portfolios' required duration targets are to be reviewed every three years or sooner if there are significant changes in the funding levels or the liability durations.
Page 88

Sector allocation of fixed income investments must be managed within the ranges presented below. Deviations may occur in the short term as a result of interim market conditions. However, if a range is exceeded, the portfolios must be rebalanced to the target allocations as soon as it is practical.
Target Allocations for the Fixed Income Sectors: U.S. treasuries and government agencies 5% - 25% Credit bonds 20% - 80% Asset-backed securities 0% - 10% Commercial mortgage-backed securities 0% - 10% Mortgage-backed securities 0% - 25% Total market value of below investment grade credit bonds (as defined by Bloomberg Barclays Family of Fixed Income Indices) shall not exceed 5 percent of the total market value of the funds. Although below investment grade mortgage-backed, asset-backed, and commercial mortgage-backed securities may not be purchased, portfolio holdings that are downgraded to those levels or are no longer rated may continue to be held. Total market value of below investment grade mortgage-backed, asset-backed, and commercial mortgage-backed securities shall not exceed 5 percent of total market value of the funds.
Real Estate. The objectives and characteristics of the real estate portfolio are as follows: • To generate a 6 percent annual investment return over
a rolling 10-year period.
• The return will be generated by current income, and the portfolio will be intentionally constructed to focus on yield rather than total return.
• The portfolio will be diversified across geography and
property type. • The benchmark for the portfolio is a total net return
of 6 percent measured over a rolling 10-year period. • No more than 15 percent of the real estate portfolio
will be invested in a single property after the program’s build-out period.
2. Valuation of Investments The Workers’ Compensation Fund reports investments at fair value and categorizes its fair value measurements within the fair value hierarchy established by generally accepted accounting principles. Unrealized gains and losses are included in the Statement of Revenues, Expenses, and Changes in Net Position. The following table presents fair value measurements as of June 30, 2020:
Workers' Compensation Fund Investments Measured at Fair Value June 30, 2020 (expressed in thousands) Fair Value Measurements Using
Investments by Fair Value Level Fair Value Level 1 Inputs
Level 2 Inputs
Level 3 Inputs
Debt securities Mortgage and other asset-backed securities $ 1,055,969 $ — $ 1,055,969 $ — Corporate bonds 11,123,826 — 11,123,826 — U.S. and foreign government and agency securities 4,304,287 — 4,304,287 —
Total Investments by Fair Value Level 16,484,082 $ — $ 16,484,082 $ — Investments Measured at Net Asset Value (NAV) Commingled equity investment trusts 3,347,866 Real estate 11,597
Total investments measured at the NAV 3,359,463 Total Investments Measured at Fair Value $ 19,843,545
Investments classified as level 2. Investments classified as level 2 in the above table are comprised of publicly traded debt securities. Publicly traded debt securities are sourced from reputable pricing vendors using models that are market-based measurements representing their good faith opinion as to the exit value of a security, in an orderly transaction under current market conditions. Such
models take into account quoted prices, nominal yield spreads, benchmark yield curves, prepayment speeds, and other market corroborated inputs. Investments measured at net asset value (NAV). Investments measured at net asset value in the Workers'
Page 89

Compensation Fund include collective investment trust funds and alternative investments. Collective Investment Trust Funds. The Workers’ Compensation Fund invests in a single collective investment trust fund (fund). The fund is passively managed to track the investment of a broad, global equity index, the MSCI All Country World Investable Market Index net with U.S. gross. The fund determines a fair value by obtaining the values of underlying holdings using reputable pricing sources and computing an overall net asset value per share. The holdings are publicly traded equity securities. The fund has daily openings, and contributions and withdrawals can be made on any business day. The fund manager, at their discretion, may require withdrawal proceeds to be made partially or wholly in kind. Under certain circumstances, the fund manager may choose to suspend valuation and/or the right to make contributions and withdrawals from the fund. Such circumstances include actual or anticipated closure, restriction, or suspension of trading activity in any markets or exchanges where the fund investments are traded; where the purchase, sale, or pricing of the fund’s investments would not be reasonably practicable or advisable; or where suspending contributions or withdrawals would be in the best interest of the fund or participants. Alternative Investments. The fair value of investments that are organized as limited partnerships and have no readily ascertainable fair value is determined by using the net asset value per share (or its equivalent) of the Workers' Compensation Funds' ownership interest in partners’ capital. These values are based on the individual investee’s capital account balance reported at fair value by the general partner at the most recently available reporting period, adjusted for subsequent contributions, distributions, management fees, changes in values of foreign currency, and published market prices for certain securities. The limited partnerships’ annual financial statements are audited by independent auditors. These investments are valued at approximately $11.6 million as of June 30, 2020. Because of the inherent uncertainties in estimating fair values, it is possible these estimates will change in the near-term or the subsequent sale of assets will be different than the June 30, 2020, reported net asset value. These investments can never be redeemed. Instead, the nature of these investments provides for distributions through the sale or liquidation of the underlying assets and from net operating cash flows. It is anticipated that the investments will be held for at least ten years or longer. Real Estate. This includes one real estate investment. Targeted investment structures within the Workers'
Compensation Fund real estate portfolio include limited liability companies, limited partnerships, joint ventures, commingled funds, and co-investments. Real estate partnerships generally provide quarterly valuations based on the most recent capital account balance. Individual properties are valued by the investment management at least annually and are adjusted as frequently as quarterly if material market or operational changes have occurred. Properties are externally appraised generally at least every five years, depending upon the investment. Annual audits of most partnerships include a review of compliance with the partnership’s valuation policies. 3. Securities Lending State law and WSIB policy permit the Workers’ Compensation Fund to participate in securities lending programs to augment investment income. The WSIB has entered into an agreement with State Street Corporation to act as agent for the Workers’ Compensation Fund in securities lending transactions. As State Street Corporation is the custodian bank for the Workers’ Compensation Fund, it is counterparty to securities lending transactions. During fiscal year 2020, debt securities were loaned and collateralized by the Workers’ Compensation Fund's agent with cash and U.S. government or U.S. agency securities including U.S. agency mortgage-backed securities (exclusive of letters of credit). When the loaned securities had collateral denominated in the same currency, the collateral requirement was 102 percent of the fair value, including accrued interest, of the securities loaned. All other securities were required to be collateralized at 105 percent of the fair value, including accrued interest, of the loaned securities. As of June 30, 2020, the Workers' Compensation Fund had no securities on loan and, accordingly, no collateral was held. During fiscal year 2020, securities lending transactions could be terminated on demand by either the Workers’ Compensation Fund or the borrower. Non-cash collateral could not be pledged or sold absent borrower default. No more than 20 percent of the total on-loan value can be held by a specific borrower. Collateral investment guidelines specifically prohibit European domiciled holdings. There are no restrictions on the amount of securities that can be lent. Securities were lent during the current fiscal year with the agreement that they would be returned in the future for exchange of the collateral. State Street Corporation indemnified the Workers’ Compensation Fund by agreeing to purchase replacement securities or return the cash collateral in the event a borrower failed to return the loaned securities or pay distributions thereon. State Street
Page 90

Corporation’s responsibilities included performing appropriate borrower and collateral investment credit analyses, demanding adequate types and levels of collateral, and complying with applicable federal regulations concerning securities lending. During fiscal year 2020, there were no significant violations of legal or contractual provisions, and no failures by any borrowers to return loaned securities or to pay distributions thereon. Further, the Workers’ Compensation Fund incurred no losses during fiscal year 2020 resulting from a default by either the borrowers or the securities lending agents. 4. Interest Rate Risk Interest rate risk is the risk that changes in interest rates over time will adversely affect the fair value of an investment. While the Workers’ Compensation Fund does not have a formal policy relating to interest rate risk, the
risk is managed within the Workers’ Compensation Fund portfolio using effective duration, which is the measure of a debt investment’s exposure to fair value changes arising from changes in interest rates. Increases in prevailing interest rates generally translate into decreases in fair values of fixed income investments. As of June 30, 2020, the Workers’ Compensation Fund portfolio durations were within the prescribed duration targets. The following two schedules provide information about the interest rate risks associated with the Workers’ Compensation Fund investments as of June 30, 2020. The schedules display various asset classes held by maturity in years, effective durations, and credit ratings. All debt securities are reported using the average life within the portfolio. The average life is a calculated estimate of the average time (in years) until maturity for these securities, taking into account possible prepayments of principal.
Workers' Compensation Fund Schedule of Maturities and Effective Duration June 30, 2020 (expressed in thousands) Maturity
Investment Type Total Fair
Value Less than 1
Year 1-5 Years 6-10 Years More than 10
Years
Effective Duration (in
years)* Mortgage and other asset-backed securities $ 1,055,969 $ 34,368 $ 764,999 $ 256,602 $ — 3.5 Corporate bonds 11,123,826 809,435 4,633,156 2,459,081 3,222,154 7.4 U.S. government and agency securities 3,005,826 101,045 745,727 1,046,698 1,112,356 11.1 Foreign government and agencies 1,298,461 144,757 668,749 391,338 93,617 5.0 Total Investments Categorized 16,484,082 $ 1,089,605 $ 6,812,631 $ 4,153,719 $ 4,428,127 7.6
Investments Not Required to be Categorized: Commingled investment trusts 3,347,866 Cash and cash equivalents 471,904 Real estate 11,597 Total investments not categorized 3,831,367 Total Investments $ 20,315,449
* Excludes cash and cash equivalents
Page 91

Investments with multiple credit ratings are presented using the Moody’s rating scale as follows:
Workers' Compensation Fund Investment Credit Ratings June 30, 2020 (expressed in thousands) Investment Type
Moody's Equivalent Credit Rating
Mortgage and Other Asset-Backed
Securities Corporate Bonds Foreign Government
and Agencies Total Fair Value Aaa $ 1,055,969 $ 494,858 $ 192,251 $ 1,743,078 Aa1 — 172,648 236,840 409,488 Aa2 — 327,289 191,314 518,603 Aa3 — 725,821 277,291 1,003,112 A1 — 1,639,931 278,090 1,918,021 A2 — 2,190,490 — 2,190,490 A3 — 1,974,979 — 1,974,979 Baa1 — 1,601,696 — 1,601,696 Baa2 — 1,466,673 92,968 1,559,641 Baa3 — 364,925 29,707 394,632 Ba1 or lower — 164,516 — 164,516 Total $ 1,055,969 $ 11,123,826 $ 1,298,461 $ 13,478,256
5. Credit Risk Credit risk is the risk that an issuer or other counterparty to an investment will not fulfill its obligations. The Workers’ Compensation Fund investment policies limit the fixed income securities to investment grade or higher at the time of purchase. Investment grade securities are those fixed income securities with a Moody’s rating of Aaa to Baa or a Standard and Poor’s rating of AAA to BBB. The rated debt investments of the Workers’ Compensation Fund as of June 30, 2020, were rated by Moody’s and/or an equivalent national rating organization. Concentration of Credit Risk. Concentration of credit risk is the risk of loss attributed to the magnitude of an investment in a single issuer. The Workers’ Compensation Fund policy states that no corporate fixed income issues cost shall exceed 3 percent of the fund’s fair value at the time of purchase, nor shall its fair value exceed 6 percent of the fund’s fair value at any time. There was no concentration of credit risk as of June 30, 2020.
Custodial Credit Risk. Custodial credit risk is the risk that, in the event a depository institution or counterparty fails, the Workers’ Compensation Fund would not be able to recover the value of its deposits, investments, or collateral securities. The Workers’ Compensation Fund does not have a policy relating to custodial credit risk. The WSIB mitigates custodial credit risk by having its investment securities (excluding cash, cash equivalents, and repurchase agreements held as securities lending collateral) registered and held in the name of the WSIB for the benefit of the Workers’ Compensation Fund. 6. Foreign Currency Risk Foreign currency risk is the risk that changes in exchange rates will adversely affect the fair value of an investment or a deposit. The Workers’ Compensation Fund does not have a formal policy to limit foreign currency risk. At June 30, 2020, the only securities held by the Workers’ Compensation Fund with foreign currency exposure were $1.38 billion (excludes U.S. dollar denominated securities) invested in an international commingled equity index fund. The following schedule presents the exposure of the Workers’ Compensation Fund to foreign currency risk. The schedule is stated in U.S. dollars.
Page 92
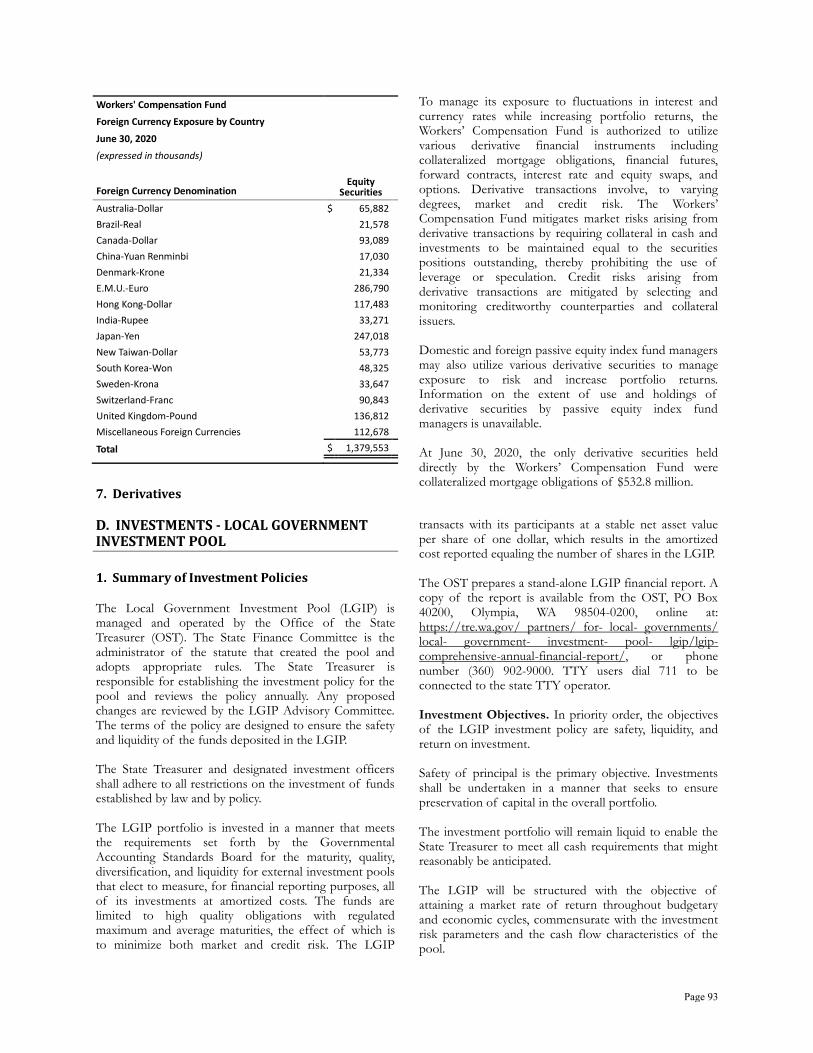
Workers' Compensation Fund Foreign Currency Exposure by Country June 30, 2020 (expressed in thousands)
Foreign Currency Denomination Equity
Securities Australia-Dollar $ 65,882 Brazil-Real 21,578 Canada-Dollar 93,089 China-Yuan Renminbi 17,030 Denmark-Krone 21,334 E.M.U.-Euro 286,790 Hong Kong-Dollar 117,483 India-Rupee 33,271 Japan-Yen 247,018 New Taiwan-Dollar 53,773 South Korea-Won 48,325 Sweden-Krona 33,647 Switzerland-Franc 90,843 United Kingdom-Pound 136,812 Miscellaneous Foreign Currencies 112,678 Total $ 1,379,553 7. Derivatives
To manage its exposure to fluctuations in interest and currency rates while increasing portfolio returns, the Workers’ Compensation Fund is authorized to utilize various derivative financial instruments including collateralized mortgage obligations, financial futures, forward contracts, interest rate and equity swaps, and options. Derivative transactions involve, to varying degrees, market and credit risk. The Workers’ Compensation Fund mitigates market risks arising from derivative transactions by requiring collateral in cash and investments to be maintained equal to the securities positions outstanding, thereby prohibiting the use of leverage or speculation. Credit risks arising from derivative transactions are mitigated by selecting and monitoring creditworthy counterparties and collateral issuers. Domestic and foreign passive equity index fund managers may also utilize various derivative securities to manage exposure to risk and increase portfolio returns. Information on the extent of use and holdings of derivative securities by passive equity index fund managers is unavailable. At June 30, 2020, the only derivative securities held directly by the Workers’ Compensation Fund were collateralized mortgage obligations of $532.8 million.
D. INVESTMENTS - LOCAL GOVERNMENT INVESTMENT POOL
1. Summary of Investment Policies The Local Government Investment Pool (LGIP) is managed and operated by the Office of the State Treasurer (OST). The State Finance Committee is the administrator of the statute that created the pool and adopts appropriate rules. The State Treasurer is responsible for establishing the investment policy for the pool and reviews the policy annually. Any proposed changes are reviewed by the LGIP Advisory Committee. The terms of the policy are designed to ensure the safety and liquidity of the funds deposited in the LGIP. The State Treasurer and designated investment officers shall adhere to all restrictions on the investment of funds established by law and by policy. The LGIP portfolio is invested in a manner that meets the requirements set forth by the Governmental Accounting Standards Board for the maturity, quality, diversification, and liquidity for external investment pools that elect to measure, for financial reporting purposes, all of its investments at amortized costs. The funds are limited to high quality obligations with regulated maximum and average maturities, the effect of which is to minimize both market and credit risk. The LGIP
transacts with its participants at a stable net asset value per share of one dollar, which results in the amortized cost reported equaling the number of shares in the LGIP. The OST prepares a stand-alone LGIP financial report. A copy of the report is available from the OST, PO Box 40200, Olympia, WA 98504-0200, online at: https://tre.wa.gov/ partners/ for- local- governments/ local- government- investment- pool- lgip/lgip-comprehensive-annual-financial-report/, or phone number (360) 902-9000. TTY users dial 711 to be connected to the state TTY operator. Investment Objectives. In priority order, the objectives of the LGIP investment policy are safety, liquidity, and return on investment. Safety of principal is the primary objective. Investments shall be undertaken in a manner that seeks to ensure preservation of capital in the overall portfolio. The investment portfolio will remain liquid to enable the State Treasurer to meet all cash requirements that might reasonably be anticipated. The LGIP will be structured with the objective of attaining a market rate of return throughout budgetary and economic cycles, commensurate with the investment risk parameters and the cash flow characteristics of the pool.
Page 93

Eligible Investments. Eligible investments are only those securities and deposits authorized by statute (chapters 39.58 and 39.59 RCW, and RCW 43.84.080). Eligible investments include: • Obligations of the U.S. government. • Obligations of U.S. government agencies or of
corporations wholly owned by the U.S. government. • Obligations of supranational institutions provided
that, at the time of investment, the institution has the U.S. government as its largest shareholder.
• Obligations of government-sponsored corporations
that are or may become eligible as collateral for advances to member banks as determined by the board of governors of the Federal Reserve.
• Certificates of deposit or demand deposits with
financial institutions qualified by the Washington Public Deposit Protection Commission.
Investment Restrictions. To provide for safety and liquidity of funds, the LGIP policy places the following restrictions on the investment portfolio: • Investments are restricted to fixed rate securities that
mature in 397 days or less, except securities utilized in repurchase agreements and U.S. government and supranational floating or variable rate securities which may have a maximum maturity of 762 days, provided they have reset dates within one year and that on any reset date can reasonably be expected to have a market value that approximates their amortized cost.
• The weighted average maturity of the portfolio will
not exceed 60 days.
• The weighted average life of the portfolio will not exceed 120 days.
• The purchase of investments in securities other than
those issued by the U.S. government or its agencies will be limited.
• Cash generated through securities lending or reverse
repurchase agreement transactions will not increase the dollar amount of specified investment types beyond stated limits.
Participant Transactions. The LGIP transacts with its participants at a stable net asset value per share of $1.00, the same method used for reporting. Participants of the LGIP may contribute and withdraw funds on a daily basis and must inform the OST of any contribution or withdrawal over one million dollars no later than 9:00 a.m. on the same day the transaction is made.
Contributions or withdrawals for one million dollars or less can be requested at any time prior to 10:00 a.m. on the day of the transaction. However, participants may complete transactions greater than one million dollars when notification is made between 9:00 a.m. and 10:00 a.m., at the sole discretion of the OST. The LGIP does not impose liquidity fees or redemption gates on participant withdrawals. 2. Valuation of Investments Investments are stated at amortized cost which approximates fair value. For bank deposits and repurchase agreements, the cost-based measure equals their carrying amount. Monthly, the fair value net asset value per share is calculated and compared to the amortized cost net asset value per share to verify that the LGIP’s shadow price does not deviate by more than one half of 1 percent from the amortized cost of the portfolio. 3. Securities Lending State statutes permit the LGIP to lend its securities to broker-dealers and other entities with a simultaneous agreement to return the collateral for the same securities in the future. The LGIP has contracted with Northern Trust as a lending agent and receives a share of income earned from this activity. The lending agent lends securities and receives collateral, which can be in the form of cash or other securities. The collateral, which must be valued at 102 percent of the fair value of the loaned securities, is priced daily and, if necessary, action is taken to maintain the collateralization level at 102 percent. Cash collateral received from the lending of non-coupon-bearing securities shall not be valued at less than 102 percent of fair value, not to exceed par. The cash is invested by the lending agent in accordance with investment guidelines approved by the LGIP. The securities held as collateral and the securities underlying the cash collateral are held by the LGIP’s custodian. One option available to the lending agent is to invest cash collateral with the LGIP. Maturities of investments made with cash collateral are generally matched to maturities of securities loaned. During fiscal year 2020, the LGIP lent U.S. agency and U.S. treasury securities while other securities were received as collateral. At June 30, 2020, the fair value of securities on loan was $1.01 billion and the fair value of securities received for collateral was $1.03 billion. The LGIP investment policy requires that any securities on loan be made available by the lending agent for next day liquidity at the option of the LGIP. During fiscal year 2020, the LGIP had no credit risk exposure to borrowers
Page 94
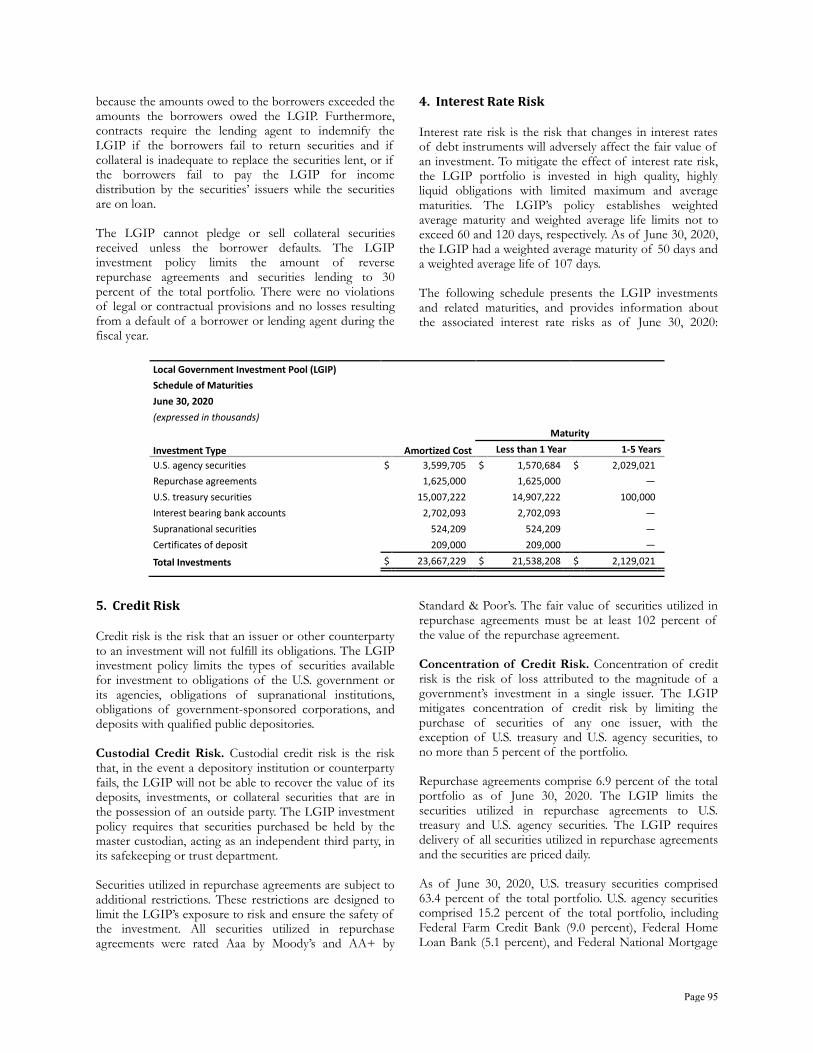
because the amounts owed to the borrowers exceeded the amounts the borrowers owed the LGIP. Furthermore, contracts require the lending agent to indemnify the LGIP if the borrowers fail to return securities and if collateral is inadequate to replace the securities lent, or if the borrowers fail to pay the LGIP for income distribution by the securities’ issuers while the securities are on loan. The LGIP cannot pledge or sell collateral securities received unless the borrower defaults. The LGIP investment policy limits the amount of reverse repurchase agreements and securities lending to 30 percent of the total portfolio. There were no violations of legal or contractual provisions and no losses resulting from a default of a borrower or lending agent during the fiscal year.
4. Interest Rate Risk Interest rate risk is the risk that changes in interest rates of debt instruments will adversely affect the fair value of an investment. To mitigate the effect of interest rate risk, the LGIP portfolio is invested in high quality, highly liquid obligations with limited maximum and average maturities. The LGIP’s policy establishes weighted average maturity and weighted average life limits not to exceed 60 and 120 days, respectively. As of June 30, 2020, the LGIP had a weighted average maturity of 50 days and a weighted average life of 107 days. The following schedule presents the LGIP investments and related maturities, and provides information about the associated interest rate risks as of June 30, 2020:
Local Government Investment Pool (LGIP) Schedule of Maturities June 30, 2020 (expressed in thousands) Maturity Investment Type Amortized Cost Less than 1 Year 1-5 Years U.S. agency securities $ 3,599,705 $ 1,570,684 $ 2,029,021 Repurchase agreements 1,625,000 1,625,000 — U.S. treasury securities 15,007,222 14,907,222 100,000 Interest bearing bank accounts 2,702,093 2,702,093 — Supranational securities 524,209 524,209 — Certificates of deposit 209,000 209,000 — Total Investments $ 23,667,229 $ 21,538,208 $ 2,129,021
5. Credit Risk Credit risk is the risk that an issuer or other counterparty to an investment will not fulfill its obligations. The LGIP investment policy limits the types of securities available for investment to obligations of the U.S. government or its agencies, obligations of supranational institutions, obligations of government-sponsored corporations, and deposits with qualified public depositories. Custodial Credit Risk. Custodial credit risk is the risk that, in the event a depository institution or counterparty fails, the LGIP will not be able to recover the value of its deposits, investments, or collateral securities that are in the possession of an outside party. The LGIP investment policy requires that securities purchased be held by the master custodian, acting as an independent third party, in its safekeeping or trust department. Securities utilized in repurchase agreements are subject to additional restrictions. These restrictions are designed to limit the LGIP’s exposure to risk and ensure the safety of the investment. All securities utilized in repurchase agreements were rated Aaa by Moody’s and AA+ by
Standard & Poor’s. The fair value of securities utilized in repurchase agreements must be at least 102 percent of the value of the repurchase agreement. Concentration of Credit Risk. Concentration of credit risk is the risk of loss attributed to the magnitude of a government’s investment in a single issuer. The LGIP mitigates concentration of credit risk by limiting the purchase of securities of any one issuer, with the exception of U.S. treasury and U.S. agency securities, to no more than 5 percent of the portfolio. Repurchase agreements comprise 6.9 percent of the total portfolio as of June 30, 2020. The LGIP limits the securities utilized in repurchase agreements to U.S. treasury and U.S. agency securities. The LGIP requires delivery of all securities utilized in repurchase agreements and the securities are priced daily. As of June 30, 2020, U.S. treasury securities comprised 63.4 percent of the total portfolio. U.S. agency securities comprised 15.2 percent of the total portfolio, including Federal Farm Credit Bank (9.0 percent), Federal Home Loan Bank (5.1 percent), and Federal National Mortgage
Page 95

Association (1.1 percent). Supranational securities comprised 2.2 percent of the total portfolio. 6. Repurchase Agreements The fair value plus accrued income of securities utilized in repurchase agreements will be 102 percent of the value of the repurchase agreement plus accrued interest.
The securities utilized in repurchase agreements are limited to government securities, are priced daily, and are held by the LGIP’s custodian in the state’s name. As of June 30, 2020, repurchase agreements totaled $1.63 billion.
E. INVESTMENTS - HIGHER EDUCATION SPECIAL REVENUE, ENDOWMENT, AND STUDENT SERVICES FUNDS
1. Summary of Investment Policies The investments of the University of Washington represent 80 percent of the total investments in Higher Education Special Revenue, Endowment, and Student Services Funds. The University of Washington’s Board of Regents is vested by statute with responsibility for the University’s properties and investments, and for establishing investment policy. The University of Washington Investment Management Company (UWINCO), led by the chief investment officer, carries out the day-to-day activities of the investment portfolios. The UWINCO Board, which consists of both Board of Regents’ members and external investment professionals, serves as an advisory board to UWINCO. The majority of the University’s investments are insured, registered, and held by the University’s custodial bank as an agent for the University. Investments not held by the custodian include venture capital, private equity, opportunistic investments, marketable alternatives, mortgages, real assets, and miscellaneous investments. The University combines most short-term cash balances in the Invested Funds Pool. At June 30, 2020, the Invested Funds Pool totaled $2.1 billion. The fund also owns units in the Consolidated Endowment Fund valued at $625.0 million on June 30, 2020. By University policy, departments with qualifying funds in the Invested Funds Pool receive distributions based on their average balances and on the type of balance. Campus depositors received 0.75 percent in fiscal year 2020. University Advancement received 3.0 percent of the average balances in endowment operating and gift accounts in fiscal year 2020. The difference between the actual earnings of the Invested Funds Pool and the calculated distributions is used to support activities benefiting all University departments. The majority of the endowed funds are invested in a pooled fund called the Consolidated Endowment Fund (CEF). Individual endowments purchase units in the pool on the basis of a per unit valuation of the CEF at fair
value on the last business day of the calendar quarter. Income is distributed based on the number of units held. Chapter 24.55 RCW and the Uniform Prudent Management of Institutional Funds Act allow for total return expenditure in the CEF under comprehensive prudent standards. In February 2019, the Board of Regents approved an amendment to the CEF Investment Policy, implementing a three-year phased spending rate reduction from 5.0 percent to 4.5 percent to lessen the impact on University units. The fiscal year 2020 spending rate was 4.9 percent. Under the CEF spending policy, quarterly distributions to programs are based on an annual percentage rate of 3.92 percent applied to the five-year rolling average of the CEF’s market value. Additionally, the policy allows for an administrative fee of 0.98 percent to support campus-wide fundraising and stewardship activities and to offset the internal cost of managing endowment assets. The University records its permanent endowments at the lower of original gift value or current market value in the Restricted Nonexpendable Net Position category. Of the endowments that are recorded at current market value, the net deficiency from the original gift value was $5.5 million at June 30, 2020. Net appreciation (depreciation) in the fair value of investments includes both realized and unrealized gains and losses on investments. The University realized net gains of $170.0 million in fiscal year 2020 from the sale of investments. The calculation of realized gains and losses is independent of the net appreciation of the fair value of investments. Realized gains and losses on investments that have been held in more than one fiscal year and are sold in the current year include the net appreciation (depreciation) of these investments reported in the prior year(s). The net appreciation in the fair value of investments during the year ended June 30, 2020, was $95.0 million.
Page 96
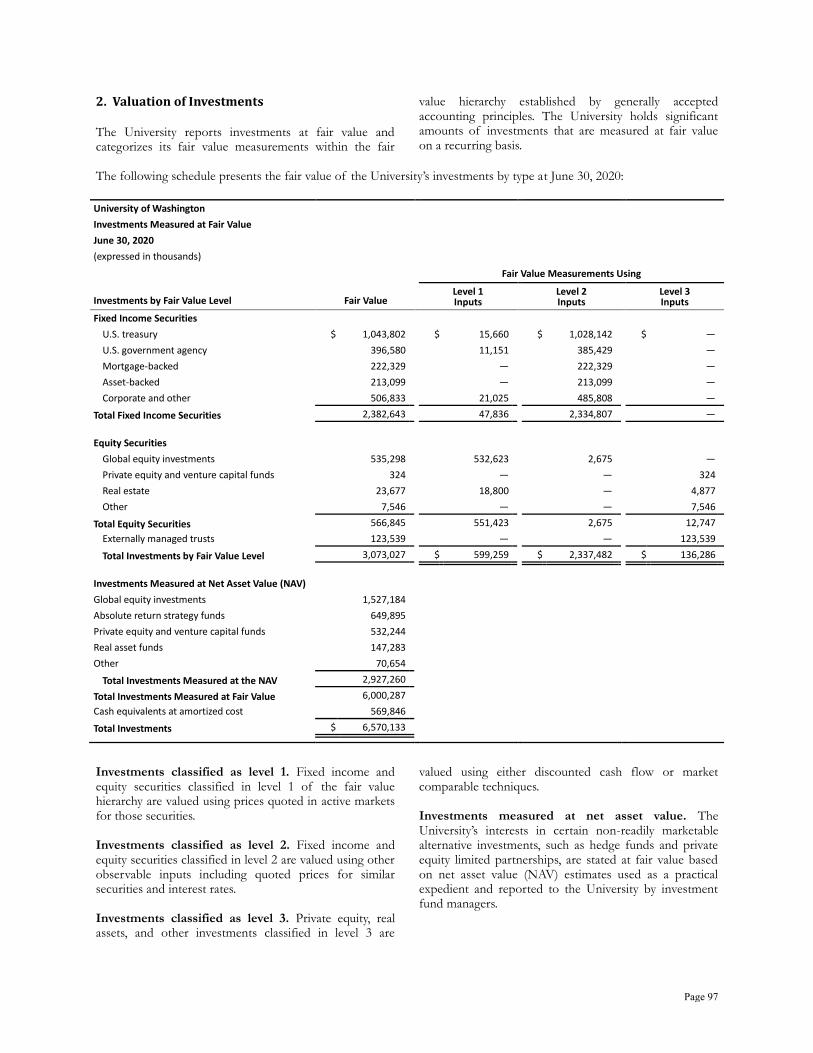
2. Valuation of Investments The University reports investments at fair value and categorizes its fair value measurements within the fair
value hierarchy established by generally accepted accounting principles. The University holds significant amounts of investments that are measured at fair value on a recurring basis.
The following schedule presents the fair value of the University’s investments by type at June 30, 2020:
University of Washington Investments Measured at Fair Value June 30, 2020 (expressed in thousands)
Fair Value Measurements Using
Investments by Fair Value Level Fair Value Level 1 Inputs
Level 2 Inputs
Level 3 Inputs
Fixed Income Securities U.S. treasury $ 1,043,802 $ 15,660 $ 1,028,142 $ — U.S. government agency 396,580 11,151 385,429 — Mortgage-backed 222,329 — 222,329 — Asset-backed 213,099 — 213,099 — Corporate and other 506,833 21,025 485,808 —
Total Fixed Income Securities 2,382,643 47,836 2,334,807 — Equity Securities
Global equity investments 535,298 532,623 2,675 — Private equity and venture capital funds 324 — — 324 Real estate 23,677 18,800 — 4,877 Other 7,546 — — 7,546
Total Equity Securities 566,845 551,423 2,675 12,747 Externally managed trusts 123,539 — — 123,539 Total Investments by Fair Value Level 3,073,027 $ 599,259 $ 2,337,482 $ 136,286
Investments Measured at Net Asset Value (NAV) Global equity investments 1,527,184 Absolute return strategy funds 649,895 Private equity and venture capital funds 532,244 Real asset funds 147,283 Other 70,654
Total Investments Measured at the NAV 2,927,260 Total Investments Measured at Fair Value 6,000,287 Cash equivalents at amortized cost 569,846 Total Investments $ 6,570,133
Investments classified as level 1. Fixed income and equity securities classified in level 1 of the fair value hierarchy are valued using prices quoted in active markets for those securities. Investments classified as level 2. Fixed income and equity securities classified in level 2 are valued using other observable inputs including quoted prices for similar securities and interest rates. Investments classified as level 3. Private equity, real assets, and other investments classified in level 3 are
valued using either discounted cash flow or market comparable techniques. Investments measured at net asset value. The University’s interests in certain non-readily marketable alternative investments, such as hedge funds and private equity limited partnerships, are stated at fair value based on net asset value (NAV) estimates used as a practical expedient and reported to the University by investment fund managers.
Page 97
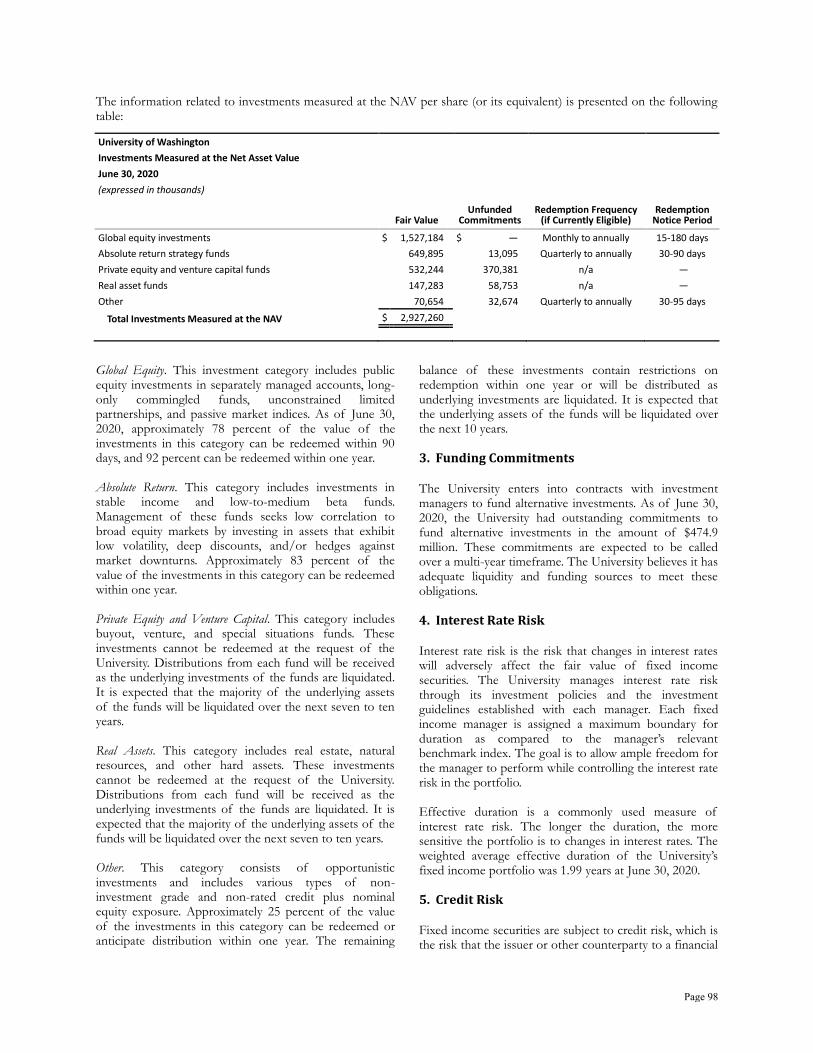
The information related to investments measured at the NAV per share (or its equivalent) is presented on the following table:
University of Washington Investments Measured at the Net Asset Value June 30, 2020 (expressed in thousands)
Fair Value Unfunded
Commitments Redemption Frequency
(if Currently Eligible) Redemption
Notice Period Global equity investments $ 1,527,184 $ — Monthly to annually 15-180 days Absolute return strategy funds 649,895 13,095 Quarterly to annually 30-90 days Private equity and venture capital funds 532,244 370,381 n/a — Real asset funds 147,283 58,753 n/a — Other 70,654 32,674 Quarterly to annually 30-95 days
Total Investments Measured at the NAV $ 2,927,260
Global Equity. This investment category includes public equity investments in separately managed accounts, long-only commingled funds, unconstrained limited partnerships, and passive market indices. As of June 30, 2020, approximately 78 percent of the value of the investments in this category can be redeemed within 90 days, and 92 percent can be redeemed within one year. Absolute Return. This category includes investments in stable income and low-to-medium beta funds. Management of these funds seeks low correlation to broad equity markets by investing in assets that exhibit low volatility, deep discounts, and/or hedges against market downturns. Approximately 83 percent of the value of the investments in this category can be redeemed within one year. Private Equity and Venture Capital. This category includes buyout, venture, and special situations funds. These investments cannot be redeemed at the request of the University. Distributions from each fund will be received as the underlying investments of the funds are liquidated. It is expected that the majority of the underlying assets of the funds will be liquidated over the next seven to ten years. Real Assets. This category includes real estate, natural resources, and other hard assets. These investments cannot be redeemed at the request of the University. Distributions from each fund will be received as the underlying investments of the funds are liquidated. It is expected that the majority of the underlying assets of the funds will be liquidated over the next seven to ten years. Other. This category consists of opportunistic investments and includes various types of non-investment grade and non-rated credit plus nominal equity exposure. Approximately 25 percent of the value of the investments in this category can be redeemed or anticipate distribution within one year. The remaining
balance of these investments contain restrictions on redemption within one year or will be distributed as underlying investments are liquidated. It is expected that the underlying assets of the funds will be liquidated over the next 10 years. 3. Funding Commitments The University enters into contracts with investment managers to fund alternative investments. As of June 30, 2020, the University had outstanding commitments to fund alternative investments in the amount of $474.9 million. These commitments are expected to be called over a multi-year timeframe. The University believes it has adequate liquidity and funding sources to meet these obligations. 4. Interest Rate Risk Interest rate risk is the risk that changes in interest rates will adversely affect the fair value of fixed income securities. The University manages interest rate risk through its investment policies and the investment guidelines established with each manager. Each fixed income manager is assigned a maximum boundary for duration as compared to the manager’s relevant benchmark index. The goal is to allow ample freedom for the manager to perform while controlling the interest rate risk in the portfolio. Effective duration is a commonly used measure of interest rate risk. The longer the duration, the more sensitive the portfolio is to changes in interest rates. The weighted average effective duration of the University’s fixed income portfolio was 1.99 years at June 30, 2020. 5. Credit Risk Fixed income securities are subject to credit risk, which is the risk that the issuer or other counterparty to a financial
Page 98
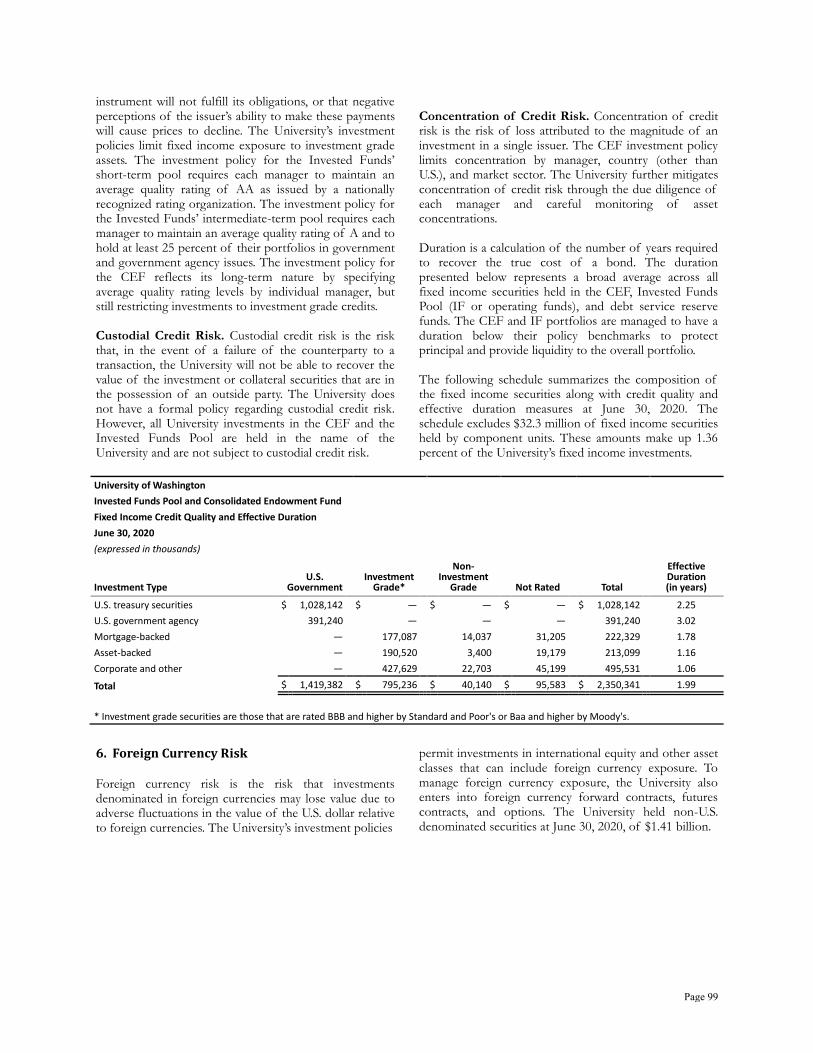
instrument will not fulfill its obligations, or that negative perceptions of the issuer’s ability to make these payments will cause prices to decline. The University’s investment policies limit fixed income exposure to investment grade assets. The investment policy for the Invested Funds’ short-term pool requires each manager to maintain an average quality rating of AA as issued by a nationally recognized rating organization. The investment policy for the Invested Funds’ intermediate-term pool requires each manager to maintain an average quality rating of A and to hold at least 25 percent of their portfolios in government and government agency issues. The investment policy for the CEF reflects its long-term nature by specifying average quality rating levels by individual manager, but still restricting investments to investment grade credits. Custodial Credit Risk. Custodial credit risk is the risk that, in the event of a failure of the counterparty to a transaction, the University will not be able to recover the value of the investment or collateral securities that are in the possession of an outside party. The University does not have a formal policy regarding custodial credit risk. However, all University investments in the CEF and the Invested Funds Pool are held in the name of the University and are not subject to custodial credit risk.
Concentration of Credit Risk. Concentration of credit risk is the risk of loss attributed to the magnitude of an investment in a single issuer. The CEF investment policy limits concentration by manager, country (other than U.S.), and market sector. The University further mitigates concentration of credit risk through the due diligence of each manager and careful monitoring of asset concentrations. Duration is a calculation of the number of years required to recover the true cost of a bond. The duration presented below represents a broad average across all fixed income securities held in the CEF, Invested Funds Pool (IF or operating funds), and debt service reserve funds. The CEF and IF portfolios are managed to have a duration below their policy benchmarks to protect principal and provide liquidity to the overall portfolio. The following schedule summarizes the composition of the fixed income securities along with credit quality and effective duration measures at June 30, 2020. The schedule excludes $32.3 million of fixed income securities held by component units. These amounts make up 1.36 percent of the University’s fixed income investments.
University of Washington Invested Funds Pool and Consolidated Endowment Fund Fixed Income Credit Quality and Effective Duration June 30, 2020 (expressed in thousands)
Investment Type U.S.
Government Investment
Grade*
Non- Investment
Grade Not Rated Total
Effective Duration (in years)
U.S. treasury securities $ 1,028,142 $ — $ — $ — $ 1,028,142 2.25 U.S. government agency 391,240 — — — 391,240 3.02 Mortgage-backed — 177,087 14,037 31,205 222,329 1.78 Asset-backed — 190,520 3,400 19,179 213,099 1.16 Corporate and other — 427,629 22,703 45,199 495,531 1.06 Total $ 1,419,382 $ 795,236 $ 40,140 $ 95,583 $ 2,350,341 1.99
* Investment grade securities are those that are rated BBB and higher by Standard and Poor's or Baa and higher by Moody's.
6. Foreign Currency Risk Foreign currency risk is the risk that investments denominated in foreign currencies may lose value due to adverse fluctuations in the value of the U.S. dollar relative to foreign currencies. The University’s investment policies
permit investments in international equity and other asset classes that can include foreign currency exposure. To manage foreign currency exposure, the University also enters into foreign currency forward contracts, futures contracts, and options. The University held non-U.S. denominated securities at June 30, 2020, of $1.41 billion.
Page 99
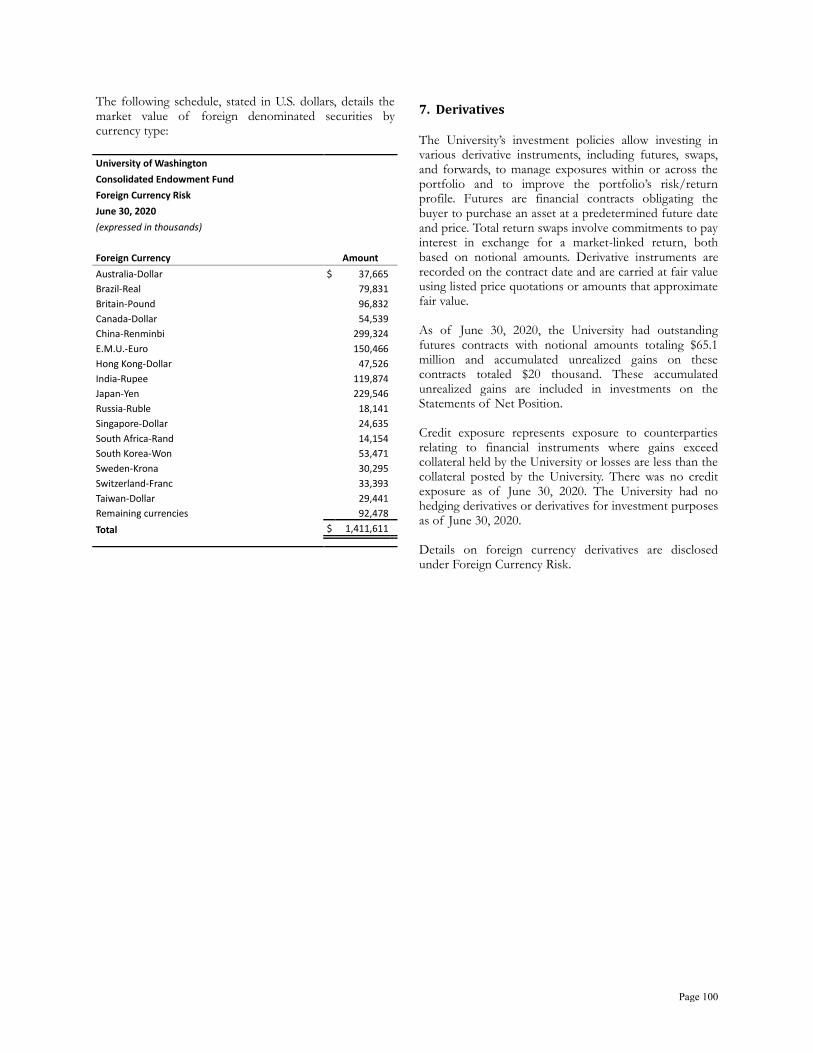
The following schedule, stated in U.S. dollars, details the market value of foreign denominated securities by currency type:
University of Washington Consolidated Endowment Fund Foreign Currency Risk June 30, 2020 (expressed in thousands) Foreign Currency Amount Australia-Dollar $ 37,665 Brazil-Real 79,831 Britain-Pound 96,832 Canada-Dollar 54,539 China-Renminbi 299,324 E.M.U.-Euro 150,466 Hong Kong-Dollar 47,526 India-Rupee 119,874 Japan-Yen 229,546 Russia-Ruble 18,141 Singapore-Dollar 24,635 South Africa-Rand 14,154 South Korea-Won 53,471 Sweden-Krona 30,295 Switzerland-Franc 33,393 Taiwan-Dollar 29,441 Remaining currencies 92,478 Total $ 1,411,611
7. Derivatives The University’s investment policies allow investing in various derivative instruments, including futures, swaps, and forwards, to manage exposures within or across the portfolio and to improve the portfolio’s risk/return profile. Futures are financial contracts obligating the buyer to purchase an asset at a predetermined future date and price. Total return swaps involve commitments to pay interest in exchange for a market-linked return, both based on notional amounts. Derivative instruments are recorded on the contract date and are carried at fair value using listed price quotations or amounts that approximate fair value. As of June 30, 2020, the University had outstanding futures contracts with notional amounts totaling $65.1 million and accumulated unrealized gains on these contracts totaled $20 thousand. These accumulated unrealized gains are included in investments on the Statements of Net Position. Credit exposure represents exposure to counterparties relating to financial instruments where gains exceed collateral held by the University or losses are less than the collateral posted by the University. There was no credit exposure as of June 30, 2020. The University had no hedging derivatives or derivatives for investment purposes as of June 30, 2020. Details on foreign currency derivatives are disclosed under Foreign Currency Risk.
Page 100

F. INVESTMENTS - OFFICE OF THE STATE TREASURER CASH MANAGEMENT ACCOUNT
1. Summary of Investment Policies The Office of the State Treasurer (OST) operates the state’s Cash Management Account for investing Treasury/Trust funds in excess of daily requirements. Investment income earned is allocated based on average daily cash balance. Pursuant to state law, all earnings on investments of Treasury/Trust funds are credited to the General Fund except as specifically provided in RCW 43.79A.040 and RCW 43.84.092. In fiscal year 2020, a portion of the investment income reported by the General Fund was earned by other funds. The State Treasurer and designated investment officers shall adhere to all restrictions on the investment of funds established by law and by policy. Investment Objectives. All Treasury/Trust funds will be invested in conformance with federal, state, and other legal requirements. The primary objectives of the portfolio shall be safety and liquidity, with return on investment a secondary objective. Investments shall be undertaken in a manner that seeks preservation of capital in the overall portfolio. Because the investment portfolio must remain liquid to enable the State Treasurer to meet all cash requirements that can reasonably be anticipated, investments will be managed to maintain cash balances needed to meet daily obligations of the state. After assuring needed levels of safety and liquidity, the investment portfolio will be structured to attain a market rate of return. Eligible Investments. Eligible investments are only those securities and deposits authorized by statute (chapters 39.58, 43.250, and 43.84.080 RCW). Eligible investments include: • Obligations of the U.S. government. • Obligations of U.S. government agencies or of
corporations wholly owned by the U.S. government. • U.S. dollar denominated obligations of supranational
institutions, provided that at the time of investment the institution has the U.S. government as its largest shareholder.
• Obligations of government-sponsored enterprises
that are or may become eligible as collateral for advances to member banks as determined by the board of governors of the Federal Reserve.
• Commercial paper, provided that the OST adheres to
policies and procedures of the Washington State Investment Board (WSIB) regarding commercial paper (RCW 43.84.080(5)).
• Corporate notes, provided that the OST adheres to
the investment policies and procedures adopted by the WSIB (RCW 43.84.080(7)).
• Investment deposits with financial institutions
qualified by the Washington Public Deposit Protection Commission (RCW 39.58.010(9)) and deposits made pursuant to RCW 39.58.080.
• Local Government Investment Pool (LGIP). • Obligations of the state of Washington or its political
subdivisions. Investment Restrictions. To provide for the safety and liquidity of Treasury/Trust funds, the Cash Management Account investment portfolio is subject to the minimum restrictions listed below. Certain investment instruments are subject to more restrictive limitations. • The final maturity of any security will not exceed ten
years. • Purchase of collateralized mortgage obligations is not
allowed. • The allocation to investments subject to high price
sensitivity or reduced marketability will not exceed 15 percent of the daily balance of the portfolio.
Additionally, investments in non-government securities, excluding collateral of repurchase agreements, must fall within prescribed limits. Limitations and Restrictions on LGIP Participant Withdrawals. Participants of the LGIP may contribute and withdraw funds on a daily basis and must inform the OST of any contribution or withdrawal over one million dollars no later than 9:00 a.m. on the same day the transaction is made. Contributions or withdrawals for one million dollars or less can be requested at any time prior to 10:00 a.m. on the day of the transaction. However, participants may complete transactions greater than one million dollars when notification is made between 9:00 a.m. and 10:00 a.m., at the sole discretion of the OST. The LGIP does not impose liquidity fees or redemption gates on participant withdrawals.
Page 101
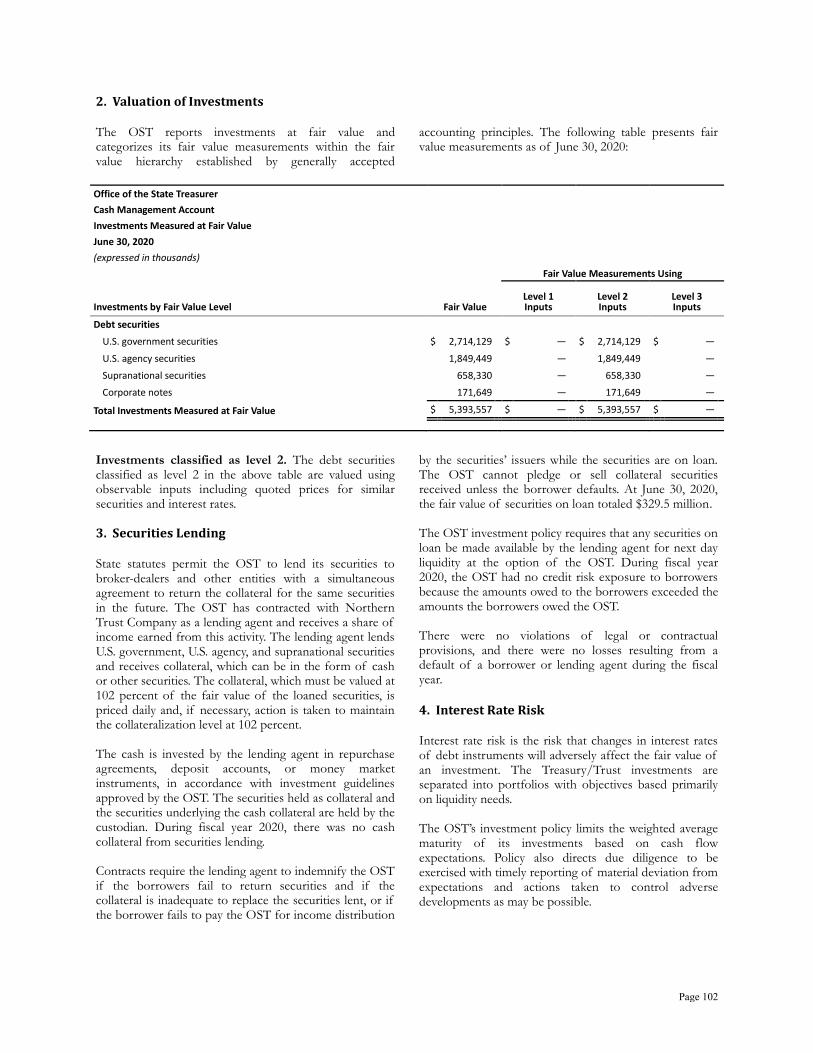
2. Valuation of Investments The OST reports investments at fair value and categorizes its fair value measurements within the fair value hierarchy established by generally accepted
accounting principles. The following table presents fair value measurements as of June 30, 2020:
Office of the State Treasurer Cash Management Account Investments Measured at Fair Value June 30, 2020 (expressed in thousands) Fair Value Measurements Using
Investments by Fair Value Level Fair Value Level 1 Inputs
Level 2 Inputs
Level 3 Inputs
Debt securities U.S. government securities $ 2,714,129 $ — $ 2,714,129 $ — U.S. agency securities 1,849,449 — 1,849,449 — Supranational securities 658,330 — 658,330 — Corporate notes 171,649 — 171,649 —
Total Investments Measured at Fair Value $ 5,393,557 $ — $ 5,393,557 $ —
Investments classified as level 2. The debt securities classified as level 2 in the above table are valued using observable inputs including quoted prices for similar securities and interest rates. 3. Securities Lending State statutes permit the OST to lend its securities to broker-dealers and other entities with a simultaneous agreement to return the collateral for the same securities in the future. The OST has contracted with Northern Trust Company as a lending agent and receives a share of income earned from this activity. The lending agent lends U.S. government, U.S. agency, and supranational securities and receives collateral, which can be in the form of cash or other securities. The collateral, which must be valued at 102 percent of the fair value of the loaned securities, is priced daily and, if necessary, action is taken to maintain the collateralization level at 102 percent. The cash is invested by the lending agent in repurchase agreements, deposit accounts, or money market instruments, in accordance with investment guidelines approved by the OST. The securities held as collateral and the securities underlying the cash collateral are held by the custodian. During fiscal year 2020, there was no cash collateral from securities lending. Contracts require the lending agent to indemnify the OST if the borrowers fail to return securities and if the collateral is inadequate to replace the securities lent, or if the borrower fails to pay the OST for income distribution
by the securities’ issuers while the securities are on loan. The OST cannot pledge or sell collateral securities received unless the borrower defaults. At June 30, 2020, the fair value of securities on loan totaled $329.5 million. The OST investment policy requires that any securities on loan be made available by the lending agent for next day liquidity at the option of the OST. During fiscal year 2020, the OST had no credit risk exposure to borrowers because the amounts owed to the borrowers exceeded the amounts the borrowers owed the OST. There were no violations of legal or contractual provisions, and there were no losses resulting from a default of a borrower or lending agent during the fiscal year. 4. Interest Rate Risk Interest rate risk is the risk that changes in interest rates of debt instruments will adversely affect the fair value of an investment. The Treasury/Trust investments are separated into portfolios with objectives based primarily on liquidity needs. The OST’s investment policy limits the weighted average maturity of its investments based on cash flow expectations. Policy also directs due diligence to be exercised with timely reporting of material deviation from expectations and actions taken to control adverse developments as may be possible.
Page 102

The following schedules present the OST investments and related maturities, and provide information about the associated interest rate risks as of June 30, 2020:
Office of the State Treasurer Cash Management Account Schedule of Maturities June 30, 2020 (expressed in thousands) Maturity Investment Type Total Fair Value Less than 1 Year 1-5 Years 6-10 Years U.S. government securities $ 3,038,840 $ 933,316 $ 2,105,524 $ — U.S. agency securities 1,861,415 168,530 1,692,885 — Supranational securities 658,330 90,426 537,737 30,167 Corporate notes 171,649 10,588 161,061 — Investments with LGIP 4,650,569 4,650,569 — — Certificates of deposit 132,872 132,872 — — Interest bearing bank accounts 92,237 92,237 — — Total Investments $ 10,605,912 $ 6,078,538 $ 4,497,207 $ 30,167
Credit ratings of investments are presented using the Standard and Poor’s (S&P) rating scale as follows:
Office of the State Treasurer Cash Management Account Investment Credit Ratings June 30, 2020 (expressed in thousands) Investment Type S&P Credit Rating Corporate Notes Supranationals Total Fair Value AAA $ 37,356 $ 658,330 $ 695,686 AA+ 21,863 — 21,863 AA 26,198 — 26,198 AA- 52,886 — 52,886 A+ 18,146 — 18,146 A 15,200 — 15,200 Total $ 171,649 $ 658,330 $ 829,979
5. Credit Risk Credit risk is the risk that an issuer or other counterparty to an investment will not fulfill its obligations. The OST limits credit risk by adhering to the OST investment policy which restricts the types of investments the OST can participate in to U.S. government and agency securities, U.S. dollar denominated obligations of supranational institutions, commercial paper, corporate notes, and deposits with qualified public depositaries. Investments in non-government securities may not exceed set percentages of the total daily portfolio size. Custodial Credit Risk. The custodial credit risk for investments is the risk that, in the event of a failure of the counterparty, a government will not be able to recover the value of the investment or collateral securities that are
in the possession of an outside party. The OST investment policy requires that securities purchased by the office be held by the master custodian, acting as an independent third party, in its safekeeping or trust department. Securities utilized in repurchase agreements are subject to additional restrictions. These restrictions are designed to limit the OST’s exposure to risk and ensure the safety of the investment. Concentration of Credit Risk. Concentration of credit risk is the risk of loss attributed to the magnitude of a government’s investment in a single issuer. For non-governmental securities, the OST adheres to the WSIB policy on commercial paper and corporate notes investments which limits its exposure to concentration of credit risk by restricting the amount of investments to no more than 3 percent of the portfolio to any single issuer.
Page 103
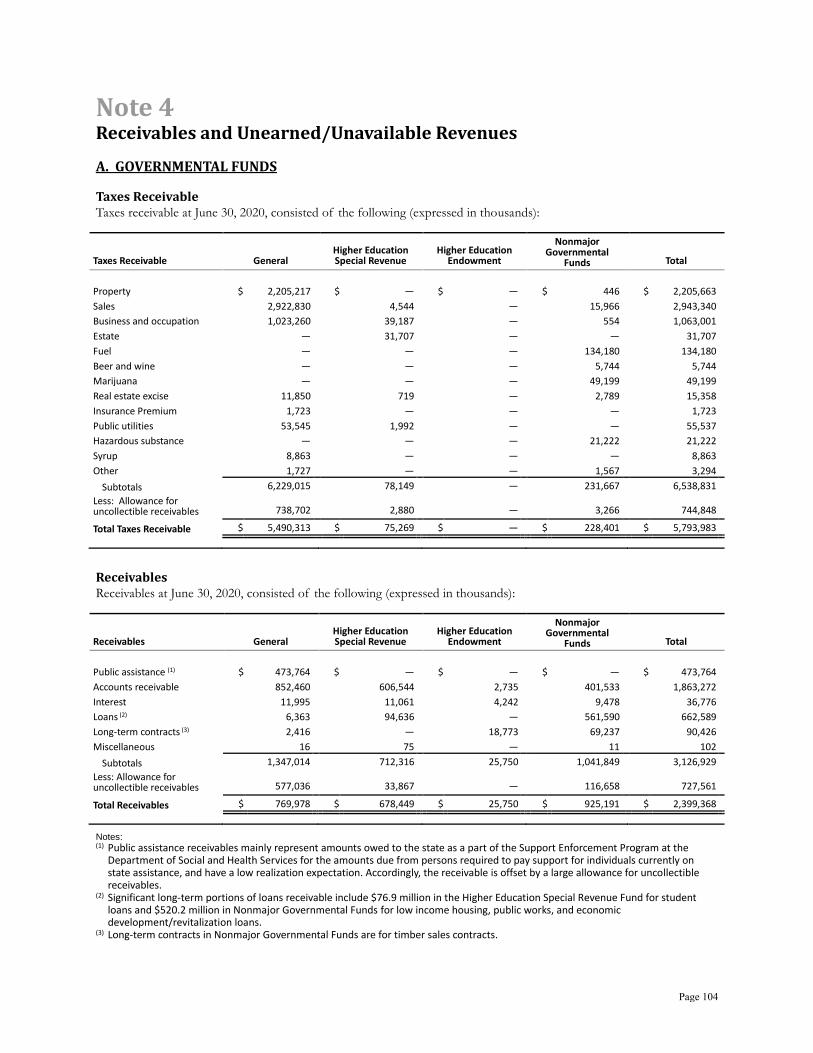
Note 4 Receivables and Unearned/Unavailable Revenues A. GOVERNMENTAL FUNDS Taxes Receivable Taxes receivable at June 30, 2020, consisted of the following (expressed in thousands):
Taxes Receivable General Higher Education Special Revenue
Higher Education Endowment
Nonmajor Governmental
Funds Total
Property $ 2,205,217 $ — $ — $ 446 $ 2,205,663 Sales 2,922,830 4,544 — 15,966 2,943,340 Business and occupation 1,023,260 39,187 — 554 1,063,001 Estate — 31,707 — — 31,707 Fuel — — — 134,180 134,180 Beer and wine — — — 5,744 5,744 Marijuana — — — 49,199 49,199 Real estate excise 11,850 719 — 2,789 15,358 Insurance Premium 1,723 — — — 1,723 Public utilities 53,545 1,992 — — 55,537 Hazardous substance — — — 21,222 21,222 Syrup 8,863 — — — 8,863 Other 1,727 — — 1,567 3,294
Subtotals 6,229,015 78,149 — 231,667 6,538,831 Less: Allowance for uncollectible receivables 738,702 2,880 — 3,266 744,848
Total Taxes Receivable $ 5,490,313 $ 75,269 $ — $ 228,401 $ 5,793,983 Receivables Receivables at June 30, 2020, consisted of the following (expressed in thousands):
Receivables General Higher Education Special Revenue
Higher Education Endowment
Nonmajor Governmental
Funds Total
Public assistance (1) $ 473,764 $ — $ — $ — $ 473,764 Accounts receivable 852,460 606,544 2,735 401,533 1,863,272 Interest 11,995 11,061 4,242 9,478 36,776 Loans (2) 6,363 94,636 — 561,590 662,589 Long-term contracts (3) 2,416 — 18,773 69,237 90,426 Miscellaneous 16 75 — 11 102
Subtotals 1,347,014 712,316 25,750 1,041,849 3,126,929 Less: Allowance for uncollectible receivables 577,036 33,867 — 116,658 727,561
Total Receivables $ 769,978 $ 678,449 $ 25,750 $ 925,191 $ 2,399,368
Notes: (1) Public assistance receivables mainly represent amounts owed to the state as a part of the Support Enforcement Program at the
Department of Social and Health Services for the amounts due from persons required to pay support for individuals currently on state assistance, and have a low realization expectation. Accordingly, the receivable is offset by a large allowance for uncollectible receivables.
(2) Significant long-term portions of loans receivable include $76.9 million in the Higher Education Special Revenue Fund for student loans and $520.2 million in Nonmajor Governmental Funds for low income housing, public works, and economic development/revitalization loans.
(3) Long-term contracts in Nonmajor Governmental Funds are for timber sales contracts.
Page 104
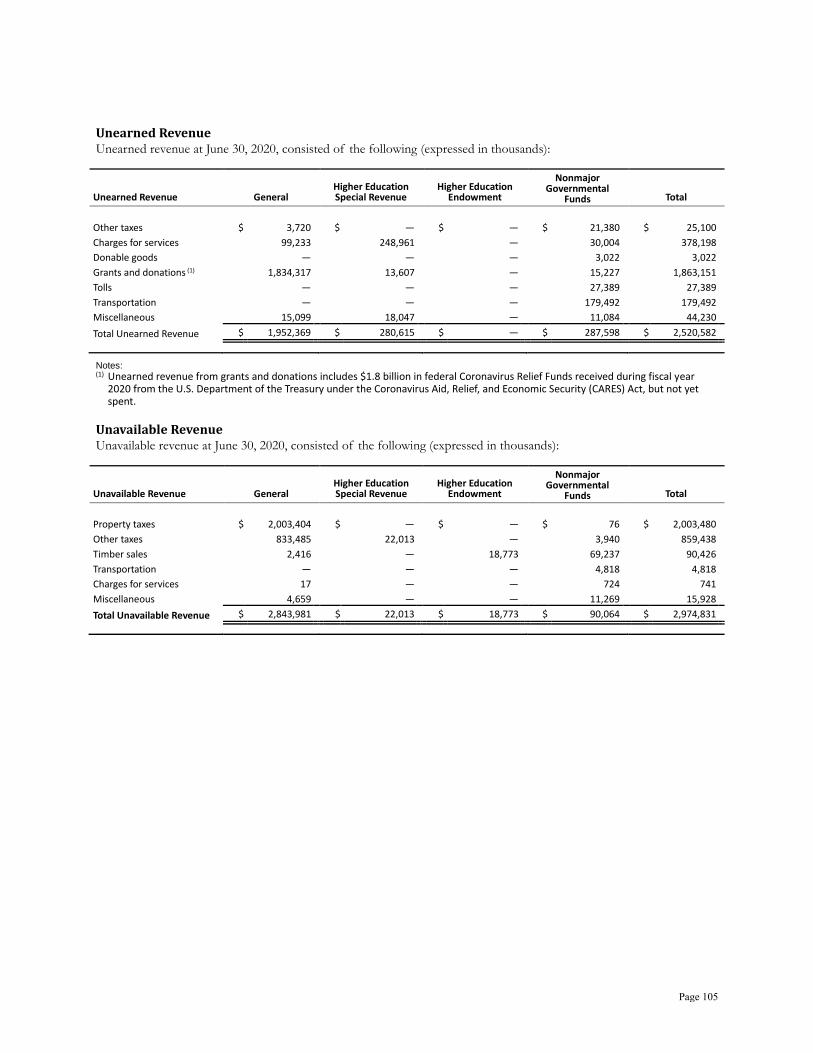
Unearned Revenue Unearned revenue at June 30, 2020, consisted of the following (expressed in thousands):
Unearned Revenue General Higher Education Special Revenue
Higher Education Endowment
Nonmajor Governmental
Funds Total
Other taxes $ 3,720 $ — $ — $ 21,380 $ 25,100 Charges for services 99,233 248,961 — 30,004 378,198 Donable goods — — — 3,022 3,022 Grants and donations (1) 1,834,317 13,607 — 15,227 1,863,151 Tolls — — — 27,389 27,389 Transportation — — — 179,492 179,492 Miscellaneous 15,099 18,047 — 11,084 44,230 Total Unearned Revenue $ 1,952,369 $ 280,615 $ — $ 287,598 $ 2,520,582
Notes: (1) Unearned revenue from grants and donations includes $1.8 billion in federal Coronavirus Relief Funds received during fiscal year
2020 from the U.S. Department of the Treasury under the Coronavirus Aid, Relief, and Economic Security (CARES) Act, but not yet spent.
Unavailable Revenue Unavailable revenue at June 30, 2020, consisted of the following (expressed in thousands):
Unavailable Revenue General Higher Education Special Revenue
Higher Education Endowment
Nonmajor Governmental
Funds Total
Property taxes $ 2,003,404 $ — $ — $ 76 $ 2,003,480 Other taxes 833,485 22,013 — 3,940 859,438 Timber sales 2,416 — 18,773 69,237 90,426 Transportation — — — 4,818 4,818 Charges for services 17 — — 724 741 Miscellaneous 4,659 — — 11,269 15,928 Total Unavailable Revenue $ 2,843,981 $ 22,013 $ 18,773 $ 90,064 $ 2,974,831
Page 105

B. PROPRIETARY FUNDS Receivables Receivables at June 30, 2020, consisted of the following (expressed in thousands):
Business-Type Activities Governmental Enterprise Funds Activities
Receivables Workers'
Compensation Unemployment Compensation
Higher Education Student Services
Nonmajor Enterprise Funds Total
Internal Service Funds
Accounts receivable (1) $ 954,486 $ 980,965 $ 356,030 $ 252,940 $ 2,544,421 $ 19,034 Interest 115,833 — 1,279 3,541 120,653 181 Investment trades pending — — — 169 169 — Miscellaneous 9 — 27 — 36 —
Subtotals 1,070,328 980,965 357,336 256,650 2,665,279 19,215 Less: Allowance for uncollectible receivables 234,390 266,191 23,399 502 524,482 847
Total Receivables $ 835,938 $ 714,774 $ 333,937 $ 256,148 $ 2,140,797 $ 18,368 Notes: (1) The Unemployment Compensation Fund accounts receivable and allowance for doubtful accounts balances include $198.2 million
and $166.5 million, respectively, related to the increased imposter fraud the fund experienced after the start of the COVID-19 pandemic.
Unearned Revenue Unearned revenue at June 30, 2020, consisted of the following (expressed in thousands):
Business-Type Activities Governmental Enterprise Funds Activities
Unearned Revenue Workers'
Compensation Unemployment Compensation
Higher Education Student Services
Nonmajor Enterprise Funds Total
Internal Service Funds
Charges for services $ — $ — $ 168,962 $ 8,569 $ 177,531 $ 3,686 Other taxes 152 — — 23,015 23,167 — Miscellaneous 7,931 — 319 19 8,269 — Total Unearned Revenue
$ 8,083 $ — $ 169,281 $ 31,603 $ 208,967 $ 3,686 Taxes Receivables Taxes receivables at June 30, 2020, consisted of $2.4 million for petroleum products, net of allowance.
C. FIDUCIARY FUNDS Other Receivables Receivables at June 30, 2020, consisted of $18.9 million for interest and other miscellaneous amounts. Unearned Revenue Unearned revenue at June 30, 2020, consisted of $572 thousand for service credit restorations reported in Pension and Other Employee Benefit Plans.
Page 106
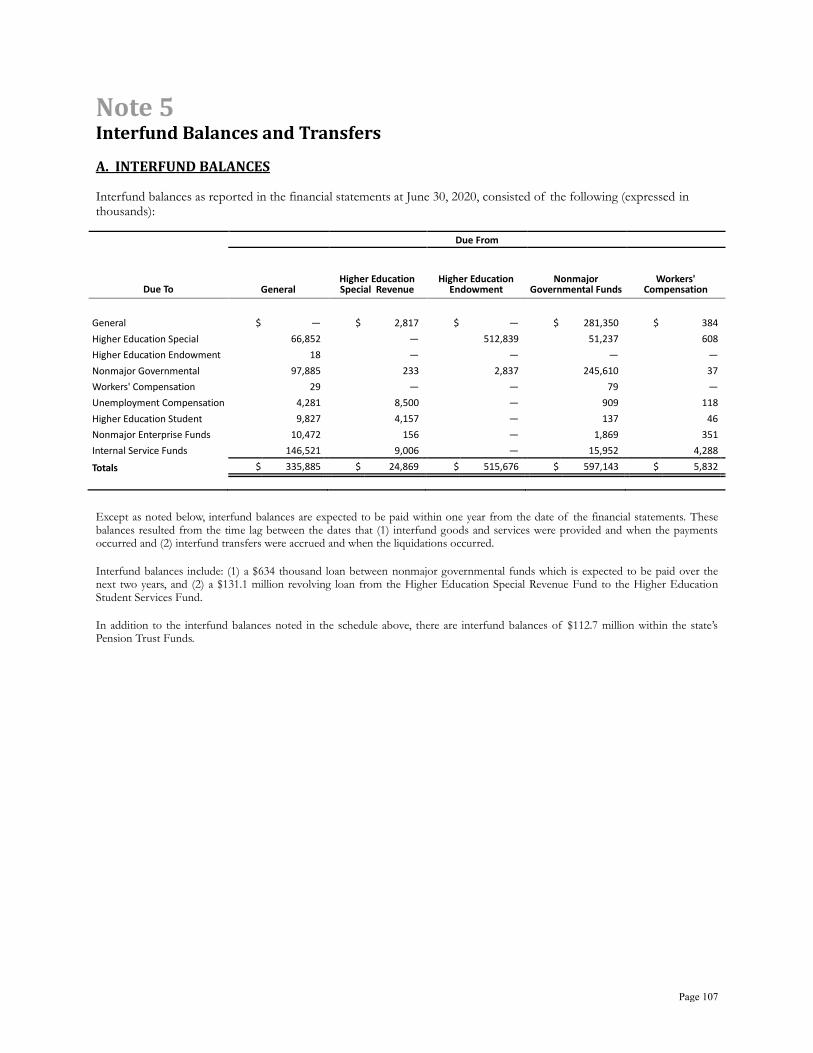
Note 5 Interfund Balances and Transfers A. INTERFUND BALANCES Interfund balances as reported in the financial statements at June 30, 2020, consisted of the following (expressed in thousands):
Due From
Due To General Higher Education Special Revenue
Higher Education Endowment
Nonmajor Governmental Funds
Workers' Compensation
General $ — $ 2,817 $ — $ 281,350 $ 384 Higher Education Special Revenue
66,852 — 512,839 51,237 608 Higher Education Endowment 18 — — — — Nonmajor Governmental Funds
97,885 233 2,837 245,610 37 Workers' Compensation 29 — — 79 — Unemployment Compensation 4,281 8,500 — 909 118 Higher Education Student Services
9,827 4,157 — 137 46 Nonmajor Enterprise Funds 10,472 156 — 1,869 351 Internal Service Funds 146,521 9,006 — 15,952 4,288 Totals $ 335,885 $ 24,869 $ 515,676 $ 597,143 $ 5,832
Except as noted below, interfund balances are expected to be paid within one year from the date of the financial statements. These balances resulted from the time lag between the dates that (1) interfund goods and services were provided and when the payments occurred and (2) interfund transfers were accrued and when the liquidations occurred.
Interfund balances include: (1) a $634 thousand loan between nonmajor governmental funds which is expected to be paid over the next two years, and (2) a $131.1 million revolving loan from the Higher Education Special Revenue Fund to the Higher Education Student Services Fund.
In addition to the interfund balances noted in the schedule above, there are interfund balances of $112.7 million within the state’s Pension Trust Funds.
Page 107

Due From
Unemployment Compensation
Higher Education Student Services
Nonmajor Enterprise Funds
Internal Service Funds Fiduciary Funds Totals
$ 6 $ — $ 17,902 $ 217,377 $ — $ 519,836
— 167,914 180 13,474 — 813,104 — — — — — 18
1,369 80 917 2,857 — 351,825 — — — 35 — 143 — 13 43 73 — 13,937 — — 74 299 — 14,540 — 51 354,121 28 — 367,048 — 11,634 2,503 13,820 82 203,806
$ 1,375 $ 179,692 $ 375,740 $ 247,963 $ 82 $ 2,284,257
Page 108
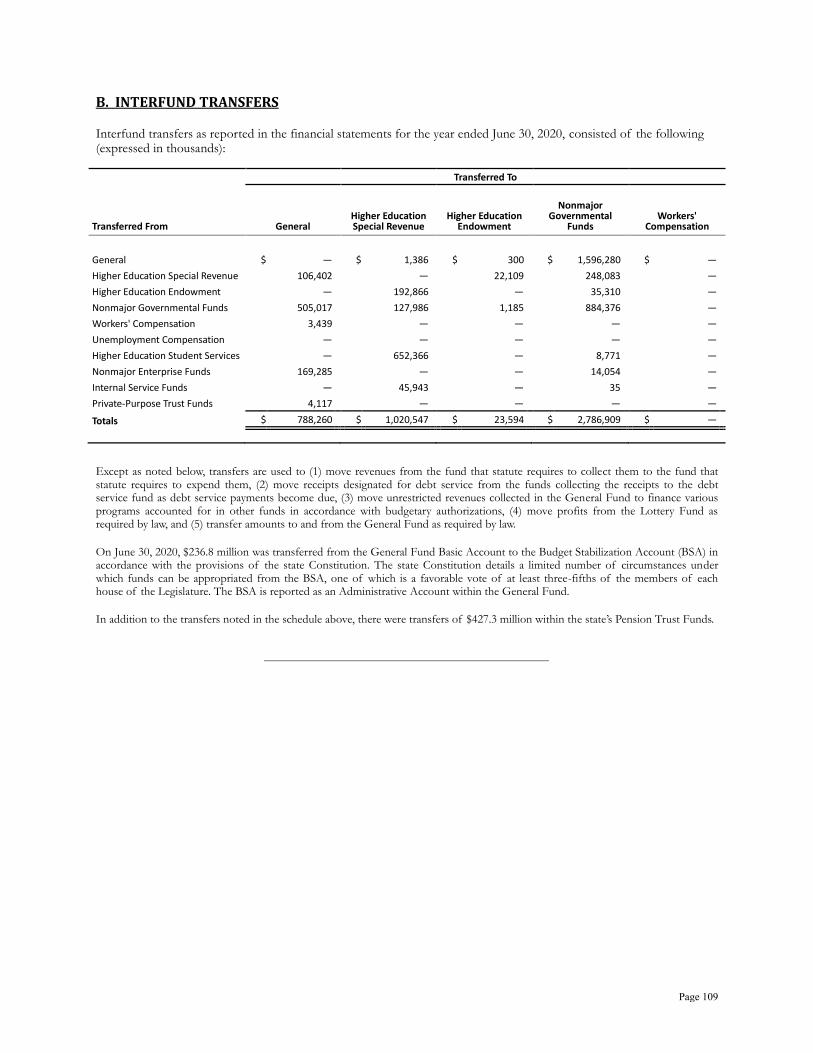
B. INTERFUND TRANSFERS Interfund transfers as reported in the financial statements for the year ended June 30, 2020, consisted of the following (expressed in thousands):
Transferred To
Transferred From General Higher Education Special Revenue
Higher Education Endowment
Nonmajor Governmental
Funds Workers'
Compensation
General $ — $ 1,386 $ 300 $ 1,596,280 $ — Higher Education Special Revenue 106,402 — 22,109 248,083 — Higher Education Endowment — 192,866 — 35,310 — Nonmajor Governmental Funds 505,017 127,986 1,185 884,376 — Workers' Compensation 3,439 — — — — Unemployment Compensation — — — — — Higher Education Student Services — 652,366 — 8,771 — Nonmajor Enterprise Funds 169,285 — — 14,054 — Internal Service Funds — 45,943 — 35 — Private-Purpose Trust Funds 4,117 — — — — Totals $ 788,260 $ 1,020,547 $ 23,594 $ 2,786,909 $ —
Except as noted below, transfers are used to (1) move revenues from the fund that statute requires to collect them to the fund that statute requires to expend them, (2) move receipts designated for debt service from the funds collecting the receipts to the debt service fund as debt service payments become due, (3) move unrestricted revenues collected in the General Fund to finance various programs accounted for in other funds in accordance with budgetary authorizations, (4) move profits from the Lottery Fund as required by law, and (5) transfer amounts to and from the General Fund as required by law.
On June 30, 2020, $236.8 million was transferred from the General Fund Basic Account to the Budget Stabilization Account (BSA) in accordance with the provisions of the state Constitution. The state Constitution details a limited number of circumstances under which funds can be appropriated from the BSA, one of which is a favorable vote of at least three-fifths of the members of each house of the Legislature. The BSA is reported as an Administrative Account within the General Fund.
In addition to the transfers noted in the schedule above, there were transfers of $427.3 million within the state’s Pension Trust Funds.
Page 109

Transferred To
Unemployment Compensation
Higher Education Student Services
Nonmajor Enterprise Funds
Internal Service Funds
Private-Purpose Trust Funds Totals
$ — $ — $ 11,331 $ 16,648 $ — $ 1,625,945
— 635,643 — 44,425 — 1,056,662 — — — — — 228,176 — 605 — — — 1,519,169 — — — — — 3,439 — — — — — — — — — 350 — 661,487 — — — — — 183,339 — — — — — 45,978 — — — — — 4,117
$ — $ 636,248 $ 11,331 $ 61,423 $ — $ 5,328,312
Page 110
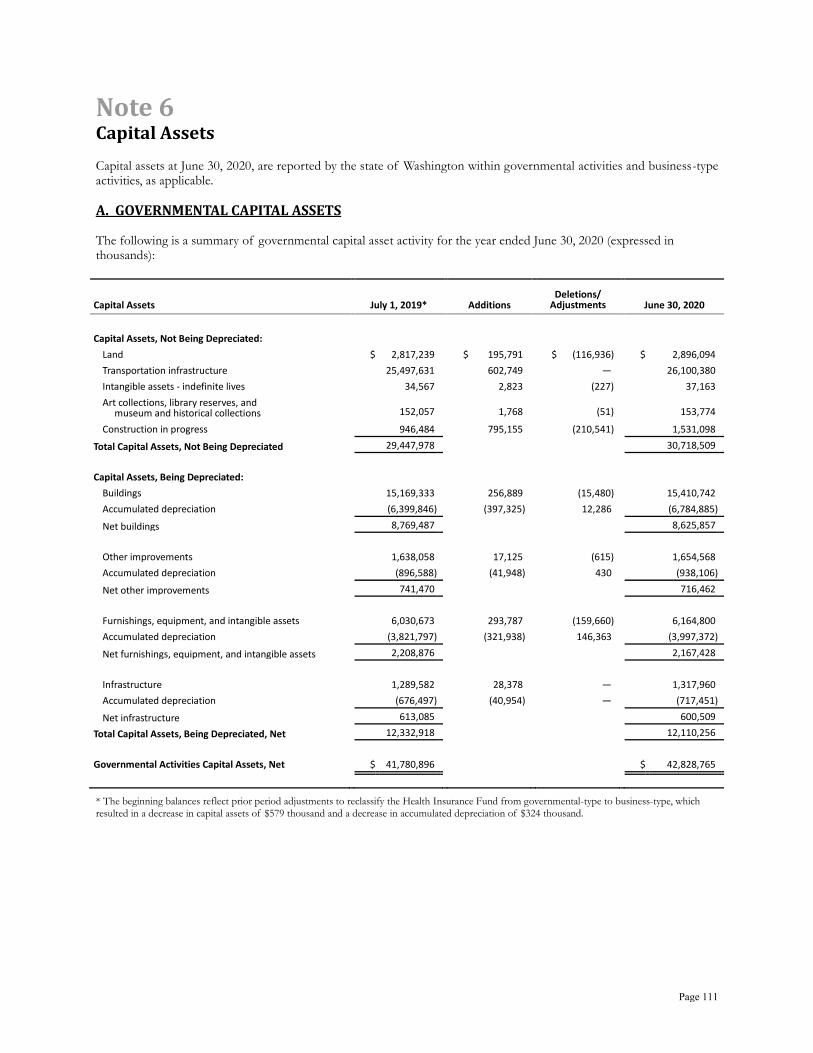
Note 6 Capital Assets Capital assets at June 30, 2020, are reported by the state of Washington within governmental activities and business-type activities, as applicable.
A. GOVERNMENTAL CAPITAL ASSETS The following is a summary of governmental capital asset activity for the year ended June 30, 2020 (expressed in thousands):
Capital Assets July 1, 2019* Additions Deletions/
Adjustments June 30, 2020
Capital Assets, Not Being Depreciated:
Land $ 2,817,239 $ 195,791 $ (116,936) $ 2,896,094 Transportation infrastructure 25,497,631 602,749 — 26,100,380 Intangible assets - indefinite lives 34,567 2,823 (227) 37,163 Art collections, library reserves, and
museum and historical collections 152,057 1,768 (51) 153,774
Construction in progress 946,484 795,155 (210,541) 1,531,098 Total Capital Assets, Not Being Depreciated 29,447,978 30,718,509 Capital Assets, Being Depreciated:
Buildings 15,169,333 256,889 (15,480) 15,410,742 Accumulated depreciation (6,399,846) (397,325) 12,286 (6,784,885) Net buildings 8,769,487 8,625,857
Other improvements 1,638,058 17,125 (615) 1,654,568 Accumulated depreciation (896,588) (41,948) 430 (938,106) Net other improvements 741,470 716,462
Furnishings, equipment, and intangible assets 6,030,673 293,787 (159,660) 6,164,800 Accumulated depreciation (3,821,797) (321,938) 146,363 (3,997,372) Net furnishings, equipment, and intangible assets 2,208,876 2,167,428
Infrastructure 1,289,582 28,378 — 1,317,960 Accumulated depreciation (676,497) (40,954) — (717,451) Net infrastructure 613,085 600,509
Total Capital Assets, Being Depreciated, Net 12,332,918 12,110,256 Governmental Activities Capital Assets, Net $ 41,780,896 $ 42,828,765
* The beginning balances reflect prior period adjustments to reclassify the Health Insurance Fund from governmental-type to business-type, which resulted in a decrease in capital assets of $579 thousand and a decrease in accumulated depreciation of $324 thousand.
Page 111
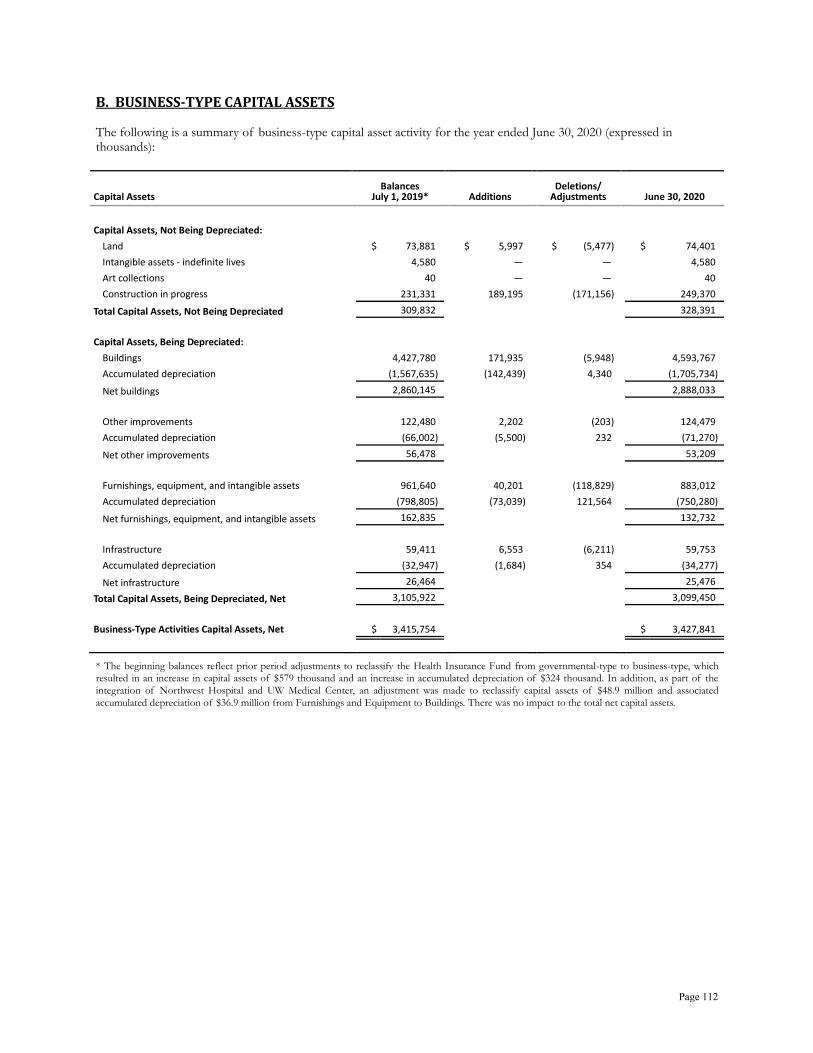
B. BUSINESS-TYPE CAPITAL ASSETS The following is a summary of business-type capital asset activity for the year ended June 30, 2020 (expressed in thousands):
Capital Assets Balances
July 1, 2019* Additions Deletions/
Adjustments June 30, 2020
Capital Assets, Not Being Depreciated:
Land $ 73,881 $ 5,997 $ (5,477) $ 74,401 Intangible assets - indefinite lives 4,580 — — 4,580 Art collections 40 — — 40 Construction in progress 231,331 189,195 (171,156) 249,370
Total Capital Assets, Not Being Depreciated 309,832 328,391 Capital Assets, Being Depreciated:
Buildings 4,427,780 171,935 (5,948) 4,593,767 Accumulated depreciation (1,567,635) (142,439) 4,340 (1,705,734) Net buildings 2,860,145 2,888,033
Other improvements 122,480 2,202 (203) 124,479 Accumulated depreciation (66,002) (5,500) 232 (71,270) Net other improvements 56,478 53,209
Furnishings, equipment, and intangible assets 961,640 40,201 (118,829) 883,012 Accumulated depreciation (798,805) (73,039) 121,564 (750,280) Net furnishings, equipment, and intangible assets 162,835 132,732
Infrastructure 59,411 6,553 (6,211) 59,753 Accumulated depreciation (32,947) (1,684) 354 (34,277) Net infrastructure 26,464 25,476
Total Capital Assets, Being Depreciated, Net 3,105,922 3,099,450 Business-Type Activities Capital Assets, Net $ 3,415,754 $ 3,427,841
* The beginning balances reflect prior period adjustments to reclassify the Health Insurance Fund from governmental-type to business-type, which resulted in an increase in capital assets of $579 thousand and an increase in accumulated depreciation of $324 thousand. In addition, as part of the
integration of Northwest Hospital and UW Medical Center, an adjustment was made to reclassify capital assets of $48.9 million and associated
accumulated depreciation of $36.9 million from Furnishings and Equipment to Buildings. There was no impact to the total net capital assets.
Page 112
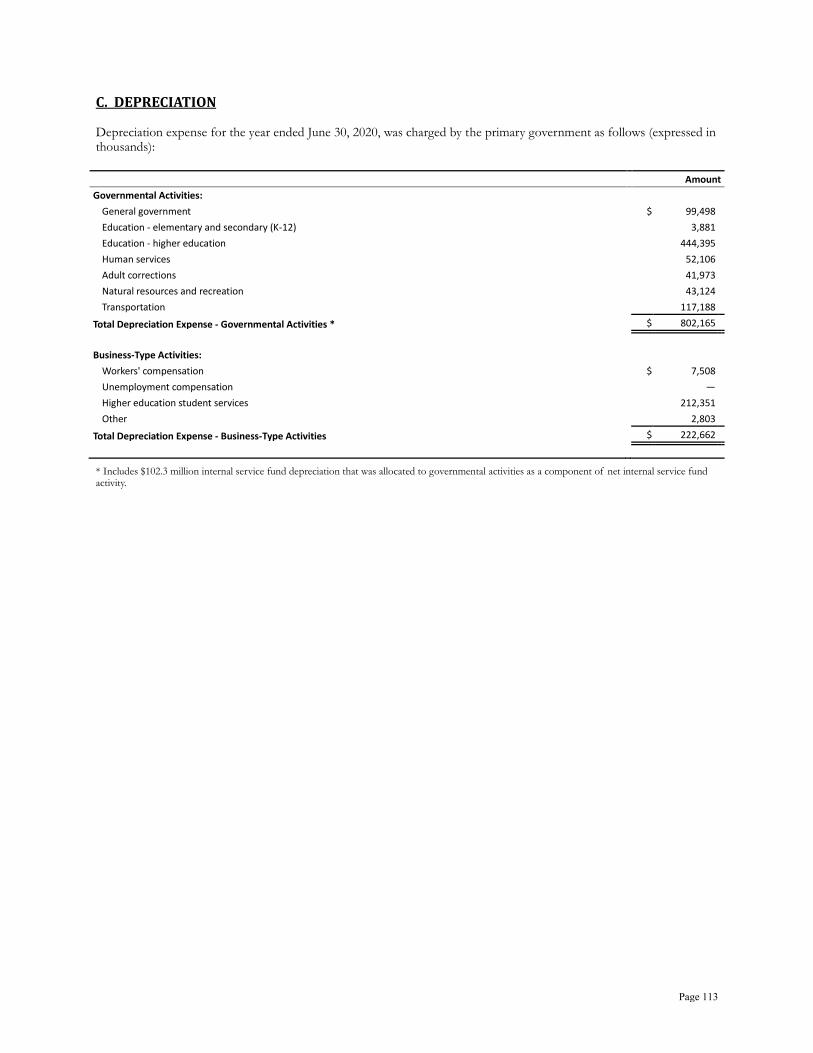
C. DEPRECIATION Depreciation expense for the year ended June 30, 2020, was charged by the primary government as follows (expressed in thousands):
Amount Governmental Activities:
General government $ 99,498 Education - elementary and secondary (K-12) 3,881 Education - higher education 444,395 Human services 52,106 Adult corrections 41,973 Natural resources and recreation 43,124 Transportation 117,188
Total Depreciation Expense - Governmental Activities * $ 802,165 Business-Type Activities:
Workers' compensation $ 7,508 Unemployment compensation — Higher education student services 212,351 Other 2,803
Total Depreciation Expense - Business-Type Activities $ 222,662
* Includes $102.3 million internal service fund depreciation that was allocated to governmental activities as a component of net internal service fund activity.
Page 113

D. CONSTRUCTION IN PROGRESS
Major construction commitments of the state at June 30, 2020, are as follows (expressed in thousands):
Continued
Agency / Project Commitments
Construction In Progress
June 30, 2020
Remaining Project
Commitments
Office of the Secretary of State: Library-Archives building $ 1,077 $ 107,052
Department of Enterprise Services:
East Plaza water infiltration and elevator, Capitol Campus Childcare Center, and other projects 17,972 10,893 Washington State Patrol:
Fire Training Academy aircraft rescue repairs, and Burn Building 1,886 10,011 High Throughput DNA Laboratory, crime lab renovation, and other projects 877 1,375
Department of Labor and Industries:
Division of Occupational Safety and Health Lab, and other projects 2,214 54,145 Military Department:
Thurston County Readiness Center, and other projects 24,879 17,540 Department of Social and Health Services:
Residential, rehabilitation, and other facilities 38,603 73,152 State hospitals / treatment centers 78,746 162,650
Department of Corrections:
Correctional center units security and safety improvements 9,597 32,531 Other projects 4,517 18,705
Department of Transportation:
State ferry vessels and terminals, and other projects 534,778 172,290 Transportation infrastructure — 250,771
Department of Fish and Wildlife:
Soos Creek, Clarks Creek, and Kalama hatcheries, Fir Island Farm, Deschutes Watershed, and other projects
87,252
147,402
Employment Security Department: Family and Medical Leave system 51,811 6,431
University of Washington:
Health and Sciences Center, Kincaid Hall, Parrington Hall, and Population Health renovation, Harborview Research and Training Building restoration, Behavioral Health Teaching Facility, Founders Hall, Tacoma soils remediation and other projects.
294,945
136,678
North campus student housing - Oak Hall and Denny Field, and Stevens Court 53,347 16,745 Parking restrip - Seattle campus master plan, Bothell corporation yard, and other athletic projects
4,580
1,837
UW Medical Center expansion, upgrades, and renovation projects 82,180 18,304 Washington State University:
Baseball clubhouse - Bailey-Brayton Field Clubhouse 6,284 4,353 Chief Joseph building, Stephenson East and South, and other housing projects 2,643 709 Modernization initiative, and miscellaneous projects 16,539 19,256 Plant Science, Global Animal Health, Tri Cities academic, and other facility projects 111,791 60,485
Page 114
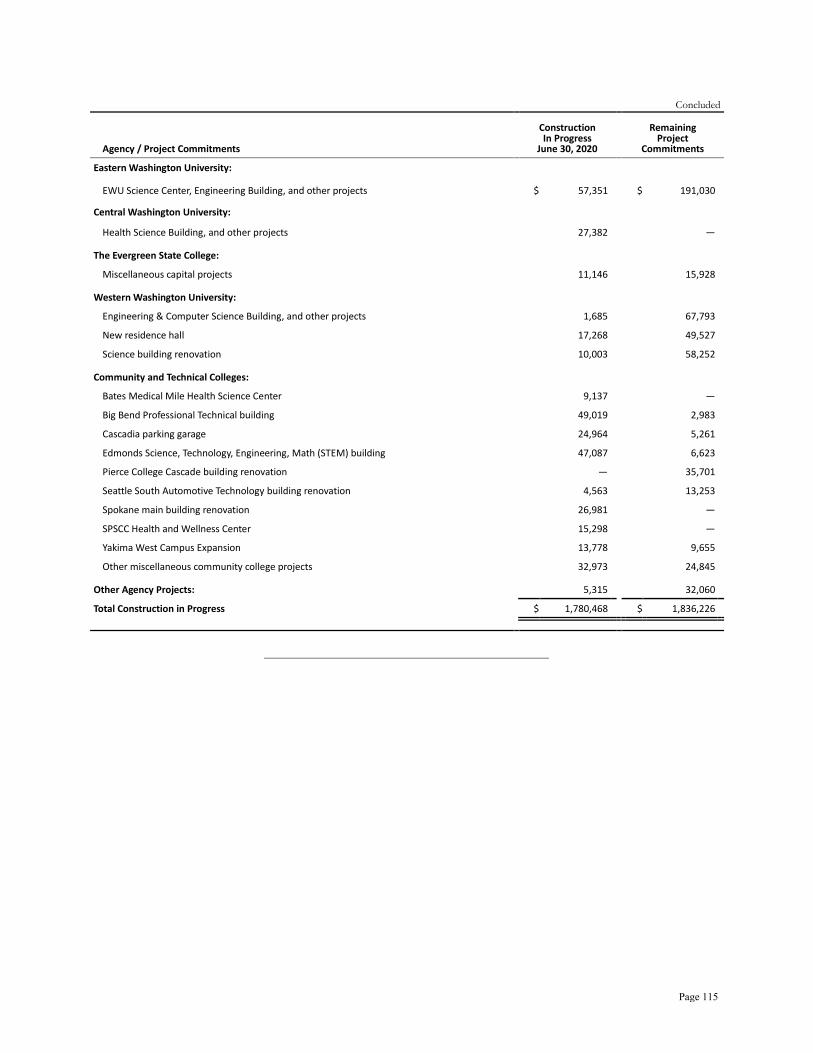
Concluded
Agency / Project Commitments
Construction In Progress
June 30, 2020
Remaining Project
Commitments
Eastern Washington University:
EWU Science Center, Engineering Building, and other projects $ 57,351 $ 191,030
— — Central Washington University: Health Science Building, and other projects 27,382 —
The Evergreen State College:
Miscellaneous capital projects 11,146 15,928 Western Washington University:
Engineering & Computer Science Building, and other projects 1,685 67,793 New residence hall 17,268 49,527 Science building renovation 10,003 58,252
Community and Technical Colleges:
Bates Medical Mile Health Science Center 9,137 — Big Bend Professional Technical building 49,019 2,983 Cascadia parking garage 24,964 5,261 Edmonds Science, Technology, Engineering, Math (STEM) building 47,087 6,623 Pierce College Cascade building renovation — 35,701 Seattle South Automotive Technology building renovation 4,563 13,253 Spokane main building renovation 26,981 — SPSCC Health and Wellness Center 15,298 — Yakima West Campus Expansion 13,778 9,655 Other miscellaneous community college projects 32,973 24,845
Other Agency Projects: 5,315 32,060 Total Construction in Progress $ 1,780,468 $ 1,836,226
Page 115

Note 7 Long-Term Liabilities
A. BONDS AND NOTES PAYABLE
Bonds payable at June 30, 2020, are reported by the state of Washington within governmental activities and business-type activities, as applicable. The state Constitution and enabling statutes authorize the incurrence of state general obligation debt, to which the state’s full faith, credit, and taxing power are pledged, either by the Legislature or by a body designated by statute (presently the State Finance Committee). Authorization arises in the following situations:
• From an affirmative vote of 60 percent of the members of each house of the Legislature without voter approval, in which case the amount of such debt is generally subject to the constitutional debt limitation described below.
• When authorized by law for a distinct work or object and approved by a majority of the voters voting thereon at a general election or a special election called for that purpose, in which case the amount of the debt so approved is not subject to the constitutional debt limitations described below.
• By the State Finance Committee without limitation as to amount, and without approval of the Legislature or approval of the voters.
The State Finance Committee debt authorization does not require voter approval; however, it is limited to providing for: (1) meeting temporary deficiencies of the state treasury if such debt is discharged within 12 months of the date of incurrence and is incurred only to provide for appropriations already made by the Legislature; or (2) refunding of outstanding obligations of the state. Legal Debt Limitation The state Constitution limits the amount of state debt that may be incurred by restricting the amount of general state revenues which may be allocated to pay principal and interest on debt subject to these limitations. In November 2012, voters passed a constitutional amendment specifying that maximum annual payments of principal and interest on all debt subject to the limit may not exceed a percentage of the average of the prior six years’ general state revenues; this percentage currently stands at 8.25 percent and will decline to 8.00 percent by July 1, 2034. This limitation restricts the incurrence of new debt and not the amount of debt service that may be paid by the state in future years. The state Constitution
requires the State Treasurer to certify the debt service limitation for each fiscal year. In accordance with these provisions, the debt service limitation for fiscal year 2020 is $1.60 billion. This computation excludes specific bond issues and types that are not secured by general state revenues. Of the $19.79 billion general obligation bond debt principal outstanding at June 30, 2020, $11.96 billion is subject to the limitation. Based on the debt limitation calculation, the debt service requirements as of June 30, 2020, did not exceed the authorized debt service limitation. For further information on the debt limit, refer to the Report on the State of Washington's Debt Limitation available from the Office of the State Treasurer at https://www.tre.wa.gov/ wp - content / uploads/ Debt-Limit-Certification-2020-for-the-web.pdf or to Schedule 11 in the Statistical Section of this report. Authorized But Unissued The state had a total of $13.83 billion in general obligation bonds authorized but unissued as of June 30, 2020, for the purpose of capital construction, higher education, transportation, and various other projects throughout the state. Interest Rates Interest rates on fixed rate general obligation bonds range from 1.00 to 6.03 percent. Interest rates on revenue bonds range from 1.31 to 8.00 percent.
Debt Service Requirements to Maturity General Obligations Bonds General obligation bonds have been authorized and issued primarily to provide funds for the following purposes: • Acquisition and construction of state and common
school capital facilities.
• Transportation construction and improvement projects.
• Assistance to local governments for public works capital projects.
• Refunding of general obligation bonds outstanding.
Outstanding general obligation bonds are presented in the Washington State Treasurer’s Annual Report. A copy of the report is available from the Office of the State Treasurer, PO Box 40200, Olympia, WA 98504-0200, phone number (360) 902-9000 or TTY 711, or by visiting their website at http://www.tre.wa.gov/about-us/resources/annual-reports.
Page 116
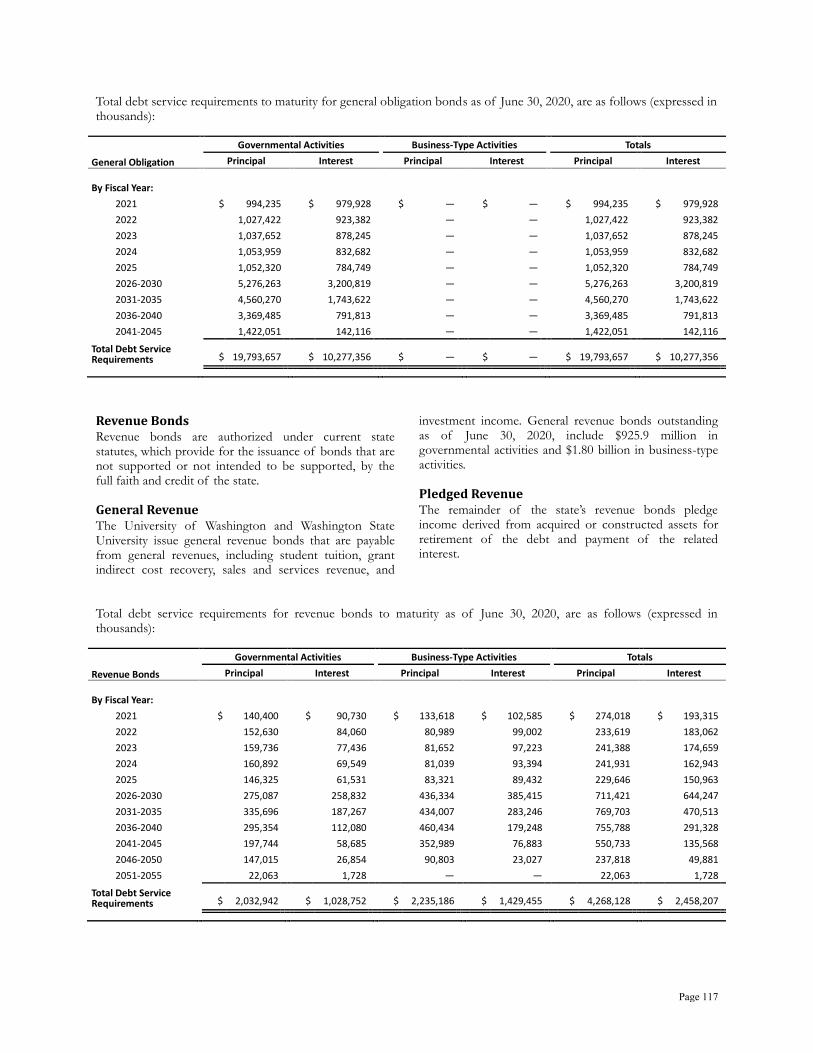
Total debt service requirements to maturity for general obligation bonds as of June 30, 2020, are as follows (expressed in thousands):
Governmental Activities Business-Type Activities Totals General Obligation Bonds
Principal Interest Principal Interest Principal Interest By Fiscal Year:
2021 $ 994,235 $ 979,928 $ — $ — $ 994,235 $ 979,928 2022 1,027,422 923,382 — — 1,027,422 923,382 2023 1,037,652 878,245 — — 1,037,652 878,245 2024 1,053,959 832,682 — — 1,053,959 832,682 2025 1,052,320 784,749 — — 1,052,320 784,749 2026-2030 5,276,263 3,200,819 — — 5,276,263 3,200,819 2031-2035 4,560,270 1,743,622 — — 4,560,270 1,743,622 2036-2040 3,369,485 791,813 — — 3,369,485 791,813 2041-2045 1,422,051 142,116 — — 1,422,051 142,116
Total Debt Service Requirements $ 19,793,657 $ 10,277,356 $ — $ — $ 19,793,657 $ 10,277,356
Revenue Bonds Revenue bonds are authorized under current state statutes, which provide for the issuance of bonds that are not supported or not intended to be supported, by the full faith and credit of the state. General Revenue The University of Washington and Washington State University issue general revenue bonds that are payable from general revenues, including student tuition, grant indirect cost recovery, sales and services revenue, and
investment income. General revenue bonds outstanding as of June 30, 2020, include $925.9 million in governmental activities and $1.80 billion in business-type activities. Pledged Revenue The remainder of the state’s revenue bonds pledge income derived from acquired or constructed assets for retirement of the debt and payment of the related interest.
Total debt service requirements for revenue bonds to maturity as of June 30, 2020, are as follows (expressed in thousands):
Governmental Activities Business-Type Activities Totals Revenue Bonds Principal Interest Principal Interest Principal Interest By Fiscal Year:
2021 $ 140,400 $ 90,730 $ 133,618 $ 102,585 $ 274,018 $ 193,315 2022 152,630 84,060 80,989 99,002 233,619 183,062 2023 159,736 77,436 81,652 97,223 241,388 174,659 2024 160,892 69,549 81,039 93,394 241,931 162,943 2025 146,325 61,531 83,321 89,432 229,646 150,963 2026-2030 275,087 258,832 436,334 385,415 711,421 644,247 2031-2035 335,696 187,267 434,007 283,246 769,703 470,513 2036-2040 295,354 112,080 460,434 179,248 755,788 291,328 2041-2045 197,744 58,685 352,989 76,883 550,733 135,568 2046-2050 147,015 26,854 90,803 23,027 237,818 49,881 2051-2055 22,063 1,728 — — 22,063 1,728
Total Debt Service Requirements $ 2,032,942 $ 1,028,752 $ 2,235,186 $ 1,429,455 $ 4,268,128 $ 2,458,207
Page 117

Governmental activities include revenue bonds outstanding at June 30, 2020, of $124.0 million issued by the Tobacco Settlement Authority (TSA), which is a blended component unit of the state. In November 2002, the TSA issued $517.9 million in bonds and transferred $450.0 million to the state to be used for increased health care, long-term care, and other programs. These bonds do not constitute either a legal or moral obligation of the state, nor does the state pledge its full faith, credit, or taxing power for payment of these bonds. The bonds are obligations of the TSA and are secured solely by the TSA’s right to receive 29.2 percent of the state’s tobacco settlement revenues, restricted investments of the TSA, undistributed TSA bond proceeds, and the earnings thereon held under the indenture authorizing the bonds. Total principal and interest remaining on the bonds is $158.6 million, payable through 2033. For the current year, both pledged revenue and debt service were $35.3 million. Governmental activities include grant anticipation revenue bonds outstanding at June 30, 2020, of $440.7 million issued for the Washington State Department of Transportation. The bonds were issued to finance a portion of the cost of constructing the State Route 520 Floating Bridge and Eastside Project. These bonds do not constitute either a legal or moral obligation of the state, nor does the state pledge its full faith, credit, or taxing power for payment of these bonds. The bonds are payable solely from Federal-Aid Highway Program funds, including federal reimbursements of debt service on the bonds and federal reimbursements to the state for projects or portions of projects not financed with bond proceeds. Total principal and interest remaining on the bonds is $497.6 million, payable through 2024. For the current year, both pledged revenue and debt service were $99.8 million. Governmental activities include the Transportation Infrastructure Finance and Innovation Act Bond (TIFIA Bond) outstanding at June 30, 2020, of $290.5 million. The bonds were issued to finance a portion of the State Route 520 Corridor Program. The TIFIA Bond is payable solely from toll revenues and does not constitute either a legal or moral obligation of the state, nor does the state pledge its full faith, credit, or taxing power for payment of this bond. Total principal and interest remaining on the bond is $504.3 million, payable through 2051. For the current year both pledged revenue and debt service were $12.7 million. Governmental activities include revenue bonds outstanding at June 30, 2020, of $33.4 million issued by TOP, which is a blended component unit of the state. The bonds, issued in 2004, are payable solely from the
trust estate pledged under the indenture, including rental payments. The bonds were used to construct an office building in Tumwater, Washington which the state occupied beginning in fiscal year 2006. The bonds are not a general obligation of the state, nor does the state pledge its full faith, credit, or taxing power for payment of these bonds. Total principal and interest remaining on the bonds is $41.0 million, payable through 2029. For the current year, both pledged revenue and debt service were $4.0 million. Governmental activities include revenue bonds outstanding at June 30, 2020, of $218.0 million issued by FYI Properties, a blended component unit of the state. The bonds, issued in 2009, are payable solely from the trust estate pledged under the indenture, including rental payments. The bonds were used to construct an office building in Olympia, Washington which the state occupied beginning in fiscal year 2012. The bonds are not a general obligation of the state, nor does the state pledge its full faith, credit, or taxing power for payment of these bonds. Total principal and interest remaining on the bonds is $342.0 million, payable through 2039. For the current year, both pledged revenue and debt service were $18.1 million. Additionally, governmental activities include revenue bonds outstanding at June 30, 2020, of $515 thousand issued by the City of Aberdeen. The bonds were used to extend utilities to the state Department of Corrections Stafford Creek Corrections Center. The Department of Corrections entered into an agreement with the City of Aberdeen to pay a system development fee sufficient to pay the debt service on the bonds. The bonds were issued in 1998 and 2002, and refunded by the city in 2010, and are payable solely from current operating appropriations. The bonds are not a general obligation of the state, nor does the state pledge its full faith, credit, or taxing power for payment of these bonds. Total principal and interest remaining on these bonds is $566 thousand payable through 2022. For the current year, both pledged revenue and debt service were $188 thousand. The state’s colleges and universities may issue bonds for the purpose of housing, dining, parking, and student facilities construction. These bonds are reported within business-type activities and are secured by a pledge of specific revenues. These bonds are not a general obligation of the state, nor does the state pledge its full faith, credit, or taxing power for payment of these bonds. The state colleges and universities may also enter into financing agreements, not offered for public sale, directly with investors or lenders.
Page 118

Total pledged specific revenues for the state’s colleges and universities to repay the principal and interest of revenue bonds as of June 30, 2020, are as follows (expressed in thousands):
Source of Revenue Pledged
Housing and Dining Revenues
(Net of Operating Expenses)
Student Facilities Fees and
Earnings on Invested Fees Bookstore Revenues
Current revenue pledged * $ 38,644 $ 13,747 $ 9 Current year debt service 22,660 7,386 202 Total future revenues pledged ** 473,481 85,620 2,831 Description of debt
Housing and dining bonds issued in
1998-2019 Student facilities bonds issued in
2002-2015 Bookstore bonds issued in 2013
Purpose of debt
Construction and renovation of student housing and dining
facilities
Construction and renovation of student activity and sports facilities
Construction of a new bookstore as part of a new
student union and recreation building
Term of commitment 2026-2049 2034-2039 2034 Percentage of debt service to pledged revenues (current year) 58.64 % 53.73 % 2,275.82 % *Bookstore revenue significantly decreased in fiscal year 2020 as a result of COVID-19, resulting in less pledged revenue. ** Total future principal and interest payments.
B. CERTIFICATES OF PARTICIPATION
Certificates of participation at June 30, 2020, are reported by the state of Washington within governmental activities and business-type activities, as applicable. Current state law authorizes the state to enter into long-term financing contracts for the acquisition of real or personal property and for the issuance of certificates of participation in the contracts. These certificates of
participation do not fall under the general obligation debt limitations and are generally payable only from annual appropriations by the Legislature. Other specific provisions could also affect the state’s obligation under certain agreements. The certificates of participation are recorded for financial reporting purposes if the possibility of the state not meeting the terms of the agreements is considered remote.
Total debt service requirements for certificates of participation to maturity as of June 30, 2020, are as follows (expressed in thousands):
Governmental Activities Business-Type Activities Totals Certificates of Participation
Principal Interest Principal Interest Principal Interest By Fiscal Year:
2021 $ 160,205 $ 52,275 $ 7,276 $ 2,374 $ 167,481 $ 54,649 2022 65,695 24,548 17,073 6,379 82,768 30,927 2023 56,829 21,362 14,768 5,552 71,597 26,914 2024 43,972 18,604 11,427 4,835 55,399 23,439 2025 39,031 16,521 10,143 4,293 49,174 20,814 2026-2030 158,194 57,320 41,110 14,896 199,304 72,216 2031-2035 93,783 29,044 24,372 7,548 118,155 36,592 2036-2040 60,466 9,940 15,714 2,583 76,180 12,523 2041-2045 13,585 1,521 3,530 395 17,115 1,916
Total Debt Service Requirements $ 691,760 $ 231,135 $ 145,413 $ 48,855 $ 837,173 $ 279,990
Page 119
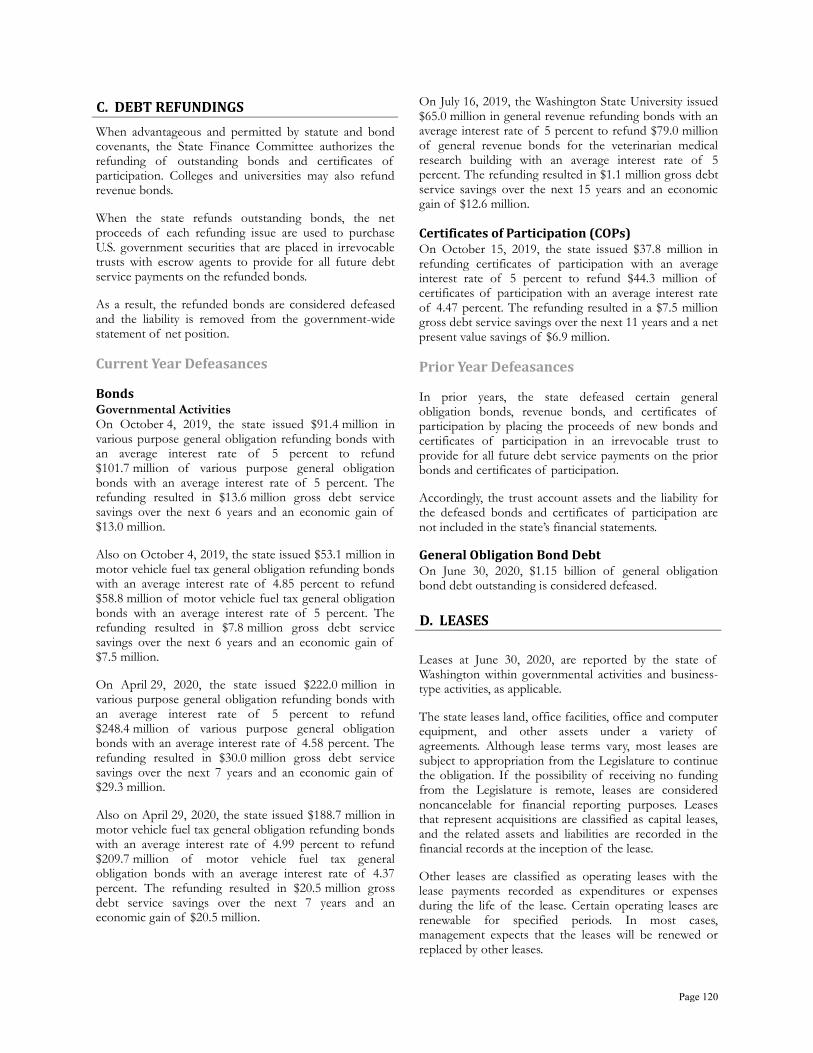
C. DEBT REFUNDINGS
When advantageous and permitted by statute and bond covenants, the State Finance Committee authorizes the refunding of outstanding bonds and certificates of participation. Colleges and universities may also refund revenue bonds.
When the state refunds outstanding bonds, the net proceeds of each refunding issue are used to purchase U.S. government securities that are placed in irrevocable trusts with escrow agents to provide for all future debt service payments on the refunded bonds.
As a result, the refunded bonds are considered defeased and the liability is removed from the government-wide statement of net position.
Current Year Defeasances Bonds Governmental Activities On October 4, 2019, the state issued $91.4 million in various purpose general obligation refunding bonds with an average interest rate of 5 percent to refund $101.7 million of various purpose general obligation bonds with an average interest rate of 5 percent. The refunding resulted in $13.6 million gross debt service savings over the next 6 years and an economic gain of $13.0 million.
Also on October 4, 2019, the state issued $53.1 million in motor vehicle fuel tax general obligation refunding bonds with an average interest rate of 4.85 percent to refund $58.8 million of motor vehicle fuel tax general obligation bonds with an average interest rate of 5 percent. The refunding resulted in $7.8 million gross debt service savings over the next 6 years and an economic gain of $7.5 million.
On April 29, 2020, the state issued $222.0 million in various purpose general obligation refunding bonds with an average interest rate of 5 percent to refund $248.4 million of various purpose general obligation bonds with an average interest rate of 4.58 percent. The refunding resulted in $30.0 million gross debt service savings over the next 7 years and an economic gain of $29.3 million.
Also on April 29, 2020, the state issued $188.7 million in motor vehicle fuel tax general obligation refunding bonds with an average interest rate of 4.99 percent to refund $209.7 million of motor vehicle fuel tax general obligation bonds with an average interest rate of 4.37 percent. The refunding resulted in $20.5 million gross debt service savings over the next 7 years and an economic gain of $20.5 million.
On July 16, 2019, the Washington State University issued $65.0 million in general revenue refunding bonds with an average interest rate of 5 percent to refund $79.0 million of general revenue bonds for the veterinarian medical research building with an average interest rate of 5 percent. The refunding resulted in $1.1 million gross debt service savings over the next 15 years and an economic gain of $12.6 million. Certificates of Participation (COPs) On October 15, 2019, the state issued $37.8 million in refunding certificates of participation with an average interest rate of 5 percent to refund $44.3 million of certificates of participation with an average interest rate of 4.47 percent. The refunding resulted in a $7.5 million gross debt service savings over the next 11 years and a net present value savings of $6.9 million.
Prior Year Defeasances In prior years, the state defeased certain general obligation bonds, revenue bonds, and certificates of participation by placing the proceeds of new bonds and certificates of participation in an irrevocable trust to provide for all future debt service payments on the prior bonds and certificates of participation.
Accordingly, the trust account assets and the liability for the defeased bonds and certificates of participation are not included in the state’s financial statements.
General Obligation Bond Debt On June 30, 2020, $1.15 billion of general obligation bond debt outstanding is considered defeased.
D. LEASES
Leases at June 30, 2020, are reported by the state of Washington within governmental activities and business-type activities, as applicable.
The state leases land, office facilities, office and computer equipment, and other assets under a variety of agreements. Although lease terms vary, most leases are subject to appropriation from the Legislature to continue the obligation. If the possibility of receiving no funding from the Legislature is remote, leases are considered noncancelable for financial reporting purposes. Leases that represent acquisitions are classified as capital leases, and the related assets and liabilities are recorded in the financial records at the inception of the lease.
Other leases are classified as operating leases with the lease payments recorded as expenditures or expenses during the life of the lease. Certain operating leases are renewable for specified periods. In most cases, management expects that the leases will be renewed or replaced by other leases.
Page 120
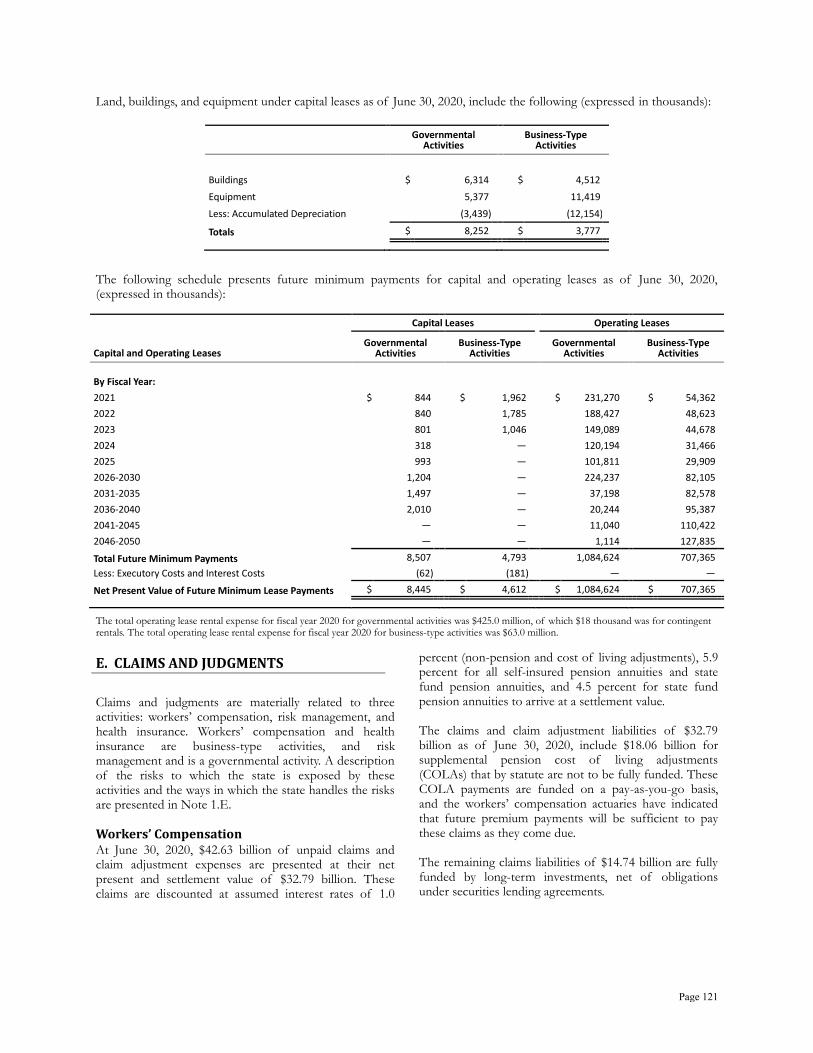
Land, buildings, and equipment under capital leases as of June 30, 2020, include the following (expressed in thousands):
Governmental
Activities Business-Type
Activities
Buildings $ 6,314 $ 4,512 Equipment 5,377 11,419 Less: Accumulated Depreciation (3,439) (12,154) Totals $ 8,252 $ 3,777
The following schedule presents future minimum payments for capital and operating leases as of June 30, 2020, (expressed in thousands):
Capital Leases Operating Leases
Capital and Operating Leases Governmental
Activities Business-Type
Activities Governmental
Activities Business-Type
Activities
By Fiscal Year: 2021 $ 844 $ 1,962 $ 231,270 $ 54,362 2022 840 1,785 188,427 48,623 2023 801 1,046 149,089 44,678 2024 318 — 120,194 31,466 2025 993 — 101,811 29,909 2026-2030 1,204 — 224,237 82,105 2031-2035 1,497 — 37,198 82,578 2036-2040 2,010 — 20,244 95,387 2041-2045 — — 11,040 110,422 2046-2050 — — 1,114 127,835 Total Future Minimum Payments 8,507 4,793 1,084,624 707,365 Less: Executory Costs and Interest Costs (62) (181) — — Net Present Value of Future Minimum Lease Payments $ 8,445 $ 4,612 $ 1,084,624 $ 707,365
The total operating lease rental expense for fiscal year 2020 for governmental activities was $425.0 million, of which $18 thousand was for contingent rentals. The total operating lease rental expense for fiscal year 2020 for business-type activities was $63.0 million.
E. CLAIMS AND JUDGMENTS
Claims and judgments are materially related to three activities: workers’ compensation, risk management, and health insurance. Workers’ compensation and health insurance are business-type activities, and risk management and is a governmental activity. A description of the risks to which the state is exposed by these activities and the ways in which the state handles the risks are presented in Note 1.E. Workers’ Compensation At June 30, 2020, $42.63 billion of unpaid claims and claim adjustment expenses are presented at their net present and settlement value of $32.79 billion. These claims are discounted at assumed interest rates of 1.0
percent (non-pension and cost of living adjustments), 5.9 percent for all self-insured pension annuities and state fund pension annuities, and 4.5 percent for state fund pension annuities to arrive at a settlement value. The claims and claim adjustment liabilities of $32.79 billion as of June 30, 2020, include $18.06 billion for supplemental pension cost of living adjustments (COLAs) that by statute are not to be fully funded. These COLA payments are funded on a pay-as-you-go basis, and the workers’ compensation actuaries have indicated that future premium payments will be sufficient to pay these claims as they come due. The remaining claims liabilities of $14.74 billion are fully funded by long-term investments, net of obligations under securities lending agreements.
Page 121
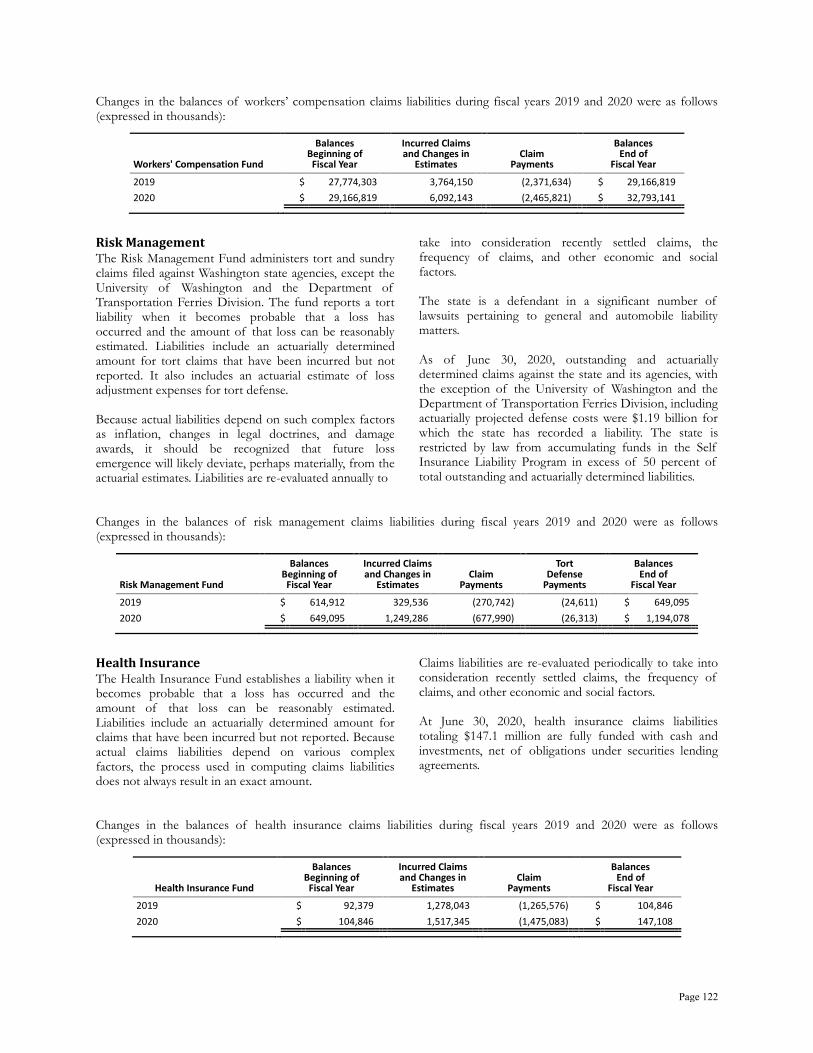
Changes in the balances of workers’ compensation claims liabilities during fiscal years 2019 and 2020 were as follows (expressed in thousands):
Workers' Compensation Fund
Balances Beginning of Fiscal Year
Incurred Claims and Changes in
Estimates Claim
Payments
Balances End of
Fiscal Year 2019 $ 27,774,303 3,764,150 (2,371,634) $ 29,166,819 2020 $ 29,166,819 6,092,143 (2,465,821) $ 32,793,141
Risk Management The Risk Management Fund administers tort and sundry claims filed against Washington state agencies, except the University of Washington and the Department of Transportation Ferries Division. The fund reports a tort liability when it becomes probable that a loss has occurred and the amount of that loss can be reasonably estimated. Liabilities include an actuarially determined amount for tort claims that have been incurred but not reported. It also includes an actuarial estimate of loss adjustment expenses for tort defense. Because actual liabilities depend on such complex factors as inflation, changes in legal doctrines, and damage awards, it should be recognized that future loss emergence will likely deviate, perhaps materially, from the actuarial estimates. Liabilities are re-evaluated annually to
take into consideration recently settled claims, the frequency of claims, and other economic and social factors. The state is a defendant in a significant number of lawsuits pertaining to general and automobile liability matters. As of June 30, 2020, outstanding and actuarially determined claims against the state and its agencies, with the exception of the University of Washington and the Department of Transportation Ferries Division, including actuarially projected defense costs were $1.19 billion for which the state has recorded a liability. The state is restricted by law from accumulating funds in the Self Insurance Liability Program in excess of 50 percent of total outstanding and actuarially determined liabilities.
Changes in the balances of risk management claims liabilities during fiscal years 2019 and 2020 were as follows (expressed in thousands):
Risk Management Fund
Balances Beginning of Fiscal Year
Incurred Claims and Changes in
Estimates Claim
Payments
Tort Defense
Payments
Balances End of
Fiscal Year 2019 $ 614,912 329,536 (270,742) (24,611) $ 649,095 2020 $ 649,095 1,249,286 (677,990) (26,313) $ 1,194,078
Health Insurance The Health Insurance Fund establishes a liability when it becomes probable that a loss has occurred and the amount of that loss can be reasonably estimated. Liabilities include an actuarially determined amount for claims that have been incurred but not reported. Because actual claims liabilities depend on various complex factors, the process used in computing claims liabilities does not always result in an exact amount.
Claims liabilities are re-evaluated periodically to take into consideration recently settled claims, the frequency of claims, and other economic and social factors. At June 30, 2020, health insurance claims liabilities totaling $147.1 million are fully funded with cash and investments, net of obligations under securities lending agreements.
Changes in the balances of health insurance claims liabilities during fiscal years 2019 and 2020 were as follows (expressed in thousands):
Health Insurance Fund
Balances Beginning of Fiscal Year
Incurred Claims and Changes in
Estimates Claim
Payments
Balances End of
Fiscal Year 2019 $ 92,379 1,278,043 (1,265,576) $ 104,846 2020 $ 104,846 1,517,345 (1,475,083) $ 147,108
Page 122
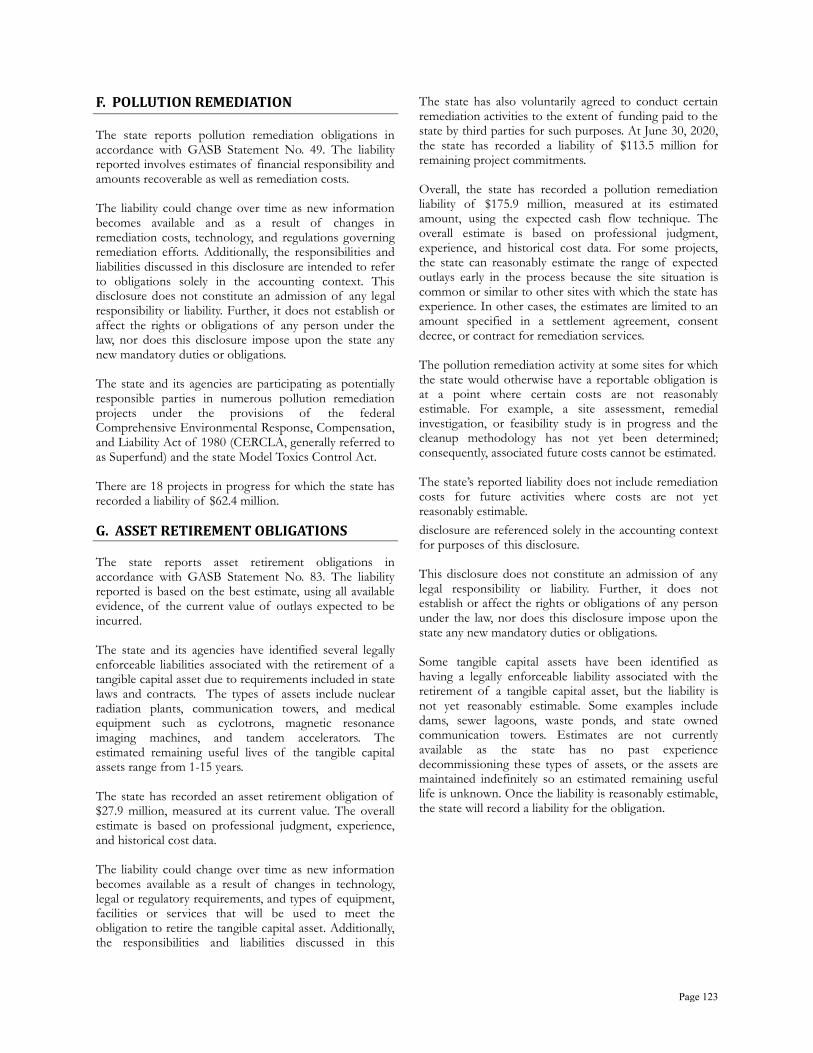
F. POLLUTION REMEDIATION
The state reports pollution remediation obligations in accordance with GASB Statement No. 49. The liability reported involves estimates of financial responsibility and amounts recoverable as well as remediation costs. The liability could change over time as new information becomes available and as a result of changes in remediation costs, technology, and regulations governing remediation efforts. Additionally, the responsibilities and liabilities discussed in this disclosure are intended to refer to obligations solely in the accounting context. This disclosure does not constitute an admission of any legal responsibility or liability. Further, it does not establish or affect the rights or obligations of any person under the law, nor does this disclosure impose upon the state any new mandatory duties or obligations. The state and its agencies are participating as potentially responsible parties in numerous pollution remediation projects under the provisions of the federal Comprehensive Environmental Response, Compensation, and Liability Act of 1980 (CERCLA, generally referred to as Superfund) and the state Model Toxics Control Act. There are 18 projects in progress for which the state has recorded a liability of $62.4 million.
The state has also voluntarily agreed to conduct certain remediation activities to the extent of funding paid to the state by third parties for such purposes. At June 30, 2020, the state has recorded a liability of $113.5 million for remaining project commitments. Overall, the state has recorded a pollution remediation liability of $175.9 million, measured at its estimated amount, using the expected cash flow technique. The overall estimate is based on professional judgment, experience, and historical cost data. For some projects, the state can reasonably estimate the range of expected outlays early in the process because the site situation is common or similar to other sites with which the state has experience. In other cases, the estimates are limited to an amount specified in a settlement agreement, consent decree, or contract for remediation services. The pollution remediation activity at some sites for which the state would otherwise have a reportable obligation is at a point where certain costs are not reasonably estimable. For example, a site assessment, remedial investigation, or feasibility study is in progress and the cleanup methodology has not yet been determined; consequently, associated future costs cannot be estimated. The state’s reported liability does not include remediation costs for future activities where costs are not yet reasonably estimable.
G. ASSET RETIREMENT OBLIGATIONS
The state reports asset retirement obligations in accordance with GASB Statement No. 83. The liability reported is based on the best estimate, using all available evidence, of the current value of outlays expected to be incurred. The state and its agencies have identified several legally enforceable liabilities associated with the retirement of a tangible capital asset due to requirements included in state laws and contracts. The types of assets include nuclear radiation plants, communication towers, and medical equipment such as cyclotrons, magnetic resonance imaging machines, and tandem accelerators. The estimated remaining useful lives of the tangible capital assets range from 1-15 years. The state has recorded an asset retirement obligation of $27.9 million, measured at its current value. The overall estimate is based on professional judgment, experience, and historical cost data. The liability could change over time as new information becomes available as a result of changes in technology, legal or regulatory requirements, and types of equipment, facilities or services that will be used to meet the obligation to retire the tangible capital asset. Additionally, the responsibilities and liabilities discussed in this
disclosure are referenced solely in the accounting context for purposes of this disclosure. This disclosure does not constitute an admission of any legal responsibility or liability. Further, it does not establish or affect the rights or obligations of any person under the law, nor does this disclosure impose upon the state any new mandatory duties or obligations. Some tangible capital assets have been identified as having a legally enforceable liability associated with the retirement of a tangible capital asset, but the liability is not yet reasonably estimable. Some examples include dams, sewer lagoons, waste ponds, and state owned communication towers. Estimates are not currently available as the state has no past experience decommissioning these types of assets, or the assets are maintained indefinitely so an estimated remaining useful life is unknown. Once the liability is reasonably estimable, the state will record a liability for the obligation.
Page 123

H. LONG-TERM LIABILITY ACTIVITY
Long-term liability activity at June 30, 2020, is reported by the state of Washington within governmental activities and business-type activities, as applicable. Long-term liability activity for governmental activities for fiscal year 2020 is as follows (expressed in thousands):
Governmental Activities:
Beginning Balance
July 1, 2019* Additions Reductions
Ending Balance
June 30, 2020
Amounts Due Within
One Year Long-Term Debt:
GO Bonds Payable: General obligation (GO) bonds $ 19,025,300 $ 2,093,660 $ 1,583,610 $ 19,535,350 $ 955,710 GO - zero coupon bonds (principal) 307,329 — 49,022 258,307 38,525 Subtotal - GO bonds payable 19,332,629 2,093,660 1,632,632 19,793,657 994,235
Accreted interest - GO - zero coupon bonds
401,153 — 41,860 359,293 62,940 Revenue bonds payable 2,188,497 76,316 231,871 2,032,942 140,400 Plus: Unamortized premiums on bonds sold
1,797,930 495,822 161,862 2,131,890 — Total Bonds Payable 23,720,209 2,665,798 2,068,225 24,317,782 1,197,575 Other Liabilities:
Certificates of participation 733,077 92,251 133,568 691,760 160,205 Plus: Unamortized premiums on COPs sold
19,689 5,674 7,441 17,922 — Claims and judgments payable 983,089 615,381 58,706 1,539,764 361,728 Installment contracts 1,317 — 137 1,180 137 Leases 8,829 722 1,106 8,445 813 Compensated absences 699,257 529,137 440,468 787,926 126,314 Net pension liability 3,331,088 1,839,982 2,190,120 2,980,950 14,306 Total OPEB liability 4,448,980 551,924 (64,278) 5,065,182 87,339 Pollution remediation obligations 132,838 51,639 8,625 175,852 — Unclaimed property refunds 250,169 2,286 45 252,410 6,647 Asset retirement obligations 25,168 2,771 — 27,939 — Other 359,944 96,112 82,132 373,924 25,021
Total Other Liabilities 10,993,445 3,787,879 2,858,070 11,923,254 782,510 Total Long-Term Debt $ 34,713,654 $ 6,453,677 $ 4,926,295 $ 36,241,036 $ 1,980,085
* Beginning balances have been restated for claims and judgments payable by $105.8 million, compensated absences by $558 thousand, net pension liability by $2.3 million, and OPEB liability by $4.6 million as a result of the Health Insurance Fund being reclassified from an internal service fund to an enterprise fund.
For governmental activities, certificates of participation are being repaid approximately 20 percent from the General Fund, 59 percent from the Higher Education Special Revenue Fund, and the balance from various governmental funds. The compensated absences liability will be liquidated approximately 46 percent by the General Fund, 33 percent by the Higher Education Special Revenue Fund, and the balance by various other governmental funds. The claims and judgments liability will be liquidated approximately 78 percent by the Risk Management Fund (a nonmajor internal service fund), and the balance by various other governmental funds. The other post employment benefits liability will be liquidated approximately 43 percent by the General Fund, 27 percent by the Higher Education Special Revenue
Fund, and the balance by various other governmental funds. The net pension liability will be liquidated approximately 48 percent by the General Fund, 33 percent by the Higher Education Special Revenue Fund, and the balance by various other governmental funds. The pollution remediation liability will be liquidated approximately 79 percent by the Wildlife and Natural Resources Fund (a nonmajor governmental fund), and the balance by various other governmental funds. The unclaimed property refunds will be liquidated against future unclaimed property deposited to the General Fund. Leases, installment contract obligations, and other liabilities will be repaid from various other governmental funds.
Page 124
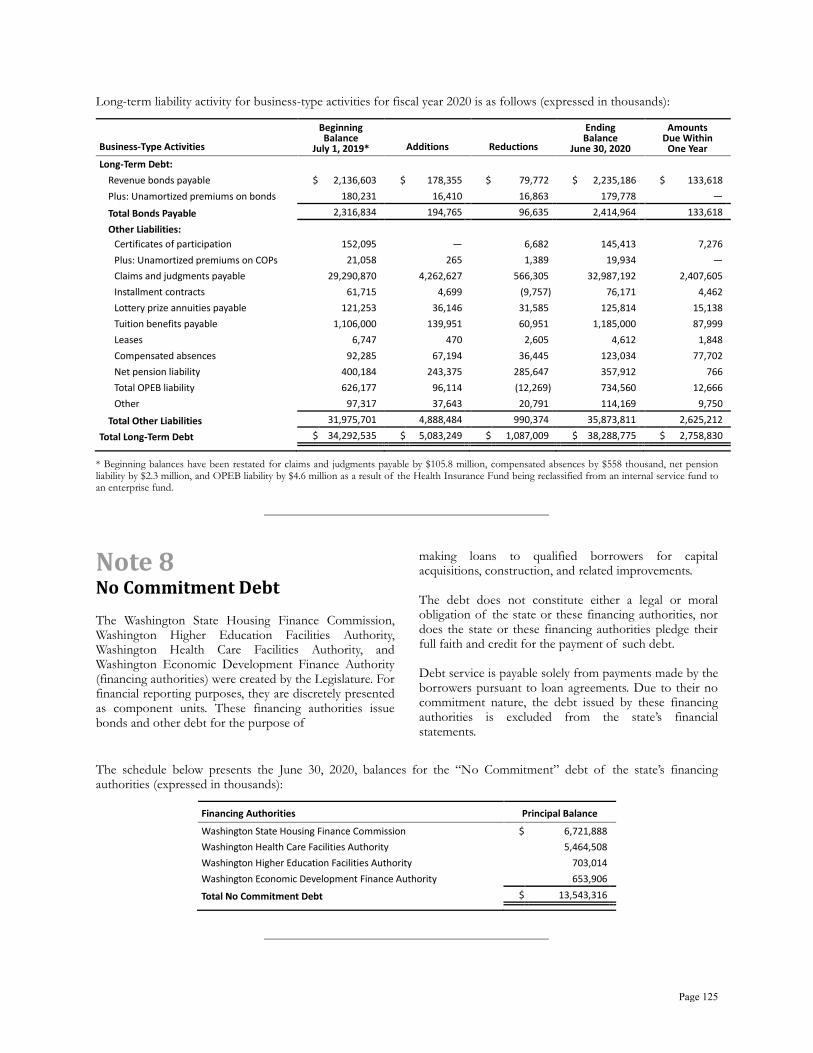
Long-term liability activity for business-type activities for fiscal year 2020 is as follows (expressed in thousands):
Business-Type Activities
Beginning Balance
July 1, 2019* Additions Reductions
Ending Balance
June 30, 2020
Amounts Due Within
One Year Long-Term Debt:
Revenue bonds payable $ 2,136,603 $ 178,355 $ 79,772 $ 2,235,186 $ 133,618 Plus: Unamortized premiums on bonds sold
180,231 16,410 16,863 179,778 — Total Bonds Payable 2,316,834 194,765 96,635 2,414,964 133,618 Other Liabilities:
Certificates of participation 152,095 — 6,682 145,413 7,276 Plus: Unamortized premiums on COPs sold
21,058 265 1,389 19,934 — Claims and judgments payable 29,290,870 4,262,627 566,305 32,987,192 2,407,605 Installment contracts 61,715 4,699 (9,757) 76,171 4,462 Lottery prize annuities payable 121,253 36,146 31,585 125,814 15,138 Tuition benefits payable 1,106,000 139,951 60,951 1,185,000 87,999 Leases 6,747 470 2,605 4,612 1,848 Compensated absences 92,285 67,194 36,445 123,034 77,702 Net pension liability 400,184 243,375 285,647 357,912 766 Total OPEB liability 626,177 96,114 (12,269) 734,560 12,666 Other 97,317 37,643 20,791 114,169 9,750
Total Other Liabilities 31,975,701 4,888,484 990,374 35,873,811 2,625,212 Total Long-Term Debt $ 34,292,535 $ 5,083,249 $ 1,087,009 $ 38,288,775 $ 2,758,830 * Beginning balances have been restated for claims and judgments payable by $105.8 million, compensated absences by $558 thousand, net pension liability by $2.3 million, and OPEB liability by $4.6 million as a result of the Health Insurance Fund being reclassified from an internal service fund to an enterprise fund.
Note 8 No Commitment Debt The Washington State Housing Finance Commission, Washington Higher Education Facilities Authority, Washington Health Care Facilities Authority, and Washington Economic Development Finance Authority (financing authorities) were created by the Legislature. For financial reporting purposes, they are discretely presented as component units. These financing authorities issue bonds and other debt for the purpose of
making loans to qualified borrowers for capital acquisitions, construction, and related improvements. The debt does not constitute either a legal or moral obligation of the state or these financing authorities, nor does the state or these financing authorities pledge their full faith and credit for the payment of such debt. Debt service is payable solely from payments made by the borrowers pursuant to loan agreements. Due to their no commitment nature, the debt issued by these financing authorities is excluded from the state’s financial statements.
The schedule below presents the June 30, 2020, balances for the “No Commitment” debt of the state’s financing authorities (expressed in thousands):
Financing Authorities Principal Balance Washington State Housing Finance Commission $ 6,721,888 Washington Health Care Facilities Authority 5,464,508 Washington Higher Education Facilities Authority 703,014 Washington Economic Development Finance Authority 653,906 Total No Commitment Debt $ 13,543,316
Page 125

Note 9 Governmental Fund Balances
A. GOVERNMENTAL FUNDS
The state’s governmental fund balances are reported according to the relative constraints that control how amounts can
be spent. Classifications include nonspendable, restricted, committed, and assigned, which are further described in Note
1.D.9.
A summary of governmental fund balances at June 30, 2020, is as follows (expressed in thousands):
Fund Balances General Higher Education Special Revenue
Higher Education
Endowment
Nonmajor Governmental
Funds Total Nonspendable:
Permanent funds $ — $ — $ 2,885,769 $ 228,242 $ 3,114,011 Consumable inventories and prepaids 17,382 33,031 — 48,843 99,256 Other receivables – long-term 35,025 — — — 35,025
Total Nonspendable Fund Balance $ 52,407 $ 33,031 $ 2,885,769 $ 277,085 $ 3,248,292 Restricted for: *
Higher education $ — $ 76,128 $ 1,541,897 $ — $ 1,618,025 Education — — 6,226 57,121 63,347 Transportation — — — 729,622 729,622 Other purposes — — — 3,646 3,646 Human services — — — 629,173 629,173 Wildlife and natural resources 3,097 — 1 1,186,244 1,189,342 Local grants and loans 46,959 — — 111 47,070 School construction 1,163 — — 102,992 104,155 State facilities — — — 62,877 62,877 Budget stabilization 1,682,883 — — — 1,682,883 Debt service — — — 52,457 52,457 Pollution remediation — — — 59,982 59,982 Operations and maintenance — — — 11,856 11,856 Repair and replacement — — — 21,684 21,684 Revenue stabilization — — — 17,805 17,805 Deferred sales tax — — — 4,500 4,500 Third tier debt service — — — 7,482 7,482 Fourth tier debt service — — — 1,985 1,985
Total Restricted Fund Balance $ 1,734,102 $ 76,128 $ 1,548,124 $ 2,949,537 $ 6,307,891 Committed for:
Higher education $ 191,982 $ 3,800,084 $ — $ 52,691 $ 4,044,757 Education 469 — — 5,193 5,662 Transportation — — — 308,631 308,631 Other purposes 291,273 — — 462,812 754,085 Human services 61,438 — — 910,981 972,419 Wildlife and natural resources 35,854 — — 548,111 583,965 Local grants and loans 17,756 — — 764,445 782,201 State facilities — — — 22,604 22,604 Debt service — — — 347,610 347,610
Total Committed Fund Balance $ 598,772 $ 3,800,084 $ — $ 3,423,078 $ 7,821,934 Assigned for:
Working capital $ 1,740,952 $ 92,631 $ — $ — $ 1,833,583 Total Assigned Fund Balance $ 1,740,952 $ 92,631 $ — $ — $ 1,833,583
*Net position restricted as a result of enabling legislation totaled $10.1 million.
Page 126

B. BUDGET STABILIZATION ACCOUNT
In accordance with Article 7, Section 12 of the Washington state Constitution, the state maintains the Budget Stabilization Account (“Rainy Day Fund”). The Budget Stabilization Account is reported in the General Fund. By June 30 of each fiscal year, an amount equal to 1 percent of the general state revenues for that fiscal year is transferred to the Budget Stabilization Account. The Budget Stabilization Account balance can only be used as follows: (a) if the Governor declares a state of emergency resulting from a catastrophic event that necessitates government action to protect life or public safety, then for that fiscal year money may be withdrawn and appropriated from the Budget Stabilization Account, via separate legislation setting forth the nature of the emergency and containing an appropriation limited to the above-authorized purposes as contained in the declaration, by a favorable vote of a majority of the members elected to each house of the Legislature; (b) if the employment growth forecast for
any fiscal year is estimated to be less than 1 percent, then for that fiscal year money may be withdrawn and appropriated from the Budget Stabilization Account by the favorable vote of a majority of the members elected to each house of the Legislature; (c) any amount may be withdrawn and appropriated from the Budget Stabilization Account at any time by the favorable vote of at least three-fifths of the members of each house of the Legislature. When the balance in the Budget Stabilization Account, including investment earnings, equals more than 10 percent of the estimated general state revenues in that fiscal year, the Legislature by the favorable vote of a majority of the members elected to each house of the Legislature may withdraw and appropriate the balance to the extent that the balance exceeds 10 percent of the estimated general state revenues. These appropriations may be made solely for deposit to the Education Construction Fund. At June 30, 2020, the Budget Stabilization Account had restricted fund balance of $1.68 billion.
Note 10 Deficit Net Position Data Processing Revolving Fund The Data Processing Revolving Fund, an internal service fund, had a deficit net position of $55.2 million at June 30, 2020. The Data Processing Revolving Fund is primarily used to account for and report activities such as data processing and communication services to other state agencies.
The Data Processing Revolving Fund is supported by user charges. Due to budgetary considerations, user rates are designed to cover cash outflows including debt service as opposed to the full cost of services which includes depreciation. Since the Data Processing Revolving Fund reports a debt-financed building, this funding approach has an impact on net position. Debt service allocates principal retirement on a straight-line basis. Depreciation on the fund’s building is componentized, which accelerates expense in the early years of the building’s life. As a result, the fund reports both an operating loss and a negative net investment in capital assets.
The following schedule details the change in net position for the Data Processing Revolving Fund during the fiscal year ended June 30, 2020 (expressed in thousands):
Data Processing Revolving Fund Net Position
Balance, July 1, 2019 $ (74,630) Fiscal year 2020 activity 19,475 Balance, June 30, 2020 $ (55,155)
Risk Management Fund The Risk Management Fund, an internal service fund, had a deficit net position of $1.38 billion at June 30, 2020. The Risk Management Fund is used to administer
the Self-Insurance Liability Program (SILP). The SILP was initiated in 1990 and is intended to provide funds for the payment of all tort claims and defense expenses. The program investigates, processes, and adjudicates tort and
Page 127
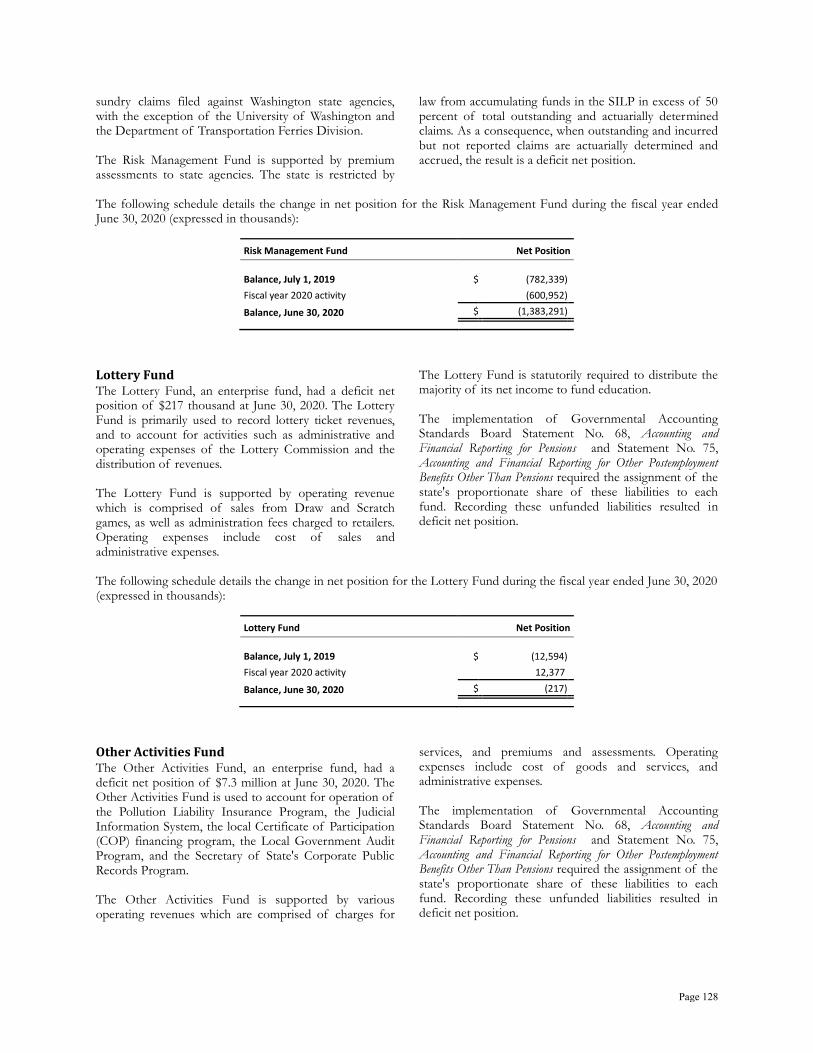
sundry claims filed against Washington state agencies, with the exception of the University of Washington and the Department of Transportation Ferries Division. The Risk Management Fund is supported by premium assessments to state agencies. The state is restricted by
law from accumulating funds in the SILP in excess of 50 percent of total outstanding and actuarially determined claims. As a consequence, when outstanding and incurred but not reported claims are actuarially determined and accrued, the result is a deficit net position.
The following schedule details the change in net position for the Risk Management Fund during the fiscal year ended June 30, 2020 (expressed in thousands):
Risk Management Fund Net Position
Balance, July 1, 2019 $ (782,339) Fiscal year 2020 activity (600,952) Balance, June 30, 2020 $ (1,383,291)
Lottery Fund The Lottery Fund, an enterprise fund, had a deficit net position of $217 thousand at June 30, 2020. The Lottery Fund is primarily used to record lottery ticket revenues, and to account for activities such as administrative and operating expenses of the Lottery Commission and the distribution of revenues. The Lottery Fund is supported by operating revenue which is comprised of sales from Draw and Scratch games, as well as administration fees charged to retailers. Operating expenses include cost of sales and administrative expenses.
The Lottery Fund is statutorily required to distribute the majority of its net income to fund education. The implementation of Governmental Accounting Standards Board Statement No. 68, Accounting and Financial Reporting for Pensions and Statement No. 75, Accounting and Financial Reporting for Other Postemployment Benefits Other Than Pensions required the assignment of the state's proportionate share of these liabilities to each fund. Recording these unfunded liabilities resulted in deficit net position.
The following schedule details the change in net position for the Lottery Fund during the fiscal year ended June 30, 2020 (expressed in thousands):
Lottery Fund Net Position
Balance, July 1, 2019 $ (12,594) Fiscal year 2020 activity 12,377 Balance, June 30, 2020 $ (217)
Other Activities Fund The Other Activities Fund, an enterprise fund, had a deficit net position of $7.3 million at June 30, 2020. The Other Activities Fund is used to account for operation of the Pollution Liability Insurance Program, the Judicial Information System, the local Certificate of Participation (COP) financing program, the Local Government Audit Program, and the Secretary of State's Corporate Public Records Program. The Other Activities Fund is supported by various operating revenues which are comprised of charges for
services, and premiums and assessments. Operating expenses include cost of goods and services, and administrative expenses. The implementation of Governmental Accounting Standards Board Statement No. 68, Accounting and Financial Reporting for Pensions and Statement No. 75, Accounting and Financial Reporting for Other Postemployment Benefits Other Than Pensions required the assignment of the state's proportionate share of these liabilities to each fund. Recording these unfunded liabilities resulted in deficit net position.
Page 128

The following schedule details the change in net position for the Other Activities Fund during the fiscal year ended June 30, 2020 (expressed in thousands):
Other Activities Fund Net Position
Balance, July 1, 2019 $ (3,647) Fiscal year 2020 activity (3,654) Balance, June 30, 2020 $ (7,301)
Note 11 Retirement Plans A. GENERAL
Washington’s pension plans were created by statutes rather than through trust documents. With the exception of the supplemental defined benefit component of the higher education retirement plan, they are administered in a way equivalent to pension trust arrangements as defined by the GASB.
In accordance with GASB Statement No. 68, the state has elected to use the prior fiscal year end as the measurement date for reporting net pension liabilities.
The state Legislature establishes and amends laws pertaining to the creation and administration of all state public retirement systems. Additionally, the state Legislature authorizes state agency participation in plans other than those administered by the state.
Basis of Accounting. Pension plans administered by the state are accounted for using the accrual basis of accounting. Under the accrual basis of accounting, employee and employer contributions are recognized in the period in which employee services are performed; investment gains and losses are recognized as incurred; and benefits and refunds are recognized when due and payable in accordance with the terms of the applicable plan. For purposes of measuring the net pension liability, deferred outflows of resources and deferred inflows of resources related to pensions, pension expense, information about the fiduciary net position of all plans, and additions to/deductions from all plan fiduciary net position have been determined in all material respects on the same basis as they are reported by the plans.
The following table represents the aggregate pension amounts for all plans for the state as an employer, for fiscal year 2020 (expressed in thousands):
Aggregate Pension Amounts - All Plans Pension liabilities $ 3,338,862 Pension assets $ (2,666,672) Deferred outflows of resources on pensions $ 1,554,890
Deferred inflows of resources on pensions $ 1,849,041
Pension expense/expenditures $ 164,717
Investments. The Washington State Investment Board (WSIB) has been authorized by statute as having investment management responsibility for the pension funds. The WSIB manages retirement fund assets to maximize return at a prudent level of risk.
Retirement funds are invested in the Commingled Trust Fund (CTF). Established on July 1, 1992, the CTF is a diversified pool of investments that invests in fixed income, public equity, private equity, real estate, and tangible assets. Investment decisions are made within the framework of a Strategic Asset Allocation Policy and a series of written WSIB-adopted investment policies for the various asset classes. Further information about the investment of pension funds by the WSIB, their valuation, classifications, concentrations, and maturities can be found in Note 3.B. Department of Retirement Systems. As established in chapter 41.50 of the Revised Code of Washington (RCW), the Department of Retirement Systems (DRS) administers eight retirement systems covering eligible employees of the state and local governments. The Governor appoints the director of the DRS. The DRS administered systems are comprised of 12 defined benefit pension plans and 3 defined benefit/defined contribution plans as follows: • Public Employees’ Retirement System (PERS)
Plan 1 - defined benefit Plan 2 - defined benefit Plan 3 - defined benefit/defined contribution
Page 129
• Teachers’ Retirement System (TRS) Plan 1 - defined benefit Plan 2 - defined benefit Plan 3 - defined benefit/defined contribution
• School Employees’ Retirement System (SERS) Plan 2 - defined benefit Plan 3 - defined benefit/defined contribution
• Law Enforcement Officers’ and Fire Fighters’
Retirement System (LEOFF) Plan 1 - defined benefit Plan 2 - defined benefit
• Public Safety Employees’ Retirement System
(PSERS) Plan 2 - defined benefit
• Washington State Patrol Retirement System
(WSPRS) Plan 1 - defined benefit Plan 2 - defined benefit
• Judicial Retirement System (JRS) Defined benefit plan
• Judges’ Retirement Fund (JRF) Defined benefit plan
Although some assets of the plans are commingled for investment purposes, each plan’s assets may be used only for the payment of benefits to the members of that plan in accordance with the terms of the plan. Administration of the PERS, TRS, SERS, LEOFF, PSERS, and WSPRS systems and plans is funded by an employer rate of 0.18 percent of employee salaries. Administration of the JRS and JRF plans is funded by means of legislative appropriations. Pursuant to RCW 41.50.770, the state offers its employees and employees of political subdivisions that elect to participate a deferred compensation program in
accordance with Internal Revenue Code Section 457. The deferred compensation is not available to employees until termination, retirement, disability, death, or unforeseeable financial emergency. This deferred compensation plan is administered by the DRS. The DRS prepares a stand-alone financial report that is compliant with the requirements of GASB Statement No. 67. Copies of the report may be obtained by contacting the Washington State Department of Retirement Systems, PO Box 48380, Olympia, WA 98504-8380 or online at http://www.drs.wa.gov/administration/annual-report. State Board for Volunteer Fire Fighters and Reserve Officers. As established in chapter 41.24 RCW, the State Board for Volunteer Fire Fighters and Reserve Officers administers the Volunteer Fire Fighters’ and Reserve Officers’ Relief and Pension Fund (VFFRPF), a defined benefit plan. Administration of the VFFRPF is funded through legislative appropriation. Administrative Office of the Courts. As established in chapter 2.14 RCW, the Administrative Office of the Courts administers the Judicial Retirement Account (JRA), a defined contribution plan. Administration of JRA is funded through member fees. Higher Education. As established in chapter 28B.10 RCW, eligible higher education state employees may participate in higher education retirement plans. These plans include a defined contribution plan administered by a third party with a supplemental defined benefit component (funded on a pay-as-you-go basis) which is administered by the state. The state has elected to use the current fiscal year end as the measurement date for reporting net pension liabilities for the Higher Education Supplemental Retirement Plan.
B. STATE PARTICIPATION IN PLANS ADMINISTERED BY DRS
1. DRS Plans - Employer Disclosures
The state is not an employer in SERS Plan 2/3 nor
LEOFF Plan 1.
Plan Descriptions Public Employees' Retirement System. The Legislature established the Public Employees’ Retirement System (PERS) in 1947. PERS retirement
benefit provisions are established in chapters 41.34 and 41.40 RCW and may be amended only by the Legislature. Membership in the system includes: elected officials; state employees; employees of the Supreme Court, Court of Appeals, and Superior Courts (other than judges currently in a judicial retirement system); employees of legislative committees; community and technical colleges, college, and university employees not in national higher education retirement programs; judges of district and municipal courts; and employees of local governments. PERS is a cost-sharing, multiple-employer retirement system comprised of three separate plans for membership purposes: Plans 1 and 2 are defined benefit plans and Plan 3 is a combination defined
Page 130
benefit/defined contribution plan. Although members can only be a member of either Plan 2 or Plan 3, the defined benefit portions of Plan 2 and Plan 3 are accounted for in the same pension trust fund. All assets of this Plan 2/3 defined benefit plan may legally be used to pay the defined benefits of any of the Plan 2 or Plan 3 members or beneficiaries, as defined by the terms of the plan. Therefore, Plan 2/3 is considered a single defined benefit plan for reporting purposes. Plan 3 accounts for the defined contribution portion of benefits for Plan 3 members. PERS members who joined the system by September 30, 1977, are Plan 1 members. Plan 1 is closed to new entrants. Those who joined on or after October 1, 1977, and by February 28, 2002, for state and higher education employees, or August 31, 2002, for local government employees, are Plan 2 members unless they exercised an option to transfer their membership to PERS Plan 3. PERS participants joining the system on or after March 1, 2002, for state and higher education employees, or September 1, 2002, for local government employees, have the irrevocable option of choosing membership in either PERS Plan 2 or PERS Plan 3. The option must be exercised within 90 days of employment. Employees who fail to choose within 90 days default to PERS Plan 3. Refer to Note 11.E for a description of the defined contribution component of PERS Plan 3. Teachers' Retirement System. The Legislature established the Teachers’ Retirement System (TRS) in 1938. TRS retirement benefit provisions are established in chapters 41.32 and 41.34 RCW and may be amended only by the Legislature. Eligibility for membership requires service as a certificated public school employee working in an instructional, administrative, or supervisory capacity. TRS is comprised principally of non-state agency employees. TRS is a cost-sharing, multiple-employer retirement system comprised of three separate plans for membership purposes: Plans 1 and 2 are defined benefit plans and Plan 3 is a defined benefit plan with a defined contribution component. Although members can only be a member of either Plan 2 or Plan 3, the defined benefit portions of Plan 2 and Plan 3 are accounted for in the same pension trust fund. All assets of this Plan 2/3 defined benefit plan may legally be used to pay the defined benefits of any of the Plan 2 or Plan 3 members or beneficiaries, as defined by the terms of the plan. Therefore, Plan 2/3 is considered a single defined benefit plan for reporting purposes. Plan 3 accounts for the defined contribution portion of benefits for Plan 3 members.
TRS members who joined the system by September 30, 1977, are Plan 1 members. Plan 1 is closed to new entrants. Those who joined on or after October 1, 1977, and by June 30, 1996, are Plan 2 members unless they exercised an option to transfer their membership to Plan 3. TRS members joining the system on or after July 1, 1996, are members of TRS Plan 3. Legislation passed in 2007 gives TRS members hired on or after July 1, 2007, 90 days to make an irrevocable choice to become a member of TRS Plan 2 or Plan 3. At the end of 90 days, any member who has not made a choice becomes a member of Plan 3. Refer to Note 11.E for a description of the defined contribution component of TRS Plan 3. Law Enforcement Officers' and Fire Fighters'. The Law Enforcement Officers’ and Fire Fighters’ Retirement System (LEOFF) was established in 1970 by the Legislature. LEOFF retirement benefit provisions are established in chapter 41.26 RCW and may be amended only by the Legislature. Membership includes all full-time, fully compensated, local law enforcement commissioned officers, fire fighters, and as of July 24, 2005, emergency medical technicians. LEOFF membership is comprised primarily of non-state employees, with Department of Fish and Wildlife enforcement officers who were first included effective July 27, 2003, being an exception. LEOFF is a cost-sharing, multiple-employer retirement system comprised of two separate defined benefit plans. LEOFF members who joined the system by September 30, 1977, are Plan 1 members. Plan 1 is closed to new entrants. Those who joined on or after October 1, 1977, are Plan 2 members. Effective July 1, 2003, the LEOFF Plan 2 Retirement Board was established by Initiative 790 to provide governance of LEOFF Plan 2. The Board’s duties include adopting contribution rates and recommending policy changes to the Legislature. Public Safety Employees' Retirement System. The Public Safety Employees’ Retirement System (PSERS) was created by the 2004 Legislature and became effective July 1, 2006. PSERS retirement benefit provisions are established in chapter 41.37 RCW and may be amended only by the Legislature. PSERS membership includes full-time employees meeting specific eligibility criteria that are employed by Department of Corrections; Department of Natural Resources; Gambling Commission; Liquor and Cannabis Board; Parks and Recreation Commission; Washington State Patrol; Washington state counties; corrections departments of Washington state cities except for Seattle, Tacoma, and Spokane; or
Page 131
correctional entities formed by PSERS employers under the Interlocal Cooperation Act. PSERS is a cost-sharing, multiple-employer retirement system comprised of a single defined benefit plan, PSERS Plan 2. Washington State Patrol Retirement System. The Washington State Patrol Retirement System (WSPRS) was established by the Legislature in 1947. WSPRS benefits are established in chapter 43.43 RCW and may be amended only by the Legislature. Any commissioned employee of the Washington State Patrol is eligible to participate. WSPRS is a single-employer, defined benefit retirement system. WSPRS members who joined the system by December 31, 2002, are Plan 1 members. Plan 1 is closed to new entrants. Those who joined on or after January 1, 2003, are Plan 2 members. For financial reporting and investment purposes, however, both plans are accounted for in the same pension fund. Effective June 7, 2012, those WSPRS members who have service credit within PERS Plan 2 have options to transfer their service credit earned as commercial vehicle enforcement officers or as communications officers into the WSPRS, provided the member pays the full actuarial cost of the transfer. At retirement, these members also have the option of selecting an actuarially reduced benefit in order to provide for post-retirement survivor benefits. For membership information refer to the table presented in Note 11.B.3. Judicial Retirement System. The Judicial Retirement System (JRS) was established by the Legislature in 1971. The JRS retirement benefit provisions are established in chapter 2.10 RCW and may be amended only by the Legislature. Membership includes judges elected or appointed to the Supreme Court, Court of Appeals, and Superior Courts on or after August 9, 1971. The JRS is a single-employer, defined benefit retirement system. There are no active members remaining in the Judicial Retirement System. For membership information refer to the table presented in Note 11.B.3. Judges' Retirement Fund. The Judges’ Retirement Fund (JRF) was created by the Legislature on March 22, 1937, to provide retirement benefits to judges elected or appointed to the Supreme Court, Court of Appeals, and Superior Courts of the state of Washington. Judges’ retirement benefit provisions are
established in chapter 2.12 RCW and may be amended only by the Legislature. The JRF is a single-employer, defined benefit retirement system. There are currently no active members in this plan. For membership information refer to the table presented in Note 11.B.3.
Benefits Provided PERS. PERS plans provide retirement, disability, and death benefits to eligible members. PERS Plan 1 members are vested after the completion of five years of eligible service. Plan 1 members are eligible for retirement after 30 years of service, or at the age of 60 with five years of service, or at the age of 55 with 25 years of service. The monthly benefit is 2 percent of the average final compensation (AFC) per year of service, capped at 60 percent. The AFC is the average of the member’s 24 highest consecutive service months. PERS Plan 1 members retiring from inactive status prior to the age of 65 may receive actuarially reduced benefits. Plan 1 members may elect to receive an optional cost of living allowance (COLA) that provides an automatic annual adjustment based on the Consumer Price Index. The adjustment is capped at 3 percent annually. To offset the cost of this annual adjustment, the benefit is reduced. PERS Plan 2 members are vested after completing five years of eligible service. Plan 2 members are eligible for normal retirement at the age of 65 with five years of service. The monthly benefit is 2 percent of the AFC per year of service. There is no cap on years of service credit and a COLA is granted based on the Consumer Price Index, capped at 3 percent annually. The AFC is the average of the member’s 60 highest paid consecutive months. PERS Plan 2 members have the option to retire early with reduced benefits. PERS Plan 3 members are vested in the defined benefit portion of their plan after 10 years of service; or after five years of service, if 12 months of that service are earned after age 44. The defined benefit portion of PERS Plan 3 provides members a monthly benefit that is 1 percent of the AFC per year of service. There is no cap on years of service credit. Plan 3 provides the same COLA as Plan 2. The AFC is the average of the member’s 60 highest paid consecutive months. PERS Plan 3 members have the option to retire early with reduced benefits.
Page 132

PERS members meeting specific eligibility requirements have options available to enhance their retirement benefits. Some of these options are available to their survivors, with reduced benefits. TRS. TRS plans provide retirement, disability, and death benefits to eligible members. TRS Plan 1 members are vested after the completion of five years of eligible service. Plan 1 members are eligible for retirement at any age after 30 years of service, or at the age of 60 with five years of service, or at the age of 55 with 25 years of service. The monthly benefit is 2 percent of the average final compensation (AFC) for each year of service credit, up to a maximum of 60 percent. The AFC is the total earnable compensation for the two consecutive highest-paid fiscal years, divided by two. TRS Plan 1 members may elect to receive an optional cost of living allowance (COLA) amount based on the Consumer Price Index, capped at 3 percent annually. To offset the cost of this annual adjustment, the benefit is reduced. TRS Plan 2 members are vested after completing five years of eligible service. Plan 2 members are eligible for normal retirement at the age of 65 with five years of service. The monthly benefit is 2 percent of the AFC per year of service. A COLA is granted based on the Consumer Price Index, capped at 3 percent annually. The AFC is the average of the member’s 60 highest paid consecutive months. TRS Plan 2 members have the option to retire early with reduced benefits. TRS Plan 3 members are vested in the defined benefit portion of their plan after 10 years of service; or after five years of service, if 12 months of that service are earned after age 44. The defined benefit portion of TRS Plan 3 provides members a monthly benefit that is 1 percent of the AFC per year of service. Plan 3 provides the same COLA as Plan 2. The AFC is the average of the member’s 60 highest paid consecutive months. TRS Plan 3 members have the option to retire early with reduced benefits. TRS members meeting specific eligibility requirements have options available to enhance their retirement benefits. Some of these options are available to their survivors, with reduced benefits. PERS and TRS Judicial Benefit Multiplier: The Judicial Benefit Multiplier (JBM) Program gave eligible justices and judges an option to increase the benefit multiplier used in their retirement benefit calculation for their judicial service periods of employment. Beginning January 1, 2007, any justice or judge who was in a judicial position at that time could choose to join JBM. Any justice or judge elected or appointed to
office on or after January 1, 2007, who elects to join DRS membership will also be mandated into JBM. If they have already established membership in PERS Plan 1 or TRS Plan 1 they will rejoin that plan, but if they have never had membership they will be enrolled as a member of both PERS Plan 2 and JBM. LEOFF. LEOFF plans provide retirement, disability, and death benefits to eligible members. LEOFF Plan 1 members are vested after the completion of five years of eligible service. Plan 1 members are eligible for retirement with five years of service at the age of 50. The benefit per year of service calculated as a percent of final average salary (FAS) is as follows:
Years of Service Percent of FAS 20+ 2.0%
10-19 1.5% 5-9 1.0%
A cost of living allowance (COLA) is granted based on the Consumer Price Index. LEOFF Plan 2 members are vested after the completion of five years of eligible service. Plan 2 members are eligible for retirement at the age of 53 with five years of service, or at age 50 with 20 years of service. Plan 2 members receive a benefit of 2 percent of the FAS per year of service. FAS is based on the highest consecutive 60 months. A COLA is granted based on the Consumer Price Index, capped at 3 percent annually. LEOFF members have the option to retire early with reduced benefits. LEOFF members meeting specific eligibility requirements have options available to enhance their retirement benefits. Some of these options are available to their survivors, generally with reduced benefits. PSERS. PSERS provides retirement, disability, and death benefits to eligible members. PSERS members are vested after an employee completes five years of eligible service. PSERS members may retire with a monthly benefit of 2 percent of the average final compensation (AFC) at the age of 65 with five years of service, or at the age of 60 with at least 10 years of PSERS service, or at age 53 with 20 years of service. A cost of living allowance is granted based on the Consumer Price Index, capped at 3 percent annually. The AFC is the average of the member’s 60 highest paid consecutive months. PSERS members have the option to retire early with reduced benefits.
Page 133
PSERS members meeting specific eligibility requirements have options available to enhance their retirement benefits. Some of these options are available to their survivors, generally with reduced benefits. WSPRS. WSPRS plans provide retirement, disability, and death benefits to eligible members. WSPRS members are vested after the completion of five years of eligible service. Active members are eligible for retirement at the age of 55 with no minimum required service credit, or at any age with 25 years of service credit, and must retire at age 65. This mandatory requirement does not apply to the Chief of the Washington State Patrol. Inactive members can retire at age 60 or at age 55 with a reduced benefit to account for the receipt of benefits over a longer period of time. The monthly benefit is 2 percent of the average final salary (AFS) per year of service, capped at 75 percent. A cost of living allowance is granted based on the Consumer Price Index, capped at 3 percent annually. WSPRS members meeting specific eligibility requirements have options available to enhance their retirement benefits. Some of these options are available to their survivors, generally with reduced benefits. . JRS. The JRS provides retirement, disability, and death benefits to eligible members. JRS members are eligible for retirement at the age of 60 with 15 years of service; or are age 60 or older, left office involuntarily with 12 years of service credit, and at least 15 years have passed since the beginning of the initial term. The system was closed to new entrants on July 1, 1988, with new judges joining PERS. The benefit per year of service calculated as a percent of final average salary (FAS) is shown in the table below. This benefit is capped at 75 percent of FAS, exclusive of cost-of-living increases.
Years of Service Percent of FAS 15+ 3.50%
10-14 3.00% JRF. The JRF provides disability and retirement benefits to eligible members. The system was closed to new entrants on August 8, 1971, with new judges joining the JRS. Members are eligible to receive a full retirement allowance at age 70 with 10 years of credited service, or at any age with 18 years of credited service. Members are eligible to receive a partial retirement allowance after 12 years of credited service as a judge.
Contributions PERS, TRS, PSERS, WSPRS: Defined benefit retirement benefits are financed from a combination of investment earnings and employer and/or employee contributions. PERS Plan 1 and TRS Plan 1 member contribution rates are established in statute. PERS Plan 2/3 and TRS Plans 2/3 employer and employee contribution rates are developed by the Office of the State Actuary (OSA) to fully fund Plan 2 and the defined benefit portion of Plan 3. PSERS Plans 2 and WSPRS Plan 1/2 employer and employee contribution rates are also developed by the OSA to fully fund the plans. Each biennium, the state Pension Funding Council adopts employer contribution rates for PERS Plan 1 and 3 and for TRS Plan 1 and 3; employee and employer contribution rates for PERS Plan 2, TRS Plan 2, and PSERS Plan 2; employee and state contribution rates for WSPRS Plans 1 and 2. The methods used to determine contribution requirements are established under statute and are subject to change by the Legislature. PERS and TRS JBM members and employers pay increased contributions that, along with investment earnings, fund the increased retirement benefits of those justices and judges who participate in the program. Members can elect to withdraw total employee contributions and interest thereon, in lieu of any retirement benefit, upon separation from covered employment. Required contribution rates for fiscal year 2020 are presented in the table in Note 11.B.3. LEOFF: LEOFF retirement benefits are financed from a combination of investment earnings, employer and employee contributions, and a special funding situation in which the state pays through legislative appropriations. Employer and employee contribution rates are developed by the Office of the State Actuary (OSA) to fully fund the plans. Starting on July 1, 2000, LEOFF Plan 1 employers and employees are not required to contribute as long as the plan remains fully funded. LEOFF Plan 2 employers and employees are required to pay at the level adopted by the LEOFF Plan 2 Retirement Board. The methods used to determine contribution requirements are established under state statute.
Page 134
Members in LEOFF Plan 1 and Plan 2 can elect to withdraw total employee contributions and interest thereon, in lieu of any retirement benefit, upon separation from LEOFF-covered employment. The Legislature, by means of a special funding arrangement, appropriates money from the state General Fund to supplement the current service liability and fund the prior service costs of LEOFF Plan 2 in accordance with the recommendations of the Pension Funding Council and the LEOFF Plan 2 Retirement Board. For fiscal year 2020, the state contributed 76.3 million to LEOFF Plan 2. Required contribution rates for fiscal year 2020 are presented in the table in Note 11.B.3. The state is not an employer for LEOFF Plan 1; however, the state is a nonemployer contributing entity for LEOFF Plan 1. For LEOFF Plan 2, the state is both an employer and a nonemployer contributing entity. Refer to Note 11.B.2 for nonemployer contributing entity disclosures. JRS and JRF: The JRF and JRS have no active members; therefore, no employer or employee contributions were required. The state guarantees the solvency of the JRF and JRS on a pay-as-you-go basis from a combination of investment earnings and funding from the state. Past contributions were made based on rates set in statute. By statute, JRF employees were required to contribute 6.5 percent of covered payroll with an equal amount contributed by the state. JRS employees were required to contribute 7.5 percent of covered payroll with an equal amount contributed by the state. Each biennium, the Legislature, through appropriations from the state General Fund, contributes amounts sufficient to meet the benefit payment requirements. For fiscal year 2019 the state contributed $400 thousand for JRF and $7.8 million for JRS . Actuarial Assumptions PERS, TRS, LEOFF, PSERS, and WSPRS: The total pension liability was determined by an actuarial valuation as of June 30, 2018, with the results rolled forward to the June 30, 2019, measurement date using the following actuarial assumptions, applied to all periods included in the measurement:
Inflation 2.75 % Salary increases 3.50 % Investment rate of return 7.40 %
Mortality rates were based on the RP-2000 Combined Healthy Table and Combined Disabled Table published by the Society of Actuaries. The Office of the State Actuary (OSA) applied offsets to the base table and recognized future improvements in mortality by projecting the mortality rates using 100 percent Scale BB. Mortality rates are applied on a generational basis, meaning members are assumed to receive additional mortality improvements in each future year, throughout their lifetime. The actuarial assumptions used in the June 30, 2018, valuation were based on the results of the 2007-2012 Experience Study Report. Additional assumptions for subsequent events and law changes are current as of the 2018 actuarial valuation report. The long-term expected rate of return on pension plan investments was determined using a building-block method in which a best estimate of expected future rates of return (expected returns, net of pension plan investment expense, but including inflation) are developed for each major asset class by the WSIB. Those expected returns make up one component of the WSIB’s Capital Market Assumptions (CMAs). The CMAs contain the following three pieces of information for each class of assets the WSIB currently invests in:
• Expected annual return. • Standard deviation of the annual return. • Correlations between the annual returns of each
asset class with every other asset class. The WSIB uses the CMAs and their target asset allocation to simulate future investment returns over various time horizons. The OSA selected a 7.40 percent long-term expected rate of return on pension plan investments. In selecting this assumption, the OSA reviewed the historical experience data, considered the historical conditions that produced past annual investment returns, and considered CMAs and simulated expected investment returns provided by the WSIB. Refer to the 2017 Report on Financial Condition and Economic Experience Study on the OSA website for additional background on how this assumption was selected. Best estimates of arithmetic real rates of return for each major asset class included in the pension plan’s target asset allocation as of June 30, 2019, are summarized in the following table:
Page 135
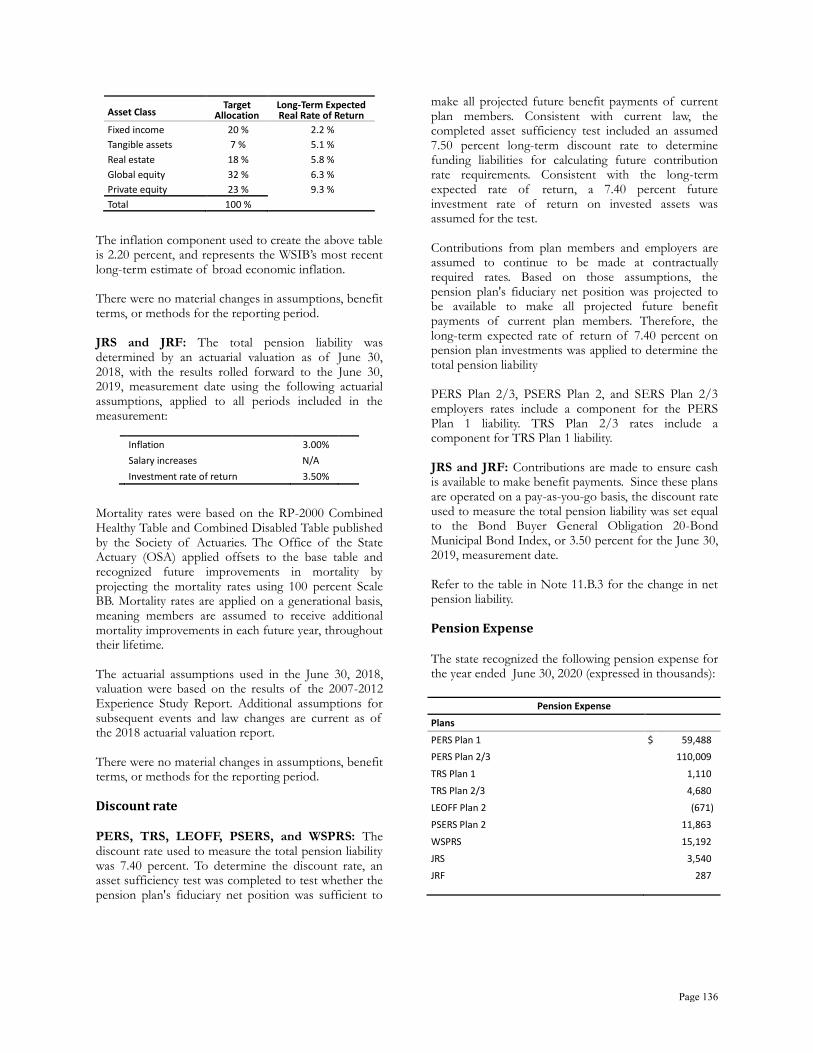
Asset Class Target Allocation
Long-Term Expected Real Rate of Return
Fixed income 20 % 2.2 % Tangible assets 7 % 5.1 % Real estate 18 % 5.8 % Global equity 32 % 6.3 % Private equity 23 % 9.3 % Total 100 %
The inflation component used to create the above table is 2.20 percent, and represents the WSIB’s most recent long-term estimate of broad economic inflation. There were no material changes in assumptions, benefit terms, or methods for the reporting period. JRS and JRF: The total pension liability was determined by an actuarial valuation as of June 30, 2018, with the results rolled forward to the June 30, 2019, measurement date using the following actuarial assumptions, applied to all periods included in the measurement:
Inflation 3.00% Salary increases N/A Investment rate of return 3.50%
Mortality rates were based on the RP-2000 Combined Healthy Table and Combined Disabled Table published by the Society of Actuaries. The Office of the State Actuary (OSA) applied offsets to the base table and recognized future improvements in mortality by projecting the mortality rates using 100 percent Scale BB. Mortality rates are applied on a generational basis, meaning members are assumed to receive additional mortality improvements in each future year, throughout their lifetime. The actuarial assumptions used in the June 30, 2018, valuation were based on the results of the 2007-2012 Experience Study Report. Additional assumptions for subsequent events and law changes are current as of the 2018 actuarial valuation report. There were no material changes in assumptions, benefit terms, or methods for the reporting period.
Discount rate PERS, TRS, LEOFF, PSERS, and WSPRS: The discount rate used to measure the total pension liability was 7.40 percent. To determine the discount rate, an asset sufficiency test was completed to test whether the pension plan's fiduciary net position was sufficient to
make all projected future benefit payments of current plan members. Consistent with current law, the completed asset sufficiency test included an assumed 7.50 percent long-term discount rate to determine funding liabilities for calculating future contribution rate requirements. Consistent with the long-term expected rate of return, a 7.40 percent future investment rate of return on invested assets was assumed for the test. Contributions from plan members and employers are assumed to continue to be made at contractually required rates. Based on those assumptions, the pension plan's fiduciary net position was projected to be available to make all projected future benefit payments of current plan members. Therefore, the long-term expected rate of return of 7.40 percent on pension plan investments was applied to determine the total pension liability PERS Plan 2/3, PSERS Plan 2, and SERS Plan 2/3 employers rates include a component for the PERS Plan 1 liability. TRS Plan 2/3 rates include a component for TRS Plan 1 liability. JRS and JRF: Contributions are made to ensure cash is available to make benefit payments. Since these plans are operated on a pay-as-you-go basis, the discount rate used to measure the total pension liability was set equal to the Bond Buyer General Obligation 20-Bond Municipal Bond Index, or 3.50 percent for the June 30, 2019, measurement date. Refer to the table in Note 11.B.3 for the change in net pension liability. Pension Expense The state recognized the following pension expense for the year ended June 30, 2020 (expressed in thousands):
Pension Expense Plans PERS Plan 1 $ 59,488 PERS Plan 2/3 110,009 TRS Plan 1 1,110 TRS Plan 2/3 4,680 LEOFF Plan 2 (671) PSERS Plan 2 11,863 WSPRS 15,192 JRS 3,540 JRF 287
Page 136
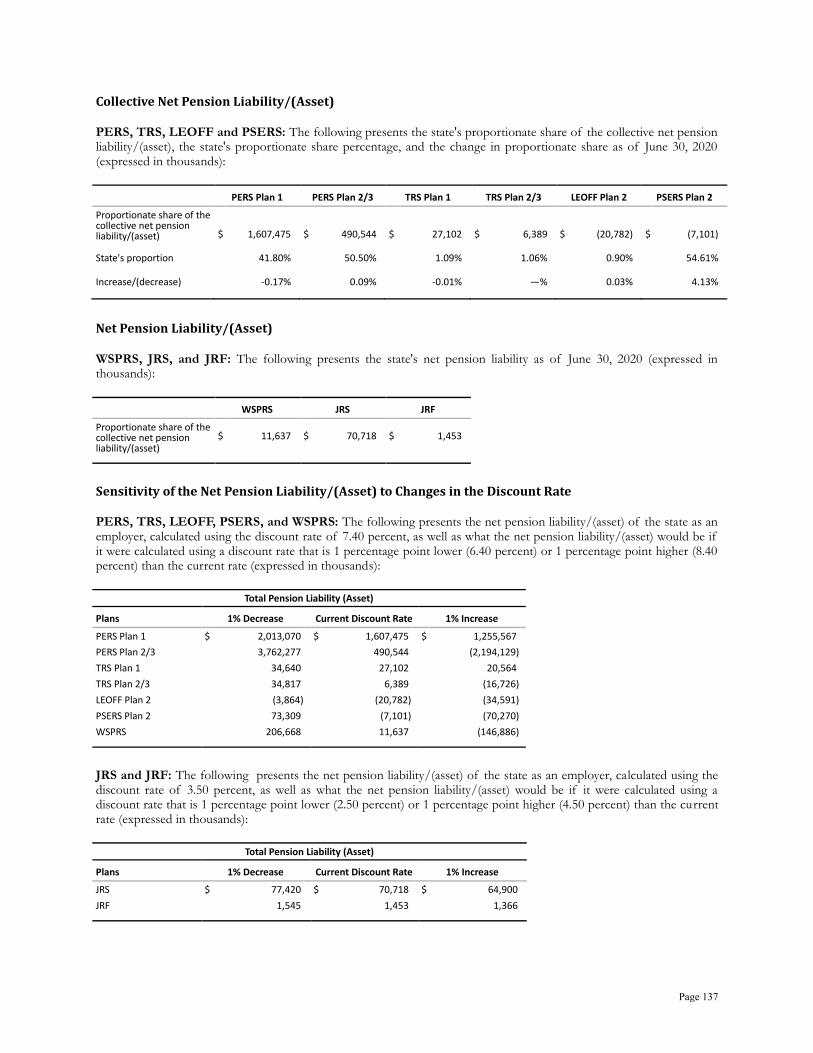
Collective Net Pension Liability/(Asset) PERS, TRS, LEOFF and PSERS: The following presents the state's proportionate share of the collective net pension liability/(asset), the state's proportionate share percentage, and the change in proportionate share as of June 30, 2020 (expressed in thousands):
PERS Plan 1 PERS Plan 2/3 TRS Plan 1 TRS Plan 2/3 LEOFF Plan 2 PSERS Plan 2 Proportionate share of the collective net pension liability/(asset) $ 1,607,475 $ 490,544 $ 27,102 $ 6,389 $ (20,782) $ (7,101) State's proportion 41.80% 50.50% 1.09% 1.06% 0.90% 54.61% Increase/(decrease) -0.17% 0.09% -0.01% —% 0.03% 4.13% Net Pension Liability/(Asset) WSPRS, JRS, and JRF: The following presents the state's net pension liability as of June 30, 2020 (expressed in thousands):
WSPRS JRS JRF Proportionate share of the collective net pension liability/(asset)
$ 11,637 $ 70,718 $ 1,453
Sensitivity of the Net Pension Liability/(Asset) to Changes in the Discount Rate PERS, TRS, LEOFF, PSERS, and WSPRS: The following presents the net pension liability/(asset) of the state as an employer, calculated using the discount rate of 7.40 percent, as well as what the net pension liability/(asset) would be if it were calculated using a discount rate that is 1 percentage point lower (6.40 percent) or 1 percentage point higher (8.40 percent) than the current rate (expressed in thousands):
Total Pension Liability (Asset)
Plans 1% Decrease Current Discount Rate 1% Increase PERS Plan 1 $ 2,013,070 $ 1,607,475 $ 1,255,567 PERS Plan 2/3 3,762,277 490,544 (2,194,129) TRS Plan 1 34,640 27,102 20,564 TRS Plan 2/3 34,817 6,389 (16,726) LEOFF Plan 2 (3,864) (20,782) (34,591) PSERS Plan 2 73,309 (7,101) (70,270) WSPRS 206,668 11,637 (146,886) JRS and JRF: The following presents the net pension liability/(asset) of the state as an employer, calculated using the discount rate of 3.50 percent, as well as what the net pension liability/(asset) would be if it were calculated using a discount rate that is 1 percentage point lower (2.50 percent) or 1 percentage point higher (4.50 percent) than the current rate (expressed in thousands):
Total Pension Liability (Asset)
Plans 1% Decrease Current Discount Rate 1% Increase JRS $ 77,420 $ 70,718 $ 64,900 JRF 1,545 1,453 1,366
Page 137
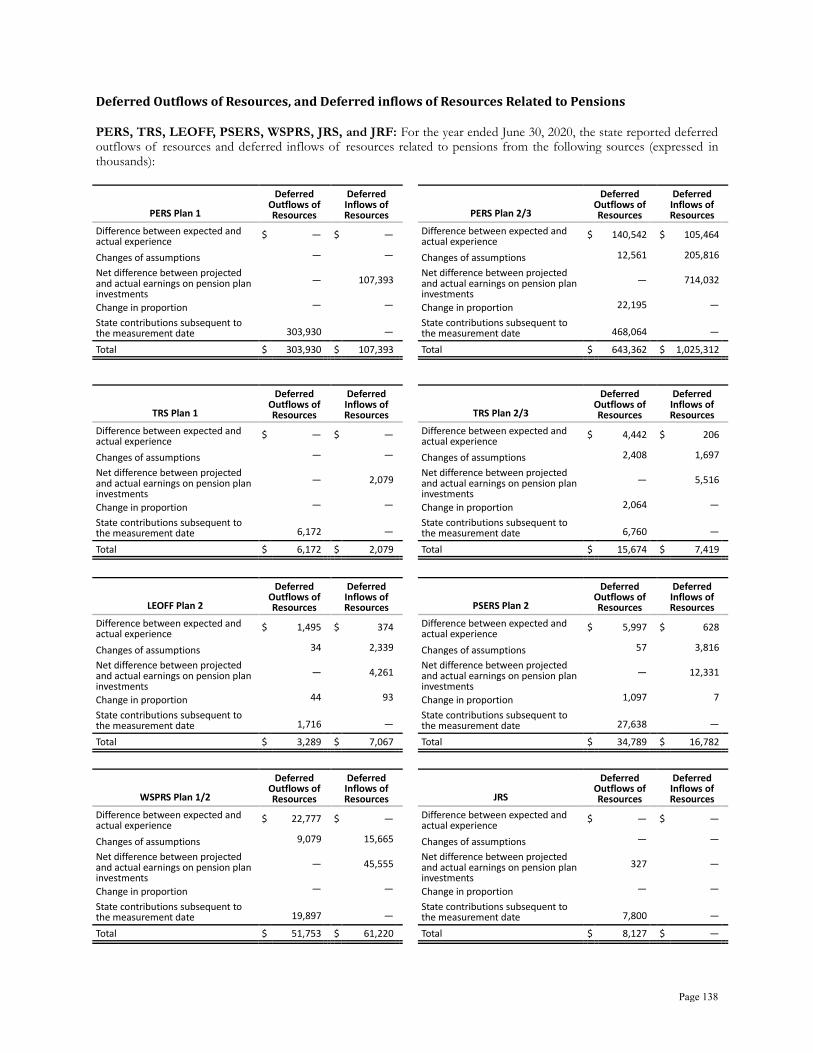
Deferred Outflows of Resources, and Deferred inflows of Resources Related to Pensions PERS, TRS, LEOFF, PSERS, WSPRS, JRS, and JRF: For the year ended June 30, 2020, the state reported deferred outflows of resources and deferred inflows of resources related to pensions from the following sources (expressed in thousands):
PERS Plan 1
Deferred Outflows of Resources
Deferred Inflows of Resources PERS Plan 2/3
Deferred Outflows of Resources
Deferred Inflows of Resources
Difference between expected and actual experience $ — $ —
Difference between expected and actual experience $ 140,542 $ 105,464
Changes of assumptions — — Changes of assumptions 12,561 205,816 Net difference between projected and actual earnings on pension plan investments
— 107,393
Net difference between projected and actual earnings on pension plan investments
— 714,032
Change in proportion — — Change in proportion 22,195 — State contributions subsequent to the measurement date 303,930 —
State contributions subsequent to the measurement date 468,064 —
Total $ 303,930 $ 107,393 Total $ 643,362 $ 1,025,312
TRS Plan 1
Deferred Outflows of Resources
Deferred Inflows of Resources TRS Plan 2/3
Deferred Outflows of Resources
Deferred Inflows of Resources
Difference between expected and actual experience $ — $ —
Difference between expected and actual experience $ 4,442 $ 206
Changes of assumptions — — Changes of assumptions 2,408 1,697 Net difference between projected and actual earnings on pension plan investments
— 2,079
Net difference between projected and actual earnings on pension plan investments
— 5,516
Change in proportion — — Change in proportion 2,064 — State contributions subsequent to the measurement date 6,172 —
State contributions subsequent to the measurement date 6,760 —
Total $ 6,172 $ 2,079 Total $ 15,674 $ 7,419
LEOFF Plan 2
Deferred Outflows of Resources
Deferred Inflows of Resources PSERS Plan 2
Deferred Outflows of Resources
Deferred Inflows of Resources
Difference between expected and actual experience $ 1,495 $ 374
Difference between expected and actual experience $ 5,997 $ 628
Changes of assumptions 34 2,339 Changes of assumptions 57 3,816 Net difference between projected and actual earnings on pension plan investments
— 4,261
Net difference between projected and actual earnings on pension plan investments
— 12,331
Change in proportion 44 93 Change in proportion 1,097 7 State contributions subsequent to the measurement date 1,716 —
State contributions subsequent to the measurement date 27,638 —
Total $ 3,289 $ 7,067 Total $ 34,789 $ 16,782
WSPRS Plan 1/2
Deferred Outflows of Resources
Deferred Inflows of Resources JRS
Deferred Outflows of Resources
Deferred Inflows of Resources
Difference between expected and actual experience $ 22,777 $ —
Difference between expected and actual experience $ — $ —
Changes of assumptions 9,079 15,665 Changes of assumptions — — Net difference between projected and actual earnings on pension plan investments
— 45,555
Net difference between projected and actual earnings on pension plan investments
327 —
Change in proportion — — Change in proportion — — State contributions subsequent to the measurement date 19,897 —
State contributions subsequent to the measurement date 7,800 —
Total $ 51,753 $ 61,220 Total $ 8,127 $ —
Page 138
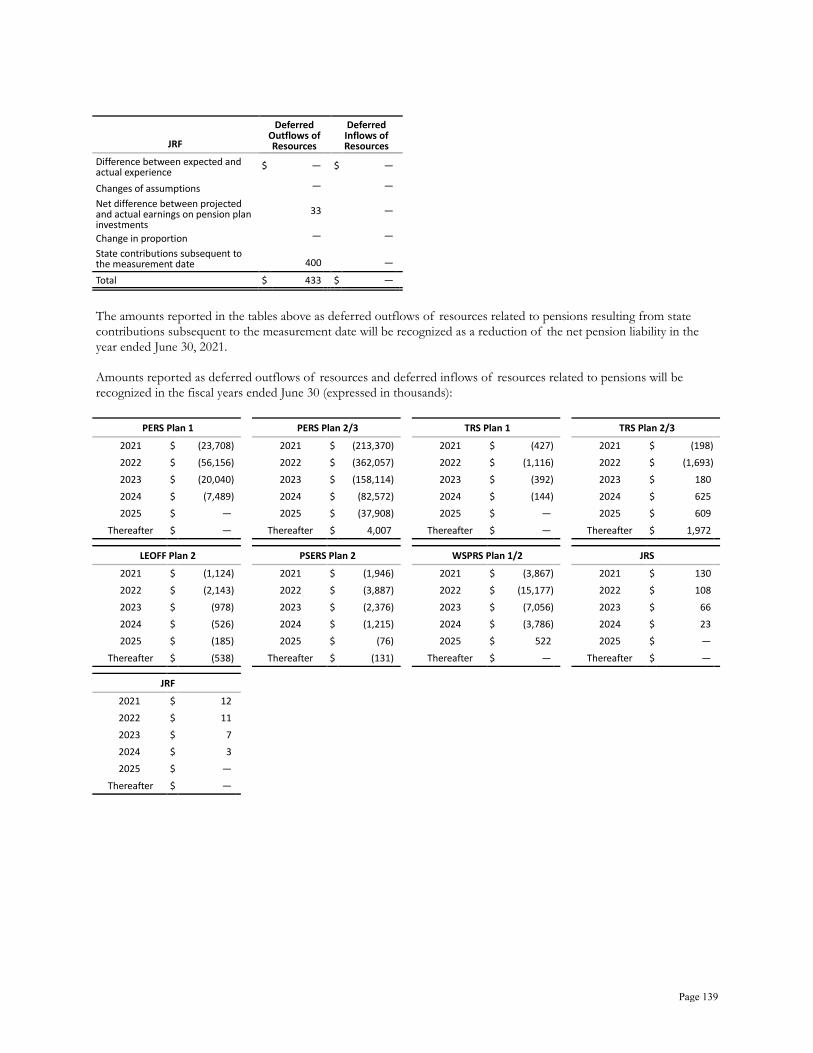
JRF
Deferred Outflows of Resources
Deferred Inflows of Resources
Difference between expected and actual experience $ — $ —
Changes of assumptions — — Net difference between projected and actual earnings on pension plan investments
33 —
Change in proportion — — State contributions subsequent to the measurement date 400 —
Total $ 433 $ —
The amounts reported in the tables above as deferred outflows of resources related to pensions resulting from state
contributions subsequent to the measurement date will be recognized as a reduction of the net pension liability in the
year ended June 30, 2021.
Amounts reported as deferred outflows of resources and deferred inflows of resources related to pensions will be
recognized in the fiscal years ended June 30 (expressed in thousands):
PERS Plan 1 PERS Plan 2/3 TRS Plan 1 TRS Plan 2/3 2021 $ (23,708) 2021 $ (213,370) 2021 $ (427) 2021 $ (198) 2022 $ (56,156) 2022 $ (362,057) 2022 $ (1,116) 2022 $ (1,693) 2023 $ (20,040) 2023 $ (158,114) 2023 $ (392) 2023 $ 180 2024 $ (7,489) 2024 $ (82,572) 2024 $ (144) 2024 $ 625 2025 $ — 2025 $ (37,908) 2025 $ — 2025 $ 609
Thereafter $ — Thereafter $ 4,007 Thereafter $ — Thereafter $ 1,972
LEOFF Plan 2 PSERS Plan 2 WSPRS Plan 1/2 JRS 2021 $ (1,124) 2021 $ (1,946) 2021 $ (3,867) 2021 $ 130 2022 $ (2,143) 2022 $ (3,887) 2022 $ (15,177) 2022 $ 108 2023 $ (978) 2023 $ (2,376) 2023 $ (7,056) 2023 $ 66 2024 $ (526) 2024 $ (1,215) 2024 $ (3,786) 2024 $ 23 2025 $ (185) 2025 $ (76) 2025 $ 522 2025 $ —
Thereafter $ (538) Thereafter $ (131) Thereafter $ — Thereafter $ —
JRF 2021 $ 12 2022 $ 11 2023 $ 7 2024 $ 3 2025 $ —
Thereafter $ —
Page 139

2. DRS Plans - Nonemployer Contributing Entity Disclosures
For fiscal year 2020, the state was considered a nonemployer contributing entity in special funding situations for two DRS-administered pension plans, LEOFF Plan 1 and LEOFF Plan 2. State contributions are required by statute to be made directly to these plans to fund pensions. Note 11.B.1 provides the detailed descriptions of these plans, their benefit terms, contribution requirements, significant assumptions used to measure pension liability and mortality, and the discount rate. Basis for Nonemployer Contributing Entity Contributions. LEOFF Plan 1 has a net pension asset as of the June 30, 2019, measurement date. If needed, RCW 41.26.080 would require employer and employee contributions of 6 percent, and the remaining liabilities funded by the state pursuant to chapter 41.45 RCW. For fiscal year 2019, the nonemployer contributing entity’s proportionate share of the net pension asset was considered substantial at 87.12 percent based on historical contributions to the plan. LEOFF Plan 2 has a net pension asset as of the June 30, 2019, measurement date. In this plan, the state is an employer and a nonemployer contributing entity. RCW 41.26.725 limits the employee contributions to 50 percent, employer contributions to 30 percent, and the state contribution to 20 percent of the cost of benefits. In no instance shall the state contribution exceed 4 percent of payroll. For fiscal year 2019, the nonemployer contributing entity’s proportionate share of the net pension asset was considered substantial at 39.57 percent based on total plan contributions received in fiscal year 2019. Collective Net Pension Liability/(Asset). The following presents the proportionate share of the collective net pension liability/(asset), the proportionate share percentage, and the change in proportion share of the state as a nonemployer contributing entity as of June 30, 2020 (expressed in thousands).
LEOFF Plan 1 LEOFF Plan 2 Proportionate share of the collective net pension liability/(asset) $ (1,722,024) $ (916,765) State's proportion 87.12% 39.57% Increase/(decrease) —% 0.27%
The proportion of the state nonemployer contributions related to LEOFF Plan 1 was based on historical contributions from the state and employers plus fiscal year 2019 retirement benefit payments. The proportion
of the state nonemployer contributions related to LEOFF Plan 2 was based on the state’s contributions to the pension plan relative to the total state contributions and all participating employers. Sensitivity of the Net Pension Liability/(Asset) to Changes in the Discount Rate. The following presents the net pension liability/(asset) of the nonemployer contributing entity calculated using the discount rate of 7.40 percent, as well as what the nonemployer contributing entity’s net pension liability/(asset) would be if it were calculated using a discount rate that is 1 percentage point lower (6.40 percent) or 1 percentage point higher (8.40 percent) than the current rate (expressed in thousands):
LEOFF Plan 1 Nonemployer Contributing Entity Proportionate
Share of Net Pension Liability/(Asset) 1% decrease $ (1,408,707) Current discount rate $ (1,722,024) 1% increase $ (1,992,542)
LEOFF Plan 2 Nonemployer Contributing Entity Proportionate
Share of Net Pension Liability/(Asset) 1% decrease $ (170,465) Current discount rate $ (916,765) 1% increase $ (1,525,917)
Pension Expense, Deferred Outflows of Resources, and Deferred Inflows of Resources Related to Pensions. For the year ended June 30, 2020, the state as a nonemployer contributing entity recognized $(90.3) million pension expense for LEOFF Plan 1 and $(29.6) million pension expense for LEOFF Plan 2. At June 30, 2020, the state as a nonemployer contributing entity reported deferred outflows of resources and deferred inflows of resources related to pensions from the following sources (expressed in thousands):
LEOFF Plan 1
Deferred Outflows of Resources
Deferred Inflows of Resources
Difference between expected and actual experience $ — $ —
Changes of assumptions — — Net difference between projected and actual earnings on pension plan investments — 178,522
Change in proportion — — State contributions subsequent to the measurement date 5 —
Total $ 5 $ 178,522
Page 140

LEOFF Plan 2
Deferred Outflows of Resources
Deferred Inflows of Resources
Difference between expected and actual experience $ 65,969 $ 16,486
Changes of assumptions 1,510 103,165 Net difference between projected and actual earnings on pension plan investments — 187,965
Change in proportion and difference between state contributions and proportionate share of contributions 1,927 4,108
State contributions subsequent to the measurement date 75,686 —
Total $ 145,092 $ 311,724
The amounts reported in the tables above as deferred
outflows of resources related to pensions resulting
from state contributions subsequent to the
measurement date will be recognized as a reduction of
the net pension liability in the year ended June 30, 2021.
Amounts reported as deferred outflows of resources and deferred inflows of resources related to pensions will be recognized in pension expense in the fiscal years ended June 30 (expressed in thousands):
LEOFF Plan 1 2021 $ (41,466) 2022 $ (91,394) 2023 $ (33,164) 2024 $ (12,498) 2025 $ —
Thereafter $ —
LEOFF Plan 2 2021 $ (49,600) 2022 $ (94,519) 2023 $ (43,136) 2024 $ (23,202) 2025 $ (8,141)
Thereafter $ (23,720)
3. Tables for Plans Administered by the Department of Retirement Services TABLE 1: Single Employer Plan Membership Membership of the single employer plans administered by the Department of Retirement Systems consisted of the following at June 30, 2019, the date of the latest actuarial valuation for all plans:
Number of Participating Members
Plans
Inactive Members (or Beneficiaries) Currently
Receiving Benefits
Inactive Members Entitled to But Not Yet
Receiving Benefits Active
Members Total Members WSPRS 1 1,181 69 397 1,647 WSPRS 2 — 37 646 683 JRS 90 — — 90 JRF 10 — — 10 Total 1,281 106 1,043 2,430
Page 141
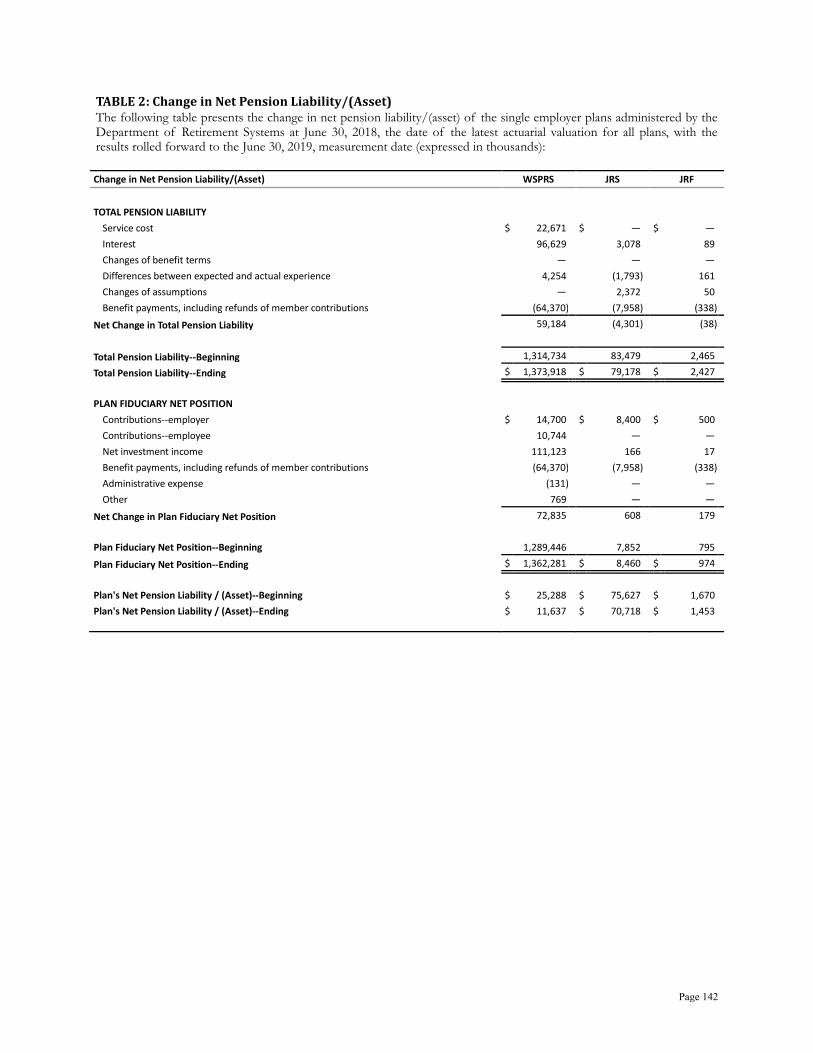
TABLE 2: Change in Net Pension Liability/(Asset) The following table presents the change in net pension liability/(asset) of the single employer plans administered by the Department of Retirement Systems at June 30, 2018, the date of the latest actuarial valuation for all plans, with the results rolled forward to the June 30, 2019, measurement date (expressed in thousands):
Change in Net Pension Liability/(Asset) WSPRS JRS JRF TOTAL PENSION LIABILITY
Service cost $ 22,671 $ — $ — Interest 96,629 3,078 89 Changes of benefit terms — — — Differences between expected and actual experience 4,254 (1,793) 161 Changes of assumptions — 2,372 50 Benefit payments, including refunds of member contributions (64,370) (7,958) (338)
Net Change in Total Pension Liability 59,184 (4,301) (38) Total Pension Liability--Beginning 1,314,734 83,479 2,465 Total Pension Liability--Ending $ 1,373,918 $ 79,178 $ 2,427 PLAN FIDUCIARY NET POSITION
Contributions--employer $ 14,700 $ 8,400 $ 500 Contributions--employee 10,744 — — Net investment income 111,123 166 17 Benefit payments, including refunds of member contributions (64,370) (7,958) (338) Administrative expense (131) — — Other 769 — —
Net Change in Plan Fiduciary Net Position 72,835 608 179 Plan Fiduciary Net Position--Beginning 1,289,446 7,852 795 Plan Fiduciary Net Position--Ending $ 1,362,281 $ 8,460 $ 974 Plan's Net Pension Liability / (Asset)--Beginning $ 25,288 $ 75,627 $ 1,670 Plan's Net Pension Liability / (Asset)--Ending $ 11,637 $ 70,718 $ 1,453
Page 142
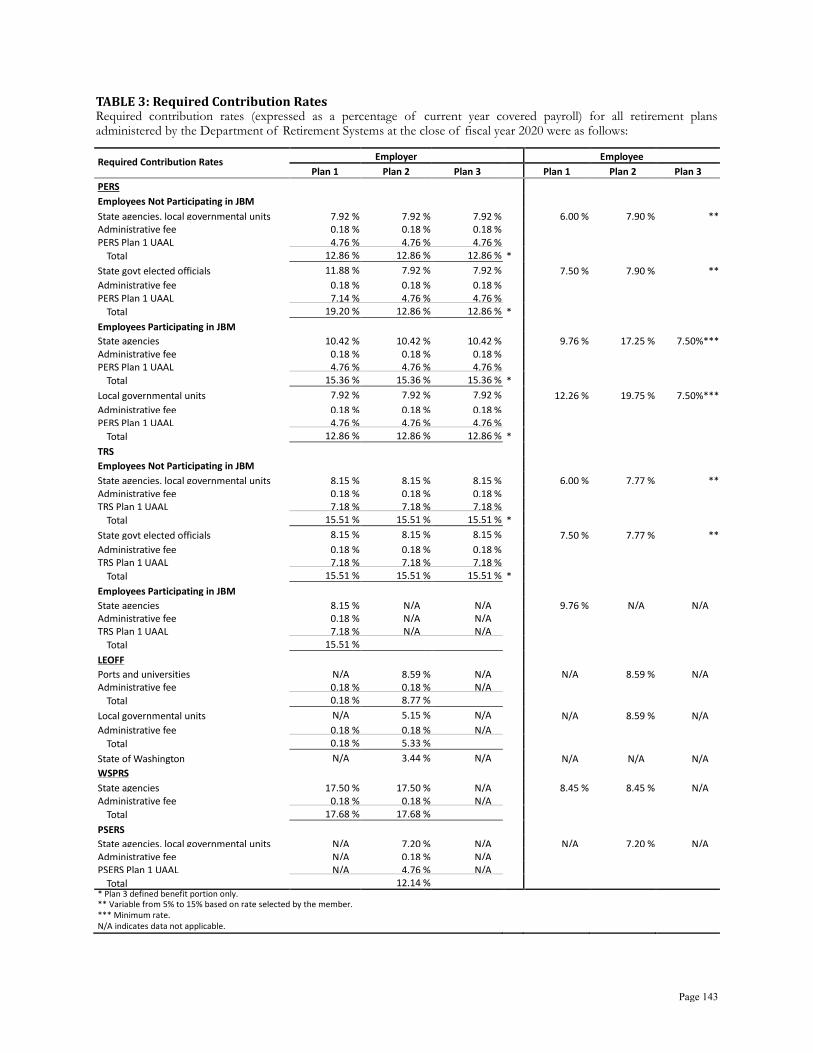
TABLE 3: Required Contribution Rates Required contribution rates (expressed as a percentage of current year covered payroll) for all retirement plans administered by the Department of Retirement Systems at the close of fiscal year 2020 were as follows:
Required Contribution Rates Employer Employee
Plan 1 Plan 2 Plan 3 Plan 1 Plan 2 Plan 3 PERS Employees Not Participating in JBM State agencies, local governmental units 7.92 % 7.92 % 7.92 % 6.00 % 7.90 % ** Administrative fee 0.18 % 0.18 % 0.18 % PERS Plan 1 UAAL 4.76 % 4.76 % 4.76 %
Total 12.86 % 12.86 % 12.86 % * State govt elected officials 11.88 % 7.92 % 7.92 % 7.50 % 7.90 % ** Administrative fee 0.18 % 0.18 % 0.18 % PERS Plan 1 UAAL 7.14 % 4.76 % 4.76 %
Total 19.20 % 12.86 % 12.86 % * Employees Participating in JBM State agencies 10.42 % 10.42 % 10.42 % 9.76 % 17.25 % 7.50%*** Administrative fee 0.18 % 0.18 % 0.18 % PERS Plan 1 UAAL 4.76 % 4.76 % 4.76 %
Total 15.36 % 15.36 % 15.36 % * Local governmental units 7.92 % 7.92 % 7.92 % 12.26 % 19.75 % 7.50%*** Administrative fee 0.18 % 0.18 % 0.18 % PERS Plan 1 UAAL 4.76 % 4.76 % 4.76 %
Total 12.86 % 12.86 % 12.86 % * TRS Employees Not Participating in JBM State agencies, local governmental units 8.15 % 8.15 % 8.15 % 6.00 % 7.77 % ** Administrative fee 0.18 % 0.18 % 0.18 % TRS Plan 1 UAAL 7.18 % 7.18 % 7.18 %
Total 15.51 % 15.51 % 15.51 % * State govt elected officials 8.15 % 8.15 % 8.15 % 7.50 % 7.77 % ** Administrative fee 0.18 % 0.18 % 0.18 % TRS Plan 1 UAAL 7.18 % 7.18 % 7.18 %
Total 15.51 % 15.51 % 15.51 % * Employees Participating in JBM State agencies 8.15 % N/A N/A 9.76 % N/A N/A Administrative fee 0.18 % N/A N/A TRS Plan 1 UAAL 7.18 % N/A N/A
Total 15.51 % LEOFF Ports and universities N/A 8.59 % N/A N/A 8.59 % N/A Administrative fee 0.18 % 0.18 % N/A
Total 0.18 % 8.77 % Local governmental units N/A 5.15 % N/A N/A 8.59 % N/A Administrative fee 0.18 % 0.18 % N/A
Total 0.18 % 5.33 % State of Washington N/A 3.44 % N/A N/A N/A N/A WSPRS State agencies 17.50 % 17.50 % N/A 8.45 % 8.45 % N/A Administrative fee 0.18 % 0.18 % N/A
Total 17.68 % 17.68 % PSERS State agencies, local governmental units N/A 7.20 % N/A N/A 7.20 % N/A Administrative fee N/A 0.18 % N/A PSERS Plan 1 UAAL N/A 4.76 % N/A
Total 12.14 % * Plan 3 defined benefit portion only. ** Variable from 5% to 15% based on rate selected by the member. *** Minimum rate. N/A indicates data not applicable.
Page 143
C. PLAN ADMINISTERED BY THE STATE BOARD FOR VOLUNTEER FIRE FIGHTERS AND RESERVE OFFICERS
Volunteer Fire Fighters’ and Reserve Officers’ Relief and Pension Fund Plan Description. The Volunteer Fire Fighters’ Relief Act was created by the Legislature in 1935, and the pension portion of the act was added in 1945. As established in chapter 41.24 RCW, the Volunteer Fire Fighters’ and Reserve Officers’ Relief and Pension Fund (VFFRPF) is a cost-sharing, multiple-employer defined benefit plan and is administered by the State Board for Volunteer Fire Fighters and Reserve Officers. The board is appointed by the Governor and is comprised of five members of fire departments covered by chapter 41.24 RCW. Administration costs of the VFFRPF are funded through legislative appropriation. As of June 30, 2020, there were approximately 390 municipalities contributing to the plan. Additionally, the state, a nonemployer contributing entity, contributes 40 percent of the fire insurance premium tax. Plan Members. Membership in the VFFRPF requires volunteer firefighter service with a fire department of an electing municipality of Washington state, emergency work as an emergency medical technician with an emergency medical service district, or work as a commissioned reserve law enforcement officer. At June 30, 2019, VFFRPF membership consisted of the following:
Plan Membership Inactive plan members or beneficiaries currently
receiving benefits 4,602
Inactive plan members entitled to but not yet receiving benefits 6,187
Active plan members* 8,428 Total membership 19,217 *Does not include 1,661 active plan members who have chosen not to join the pension plan. Benefits Provided. VFFRPF provides retirement, disability, and death benefits to eligible members. Benefits are established in chapter 41.24 RCW which may be amended only by the Legislature. Since retirement benefits cover volunteer service, benefits are paid based on years of service, not salary. Municipalities consist of fire departments, emergency medical service districts, and law enforcement agencies. After 25 years of active membership, members having reached the age of 65 and who have paid their annual
retirement fee for 25 years are entitled to receive a monthly benefit of $50 plus $10 per year of service. The maximum monthly benefit is $300. Reduced pensions are available for members under the age of 65 or with less than 25 years of service. Members are vested after ten years of service. VFFRPF members earn no interest on contributions and may elect to withdraw their contributions upon termination. Death and active duty disability benefits are provided at no cost to the member. Death benefits in the line of duty consist of a lump sum of $214 thousand. Funeral and burial expenses are also paid in a lump sum of $2 thousand for members on active duty. Members receiving disability benefits at the time of death shall be paid $500. Effective June 7, 2012, at any time prior to retirement or at the time of retirement, a member of the VFFRPF may purchase retirement pension coverage for years of eligible service prior to the member’s enrollment in the system or for years of service credit lost due to the withdrawal of the member’s pension fee contributions. A member choosing to purchase such retirement pension coverage must contribute to the system an amount equal to the actuarial value of the resulting benefit increase. There were no material changes in VFFRPF benefit provisions for the fiscal year ended June 30, 2020. Contributions. VFFRPF retirement benefits are financed from a combination of investment earnings, member contributions, municipality contributions, and state contributions. In accordance with chapter 41.24 RCW, the state contribution is set at 40 percent of the fire insurance premium tax. The state is considered a nonemployer contributing entity; however, this is not considered a special funding situation. For fiscal year 2020, the fire insurance premium tax contribution was $8.2 million. The municipality rate for emergency medical service districts (EMSD) and law enforcement agencies is set each year by the State Board for Volunteer Fire Fighters and Reserve Officers, based on the actual cost of participation as determined by the Office of the State Actuary (OSA). All other contribution rates are set by the Legislature. Municipalities may opt to pay the member's fee on their behalf. The contribution rates set for calendar year 2020 were the following:
Page 144
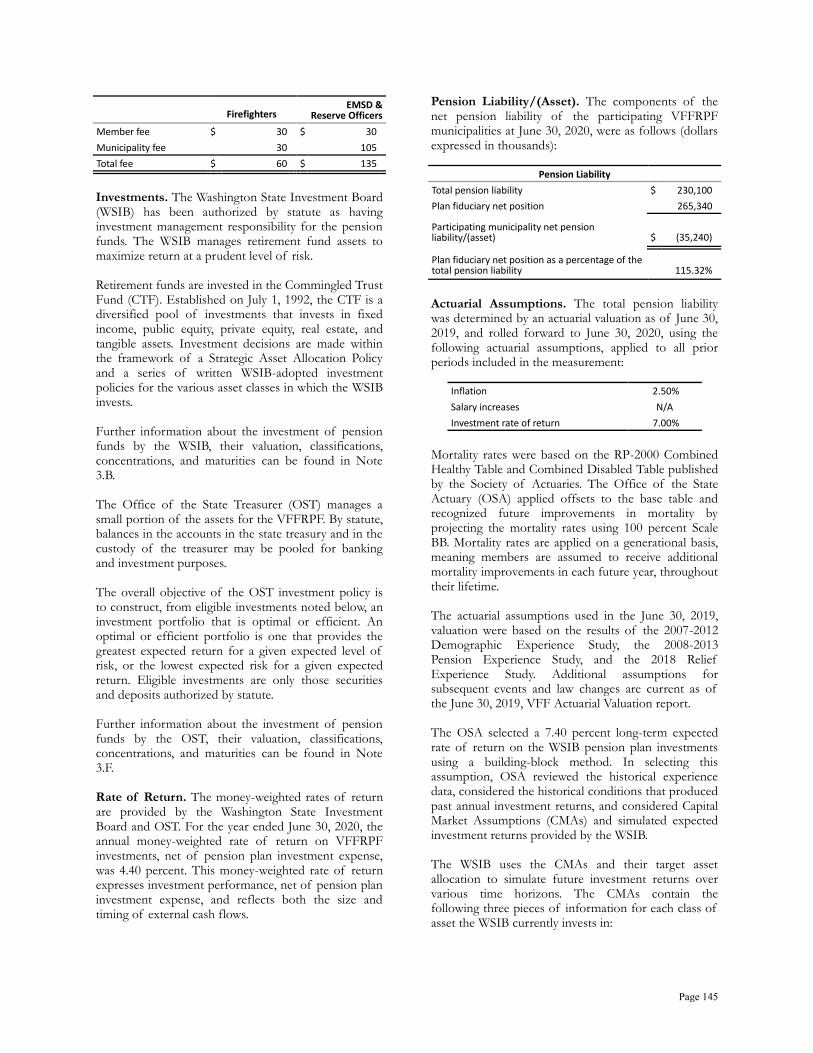
Firefighters EMSD &
Reserve Officers Member fee $ 30 $ 30 Municipality fee 30 105 Total fee $ 60 $ 135 Investments. The Washington State Investment Board (WSIB) has been authorized by statute as having investment management responsibility for the pension funds. The WSIB manages retirement fund assets to maximize return at a prudent level of risk. Retirement funds are invested in the Commingled Trust Fund (CTF). Established on July 1, 1992, the CTF is a diversified pool of investments that invests in fixed income, public equity, private equity, real estate, and tangible assets. Investment decisions are made within the framework of a Strategic Asset Allocation Policy and a series of written WSIB-adopted investment policies for the various asset classes in which the WSIB invests. Further information about the investment of pension funds by the WSIB, their valuation, classifications, concentrations, and maturities can be found in Note 3.B. The Office of the State Treasurer (OST) manages a small portion of the assets for the VFFRPF. By statute, balances in the accounts in the state treasury and in the custody of the treasurer may be pooled for banking and investment purposes. The overall objective of the OST investment policy is to construct, from eligible investments noted below, an investment portfolio that is optimal or efficient. An optimal or efficient portfolio is one that provides the greatest expected return for a given expected level of risk, or the lowest expected risk for a given expected return. Eligible investments are only those securities and deposits authorized by statute. Further information about the investment of pension funds by the OST, their valuation, classifications, concentrations, and maturities can be found in Note 3.F. Rate of Return. The money-weighted rates of return are provided by the Washington State Investment Board and OST. For the year ended June 30, 2020, the annual money-weighted rate of return on VFFRPF investments, net of pension plan investment expense, was 4.40 percent. This money-weighted rate of return expresses investment performance, net of pension plan investment expense, and reflects both the size and timing of external cash flows.
Pension Liability/(Asset). The components of the net pension liability of the participating VFFRPF municipalities at June 30, 2020, were as follows (dollars expressed in thousands):
Pension Liability
Total pension liability $ 230,100 Plan fiduciary net position 265,340
Participating municipality net pension liability/(asset) $ (35,240)
Plan fiduciary net position as a percentage of the total pension liability 115.32%
Actuarial Assumptions. The total pension liability was determined by an actuarial valuation as of June 30, 2019, and rolled forward to June 30, 2020, using the following actuarial assumptions, applied to all prior periods included in the measurement:
Inflation 2.50% Salary increases N/A Investment rate of return 7.00%
Mortality rates were based on the RP-2000 Combined Healthy Table and Combined Disabled Table published by the Society of Actuaries. The Office of the State Actuary (OSA) applied offsets to the base table and recognized future improvements in mortality by projecting the mortality rates using 100 percent Scale BB. Mortality rates are applied on a generational basis, meaning members are assumed to receive additional mortality improvements in each future year, throughout their lifetime. The actuarial assumptions used in the June 30, 2019, valuation were based on the results of the 2007-2012 Demographic Experience Study, the 2008-2013 Pension Experience Study, and the 2018 Relief Experience Study. Additional assumptions for subsequent events and law changes are current as of the June 30, 2019, VFF Actuarial Valuation report. The OSA selected a 7.40 percent long-term expected rate of return on the WSIB pension plan investments using a building-block method. In selecting this assumption, OSA reviewed the historical experience data, considered the historical conditions that produced past annual investment returns, and considered Capital Market Assumptions (CMAs) and simulated expected investment returns provided by the WSIB. The WSIB uses the CMAs and their target asset allocation to simulate future investment returns over various time horizons. The CMAs contain the following three pieces of information for each class of asset the WSIB currently invests in:
Page 145

• Expected annual return. • Standard deviation of the annual return. • Correlations between annual returns of each asset
class with every other asset class. Best estimates of arithmetic real rates of return for each major asset class included in the pension plan’s target asset allocation as of June 30, 2020, are summarized in the following table:
Asset Class Target
Allocation Long-Term Expected Real Rate of Return
Fixed income 20% 2.2% Tangible assets 7% 5.1% Real estate 18% 5.8% Public equity 32% 6.3% Private equity 23% 9.3% Total 100%
The inflation component used to create the above table is 2.20 percent, and represents the WSIB’s most recent long-term estimate of broad economic inflation. For additional information and background on the OSA’s development of the long-term rate of return assumptions, refer to the 2019 Report on Financial Condition and Economic Experience Study located on the OSA website. The selection of this assumption and economic experience studies are further detailed in the Department of Retirement Systems (DRS), Comprehensive Annual Financial Report's actuarial certification letter found on the DRS website. In consultation with the OST, the OSA selected a 3.50 percent long-term investment rate of return on assets managed by the OST. See OSA's 2019 VFF Actuarial Report for further details. https://leg.wa.gov/ osa/ presentations/ Documents/ Valuations/ 2019VAVR Report.pdfs/ 2019VAVR Report.pdf. As the VFFRPF has assets managed by both the WSIB and the OST, the long-term expected rate of return of
7.00 percent represents an approximate 90%/10% weighted-average of the assets managed by the WSIB (7.40 percent expected return) and the assets managed by the OST (3.50 percent expected return), respectively. Discount Rate. The discount rate used to measure the total pension liability was 7.00 percent. To determine the discount rate, an asset sufficiency test was completed to test whether the pension plan’s fiduciary net position was sufficient to make all projected future benefit payments of current plan members. Consistent with current law, the completed asset sufficiency test included an assumed 7.00 percent long-term discount rate to determine funding liabilities for calculating future contribution rate requirements. Consistent with the long-term expected rate of return, a 7.00 percent future investment rate of return on invested assets was assumed for the test. Contributions from plan members, municipalities, and the state will be made at the current contribution rate. Based on those assumptions, the pension plan’s fiduciary net position was projected to be available to make all projected future benefit payments of current plan members. Therefore, the long-term expected rate of return of 7.00 percent on plan investments was applied to determine the total pension liability. Sensitivity of the Net Pension Liability/(Asset) to Changes in the Discount Rate. The following presents the net pension liability/(asset) of the municipalities calculated using the discount rate of 7.00 percent, as well as what the municipalities’ net pension liability/(asset) would be if it were calculated using a discount rate that is 1 percentage point lower (6.00 percent) or 1 percentage point higher (8.00 percent) than the current rate (expressed in thousands):
Municipalities' Net Pension Liability/(Asset)
1% decrease $ (5,173) Current discount rate $ (35,240) 1% increase $ (59,666)
D. HIGHER EDUCATION RETIREMENT PLAN SUPPLEMENTAL DEFINED BENEFIT PLANS
Plan Description. The Higher Education Retirement Plans are privately administered single-employer defined contribution plans with a supplemental defined benefit plan component which guarantees a minimum retirement benefit based upon a one-time calculation at each employee’s retirement date. The supplemental component is financed on a pay-as-you-go basis. State institutions of higher education make direct payments to qualifying retirees when the retirement benefits
provided by the fund sponsors do not meet the benefit goals. No assets are accumulated in trusts or equivalent arrangements. The state and regional universities, the state college, the state community and technical colleges, and the Student Achievement Council each participate in a separate plan. As authorized by chapter 28B.10 RCW, the plans cover faculty and other positions as designated by each participating employer. RCW 28B.10.400, et seq. assigns the authority to establish and amend benefit provisions to the board of regents of the state universities, the boards of trustees of the regional universities and the state college, the
Page 146

state board for community and technical colleges, and the Student Achievement Council. The Higher Education Defined Contribution Retirement Plans are described in Note 11.E. Benefits Provided. The Higher Education Supplemental Retirement Plans provide retirement, disability, and death benefits to eligible members. As of July 1, 2011, all Higher Education Supplemental Retirement Plans were closed to new entrants. Members are eligible to receive benefits under this plan at age 62 with 10 years of credited service. The supplemental benefit is a lifetime benefit equal to the amount a member’s goal income exceeds their assumed income. The monthly goal income is one-twelfth of 2 percent of the member’s average annual salary multiplied by the number of years of service (such product not to exceed one-twelfth of fifty percent of the member’s average annual salary). The member’s assumed income is an annuity benefit the retired member would receive from their defined contribution Retirement Plan benefit in the first month of retirement had they invested all employer and member contributions equally between a fixed income and variable income annuity investment. Plan members have the option to retire early with reduced benefits. Actuarial Assumptions. The total pension liability was determined by an actuarial valuation as of June 30, 2018, with the results rolled forward to the June 30, 2020, measurement date using the following actuarial assumptions, applied to all periods included in the measurement:
Salary increases 3.50%-4.25% Fixed income and variable income investment returns* 4.25%-6.50% *Measurement reflects actual investment returns through June 30, 2020
Mortality rates were based on the RP-2000 Combined Healthy Table and Combined Disabled Table published
by the Society of Actuaries. The Office of the State Actuary (OSA) applied offsets to the base table and recognized future improvements in mortality by projecting the mortality rates using 100 percent Scale BB. Mortality rates are applied on a generational basis, meaning members are assumed to receive additional mortality improvements in each future year, throughout their lifetime. Most actuarial assumptions used in the June 30, 2018, valuation were based on the results of the April 2016 Supplemental Plan Experience Study. Additional assumptions related to salary growth were based on feedback from financial administrators of the Higher Education Supplemental Retirement Plans. Material assumption changes during the measurement period include the discount rate decrease from 3.50 percent to 2.21 percent. Discount Rate. The discount rate used to measure the total pension liability was set equal to the Bond Buyer General Obligation 20-Bond Municipal Bond Index, or 2.21 percent for the June 30, 2020, measurement date. Pension Expense. For the year ended June 30, 2020, the Higher Education Supplemental Retirement Plans reported the following for pension expense (expressed in thousands):
Pension Expense Plans
University of Washington (UW) $ 60,026 Washington State University (WSU) 5,274 Eastern Washington University (EWU) 1,985 Central Washington University (CWU) 611 The Evergreen State College (TESC) 451 Western Washington University (WWU) 2,073 State Board for Community and Technical Colleges (SBCTC) 8,643
Total $ 79,063
Page 147
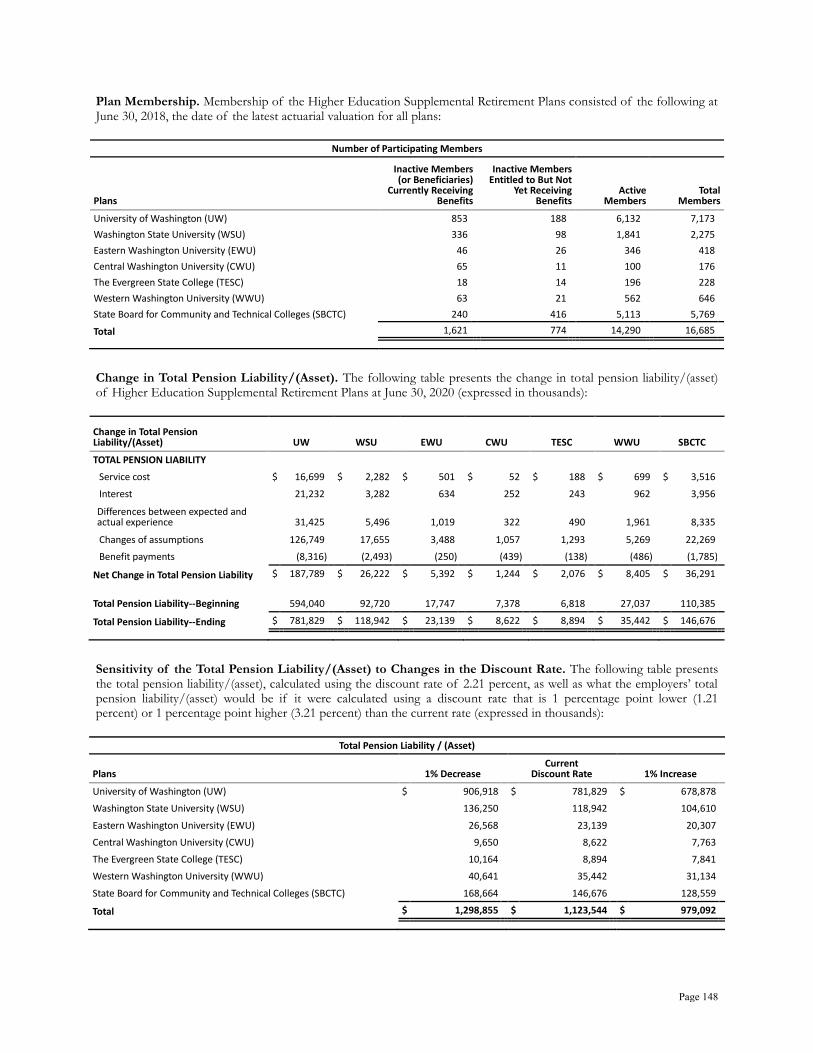
Plan Membership. Membership of the Higher Education Supplemental Retirement Plans consisted of the following at June 30, 2018, the date of the latest actuarial valuation for all plans:
Number of Participating Members
Plans
Inactive Members (or Beneficiaries)
Currently Receiving Benefits
Inactive Members Entitled to But Not
Yet Receiving Benefits
Active Members
Total Members
University of Washington (UW) 853 188 6,132 7,173 Washington State University (WSU) 336 98 1,841 2,275 Eastern Washington University (EWU) 46 26 346 418 Central Washington University (CWU) 65 11 100 176 The Evergreen State College (TESC) 18 14 196 228 Western Washington University (WWU) 63 21 562 646 State Board for Community and Technical Colleges (SBCTC) 240 416 5,113 5,769 Total 1,621 774 14,290 16,685 Change in Total Pension Liability/(Asset). The following table presents the change in total pension liability/(asset) of Higher Education Supplemental Retirement Plans at June 30, 2020 (expressed in thousands):
Change in Total Pension Liability/(Asset) UW WSU EWU CWU TESC WWU SBCTC TOTAL PENSION LIABILITY
Service cost $ 16,699 $ 2,282 $ 501 $ 52 $ 188 $ 699 $ 3,516 Interest 21,232 3,282 634 252 243 962 3,956 Differences between expected and actual experience 31,425 5,496 1,019 322 490 1,961 8,335
Changes of assumptions 126,749 17,655 3,488 1,057 1,293 5,269 22,269 Benefit payments (8,316) (2,493) (250) (439) (138) (486) (1,785)
Net Change in Total Pension Liability $ 187,789 $ 26,222 $ 5,392 $ 1,244 $ 2,076 $ 8,405 $ 36,291 Total Pension Liability--Beginning 594,040 92,720 17,747 7,378 6,818 27,037 110,385 Total Pension Liability--Ending $ 781,829 $ 118,942 $ 23,139 $ 8,622 $ 8,894 $ 35,442 $ 146,676 Sensitivity of the Total Pension Liability/(Asset) to Changes in the Discount Rate. The following table presents the total pension liability/(asset), calculated using the discount rate of 2.21 percent, as well as what the employers’ total pension liability/(asset) would be if it were calculated using a discount rate that is 1 percentage point lower (1.21 percent) or 1 percentage point higher (3.21 percent) than the current rate (expressed in thousands):
Total Pension Liability / (Asset)
Plans 1% Decrease Current
Discount Rate 1% Increase University of Washington (UW) $ 906,918 $ 781,829 $ 678,878 Washington State University (WSU) 136,250 118,942 104,610 Eastern Washington University (EWU) 26,568 23,139 20,307 Central Washington University (CWU) 9,650 8,622 7,763 The Evergreen State College (TESC) 10,164 8,894 7,841 Western Washington University (WWU) 40,641 35,442 31,134 State Board for Community and Technical Colleges (SBCTC) 168,664 146,676 128,559 Total $ 1,298,855 $ 1,123,544 $ 979,092
Page 148
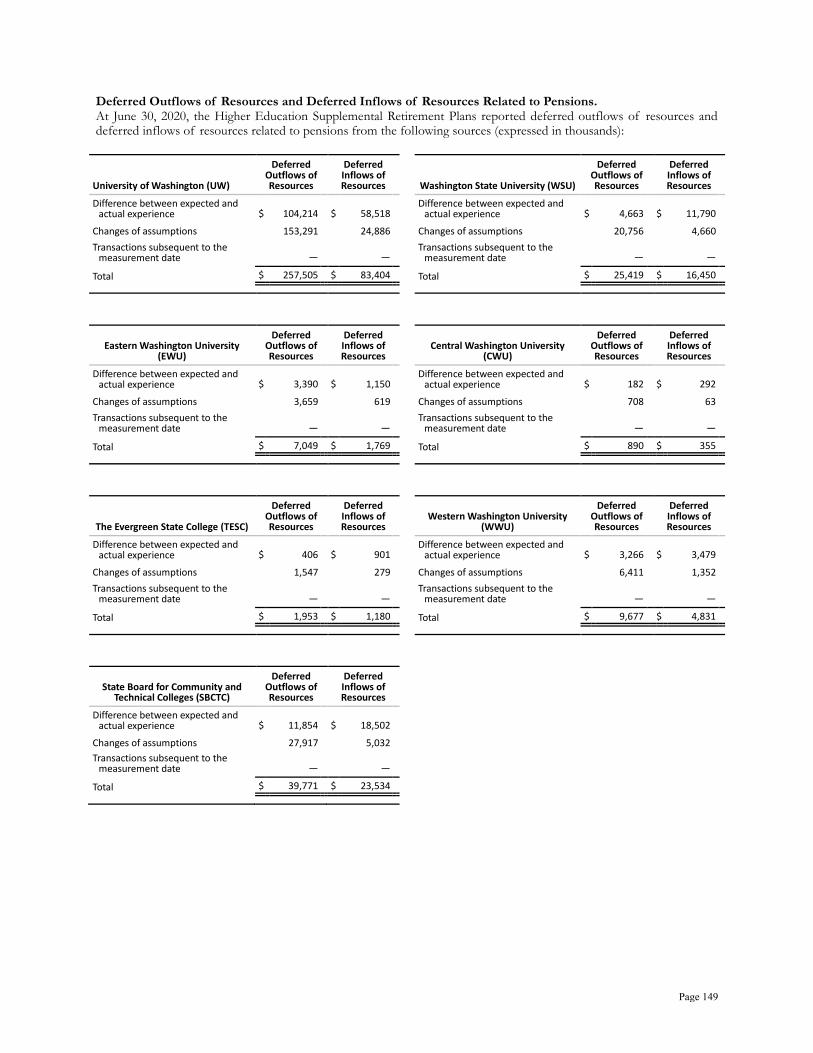
Deferred Outflows of Resources and Deferred Inflows of Resources Related to Pensions. At June 30, 2020, the Higher Education Supplemental Retirement Plans reported deferred outflows of resources and deferred inflows of resources related to pensions from the following sources (expressed in thousands):
University of Washington (UW)
Deferred Outflows of Resources
Deferred Inflows of Resources Washington State University (WSU)
Deferred Outflows of Resources
Deferred Inflows of Resources
Difference between expected and actual experience $ 104,214 $ 58,518
Difference between expected and actual experience $ 4,663 $ 11,790
Changes of assumptions 153,291 24,886 Changes of assumptions 20,756 4,660 Transactions subsequent to the
measurement date — — Transactions subsequent to the
measurement date — —
Total $ 257,505 $ 83,404 Total $ 25,419 $ 16,450
Eastern Washington University (EWU)
Deferred Outflows of Resources
Deferred Inflows of Resources
Central Washington University (CWU)
Deferred Outflows of Resources
Deferred Inflows of Resources
Difference between expected and actual experience $ 3,390 $ 1,150
Difference between expected and actual experience $ 182 $ 292
Changes of assumptions 3,659 619 Changes of assumptions 708 63 Transactions subsequent to the
measurement date — — Transactions subsequent to the
measurement date — —
Total $ 7,049 $ 1,769 Total $ 890 $ 355
The Evergreen State College (TESC)
Deferred Outflows of Resources
Deferred Inflows of Resources
Western Washington University (WWU)
Deferred Outflows of Resources
Deferred Inflows of Resources
Difference between expected and actual experience $ 406 $ 901
Difference between expected and actual experience $ 3,266 $ 3,479
Changes of assumptions 1,547 279 Changes of assumptions 6,411 1,352 Transactions subsequent to the
measurement date — — Transactions subsequent to the
measurement date — —
Total $ 1,953 $ 1,180 Total $ 9,677 $ 4,831
State Board for Community and Technical Colleges (SBCTC)
Deferred Outflows of Resources
Deferred Inflows of Resources
Difference between expected and actual experience $ 11,854 $ 18,502
Changes of assumptions 27,917 5,032 Transactions subsequent to the
measurement date — — Total $ 39,771 $ 23,534
Page 149
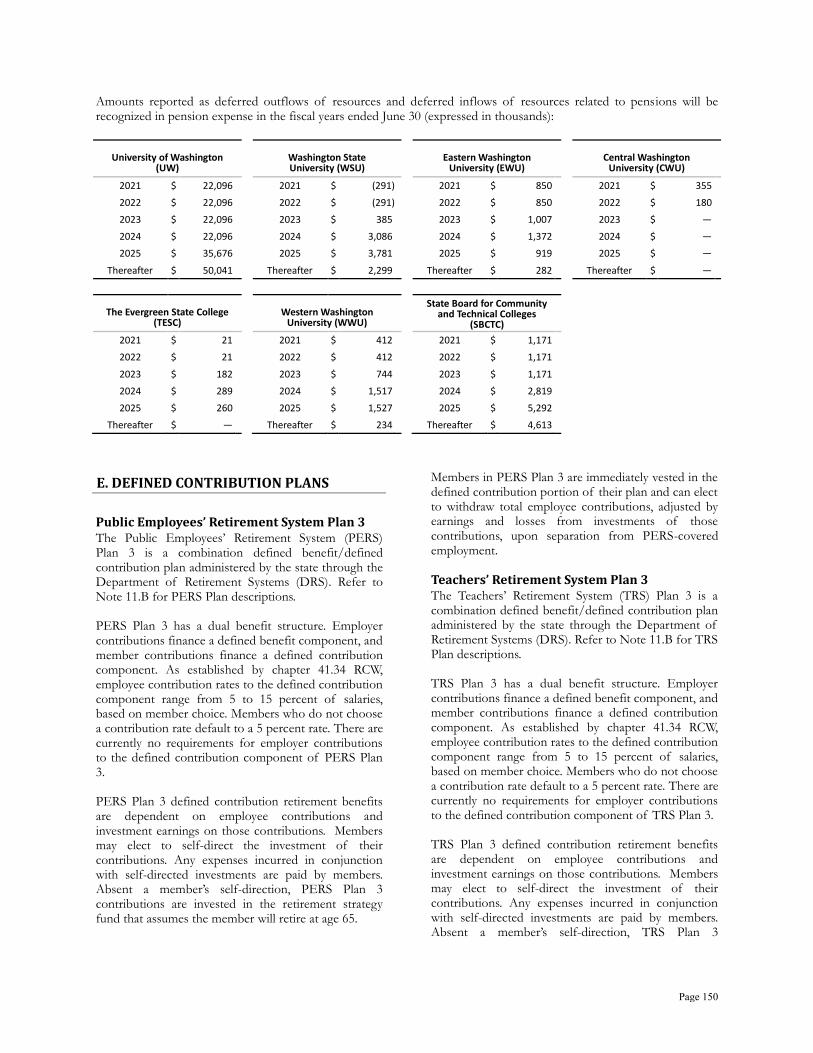
Amounts reported as deferred outflows of resources and deferred inflows of resources related to pensions will be recognized in pension expense in the fiscal years ended June 30 (expressed in thousands):
University of Washington (UW)
Washington State University (WSU)
Eastern Washington University (EWU)
Central Washington University (CWU)
2021 $ 22,096 2021 $ (291) 2021 $ 850 2021 $ 355 2022 $ 22,096 2022 $ (291) 2022 $ 850 2022 $ 180 2023 $ 22,096 2023 $ 385 2023 $ 1,007 2023 $ — 2024 $ 22,096 2024 $ 3,086 2024 $ 1,372 2024 $ — 2025 $ 35,676 2025 $ 3,781 2025 $ 919 2025 $ —
Thereafter $ 50,041 Thereafter $ 2,299 Thereafter $ 282 Thereafter $ —
The Evergreen State College (TESC)
Western Washington University (WWU)
State Board for Community and Technical Colleges
(SBCTC) 2021 $ 21 2021 $ 412 2021 $ 1,171 2022 $ 21 2022 $ 412 2022 $ 1,171 2023 $ 182 2023 $ 744 2023 $ 1,171 2024 $ 289 2024 $ 1,517 2024 $ 2,819 2025 $ 260 2025 $ 1,527 2025 $ 5,292
Thereafter $ — Thereafter $ 234 Thereafter $ 4,613
E. DEFINED CONTRIBUTION PLANS
Public Employees’ Retirement System Plan 3 The Public Employees’ Retirement System (PERS) Plan 3 is a combination defined benefit/defined contribution plan administered by the state through the Department of Retirement Systems (DRS). Refer to Note 11.B for PERS Plan descriptions. PERS Plan 3 has a dual benefit structure. Employer contributions finance a defined benefit component, and member contributions finance a defined contribution component. As established by chapter 41.34 RCW, employee contribution rates to the defined contribution component range from 5 to 15 percent of salaries, based on member choice. Members who do not choose a contribution rate default to a 5 percent rate. There are currently no requirements for employer contributions to the defined contribution component of PERS Plan 3. PERS Plan 3 defined contribution retirement benefits are dependent on employee contributions and investment earnings on those contributions. Members may elect to self-direct the investment of their contributions. Any expenses incurred in conjunction with self-directed investments are paid by members. Absent a member’s self-direction, PERS Plan 3 contributions are invested in the retirement strategy fund that assumes the member will retire at age 65.
Members in PERS Plan 3 are immediately vested in the defined contribution portion of their plan and can elect to withdraw total employee contributions, adjusted by earnings and losses from investments of those contributions, upon separation from PERS-covered employment.
Teachers’ Retirement System Plan 3 The Teachers’ Retirement System (TRS) Plan 3 is a combination defined benefit/defined contribution plan administered by the state through the Department of Retirement Systems (DRS). Refer to Note 11.B for TRS Plan descriptions. TRS Plan 3 has a dual benefit structure. Employer contributions finance a defined benefit component, and member contributions finance a defined contribution component. As established by chapter 41.34 RCW, employee contribution rates to the defined contribution component range from 5 to 15 percent of salaries, based on member choice. Members who do not choose a contribution rate default to a 5 percent rate. There are currently no requirements for employer contributions to the defined contribution component of TRS Plan 3. TRS Plan 3 defined contribution retirement benefits are dependent on employee contributions and investment earnings on those contributions. Members may elect to self-direct the investment of their contributions. Any expenses incurred in conjunction with self-directed investments are paid by members. Absent a member’s self-direction, TRS Plan 3
Page 150

contributions are invested in the retirement strategy fund that assumes the member will retire at age 65. Members in TRS Plan 3 are immediately vested in the defined contribution portion of their plan, and can elect to withdraw total employee contributions, adjusted by earnings and losses from investments of those contributions, upon separation from TRS-covered employment. Judicial Retirement Account The Judicial Retirement Account (JRA) Plan was established by the Legislature in 1988 to provide supplemental retirement benefits. It is a defined contribution plan administered by the state Administrative Office of the Courts (AOC), under the direction of the Board for Judicial Administration. Membership includes judges elected or appointed to the Supreme Court, Court of Appeals, and Superior Courts, and who are members of PERS for their services as a judge. Vesting is full and immediate. At June 30, 2020, there were one active member and 101 inactive members and one member receiving monthly benefits in JRA. The state, through the AOC, is the sole participating employer. Beginning January 1, 2007, any justice or judge who was in a judicial position at that time and who chose to join the Judicial Benefit Multiplier (JBM) Program could no longer participate in JRA. Any justice or judge elected or appointed to office on or after January 1, 2007, who elects to join DRS membership will also be mandated into JBM. If they have already established membership in PERS Plan 1 or TRS Plan 1 they will rejoin that plan, but if they have never had membership, they will be enrolled as a member of both PERS Plan 2 and JBM. JRA Plan members are required to contribute 2.5 percent of covered salary. The state, as employer, contributes an equal amount on a monthly basis. The employer and employee obligations to contribute are established per chapter 2.14 RCW. Plan provisions and contribution requirements are established in state statute and may be amended only by the Legislature. A JRA member who separates from judicial service for any reason is entitled to receive a lump-sum distribution of the accumulated contributions. The administrator of JRA may adopt rules establishing other payment options. If a member dies, the amount of accumulated contributions standing to the member’s credit at the time of the member’s death is to be paid
to the member’s estate or such person or persons, trust or organization, as the member has nominated by written designation. For fiscal year 2020, the state recognized pension expense for contributions of $9 thousand made to employee accounts. No plan refunds were made. The administrator of JRA has entered an agreement with the DRS for accounting and reporting services, and the Washington State Investment Board (WSIB) for investment services. Under this agreement, the DRS is responsible for all record keeping, accounting, and reporting of member accounts and the WSIB is granted the full power to establish investment policy, develop participant investment options, and manage the investment funds for the JRA Plan, consistent with the provisions of RCW 2.14.080 and 43.84.150. Higher Education Retirement Plans The Higher Education Retirement Plans are privately administered defined contribution plans with a supplemental defined benefit plan component. The state and regional universities, the state college, the state community and technical colleges, and the Student Achievement Council each participate in a plan. As authorized by chapter 28B.10 RCW, the plans cover faculty and other positions as designated by each participating employer. Contributions to the plans are invested in annuity contracts or mutual fund accounts offered by one or more fund sponsors. Benefits from fund sponsors are available upon separation or retirement at the member’s option. Employees have, at all times, a 100 percent vested interest in their accumulations. RCW 28B.10.400, et seq. assigns the authority to establish and amend benefit provisions to the board of regents of the state universities, the boards of trustees of the regional universities and the state college, the state board for community and technical colleges, and the Student Achievement Council. Employee contribution rates, based on age, range from 3.77 percent to 9.85 percent of salary. The employers match the employee contributions. The employer and employee obligations to contribute are established per chapter 28B.10 RCW. For fiscal year 2020, employer and employee contributions were $251.9 and $249.6 million, respectively, for a total of $501.5 million.
Page 151
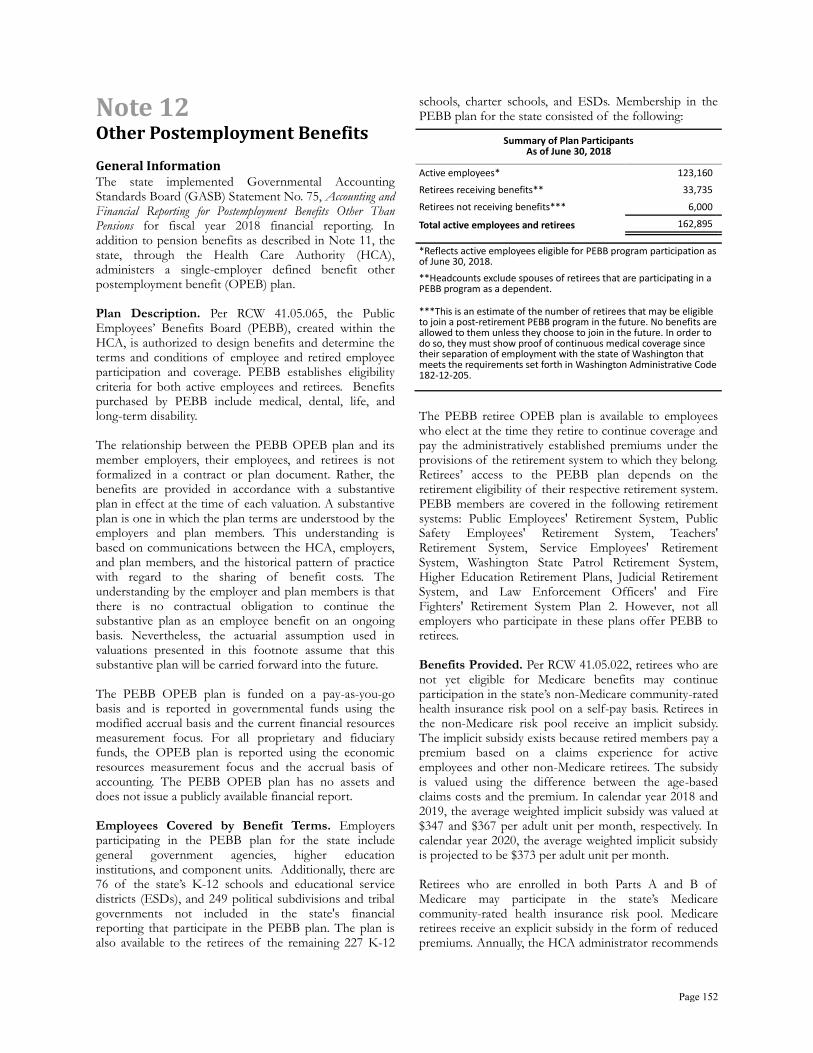
Note 12 Other Postemployment Benefits General Information The state implemented Governmental Accounting Standards Board (GASB) Statement No. 75, Accounting and Financial Reporting for Postemployment Benefits Other Than Pensions for fiscal year 2018 financial reporting. In addition to pension benefits as described in Note 11, the state, through the Health Care Authority (HCA), administers a single-employer defined benefit other postemployment benefit (OPEB) plan. Plan Description. Per RCW 41.05.065, the Public Employees’ Benefits Board (PEBB), created within the HCA, is authorized to design benefits and determine the terms and conditions of employee and retired employee participation and coverage. PEBB establishes eligibility criteria for both active employees and retirees. Benefits purchased by PEBB include medical, dental, life, and long-term disability. The relationship between the PEBB OPEB plan and its member employers, their employees, and retirees is not formalized in a contract or plan document. Rather, the benefits are provided in accordance with a substantive plan in effect at the time of each valuation. A substantive plan is one in which the plan terms are understood by the employers and plan members. This understanding is based on communications between the HCA, employers, and plan members, and the historical pattern of practice with regard to the sharing of benefit costs. The understanding by the employer and plan members is that there is no contractual obligation to continue the substantive plan as an employee benefit on an ongoing basis. Nevertheless, the actuarial assumption used in valuations presented in this footnote assume that this substantive plan will be carried forward into the future. The PEBB OPEB plan is funded on a pay-as-you-go basis and is reported in governmental funds using the modified accrual basis and the current financial resources measurement focus. For all proprietary and fiduciary funds, the OPEB plan is reported using the economic resources measurement focus and the accrual basis of accounting. The PEBB OPEB plan has no assets and does not issue a publicly available financial report. Employees Covered by Benefit Terms. Employers participating in the PEBB plan for the state include general government agencies, higher education institutions, and component units. Additionally, there are 76 of the state’s K-12 schools and educational service districts (ESDs), and 249 political subdivisions and tribal governments not included in the state's financial reporting that participate in the PEBB plan. The plan is also available to the retirees of the remaining 227 K-12
schools, charter schools, and ESDs. Membership in the PEBB plan for the state consisted of the following:
Summary of Plan Participants As of June 30, 2018
Active employees* 123,160 Retirees receiving benefits** 33,735 Retirees not receiving benefits*** 6,000 Total active employees and retirees 162,895 *Reflects active employees eligible for PEBB program participation as of June 30, 2018. **Headcounts exclude spouses of retirees that are participating in a PEBB program as a dependent.
***This is an estimate of the number of retirees that may be eligible to join a post-retirement PEBB program in the future. No benefits are allowed to them unless they choose to join in the future. In order to do so, they must show proof of continuous medical coverage since their separation of employment with the state of Washington that meets the requirements set forth in Washington Administrative Code 182-12-205.
The PEBB retiree OPEB plan is available to employees who elect at the time they retire to continue coverage and pay the administratively established premiums under the provisions of the retirement system to which they belong. Retirees’ access to the PEBB plan depends on the retirement eligibility of their respective retirement system. PEBB members are covered in the following retirement systems: Public Employees' Retirement System, Public Safety Employees' Retirement System, Teachers' Retirement System, Service Employees' Retirement System, Washington State Patrol Retirement System, Higher Education Retirement Plans, Judicial Retirement System, and Law Enforcement Officers' and Fire Fighters' Retirement System Plan 2. However, not all employers who participate in these plans offer PEBB to retirees. Benefits Provided. Per RCW 41.05.022, retirees who are not yet eligible for Medicare benefits may continue participation in the state’s non-Medicare community-rated health insurance risk pool on a self-pay basis. Retirees in the non-Medicare risk pool receive an implicit subsidy. The implicit subsidy exists because retired members pay a premium based on a claims experience for active employees and other non-Medicare retirees. The subsidy is valued using the difference between the age-based claims costs and the premium. In calendar year 2018 and 2019, the average weighted implicit subsidy was valued at $347 and $367 per adult unit per month, respectively. In calendar year 2020, the average weighted implicit subsidy is projected to be $373 per adult unit per month. Retirees who are enrolled in both Parts A and B of Medicare may participate in the state’s Medicare community-rated health insurance risk pool. Medicare retirees receive an explicit subsidy in the form of reduced premiums. Annually, the HCA administrator recommends
Page 152

an amount for the next calendar year’s explicit subsidy for inclusion in the Governor’s budget. The final amount is approved by the state Legislature. In calendar year 2018 and 2019, the explicit subsidy was up to $168 per member per month, increasing to up to $183 per member per month in calendar year 2020. It is projected to remain at $183 per member per month in calendar year 2021. Contribution Information. Administrative costs as well as implicit and explicit subsidies are funded by required contributions (RCW 41.05.050) from participating employers. The subsidies provide monetary assistance for medical benefits. Contributions are set each biennium as part of the budget process. The benefits are funded on a pay-as-you-go basis. The estimated monthly cost for PEBB benefits for the reporting period for each active employee (average across all plans and tiers) is as follows (expressed in dollars):
Required Premium* Medical $ 1,100 Dental 81 Life 4 Long-term disability 2
Total $ 1,187 Employer contribution $ 1,025 Employee contribution 162
Total $ 1,187 *Per 2020 PEBB Financial Projection Model 3.3. Per capita cost based on subscribers, includes non-Medicare risk pool only. Figures based on calendar year 2020 which includes projected claims cost at the time of this reporting.
Each participating employer in the plan is required to disclose additional information with regard to funding policy, the employer’s annual OPEB costs and contributions made, the funded status and funding progress of the employer’s individual plan, and actuarial methods and assumptions used. For information on the results of an actuarial valuation of the employer provided subsidies associated with the PEBB plan, refer to the Office of the State Actuary's website: https:// leg.wa.gov/osa/additional services/ Pages/OPEB.aspx. Please note that the results from OSA's report will not precisely match this publication due to the exclusion of a component unit that reports on a cash basis, and inclusion of a component unit not included in OSA's valuation report. Actuarial Assumptions. The total OPEB liability was determined using the following methodologies:
Actuarial valuation date 6/30/2018 Actuarial measurement date 6/30/2019
Actuarial cost method Entry Age
Amortization method The recognition period for the experience and assumption changes is 9 years. This is equal to the average expected remaining service lives of all active and inactive members.
Asset valuation method N/A - No Assets
Projections of benefits for financial reporting purposes are based on the terms of the substantive plan (i.e., the plan as understood by the employer and the plan members), and include the types of benefits provided at the time of each valuation and the historical pattern of sharing of benefit costs between the employer and plan members (active employees and retirees) to that point. The actuarial methods and assumptions used include techniques that are designed to reduce the effects of short-term volatility in actuarial accrued liabilities, consistent with the long-term perspective of the calculations. The total OPEB liability was determined using the following actuarial assumptions, applied to all periods included in the measurement, unless otherwise specified:
Inflation rate 2.75% Projected salary changes 3.50% plus service-based salary
increases
Health care trend rates Trend rate assumptions vary slightly by medical plan. Initial rate is approximately 8%, reaching an ultimate rate of approximately 4.5% in 2080.
Post-retirement participation percentage 65%
Percentage with spouse coverage 45%
In projecting the growth of the explicit subsidy, after 2022 when the cap is $183, it is assumed to grow at the health care trend rates. The Legislature determines the value of the cap and no future increases are guaranteed; however, based on historical growth patterns, future increases to the cap are assumed. Mortality rates were based on the RP-2000 Combined Healthy Table and Combined Disabled Table published by the Society of Actuaries. The Office of the State Actuary applied offsets to the base table and recognized future improvements in mortality by projecting the mortality rates using 100 percent Scale BB. Mortality rates are applied on a generational basis, meaning members are assumed to receive additional mortality improvements in each future year, throughout their lifetime.
Page 153
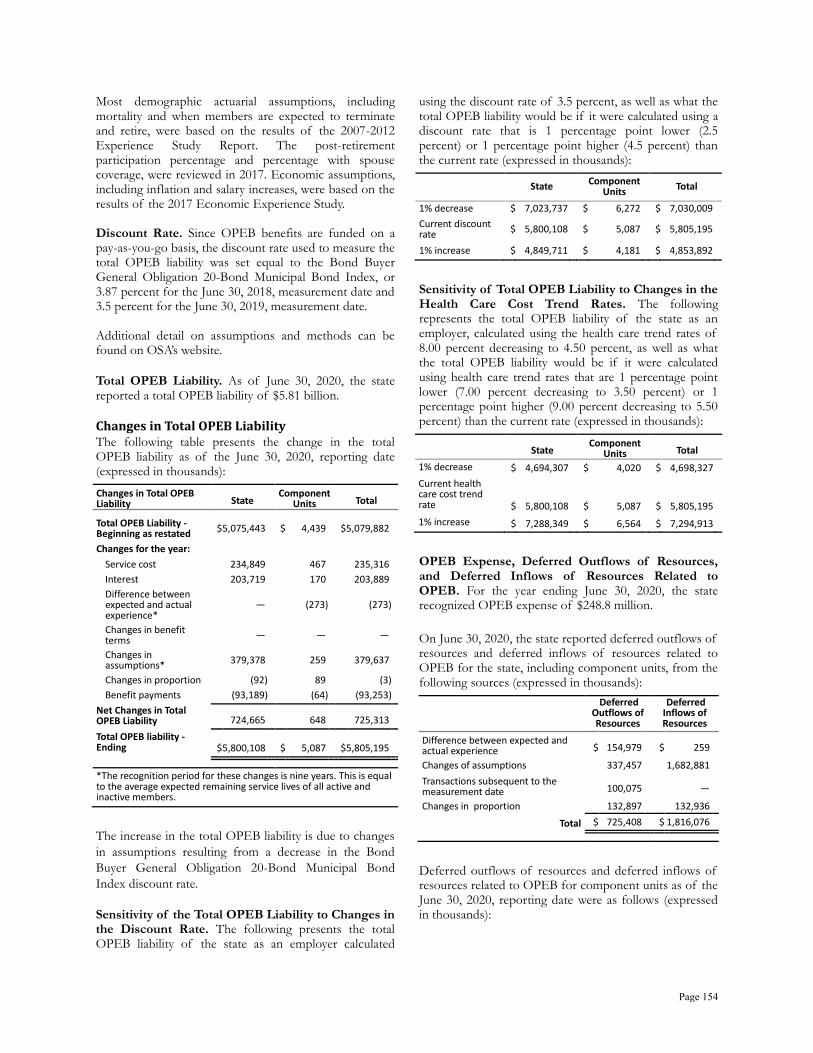
Most demographic actuarial assumptions, including mortality and when members are expected to terminate and retire, were based on the results of the 2007-2012 Experience Study Report. The post-retirement participation percentage and percentage with spouse coverage, were reviewed in 2017. Economic assumptions, including inflation and salary increases, were based on the results of the 2017 Economic Experience Study. Discount Rate. Since OPEB benefits are funded on a pay-as-you-go basis, the discount rate used to measure the total OPEB liability was set equal to the Bond Buyer General Obligation 20-Bond Municipal Bond Index, or 3.87 percent for the June 30, 2018, measurement date and 3.5 percent for the June 30, 2019, measurement date. Additional detail on assumptions and methods can be found on OSA’s website. Total OPEB Liability. As of June 30, 2020, the state reported a total OPEB liability of $5.81 billion. Changes in Total OPEB Liability The following table presents the change in the total OPEB liability as of the June 30, 2020, reporting date (expressed in thousands):
Changes in Total OPEB Liability State
Component Units Total
Total OPEB Liability - Beginning as restated $ 5,075,443 $ 4,439 $ 5,079,882
Changes for the year: Service cost 234,849 467 235,316 Interest 203,719 170 203,889 Difference between expected and actual experience*
— (273) (273)
Changes in benefit terms — — — Changes in assumptions* 379,378 259 379,637
Changes in proportion (92) 89 (3) Benefit payments (93,189) (64) (93,253)
Net Changes in Total OPEB Liability 724,665 648 725,313 Total OPEB liability - Ending $ 5,800,108 $ 5,087 $ 5,805,195
*The recognition period for these changes is nine years. This is equal to the average expected remaining service lives of all active and inactive members.
The increase in the total OPEB liability is due to changes
in assumptions resulting from a decrease in the Bond
Buyer General Obligation 20-Bond Municipal Bond
Index discount rate.
Sensitivity of the Total OPEB Liability to Changes in the Discount Rate. The following presents the total OPEB liability of the state as an employer calculated
using the discount rate of 3.5 percent, as well as what the total OPEB liability would be if it were calculated using a discount rate that is 1 percentage point lower (2.5 percent) or 1 percentage point higher (4.5 percent) than the current rate (expressed in thousands):
State Component Units Total
1% decrease $ 7,023,737 $ 6,272 $ 7,030,009 Current discount rate $ 5,800,108 $ 5,087 $ 5,805,195
1% increase $ 4,849,711 $ 4,181 $ 4,853,892
Sensitivity of Total OPEB Liability to Changes in the Health Care Cost Trend Rates. The following represents the total OPEB liability of the state as an employer, calculated using the health care trend rates of 8.00 percent decreasing to 4.50 percent, as well as what the total OPEB liability would be if it were calculated using health care trend rates that are 1 percentage point lower (7.00 percent decreasing to 3.50 percent) or 1 percentage point higher (9.00 percent decreasing to 5.50 percent) than the current rate (expressed in thousands):
State Component Units Total
1% decrease $ 4,694,307 $ 4,020 $ 4,698,327 Current health care cost trend rate $ 5,800,108 $ 5,087 $ 5,805,195 1% increase $ 7,288,349 $ 6,564 $ 7,294,913
OPEB Expense, Deferred Outflows of Resources, and Deferred Inflows of Resources Related to OPEB. For the year ending June 30, 2020, the state recognized OPEB expense of $248.8 million.
On June 30, 2020, the state reported deferred outflows of resources and deferred inflows of resources related to OPEB for the state, including component units, from the following sources (expressed in thousands):
Deferred
Outflows of Resources
Deferred Inflows of Resources
Difference between expected and actual experience $ 154,979 $ 259
Changes of assumptions 337,457 1,682,881 Transactions subsequent to the measurement date 100,075 —
Changes in proportion 132,897 132,936 Total $ 725,408 $ 1,816,076
Deferred outflows of resources and deferred inflows of resources related to OPEB for component units as of the June 30, 2020, reporting date were as follows (expressed in thousands):
Page 154
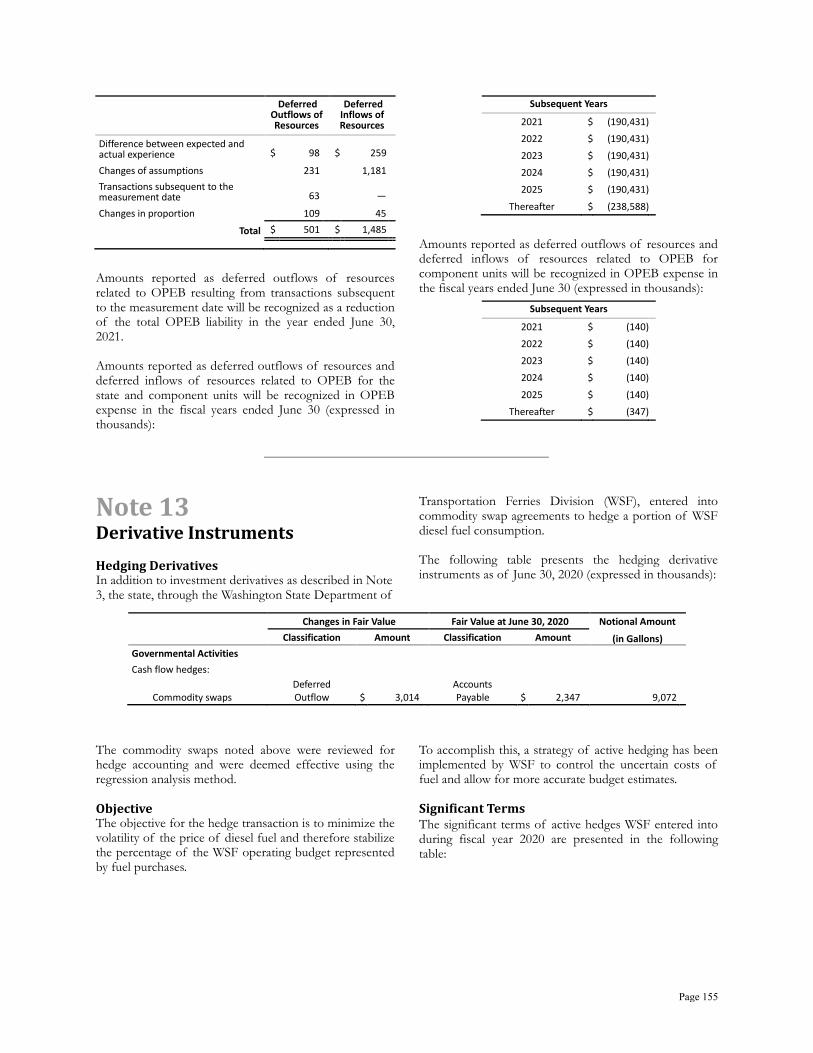
Deferred
Outflows of Resources
Deferred Inflows of Resources
Difference between expected and actual experience $ 98 $ 259
Changes of assumptions 231 1,181 Transactions subsequent to the measurement date 63 —
Changes in proportion 109 45 Total $ 501 $ 1,485
Amounts reported as deferred outflows of resources related to OPEB resulting from transactions subsequent to the measurement date will be recognized as a reduction of the total OPEB liability in the year ended June 30, 2021. Amounts reported as deferred outflows of resources and deferred inflows of resources related to OPEB for the state and component units will be recognized in OPEB expense in the fiscal years ended June 30 (expressed in thousands):
Subsequent Years 2021 $ (190,431) 2022 $ (190,431) 2023 $ (190,431) 2024 $ (190,431) 2025 $ (190,431)
Thereafter $ (238,588)
Amounts reported as deferred outflows of resources and deferred inflows of resources related to OPEB for component units will be recognized in OPEB expense in the fiscal years ended June 30 (expressed in thousands):
Subsequent Years 2021 $ (140) 2022 $ (140) 2023 $ (140) 2024 $ (140) 2025 $ (140)
Thereafter $ (347)
Note 13 Derivative Instruments Hedging Derivatives In addition to investment derivatives as described in Note 3, the state, through the Washington State Department of
Transportation Ferries Division (WSF), entered into commodity swap agreements to hedge a portion of WSF diesel fuel consumption. The following table presents the hedging derivative instruments as of June 30, 2020 (expressed in thousands):
Changes in Fair Value Fair Value at June 30, 2020 Notional Amount Classification Amount Classification Amount (in Gallons) Governmental Activities Cash flow hedges: Deferred Accounts
Commodity swaps Outflow $ 3,014 Payable $ 2,347 9,072
The commodity swaps noted above were reviewed for hedge accounting and were deemed effective using the regression analysis method.
Objective The objective for the hedge transaction is to minimize the volatility of the price of diesel fuel and therefore stabilize the percentage of the WSF operating budget represented by fuel purchases.
To accomplish this, a strategy of active hedging has been implemented by WSF to control the uncertain costs of fuel and allow for more accurate budget estimates. Significant Terms The significant terms of active hedges WSF entered into during fiscal year 2020 are presented in the following table:
Page 155
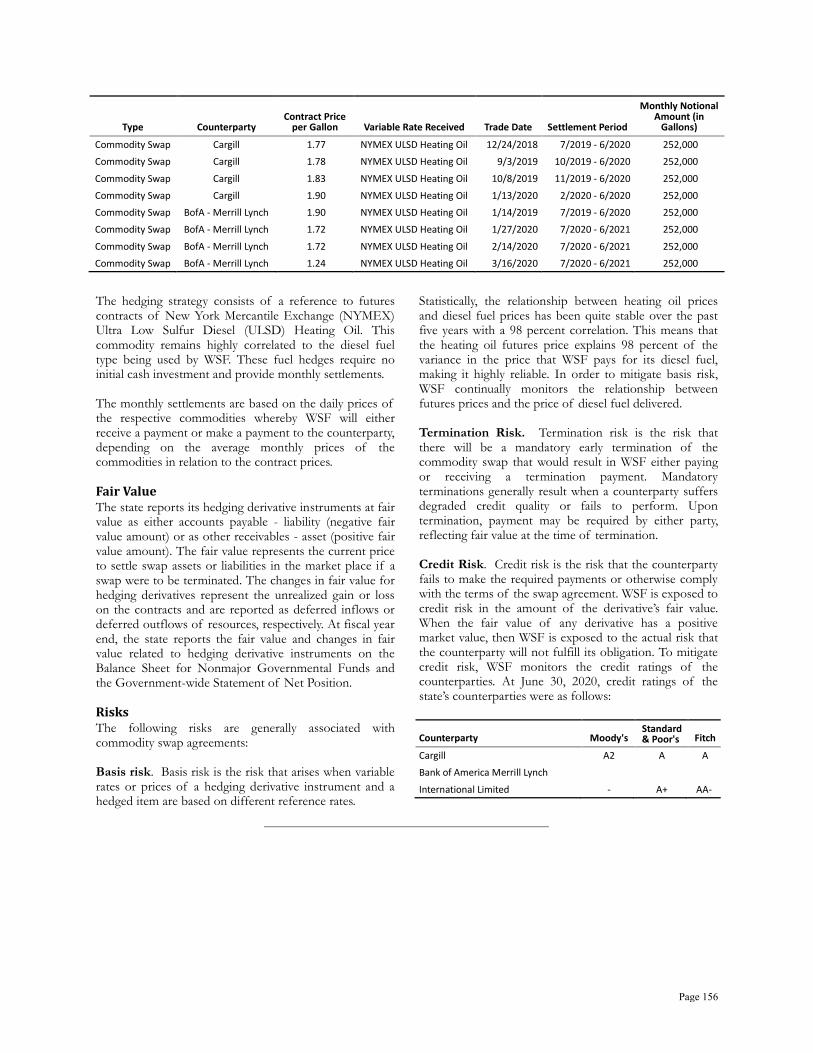
Type Counterparty Contract Price
per Gallon Variable Rate Received Trade Date Settlement Period
Monthly Notional Amount (in
Gallons) Commodity Swap Cargill 1.77 NYMEX ULSD Heating Oil 12/24/2018 7/2019 - 6/2020 252,000 Commodity Swap Cargill 1.78 NYMEX ULSD Heating Oil 9/3/2019 10/2019 - 6/2020 252,000 Commodity Swap Cargill 1.83 NYMEX ULSD Heating Oil 10/8/2019 11/2019 - 6/2020 252,000 Commodity Swap Cargill 1.90 NYMEX ULSD Heating Oil 1/13/2020 2/2020 - 6/2020 252,000 Commodity Swap BofA - Merrill Lynch 1.90 NYMEX ULSD Heating Oil 1/14/2019 7/2019 - 6/2020 252,000 Commodity Swap BofA - Merrill Lynch 1.72 NYMEX ULSD Heating Oil 1/27/2020 7/2020 - 6/2021 252,000 Commodity Swap BofA - Merrill Lynch 1.72 NYMEX ULSD Heating Oil 2/14/2020 7/2020 - 6/2021 252,000 Commodity Swap BofA - Merrill Lynch 1.24 NYMEX ULSD Heating Oil 3/16/2020 7/2020 - 6/2021 252,000
The hedging strategy consists of a reference to futures contracts of New York Mercantile Exchange (NYMEX) Ultra Low Sulfur Diesel (ULSD) Heating Oil. This commodity remains highly correlated to the diesel fuel type being used by WSF. These fuel hedges require no initial cash investment and provide monthly settlements. The monthly settlements are based on the daily prices of the respective commodities whereby WSF will either receive a payment or make a payment to the counterparty, depending on the average monthly prices of the commodities in relation to the contract prices. Fair Value The state reports its hedging derivative instruments at fair value as either accounts payable - liability (negative fair value amount) or as other receivables - asset (positive fair value amount). The fair value represents the current price to settle swap assets or liabilities in the market place if a swap were to be terminated. The changes in fair value for hedging derivatives represent the unrealized gain or loss on the contracts and are reported as deferred inflows or deferred outflows of resources, respectively. At fiscal year end, the state reports the fair value and changes in fair value related to hedging derivative instruments on the Balance Sheet for Nonmajor Governmental Funds and the Government-wide Statement of Net Position. Risks The following risks are generally associated with commodity swap agreements: Basis risk. Basis risk is the risk that arises when variable rates or prices of a hedging derivative instrument and a hedged item are based on different reference rates.
Statistically, the relationship between heating oil prices and diesel fuel prices has been quite stable over the past five years with a 98 percent correlation. This means that the heating oil futures price explains 98 percent of the variance in the price that WSF pays for its diesel fuel, making it highly reliable. In order to mitigate basis risk, WSF continually monitors the relationship between futures prices and the price of diesel fuel delivered. Termination Risk. Termination risk is the risk that there will be a mandatory early termination of the commodity swap that would result in WSF either paying or receiving a termination payment. Mandatory terminations generally result when a counterparty suffers degraded credit quality or fails to perform. Upon termination, payment may be required by either party, reflecting fair value at the time of termination. Credit Risk. Credit risk is the risk that the counterparty fails to make the required payments or otherwise comply with the terms of the swap agreement. WSF is exposed to credit risk in the amount of the derivative’s fair value. When the fair value of any derivative has a positive market value, then WSF is exposed to the actual risk that the counterparty will not fulfill its obligation. To mitigate credit risk, WSF monitors the credit ratings of the counterparties. At June 30, 2020, credit ratings of the state’s counterparties were as follows:
Counterparty Moody's Standard & Poor's Fitch
Cargill A2 A A Bank of America Merrill Lynch International Limited - A+ AA-
Page 156
Note 14 Tax Abatements During fiscal year 2020, the state of Washington provided material tax abatements through eight programs, five of which are only available to businesses in the aerospace industry. Data Center Server Equipment and Power Infrastructure Tax Exemption Per Revised Code of Washington (RCW) 82.08.986 and 82.12.986, the purchase or use of server equipment and power infrastructure in data centers within the state of Washington, along with certain related labor and services charges, may be exempt from sales and use tax to encourage immediate investments in technology facilities. The Department of Revenue (DOR) will issue an exemption certificate, which the buyer must present to the seller at the time of the sale in order to make eligible tax-exempt purchases. Within six years of the date that the exemption certificate is issued, the certificate holder must establish that net employment at the computer data center has increased by a minimum of 35 family wage positions or 3 family wage employment positions for each 20,000 square feet or less of space. Family wage employment positions are new permanent employment positions requiring 40 hours of weekly work, or their equivalent, at the eligible computer data center, and receiving a wage equivalent to or greater than 150 percent of the per capita personal income of the county in which the data center is located. All previously exempted sales and use tax are immediately due and payable for a qualifying business that does not meet these requirements. High-Technology Business Tax Deferral Program Chapter 82.63 RCW provides a deferral and ultimate waiver of sales and use tax to encourage the creation of high-wage, high-skilled jobs in the state of Washington. The deferral applies to sales and use tax arising from the construction or expansion of a qualified research and development facility or a pilot scale manufacturing facility used in the fields of advanced computing, advanced materials, biotechnology, electronic device technology, or environmental technology. Businesses must apply for a deferral certificate prior to being issued a building permit for the project(s) or before taking possession of machinery and equipment. Eligible projects will receive a sales and use tax deferral certificate issued by DOR, which allows vendors and contractors to sell to the approved business without charging sales tax. An annual survey must be filed by May 31 of the year in which the project is certified and for the following seven
years. If the investment project is used for any other purpose at any time during the calendar year in which the investment is certified as operationally complete, or during the next seven calendar years, a portion of the deferred taxes must be repaid immediately. The portion due is determined by a sliding scale ranging from 100 percent recapture in the year the project is operationally complete to 12.5 percent recapture in year eight. Multi-Unit Urban Housing Tax Exemption RCW 84.14.020 allows for a property tax exemption to improve residential opportunities, including affordable housing opportunities, in urban centers. In order to qualify for the exemption, the new or rehabilitated multiple-housing unit must be located in a targeted residential area designated by the city or county, provide for a minimum of 50 percent of the space for permanent residential occupancy, meet all construction and development regulations, and be completed within three years of the application approval date. To qualify as a rehabilitated unit, the property must also fail to comply with one or more standards of the applicable state or local building or housing codes on or after July 23, 1995. The property owner must apply for the exemption certificate with the city or county where the property is located before beginning construction. If the application is approved, the exemption certificate will be issued after the owner certifies all requirements have been met upon completion of the project. If the application for a tax exemption certificate was submitted before July 22, 2007, the property is exempt for ten years. If the application for a tax exemption certificate was submitted on or after July 22, 2007, the property is exempt for eight years, unless the applicant commits to renting or selling at least 20 percent of the units as affordable housing units to low and moderate-income households, making it exempt for 12 years. Each tax exemption certificate recipient must submit an annual report to the city or county. If a portion of the property no longer meets the exemption requirements, the tax exemption is canceled and a lien will be placed on the land for the additional real property tax on the value of the non-qualifying improvements plus a 20 percent penalty and interest. Aerospace Incentives The state of Washington provides tax abatement programs to the aerospace industry to encourage the industry’s continued presence in the state. RCW 82.04.260(11), 82.04.290(3), and 82.04.250(3) allow for a reduced business and occupation (B&O) tax for manufacturers and processors for hire of commercial airplanes, component parts of commercial airplanes, or tooling designed for use in manufacturing commercial airplanes or components; non-manufacturers engaged in the business of aerospace product development; and
Page 157

certificated Federal Acquisition Regulation (FAR) repair stations making retail sales. RCW 82.04.4461 allows a B&O tax credit equal to 1.5 percent of expenditures on aerospace product development performed within Washington. A business claiming the credit must file an annual report with DOR. Per RCW 82.04.4463, manufacturers and processors for hire of commercial airplanes or their component parts and aerospace tooling manufacturers are eligible for a B&O tax credit equal to the property and leasehold taxes paid on certain buildings, land, and the increased value from certain building renovations or expansions, as well as a portion of property taxes paid on certain machinery and equipment. The credit for machinery and equipment is equal to the amount of property taxes paid on the machinery and equipment multiplied by a fraction as prescribed in the RCW. Eligibility for the credit requires the building, land, and/or machinery and equipment be used exclusively in manufacturing commercial airplanes or their components or in manufacturing tooling specifically designed for use in manufacturing commercial airplanes or their components. A business claiming the credit must file an annual report with DOR. Non-manufacturers engaged in the business of aerospace product development and certificated FAR repair stations making retail sales are eligible for a B&O tax credit equal to property and leasehold taxes on certain buildings, land, and the increased value of renovated buildings, and qualifying computer equipment and peripherals under RCW 82.04.4463. Eligibility for the credit requires the
building, land, and/or computer equipment and peripherals be used exclusively in aerospace product development or in providing aerospace services. A business claiming the credit must file an annual report with DOR. The purchase and use of computer hardware, software, or peripherals, including installation charges, is exempt from sales and use tax per RCW 82.08.975 and 82.12.975 if the item is used primarily in developing, designing, and engineering aerospace products. The purchaser must present a Buyers' Retail Sales Tax Exemption Certificate to the seller at the time of purchase. The purchase of goods and services, including labor, for the construction of new buildings used to manufacture commercial airplanes or fuselages or wings of commercial airplanes are exempt from sales and use tax per RCW 82.08.980 and 82.12.980. The exemption also applies to new buildings or parts of new buildings used for storing raw materials or finished products used to manufacture commercial airplanes and certain commercial airplane parts. Port districts, political subdivisions, or municipal corporations may also use the sales and use tax exemption when constructing new facilities to lease to these manufacturers. The eligible purchaser must present a Buyers' Retail Sales Tax Exemption Certificate to the seller at the time of purchase. The amount of sales and use tax abated from this exemption cannot be disclosed because there are fewer than three taxpayers that received the exemption in fiscal year 2020 per RCW 82.32.330(2). The following table shows the amount of taxes abated during fiscal year 2020 (expressed in thousands):
Tax Abatement Program Amount of Taxes
Abated
Data center server equipment and power infrastructure exemption $ 33,390 High-technology business tax deferral program 31,873 Multi-unit urban housing tax exemption 28,434 Aerospace incentives:
Reduced B&O tax rate 65,509 Aerospace product development expenditures credit 70,408 Aerospace business facilities credit 35,939 Computer hardware, software, and peripherals exemption 6,037
TOTAL $ 271,590
Page 158
Note 15 Commitments and Contingencies
A. CAPITAL COMMITMENTS
Outstanding commitments related to state infrastructure and facility construction, improvement, and/or renovation totaled $1.84 billion at June 30, 2020.
B. ENCUMBRANCES
Encumbrances, which represent commitments related to unperformed contracts for goods or services, are included in restricted, committed, or assigned fund balance, as appropriate. Operating encumbrances lapse at the end of the applicable appropriation period. Capital outlay encumbrances lapse at the end of the biennium unless reappropriated by the Legislature in the ensuing biennium. Encumbrances outstanding against continuing appropriations at the end of fiscal year 2020 are expressed in thousands):
General Fund $ 179,961 Higher Education Special Revenue Fund 15,935 Nonmajor Governmental Funds 1,522,117
C. SUMMARY OF SIGNIFICANT LITIGATION
Pending Litigation The state and its agencies are parties to numerous routine legal proceedings that normally occur in governmental operations. In addition, at any given point, there may be numerous lawsuits involving the implementation, reduction, or elimination of specific state programs that could significantly impact expenditures and revenues, and potentially have future budgetary impact. This summary considers significant litigation not covered by tort insurance. Tort case liabilities are disclosed in Note 7.E, Claims and Judgments, Risk Management. The state is the defendant in a number of cases alleging inadequate funding of state programs or services, as well as various assertions by unions representing individual service providers. Claims include insufficient funding for the provision of mental health services to Medicaid eligible children; insufficient competency services at state hospitals; and back wages due to individual providers. Collective claims in these programmatic and service cases exceed $35 million. In addition, adverse rulings in some of these cases could result in significant future costs. The state is contesting these lawsuits and the outcomes are uncertain at this time.
Tobacco Settlement In November 1998, Washington joined 45 other states in a Master Settlement Agreement (MSA) with the nation’s largest tobacco manufacturers to provide restitution for monies spent under health care programs for the treatment of smoking-related illnesses. The annual payments to each state under the MSA are subject to a number of adjustments, including the nonparticipating manufacturer (NPM) adjustment. The NPM adjustment is a downward adjustment that is applicable to any state found by an arbitration panel not to have diligently enforced the qualifying statute. The amount of the available adjustment is calculated every year by Price Waterhouse Coopers and is typically $1.25 billion. States found not diligent share the costs of that downward adjustment and the adjustment is applied against the next annual MSA payment. No state can lose more than its entire annual payment. For every annual MSA payment cycle since 2006, the participating manufacturers have withheld the amount of the available NPM adjustment from their MSA payments claiming all of the states were not diligent, depositing the amount of the available adjustment into a Disputed Payments Account. For Washington, the amount withheld from each payment has been in the range of approximately $17.5 million to $22.2 million. The states are required to sue the participating manufacturers to recover the withheld amounts. The withholding in 2006 challenged the states' diligence for calendar year 2003. That challenge marked the first time the NPM adjustment procedure was involved and led to diligent enforcement arbitrations. The arbitration occured in two stages: a national hearing on "common issues" and then state's specific case. During the 2003 NPM adjustment dispute, 22 states settled their dispute. The participating manufacturers agreed to a 54 percent reduction in their annual MSA payments and to additional NPM enforcement obligations. On September 11, 2013, the arbitration panel issued a decision in Washington's favor, unanimously concluding that Washington proved that it diligently enforced the qualifying statute during calendar year 2003 and therefore, for that calendar year, is not subject to an NPM adjustment under the MSA. As a result of that decision, in fiscal year 2014, Washington received approximately $14 million more than it would have otherwise received. The 2004 NPM adjustment dispute is currently underway. The common issues trial was completed in June 2017 and Washington's state-specific hearing was completed in April 2018. The final state's hearing was completed in July 2019. All diligence determinations are embargoed until
Page 159

decisions for all states are made and all decisions are released simultaneously. In September 2019, one of the states' three elected arbitration panel members passed away before any decisions were finalized. The states subsequently selected a replacement who will review all filings and transcripts and then participate in the Panel's decisions. Washington faces a potential downward NPM adjustment in its 2020 MSA payment between $14 and $137 million for the year 2004 if found not diligent. If Washington wins the 2004 dispute, the state will receive its full MSA payment plus the $14.5 million that was withheld in 2007 and the earnings on that amount from the Disputed Payments Account.
D. FEDERAL ASSISTANCE
The state has received federal financial assistance for specific purposes that are generally subject to review or audit by the grantor agencies. Entitlement to this assistance is generally conditional upon compliance with the terms and conditions of grant agreements and applicable federal regulations, including the expenditure of assistance for allowable purposes. Any disallowance resulting from a review or audit may become a liability of the state. The state estimates and recognizes claims and judgments liabilities for disallowances when determined by the grantor agency or for probable disallowances based on experience pertaining to these grants; however, these recognized liabilities and any unrecognized disallowances are considered immaterial to the state’s overall financial condition.
E. ARBITRAGE REBATE
Rebatable arbitrage is defined by the Internal Revenue Service Code Section 148 as earnings on investments purchased from the gross proceeds of a bond issue that are in excess of the amount that would have been earned if the investments were invested at a yield equal to the yield on the bond issue. The rebatable arbitrage must be paid to the federal government. The state estimates that rebatable arbitrage liability, if any, will be immaterial to its overall financial condition.
F. FINANCIAL GUARANTEES
School District Credit Enhancement Program In accordance with chapter 39.98 RCW (School District Credit Enhancement Program), the state has guaranteed outstanding voter-approved general obligation bonds of
school districts within the state in the amount of $15.52 billion at June 30, 2020. The guarantees extend through the life of the bonds, with a final maturity date of the longest series in 2043. In the event that a school district has insufficient funds to make a required debt service payment on a guaranteed bond, the state is required to transfer sufficient funds to make the payment. School districts for which the state has made all or part of a debt service payment shall reimburse the state for all money drawn on their behalf, as well as interest and penalties. The state has not paid debt service on any school debt since the inception of the program in 2000.
G. COLUMBIA RIVER CROSSING
The Washington State Department of Transportation (WSDOT) and the Oregon Department of Transportation (ODOT) worked together, along with federal and local agencies, on the Columbia River Crossing (CRC) project. The CRC project was a bridge, transit, highway, bicycle, and pedestrian improvement project intended to replace the existing two highway spans on Interstate 5 (I-5) across the Columbia River, along with new interchanges on both the Washington and Oregon sides of the river. It also included extension of light rail public transit into Vancouver, Washington. In 2014, the CRC project was shut down due to lack of funding by both the Washington and Oregon legislatures. During the project, WSDOT expended approximately $54 million in federal funds, of which $15 million was jointly awarded to Washington and Oregon. Under Federal Highway Administration (FHWA) policy, failure to advance a project to the construction phase within 10 years of the initial obligation of funds could trigger a requirement to repay federal funds used on the project. FHWA has granted Washington and Oregon an extension to September 30, 2024. In 2019, the Washington Legislature provided $35 million to establish a project office jointly staffed by Washington and Oregon. The funding also covers pre-design activities to replace the I-5 Columbia River bridge crossing. The Oregon Transportation Commission has allocated $9 million as the state’s initial contribution to restarting the work. In April 2020, WSDOT and ODOT signed a funding and administration agreement committing to jointly approve expenditures and equally fund the program. A program administrator was hired in June 2020 to act on behalf of both states. In August 2020, the Oregon Transportation Commission approved an additional $4 million to be obligated to the
Page 160

program. WSDOT and ODOT have initiated program development efforts. Community engagement, preliminary engineering, and data collection are scheduled to begin in fall 2020.
H. OTHER COMMITMENTS AND CONTINGENCIES
Local Option Capital Asset Lending Program On September 1, 1998, the state lease-purchase program was extended to local governments seeking low cost financing of essential equipment and, in the year 2000, for real estate. The Local Option Capital Assets Lending (LOCAL) program allows local governments to pool their financing requests together with Washington state agencies in Certificates of Participation (COPs). Refer to Note 7.B for the state’s COP disclosure. These COPs do not constitute a debt or pledge of the full faith and credit of the state; rather, local governments
pledge their full faith and credit in a general obligation pledge. In the event that any local government fails to make any payment, the state is obligated to withhold an amount sufficient to make such payment from the local government’s share, if any, of state revenues or other amounts authorized or required by law to be distributed by the state to such local government, if otherwise legally permissible. Upon failure of any local government to make a payment, the state is further obligated, to the extent of legally available appropriated funds to make such payment on behalf of such local government. The local government remains obligated to make all COP payments and reimburse the state for any conditional payments. As of June 30, 2020, outstanding COP notes totaled $72.2 million for 127 local governments participating in LOCAL. The state estimates that the LOCAL program liability, if any, will be immaterial to its overall financial condition.
Note 16 Subsequent Events
A. BOND ISSUES
In July 2020, the state issued: • $493.9 million in general obligation bonds to provide
funds to pay and reimburse for various state capital projects.
• $115.0 million in motor vehicle fuel tax and vehicle related fees general obligation bonds to provide funds to pay and reimburse for construction of state and local highway improvements and preservation projects, including those that are identified as Connecting Washington projects.
• $36.5 million in taxable general obligation bonds to provide funds to pay and reimburse for various non-transportation capital projects.
In October 2020, the state issued:
• $105.0 million in general obligation refunding bonds
for the purpose of refunding certain various general obligation bonds of the state.
In September 2020, Western Washington University issued $21.8 million in general revenue refunding bonds to refund, refinance, and restructure debt service.
B. CERTIFICATES OF PARTICIPATION
In July 2020, the state issued $67.4 million in Certificates of Participation (COP), including $12.8 million of taxable COPs. The taxable portion of the COPs will be used fund real property for the benefit of a Local Agency. In October 2020, the state issued $75.2 million in COPs, of which $29.8 million were refunding COPs.
C. CASH DEFEASANCE
In October 2020, the state purchased U.S. government securities and placed them in an escrow account with US Bank to legally defease $10.4 million of fiscal year 2021 debt service from Motor Vehicle Fuel Tax General Obligation Bonds (SR 520 Corridor Program - Toll Revenue), Series 2012C.
D. STATE SUPREME COURT RULING
Article II, Section 19 of the Washington State Constitution prohibits a bill from containing more than one subject and requires the subject to be accurately expressed in the bill title. On October 15, 2020, the Washington Supreme Court struck down Initiative 976 (I-976) as unconstitutional, ruling the measure violated Article II, Section 19.
Page 161

Initiative 976 would repeal, reduce, or remove authority to impose certain vehicle taxes and fees, and would limit annual motor vehicle license fees to $30 with certain exceptions. I-976 passed in November 2019 and was to become effective during fiscal year 2020. However, a lawsuit arguing that I-976 violated the state Constitution was filed. The state began to set aside its portion of car-tab tax money in case the measure was upheld and those funds would have to be refunded. With the Washington Supreme Court ruling, the $136 million state portion that was set aside is now available to spend upon legislative appropriation, mostly on transportation projects.
E. BOEING DECISION
On October 1, 2020, Boeing announced a decision to consolidate the manufacturing of the Boeing 787 in South Carolina and end production of the 787 in the Everett, Washington plant. The immediate impact is estimated at about 1,000 direct jobs lost, consisting of production work on the final assembly line and in fabrication and interior cabin shops, plus support employees. Even before the 787 news, Boeing had announced that it will cut 12,600 jobs in Washington state in calendar year 2020 through a combination of buyouts and layoffs because of the steep aviation downturn due to coronavirus. The full economic impact is unknown, but the effect on the state's business and occupation tax and sales tax revenue is expected beginning in the third quarter of fiscal year 2021.
Page 162

BUDGETARY COMPARISON SCHEDULES
General Fund For the Fiscal Year Ended June 30, 2020 (expressed in thousands) Original Budget Final Budget Actual 2019-21 2019-21 2019-21 Variance with Biennium Biennium Biennium Final Budget
Budgetary Fund Balance, July 1, as restated $ 3,265,160 $ 3,265,160 $ 3,265,160 $ — Resources Taxes 48,881,435 44,702,947 23,366,236 (21,336,711) Licenses, permits, and fees 245,094 254,886 137,138 (117,748) Other contracts and grants 903,905 876,284 325,895 (550,389) Timber sales 7,740 8,241 4,559 (3,682) Federal grants-in-aid 25,740,835 26,619,334 12,456,043 (14,163,291) Charges for services 111,396 111,197 50,340 (60,857) Investment income (loss) 92,309 67,521 39,244 (28,277) Miscellaneous revenue 504,520 484,822 195,943 (288,879) Unclaimed property 178,743 208,584 110,410 (98,174) Transfers from other funds 2,087,173 2,116,426 1,008,686 (1,107,740) Total Resources 82,018,310 78,715,402 40,959,654 (37,755,748) Charges To Appropriations General government 4,666,396 5,055,678 2,472,374 2,583,304 Human services 40,112,938 41,554,134 19,479,551 22,074,583 Natural resources and recreation 902,718 968,834 424,741 544,093 Transportation 150,242 155,489 67,144 88,345 Education 31,757,555 31,122,516 14,884,953 16,237,563 Capital outlays 1,050,822 1,061,795 158,782 903,013 Transfers to other funds 851,816 868,339 522,225 346,114 Total Charges To Appropriations 79,492,487 80,786,785 38,009,770 42,777,015 Excess Available For Appropriation Over (Under) Charges To Appropriations 2,525,823 (2,071,383) 2,949,884 5,021,267
Reconciling Items Bond sale proceeds 375,491 379,030 97,409 (281,621) Issuance premiums — — 1,272 1,272 Assumed reversions 353,704 420,086 — (420,086) Working capital adjustment — — (447,000) (447,000) Noncash activity (net) — — 81,292 81,292 Nonappropriated fund balances — — 184,581 184,581 Changes in reserves (net) — — 118,320 118,320 Total Reconciling Items 729,195 799,116 35,874 (763,242) Budgetary Fund Balance, June 30 $ 3,255,018 $ (1,272,267) $ 2,985,758 $ 4,258,025 The separately submitted report that demonstrates compliance at a legal level of budgetary control is traceable to the Schedule of Revenues, Expenditures and Other Financing Sources (Uses) - Budget and Actual found in the Individual Fund Schedules section.
Page 163

BUDGETARY COMPARISON SCHEDULES
General Fund - Budget to GAAP Reconciliation For the Fiscal Year Ended June 30, 2020 (expressed in thousands) Sources/Inflows of Resources Actual amounts (budgetary basis) "Total Resources"
from the Budgetary Comparison Schedule $ 40,959,654 Differences - budget to GAAP:
The following items are inflows of budgetary resources but are not revenue for financial reporting purposes:
Transfers from other funds (1,008,686) Budgetary fund balance at the beginning of the biennium, as restated (3,265,160) Appropriated loan principal repayment (129)
The following items are not inflows of budgetary resources but are revenue for financial reporting purposes:
Noncash commodities and electronic food stamp benefits 1,452,860 Revenues collected for other governments 129,850 Unanticipated receipts 602,834 Noncash revenues 7,235 Other 57,755
Biennium total revenues 38,936,213 Nonappropriated activity 41,197 Total Revenues (GAAP Basis) as reported on the Statement of Revenues, Expenditures, and Changes in Fund Balances - Governmental Funds $ 38,977,410
Uses/Outflows of Resources Actual amounts (budgetary basis) "Total Charges to Appropriations"
from the Budgetary Comparison Schedule $ 38,009,770 Differences - budget to GAAP:
The following items are outflows of budgetary resources but are not expenditures for financial reporting purposes:
Appropriated transfers to other funds (1,808,559) Other transfers to other funds (522,225) Appropriated loan disbursements (17)
The following items are not outflows of budgetary resources but are recorded as current expenditures for financial reporting purposes:
Noncash commodities and electronic food stamp benefits 1,452,860 Distributions to other governments 129,850 Certificates of participation and capital lease acquisitions 11,640 Expenditures related to unanticipated receipts 602,834 Other 6,981
Biennium total expenditures 37,883,134 Nonappropriated activity 432,321 Total expenditures (GAAP basis) as reported on the Statement of Revenues, Expenditures, and Changes in Fund Balance - Governmental Funds $ 38,315,455
Page 164
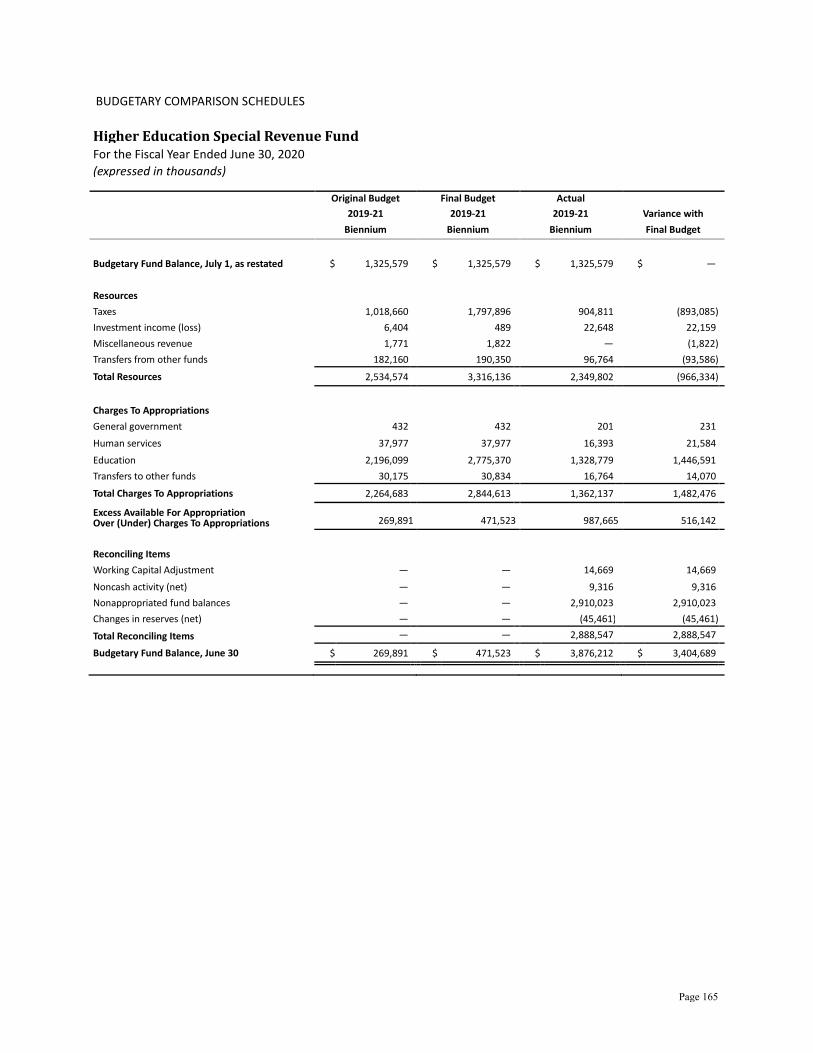
BUDGETARY COMPARISON SCHEDULES
Higher Education Special Revenue Fund For the Fiscal Year Ended June 30, 2020 (expressed in thousands) Original Budget Final Budget Actual 2019-21 2019-21 2019-21 Variance with Biennium Biennium Biennium Final Budget
Budgetary Fund Balance, July 1, as restated $ 1,325,579 $ 1,325,579 $ 1,325,579 $ — Resources Taxes 1,018,660 1,797,896 904,811 (893,085) Investment income (loss) 6,404 489 22,648 22,159 Miscellaneous revenue 1,771 1,822 — (1,822) Transfers from other funds 182,160 190,350 96,764 (93,586) Total Resources 2,534,574 3,316,136 2,349,802 (966,334) Charges To Appropriations General government 432 432 201 231 Human services 37,977 37,977 16,393 21,584 Education 2,196,099 2,775,370 1,328,779 1,446,591 Transfers to other funds 30,175 30,834 16,764 14,070 Total Charges To Appropriations 2,264,683 2,844,613 1,362,137 1,482,476 Excess Available For Appropriation Over (Under) Charges To Appropriations 269,891 471,523 987,665 516,142
Reconciling Items Working Capital Adjustment — — 14,669 14,669 Noncash activity (net) — — 9,316 9,316 Nonappropriated fund balances — — 2,910,023 2,910,023 Changes in reserves (net) — — (45,461) (45,461) Total Reconciling Items — — 2,888,547 2,888,547 Budgetary Fund Balance, June 30 $ 269,891 $ 471,523 $ 3,876,212 $ 3,404,689
Page 165

BUDGETARY COMPARISON SCHEDULES
Higher Education Special Revenue Fund - Budget to GAAP Reconciliation For the Fiscal Year Ended June 30, 2020 (expressed in thousands) Sources/Inflows of Resources Actual amounts (budgetary basis) "Total Resources"
from the Budgetary Comparison Schedule $ 2,349,802 Differences - budget to GAAP:
The following items are inflows of budgetary resources but are not revenue for financial reporting purposes:
Transfers from other funds (96,764) Budgetary fund balance at the beginning of the biennium, as restated (1,325,579)
The following items are not inflows of budgetary resources but are revenue for financial reporting purposes:
Noncash revenues 2 Biennium total revenues 927,461 Nonappropriated activity 6,087,067 Total Revenues (GAAP Basis) as reported on the Statement of Revenues, Expenditures, and Changes in Fund Balances - Governmental Funds $ 7,014,528
Uses/Outflows of Resources Actual amounts (budgetary basis) "Total Charges to Appropriations"
from the Budgetary Comparison Schedule $ 1,362,137 Differences - budget to GAAP:
The following items are outflows of budgetary resources but are not expenditures for financial reporting purposes:
Appropriated transfers to other funds (91,985) Other transfers to other funds (16,764)
Biennium total expenditures 1,253,388 Nonappropriated activity 5,768,278 Total expenditures (GAAP basis) as reported on the Statement of Revenues, Expenditures, and Changes in Fund Balance - Governmental Funds $ 7,021,666
BUDGETARY INFORMATION Notes to Required Supplementary Information
GENERAL BUDGETARY POLICIES AND PROCEDURES
The Governor is required to submit a budget to the Legislature no later than December 20 of the year preceding odd-numbered year sessions of the Legislature. The budget is a proposal for expenditures in the ensuing biennial period based upon anticipated revenues from the sources and rates existing by law at the time of submission of the budget. The Governor may additionally submit, as an appendix to the budget, a proposal for expenditures in the ensuing biennium from
revenue sources derived from proposed changes in existing statutes. The appropriated budget and any necessary supplemental budgets are legally required to be adopted through the passage of appropriation bills by the Legislature and approved by the Governor. Operating appropriations are generally made at the fund/account and agency level; however, in a few cases, appropriations are made at the fund/account and agency/program level. Operating appropriations cover either the entire biennium or a single fiscal year in the biennium. Capital appropriations are biennial and are generally made at the fund/account, agency, and project level. The legal level of budgetary control is at the fund/account, agency, and appropriation level, with administrative controls established at lower levels of detail in certain instances. The accompanying budgetary schedule is not presented at the legal level of budgetary
Page 166

control. This is due to the large number of appropriations within individual agencies that would make such a presentation in the accompanying financial schedule extremely cumbersome. Section 2400.121 of the Governmental Accounting Standards Board Codification of Governmental Accounting and Financial Reporting Standards provides for the preparation of a separate report in these extreme cases. For the state of Washington, a separate report has been prepared for the 2019-21 biennium to illustrate legal budgetary compliance. Appropriated budget versus actual expenditures, and estimated versus actual revenues and other financing sources (uses) for appropriated funds/accounts at agency and appropriation level are presented in the Budget-to-Actual Detail Report for governmental funds. The report is available on line at https://ofm.wa.gov /sites /default /files /public /accounting /report /CAFR /2020/Washington State Budget to Actual Detail Report.pdf. Legislative appropriations are strict legal limits on expenditures; over-expenditures are prohibited. All appropriated and certain nonappropriated funds/accounts are further controlled by the executive branch through the allotment process. This process allocates the expenditure plan into monthly allotments by program, source of funds, and object of expenditure. State law does not preclude the over-expenditure of allotments. Proprietary funds/accounts can earn revenues and incur expenses (i.e., depreciation or cost of goods sold) not covered by the allotment process. Budget estimates are generally made outside the allotment process according to prepared business plans. These proprietary fund/account business plan estimates are adjusted only at the beginning of each fiscal year. Additional fiscal control is exercised through various means. The Office of Financial Management is authorized to estimate revenue and make expenditure allotments based on availability of unanticipated receipts, mainly federal government grant increases made during a fiscal year. Operating encumbrances lapse at the end of the applicable appropriation. Capital outlay encumbrances lapse at the end of the biennium unless reappropriated by the Legislature in the ensuing biennium. Encumbrances outstanding against continuing appropriations at fiscal year-end are reported as restricted, committed, or assigned fund balance. Budgetary Reporting vs. GAAP Reporting
Governmental funds are budgeted materially in conformance with generally accepted accounting
principles. However, the presentation in the accompanying budgetary schedules is different in certain respects from the corresponding Statements of Revenues, Expenditures, and Changes in Fund Balance (governmental operating statement). In the accompanying budgetary schedules, budget and actual expenditures are reported only for appropriated activities. Expenditures are classified based on whether the appropriation is from the operating or capital budget. Expenditures funded by operating budget appropriations are reported as current expenditures classified by the function of the agency receiving the appropriation. Expenditures funded by capital budget appropriations are reported as capital outlays.
However, in the governmental operating statements, all governmental funds are included and expenditures are classified according to what was actually purchased. Capital outlays are capital asset acquisitions such as land, buildings, and equipment. Debt service expenditures are principal and interest payments. Current expenditures are all other governmental fund expenditures classified based on the function of the agency making the expenditures. Certain governmental activities are excluded from the budgetary schedules because they are not appropriated. These include activities designated as nonappropriated by the Legislature. Nonappropriated activities can represent a portion of a fund such as the Higher Education Special Revenue Fund or all of a fund such as the Higher Education Endowment and Tobacco Settlement Securitization Bond Debt Service Funds. Additionally, certain items including federal surplus food commodities, electronic food stamp benefits, and resources collected and distributed to other governments are also excluded because they are not appropriated. Further, certain expenditures are appropriated as operating transfers. These transfers are reported as operating transfers on the budgetary schedules and as expenditures on the governmental operating statements. In the General Fund, Budgetary Fund Balance equals restricted fund balance reduced by a portion that is not available for budgeting, committed, and unassigned fund balances as reported on the Governmental Funds Balance Sheet. In the Higher Education Special Revenue Fund, Budgetary Fund Balance equals the sum of restricted and committed fund balance as reported on the Governmental Funds Balance Sheet. In all other funds except Wildlife and Natural Resources, Budgetary Fund Balance equals total fund balance less nonspendable fund balance as reported on the Governmental Funds Balance Sheet. The Budgetary Fund Balance in the Wildlife and Natural Resources fund is further reduced by a portion of restricted fund balance that is not available for budgeting.
Page 167
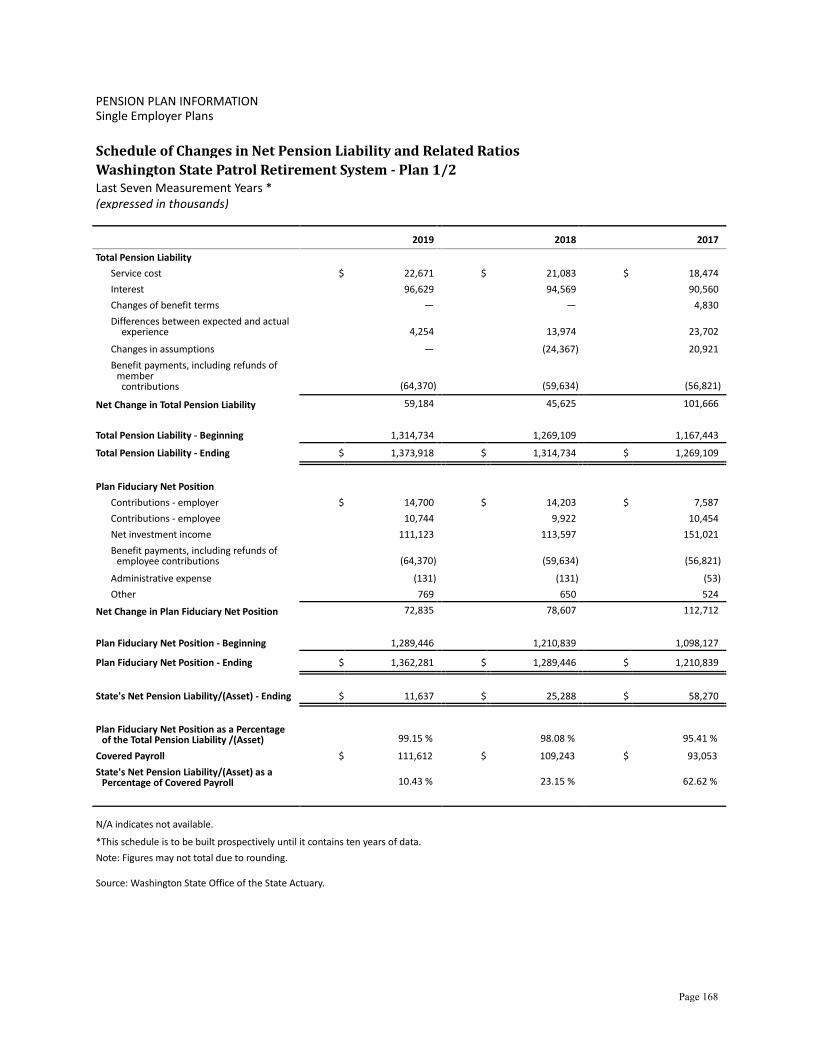
PENSION PLAN INFORMATION Single Employer Plans
Schedule of Changes in Net Pension Liability and Related Ratios
Washington State Patrol Retirement System - Plan 1/2 Last Seven Measurement Years * (expressed in thousands)
2019 2018 2017
Total Pension Liability Service cost $ 22,671 $ 21,083 $ 18,474 Interest 96,629 94,569 90,560 Changes of benefit terms — — 4,830 Differences between expected and actual
experience 4,254 13,974 23,702
Changes in assumptions — (24,367) 20,921 Benefit payments, including refunds of
member contributions (64,370) (59,634) (56,821)
Net Change in Total Pension Liability 59,184 45,625 101,666 Total Pension Liability - Beginning 1,314,734 1,269,109 1,167,443 Total Pension Liability - Ending $ 1,373,918 $ 1,314,734 $ 1,269,109
Plan Fiduciary Net Position
Contributions - employer $ 14,700 $ 14,203 $ 7,587 Contributions - employee 10,744 9,922 10,454 Net investment income 111,123 113,597 151,021 Benefit payments, including refunds of
employee contributions (64,370) (59,634) (56,821)
Administrative expense (131) (131) (53) Other 769 650 524
Net Change in Plan Fiduciary Net Position 72,835 78,607 112,712 Plan Fiduciary Net Position - Beginning 1,289,446 1,210,839 1,098,127 Plan Fiduciary Net Position - Ending $ 1,362,281 $ 1,289,446 $ 1,210,839
State's Net Pension Liability/(Asset) - Ending $ 11,637 $ 25,288 $ 58,270 Plan Fiduciary Net Position as a Percentage
of the Total Pension Liability /(Asset) 99.15 % 98.08 % 95.41 % Covered Payroll $ 111,612 $ 109,243 $ 93,053 State's Net Pension Liability/(Asset) as a
Percentage of Covered Payroll 10.43 % 23.15 % 62.62 %
N/A indicates not available. *This schedule is to be built prospectively until it contains ten years of data. Note: Figures may not total due to rounding.
Source: Washington State Office of the State Actuary.
Page 168

2016 2015 2014 2013
$ 16,534 $ 16,633 $ 18,041 N/A
83,373 80,037 75,249 N/A 1,947 2,258 — N/A
(10,431) 8,883 — N/A 2 17 — N/A
(54,159) (50,075) (47,510) N/A 37,266 57,753 45,780 N/A
1,130,177 1,072,424 1,026,644 N/A
$ 1,167,443 $ 1,130,177 $ 1,072,424 $ 1,026,644
$ 7,044 $ 6,679 $ 6,587 N/A 8,895 6,323 6,555 N/A
25,352 49,046 176,856 N/A
(54,159) (50,075) (47,510) N/A (60) (67) (84) N/A 429 293 509 N/A
(12,499) 12,199 142,913 N/A
1,110,626 1,098,427 955,514 N/A
$ 1,098,127 $ 1,110,626 $ 1,098,427 $ 955,514
$ 69,316 $ 19,551 $ (26,003) $ 71,130
94.06 % 98.27 % 102.42% 93.07% $ 86,660 $ 84,388 $ 85,046 $ 81,895
79.99 % 23.17 % -30.58% 86.86%
Page 169
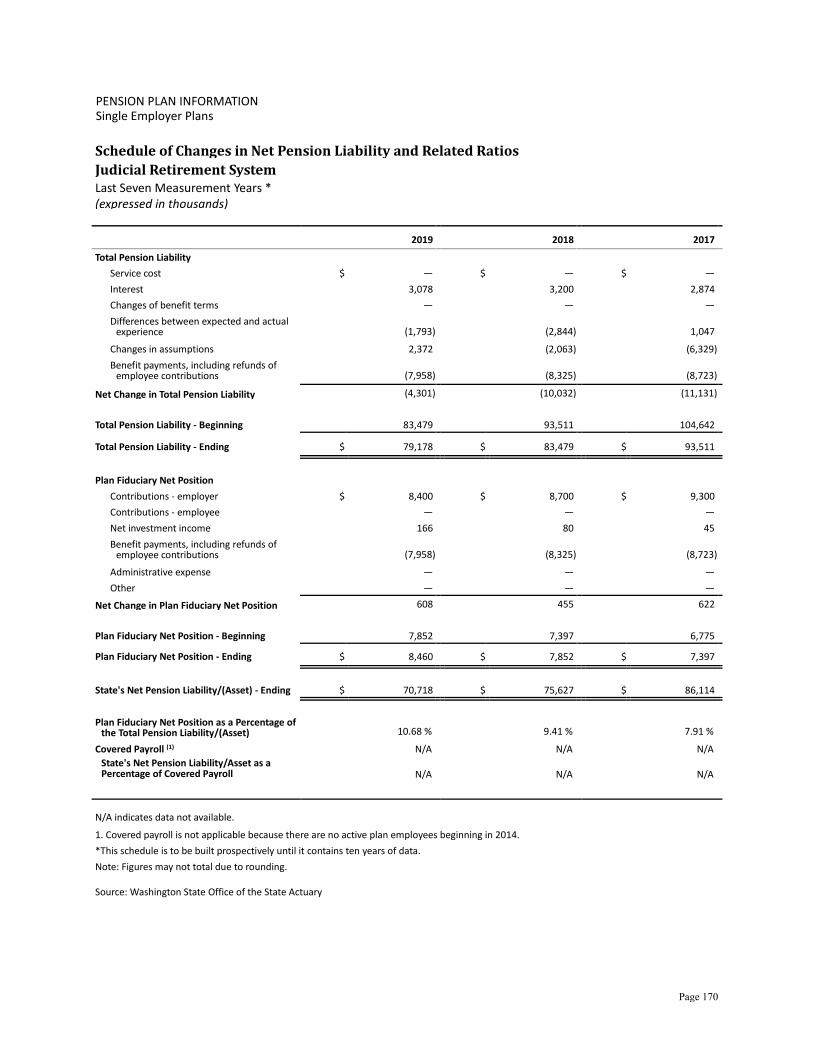
PENSION PLAN INFORMATION Single Employer Plans
Schedule of Changes in Net Pension Liability and Related Ratios
Judicial Retirement System Last Seven Measurement Years * (expressed in thousands)
2019 2018 2017
Total Pension Liability Service cost $ — $ — $ — Interest 3,078 3,200 2,874 Changes of benefit terms — — — Differences between expected and actual
experience (1,793) (2,844) 1,047
Changes in assumptions 2,372 (2,063) (6,329) Benefit payments, including refunds of
employee contributions (7,958) (8,325) (8,723)
Net Change in Total Pension Liability (4,301) (10,032) (11,131) Total Pension Liability - Beginning 83,479 93,511 104,642 Total Pension Liability - Ending $ 79,178 $ 83,479 $ 93,511
Plan Fiduciary Net Position
Contributions - employer $ 8,400 $ 8,700 $ 9,300 Contributions - employee — — — Net investment income 166 80 45 Benefit payments, including refunds of
employee contributions (7,958) (8,325) (8,723)
Administrative expense — — — Other — — —
Net Change in Plan Fiduciary Net Position 608 455 622 Plan Fiduciary Net Position - Beginning 7,852 7,397 6,775 Plan Fiduciary Net Position - Ending $ 8,460 $ 7,852 $ 7,397
State's Net Pension Liability/(Asset) - Ending $ 70,718 $ 75,627 $ 86,114 Plan Fiduciary Net Position as a Percentage of
the Total Pension Liability/(Asset) 10.68 % 9.41 % 7.91 % Covered Payroll (1) N/A N/A N/A
State's Net Pension Liability/Asset as a Percentage of Covered Payroll N/A N/A N/A
N/A indicates data not available. 1. Covered payroll is not applicable because there are no active plan employees beginning in 2014.
*This schedule is to be built prospectively until it contains ten years of data. Note: Figures may not total due to rounding.
Source: Washington State Office of the State Actuary
Page 170
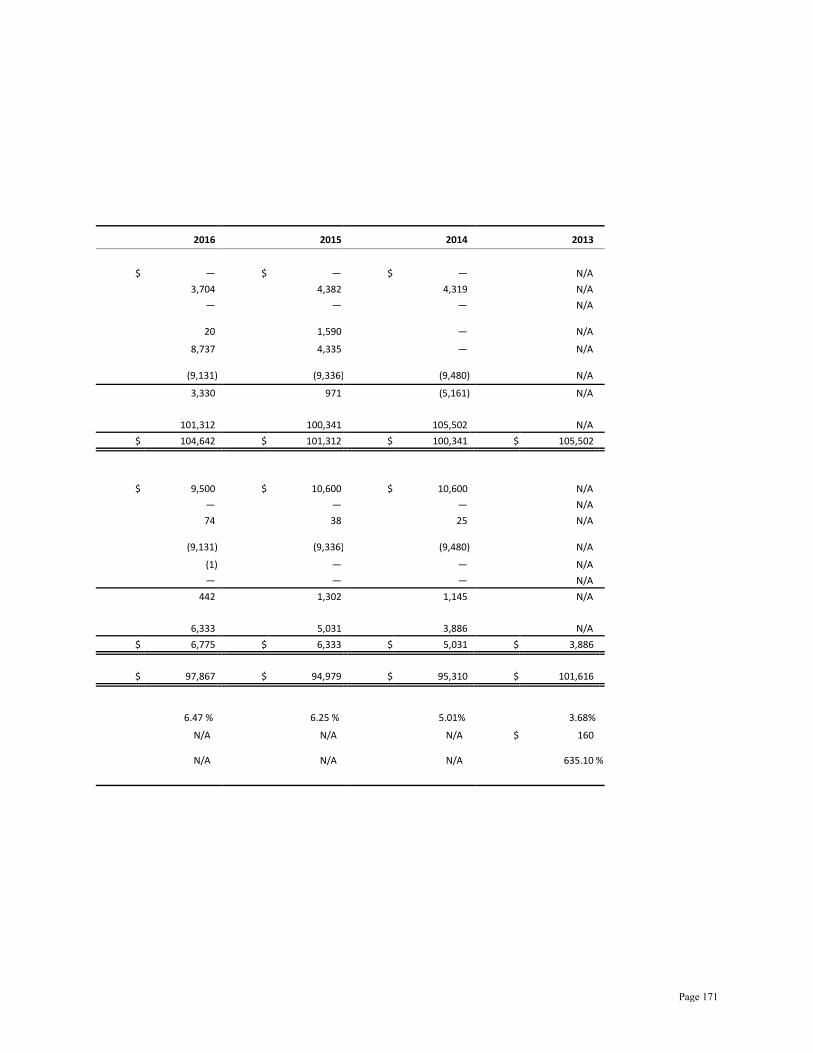
2016 2015 2014 2013
$ — $ — $ — N/A
3,704 4,382 4,319 N/A — — — N/A
20 1,590 — N/A 8,737 4,335 — N/A
(9,131) (9,336) (9,480) N/A 3,330 971 (5,161) N/A
101,312 100,341 105,502 N/A
$ 104,642 $ 101,312 $ 100,341 $ 105,502
$ 9,500 $ 10,600 $ 10,600 N/A
— — — N/A 74 38 25 N/A
(9,131) (9,336) (9,480) N/A (1) — — N/A — — — N/A
442 1,302 1,145 N/A
6,333 5,031 3,886 N/A
$ 6,775 $ 6,333 $ 5,031 $ 3,886
$ 97,867 $ 94,979 $ 95,310 $ 101,616
6.47 % 6.25 % 5.01% 3.68% N/A N/A N/A $ 160
N/A N/A N/A 635.10 %
Page 171

PENSION PLAN INFORMATION Single Employer Plans
Schedule of Changes in Net Pension Liability and Related Ratios
Judges' Retirement Fund Last Seven Measurement Years * (expressed in thousands)
2019 2018 2017
Total Pension Liability Service cost $ — $ — $ — Interest 89 95 88 Changes of benefit terms — — — Differences between expected and actual
experience 161 (39) 194
Changes of assumptions 50 (43) (129) Benefit payments, including refunds of
member contributions (338) (396) (402)
Net Change in Total Pension Liability (38) (383) (249) Total Pension Liability - Beginning 2,465 2,848 3,097 Total Pension Liability - Ending $ 2,427 $ 2,465 $ 2,848 Plan Fiduciary Net Position
Contributions--state $ 500 $ 500 $ 499 Contributions--member — — — Net investment income 17 8 4 Benefit payments, including refunds of
member contributions (338) (396) (402)
Administrative expense — — — Other — — —
Net Change in Plan Fiduciary Net Position 179 112 101
Plan Fiduciary Net Position - Beginning 795 683 582 Plan Fiduciary Net Position - Ending $ 974 $ 795 $ 683
Plan's Net Pension Liability (Asset) - Ending $ 1,453 $ 1,670 $ 2,165
Plan Fiduciary Net Position as a Percentage of
the Total Pension Liability /(Asset) 40.13 % 32.25 % 23.98 % Covered Payroll (1) N/A N/A N/A State's Net Pension Liability/(Asset) as a
Percentage of Covered Payroll N/A N/A N/A
N/A indicates data not available. 1. Covered payroll is not applicable because there are no active plan employees. *This schedule is to be built prospectively until it contains ten years of data. Note: Figures may not total due to rounding.
Source: Washington State Office of the State Actuary
Page 172

2016 2015 2014 2013
$ — $ — $ — N/A
116 138 137 N/A — — — N/A
123 182 — N/A 181 95 — N/A
(440) (444) (444) N/A (20) (29) (307) N/A
3,117 3,146 3,453 N/A
$ 3,097 $ 3,117 $ 3,146 $ 3,453
$ 501 $ — $ — N/A
— — — N/A 6 4 7 N/A
(440) (444) (444) N/A — — — N/A — — — N/A
67 (440) (437) N/A
515 955 1,392 N/A
$ 582 $ 515 $ 955 $ 1,392
$ 2,515 $ 2,602 $ 2,191 $ 2,061
18.79% 16.52% 30.36% 40.31% N/A N/A N/A N/A
N/A N/A N/A N/A
Page 173

PENSION PLAN INFORMATION Single Employer Plans
Schedule of Contributions
Washington State Patrol Retirement System - Plan 1/2 Last Ten Fiscal Years (expressed in thousands)
Year
Actuarially Determined
Contributions
Contributions in Relation to the
Actuarially Determined
Contributions
Contribution Deficiency
(Excess) Covered
Payroll
Contributions as a Percentage of
Covered Payroll 2020 $ 25,167 $ 19,897 $ 5,270 $ 113,704 17.50 % 2019 17,020 14,700 2,320 111,612 13.17 % 2018 16,648 14,203 2,445 109,243 13.00 % 2017 8,179 7,587 592 93,053 8.15 % 2016 7,618 7,044 574 86,660 8.13 % 2015 6,810 6,679 131 84,388 7.91 % 2014 6,677 6,587 90 85,046 7.75 % 2013 2,500 6,478 (3,978) 81,895 7.91 % 2012 2,900 6,454 (3,554) 81,578 7.91 % 2011 2,300 5,251 (2,951) 81,882 6.41 %
Prior to 2014, the Annual Required Contribution amounts are presented for the Actuarially Determined Contributions. Note: Figures may not total due to rounding.
Source: Washington State Office of the State Actuary
Schedule of Contributions
Judicial Retirement System Last Ten Fiscal Years (expressed in thousands)
Year
Actuarially Determined
Contributions
Contributions in Relation to the
Actuarially Determined
Contributions
Contribution Deficiency
(Excess) Covered
Payroll
Contributions as a Percentage of
Covered Payroll 2020 $ 7,643 $ 7,800 $ (157) $ — N/A 2019 7,914 8,400 (486) — N/A 2018 8,317 8,700 (383) — N/A 2017 8,761 9,300 (539) — N/A 2016 8,999 9,500 (501) — N/A 2015 9,132 10,600 (1,468) — N/A 2014 9,205 10,600 (1,395) — N/A 2013 21,700 10,112 11,588 160 6320.00 % 2012 22,600 8,131 14,469 407 1997.79 % 2011 18,600 10,906 7,694 611 1784.94 %
Contributions in relation to the Actuarially Determined Contributions are based on state contributions. Prior to 2014, the Annual Required Contribution amounts are presented for the Actuarially Determined Contributions.
N/A indicates data not available. Beginning in 2014, there are no active members. Note: Figures may not total due to rounding.
Source: Washington State Office of the State Actuary
Page 174

PENSION PLAN INFORMATION Single Employer Plans
Schedule of Contributions
Judges' Retirement Fund
Last Ten Fiscal Years (expressed in thousands)
Year
Actuarially Determined
Contributions
Contributions in Relation to the
Actuarially Determined
Contributions
Contribution Deficiency
(Excess) Covered
Payroll
Contributions as a Percentage of
Covered Payroll 2020 $ 328 $ 400 $ (72) $ — N/A 2019 395 500 (105) — N/A 2018 395 500 (105) — N/A 2017 439 499 (60) — N/A 2016 444 501 (57) — N/A 2015 539 — 539 — N/A 2014 425 — 425 — N/A 2013 400 — 400 — N/A 2012 300 — 300 — N/A 2011 100 — 100 — N/A Contributions in relation to the Actuarially Determined Contributions are based on state contributions. Prior to 2014, the Annual Required Contribution amounts are presented for the Actuarially Determined Contributions. N/A indicates data not available. There are no active employees. Note: Figures may not total due to rounding.
Source: Washington State Office of the State Actuary
Page 175

PENSION PLAN INFORMATION Cost Sharing Employer Plans
Schedule of the State's Proportionate Share of the Net Pension Liability
Public Employees' Retirement System (PERS) Plan 1 Last Six Measurement Years * (expressed in thousands)
2019 2018 2017 2016 2015 2014
State PERS Plan 1 employers' proportion of
the net pension liability/(asset) 41.80 % 41.97 % 41.88 % 41.99 % 41.57 % 42.37 % State PERS Plan 1 employers' proportionate
share of the net pension liability/(asset) $ 1,607,475 $ 1,874,226 $ 1,987,268 $ 2,255,244 $ 2,174,623 $ 2,134,189
Covered payroll of employees participating in PERS Plan 1 $ 54,779 $ 69,330 $ 85,341 $ 103,235 $ 120,686 $ 143,836
Covered payroll of employees participating in PERS Plan 2/3 5,469,217 5,237,495 4,928,806 4,648,843 4,363,171 4,215,934
Covered payroll of employees participating in PSERS Plan 2 321,991 198,511 175,395 155,768 140,977 130,172
Covered Payroll $ 5,845,987 $ 5,505,336 $ 5,189,542 $ 4,907,846 $ 4,624,834 $ 4,489,942
State PERS Plan 1 employers' proportionate
share of the net pension liability/(asset) as a percentage of its covered payroll 27.50 % 34.04 % 38.29 % 45.95 % 47.02 % 47.53 %
Plan fiduciary net position as a percentage
of the total pension liability/(asset) 67.12 % 63.22 % 61.24 % 57.03 % 59.10 % 61.19 %
* This schedule is to be built prospectively until it contains ten years of data.
Page 176

Schedule of the State's Proportionate Share of the Net Pension Liability
Public Employees' Retirement System (PERS) Plan 2/3 Last Six Measurement Years * (expressed in thousands)
2019 2018 2017 2016 2015 2014
State PERS Plan 2/3 employers' proportion
of the net pension liability/(asset) 50.50 % 50.41 % 50.20 % 49.72 % 49.10 % 49.27 % State PERS Plan 2/3 employers'
proportionate share of the net pension liability/(asset) $ 490,544 $ 860,776 $ 1,744,067 $ 2,503,313 $ 1,754,418 $ 995,856
State PERS Plan 2/3 employers' covered payroll $ 5,469,217 $ 5,237,495 $ 4,928,806 $ 4,648,843 $ 4,363,171 $ 4,215,934
State PERS Plan 2/3 employers' proportionate share of the net pension liability/(asset) as a percentage of its covered payroll 8.97 % 16.43 % 35.39 % 53.85 % 40.21 % 23.62 %
Plan fiduciary net position as a percentage
of the total pension liability/(asset) 97.77 % 95.77 % 90.97 % 85.82 % 89.20 % 93.29 %
* This schedule is to be built prospectively until it contains ten years of data.
PENSION PLAN INFORMATION Cost Sharing Employer Plans
Schedule of the State's Proportionate Share of the Net Pension Liability
Teachers' Retirement System (TRS) Plan 1 Last Six Measurement Years * (expressed in thousands)
2019 2018 2017 2016 2015 2014
State TRS Plan 1 employers' proportion of the
net pension liability/(asset) 1.09 % 1.10 % 1.03 % 0.97 % 0.86 % 0.78 % State TRS Plan 1 employers' proportionate
share of the net pension liability/(asset) $ 27,102 $ 32,177 $ 31,172 $ 33,026 $ 27,186 $ 22,924 Covered payroll of employees participating in TRS Plan 1 $ 1,557 $ 1,893 $ 2,475 $ 5,735 $ 3,913 $ 4,611 Covered payroll of employees participating in TRS Plan 2/3 43,082 61,292 52,534 41,803 33,705 25,673
Covered Payroll $ 44,639 $ 63,185 $ 55,009 $ 47,538 $ 37,618 $ 30,284
State TRS Plan 1 employers' proportionate
share of the net pension liability/(asset) as a percentage of its covered payroll 60.71 % 50.93 % 56.67 % 69.47 % 72.27 % 75.70 %
Plan fiduciary net position as a percentage of
the total pension liability/(asset) 70.37 % 66.52 % 65.58 % 62.07 % 65.70 % 68.77 %
* This schedule is to be built prospectively until it contains ten years of data.
Page 177

Schedule of the State's Proportionate Share of the Net Pension Liability Teachers' Retirement System (TRS) Plan 2/3 Last Six Measurement Years * (expressed in thousands)
2019 2018 2017 2016 2015 2014
State TRS Plan 2/3 employers' proportion of
the net pension liability/(asset) 1.06 % 1.06 % 0.96 % 0.87 % 0.72 % 0.59 % State TRS Plan 2/3 employers' proportionate
share of the net pension liability/(asset) $ 6,389 $ 4,757 $ 8,873 $ 11,896 $ 6,107 $ 1,913 State TRS Plan 2/3 employers' covered payroll
$ 43,082 $ 61,292 $ 52,534 $ 41,803 $ 33,705 $ 25,673 State PERS Plan 2/3 employers'
proportionate share of the net pension liability/(asset) as a percentage of its covered payroll
14.83 % 7.76 % 16.89 % 28.46 % 18.12 % 7.45 % Plan fiduciary net position as a percentage of
the total pension liability/(asset) 96.36 % 96.88 % 93.14 % 88.72 % 92.48 % 96.81 %
* This schedule is to be built prospectively until it contains ten years of data.
Page 178
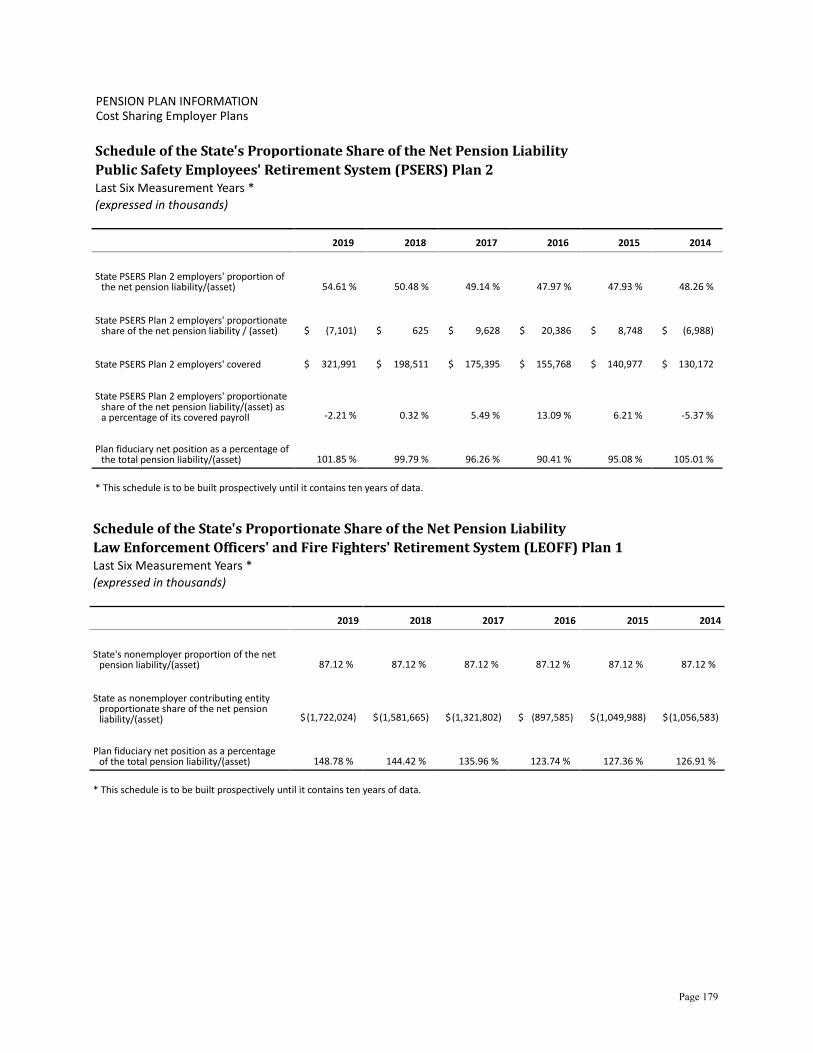
PENSION PLAN INFORMATION Cost Sharing Employer Plans
Schedule of the State's Proportionate Share of the Net Pension Liability
Public Safety Employees' Retirement System (PSERS) Plan 2 Last Six Measurement Years * (expressed in thousands)
2019 2018 2017 2016 2015 2014
State PSERS Plan 2 employers' proportion of
the net pension liability/(asset) 54.61 % 50.48 % 49.14 % 47.97 % 47.93 % 48.26 % State PSERS Plan 2 employers' proportionate
share of the net pension liability / (asset) $ (7,101) $ 625 $ 9,628 $ 20,386 $ 8,748 $ (6,988) State PSERS Plan 2 employers' covered payroll
$ 321,991 $ 198,511 $ 175,395 $ 155,768 $ 140,977 $ 130,172 State PSERS Plan 2 employers' proportionate
share of the net pension liability/(asset) as a percentage of its covered payroll -2.21 % 0.32 % 5.49 % 13.09 % 6.21 % -5.37 %
Plan fiduciary net position as a percentage of
the total pension liability/(asset) 101.85 % 99.79 % 96.26 % 90.41 % 95.08 % 105.01 %
* This schedule is to be built prospectively until it contains ten years of data.
Schedule of the State's Proportionate Share of the Net Pension Liability
Law Enforcement Officers' and Fire Fighters' Retirement System (LEOFF) Plan 1 Last Six Measurement Years * (expressed in thousands)
2019 2018 2017 2016 2015 2014
State's nonemployer proportion of the net
pension liability/(asset) 87.12 % 87.12 % 87.12 % 87.12 % 87.12 % 87.12 % State as nonemployer contributing entity
proportionate share of the net pension liability/(asset) $ (1,722,024) $ (1,581,665) $ (1,321,802) $ (897,585) $ (1,049,988) $ (1,056,583)
Plan fiduciary net position as a percentage
of the total pension liability/(asset) 148.78 % 144.42 % 135.96 % 123.74 % 127.36 % 126.91 %
* This schedule is to be built prospectively until it contains ten years of data.
Page 179
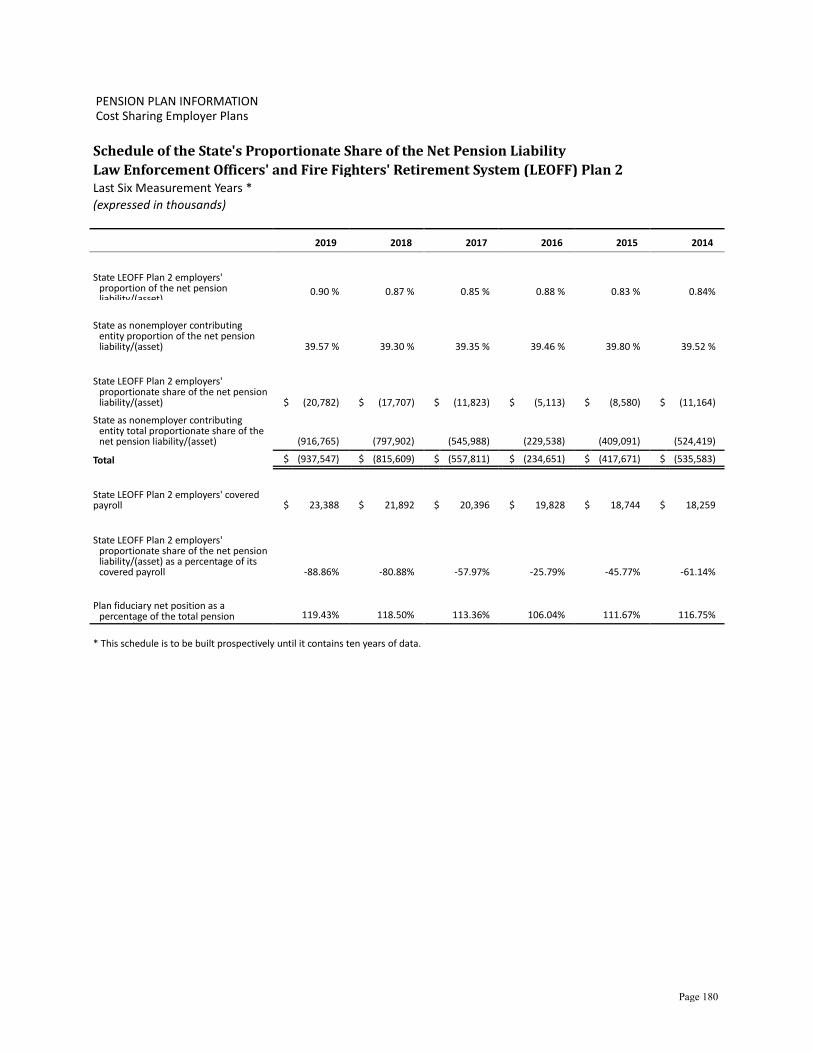
PENSION PLAN INFORMATION Cost Sharing Employer Plans
Schedule of the State's Proportionate Share of the Net Pension Liability
Law Enforcement Officers' and Fire Fighters' Retirement System (LEOFF) Plan 2 Last Six Measurement Years * (expressed in thousands)
2019 2018 2017 2016 2015 2014
State LEOFF Plan 2 employers'
proportion of the net pension liability/(asset)
0.90 % 0.87 % 0.85 % 0.88 % 0.83 % 0.84% State as nonemployer contributing
entity proportion of the net pension liability/(asset) 39.57 % 39.30 % 39.35 % 39.46 % 39.80 % 39.52 %
State LEOFF Plan 2 employers'
proportionate share of the net pension liability/(asset) $ (20,782) $ (17,707) $ (11,823) $ (5,113) $ (8,580) $ (11,164)
State as nonemployer contributing entity total proportionate share of the net pension liability/(asset) (916,765) (797,902) (545,988) (229,538) (409,091) (524,419)
Total $ (937,547) $ (815,609) $ (557,811) $ (234,651) $ (417,671) $ (535,583)
State LEOFF Plan 2 employers' covered payroll $ 23,388 $ 21,892 $ 20,396 $ 19,828 $ 18,744 $ 18,259 State LEOFF Plan 2 employers'
proportionate share of the net pension liability/(asset) as a percentage of its covered payroll -88.86% -80.88% -57.97% -25.79% -45.77% -61.14%
Plan fiduciary net position as a
percentage of the total pension liability/(asset)
119.43% 118.50% 113.36% 106.04% 111.67% 116.75%
* This schedule is to be built prospectively until it contains ten years of data.
Page 180
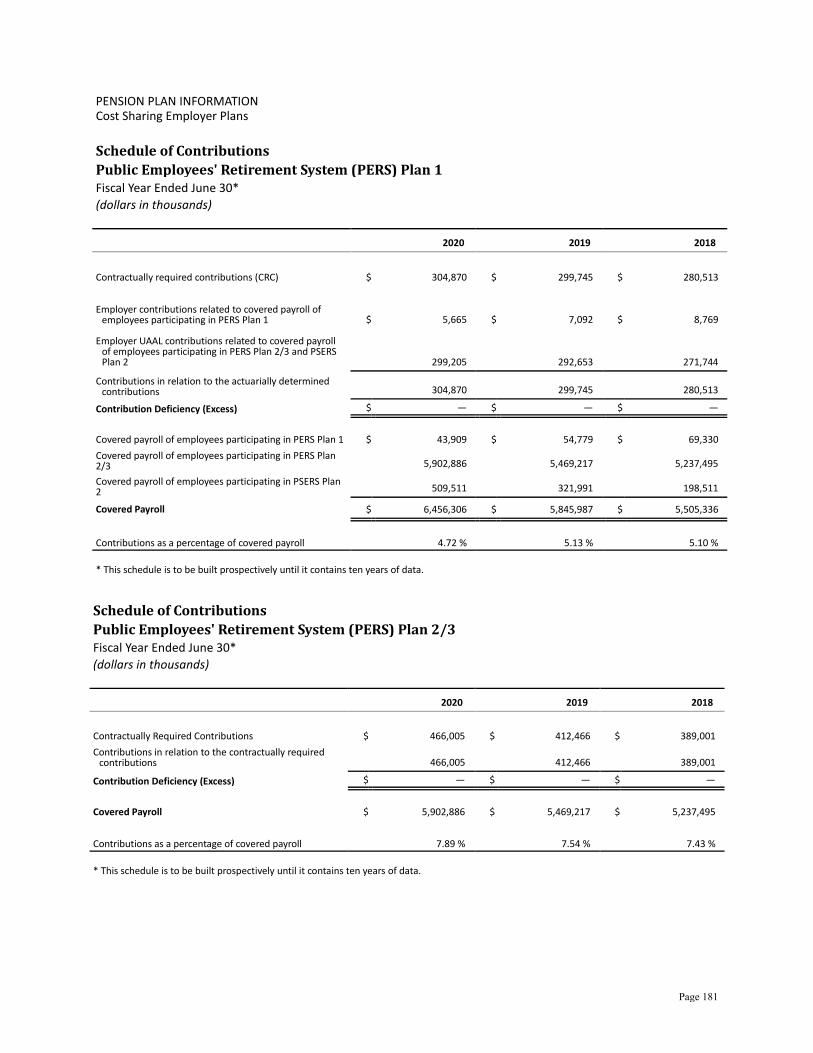
PENSION PLAN INFORMATION Cost Sharing Employer Plans
Schedule of Contributions
Public Employees' Retirement System (PERS) Plan 1 Fiscal Year Ended June 30* (dollars in thousands)
2020 2019 2018
Contractually required contributions (CRC) $ 304,870 $ 299,745 $ 280,513 Employer contributions related to covered payroll of
employees participating in PERS Plan 1 $ 5,665 $ 7,092 $ 8,769
Employer UAAL contributions related to covered payroll of employees participating in PERS Plan 2/3 and PSERS Plan 2 299,205 292,653 271,744
Contributions in relation to the actuarially determined contributions 304,870 299,745 280,513
Contribution Deficiency (Excess) $ — $ — $ —
Covered payroll of employees participating in PERS Plan 1 $ 43,909 $ 54,779 $ 69,330 Covered payroll of employees participating in PERS Plan 2/3 5,902,886 5,469,217 5,237,495 Covered payroll of employees participating in PSERS Plan 2 509,511 321,991 198,511
Covered Payroll $ 6,456,306 $ 5,845,987 $ 5,505,336
Contributions as a percentage of covered payroll 4.72 % 5.13 % 5.10 % * This schedule is to be built prospectively until it contains ten years of data.
Schedule of Contributions
Public Employees' Retirement System (PERS) Plan 2/3 Fiscal Year Ended June 30* (dollars in thousands)
2020 2019 2018
Contractually Required Contributions $ 466,005 $ 412,466 $ 389,001 Contributions in relation to the contractually required
contributions 466,005 412,466 389,001
Contribution Deficiency (Excess) $ — $ — $ —
Covered Payroll $ 5,902,886 $ 5,469,217 $ 5,237,495 Contributions as a percentage of covered payroll 7.89 % 7.54 % 7.43 % * This schedule is to be built prospectively until it contains ten years of data.
Page 181

2017 2016 2015 2014
$ 251,924 $ 238,158 $ 191,618 $ 188,639
$ 9,537 $ 11,385 $ 11,072 $ 12,964
242,387 226,773 180,546 175,675
251,924 238,158 191,618 188,639 $ — $ — $ — $ —
$ 85,341 $ 103,235 $ 120,686 $ 143,836
4,928,806 4,648,843 4,363,171 4,215,935 175,395 155,768 140,977 130,172
$ 5,189,542 $ 4,907,846 $ 4,624,834 $ 4,489,943
4.85 % 4.85 % 4.14 % 4.20 %
2017 2016 2015 2014
$ 306,591 $ 287,049 $ 219,395 $ 209,455
306,591 287,049 219,395 209,455 $ — $ — $ — $ —
$ 4,928,806 $ 4,648,843 $ 4,363,171 $ 4,215,935
6.22 % 6.17 % 5.03 % 4.97 %
Page 182

PENSION PLAN INFORMATION Cost Sharing Employer Plans
Schedule of Contributions
Teachers' Retirement System (TRS) Plan 1 Fiscal Year Ended June 30* (dollars in thousands)
2020 2019 2018
Contractually required contributions $ 6,215 $ 5,436 $ 4,582 Employer contributions related to covered payroll of
employees participating in TRS Plan 1 $ 225 $ 241 $ 272 Employer UAAL contributions related to covered payroll
of employees participating in TRS Plan 2/3 5,990 5,195 4,310
Contributions in relation to the actuarially determined contributions 6,215 5,436 4,582
Contribution Deficiency (Excess) $ — $ — $ —
Covered payroll of employees participating in TRS Plan 1 $ 1,431 $ 1,557 $ 1,893 Covered payroll of employees participating in TRS Plan 2/3 83,176 43,082 61,292
Covered Payroll $ 84,607 $ 44,639 $ 63,185
Contributions as a percentage of covered payroll 7.35 % 12.18 % 7.25 % * This schedule is to be built prospectively until it contains ten years of data.
Schedule of Contributions
Teachers' Retirement System (TRS) Plan 2/3
Fiscal Year Ended June 30*
(dollars in thousands)
2020 2019 2018
Contractually required contributions $ 6,730 $ 5,542 $ 4,699 Contributions in relation to the contractually required
contributions 6,730 5,542 4,699
Contribution Deficiency (Excess) $ — $ — $ —
Covered Payroll $ 83,176 $ 43,082 $ 61,292 Contributions as a percentage of covered payroll 8.09 % 12.86 % 7.67 % * This schedule is to be built prospectively until it contains ten years of data.
Page 183

2017 2016 2015 2014
$ 3,608 $ 2,940 $ 1,920 $ 1,537
$ 326 $ 369 $ 388 $ 451
3,282 2,571 1,532 1,086
3,608 2,940 1,920 1,537 $ — $ — $ — $ —
$ 2,475 $ 5,735 $ 3,913 $ 4,611
52,534 41,803 33,705 25,673 $ 55,009 $ 47,538 $ 37,618 $ 30,284
6.56 % 6.18 % 5.10 % 5.08 %
2017 2016 2015 2014
$ 3,542 $ 2,827 $ 1,924 $ 1,454
3,542 2,827 1,924 1,454 $ — $ — $ — $ —
$ 52,534 $ 41,803 $ 33,705 $ 25,673
6.74 % 6.76 % 5.71 % 5.66 %
Page 184
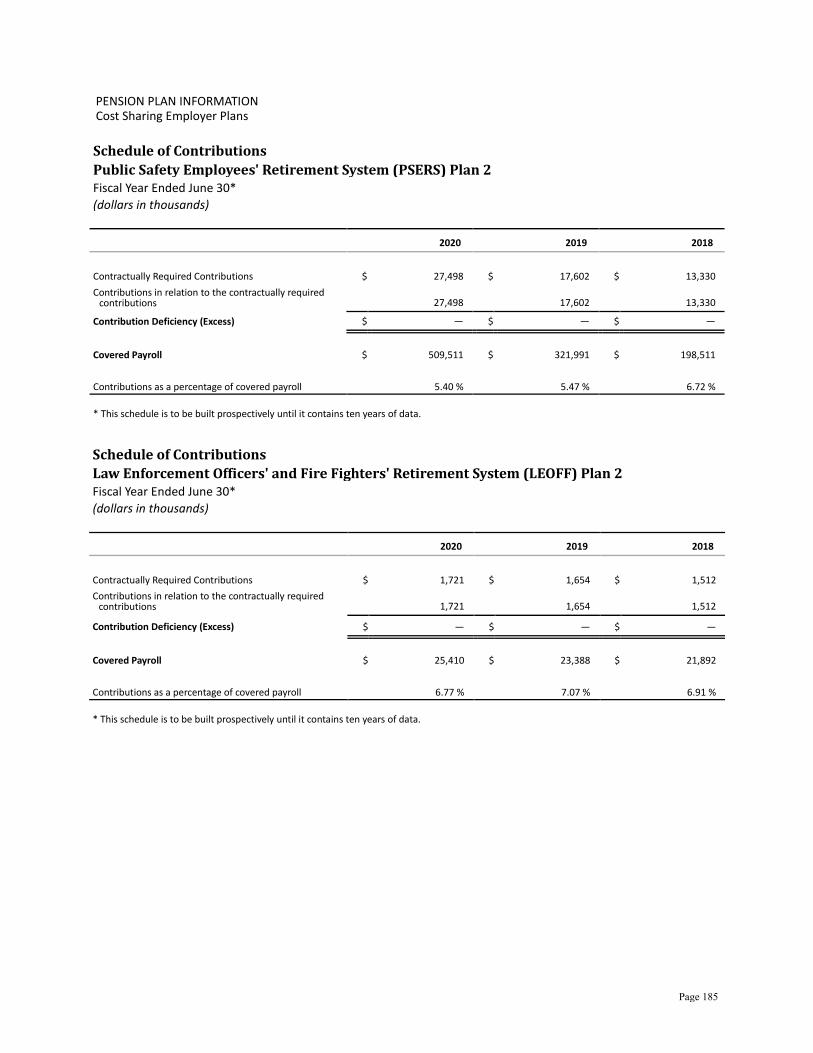
PENSION PLAN INFORMATION Cost Sharing Employer Plans
Schedule of Contributions
Public Safety Employees' Retirement System (PSERS) Plan 2 Fiscal Year Ended June 30* (dollars in thousands)
2020 2019 2018
Contractually Required Contributions $ 27,498 $ 17,602 $ 13,330 Contributions in relation to the contractually required
contributions 27,498 17,602 13,330
Contribution Deficiency (Excess) $ — $ — $ —
Covered Payroll $ 509,511 $ 321,991 $ 198,511 Contributions as a percentage of covered payroll 5.40 % 5.47 % 6.72 % * This schedule is to be built prospectively until it contains ten years of data.
Schedule of Contributions
Law Enforcement Officers' and Fire Fighters' Retirement System (LEOFF) Plan 2 Fiscal Year Ended June 30* (dollars in thousands)
2020 2019 2018
Contractually Required Contributions $ 1,721 $ 1,654 $ 1,512 Contributions in relation to the contractually required
contributions 1,721 1,654 1,512
Contribution Deficiency (Excess) $ — $ — $ —
Covered Payroll $ 25,410 $ 23,388 $ 21,892 Contributions as a percentage of covered payroll 6.77 % 7.07 % 6.91 % * This schedule is to be built prospectively until it contains ten years of data.
Page 185
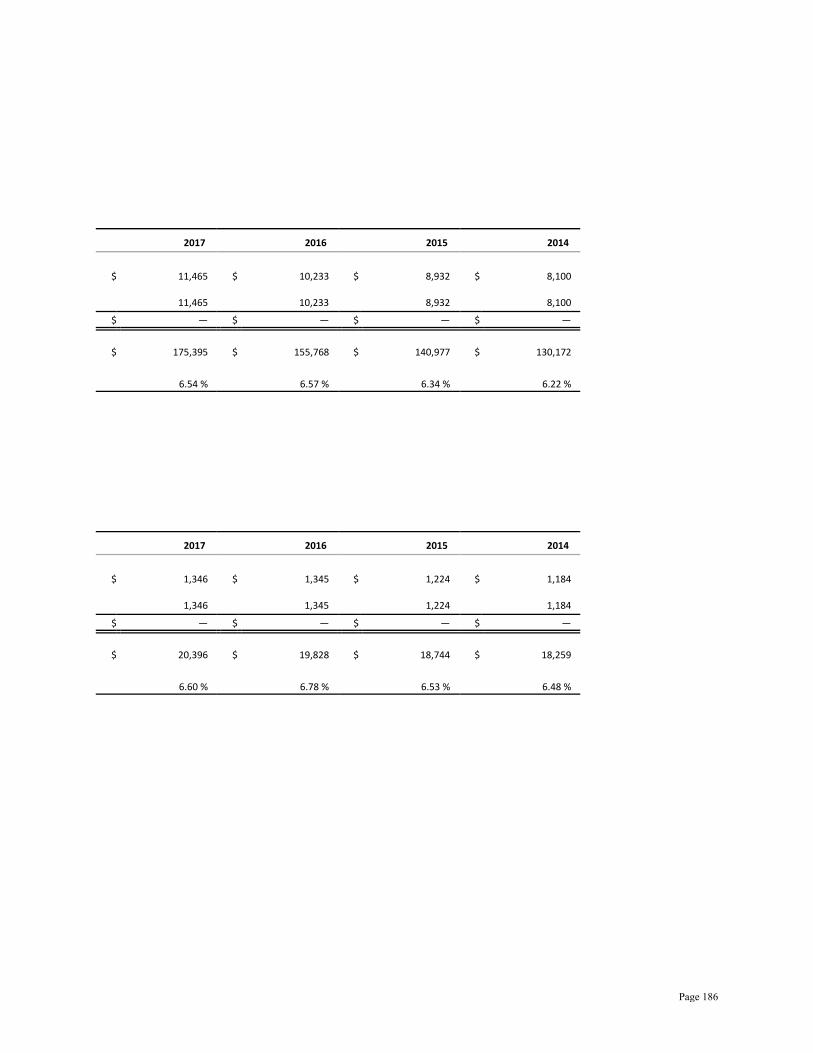
2017 2016 2015 2014
$ 11,465 $ 10,233 $ 8,932 $ 8,100
11,465 10,233 8,932 8,100 $ — $ — $ — $ —
$ 175,395 $ 155,768 $ 140,977 $ 130,172
6.54 % 6.57 % 6.34 % 6.22 %
2017 2016 2015 2014
$ 1,346 $ 1,345 $ 1,224 $ 1,184
1,346 1,345 1,224 1,184 $ — $ — $ — $ —
$ 20,396 $ 19,828 $ 18,744 $ 18,259
6.60 % 6.78 % 6.53 % 6.48 %
Page 186

PENSION PLAN INFORMATION Notes to Required Supplementary Information Methods and assumptions used in calculations of Actuarially Determined Contributions for PERS, TRS, PSERS, LEOFF, and WSPRS. The Office of the State Actuary (OSA) calculates the Actuarially Determined Contributions (ADC) based on the results of an actuarial valuation consistent with the state’s funding policy defined under chapter 41.45 of the Revised Code of Washington (RCW). Consistent with the state’s contribution rate adoption process, the results of an actuarial valuation with an odd-numbered year valuation date determine the ADC for the biennium that ensues two years later. The actuarial valuation with a June 30, 2017, valuation date, completed in the fall of 2018, plus any supplemental contribution rates from the preceding legislative session, determined the ADC for the period beginning July 1, 2019, and ending June 30, 2021.
Methods and assumptions used in calculations of the ADC for the Judicial Retirement System and the Judges Retirement Fund. The OSA calculates the ADC based on the results of an actuarial valuation, and sets the ADC equal to the expected benefit payments from the plan. Consistent with the state’s funding policy defined under RCW 2.10.90 and 2.12.60, the Legislature makes biennial appropriations in order to ensure the fund is solvent to make the necessary benefit payments. Additional consideration on ADC for all plans. OSA calculates the ADC consistent with the methods described above. Adopted contribution rates may be different pending the actions of the governing bodies. Contractually Required Contributions for PERS, TRS, PSERS, and LEOFF. For cost-sharing plans, OSA calculates the Contractually Required Contributions (CRC) using the same assumptions and methods as the ADC except the CRC reflects the adopted contribution rates for the time period shown, which may differ from the contribution rates produced for the ADC.
Page 187

PENSION PLAN INFORMATION Volunteer Fire Fighters’ and Reserve Officers’ Relief and Pension Fund
Schedule of Contributions Last Ten Fiscal Years (expressed in thousands)
Year
Actuarially Determined
Contributions
Contributions in Relation to the Actuarially Determined
Contributions
Contribution Deficiency
(Excess) 2020 $ 900 $ 8,967 $ (8,067) 2019 926 8,436 (7,510) 2018 3,523 8,050 (4,527) 2017 4,528 7,494 (2,966) 2016 6,846 8,153 (1,307) 2015 6,653 6,816 (163) 2014 6,421 7,336 (915) 2013 4,600 6,946 (2,346) 2012 4,700 6,484 (1,784) 2011 5,300 6,778 (1,478) Notes: Neither covered payroll nor contributions as a percentage of covered payroll are applicable. This is a volunteer organization. Beginning in 2017, the methodology for determining the Actuarially Determined Contributions was revised to reflect the timing of the contributions based upon the Board for Volunteer Firefighters adoption cycle and the actuarial funding methods selected.
Prior to 2014, the Annual Required Contribution amounts are presented for the Actuarially Determined Contributions.
Figures may not total due to rounding. Source: Washington State Office of the State Actuary
Schedule of Investment Returns
Last Seven Fiscal Years*
2020 2019 2018 2017 2016 2015 2014 Annual money-weighted rate of return, net of investment expense 4.40 % 8.23 % 8.84 % 13.26 % 2.19 % 4.05 % 18.50 % *This schedule is to be built prospectively until it contains ten years of data. Source: Washington State Office of the State Actuary
Page 188

PENSION PLAN INFORMATION Volunteer Fire Fighters’ and Reserve Officers’ Relief and Pension Fund
Schedule of Change in Net Pension Liability Last Eight Fiscal Years* (expressed in thousands)
2020 2019 2018 Total Pension Liability
Service cost $ 820 $ 828 $ 853 Interest 13,120 13,119 13,151 Changes of benefit terms 34,626 — — Differences between expected and actual experience 1,134 (1,857) (2,707)
Changes in assumptions — — 16 Benefit payments, including refunds of member contributions (12,217) (11,913) (11,573)
Net Change in Total Pension Liability 37,483 177 (260) Total Pension Liability - Beginning 192,617 192,440 192,700 Total Pension Liability - Ending $ 230,100 $ 192,617 $ 192,440 Plan Fiduciary Net Position
Contributions - municipalities $ 771 $ 797 $ 823 Contributions - member 40 54 65 Contributions - state as nonemployer
contributing entity 8,196 7,639 7,227
Net investment income 11,059 20,101 19,860 Benefit payments, including refunds of member contributions (12,215) (11,913) (11,573)
Administrative expense (3,120) (1,352) (918) Other — — —
Net Change in Plan Fiduciary Net Position 4,731 15,326 15,484 Plan Fiduciary Net Position--Beginning, as restated 260,609 245,284 229,800
Plan Fiduciary Net Position--Ending $ 265,340 $ 260,610 $ 245,284
Plan's Net Pension Liability/(Asset)--Ending $ (35,240) $ (67,993) $ (52,844)
N/A indicates data not available. *This schedule is to be built prospectively until it contains ten years of data. Note: Figures may not total due to rounding. Source: Washington State Office of the State Actuary
Page 189

2017 2016 2015 2014 2013
$ 869 $ 893 $ 919 $ 1,240 N/A
12,946 12,887 12,656 12,480 N/A — — — — N/A
(1,998) (176) (2,948) — N/A 463 101 1,931 — N/A
(11,074) (10,795) (10,501) (10,771) N/A 1,206 2,910 2,057 2,949 N/A
191,494 188,584 186,527 183,578 N/A
$ 192,700 $ 191,494 $ 188,584 $ 186,527 $ 183,578
$ 848 $ 918 $ 913 $ 953 N/A
69 67 76 95 N/A
6,646 7,235 5,903 6,383 N/A 26,114 4,588 8,289 31,892 N/A
(11,074) (10,795) (10,501) (10,771) N/A (1,466) (1,205) (1,020) (1,469) N/A
— — — (22) N/A 21,137 808 3,660 27,061 N/A
208,663 207,855 204,195 177,134 N/A $ 229,800 $ 208,663 $ 207,855 $ 204,195 $ 177,134
$ (37,100) $ (17,169) $ (19,271) $ (17,668) $ 6,444
Page 190
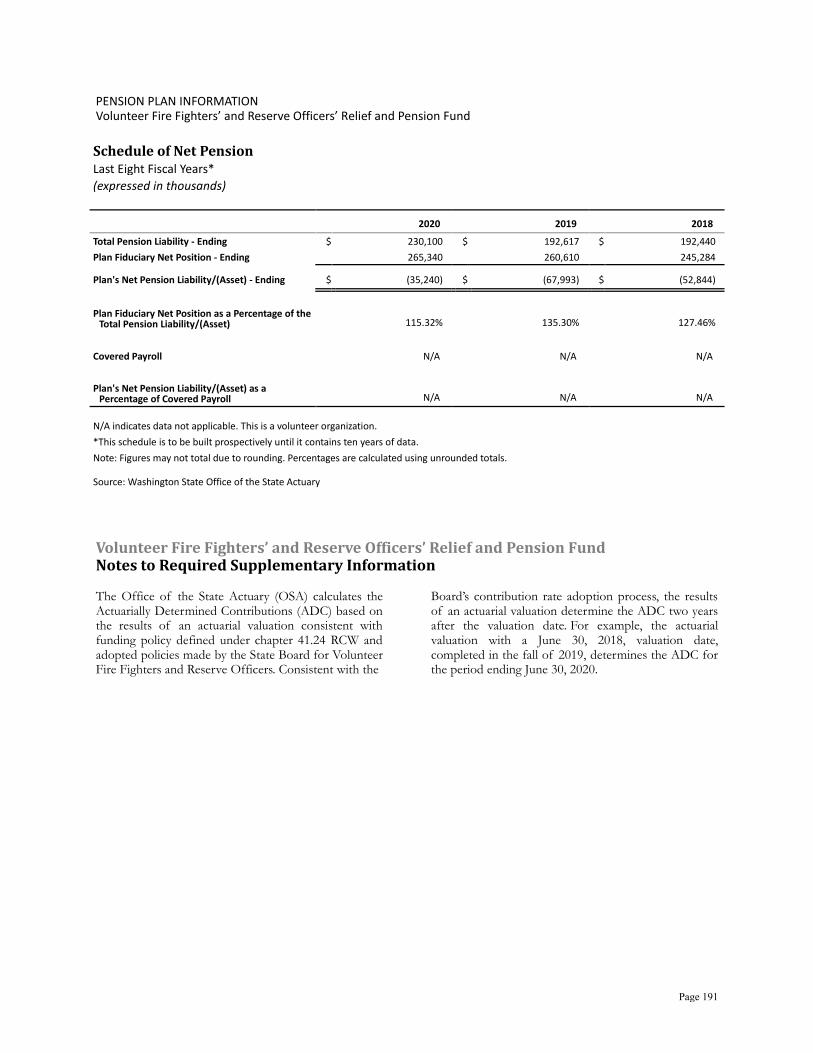
PENSION PLAN INFORMATION Volunteer Fire Fighters’ and Reserve Officers’ Relief and Pension Fund
Schedule of Net Pension Liability
Last Eight Fiscal Years*
(expressed in thousands)
2020 2019 2018 Total Pension Liability - Ending $ 230,100 $ 192,617 $ 192,440 Plan Fiduciary Net Position - Ending 265,340 260,610 245,284
Plan's Net Pension Liability/(Asset) - Ending $ (35,240) $ (67,993) $ (52,844)
Plan Fiduciary Net Position as a Percentage of the
Total Pension Liability/(Asset) 115.32% 135.30% 127.46% Covered Payroll N/A N/A N/A Plan's Net Pension Liability/(Asset) as a
Percentage of Covered Payroll N/A N/A N/A
N/A indicates data not applicable. This is a volunteer organization. *This schedule is to be built prospectively until it contains ten years of data. Note: Figures may not total due to rounding. Percentages are calculated using unrounded totals. Source: Washington State Office of the State Actuary
Volunteer Fire Fighters’ and Reserve Officers’ Relief and Pension Fund Notes to Required Supplementary Information The Office of the State Actuary (OSA) calculates the Actuarially Determined Contributions (ADC) based on the results of an actuarial valuation consistent with funding policy defined under chapter 41.24 RCW and adopted policies made by the State Board for Volunteer Fire Fighters and Reserve Officers. Consistent with the
Board’s contribution rate adoption process, the results of an actuarial valuation determine the ADC two years after the valuation date. For example, the actuarial valuation with a June 30, 2018, valuation date, completed in the fall of 2019, determines the ADC for the period ending June 30, 2020.
Page 191
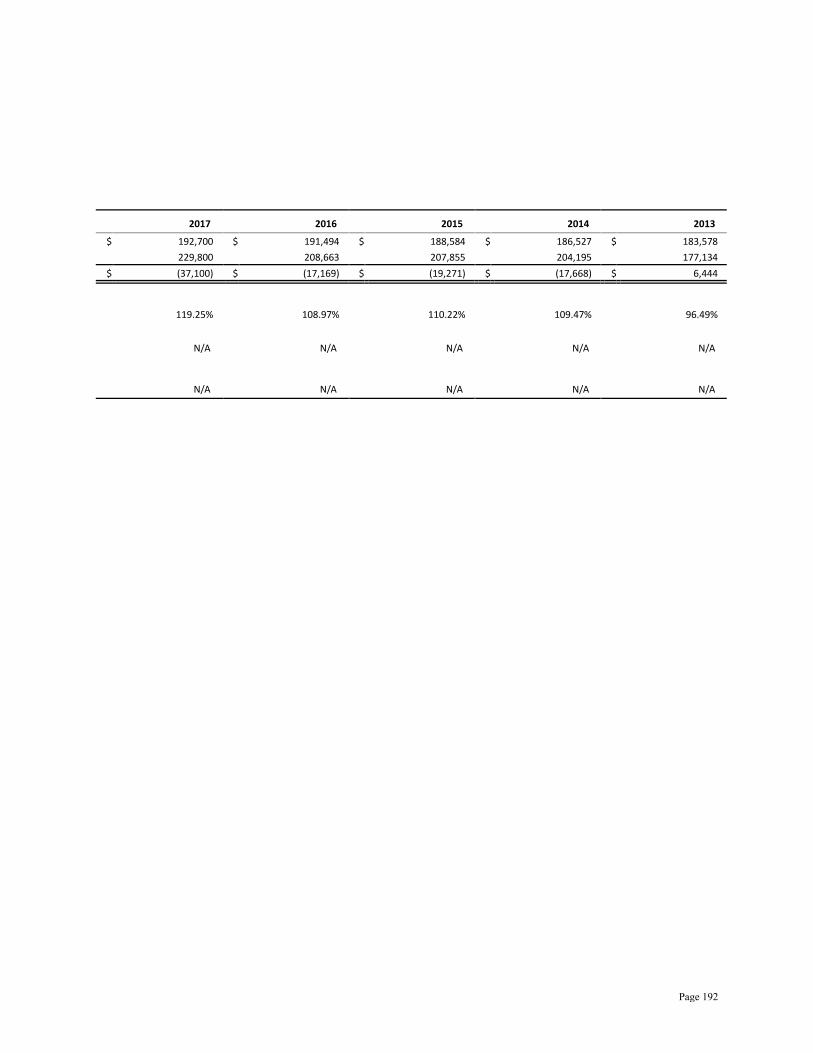
2017 2016 2015 2014 2013 $ 192,700 $ 191,494 $ 188,584 $ 186,527 $ 183,578
229,800 208,663 207,855 204,195 177,134 $ (37,100) $ (17,169) $ (19,271) $ (17,668) $ 6,444
119.25% 108.97% 110.22% 109.47% 96.49%
N/A N/A N/A N/A N/A
N/A N/A N/A N/A N/A
Page 192
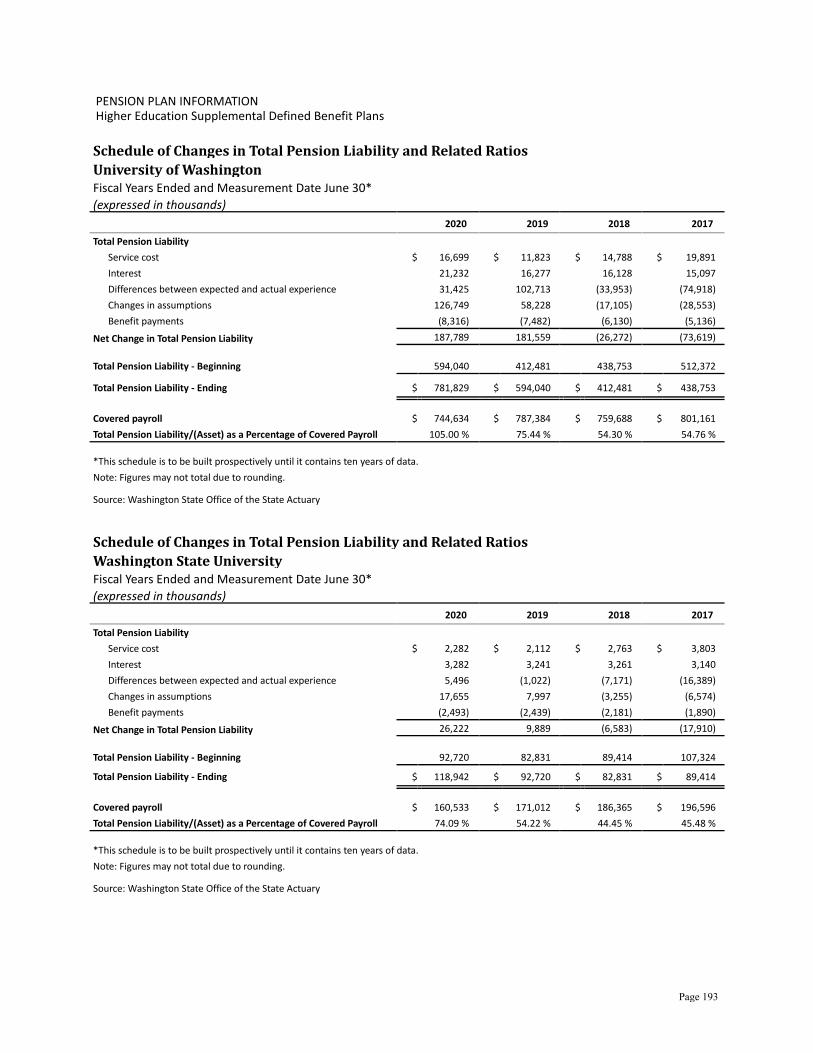
PENSION PLAN INFORMATION Higher Education Supplemental Defined Benefit Plans
Schedule of Changes in Total Pension Liability and Related Ratios
University of Washington Fiscal Years Ended and Measurement Date June 30* (expressed in thousands)
2020 2019 2018 2017 Total Pension Liability
Service cost $ 16,699 $ 11,823 $ 14,788 $ 19,891 Interest 21,232 16,277 16,128 15,097 Differences between expected and actual experience 31,425 102,713 (33,953) (74,918) Changes in assumptions 126,749 58,228 (17,105) (28,553) Benefit payments (8,316) (7,482) (6,130) (5,136)
Net Change in Total Pension Liability 187,789 181,559 (26,272) (73,619) Total Pension Liability - Beginning 594,040 412,481 438,753 512,372
Total Pension Liability - Ending $ 781,829 $ 594,040 $ 412,481 $ 438,753
Covered payroll $ 744,634 $ 787,384 $ 759,688 $ 801,161 Total Pension Liability/(Asset) as a Percentage of Covered Payroll 105.00 % 75.44 % 54.30 % 54.76 % *This schedule is to be built prospectively until it contains ten years of data. Note: Figures may not total due to rounding.
Source: Washington State Office of the State Actuary
Schedule of Changes in Total Pension Liability and Related Ratios
Washington State University Fiscal Years Ended and Measurement Date June 30* (expressed in thousands)
2020 2019 2018 2017 Total Pension Liability
Service cost $ 2,282 $ 2,112 $ 2,763 $ 3,803 Interest 3,282 3,241 3,261 3,140 Differences between expected and actual experience 5,496 (1,022) (7,171) (16,389) Changes in assumptions 17,655 7,997 (3,255) (6,574) Benefit payments (2,493) (2,439) (2,181) (1,890)
Net Change in Total Pension Liability 26,222 9,889 (6,583) (17,910) Total Pension Liability - Beginning 92,720 82,831 89,414 107,324
Total Pension Liability - Ending $ 118,942 $ 92,720 $ 82,831 $ 89,414
Covered payroll $ 160,533 $ 171,012 $ 186,365 $ 196,596 Total Pension Liability/(Asset) as a Percentage of Covered Payroll 74.09 % 54.22 % 44.45 % 45.48 % *This schedule is to be built prospectively until it contains ten years of data. Note: Figures may not total due to rounding.
Source: Washington State Office of the State Actuary
Page 193

PENSION PLAN INFORMATION Higher Education Supplemental Defined Benefit Plans
Schedule of Changes in Total Pension Liability and Related Ratios
Eastern Washington University Fiscal Years Ended and Measurement Date June 30* (expressed in thousands)
2020 2019 2018 2017
Total Pension Liability
Service cost $ 501 $ 463 $ 477 $ 658
Interest 634 614 429 420
Differences between expected and actual experience 1,019 421 3,867 (2,852)
Changes in assumptions 3,488 1,014 (621) (647)
Benefit payments (250) (316) (202) (140)
Net Change in Total Pension Liability 5,392 2,196 3,950 (2,561)
Total Pension Liability - Beginning 17,747 15,551 11,601 14,162
Total Pension Liability - Ending $ 23,139 $ 17,747 $ 15,551 $ 11,601
Covered payroll $ 30,441 $ 32,357 $ 34,114 $ 38,505
Total Pension Liability/(Asset) as a Percentage of Covered Payroll 76.01 % 54.85 % 45.59 % 30.13 %
*This schedule is to be built prospectively until it contains ten years of data.
Note: Figures may not total due to rounding.
Source: Washington State Office of the State Actuary
Schedule of Changes in Total Pension Liability and Related Ratios
Central Washington University Fiscal Years Ended and Measurement Date June 30* (expressed in thousands)
2020 2019 2018 2017
Total Pension Liability
Service cost $ 52 $ 61 $ 91 $ 150
Interest 252 293 299 293
Differences between expected and actual experience 322 (710) (466) (1,270)
Changes in assumptions 1,057 428 (272) (616)
Benefit payments (439) (411) (412) (411)
Net Change in Total Pension Liability 1,244 (339) (760) (1,854)
Total Pension Liability - Beginning 7,378 7,717 8,477 10,331
Total Pension Liability - Ending $ 8,622 $ 7,378 $ 7,717 $ 8,477
Covered payroll $ 8,282 $ 8,952 $ 10,368 $ 11,028
Total Pension Liability/(Asset) as a Percentage of Covered Payroll 104.10 % 82.41 % 74.43 % 76.87 %
*This schedule is to be built prospectively until it contains ten years of data.
Note: Figures may not total due to rounding.
Source: Washington State Office of the State Actuary
Page 194

PENSION PLAN INFORMATION Higher Education Supplemental Defined Benefit Plans
Schedule of Changes in Total Pension Liability and Related Ratios
The Evergreen State College Fiscal Years Ended and Measurement Date June 30* (expressed in thousands)
2020 2019 2018 2017 Total Pension Liability
Service cost $ 188 $ 154 $ 210 $ 296 Interest 243 235 237 230 Differences between expected and actual experience 490 (108) (565) (1,327) Changes in assumptions 1,293 694 (229) (387) Benefit payments (138) (137) (183) (158)
Net Change in Total Pension Liability 2,076 838 (530) (1,346) Total Pension Liability - Beginning 6,818 5,980 6,510 7,856
Total Pension Liability - Ending $ 8,894 $ 6,818 $ 5,980 $ 6,510
Covered payroll $ 13,618 $ 14,999 $ 15,978 $ 16,941 Total Pension Liability/(Asset) as a Percentage of Covered Payroll 65.31 % 45.46 % 37.43 % 38.43 % *This schedule is to be built prospectively until it contains ten years of data. Note: Figures may not total due to rounding.
Source: Washington State Office of the State Actuary
Schedule of Changes in Total Pension Liability and Related Ratios
Western Washington University Fiscal Years Ended and Measurement Date June 30* (expressed in thousands)
2020 2019 2018 2017 Total Pension Liability
Service cost $ 699 $ 551 $ 737 $ 1,057 Interest 962 825 837 842 Differences between expected and actual experience 1,961 2,298 (2,233) (5,278) Changes in assumptions 5,269 2,821 (819) (2,126) Benefit payments (486) (420) (380) (298)
Net Change in Total Pension Liability 8,405 6,075 (1,858) (5,803) Total Pension Liability - Beginning 27,037 20,962 22,820 28,623
Total Pension Liability - Ending $ 35,442 $ 27,037 $ 20,962 $ 22,820
Covered payroll $ 49,576 $ 53,024 $ 52,750 $ 55,840 Total Pension Liability/(Asset) as a Percentage of Covered Payroll 71.49 % 50.99 % 39.74 % 40.87 % *This schedule is to be built prospectively until it contains ten years of data. Note: Figures may not total due to rounding.
Source: Washington State Office of the State Actuary
Page 195

PENSION PLAN INFORMATION Higher Education Supplemental Defined Benefit Plans
Schedule of Changes in Total Pension Liability and Related Ratios
State Board for Community and Technical Colleges Fiscal Years Ended and Measurement Date June 30* (expressed in thousands)
2020 2019 2018 2017 Total Pension Liability
Service cost $ 3,516 $ 2,851 $ 3,827 $ 5,417 Interest 3,956 3,449 3,517 3,514 Differences between expected and actual experience 8,335 6,503 (10,402) (25,336) Changes in assumptions 22,269 12,227 (3,519) (5,980) Benefit payments (1,785) (1,818) (1,300) (902)
Net Change in Total Pension Liability 36,291 23,212 (7,877) (23,287) Total Pension Liability - Beginning 110,385 87,173 95,050 118,337
Total Pension Liability - Ending $ 146,676 $ 110,385 $ 87,173 $ 95,050
Covered payroll $ 312,253 $ 331,420 $ 353,910 $ 375,725 Total Pension Liability/(Asset) as a Percentage of Covered Payroll 46.97 % 33.31 % 24.63 % 25.30 % *This schedule is to be built prospectively until it contains ten years of data. Note: Figures may not total due to rounding.
Source: Washington State Office of the State Actuary
Higher Education Supplemental Defined Benefit Plans Notes to Required Supplementary Information The Higher Education Supplemental Retirement Plans are financed on a pay-as-you-go basis. State institutions of higher education make direct payments to qualifying retirees when the retirement benefits provided by the
fund sponsors do not meet the benefit goals. No assets are accumulated in trusts or equivalent arrangements. Potential factors that may significantly affect trends in amounts reported include changes to the discount rate, salary growth, and the variable income investment return.
Page 196

OTHER POSTEMPLOYMENT BENEFITS INFORMATION
Schedule of Changes in Total OPEB Liability and Related Ratios Measurement Date of June 30* (expressed in thousands)
2019 2018 2017 Total OPEB Liability
Service cost $ 235,316 $ 317,866 $ 394,955 Interest 203,889 218,339 184,999 Changes in benefit terms — — — Difference between expected and actual experience (273) 199,258 — Changes in assumptions 379,637 (1,390,198) (902,431) Benefit payments (93,253) (92,200) (94,279) Changes in proportion (3) (15) —
Net Changes in Total OPEB Liability 725,313 (746,950) (416,755) Total OPEB Liability - Beginning 5,079,882 5,826,832 6,242,577
Total OPEB Liability - Ending $ 5,805,195 $ 5,079,882 $ 5,825,822
Covered-employee payroll $ 8,722,746 $ 8,401,635 $ 7,878,188 Total OPEB liability as a percentage of covered-employee payroll 66.55 % 60.46 % 73.95 % *This schedule is to be built prospectively until it contains ten years of data. Note: Figures may not total due to rounding.
Source: Washington State Office of the State Actuary
Notes to Required Supplementary Information The Public Employees' Benefits Board OPEB plan does not have assets in trusts or equivalent arrangements and is funded on a pay-as-you-go basis. Potential factors that may significantly affect trends in amounts reported include changes to the discount rate,
health care trend rates, salary projections, and participation percentages.
Total OPEB liability beginning balance for the measurement date of June 30, 2018, was restated to reflect the changes in proportion between the state and the Washington Economic Development Finance Authority which operates on a cash basis and does not report an OPEB liability. The restatement also includes OPEB amounts for the Health Care Benefits Exchange which was omitted from the table in the prior year.
Page 197
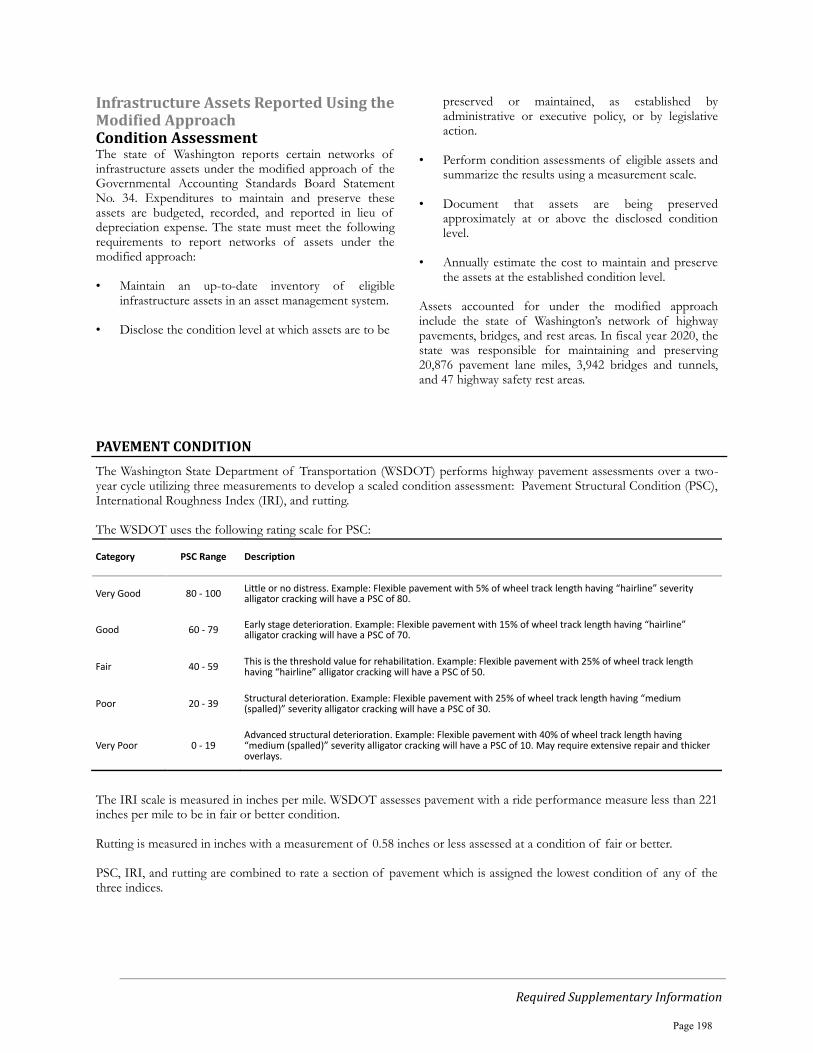
Required Supplementary Information
Infrastructure Assets Reported Using the Modified Approach Condition Assessment The state of Washington reports certain networks of infrastructure assets under the modified approach of the Governmental Accounting Standards Board Statement No. 34. Expenditures to maintain and preserve these assets are budgeted, recorded, and reported in lieu of depreciation expense. The state must meet the following requirements to report networks of assets under the modified approach:
• Maintain an up-to-date inventory of eligibleinfrastructure assets in an asset management system.
• Disclose the condition level at which assets are to be
preserved or maintained, as established by administrative or executive policy, or by legislative action.
• Perform condition assessments of eligible assets andsummarize the results using a measurement scale.
• Document that assets are being preservedapproximately at or above the disclosed conditionlevel.
• Annually estimate the cost to maintain and preservethe assets at the established condition level.
Assets accounted for under the modified approach include the state of Washington’s network of highway pavements, bridges, and rest areas. In fiscal year 2020, the state was responsible for maintaining and preserving 20,876 pavement lane miles, 3,942 bridges and tunnels, and 47 highway safety rest areas.
PAVEMENT CONDITION
The Washington State Department of Transportation (WSDOT) performs highway pavement assessments over a two-year cycle utilizing three measurements to develop a scaled condition assessment: Pavement Structural Condition (PSC), International Roughness Index (IRI), and rutting.
The WSDOT uses the following rating scale for PSC:
Category PSC Range Description
Very Good 80 - 100 Little or no distress. Example: Flexible pavement with 5% of wheel track length having “hairline” severity alligator cracking will have a PSC of 80.
Good 60 - 79 Early stage deterioration. Example: Flexible pavement with 15% of wheel track length having “hairline” alligator cracking will have a PSC of 70.
Fair 40 - 59 This is the threshold value for rehabilitation. Example: Flexible pavement with 25% of wheel track length having “hairline” alligator cracking will have a PSC of 50.
Poor 20 - 39Structural deterioration. Example: Flexible pavement with 25% of wheel track length having “medium (spalled)” severity alligator cracking will have a PSC of 30.
Very Poor 0 - 19Advanced structural deterioration. Example: Flexible pavement with 40% of wheel track length having “medium (spalled)” severity alligator cracking will have a PSC of 10. May require extensive repair and thicker overlays.
The IRI scale is measured in inches per mile. WSDOT assesses pavement with a ride performance measure less than 221 inches per mile to be in fair or better condition.
Rutting is measured in inches with a measurement of 0.58 inches or less assessed at a condition of fair or better.
PSC, IRI, and rutting are combined to rate a section of pavement which is assigned the lowest condition of any of the three indices.
Page 198
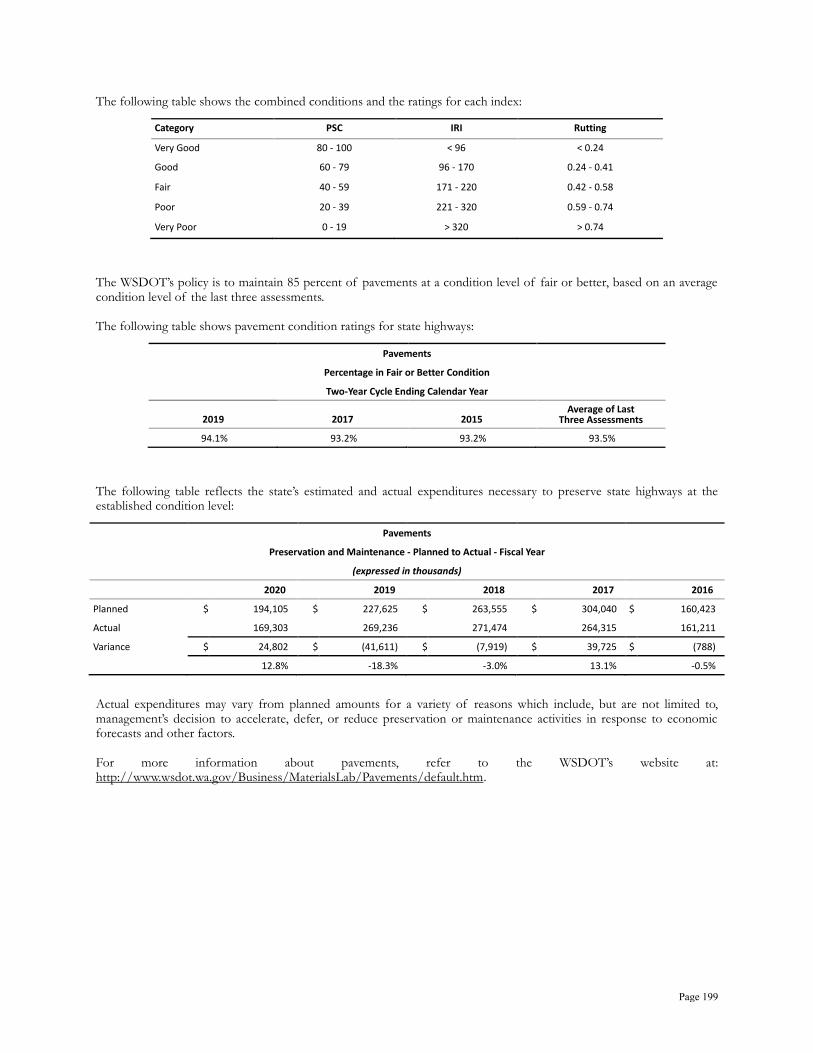
The following table shows the combined conditions and the ratings for each index:
Category PSC IRI Rutting
Very Good 80 - 100 < 96 < 0.24
Good 60 - 79 96 - 170 0.24 - 0.41
Fair 40 - 59 171 - 220 0.42 - 0.58
Poor 20 - 39 221 - 320 0.59 - 0.74
Very Poor 0 - 19 > 320 > 0.74
The WSDOT’s policy is to maintain 85 percent of pavements at a condition level of fair or better, based on an average condition level of the last three assessments. The following table shows pavement condition ratings for state highways:
Pavements
Percentage in Fair or Better Condition
Two-Year Cycle Ending Calendar Year
2019 2017 2015 Average of Last
Three Assessments
94.1% 93.2% 93.2% 93.5%
The following table reflects the state’s estimated and actual expenditures necessary to preserve state highways at the established condition level:
Pavements
Preservation and Maintenance - Planned to Actual - Fiscal Year
(expressed in thousands)
2020 2019 2018 2017 2016
Planned $ 194,105 $ 227,625 $ 263,555 $ 304,040 $ 160,423
Actual 169,303 269,236 271,474 264,315 161,211
Variance $ 24,802 $ (41,611) $ (7,919) $ 39,725 $ (788)
12.8% -18.3% -3.0% 13.1% -0.5%
Actual expenditures may vary from planned amounts for a variety of reasons which include, but are not limited to, management’s decision to accelerate, defer, or reduce preservation or maintenance activities in response to economic forecasts and other factors. For more information about pavements, refer to the WSDOT’s website at: http://www.wsdot.wa.gov/Business/MaterialsLab/Pavements/default.htm.
Page 199

BRIDGE CONDITION
The WSDOT inspects and performs condition assessments on approximately 3,300 state-owned vehicular bridges in excess of 20 feet in length. While most bridges undergo condition assessments every two years, the National Bridge Inspection Standards (NBIS) make provisions for some bridges to be inspected more of less frequently. Factors that are considered when determining the frequency of inspection include age, type of structure, span length, and condition. There are currently about 360 bridges that are inspected on a four-year cycle, and many bridges that are inspected more frequently than every two years. Underwater bridge components are inspected at least once every five years in accordance with Federal Highway Administration (FHWA) requirements. The WSDOT uses a performance measure established in FHWA’s Recording and Coding Guide for the Structural Inventory and Appraisal of the Nation’s Bridges, which classifies the physical condition of bridges as good, fair, or poor based on structural sufficiency standards for the following bridge components: bridge superstructure, substructure, and deck. The appraisal data is collected in the National Bridge Inventory (NBI) and assigned a code from 0 to 9, with 0 being in a failed condition and 9 being in excellent condition.
Category National Bridge
Inventory Code Description
Good 7 or 8 A range from no problems noted to some minor problems.
Fair 5 or 6 All primary structural elements are sound but may have deficiencies such as minor section loss, deterioration, cracking, spalling, or scour.
Poor 4 or less Advanced deficiencies such as section loss, deterioration, cracking, spalling, scour, or seriously affected primary structural components.
The WSDOT’s policy is to maintain 90 percent of bridges at a condition level of fair or better, based on an average condition level of the last three assessments. The following table shows condition ratings for state bridges:
Bridges
Percentage in Fair or Better Condition Two-Year Cycle Ending Fiscal Year
2019 2017 2015 Average of Last Three Assessments
92.9% 91.8% 92.1% 92.3%
The following table reflects the state’s estimated and actual expenditures necessary to preserve the bridges at the established condition level:
Bridges
Preservation and Maintenance - Planned to Actual - Fiscal Year (expressed in thousands)
2020 2019 2018 2017 2016 Planned $ 148,212 $ 182,409 $ 106,595 $ 45,891 $ 75,160 Actual 120,554 146,816 87,068 45,088 66,339 Variance $ 27,658 $ 35,593 $ 19,527 $ 803 $ 8,821 18.7% 19.5% 18.3% 1.7% 11.7%
Actual expenditures may vary from planned amounts for a variety of reasons which include, but are not limited to, management’s decision to accelerate, defer, or reduce preservation or maintenance activities in response to economic forecasts and other factors. For more information about bridges, refer to the WSDOT’s website at: http://www.wsdot.wa.gov/Bridge/Structures/.
Page 200

SAFETY REST AREA CONDITION
In April 2019, the WSDOT’s Statewide Asset Management Program requested that safety rest areas be managed under the same asset management plan as all other agency-owned facilities. As of July 2019, the WSDOT implemented a new alignment plan that imposed stricter standards for preserving all safety rest areas. While the scale for condition measurement remains unchanged, both the condition rating tiers and the condition target for safety rest areas have been modified. The rating for a safety rest area to be considered in “fair” condition was increased from 50% to 60% under the new plan, representing a higher assessment standard than under the historical rating system. Beginning in fiscal year 2020, the WSDOT performs condition assessments on safety rest areas in the odd year of every fiscal biennium. Sites and buildings are divided into functional components that are assessed with a three-tiered condition scale: good, fair, and poor condition. The assessment criteria are based on guidelines that are typical of industry standards and have been modified by the WSDOT Capital Facilities Program to align with transportation-related facilities. The WSDOT’s policy is to maintain 85 percent of safety rest areas at a level of fair or better condition, based on the average condition level of the last three assessments. The following table shows condition ratings for safety rest areas:
Safety Rest Areas
Percentage in Fair or Better Condition
Two-Year Cycle Ending Fiscal Year *
2019 2017 2015 Average of Last
Three Assessments
80.4% 80.4% 95.7% 85.5%
* The percentages for last three assessments were recalculated based on the new rating methodology effective July 2019. The following table reflects the state’s estimated and actual expenditures necessary to preserve the safety rest areas at the established condition level:
Safety Rest Areas
Preservation and Maintenance - Planned to Actual - Fiscal Year
(expressed in thousands)
2020 2019 2018 2017 2016
Planned $ 9,420 $ 11,084 $ 9,609 $ 9,964 $ 7,204
Actual 8,601 9,004 7,986 8,011 7,185
Variance $ 819 $ 2,080 $ 1,623 $ 1,953 $ 19
8.7% 18.8% 16.9% 19.6% 0.3%
Actual expenditures may vary from planned amounts for a variety of reasons which include, but are not limited to, management’s decision to accelerate, defer, or reduce preservation or maintenance activities in response to economic forecasts and other factors. For more information about safety rest areas, refer to the WSDOT’s website at: http://www.wsdot.wa.gov/safety/restareas.
Page 201
Office of the Washington State Auditor
ABOUT THE STATE AUDITOR’S OFFICE
The State Auditor’s Office is established in the state’s Constitution and is part of the executive
branch of state government. The State Auditor is elected by the citizens of Washington and serves
four-year terms.
We work with our audit clients and citizens to achieve our vision of government that works for
citizens, by helping governments work better, cost less, deliver higher value, and earn greater
public trust.
In fulfilling our mission to hold state and local governments accountable for the use of public
resources, we also hold ourselves accountable by continually improving our audit quality and
operational efficiency and developing highly engaged and committed employees.
As an elected agency, the State Auditor’s Office has the independence necessary to objectively
perform audits and investigations. Our audits are designed to comply with professional standards
as well as to satisfy the requirements of federal, state, and local laws.
Our audits look at financial information and compliance with state, federal and local laws on the
part of all local governments, including schools, and all state agencies, including institutions of
higher education. In addition, we conduct performance audits of state agencies and local
governments as well as fraud, state whistleblower and citizen hotline investigations.
The results of our work are widely distributed through a variety of reports, which are available on
our website and through our free, electronic subscription service.
We take our role as partners in accountability seriously, and provide training and technical
assistance to governments, and have an extensive quality assurance program.
Contact information for the State Auditor’s Office
Public Records requests [email protected]
Main telephone (564) 999-0950
Toll-free Citizen Hotline (866) 902-3900
Website www.sao.wa.gov
Page 202