Embed Size (px)
Citation preview

Financial Statements and Federal Single Audit
Report
Public Utility District No. 1 of Skagit
County
For the period January 1, 2015 through December 31, 2016
Published October 9, 2017
Report No. 1020031
Insurance Building, P.O. Box 40021 Olympia, Washington 98504-0021 (360) 902-0370 [email protected]
October 9, 2017
Board of Commissioners
Public Utility District No. 1 of Skagit County
Mount Vernon, Washington
Report on Financial Statements and Federal Single Audit
Please find attached our report on Public Utility District No. 1 of Skagit County’s financial
statements and compliance with federal laws and regulations.
We are issuing this report in order to provide information on the District’s financial condition.
Sincerely,
Pat McCarthy
State Auditor
Olympia, WA
Office of the Washington State Auditor
Pat McCarthy

TABLE OF CONTENTS
Schedule Of Findings And Questioned Costs ................................................................................. 4
Schedule Of Audit Findings And Responses .................................................................................. 6
Summary Schedule Of Prior Audit Findings .................................................................................. 9
Independent Auditor’s Report On Internal Control Over Financial Reporting And On
Compliance And Other Matters Based On An Audit Of Financial Statements Performed In
Accordance With Government Auditing Standards ..................................................................... 10
Independent Auditor’s Report On Compliance For Each Major Federal Program And Report
On Internal Control Over Compliance In Accordance With The Uniform Guidance .................. 13
Independent Auditor’s Report On Financial Statements .............................................................. 16
Financial Section ........................................................................................................................... 19
Corrective Action Plan For Findings Reported Under Uniform Guidance .................................. 59
About The State Auditor’s Office ................................................................................................. 60
Washington State Auditor's Office
___________________________________________________________________________________________________________________
Page 3

SCHEDULE OF FINDINGS AND QUESTIONED COSTS
Public Utility District No. 1 of Skagit County
January 1, 2016 through December 31, 2016
SECTION I – SUMMARY OF AUDITOR’S RESULTS
The results of our audit of Public Utility District No. 1 of Skagit County are summarized below
in accordance with Title 2 U.S. Code of Federal Regulations (CFR) Part 200, Uniform
Administrative Requirements, Cost Principles, and Audit Requirements for Federal Awards
(Uniform Guidance).
Financial Statements
We issued an unmodified opinion on the fair presentation of the basic financial statements in
accordance with accounting principles generally accepted in the United States of America
(GAAP).
Internal Control over Financial Reporting:
Significant Deficiencies: We identified deficiencies in the design or operation of internal
control over financial reporting that we consider to be significant deficiencies.
Material Weaknesses: We identified no deficiencies that we consider to be material
weaknesses.
We noted no instances of noncompliance that were material to the financial statements of the
District.
Federal Awards
Internal Control over Major Programs:
Significant Deficiencies: We reported no deficiencies in the design or operation of
internal control over major federal programs that we consider to be significant
deficiencies.
Material Weaknesses: We identified no deficiencies that we consider to be material
weaknesses.
Washington State Auditor's Office
___________________________________________________________________________________________________________________
Page 4

We issued an unmodified opinion on the District’s compliance with requirements applicable to
its major federal program.
We reported no findings that are required to be disclosed in accordance with 2 CFR 200.516(a).
Identification of Major Federal Programs:
The following program was selected as a major program in our audit of compliance in
accordance with the Uniform Guidance.
CFDA No. Program or Cluster Title
66.468 Capitalization Grants for Drinking Water State Revolving Funds
The dollar threshold used to distinguish between Type A and Type B programs, as prescribed by
the Uniform Guidance, was $750,000.
The District did not qualify as a low-risk auditee under the Uniform Guidance.
SECTION II – FINANCIAL STATEMENT FINDINGS
See finding 2016-001.
SECTION III – FEDERAL AWARD FINDINGS AND QUESTIONED
COSTS
None reported.
Washington State Auditor's Office
___________________________________________________________________________________________________________________
Page 5

SCHEDULE OF AUDIT FINDINGS AND RESPONSES
Skagit County Public Utility District No. 1
January 1, 2016 through December 31, 2016
2016-001 The District’s internal controls over capital asset reporting were
inadequate to ensure accurate reporting.
Background
District commissioners, state and federal agencies, and the public rely on the
information included in the financial statements and report to make decisions.
District management is responsible for designing and following internal controls
that provide reasonable assurance regarding the reliability of financial reporting.
Our audit identified a deficiency in internal controls over financial reporting that
hindered the District’s ability to produce reliable financial statements.
Description of Condition
The Budgeting, Accounting and Reporting System (BARS) Manual outlines the
requirements for capital asset records.
The District did not have a process in place to ensure that capital asset balances,
including depreciation expense and accumulated depreciation, reported on the
financial statements are accurate and properly supported.
This deficiency in internal controls over financial reporting represents a
significant deficiency.
Cause of Condition
The District has experienced significant turnover in the accounting positions that
oversee capital asset reporting, causing a loss of knowledge of historical
transactions.
In addition, several concerns have been noted internally regarding the District’s
previous financial system, specifically the limitations on capital asset tracking and
reporting.
Effect of Condition
During our testing of capital asset depreciation calculations, significant variances
were noted for the majority of selected assets. Audit work determined that the
reported Accumulated Depreciation was under-reported by $5,492,840. The
District was unable to explain the reasoning for any differences.
Washington State Auditor's Office
___________________________________________________________________________________________________________________
Page 6

In addition, the District was unable to provide a detailed listing of Plant capital
assets separate from all asset categories, to support the balance reported on the
financial statements.
Recommendation
We recommend the District develop a process to ensure capital asset amounts are
accurately presented in the financial statements and properly supported.
District’s Response
We appreciate the work performed by the Washington State Auditor’s Office. The
District has been transitioning to a new financial system and the next module to
be implemented is asset management; which should be completed in 2017.
The majority of the issue noted in the current audit can be traced back to
reclassifications of assets in 2010 and 2012. We were able to find documentation
that supported the District’s decision in 201 that determined it would be more
efficient to combine similar assets. In 2012, the District changed the service life of
a group of assets. In both circumstances, the information was not updated
correctly resulting in depreciation not calculating in one instance and not
properly in the other; this was a result of data entry error, not a system error or
limitation.
The implementation of the new asset management module will require the District
to convert and reconcile data for all asset classifications, which will result in
better information for all users of the financial statements.
We look forward to reviewing our process with the State Auditor during the 2017
financial statement audit.
Auditor’s Remarks
We appreciate the District’s commitment to resolving the issues identified above.
We will review the corrective action taken during our next audit. We thank the
District for its cooperation and assistance during the audit.
Applicable Laws and Regulations
RCW 43.09.200 Local government accounting – Uniform system of accounting
Budgeting Accounting and Reporting System (BARS) Manual – Accounting,
Accounting Principles and General Procedures, Internal Control (3.1.3)
Government Auditing Standards, December 2011 Revision, paragraph 4.23
Washington State Auditor's Office
___________________________________________________________________________________________________________________
Page 7

The American Institute of Certified Public Accounts defines significant
deficiencies and material weaknesses in its Codification of Statements on Audit
Standards section 115
Budgeting Accounting and Reporting System (BARS) Manual – Accounting,
Capital Assets, Capital Asset Management System Requirements (3.3.9)
Washington State Auditor's Office
___________________________________________________________________________________________________________________
Page 8
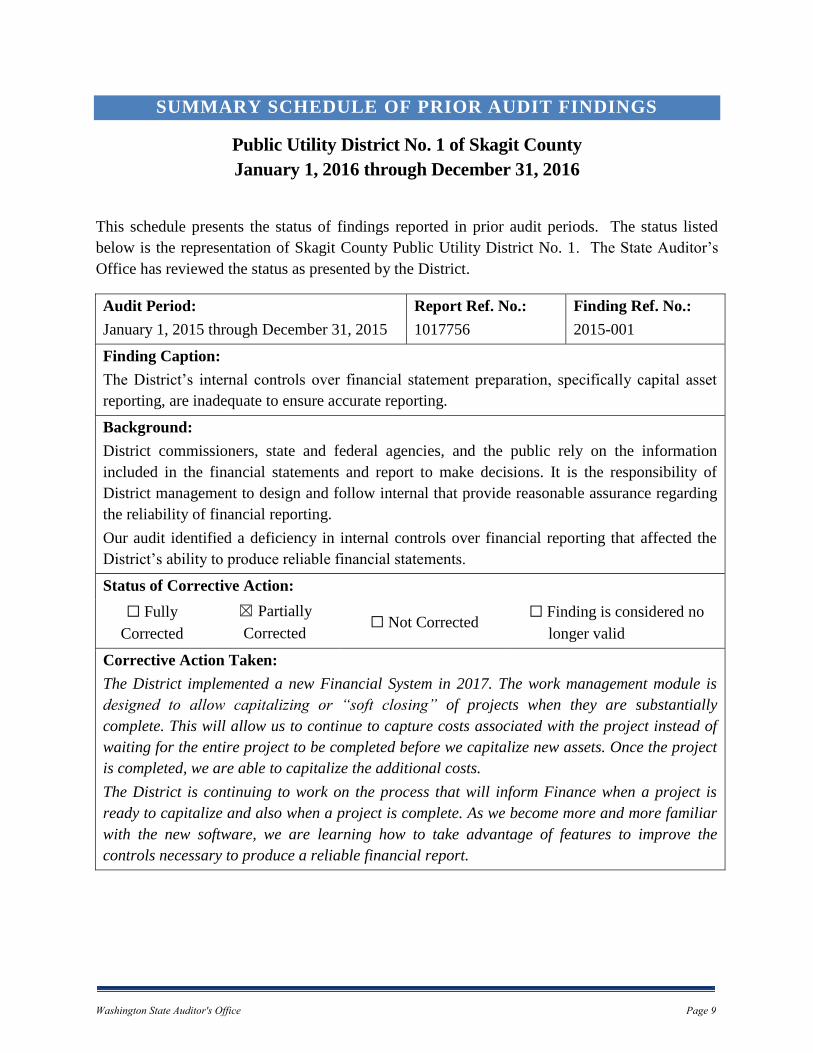
SUMMARY SCHEDULE OF PRIOR AUDIT FINDINGS
Public Utility District No. 1 of Skagit County
January 1, 2016 through December 31, 2016
This schedule presents the status of findings reported in prior audit periods. The status listed
below is the representation of Skagit County Public Utility District No. 1. The State Auditor’s
Office has reviewed the status as presented by the District.
Audit Period:
January 1, 2015 through December 31, 2015
Report Ref. No.:
1017756
Finding Ref. No.:
2015-001
Finding Caption:
The District’s internal controls over financial statement preparation, specifically capital asset
reporting, are inadequate to ensure accurate reporting.
Background:
District commissioners, state and federal agencies, and the public rely on the information
included in the financial statements and report to make decisions. It is the responsibility of
District management to design and follow internal that provide reasonable assurance regarding
the reliability of financial reporting.
Our audit identified a deficiency in internal controls over financial reporting that affected the
District’s ability to produce reliable financial statements.
Status of Corrective Action:
☐ Fully
Corrected
☒ Partially
Corrected ☐ Not Corrected
☐ Finding is considered no
longer valid
Corrective Action Taken:
The District implemented a new Financial System in 2017. The work management module is
designed to allow capitalizing or “soft closing” of projects when they are substantially
complete. This will allow us to continue to capture costs associated with the project instead of
waiting for the entire project to be completed before we capitalize new assets. Once the project
is completed, we are able to capitalize the additional costs.
The District is continuing to work on the process that will inform Finance when a project is
ready to capitalize and also when a project is complete. As we become more and more familiar
with the new software, we are learning how to take advantage of features to improve the
controls necessary to produce a reliable financial report.
Washington State Auditor's Office
___________________________________________________________________________________________________________________
Page 9

INDEPENDENT AUDITOR’S REPORT ON INTERNAL CONTROL
OVER FINANCIAL REPORTING AND ON COMPLIANCE AND
OTHER MATTERS BASED ON AN AUDIT OF FINANCIAL
STATEMENTS PERFORMED IN ACCORDANCE WITH
GOVERNMENT AUDITING STANDARDS
Public Utility District No. 1 of Skagit County
January 1, 2015 through December 31, 2016
Board of Commissioners
Public Utility District No. 1 of Skagit County
Mount Vernon, Washington
We have audited, in accordance with auditing standards generally accepted in the United States
of America and the standards applicable to financial audits contained in Government Auditing
Standards, issued by the Comptroller General of the United States, the financial statements of
Public Utility District No. 1 of Skagit County, Washington, as of and for the years ended
December 31, 2016 and 2015, and the related notes to the financial statements, which
collectively comprise the District’s basic financial statements, and have issued our report thereon
dated September 29, 2017.
INTERNAL CONTROL OVER FINANCIAL REPORTING
In planning and performing our audits of the financial statements, we considered the District’s
internal control over financial reporting (internal control) to determine the audit procedures that
are appropriate in the circumstances for the purpose of expressing our opinion on the financial
statements, but not for the purpose of expressing an opinion on the effectiveness of the District’s
internal control. Accordingly, we do not express an opinion on the effectiveness of the District’s
internal control.
A deficiency in internal control exists when the design or operation of a control does not allow
management or employees, in the normal course of performing their assigned functions, to
prevent, or detect and correct, misstatements on a timely basis. A material weakness is a
deficiency, or a combination of deficiencies, in internal control such that there is a reasonable
possibility that a material misstatement of District's financial statements will not be prevented, or
detected and corrected on a timely basis. A significant deficiency is a deficiency, or a
combination of deficiencies, in internal control that is less severe than a material weakness, yet
important enough to merit attention by those charged with governance.
Washington State Auditor's Office
___________________________________________________________________________________________________________________
Page 10

Our consideration of internal control was for the limited purpose described in the first paragraph
of this section and was not designed to identify all deficiencies in internal control that might be
material weaknesses or significant deficiencies and therefore, material weaknesses or significant
deficiencies may exist that were not identified. Given these limitations, during our audit we did
not identify any deficiencies in internal control that we consider to be material weaknesses. We
did identify certain deficiencies in internal control, described in the accompanying Schedule of
Audit Findings and Responses as Finding 2016-001 that we consider to be significant
deficiencies.
COMPLIANCE AND OTHER MATTERS
As part of obtaining reasonable assurance about whether the District’s financial statements are
free from material misstatement, we performed tests of the District’s compliance with certain
provisions of laws, regulations, contracts and grant agreements, noncompliance with which could
have a direct and material effect on the determination of financial statement amounts. However,
providing an opinion on compliance with those provisions was not an objective of our audit, and
accordingly, we do not express such an opinion.
The results of our tests disclosed no instances of noncompliance or other matters that are
required to be reported under Government Auditing Standards.
DISTRICT’S RESPONSE TO FINDINGS
The District’s response to the findings identified in our audit is described in the accompanying
Schedule of Audit Findings and Responses. The District’s response was not subjected to the
auditing procedures applied in the audit of the financial statements and, accordingly, we express
no opinion on the response.
PURPOSE OF THIS REPORT
The purpose of this report is solely to describe the scope of our testing of internal control and
compliance and the results of that testing, and not to provide an opinion on the effectiveness of
the District’s internal control or on compliance. This report is an integral part of an audit
performed in accordance with Government Auditing Standards in considering the District’s
internal control and compliance. Accordingly, this communication is not suitable for any other
Washington State Auditor's Office
___________________________________________________________________________________________________________________
Page 11
purpose. However, this report is a matter of public record and its distribution is not limited. It
also serves to disseminate information to the public as a reporting tool to help citizens assess
government operations.
Pat McCarthy
State Auditor
Olympia, WA
September 29, 2017
Washington State Auditor's Office
___________________________________________________________________________________________________________________
Page 12

INDEPENDENT AUDITOR’S REPORT ON COMPLIANCE FOR
EACH MAJOR FEDERAL PROGRAM AND REPORT ON
INTERNAL CONTROL OVER COMPLIANCE IN ACCORDANCE
WITH THE UNIFORM GUIDANCE
Public Utility District No. 1 of Skagit County
January 1, 2016 through December 31, 2016
Board of Commissioners
Public Utility District No. 1 of Skagit County
Mount Vernon, Washington
REPORT ON COMPLIANCE FOR EACH MAJOR FEDERAL
PROGRAM
We have audited the compliance of Public Utility District No. 1 of Skagit County, Skagit County, Washington, with the types of compliance requirements described in the U.S. Office of
Management and Budget (OMB) Compliance Supplement that could have a direct and material
effect on each of the District’s major federal programs for the year ended December 31, 2016.
The District’s major federal programs are identified in the accompanying Schedule of Findings
and Questioned Costs.
Management’s Responsibility
Management is responsible for compliance with federal statutes, regulations, and the terms and
conditions of its federal awards applicable to its federal programs.
Auditor’s Responsibility
Our responsibility is to express an opinion on compliance for each of the District’s major federal
programs based on our audit of the types of compliance requirements referred to above. We
conducted our audit of compliance in accordance with auditing standards generally accepted in
the United States of America; the standards applicable to financial audits contained in
Government Auditing Standards, issued by the Comptroller General of the United States; and the
audit requirements of Title 2 U.S. Code of Federal Regulations Part 200, Uniform Administrative
Requirements, Cost Principles, and Audit Requirements for Federal Awards (Uniform
Guidance). Those standards and the Uniform Guidance require that we plan and perform the
audit to obtain reasonable assurance about whether noncompliance with the types of compliance
requirements referred to above that could have a direct and material effect on a major federal
Washington State Auditor's Office
___________________________________________________________________________________________________________________
Page 13

program occurred. An audit includes examining, on a test basis, evidence about the District’s
compliance with those requirements and performing such other procedures as we considered
necessary in the circumstances.
We believe that our audit provides a reasonable basis for our opinion on compliance for each
major federal program. Our audit does not provide a legal determination on the District’s
compliance.
Opinion on Each Major Federal Program
In our opinion, the District complied, in all material respects, with the types of compliance
requirements referred to above that could have a direct and material effect on each of its major
federal programs for the year ended December 31, 2016.
REPORT ON INTERNAL CONTROL OVER COMPLIANCE
Management of the District is responsible for establishing and maintaining effective internal
control over compliance with the types of compliance requirements referred to above. In
planning and performing our audit of compliance, we considered the District’s internal control
over compliance with the types of requirements that could have a direct and material effect on
each major federal program in order to determine the auditing procedures that are appropriate in
the circumstances for the purpose of expressing an opinion on compliance for each major federal
program and to test and report on internal control over compliance in accordance with the
Uniform Guidance, but not for the purpose of expressing an opinion on the effectiveness of
internal control over compliance. Accordingly, we do not express an opinion on the
effectiveness of the District's internal control over compliance.
A deficiency in internal control over compliance exists when the design or operation of a control
over compliance does not allow management or employees, in the normal course of performing
their assigned functions, to prevent, or detect and correct, noncompliance with a type of
compliance requirement of a federal program on a timely basis. A material weakness in internal
control over compliance is a deficiency, or combination of deficiencies, in internal control over
compliance, such that there is a reasonable possibility that material noncompliance with a type of
compliance requirement of a federal program will not be prevented, or detected and corrected, on
a timely basis. A significant deficiency in internal control over compliance is a deficiency, or a
combination of deficiencies, in internal control over compliance with a type of compliance
requirement of a federal program that is less severe than a material weakness in internal control
over compliance, yet important enough to merit attention by those charged with governance.
Our consideration of internal control over compliance was for the limited purpose described in
the first paragraph of this section and was not designed to identify all deficiencies in internal
Washington State Auditor's Office
___________________________________________________________________________________________________________________
Page 14

control that might be material weaknesses or significant deficiencies. We did not identify any
deficiencies in internal control over compliance that we consider to be material weaknesses.
However, material weaknesses may exist that have not been identified.
Purpose of this Report
The purpose of this report on internal control over compliance is solely to describe the scope of
our testing of internal control over compliance and the results of that testing based on the
requirements of the Uniform Guidance. Accordingly, this report is not suitable for any other
purpose. However, this report is a matter of public record and its distribution is not limited. It
also serves to disseminate information to the public as a reporting tool to help citizens assess
government operations.
Pat McCarthy
State Auditor
Olympia, WA
September 29, 2017
Washington State Auditor's Office
___________________________________________________________________________________________________________________
Page 15

INDEPENDENT AUDITOR’S REPORT ON
FINANCIAL STATEMENTS
Public Utility District No. 1 of Skagit County
January 1, 2015 through December 31, 2016
Board of Commissioners
Public Utility District No. 1 of Skagit County
Mount Vernon, Washington
REPORT ON THE FINANCIAL STATEMENTS
We have audited the accompanying financial statements of Public Utility District No. 1 of Skagit
County, Washington, as of and for the years ended December 31, 2016 and 2015, and the related
notes to the financial statements, which collectively comprise the District’s basic financial
statements as listed on page 19.
Management’s Responsibility for the Financial Statements
Management is responsible for the preparation and fair presentation of these financial statements
in accordance with accounting principles generally accepted in the United States of America; this
includes the design, implementation, and maintenance of internal control relevant to the
preparation and fair presentation of financial statements that are free from material misstatement,
whether due to fraud or error.
Auditor’s Responsibility
Our responsibility is to express opinions on these financial statements based on our audits. We
conducted our audits in accordance with auditing standards generally accepted in the United
States of America and the standards applicable to financial audits contained in Government
Auditing Standards, issued by the Comptroller General of the United States. Those standards
require that we plan and perform the audit to obtain reasonable assurance about whether the
financial statements are free from material misstatement.
An audit involves performing procedures to obtain audit evidence about the amounts and
disclosures in the financial statements. The procedures selected depend on the auditor’s
judgment, including the assessment of the risks of material misstatement of the financial
statements, whether due to fraud or error. In making those risk assessments, the auditor
considers internal control relevant to the District’s preparation and fair presentation of the
financial statements in order to design audit procedures that are appropriate in the circumstances,
Washington State Auditor's Office
___________________________________________________________________________________________________________________
Page 16

but not for the purpose of expressing an opinion on the effectiveness of the District’s internal
control. Accordingly, we express no such opinion. An audit also includes evaluating the
appropriateness of accounting policies used and the reasonableness of significant accounting
estimates made by management, as well as evaluating the overall presentation of the financial
statements.
We believe that the audit evidence we have obtained is sufficient and appropriate to provide a
basis for our audit opinions.
Opinion
In our opinion, the financial statements referred to above present fairly, in all material respects,
the financial position of Public Utility District No. 1 of Skagit County, as of December 31, 2016
and 2015, and the changes in financial position and cash flows thereof for the years then ended in
accordance with accounting principles generally accepted in the United States of America.
Other Matters
Required Supplementary Information
Accounting principles generally accepted in the United States of America require that the
management’s discussion and analysis and required supplementary information listed on page 19
be presented to supplement the basic financial statements. Such information, although not a part
of the basic financial statements, is required by the Governmental Accounting Standards Board
who considers it to be an essential part of financial reporting for placing the basic financial
statements in an appropriate operational, economic or historical context. We have applied
certain limited procedures to the required supplementary information in accordance with auditing
standards generally accepted in the United States of America, which consisted of inquiries of
management about the methods of preparing the information and comparing the information for
consistency with management’s responses to our inquiries, the basic financial statements, and
other knowledge we obtained during our audit of the basic financial statements. We do not
express an opinion or provide any assurance on the information because the limited procedures
do not provide us with sufficient evidence to express an opinion or provide any assurance.
Supplementary and Other Information
Our audits were conducted for the purpose of forming opinions on the financial statements that
collectively comprise the District’s basic financial statements. The accompanying Schedule of
Expenditures of Federal Awards is presented for purposes of additional analysis as required by
Title 2 U.S. Code of Federal Regulations (CFR) Part 200, Uniform Administrative Requirements,
Washington State Auditor's Office
___________________________________________________________________________________________________________________
Page 17

Cost Principles, and Audit Requirements for Federal Awards (Uniform Guidance). This
schedule is not a required part of the basic financial statements. Such information is the
responsibility of management and was derived from and relates directly to the underlying
accounting and other records used to prepare the basic financial statements. The information has
been subjected to the auditing procedures applied in the audit of the basic financial statements
and certain additional procedures, including comparing and reconciling such information directly
to the underlying accounting and other records used to prepare the basic financial statements or
to the basic financial statements themselves, and other additional procedures in accordance with
auditing standards generally accepted in the United States of America. In our opinion, the
information is fairly stated, in all material respects, in relation to the basic financial statements
taken as a whole.
OTHER REPORTING REQUIRED BY GOVERNMENT AUDITING
STANDARDS
In accordance with Government Auditing Standards, we have also issued our report dated
September 29, 2017 on our consideration of the District’s internal control over financial
reporting and on our tests of its compliance with certain provisions of laws, regulations, contracts
and grant agreements and other matters. The purpose of that report is to describe the scope of
our testing of internal control over financial reporting and compliance and the results of that
testing, and not to provide an opinion on internal control over financial reporting or on
compliance. That report is an integral part of an audit performed in accordance with Government
Auditing Standards in considering the District’s internal control over financial reporting and
compliance.
Pat McCarthy
State Auditor
Olympia, WA
September 29, 2017
Washington State Auditor's Office
___________________________________________________________________________________________________________________
Page 18

FINANCIAL SECTION
Public Utility District No. 1 of Skagit County
January 1, 2015 through December 31, 2016
REQUIRED SUPPLEMENTARY INFORMATION
Management’s Discussion and Analysis – 2016 and 2015
BASIC FINANCIAL STATEMENTS
Comparative Statement of Net Position – 2016 and 2015
Comparative Statement of Revenues, Expenses and Changes in Net Position – 2016 and
2015
Comparative Statement of Cash Flows – 2016 and 2015
Notes to Financial Statements – 2016 and 2015
REQUIRED SUPPLEMENTARY INFORMATION
OPEB Schedule of Funding Progress – 2016
OPEB Schedule of Employer Contributions – 2016
Schedule of Proportionate Share of Net Pension Liability – PERS 1, PERS 2/3 – 2016
Schedule of Employer Contributions – PERS 1, PERS 2/3 – 2016
Schedule of Employer Contributions – Western Conference of Teamsters Pension Plan –
2016
SUPPLEMENTARY AND OTHER INFORMATION
Schedule of Expenditures of Federal Awards – 2016
Notes to the Schedule of Expenditures of Federal Awards – 2016
Washington State Auditor's Office
___________________________________________________________________________________________________________________
Page 19

PUBLIC UTILITY DISTRICT NO. 1 OF SKAGIT COUNTY
MANAGEMENT DISCUSSION AND ANALYSIS For the Years Ended December 31, 2016 and 2015
MANAGEMENT’S DISCUSSION AND ANALYSIS The Management Discussion and Analysis of Public Utility District No. 1 of Skagit County (the District) provides an overview and analysis of the District’s financial activities for the year ended December 31, 2016 with comparative data for 2015 and 2014. This information is designed to be used in conjunction with the financial statements and accompanying notes. OVERVIEW OF THE FINANCIAL STATEMENTS Basic Financial Statements The District accounts for its financial activity within a single enterprise fund. The activities of the District are comprised of treating and distributing water, as well as the sale of wholesale telecommunication services. The District also has voter-approved authority for sewer, although the District does not have sewer operations at this time. The basic financial statements of the District are designed to provide readers with a broad overview of the District’s finances similar to statements of a private-sector business. They are prepared using the accrual basis of accounting in accordance with generally accepted accounting principles. Under this basis of accounting, revenues are recognized in the period in which they are earned and expenses are recognized in the period in which they are incurred, regardless of the timing of related cash flows. These statements offer short-term and long-term financial statement information about District activities. The basic financial statements are comprised of: The Comparative Statement of Net Position: The District presents its statement of net position using the balance sheet format. The statement provides information on all of the District’s assets, deferred outflows, liabilities, deferred inflows, and net position at year end. The net position section is separated into three categories; net investment in capital assets; restricted net positon; and unrestricted net position. Investment in capital assets reflects the District’s investment in capital assets (land, plant, and equipment) less any remaining related debt. Restricted assets represent resources that are subject to external restrictions on how the funds may be used. Restrictions placed on these assets generally relate to constraints derived from grants, loans, or other debt. Unrestricted assets may be used to meet the District’s ongoing obligations. The Comparative Statement of Revenues, Expenses, and Changes in Net Position: This statement provides information on the District’s current and prior year revenues and expenses. Revenues are classified by major source and expenses are classified by function. Revenues and expenses are classed as operating or non-operating based upon the nature of the transaction. The Comparative Statement of Cash Flows: This statement provides relevant information about the District’s cash receipts and cash payments for operations as well as funds provided and used by investing and financing activities during the year. Notes to the Financial Statements: The notes to the financial statements are presented at the end of the basic financial statements and provide additional information that is essential to a full understanding of the data provided in the basic financial statements
Washington State Auditor's Office
___________________________________________________________________________________________________________________
Page 20

FINANCIAL ANALYSIS
The following analysis provides a three-year comparison of key financial information:
Capital Assets The increase in capital assets and construction in progress are the results of the completion of a few large multi-year pipeline replacement projects that transferred the related costs from the construction in progress to the capital asset and projects that moved from the design phase to construction phase. The following is a summary of the major projects completed in 2016:
Discovery, Peterson to Gailee & Gull Dr, Gailee to Maple Crest Dr Ball Road East (500’) Mann Road LUD #31 Bulk Water Filling stations at Bow Hill Rd and Old Highway 99 The conversion of the Accounting, Customer Service, and Work Management systems. Security systems put into place at the Water Treatment Plant Various developer projects and annual pipe replacement and upsizing projects
2016 2015 Change 2014Assets
Current and other assets 21,757,650$ 15,920,843$ 36.66% 14,971,953$
Capital assets 162,110,153 153,002,914 5.95% 150,906,976
Total assets 183,867,803 168,923,757 8.85% 165,878,929
Deferred outflow of resources 1,136,027 562,579 101.93% 246,758
Liabilities
Current and other liabilities 6,292,782$ 4,832,521$ 30.22% 4,497,961$
Long-term liabilities 30,532,776 22,548,622 35.41% 23,146,066
Total liabilities 36,825,558 27,381,143 34.49% 27,644,027
Deferred inflow of resources 105,213 713,799 -85.26% 1,572,800
Net Position
Net investment in capital assets 136,557,964$ 134,107,401$ 1.83% 130,113,953$
Restricted 6,496,763 221,904 2827.74% 396,075
Unrestricted 5,018,332 7,062,089 -28.94% 6,398,832
Total net position 148,073,059 141,391,394 4.73% 136,908,860
Condensed Comparative Statement of Net Position
Washington State Auditor's Office
___________________________________________________________________________________________________________________
Page 21

The following is a summary of the major projects that completed design work and construction started in 2016:
Josh Wilson Road, Higgins Airport Way to Walker Road Pipeline and Fiber and Old Highway 99 to Tina’s Coma Reservoir Fiber
Chemical Feed System for the Water Treatment Plant N 30th Street Transmission Line and Digby Road Pipeline, Phase I N 30th Street Transmission Line and Digby Road Pipeline, Phase II E Division Street Tank and Booster Pump Station Warehouse storage building on campus
The District’s 2017 capital budget includes plans for investing an additional $19.878 million of new and existing funds into capital improvements. This plan includes:
I-5 crossing at Conway Replacing the raw water PS Pump at the Skagit River Diversion Purchase of 250 acres around the Gilligan Creek watershed Mundt Creek Intake Improvements Judy WTP to Mount Vernon Transmission Line-Phase 2 Annual plant replacement and upsizing of infrastructure
See Note 3 for more information regarding capital asset activity.
Long-term Liabilities The increase in long-term liabilities is attributed to a 2016 Revenue bond issue of $6.3 million to fund the Judy WTP to Mount Vernon transmission Line – Phase II project and draws of $2.4 million against a Drinking Water loan to fund the E Division Street Tank, Booster Pump Station and Piping project. The District will be receiving $4.2 million in 2017 from an additional bond issue. See note 6 for more information regarding outstanding debt. Net Position The restricted portion of total net position, represent resources that are subject to external restrictions on how the funds may be used. The 2016 Revenue Bond issue was relatively unspent by the end of 2016; these unspent funds are reflected as restricted for capital projects. The decrease in unrestricted net position is a result of an aggressive pipe replacement program that is funded by water revenues.
Changes in the District’s net position can be determined by reviewing the following condensed Statement of Revenues, Expenses, and Changes in Net Position.
Washington State Auditor's Office
___________________________________________________________________________________________________________________
Page 22
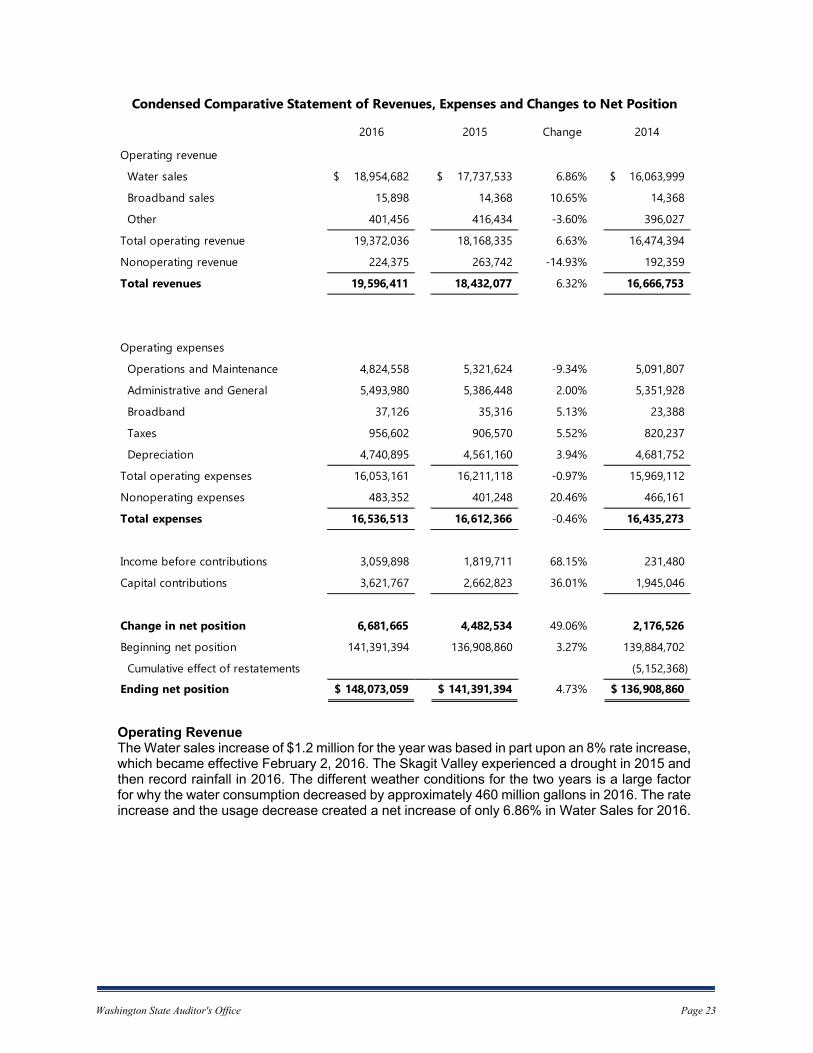
Operating Revenue The Water sales increase of $1.2 million for the year was based in part upon an 8% rate increase, which became effective February 2, 2016. The Skagit Valley experienced a drought in 2015 and then record rainfall in 2016. The different weather conditions for the two years is a large factor for why the water consumption decreased by approximately 460 million gallons in 2016. The rate increase and the usage decrease created a net increase of only 6.86% in Water Sales for 2016.
2016 2015 Change 2014
Operating revenue
Water sales 18,954,682$ 17,737,533$ 6.86% 16,063,999$
Broadband sales 15,898 14,368 10.65% 14,368
Other 401,456 416,434 -3.60% 396,027
Total operating revenue 19,372,036 18,168,335 6.63% 16,474,394
Nonoperating revenue 224,375 263,742 -14.93% 192,359
Total revenues 19,596,411 18,432,077 6.32% 16,666,753
Operating expenses
Operations and Maintenance 4,824,558 5,321,624 -9.34% 5,091,807
Administrative and General 5,493,980 5,386,448 2.00% 5,351,928
Broadband 37,126 35,316 5.13% 23,388
Taxes 956,602 906,570 5.52% 820,237
Depreciation 4,740,895 4,561,160 3.94% 4,681,752
Total operating expenses 16,053,161 16,211,118 -0.97% 15,969,112
Nonoperating expenses 483,352 401,248 20.46% 466,161
Total expenses 16,536,513 16,612,366 -0.46% 16,435,273
Income before contributions 3,059,898 1,819,711 68.15% 231,480
Capital contributions 3,621,767 2,662,823 36.01% 1,945,046
Change in net position 6,681,665 4,482,534 49.06% 2,176,526
Beginning net position 141,391,394 136,908,860 3.27% 139,884,702
Cumulative effect of restatements (5,152,368)
Ending net position 148,073,059$ 141,391,394$ 4.73% 136,908,860$
Condensed Comparative Statement of Revenues, Expenses and Changes to Net Position
Washington State Auditor's Office
___________________________________________________________________________________________________________________
Page 23

Operating Expenses Operating expenses decreased by .97% for 2016 The District did experience higher legal costs due to personnel issues, increased cost in water purchased through the City of Anacortes due to a new agreement, but that was offset by unfilled budgeted positions and updating the rate our equipment is charged to capital projects. Change in Net Position At the end of 2016, the District’s total net position increased by $6,681,665. Two major components of that increase were an operating income of $3,318,875 and capital contributions of $3,621,767. ECONOMIC FACTORS AND NEXT YEAR’S BUDGET AND RATES The District’s annual budget, as approved by the Board of Commissioners, outlines its plan for operations, maintenance, and growth, in order to provide quality potable water to the District’s customers for the present and foreseeable future. In considering the District’s budget for the 2017 year, the Board of Commissioners and management used the following estimates:
Revenue from water sales and charges are expected to increase as a result of a rate increase of 8.5%.
Capital contributions are expected to be $2,935,000. This amount includes $600,000 in fees approved to fund pipe replacement.
Operating expenses, excluding depreciation and OPEB, are expected to increase approximately 2.7% in 2017. Unfilled positions, repairs to the Skagit River Diversion and Water Treatment Plant, and contracting out our billing process are some of the contributors to the increase.
REQUESTS FOR INFORMATION The basic financial statements, notes and management discussion and analysis are designed to provide a general overview of the District’s finances. If you have any questions about the report or need additional financial information, contact the District Treasurer at: Public Utility District No. 1 of Skagit County Attention: Treasurer Post Office Box 1436 Mount Vernon, Washington 98273-1436
Washington State Auditor's Office
___________________________________________________________________________________________________________________
Page 24

The notes to the financial statements are an integral part of this statement.
ASSETS
CURRENT ASSETS 2016 2015Cash and cash equivalents 4,272,905$ 6,023,464$ Restricted assets
Cash and cash equibalents 136,677 160,100 Receivables - 39,931
Customer accounts receivable, net 2,689,844 2,104,224 Accounts receivable, other 894,177 103,182 Materials inventory 1,507,917 1,647,025 Prepaid insurance 227,461 26,073 Other current assets 170,613 167,578
Total current assets 9,899,594 10,271,577
NON-CURRENT ASSETSInvestments 3,640,759 2,757,237 Restricted assets
Cash and cash equibalents 6,184,616 - Investments 309,220 217,061
Assessment receivable 948,322 879,191 Preconstruction costs 767,753 1,781,775 Other non-current assets 7,386 14,002 Capital assets not being depreciated
Non-operating property 29,521 29,521 Land and land rights 579,821 579,821 Earthen impounding reservoir 12,375,489 12,375,489 Construction in progress 6,070,441 7,666,801
Capital assets net of accumulated depreciationPlant 135,419,800 125,632,784 Equipment 7,635,081 6,718,498
Total non-current assets 173,968,209 158,652,180
Total assets 183,867,803 168,923,757
DEFERRED OUTFLOWS OF RESOURCESDeferred outflows related to pensions 1,136,027 562,579
Total deferred outflows of resources 1,136,027 562,579
TOTAL ASSETS AND DEFERRED OUTFLOWS OF RESOURCES 185,003,830$ 169,486,336$
PUBLIC UTILITY DISTRICT NO. 1 OF SKAGIT COUNTY
COMPARATIVE STATEMENTS OF NET POSITION
DECEMBER 31, 2016 AND 2015
Washington State Auditor's Office
___________________________________________________________________________________________________________________
Page 25

The notes to the financial statements are an integral part of this statement.
LIABILITIES
CURRENT LIABILITIES 2016 2015Accounts payable 2,387,401$ 1,311,165$ Taxes payable 147,250 118,339 Customer deposits 168,854 165,688 Restricted liabilities
Debt interest 133,750 155,257 Accrued interest on debt 53,857 39,311 Bonds and loans payable 2,934,307 2,647,223 Other current liabilities 467,363 395,538
Total current liabilities 6,292,782 4,832,521
NON-CURRENT LIABILITIESOther post-employment benefits 1,285,524 1,018,703 Compensated absences 551,183 484,280 Long-term debt, revenue bonds 10,197,203 5,234,958 Long-term debt, loans 12,420,679 11,027,334
Net Pension Liability 6,078,187 4,783,347
Total non-current liabilities 30,532,776 22,548,622
Total liabilities 36,825,558 27,381,143
DEFERRED INFLOWS OF RESOURCESDeferred inflows related to pensions 105,213 713,799
Total deferred inflows of resources 105,213 713,799
NET POSITIONNet investment in capital assets 136,557,964 134,107,401Restricted for
Debt service 312,147 221,904Capital projects 6,184,616 0
Unrestricted 5,018,332 7,062,089
Total net position 148,073,059 141,391,394
TOTAL LIABILITIES, DEFERRED INFLOWS OF RESOURCES AND NET POSITION 185,003,830$ 169,486,336$
COMPARATIVE STATEMENT OF NET POSITION
PUBLIC UTILITY DISTRICT NO. 1 OF SKAGIT COUNTY
DECEMBER 31, 2016 AND 2015
Washington State Auditor's Office
___________________________________________________________________________________________________________________
Page 26

The notes to the financial statements are an integral part of this statement.
OPERATING REVENUESWater sales 2016 2015
Residential and multiple 13,355,049$ 12,597,211$ Commercial, industrial and farms 4,554,616 4,122,563 Government 559,800 505,485 Resale 89,261 96,143 Irrigation 395,956 416,131
Broadband sales 15,898 14,368 Other sales 401,456 416,434
Total operating revenues 19,372,036 18,168,335
OPERATING EXPENSESSupply 787,604 735,439 Treatment 1,713,345 1,718,875 Transmission and distribution 2,323,609 2,867,310 Broadband 37,126 35,316 Customer accounts 1,255,267 1,109,612 Administrative and general 4,238,713 4,276,836 Utility taxes 956,602 906,570 Depreciation and amortization 4,740,895 4,561,160
Total operating expenses 16,053,161 16,211,118
Operating income (loss) 3,318,875 1,957,217
NON-OPERATING REVENUES (EXPENSES)Interest income 47,461 7,947 LUD interest and penalty income 36,768 44,442 Interest and related charges (466,909) (384,027) Federal rebates on revenue bonds 66,151 66,009 Gain (loss) on capital asset disposition 42,684 104,394 Other non-operating revenues 31,311 40,950 Other non-operating expenses (16,443) (17,221)
Total non-operating revenues (expenses) (258,977) (137,506)
Income before capital contributions 3,059,898 1,819,711
CAPITAL CONTRIBUTIONSNon-donated plant 123,850 269,388 Donated plant 880,379 513,224 System development fees 1,341,132 1,216,991 Services 367,340 248,944 Pipe replacement 591,860 374,345 Local utility districts 269,796 - Capital grants 47,410 39,931
Total capital contributions 3,621,767 2,662,823
Change in net position 6,681,665 4,482,534
TOTAL NET POSITION - beginning of year 141,391,394 136,908,860
TOTAL NET POSITION - end of year 148,073,059$ 141,391,394$
PUBLIC UTILITY DISTRICT NO. 1 OF SKAGIT COUNTY
FOR YEARS ENDED DECEMBER 31, 2016 AND 2015
COMPARATIVE STATEMENTS OF REVENUES, EXPENSES, AND CHANGES IN FUND NET POSITION
Washington State Auditor's Office
___________________________________________________________________________________________________________________
Page 27

The notes to the financial statements are an integral part of this statement.
2016 2015
CASH FLOWS FROM OPERATING ACTIVITIES
Cash received from customers 18,775,082$ 18,099,325$
Cash payments to suppliers for goods and services (1,306,515) (3,550,238)
Cash payments to employees for services (7,659,247) (7,878,316)
Cash payments for taxes (927,691) (860,433)
Other cash receipts or (payments) 10,465 32,431
Net cash provided (used) by operating activities 8,892,094 5,842,769
CASH FLOWS FROM NON-CAPITAL FINANCING ACTIVITIES
Cash received from non-capital grants - -
Net cash provided (used) for non-capital financing actitivies - -
CASH FLOWS FROM CAPITAL AND RELATED FINANCING ACTIVITIES
Acquisition and construction of capital assets (12,002,306) (5,853,356)
Proceeds from sale of capital assets 48,537 128,999
Principal paid on captial debt (2,647,222) (2,607,223)
Interest paid on capital debt (486,651) (429,829)
Federal interest rebates 66,151 66,009
Bond issues and Loan proceeds 8,730,218 627,336
Grant proceeds 87,341 -
Proceeds from customers for capital purposes 2,656,623 2,372,741
Net cash provided (used) for capital and related financing activities (3,547,309) (5,695,323)
CASH FLOWS FROM INVESTING ACTIVITIES
Purchase of investment securities (998,118) (2,990,203)
Proceeds from sale or maturity of investment securities - 2,000,000
Investment income proceeds 63,967 12,689
Net cash provided (used) for investing activities (934,151) (977,514)
Net increase (decrease) in cash and cash equivalents 4,410,634 (830,068)
CASH AND CASH EQUIVALENTS AT BEGINNING OF YEAR 6,183,564 7,013,632
CASH AND CASH EQUIVALENTS AT END OF YEAR 10,594,198$ 6,183,564$
PUBLIC UTILITY DISTRICT NO. 1 OF SKAGIT COUNTY
COMPARATIVE STATEMENTS OF CASH FLOWS
FOR YEARS ENDED DECEMBER 31, 2016 AND 2015
Washington State Auditor's Office
___________________________________________________________________________________________________________________
Page 28

The notes to the financial statements are an integral part of this statement.
2016 2015
RECONCILIATION OF OPERATING INCOME TO NET CASH
PROVIDED BY (USED IN) OPERATING ACTIVITIES
Net operating income (loss) 3,318,875$ 1,957,217$
Adjustments to reconcile operating income to net cash
provided by (used in) operating activities
Depreciation and amortization 4,740,895 4,561,160
Other Income (Expenses) 10,465 32,431
Change in assets and liabilities
Accounts receivable (585,396) (66,359)
Inventory 139,108 (272,944)
Other current assets (201,388) 44,820
Preliminary expenses (72,571) (939,320)
Accounts payable 113,370 8,559
Accrued taxes 1,161,915 241,966
Other postemployment benefits 266,821 275,239
Net cash provided by operating activities 8,892,094$ 5,842,769$
During the year 2016, plant assets of $228,157 were donated to the District.
During the year 2015, plant assets of $497,725 were donated to the District.
FOR YEARS ENDED DECEMBER 31, 2016 AND 2015
PUBLIC UTILITY DISTRICT NO. 1 OF SKAGIT COUNTY
COMPARATIVE STATEMENT OF CASH FLOWS
Washington State Auditor's Office
___________________________________________________________________________________________________________________
Page 29

PUBLIC UTILITY DISTRICT NO. 1 OF SKAGIT COUNTY
NOTES TO FINANCIAL STATEMENTS For the Years Ended December 31, 2016 and 2015
These notes are an integral part of the accompanying financial statements. NOTE 1 – SUMMARY OF SIGNIFICANT ACCOUNTING POLICIES The accounting policies of the District conform to generally accepted accounting principles (GAAP) as applicable to proprietary funds of governments. The Governmental Accounting Standards Board (GASB) is the accepted standard setting body for establishing governmental accounting and financial reporting principles. The significant accounting policies are described below. Reporting Entity Public Utility District No. 1 of Skagit County (the District) is a municipal corporation governed by an elected three-person Commission, authorized under Title 54 RCW. The District is a special purpose government that provides water supply and distribution services. In addition, the District provides wholesale telecommunication services. As required by generally accepted accounting principles, management has considered all potential component units in defining the reporting entity. The District has no component units. Basis of Accounting and Presentation The accounting records of the District are maintained in accordance with methods prescribed by the State Auditor under the authority of Chapter 43.09 RCW and are based on the Uniform System of Accounts for Class A and B Water Utilities as prescribed by the National Association of Regulatory Utility Commissioners. The District uses the full-accrual basis of accounting where revenues are recognized when earned and expenses are recognized when incurred. Capital asset purchases and construction are capitalized and unbilled utility service receivables are recorded at year end. Operating revenues are defined as related to the sale of water to customers and to other services that are usually provided under standard rate schedules or by contractual arrangements. Operating expenses are defined as related to the operations and maintenance of treating and distributing water, customer service activities and general administration. Non-operating revenues and expenses are all revenues and expenses not meeting these definitions, such as financing and investing activities. Cash and Cash Equivalents For purposes of the statement of cash flows, the District considers all highly liquid investments (including restricted assets) with a maturity of three months or less to be cash equivalents. Balances in the Local Government Investment Pool (LGIP) are considered cash equivalents as they can be converted into cash within one business day.
Washington State Auditor's Office
___________________________________________________________________________________________________________________
Page 30

Investments See Note 2 – Deposits and Investments Receivables The District maintains receivable for its billing for water service, property improvement assessments, and other miscellaneous billings. It is the District’s policy to write off accounts as uncollectible after 90 days, at which time they are turned over to collection. Any subsequently collected accounts reduce bad debt expense. Inventories Inventories are valued at average weighted cost, which approximates the market value. Restricted Assets and Liabilities In accordance with bond resolutions and other agreements, separate reserve accounts have been established for restricted or limited-use resources. The assets held in these funds are restricted for specific uses, including construction, debt service, and other reserve requirements. The restricted assets of the District are composed of the following: 2016 2015 Cash and Investments – Debt Service $ 445,897 $ 377,162
Cash and Investments – Construction $ 6,184,616 $ 0
Capital Assets Capital assets are defined by the District as assets with individual costs of more than $5,000 and an estimated useful life in excess of two years. The cost of maintenance and repairs is charged to expense as incurred, while the cost of replacements and improvements is capitalized. Utility plant and other capital assets are recorded at the original cost where the historical cost is known. Where historical cost is not known, assets are recorded at fair market value, as determined by Engineer’s estimate. Donations by developers and customers are recorded at the contract price and donor cost. An allowance for funds used during construction is capitalized as part of the cost of utility plant. This procedure is intended to remove the cost of financing construction activity from the statement of revenues, expenses and changes in net position and to treat such cost in the same manner as construction labor and material costs. Capital assets are depreciated using the straight-line method over the following estimated useful lives: Water Mains (Transmission, distribution, and supply) 70 years Structures and improvements 50 years Services 40 years Intakes, wells, reservoirs, standpipes, and hydrants 30 years
Pumping equipment 20 years Meters 15 years General plant, furniture, tools, lab, and other equipment 10 years Transportation and power-operated equipment 6.67 years
Washington State Auditor's Office
___________________________________________________________________________________________________________________
Page 31

Depreciation is recorded the year following acquisition or construction. When a capital asset is retired, or otherwise disposed of, the original cost is removed from the capital asset account and from accumulated depreciation Preconstruction costs incurred for proposed projects are deferred pending construction of the project. Costs relating to projects ultimately constructed are reclassified to utility plant. If the projects are abandoned, the costs are expensed. See Note 3 – Capital Assets Compensated Absences The District maintains a Personal Leave Plan (PLP) for vacation, sick and family leave purposes; accruing based upon an employee’s length of service. Personal Leave may be carried forward from year-to-year to a maximum accumulation of 800 hours. Any accumulated Personal Leave balance is paid to the employee at retirement, termination of employment or death. The exception is for employees retiring from the PERS 1 Retirement System. These employees may be paid a maximum of 240 hours compensated leave at retirement. The District records PLP as a component of payroll labor load as earned with a liability representing earned leave balances not yet taken. The District maintains a Supplemental Leave Bank which originated from a former sick leave plan at the change to the Personal Leave Plan. The old sick leave is non-accruing and no portion is payable at termination of employment. It is used solely to supplement short-term disability for those eligible. Pensions For purposes of measuring the net pension liability, deferred outflows of resources and deferred inflows of resources related to pensions, and pension expense, information about the fiduciary net position of all state sponsored pension plans and additions to/deductions from those plans’ fiduciary net position have been determined on the same basis as they are reported by the Washington State Department of Retirement Systems. For this purpose, benefit payments (including refunds of employee contributions) are recognized when due and payable in accordance with the benefit terms. Investments are reported at fair value. See Note 10 – Pension Plans. Use of Estimates The preparation of the financial statements, in conformity with Generally Accepted Accounting Principles (GAAP), requires management to make estimates and assumptions that affect amounts reported in the financial statements. Estimates may be included in the disclosure of contingent assets and liabilities at the date of the financial statements, and in the reported amounts of revenues and expenses during the reporting period. Actual results could differ from these estimates. Financial Statement Reclassifications Certain prior year amounts have been reclassified to conform to the current year presentation. NOTE 2 – DEPOSITS AND INVESTMENTS Deposits The District’s deposits are entirely covered by the Federal Depository Insurance Corporation (FDIC) or by collateral held in a multiple financial institution collateral pool administered by the
Washington State Auditor's Office
___________________________________________________________________________________________________________________
Page 32
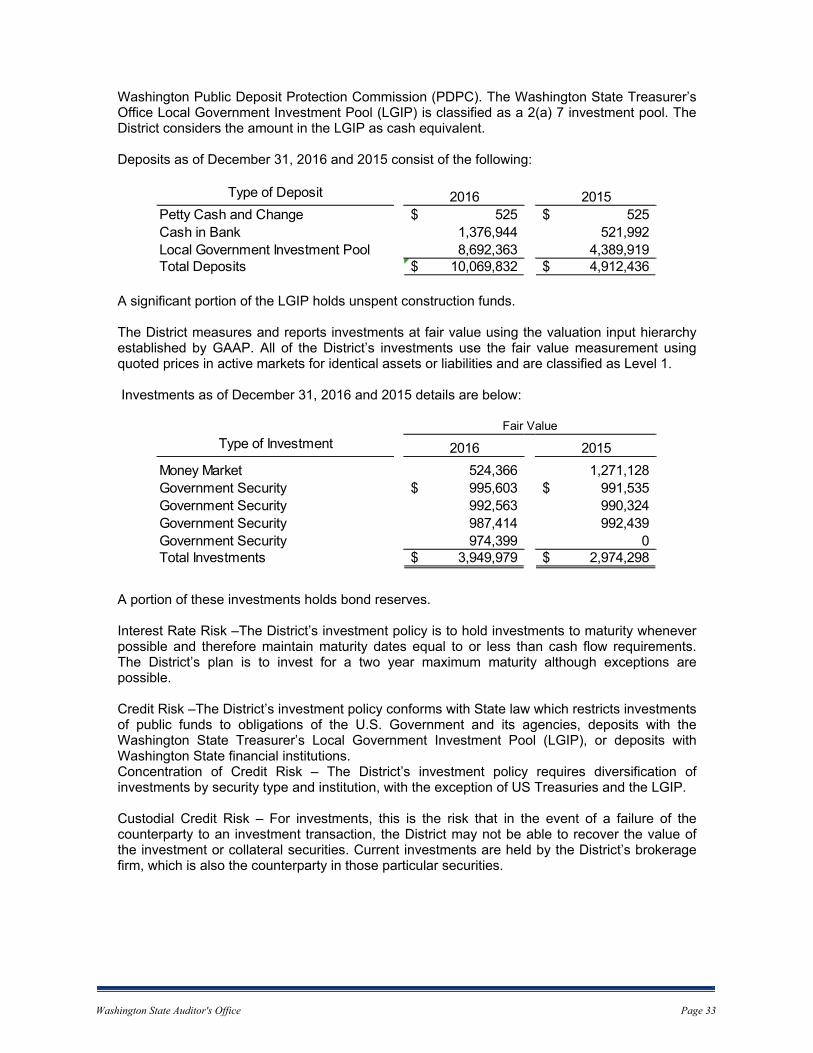
Washington Public Deposit Protection Commission (PDPC). The Washington State Treasurer’s Office Local Government Investment Pool (LGIP) is classified as a 2(a) 7 investment pool. The District considers the amount in the LGIP as cash equivalent. Deposits as of December 31, 2016 and 2015 consist of the following:
A significant portion of the LGIP holds unspent construction funds. The District measures and reports investments at fair value using the valuation input hierarchy established by GAAP. All of the District’s investments use the fair value measurement using quoted prices in active markets for identical assets or liabilities and are classified as Level 1. Investments as of December 31, 2016 and 2015 details are below:
A portion of these investments holds bond reserves. Interest Rate Risk –The District’s investment policy is to hold investments to maturity whenever possible and therefore maintain maturity dates equal to or less than cash flow requirements. The District’s plan is to invest for a two year maximum maturity although exceptions are possible. Credit Risk –The District’s investment policy conforms with State law which restricts investments of public funds to obligations of the U.S. Government and its agencies, deposits with the Washington State Treasurer’s Local Government Investment Pool (LGIP), or deposits with Washington State financial institutions. Concentration of Credit Risk – The District’s investment policy requires diversification of investments by security type and institution, with the exception of US Treasuries and the LGIP. Custodial Credit Risk – For investments, this is the risk that in the event of a failure of the counterparty to an investment transaction, the District may not be able to recover the value of the investment or collateral securities. Current investments are held by the District’s brokerage firm, which is also the counterparty in those particular securities.
Type of Deposit 2016 2015Petty Cash and Change 525$ 525$ Cash in Bank 1,376,944 521,992Local Government Investment Pool 8,692,363 4,389,919Total Deposits 10,069,832$ 4,912,436$
Type of Investment 2016 2015
Money Market 524,366 1,271,128Government Security 995,603$ 991,535$ Government Security 992,563 990,324Government Security 987,414 992,439Government Security 974,399 0Total Investments 3,949,979$ 2,974,298$
Fair Value
Washington State Auditor's Office
___________________________________________________________________________________________________________________
Page 33

NOTE 3 – CAPITAL ASSETS Utility plant activity for the year ended December 31, 2016 was as follows:
Interest incurred by the District during the current year is $479,691. Of this amount, $46,027 was included as part of the capitalized value. Utility plant activity for the year ended December 31, 2015 was as follows:
Interest incurred by the District during 2015 was $416,172. Of this amount, $41,663 was included as part of the capitalized value.
Balance Increase Decrease Ending Balance
Utility plant not being depreciated:Non-operating property 29,521$ -$ -$ 29,521$
Land and land rights 579,821 - - 579,821
Earthen impounding reservoir 12,375,489 - - 12,375,489
Construction in progress 7,666,801 13,493,217 (15,089,577) 6,070,441
Total utility plant not being depreciated 20,651,632 13,493,217 (15,089,577) 19,055,272
Utility plant being depreciated:Plant 188,835,639 14,407,359 (440,484) 202,802,514
Equipment 9,743,322 1,042,989 - 10,786,311
Total utility plant being depreciated 198,578,961 15,450,348 (440,484) 213,588,825
Accumulated depreciation for:Plant (63,202,855) (4,587,382) 434,631 (67,355,606)
Equipment (3,024,824) (153,514) - (3,178,338)
Total accumulated depreciation (66,227,679) (4,740,896) 434,631 (70,533,944)
Total utility plant being depreciated, net 132,351,282 10,709,452 (5,853) 143,054,881
TOTAL UTILITY PLANT, NET 153,002,914$ 24,202,669$ (15,095,430)$ 162,110,153$
Beginning Balance Increase Decrease Ending Balance
Utility plant not being depreciated:Non-operating property 29,521$ -$ -$ 29,521$
Land and land rights 585,877 - (6,056) 579,821
Earthen impounding reservoir 12,375,489 - - 12,375,489
Construction in progress 8,076,635 6,183,979 (6,593,813) 7,666,801
Total utility plant not being depreciated 21,067,522 6,183,979 (6,599,869) 20,651,632
Utility plant being depreciated:Plant 182,414,049 6,868,830 (447,240) 188,835,639
Equipment 9,818,451 222,708 (297,837) 9,743,322
Total utility plant being depreciated 192,232,500 7,091,538 (745,077) 198,578,961
Accumulated depreciation for:Plant (59,331,753) (4,351,976) 480,874 (63,202,855)
Equipment (3,061,294) (209,184) 245,654 (3,024,824)
Total accumulated depreciation (62,393,047) (4,561,160) 726,528 (66,227,679)
Total utility plant being depreciated, net 129,839,453 2,530,378 (18,549) 132,351,282
TOTAL UTILITY PLANT, NET 150,906,975$ 8,714,357$ (6,618,418)$ 153,002,914$
Washington State Auditor's Office
___________________________________________________________________________________________________________________
Page 34

NOTE 4 – CONSTRUCTION IN PROGRESS The District had active construction projects as of December 31, 2016 in the amount of $6,070,441; these are listed as Construction in Progress on the Statement of Net Position. As of December 31, 2016, the District’s commitments with contractors are as follows:
The District had active construction projects as of December 31, 2015 in the amount of $7,666,801; these are listed as Construction in Progress on the Statement of Net Position. As of December 31, 2015, the District’s commitments with contractors are as follows:
NOTE 5 – LEASE COMMITMENTS The District has no capital or operating lessee commitments as of December 31, 2016. NOTE 6 – LONG-TERM DEBT AND LIABILITIES Long-Term Debts The District issues revenue bonds and has loans obtained through State and Federal programs to finance the acquisition of property or equipment or construction of utility plant improvements or replacements of the existing water infrastructure. The bonds are repaid using the water revenue of the District.
Spent RemainingProject to Date CommitmentJosh Wilson Road, Higgins Airport Way to Walker Road Pipeline and Fiber 1,183,749 369,840Chemical Feed System at the Water Treatment Plant 5,899 599,531N 30th Street Transmission Line & Digby Pipeline, Phase I 763,590 64,640N 30th Street Transmission Line & Digby Pipeline, Phase II 2,295,554 110,897E Division Street Tank and Booster Pump Station 283,733 7,624,988Warehouse 0 89,248
ProjectSpent to
DateRemaining
CommitmentGilligan Road Culvert Replacement 4,062 1,197
Old Day Creek Road "A" Street to Transmission Line 903,810 43,662Judy WTP to SW Transmission Line Phase 1 931,099 44,981
Washington State Auditor's Office
___________________________________________________________________________________________________________________
Page 35

Long-term debts as of December 31, 2016, are as follows:
The annual requirements for all debts outstanding as of December 31, 2016, are as follows:
Description Maturity RangeStated Interest
RateOriginal Amount
Amount of Installment
Water Revenue Refunding Bond, 2008 2009 - 2018 3.5% - 4.25% 7,205,000 805,000
Water Revenue Bond, 2009A 2009 - 2016 2.75% - 4.0% 1,335,000 220,000
Water Revenue Bonds, 2009B (Taxable Build America Bonds)
2017 - 20294.159% - 5.824%
Original3,660,000 0
Water Revenue Bond, 2016 2017 - 2036 2.65% - 10% 6,300,000 0
Bond Premiums2008, 2009 Issuances
N/A 275,712 25,671
Drinking Water State Revolving FundLoan #01-65101-026
2008 - 2022 1.50% 77,520 5,168
Drinking Water State Revolving FundLoan #01-65101-027
2005 - 2022 1.50% 1,758,480 110,538
Drinking Water State Revolving FundLoan #01-65120-028
2005 - 2021 1.50% 1,803,360 106,520
Drinking Water State Revolving FundLoan #01-65120-036
2005 - 2021 1.50% 64,619 4,069
Drinking Water State Revolving FundLoan #01-65120-037
2004 - 2021 1.50% 704,070 39,728
Drinking Water State Revolving FundLoan #DM13-952-134
2018 - 2042 1.50% 3,057,555 0
Public Works BoardLoan# PW-02-691-047
2004 - 2022 0.50% 10,000,000 562,494
Public Works BoardLoan# PW-01-691-057
2003 - 2021 0.50% 10,000,000 542,424
Public Works BoardLoan# PC12-951-059
2013 - 2031 0.25% 3,342,154 176,282
Public Works BoardLoan# PR13-951-106
2015 - 2018 1.00% 300,000 75,000
Totals 2,672,894
Washington State Auditor's Office
___________________________________________________________________________________________________________________
Page 36

Long-term debts as of December 31, 2015 are as follows:
The annual requirements for all debts outstanding as of December 31, 2015, are as follows:
Description Maturity RangeStated Interest
RateOriginal Amount
Amount of Installment
Water Revenue Refunding Bond, 2008 2009 - 2018 3.5% - 4.25% 7,205,000 805,000
Water Revenue Bond, 2009A 2009 - 2016 2.75% - 4.0% 1,335,000 220,000
Water Revenue Bonds, 2009B (Taxable Build America Bonds)
2017 - 20294.159% - 5.824%
Original3,660,000 0
Bond Premiums2008, 2009 Issuances
N/A 275,712 31,817
Drinking Water State Revolving FundLoan #01-65101-026
2008 - 2022 1.50% 77,520 5,168
Drinking Water State Revolving FundLoan #01-65101-027
2005 - 2022 1.50% 1,758,480 110,538
Drinking Water State Revolving FundLoan #01-65120-028
2005 - 2021 1.50% 1,803,360 106,520
Drinking Water State Revolving FundLoan #01-65120-036
2005 - 2021 1.50% 64,619 4,069
Drinking Water State Revolving FundLoan #01-65120-037
2004 - 2021 1.50% 704,070 39,728
Drinking Water State Revolving FundLoan #DM13-952-134
2018 - 2042 1.50% 700,194 0
Public Works BoardLoan# PW-02-691-047
2004 - 2022 0.50% 10,000,000 562,494
Public Works BoardLoan# PW-01-691-057
2003 - 2021 0.50% 10,000,000 542,424
Public Works BoardLoan# PC12-951-059
2013 - 2031 0.25% 3,342,154 176,282
Public Works BoardLoan# PR13-951-106
2015 - 2018 1.00% 300,000 75,000
Totals 2,679,040
Year Ending Debt ServiceDec 31st Principal Interest Total
2016 2,647,222 381,453 3,028,6752017 2,934,307 497,004 3,431,3112018 2,785,811 434,526 3,220,3372019 2,071,665 388,404 2,460,0692020 2,088,114 360,666 2,448,780
2021-2025 5,891,162 1,350,551 7,241,7132026-2030 3,958,362 671,553 4,629,9152031-2035 2,173,130 228,109 2,401,2392036-2040 546,434 21,733 568,1672041-2042 58,350 1,313 59,663
Totals 25,154,557 4,335,312 29,489,869
Washington State Auditor's Office
___________________________________________________________________________________________________________________
Page 37

At December 31, 2016, and December 31, 2015, the District had $1,447,664 and $1,159,652, respectively, available in debt service funds to service the revenue bonds. Restricted assets contained $312,147 in 2016 and $221,905 in 2015 which were comprised of sinking funds and reserves as required by bond indentures. In 2015, the District contracted with the Washington State Department of Commerce for a Drinking Water State Revolving Fund loan to finance the construction of the Division Street Tank and Booster Pump Station and Piping. The loan amount is for $10,004,050, in 2016 $3,015,568 in draws were made, and in 2015 $700,194 in draws were made. In 2016, the District contracted with the Washington State Department of Ecology for a Clean Water State Revolving Fund loan to finance the acquisition of approximately 250 acres of watershed land around the Gilligan Creek intake to protect public water supply source. This loan is for $1,590,000 with 25% loan forgiveness. No draws have been made against this loan. In 2016, the District issued $6,300,000 of revenue bonds with additional issues of $4,200,000 planned in 2017 to provide funding for the Judy Water Treatment Plant to Mount Vernon transmission line project and various other projects. The District spends bond proceeds within the allowable period of time to avoid a negative arbitrage position. Changes in Long-term Liabilities During the year ended December 31, 2016, the following changes occurred in long-term liabilities:
Beginning Balance
Ending Balance
Description 1/1/2016 Additions Reductions 12/31/2016Revenue Bonds Payable
Revenue Refunding Bonds 2,325,000 805,000 1,520,000 840,000Revenue Bonds 3,880,000 6,300,000 220,000 9,960,000 472,083Unamortized Bond Premium 54,958 25,671 29,287 19,525
Total Revenue Bonds Payable 6,259,958 6,300,000 1,050,671 11,509,287 1,331,608
Long-term Debt PayableDrinking Water Revolving Fund Loans 2,412,033 3,015,568 266,022 5,161,579 266,022Public Works Trust Fund Loans 10,237,525 1,356,201 8,881,324 1,356,201
Total Long-term Debt Payable 12,649,558 3,015,568 1,622,223 14,042,903 1,622,223
Other Long-term LiabilitiesCompensated Absences 820,061 647,953 579,285 888,729 337,547Net Pension Liabilities 4,783,347 1,294,840 6,078,187Other Post-employment Benefits (OPEB) 1,018,703 266,821 1,285,524
Total Other Long-term Liabilities 6,622,111 2,209,614 579,285 8,252,440 337,547
Total Long-term Liabilities 25,531,627 11,525,182 3,252,179 33,804,630 3,291,378
Due within one Year
Washington State Auditor's Office
___________________________________________________________________________________________________________________
Page 38

During the year ended December 31, 2015, the following changes occurred in long-term liabilities:
NOTE 7 – SPECIAL ASSESSMENTS The District receives annual installments on outstanding special assessments, which have remaining terms ranging from 1 to 20 years. Outstanding assessments receivable consist of current and delinquent assessments and related interest and penalties. As of December 31, 2016, $33,538 of special assessments was delinquent, and as of December 31, 2015, $40,619 was delinquent. There is minimal risk to collecting special assessment amounts since a lien is formed on each individual property. NOTE 8 – TELECOMMUNICATION SERVICES In 2009, the District started providing wholesale telecommunications services to Internet Service Providers. Revenue from the telecommunication activity is included in Broadband Sales in the Comparative Statement of Revenue, Expenses and Changes in Net Position. Telecommunication activities for 2016 and 2015 are as follows:
Beginning Balance
Ending Balance
Due within one Year
Description 1/1/2015 Additions Reductions 12/31/2015Revenue Bonds Payable
Revenue Refunding Bonds 3,100,000 775,000 2,325,000 805,000Revenue Bonds 4,090,000 210,000 3,880,000 220,000Unamortized Bond Premium 86,775 31,817 54,958 25,671
Total Revenue Bonds Payable 7,276,775 0 1,016,817 6,259,958 1,050,671
Long-term Debt PayableDrinking Water Revolving Fund Loans 1,977,860 700,194 266,021 2,412,033 266,022Public Works Trust Fund Loans 11,593,728 1,356,203 10,237,525 1,356,200
Total Long-term Debt Payable 13,571,588 700,194 1,622,224 12,649,558 1,622,222
Other Long-term LiabilitiesCompensated Absences 810,133 566,395 556,467 820,061 335,782Net Pension Liabilities 3,706,562 1,076,785 4,783,347Other Post-employment Benefits (OPEB) 743,464 275,239 1,018,703
Total Other Long-term Liabilities 5,260,159 1,918,419 556,467 1,838,764 5,119,129
Total Long-term Liabilities 26,108,522 2,618,613 3,195,508 20,748,280 7,792,022
2016 2015
Operating Revenues:
Wholesale Fiber Services to ISP $15,898 $14,368
Operating Expenses:
Administration and General $37,126 $35,316
Capital Investment:
Current Year 0 $175,728
Cumulative (since 2009) $1,168,025 $1,168,025
Washington State Auditor's Office
___________________________________________________________________________________________________________________
Page 39

NOTE 9 - RESTRICTED NET POSITION The District’s Statement of Net Position reports $6,496,763 of restricted net position for 2016 and $221,904 of restricted net position for 2015. None of which is restricted by enabling legislation but rather by Bond covenants. NOTE 10 – PENSION PLANS The following table represents the aggregate pension amounts for all plans subject to the requirements of the GASB Statement 68, Accounting and Financial Reporting for Pensions for the year 2016:
State Sponsored Pension Plans Substantially all the District’s full-time and qualifying part-time employees participate in one of the following statewide retirement systems administered by the Washington State Department of Retirement Systems, under cost-sharing, multiple-employer public employee defined benefit and defined contribution retirement plans. The state Legislature establishes, and amends, laws pertaining to the creation and administration of all public retirement systems. The Department of Retirement Systems (DRS), a department within the primary government of the State of Washington, issues a publicly available comprehensive annual financial report (CAFR) that includes financial statements and required supplementary information for each plan. The DRS CAFR may be obtained by writing to: Department of Retirement Systems Communications Unit P.O. Box 48380 Olympia, WA 98540-8380 Or the DRS CAFR may be downloaded from the DRS website at www.drs.wa.gov. Public Employees’ Retirement System (PERS) PERS members include elected officials; state employees; employees of the Supreme, Appeals and Superior Courts; employees of the legislature; employees of district and municipal courts; employees of local governments; and higher education employees not participating in higher education retirement programs. PERS is comprised of three separate pension plans for membership purposes. PERS plans 1 and 2 are defined benefit plans, and PERS plan 3 is a defined benefit plan with a defined contribution component.
Pension liabilities (6,078,187)$
Pension assets -$
Deferred outflows of resources 1,136,027$
Deferred inflows of resources (105,213)$
Pension expense/expenditures 770,419$
Aggregate Pension Amounts - All Plans
Washington State Auditor's Office
___________________________________________________________________________________________________________________
Page 40

PERS Plan 1 provides retirement, disability and death benefits. Retirement benefits are determined as two percent of the member’s average final compensation (AFC) times the member’s years of service. The AFC is the average of the member’s 24 highest consecutive service months. Members are eligible for retirement from active status at any age with at least 30 years of service, at age 55 with at least 25 years of service, or at age 60 with at least five years of service. Members retiring from active status prior to the age of 65 may receive actuarially reduced benefits. Retirement benefits are actuarially reduced to reflect the choice of a survivor benefit. Other benefits include duty and non-duty disability payments, an optional cost-of-living adjustment (COLA), and a one-time duty-related death benefit, if found eligible by the Department of Labor and Industries. PERS 1 members were vested after the completion of five years of eligible service. The plan was closed to new entrants on September 30, 1977. Contributions The PERS Plan 1 member contribution rate is established by State statute at 6 percent. The employer contribution rate is developed by the Office of the State Actuary and includes an administrative expense component that is currently set at 0.18 percent. Each biennium, the state Pension Funding Council adopts Plan 1 employer contribution rates. The PERS Plan 1 required contribution rates (expressed as a percentage of covered payroll) for 2016 were as follows:
PERS Plan 1
Actual Contribution Rates: Employer Employee
PERS Plan 1 6.23% 6.00%
PERS Plan 1 UAAL 4.77% 6.00%
Administrative Fee 0.18%
Total 11.18% 6.00%
PERS Plan 2/3 provides retirement, disability and death benefits. Retirement benefits are determined as two percent of the member’s average final compensation (AFC) times the member’s years of service for Plan 2 and 1 percent of AFC for Plan 3. The AFC is the average of the member’s 60 highest-paid consecutive service months. There is no cap on years of service credit. Members are eligible for retirement with a full benefit at 65 with at least five years of service credit. Retirement before age 65 is considered an early retirement. PERS Plan 2/3 members who have at least 20 years of service credit and are 55 years of age or older, are eligible for early retirement with a benefit that is reduced by a factor that varies according to age for each year before age 65. PERS Plan 2/3 members who have 30 or more years of service credit and are at least 55 years old can retire under one of two provisions:
With a benefit that is reduced by three percent for each year before age 65; or With a benefit that has a smaller (or no) reduction (depending on age) that imposes
stricter return-to-work rules. PERS Plan 2/3 members hired on or after May 1, 2013 have the option to retire early by accepting a reduction of five percent for each year of retirement before age 65. This option is available only to those who are age 55 or older and have at least 30 years of service credit.
Washington State Auditor's Office
___________________________________________________________________________________________________________________
Page 41

PERS Plan 2/3 retirement benefits are also actuarially reduced to reflect the choice of a survivor benefit. Other PERS Plan 2/3 benefits include duty and non-duty disability payments, a cost-of-living allowance (based on the CPI), capped at three percent annually and a one-time duty related death benefit, if found eligible by the Department of Labor and Industries. PERS 2 members are vested after completing five years of eligible service. Plan 3 members are vested in the defined benefit portion of their plan after ten years of service; or after five years of service if 12 months of that service are earned after age 44. PERS Plan 3 defined contribution benefits are totally dependent on employee contributions and investment earnings on those contributions. PERS Plan 3 members choose their contribution rate upon joining membership and have a chance to change rates upon changing employers. As established by statute, Plan 3 required defined contribution rates are set at a minimum of 5 percent and escalate to 15 percent with a choice of six options. Employers do not contribute to the defined contribution benefits. PERS Plan 3 members are immediately vested in the defined contribution portion of their plan. Contributions The PERS Plan 2/3 employer and employee contribution rates are developed by the Office of the State Actuary to fully fund Plan 2 and the defined benefit portion of Plan 3. The Plan 2/3 employer rates include a component to address the PERS Plan 1 UAAL and an administrative expense that is currently set at 0.18 percent. Each biennium, the state Pension Funding Council adopts Plan 2 employer and employee contribution rates and Plan 3 contribution rates. The PERS Plan 2/3 required contribution rates (expressed as a percentage of covered payroll) for 2016 were as follows:
PERS Plan 2/3
Actual Contribution Rates: Employer 2/3 Employee 2
PERS Plan 2/3 6.23% 6.12%
PERS Plan 1 UAAL 4.77%
Administrative Fee 0.18%
Employee PERS Plan 3 varies
Total 11.18% 6.12%
The District’s actual PERS plan contributions were $290,163 to PERS Plan 1 and $356,862 to PERS Plan 2/3 for the year ended December 31, 2016. Actuarial Assumptions The total pension liability (TPL) for each of the DRS plans was determined using the most recent actuarial valuation completed in 2016 with a valuation date of June 30, 2015. The actuarial assumptions used in the valuation were based on the results of the Office of the State Actuary’s (OSA) 2007-2012 Experience Study. Additional assumptions for subsequent events and law changes are current as of the 2015 actuarial valuation report. The TPL was calculated as of the valuation date and rolled forward to the measurement date of June 30, 2016. Plan liabilities were rolled forward from June 30, 2015,
Washington State Auditor's Office
___________________________________________________________________________________________________________________
Page 42

to June 30, 2016, reflecting each plan’s normal cost (using the entry-age cost method), assumed interest and actual benefit payments.
Inflation: 3% total economic inflation; 3.75% salary inflation Salary increases: In addition to the base 3.75% salary inflation assumption, salaries
are also expected to grow by promotions and longevity. Investment rate of return: 7.5%
Mortality rates were based on the RP-2000 report’s Combined Healthy Table and Combined Disabled Table, published by the Society of Actuaries. The OSA applied offsets to the base table and recognized future improvements in mortality by projecting the mortality rates using 100 percent Scale BB. Mortality rates are applied on a generational basis; meaning, each member is assumed to receive additional mortality improvements in each future year throughout his or her lifetime. There were minor changes in methods and assumptions since the last valuation.
For all systems, except LEOFF Plan 2, the assumed valuation interest rate was lowered
from 7.8% to 7.7%. Assumed administrative factors were updated. Valuation software was corrected on how the nonduty disability benefits for LEOFF Plan
2 active members are calculated. New LEOFF Plan 2 benefit definitions were added within the OSA valuation software to
model legislation signed into law during the 2015 legislative session. Discount Rate The discount rate used to measure the total pension liability for all DRS plans was 7.5 percent. To determine that rate, an asset sufficiency test included an assumed 7.7 percent long-term discount rate to determine funding liabilities for calculating future contribution rate requirements. (All plans use 7.7 percent except LEOFF 2, which has assumed 7.5 percent). Consistent with the long-term expected rate of return, a 7.5 percent future investment rate of return on invested assets was assumed for the test. Contributions from plan members and employers are assumed to continue being made at contractually required rates (including PERS 2/3, PSERS 2, SERS 2/3, and TRS 2/3 employers, whose rates include a component for the PERS 1, and TRS 1 plan liabilities). Based on these assumptions, the pension plans’ fiduciary net position was projected to be available to make all projected future benefit payments of current plan members. Therefore, the long-term expected rate of return of 7.5 percent was used to determine the total liability. Long-Term Expected Rate of Return The long-term expected rate of return on the DRS pension plan investments of 7.5 percent was determined using a building-block-method. The Washington State Investment Board (WSIB) used a best estimate of expected future rates of return (expected returns, net of pension plan investment expense, including inflation) to develop each major asset class. Those expected returns make up one component of WSIB’s capital market assumptions. The WSIB uses the capital market assumptions and their target asset allocation to simulate future investment returns at various future times. The long-term expected rate of return of 7.5 percent approximately equals the median of the simulated investment returns over a 50-year time horizon.
Washington State Auditor's Office
___________________________________________________________________________________________________________________
Page 43

Estimated Rates of Return by Asset Class Best estimates of arithmetic real rates of return for each major asset class included in the pension plan’s target asset allocation as of June 30, 2016, are summarized in the table below. The inflation component used to create the table is 2.2 percent and represents the WSIB’s most recent long-term estimate of broad economic inflation.
Asset Class
Target Allocation
% Long-Term Expected Real Rate of Return Arithmetic
Fixed Income 20% 1.70% Tangible Assets 5% 4.40% Real Estate 15% 5.80% Global Equity 37% 6.60% Private Equity 23% 9.60%
Total 100% Sensitivity of Net Pension Liability/(Asset) The table below presents the District’s proportionate share of the net pension liability calculated using the discount rate of 7.5 percent, as well as what the District’s proportionate share of the net pension liability would be if it were calculated using a discount rate that is 1-percentage point lower (6.5 percent) or 1-percentage point higher (8.5 percent) than the current rate.
1% Decrease
(6.5%)
Current Discount Rate
(7.5%) 1% Increase
(8.5%) PERS Plan 1 $ 3,486,294 $2,891,032 $2,378,773 PERS Plan 2/3 $5,868,126 $3,187,155 ($1,659,098)
Pension Plan Fiduciary Net Position Detailed information about the State’s pension plans’ fiduciary net position is available in the separately issued DRS financial report. Pension Liabilities (Assets), Pension Expense, and Deferred Outflows of Resources and Deferred Inflows of Resources Related to Pensions At June 30, 2016, the District’s reported a total pension liability of $6,078,187 for its proportionate share of the net pension liabilities as follows:
Liability (or Asset) PERS Plan 1 $2,891,032 PERS Plan 2/3 $3,187,155
At June 30, the District’s proportionate share of the collective net pension liabilities was as follows:
Proportionate Share 6/30/15
Proportionate Share 6/30/16
Change in Proportion
PERS Plan 1 .050722% .053832% .003110% PERS Plan 2/3 .059616% .063301% .003685%
Washington State Auditor's Office
___________________________________________________________________________________________________________________
Page 44

Employer contribution transmittals received and processed by the DRS for the fiscal year ended June 30 are used as the basis for determining each employer’s proportionate share of the collective pension amounts reported by the DRS in the Schedules of Employer and Nonemployer Allocations for all plans except LEOFF 1. The collective net pension liability (asset) was measured as of June 30, 2016, and the actuarial valuation date on which the total pension liability (asset) is based was as of June 30, 2015, with update procedures used to roll forward the total pension liability to the measurement date. Pension Expense For the year ended December 31, 2016, the District’s recognized pension expense as follows:
Pension Expense PERS Plan 1 303,133 PERS Plan 2/3 467,286
TOTAL $ 770,419 Deferred Outflows of Resources and Deferred Inflows of Resources At December 31, 2016, the District’s reported deferred outflows of resources and deferred inflows of resources related to pensions from the following sources:
PERS Plan 1 Deferred Outflows
of Resources Deferred Inflows
of Resources Differences between expected and actual experience
- -
Net difference between projected and actual investment earnings on pension plan investments 72,792
-
Changes of assumptions - - Changes in proportion and differences between contributions and proportionate share of contributions - - Contributions subsequent to the measurement date 146,298 -
TOTAL $219,090 $ -
PERS Plan 2/3 Deferred Outflows
of Resources Deferred Inflows
of Resources Differences between expected and actual experience $169,714
($105,213)
Net difference between projected and actual investment earnings on pension plan investments 390,016 - Changes of assumptions 32,942 - Changes in proportion and differences between contributions and proportionate share of contributions 137,146 - Contributions subsequent to the measurement date 187,119 -
TOTAL $916,937 ($105,213)
Washington State Auditor's Office
___________________________________________________________________________________________________________________
Page 45

Aggregate Pension Amounts – All Plans Deferred Outflows
of Resources Deferred Inflows
of Resources Differences between expected and actual experience $169,714 ($105,213) Net difference between projected and actual investment earnings on pension plan investments 462,808 - Changes of assumptions 32,942 - Changes in proportion and differences between contributions and proportionate share of contributions 137,146 - Contributions subsequent to the measurement date 333,417 -
TOTAL $1,136,027 ($105,213) Deferred outflows of resources related to pensions resulting from the District’s contributions subsequent to the measurement date will be recognized as a reduction of the net pension liability in the year ended December 31, 2017. Other amounts reported as deferred outflows and deferred inflows of resources related to pensions will be recognized in pension expense as follows:
Year ended December 31:
PERS 1 PERS 2/3
2017 ($17,923) $47,234 2018 ($17,923) $47,234 2019 $66,851 $338,026 2020 $41,786 $192,111 2021 - -
Thereafter - - Western Conference of Teamsters Pension Plan Substantially all of the District’s full-time and qualifying part-time represented employees participate in the Western Conference of Teamsters Pension Plan (the Plan) administered by the Western Conference of Teamsters Pension Trust Fund Board of Trustees, under a cost-sharing, multiple-employer defined benefit pension plan. The Board of Trustees has the power to amend or terminate the Plan. Additional information can be obtained by writing to Western Conference of Teamster Pension Trust Plan, 2323 Eastlake Avenue East, Seattle, WA 98102. The District began participation in the Plan per the collective-bargaining agreement effective January 1, 2013. The District’s contributions are defined as $0.50 per paid hour by the District for represented employees. Effective January 1, 2016, the represented employees agreed to contribute $1.00 per paid hour by the District with the option to change the rate at the beginning of the years 2017 and 2018. The current collective-bargaining agreement expires December 31, 2018.
Washington State Auditor's Office
___________________________________________________________________________________________________________________
Page 46

The Plan provides retirement, disability and death benefits. Retirement benefits are determined by applying the benefit percentage to the total annual contributions for each year and adding all of the results for all years together for the monthly contributory service benefit. The benefit percentage differs year to year. Participants are eligible for retirement with at least five years of vesting service at age 55, or two years of vesting service at age 65. Members retiring prior to age 65 may receive reduced benefits. Additional details of the Plan are as follows:
For the year ended December 31, 2016 Number of employees covered 35 Amount of contributions $ 34,863 Employer contribution rate $ 0.50 per hour paid Employee contribution rate $ 1.00 per hour paid
The District contributed 100% of the required amount for year ending December 31, 2016. There is no unfunded liability on the District’s part. NOTE 11 – CONTINGENCIES AND LITIGATIONS The District has recorded in its financial statements all material liabilities, including an estimate for situations which are not yet resolved but where, based on available information, management believes it is probable that the District will have to make payment. In the opinion of management, the District’s insurance policies are adequate to pay all known or pending claims. As discussed in Note 6 – Long-Term Debt, the District is contingently liable for repayment of refunded debt. The District participates in a number of Federal and State-assisted programs. These grants are subject to audit by the grantors or their representatives. Such audits could result in requests for reimbursement to grantor agencies for expenditures disallowed under the terms of the grants. District management believes that such disallowances, if any, will be immaterial. NOTE 12 – SUBSEQUENT EVENTS The District has evaluated subsequent events through the report date to ensure that these financial statements include appropriate disclosure of events both recognized in the financial statements as of December 31, 2016 and events which occurred subsequent to December 31, 2016 but were not recognized in the financial statements. The District was approved for a $10,500,000 bond to fund the construction of the Judy to Mount Vernon transmission line project and other various construction projects. The District received $6,300,000 in 2016 and will receive $4,200,000 in 2017. The District has been approved for a Drinking Water Loan for $1,212,100 to fund the Mountain View Estates Consolidation and Restructuring project. This loan and the Drinking Water Loan for the Division Street Tank are currently suspended until the State is able to fund its capital budget. Draws have not started for the Mountain View loan.
Washington State Auditor's Office
___________________________________________________________________________________________________________________
Page 47

NOTE 13 – RISK MANAGEMENT Liability and Property-Enduris The District is a member of Enduris. Chapter 48.62 RCW authorizes the governing body of any one or more governmental entities to form to individually or jointly self-insure risks, jointly purchase insurance or reinsurance, and to contract for risk management, claims, and administrative services. Enduris was formed July 10, 1987 pursuant to the provisions of Chapter 48.62 RCW, Chapter 200-100 WAC, and Chapter 39.34 RCW. Two (2) counties and two (2) cities in the State of Washington joined together by signing an interlocal governmental agreement to fund their self-insured losses and jointly purchase insurance and administrative services. As of September 1, 2016 there were 524 members representing a broad array of special purpose districts throughout the state. Enduris provides property and liability coverage as well as risk management services and other related administrative services. Members make an annual contribution to fund Enduris and share in the self-insured retention of the jointly purchased excess and/or reinsurance coverage. The self-insured retention is:
$1,000,000 deductible on liability loss - the member is responsible for the first $1,000
of the deductible amount of each claim, while Enduris is responsible for the remaining $999,000 on a liability loss.
$250,000 deductible on property loss - the member is responsible for the first $1,000 of the deductible amount of each claim, while Enduris is responsible for the remaining $249,000 on a property loss.
Enduris is responsible for the $4,000 deductible on boiler and machinery loss.
Enduris acquires reinsurance from unrelated insurance companies on a “per occurrence” basis to cover all losses over the deductibles as shown on the policy maximum limits. Liability coverage is for all lines of liability coverage including Public Official’s Liability. The Property coverage is written on an “all risk”, blanket basis using current Statement of Values. The Property coverage includes but is not limited to mobile equipment, boiler and machinery, electronic data processing equipment, business interruption, course of construction and additions, property in transit, fine arts, and automobile physical damage to insured vehicles. Liability coverage limit is $10 million per occurrence and property coverage limit is $1 billion per occurrence. Enduris offers crime coverage up to a limit of $1 million per occurrence. Since Enduris is a cooperative program, there is a joint liability among the participating members. The contract requires members to continue membership for a period of not less than one (1) year and must give notice 60 days before terminating participation. The Master Agreement (Intergovernmental Contract) is automatically renewed after the initial one (1) full fiscal year commitment. Even after termination, a member is still responsible for contribution to Enduris for any unresolved, unreported and in-process claims for the period they were a signatory to the Master Agreement. Enduris is fully funded by its member participants. Claims are filed by members with Enduris and are administered in house.
Washington State Auditor's Office
___________________________________________________________________________________________________________________
Page 48
A Board of Directors consisting of seven (7) board members governs Enduris. Its members elect the Board and the positions are filled on a rotating basis. The Board meets quarterly and is responsible for conducting the business affairs of Enduris. In the past three years (2016, 2015, and 2014), there have been no claim settlements, per occurrence or in aggregate, that have exceeded the coverage provided by excess/reinsurance contracts. Liability and Property-PURMS The District was formally a member of the Public Utility Risk Management Services Self-Insurance fund (PURMS) for liability and property. After termination of membership, the District is still responsible for contributions for its share of any unresolved, unreported and in-process claims for the period of membership. During 2016, the District paid $53,318 for liability general assessments to PURMS. As of December 31, 2016, there were 84 known incidents or unresolved liability claims pending against one or more members or former members of the liability pool ("pending liability claims"). The total dollar amount of the risk posed by these pending liability claims to such members and to the liability pool itself is not precisely determinable, and can only be estimated by actuarial report. However, the case reserves set by the Administrator for the District's share of these claims was $239,301. Because the total dollar amount of the risk posed by the liability pool's "unpaid claims" liability is based on case reserves estimated by the Administrator and because the amount of incurred but not reported claims is based on an actuarial report prepared by a retained actuary, the letter provides no opinion and makes no representations as to the risk the total "unpaid claims" liability at any confidence level poses to the solvency of the pool. However as a contractual matter, the inter-local agreement requires participating members to pay their assessments within thirty (30) days of the date they are issued. Health & Welfare Risk Pool PURMS provides health and welfare insurance coverage for the employees of each of its Members participating in the Health & Welfare Risk Pool (H&W Pool) in accordance with the terms of the Health & Welfare Coverage of the SIA (H&W Pool) and the terms of each member’s respective Coverage Booklet provided to its Employees. The H&W Pool was established as one of PURMS’ risk pools effective March 31, 2000. Under the terms of the Interlocal Agreement and the H&W General Assessment Formula, the H&W Pool is funded with cash reserves (H&W Pool Reserves) in an amount approximately equal to the sum of three times the amount of each Member’s historical agerage monthly H&W Claims Experience (Pool Claims Experience Reserves) for its respective Employees and their Dependents. Unless required otherwise by the H&W Pool Funding Methodology, the Pool Claims Experience Reserves shall be deemed its designated H&W Pool Reserves. The H&W Pool Members’ H&W Claims Experience was reevaluated and recalculated in June 2014, establishing the Designated H&W Pool Reserves at $2,785,633. Every month, each member of the H&W Pool is assessed for (a) the cost the H&W Pool incurred during the preceding month for the H&W claims for such member’s employees; and (b) for such member’s share of Shared H&W Costs. Shared H&W Costs consist of administrative expenses incurred by the H&W Pool, premiums for Stop-Loss Insurance, PPO charges, and Shared H&W Claims.
Washington State Auditor's Office
___________________________________________________________________________________________________________________
Page 49

Each of PURMS risk pools is audited annually by the State Auditor’s Office. In addition, as required by State regulations, PURMS provides audited financial reports to the State Risk Manager reflecting the claims and administrative expenses of the Risk Pools. On an annual basis, PURMS engages the services of the accounting firm Moss Adams to perform a claims audit for each of the Risk Pools. Unemployment Benefits Unemployment benefits are provided by the District as a “reimbursable employer” with the Washington State Department of Employment Security. Unemployment compensation is paid to eligible individuals by the Washington State Department of Employment Security and the District is subsequently billed for actual costs. As a result, the District will experience periods of fluctuating costs, depending on the number and size of eligible claims each year. These costs are immaterial to the District’s financial statements. NOTE 14 –POST-EMPLOYMENT BENEFITS OTHER THAN PENSION BENEFIT The District implemented Governmental Accounting Standards Board (GASB) 45 Accounting and Financial Reporting by Employers for Postemployment Benefits Other Than Pensions, prospectively, as of December 31, 2009. Plan Description In addition to the pension benefits described in Note 10, the District provides Other Post-Employment Benefits (OPEB), in accordance with RCW 41.04.208, to all employees who are vested members in the Public Employees Retirement System (PERS), who leave the employment of the District and are eligible to immediately receive benefits under PERS. This single-employer health and welfare benefit plan is provided through the Public Utility Risk Management Services (PURMS). Commissioners who serve at least one six-year term and have been re-elected for a second term of office shall be eligible for coverage under this policy. Plan benefits for retirees are reduced upon eligibility for Medicare, regardless of whether or not Medicare enrollment occurs. The surviving spouse of a retiree who is covered at the time of the retiree’s death may continue his/her coverage until the time of the surviving spouse’s death. A new spouse to a surviving spouse is not eligible for this coverage. In the event of a divorce after retirement, the spouse of the retired employee will not be eligible to remain on the District’s plan. COBRA benefits will be offered to the divorced spouse according to statutory regulations. Funding Policy The District establishes contribution requirements on an annual basis. As of December 31, 2016, the District had nineteen retirees enrolled in the District’s health and welfare plan. The premium charged to the retirees is based on the District’s experience for all members of its health and welfare plan, as determined by the PURMS Self-Insurance Fund. Costs in excess of the retirees’ contributions are covered by the District on a pay-as-you-go financing plan. Annual OPEB Cost and Net OPEB Obligation The District’s annual OPEB cost is calculated based upon the Annual Required Contribution (ARC), an amount actuarially determined in accordance with the parameters of GASB Statement 45. The ARC represents a level of funding that, if paid on an ongoing basis, is projected to cover the normal cost each year and amortize any unfunded actuarial liabilities over a period of 30 years as of December 31, 2009.
Washington State Auditor's Office
___________________________________________________________________________________________________________________
Page 50

The District’s annual OPEB cost, the percentage of OPEB cost contributed to the Plan, and the net OPEB obligation for 2016, 2015, and 2014 were as follows:
Fiscal Year Ended
Annual OPEB Cost
Percentage of Annual OPEB
Cost Contributed
Net OPEB Obligation
2016 $ 429,456 37.87% $1,285,524 2015 $ 433,135 36.45% $1,018,703 2014 $ 289,739 48.35% $ 743,464
Funded Status and Funding Progress As of December 31, 2015, the most recent actuarial valuation date, the plan was 0% funded. The accrued liability for benefits was $5.485 million, and the actuarial value of assets was $0, resulting in an Unfunded Actuarial Accrued Liability and Amortization (UAAL) of $5.485 million. Actuarial valuations involve estimates of the value of reported amounts and assumptions about the probability of occurrence of events far into the future. Examples include assumptions about future employment, mortality, and the healthcare cost trend. Amounts determined regarding the funded status of the Plan and the Annual Required Contributions (ARC) of the employer are subject to continual revision as actual results are compared with past expectations and new estimates are made about the future.
Unfunded Actuarial Liability (UAAL) Valuation Date 12/31/2015 Actuarial Value of Assets $ 0 Actuarial Accrued Liability $5,485,372 Reserve Fund $ 0 Unfunded Actuarial Accrued Liability (UAAL) $5,485,372 Funded Ratio 0%
Actuarial Cost Method and Assumptions Projections of benefits for financial reporting purposes are based on the substantive plan (the plan as understood by the employer and the plan members) and include the types of benefits provided at the time of each valuation. The actuarial methods and assumptions used include techniques that are designed to reduce the effects of short-term volatility in actuarial accrued liabilities, consistent with the long-term perspective of the calculations. In the December 31, 2015 actuarial valuation, the Entry Age Normal Actuarial Cost Method was used. The actuarial assumptions used included a 2.30% inflation assumption and a 3.50% discount rate, which is based upon the long-term investment yield on the investments that are expected to be used to finance the payment of benefits. The medical trend assumptions were as follow:
Year Medical Trend
2016 7.3% 2017 6.4% 2020 5.3% 2030 5.2%
Washington State Auditor's Office
___________________________________________________________________________________________________________________
Page 51
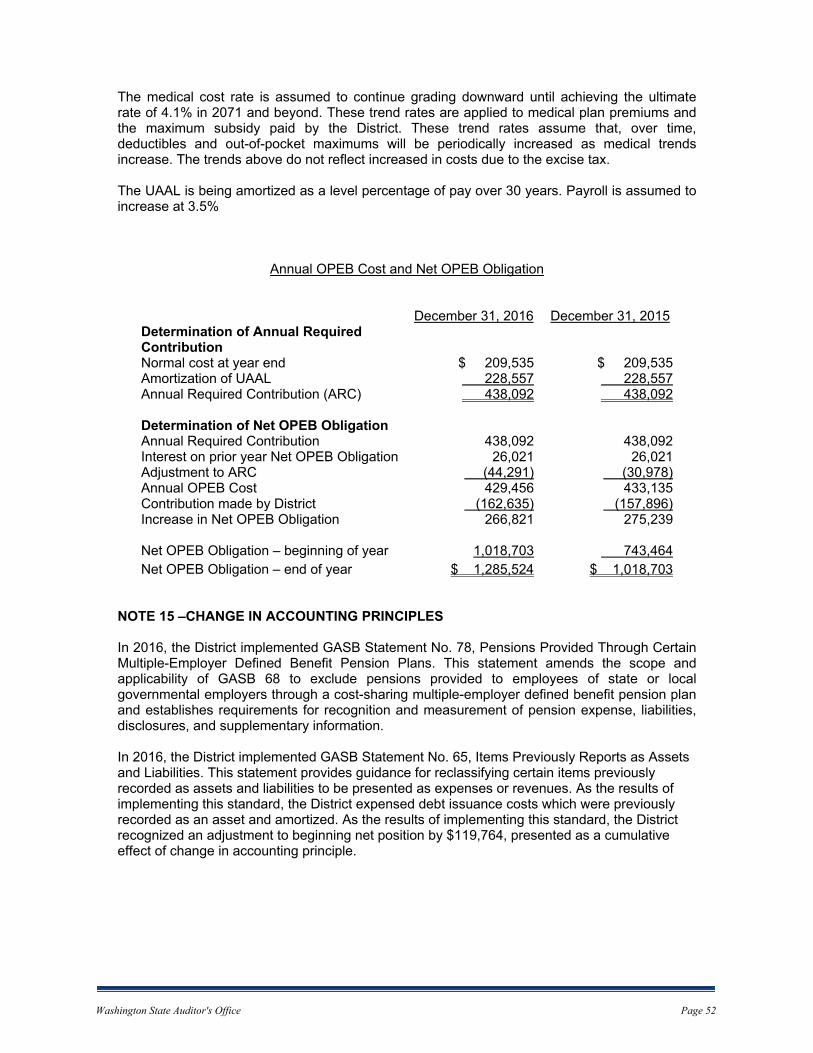
The medical cost rate is assumed to continue grading downward until achieving the ultimate rate of 4.1% in 2071 and beyond. These trend rates are applied to medical plan premiums and the maximum subsidy paid by the District. These trend rates assume that, over time, deductibles and out-of-pocket maximums will be periodically increased as medical trends increase. The trends above do not reflect increased in costs due to the excise tax. The UAAL is being amortized as a level percentage of pay over 30 years. Payroll is assumed to increase at 3.5%
Annual OPEB Cost and Net OPEB Obligation
December 31, 2016 December 31, 2015 Determination of Annual Required Contribution Normal cost at year end $ 209,535 $ 209,535 Amortization of UAAL 228,557 228,557 Annual Required Contribution (ARC) 438,092 438,092 Determination of Net OPEB Obligation Annual Required Contribution 438,092 438,092 Interest on prior year Net OPEB Obligation 26,021 26,021 Adjustment to ARC (44,291) (30,978) Annual OPEB Cost 429,456 433,135 Contribution made by District (162,635) (157,896) Increase in Net OPEB Obligation 266,821 275,239 Net OPEB Obligation – beginning of year 1,018,703 743,464 Net OPEB Obligation – end of year $ 1,285,524 $ 1,018,703
NOTE 15 –CHANGE IN ACCOUNTING PRINCIPLES In 2016, the District implemented GASB Statement No. 78, Pensions Provided Through Certain Multiple-Employer Defined Benefit Pension Plans. This statement amends the scope and applicability of GASB 68 to exclude pensions provided to employees of state or local governmental employers through a cost-sharing multiple-employer defined benefit pension plan and establishes requirements for recognition and measurement of pension expense, liabilities, disclosures, and supplementary information. In 2016, the District implemented GASB Statement No. 65, Items Previously Reports as Assets and Liabilities. This statement provides guidance for reclassifying certain items previously recorded as assets and liabilities to be presented as expenses or revenues. As the results of implementing this standard, the District expensed debt issuance costs which were previously recorded as an asset and amortized. As the results of implementing this standard, the District recognized an adjustment to beginning net position by $119,764, presented as a cumulative effect of change in accounting principle.
Washington State Auditor's Office
___________________________________________________________________________________________________________________
Page 52
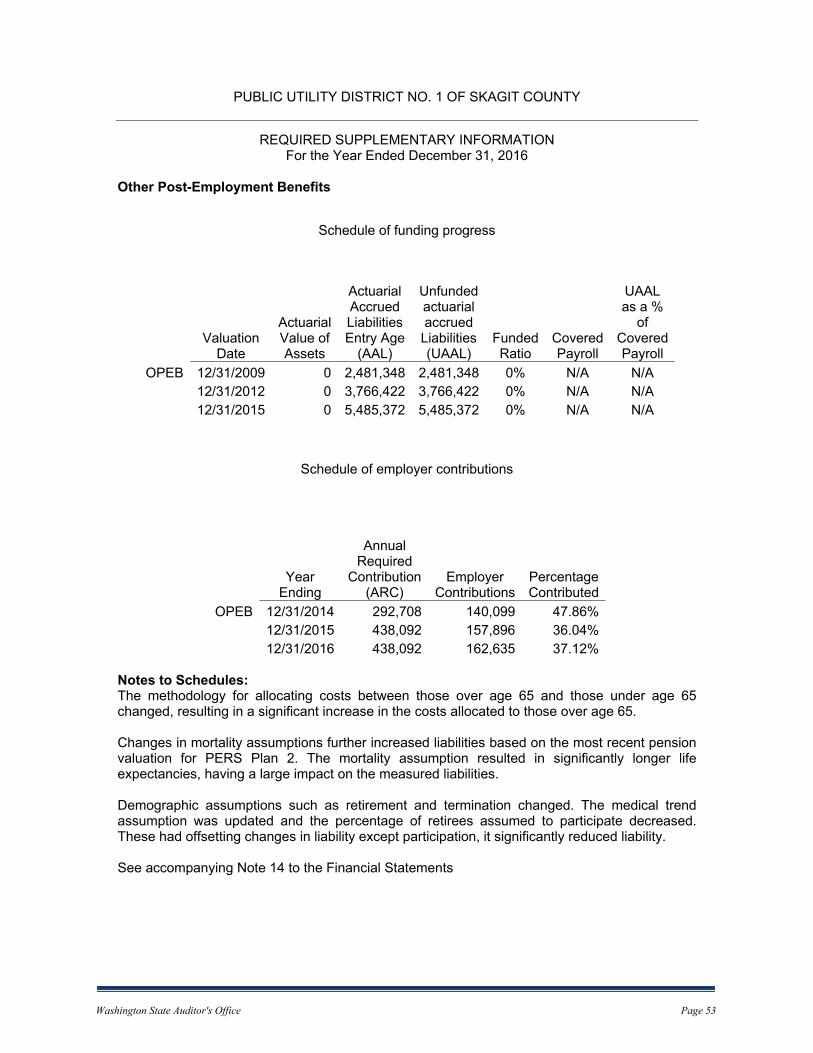
PUBLIC UTILITY DISTRICT NO. 1 OF SKAGIT COUNTY
REQUIRED SUPPLEMENTARY INFORMATION For the Year Ended December 31, 2016
Other Post-Employment Benefits
Schedule of funding progress
Valuation Date
Actuarial Value of Assets
Actuarial Accrued Liabilities Entry Age
(AAL)
Unfunded actuarial accrued
Liabilities (UAAL)
Funded Ratio
Covered Payroll
UAAL as a %
of Covered Payroll
OPEB 12/31/2009 0 2,481,348 2,481,348 0% N/A N/A 12/31/2012 0 3,766,422 3,766,422 0% N/A N/A 12/31/2015 0 5,485,372 5,485,372 0% N/A N/A
Schedule of employer contributions
Year Ending
Annual Required
Contribution (ARC)
Employer Contributions
Percentage Contributed
OPEB 12/31/2014 292,708 140,099 47.86% 12/31/2015 438,092 157,896 36.04% 12/31/2016 438,092 162,635 37.12%
Notes to Schedules: The methodology for allocating costs between those over age 65 and those under age 65 changed, resulting in a significant increase in the costs allocated to those over age 65.
Changes in mortality assumptions further increased liabilities based on the most recent pension valuation for PERS Plan 2. The mortality assumption resulted in significantly longer life expectancies, having a large impact on the measured liabilities.
Demographic assumptions such as retirement and termination changed. The medical trend assumption was updated and the percentage of retirees assumed to participate decreased. These had offsetting changes in liability except participation, it significantly reduced liability.
See accompanying Note 14 to the Financial Statements
Washington State Auditor's Office
___________________________________________________________________________________________________________________
Page 53

Pension Plans – State Sponsored
Schedule of Proportionate Share of the Net Pension Liability PERS Plan 1
As of June 30, 2016
2016 2015*
Employer’s proportion of the net pension liability 0.053832% 0.050722%
Employer’s proportionate share of the net pension liability $2,891,032 $2,653,233
Employer’s covered employee payroll $5,769,868 $5,522,456
Employer’s proportionate share of the net pension liability as a percentage of covered employee payroll
50.11% 48.0%
Plan fiduciary net position as a percentage of the total pension liability
57.03% 59.10%
Schedule of Proportionate Share of the Net Pension Liability PERS Plan 2/3
As of June 30, 2016
2016 2015*
Employer’s proportion of the net pension liability 0.063301% 0.059616%
Employer’s proportionate share of the net pension liability $3,187,155 $2,130,114
Employer’s covered employee payroll $3,187,155 $5,289,649
Employer’s proportionate share of the net pension liability as a percentage of covered employee payroll
57.33% 40.3%
Plan fiduciary net position as a percentage of the total pension liability
85.82% 89.20%
Notes to Schedules: As of the date of this schedule, there have not been any changes to the benefit terms and the actuarial assumptions applied for June 30, 2015 are the same for June 30, 2016
*Fiscal year 2015 was the 1st year of implementation, therefore only two years are shown
See accompanying Note 10 to the Financial Statements
Washington State Auditor's Office
___________________________________________________________________________________________________________________
Page 54

Schedule of Employer Contributions PERS Plan 1
As of December 31, 2016
2016 2015*
Statutorily or contractually required contributions $290,163 $259,019
Contributions in relation to the statutorily or contractually required contributions
($290,163) ($259,019)
Contributions deficiency (excess) 0 0
Covered employer payroll $5,882,031 $5,704,404
Contributions as a percentage of covered employee payroll 4.94% 4.54%
Schedule of Employer Contributions PERS Plan 2/3
As of December 31, 2016
2016 2015*
Statutorily or contractually required contributions $356,862 $305,984
Contributions in relation to the statutorily or contractually required contributions
($356,862) ($305,984)
Contributions deficiency (excess) 0 0
Covered employer payroll $5,728,101 $5,466,178
Contributions as a percentage of covered employee payroll 6.23% 5.60%
Notes to Schedules: As of the date of this schedule, there have not been any changes to the benefit terms and the actuarial assumptions applied for June 30, 2015 are the same for June 30, 2016. The employer contribution rate changed as of July 1, 2015 to 11.18% from 9.21%.
*Fiscal year 2015 was the 1st year of implementation, therefore only two years are shown
See accompanying Note 10 to the Financial Statements
Washington State Auditor's Office
___________________________________________________________________________________________________________________
Page 55
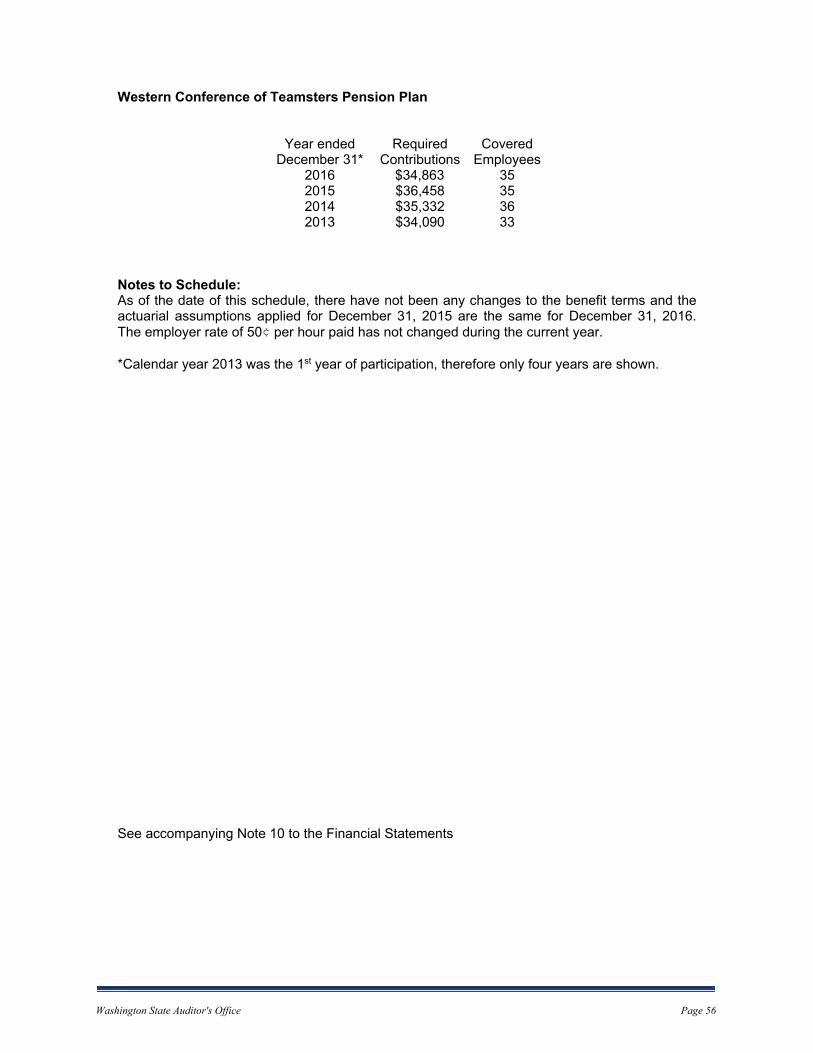
Western Conference of Teamsters Pension Plan
Notes to Schedule: As of the date of this schedule, there have not been any changes to the benefit terms and the actuarial assumptions applied for December 31, 2015 are the same for December 31, 2016. The employer rate of 50¢ per hour paid has not changed during the current year.
*Calendar year 2013 was the 1st year of participation, therefore only four years are shown.
See accompanying Note 10 to the Financial Statements
Year ended December 31*
Required Contributions
Covered Employees
2016 $34,863 35 2015 $36,458 35 2014 $35,332 36 2013 $34,090 33
Washington State Auditor's Office
___________________________________________________________________________________________________________________
Page 56
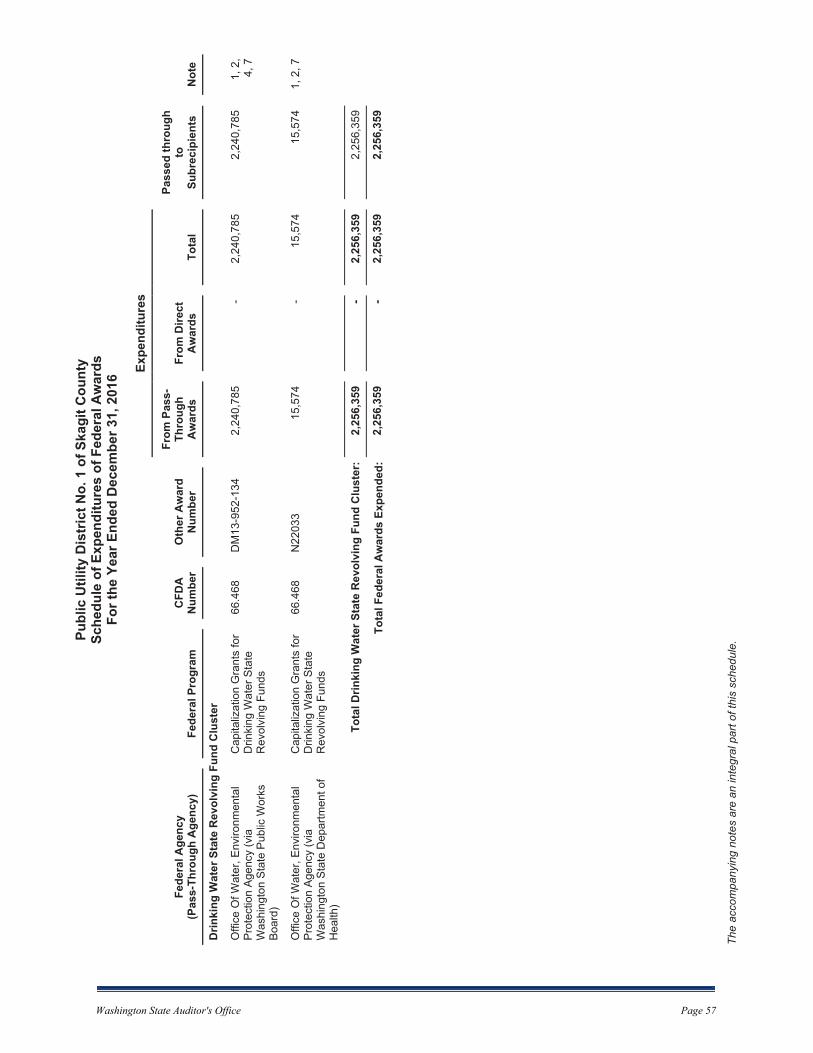
Fede
ral A
genc
y (P
ass-
Thro
ugh
Age
ncy)
Fede
ral P
rogr
amC
FDA
N
umbe
rO
ther
Aw
ard
Num
ber
Expe
nditu
res
Pass
ed th
roug
h to
Su
brec
ipie
nts
Not
e
From
Pas
s-Th
roug
h A
war
dsFr
om D
irect
A
war
dsTo
tal
Drin
king
Wat
er S
tate
Rev
olvi
ng F
und
Clu
ster
Offi
ce O
f Wat
er, E
nviro
nmen
tal
Prot
ectio
n Ag
ency
(via
W
ashi
ngto
n St
ate
Publ
ic W
orks
Bo
ard)
Cap
italiz
atio
n G
rant
s fo
r D
rinki
ng W
ater
Sta
te
Rev
olvi
ng F
unds
66.4
68D
M13
-952
-134
2,24
0,78
5-
2,24
0,78
52,
240,
785
1, 2
, 4,
7
Offi
ce O
f Wat
er, E
nviro
nmen
tal
Prot
ectio
n Ag
ency
(via
W
ashi
ngto
n St
ate
Dep
artm
ent o
f H
ealth
)
Cap
italiz
atio
n G
rant
s fo
r D
rinki
ng W
ater
Sta
te
Rev
olvi
ng F
unds
66.4
68N
2203
315
,574
-15
,574
15,5
741,
2, 7
Tota
l Drin
king
Wat
er S
tate
Rev
olvi
ng F
und
Clu
ster
: 2,
256,
359
-2,
256,
359
2,25
6,35
9
Tota
l Fed
eral
Aw
ards
Exp
ende
d:2,
256,
359
-2,
256,
359
2,25
6,35
9
Publ
ic U
tility
Dis
tric
t No.
1 o
f Ska
git C
ount
ySc
hedu
le o
f Exp
endi
ture
s of
Fed
eral
Aw
ards
For t
he Y
ear E
nded
Dec
embe
r 31,
201
6
The
acco
mpa
nyin
g no
tes
are
an in
tegr
al p
art o
f thi
s sc
hedu
le.
Washington State Auditor's Office
___________________________________________________________________________________________________________________
Page 57
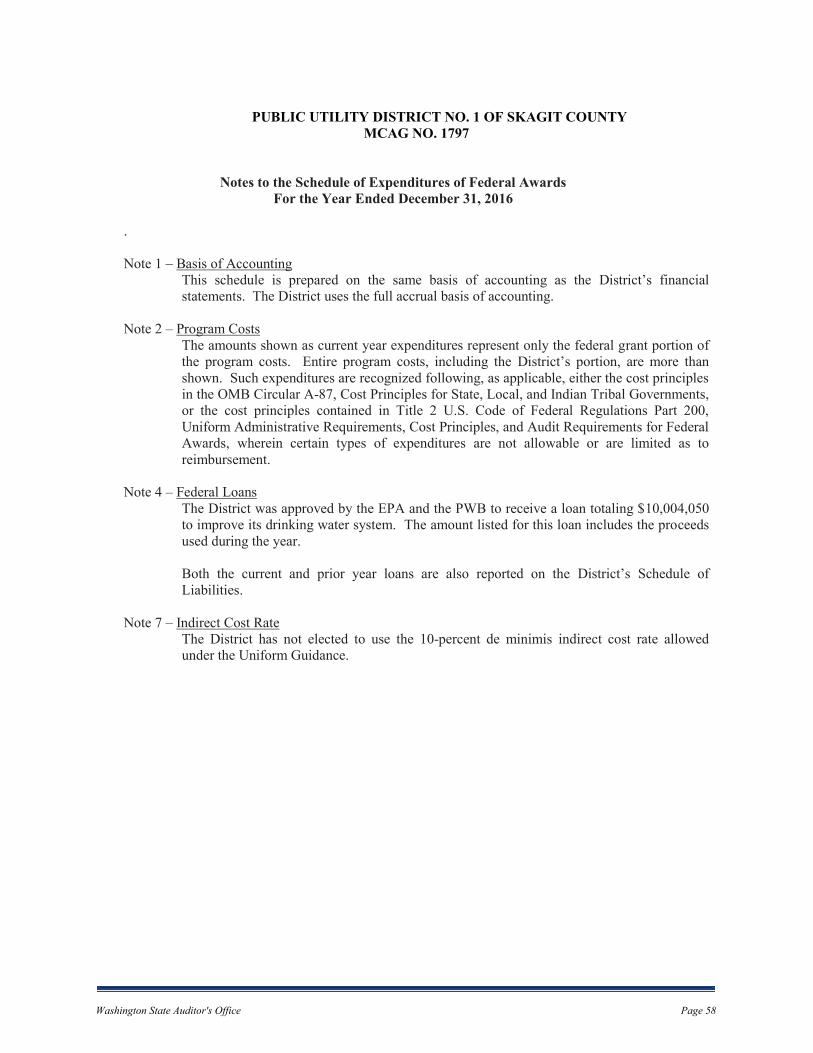
PUBLIC UTILITY DISTRICT NO. 1 OF SKAGIT COUNTY MCAG NO. 1797
Notes to the Schedule of Expenditures of Federal Awards For the Year Ended December 31, 2016
. Note 1 – Basis of Accounting
This schedule is prepared on the same basis of accounting as the District’s financial statements. The District uses the full accrual basis of accounting.
Note 2 – Program Costs
The amounts shown as current year expenditures represent only the federal grant portion of the program costs. Entire program costs, including the District’s portion, are more than shown. Such expenditures are recognized following, as applicable, either the cost principles in the OMB Circular A-87, Cost Principles for State, Local, and Indian Tribal Governments, or the cost principles contained in Title 2 U.S. Code of Federal Regulations Part 200, Uniform Administrative Requirements, Cost Principles, and Audit Requirements for Federal Awards, wherein certain types of expenditures are not allowable or are limited as to reimbursement.
Note 4 – Federal Loans
The District was approved by the EPA and the PWB to receive a loan totaling $10,004,050 to improve its drinking water system. The amount listed for this loan includes the proceeds used during the year. Both the current and prior year loans are also reported on the District’s Schedule of Liabilities.
Note 7 – Indirect Cost Rate
The District has not elected to use the 10-percent de minimis indirect cost rate allowed under the Uniform Guidance.
Washington State Auditor's Office
___________________________________________________________________________________________________________________
Page 58
CORRECTIVE ACTION PLAN FOR FINDINGS REPORTED
UNDER UNIFORM GUIDANCE
Public Utility District No. 1 of Skagit County
January 1, 2016 through December 31, 2016
This schedule presents the corrective action planned by the auditee for findings reported in this
report in accordance with Title 2 U.S. Code of Federal Regulations (CFR) Part 200, Uniform
Administrative Requirements, Cost Principles, and Audit Requirements for Federal Awards
(Uniform Guidance). The information in this schedule is the representation of the District.
Finding ref number:
2016-001
Finding caption:
The District’s internal controls over financial statement preparation,
specifically capital asset reporting, are inadequate to ensure accurate
reporting.
Name, address, and telephone of auditee contact person:
Sally Saxton, Finance Manager/Treasurer
P.O. BOX 1436
Mount Vernon WA 98273
Corrective action the auditee plans to take in response to the finding:
Asset management is the next module to be implemented in Cayenta. During the conversion
process we will review the accumulated depreciation of each asset and make any corrections
found during the process as a prior period adjustment on the 2017 financial statements. In
addition, we will ensure that all assets are properly classified as Plant or Equipment and
reconciled to the general ledger.
To ensure that depreciation is calculating properly in Cayenta, we will test a sample of assets
in 2017 and 2018.
Anticipated date to complete the corrective action: December 31, 2017
Washington State Auditor's Office
___________________________________________________________________________________________________________________
Page 59

ABOUT THE STATE AUDITOR’S OFFICE
The State Auditor's Office is established in the state's Constitution and is part of the executive
branch of state government. The State Auditor is elected by the citizens of Washington and
serves four-year terms.
We work with our audit clients and citizens to achieve our vision of government that works for
citizens, by helping governments work better, cost less, deliver higher value, and earn greater
public trust.
In fulfilling our mission to hold state and local governments accountable for the use of public
resources, we also hold ourselves accountable by continually improving our audit quality and
operational efficiency and developing highly engaged and committed employees.
As an elected agency, the State Auditor's Office has the independence necessary to objectively
perform audits and investigations. Our audits are designed to comply with professional standards
as well as to satisfy the requirements of federal, state, and local laws.
Our audits look at financial information and compliance with state, federal and local laws on the
part of all local governments, including schools, and all state agencies, including institutions of
higher education. In addition, we conduct performance audits of state agencies and local
governments as well as fraud, state whistleblower and citizen hotline investigations.
The results of our work are widely distributed through a variety of reports, which are available
on our website and through our free, electronic subscription service.
We take our role as partners in accountability seriously, and provide training and technical
assistance to governments, and have an extensive quality assurance program.
Contact information for the State Auditor’s Office
Public Records requests [email protected]
Main telephone (360) 902-0370
Toll-free Citizen Hotline (866) 902-3900
Website www.sao.wa.gov
Washington State Auditor's Office
___________________________________________________________________________________________________________________
Page 60