Embed Size (px)
Citation preview

FINANCIAL STATEMENTS 2019FOR THE YEAR ENDED 31 JULY 2019

Contents
1 Chair’s foreword
2 Review of the year by Professor Dame Nancy Rothwell, President and Vice-Chancellor
5 Key performance indicators
6 The year in pictures
12 Financial review by Mr Stephen Dauncey, Director of Finance
22 Corporate governance statement
26 Remuneration Committee report
31 Modern slavery and human trafficking statement
34 Statement of the Board of Governors’ responsibilities for the year ended 31 July 2019
35 Independent auditor’s report to the Board of Governors of The University of Manchester
42 Financial Statements for the year ended 31 July 2019
44 Statement of principal accounting policies
49 Consolidated statement of comprehensive income
50 Consolidated statement of changes in reserves
51 Balance sheet
52 Consolidated statement of cash flows
53 Notes to the financial statements
Officers
ChancellorMr Lemn Sissay, MBE
Pro-ChancellorMrs Gillian Easson, MA,FRSA
President and Vice-ChancellorProfessor Dame Nancy J Rothwell, DBE, DL, BSc, PhD, DSc, FRS, FMedSci, FRSB, FRCP(Hon), FRSA
Deputy President and Deputy Vice-ChancellorProfessor Luke Georghiou, BSc, PhD, MAE, FRSA
Chair of the Board of Governors and Pro-ChancellorMr Edward M Astle, MA, MBA
Deputy Chair of the Board of Governors Dr John Stageman, OBE, PhD, CChem, FRSB
Registrar, Secretary and Chief Operating OfficerMr Patrick Hackett BArch
Director of FinanceMr Stephen Dauncey BSc, FCCA (until 18 October 2019)
Interim Director of Finance Mr David Soutter BA (Hons), MA (Hons), FCA
Vice-Presidents (Policy)
Teaching, Learning and StudentsProfessor Clive Agnew, BSc, PhD(until 30 November 2019)
Professor April McMahon, MA, PhD, FBA, FRSE, FLSW (from 1 October 2019)
ResearchProfessor Colette Fagan, BA, MSc, PhD, FAcSS
Social ResponsibilityProfessor James Thompson BA (Hons), FRSA.(until 31 July 2019)
Professor Nalin Thakkar, BDS, MSc, PhD, FRCPath (from 1 September 2019)
Vice-Presidents and Deans of Faculties
Science and EngineeringProfessor Martin Schröder, BSc, CChem, PhD, DIC, FRSE, FRSC, MAE
HumanitiesProfessor Keith Brown, MA, PhD, FRHS, FRSE
Biology, Medicine and Health Professor Graham M. Lord MA, PhD, FRCP, FRSB, FMedSci
Chairs of Committees of the Board of Governors
Chair of Audit CommitteeMr Colin Gillespie, BSc (Hons), FCA
Chair of Finance CommitteeDr John Stageman, OBE, PhD, CChem, FRSB
Chair of Remuneration CommitteeMr Gary Buxton, MBE, BA (Hons.) MIoD
Chair of Nominations CommitteeMr Jim Hancock BA (interim until 31 August 2019)
Mr Edward M Astle, MA, MBA (from 1 September 2019)
Chair of Staffing CommitteeMr Paul Lee, DL, MA, LLM, (until 31 August 2019)
Mrs Ann Barnes BA (Hons), Diploma IHM (from 1 September 2019)
Membership of the Board of Governors
From 1 September 2019
Category 1, ex officio members (2)
Professor Dame Nancy J Rothwell, DBE, DL, BSc, PhD, DSc, FRS, FMedSci, FRSB, FRCP(Hon), FRSA President and Vice-Chancellor
Mr Kwame Kwarteng, General Secretary of the Students’ Union, HND, BSc (from 1 July 2019)
Category 2, lay members (13)
Mr Edward M Astle, MA, MBA, Chair
Mrs Ann Barnes, BA (Hons), Diploma IHM
Mr Gary Buxton, MBE, BA (Hons.) MIoD
Mr Michael Crick, BA
Mr Colin Gillespie, BSc (Hons), FCA
Mr Nick Hillman, MA
Mrs Bridget Lea, BA (Hons)
Dr Neil McArthur, MBE, CEng, FIMechE, FIET
Mr Robin Phillips, BA (Hons)
Mr Andrew Spinoza, BA, MCIPR
Dr John Stageman, OBE, PhD, CChem, FRSB, Deputy Chair
Mr Richard Solomons, BA (Econ) (Hons), ACA
Mrs Alice Webb, M.Eng, Hon DA
Category 3, members of the Senate (6)
Professor Aneez Esmail, PhD, MRCGP, MFPHM, FRCP
Professor Danielle George, MBE, BSc, MSc, PhD, FIET
Dr Reinmar Hager MSc, PhD
Professor Steven Jones, PFHEA
Professor Nalin Thakkar, BDS, MSc, PhD, FRCPath
Dr Delia Vazquez, B.A. Hons, MPhil, PhD
Category 4, members of staff other than academic or research staff (1)
Ms Rosalyn Webster BA MA
Category 5, student member (1)
Ms Sara Khan BA (Hons) (from 1 September 2019)
The following were members of the Board of Governors in the previous academic year, to the dates shown:
Miss Fatima Abid (30 June 2018) General Secretary of the Students’ Union
Mr Paul Lee, DL, MA, LLM (until 31 August 2019)
Mr Shumit Mandal BSc (until 31 August 2019)
Professor Silvia Massini, Laurea (cum Laude), MSc, PhD (until 31 August 2019)
Officers and advisers
1FINANCIAL STATEMENTS
These financial statements reveal a reasonable financial performance and good strategic progress against a backdrop of continued financial pressures and uncertainty for the sector.
Chair’s foreword
This was another testing year for UK universities, with uncertainties arising from, among others, Brexit and the government review of higher and further education funding, and significant economic headwinds, not least from the fee cap on home undergraduates and the funding of pensions.
In this context, it is encouraging to see the University report an improved operating performance, with a rise in income from research, and an increased operating surplus (see page 14) – the key measure of the University’s financial performance. There was great progress against the core goals and Campus Masterplan, with numerous highlights offered in the President and Vice-Chancellor’s review. The overall deficit, however, is a concern, and mainly arises from a non-cash accounting provision for the USS pensions deficit.
Ensuring the University’s financial sustainability against the current political and economic backdrop requires shrewd management and strong leadership. On behalf of the Board of Governors I would like to commend the President and Vice-Chancellor, the Senior Leadership Team and all academic and support staff who are steering the University through these unpredictable waters.
I am also proud of the contribution of the many skilled and experienced people involved in the University’s governance. This year saw us conclude a review of governing instruments, resulting in revised Statutes and Ordinances being approved. This has enabled a reduction in Board size, as recommended by an external review of governance in 2017, with effect from 1 September 2019. We also continued to oversee full compliance with the Committee of University Chairs’ Higher Education Senior Staff Remuneration Code, and are maintaining our programme of continuous governance improvement for the Board and its committees. The Board also has had a role in the development of the new vision and strategic plan for the University, to be launched in 2020.
In both the near and longer term, I am confident that the University will continue to build on its unique combination of strengths – its scale, location in the UK’s second city, excellence in research and teaching, world leading innovation, unparalleled civic engagement and commitment to social responsibility – to contribute skills, knowledge and long-term economic and social benefit regionally, nationally and globally.
Edward M AstleChair of the Board of Governors and Pro Chancellor

2 FINANCIAL STATEMENTS
The year covered by these financial statements was another challenging one for the University and the whole UK higher education sector. While we have improved our operating performance, we have also reported an accounting deficit due entirely to the worsening of pension liabilities. Ensuring our financial sustainability is paramount, and never more so, as we approach the end of our Manchester 2020 strategic plan and look to our future.
President and Vice-Chancellor’s review of the year
This was another year of external turbulence and uncertainty for the higher education sector. The future funding of university staff pensions continued to be of concern across the sector. While student recruitment for our University remains healthy, others are now struggling because of global competition and a dip in the number of 18-year-olds in the UK.
The Augar Review of post-18 education and funding in England was published in May, though it is uncertain as to which, if any of the recommendations will be implemented – and when. The review made some helpful recommendations, including support for further education, reintroducing the maintenance grant and reducing interest repayments on loans while students are studying. It recommended a reduction in the cap on home undergraduate fees to £7,500. A subsequent report by the House of Lords Select Committee described the highly damaging impact of reducing the fee cap without financial compensation.
Uncertainty over Brexit continued for another year. Our priority is to remain a civic university with a global outlook and reach, which welcomes and embraces staff and students, and values academic and business partnerships across the world. We continue to do our best to support our staff, students and collaborators who are affected in different ways by the referendum outcome.
On campus, we implemented some major changes to enhance the student experience, deliver research impact and increase
interdisciplinary collaboration. We restructured our Faculty of Science and Engineering (FSE) into two Schools, with each of the previous Schools now incorporated as Departments. In the Faculty of Humanities, our School of Law merged with our School of Social Sciences.
In a challenging year for the sector, we reported a reasonable financial performance. Our priority, as in previous years, was to consolidate the financial position of the University by generating an operating surplus, which is essential for ongoing investment. Operating surplus is defined in the financial review on page 14. Total comprehensive income fell from £102.2 million to a deficit of £(110.5 million) and total net assets from £1.7 billion to £1.6 billion. Excluding very significant one-off pensions adjustments and other external volatilities, our financial results show an increase in underlying operating surplus to £40.8 million (3.7% of income) from £24.7 million (2.3%) last year (see page 14).
While this shows a year-on-year improvement, it falls short of our aim of delivering an operating surplus in the 5–7% range of our income. You can see a full breakdown in the financial overview. We continue to implement an agreed programme to improve the University’s financial position so it can invest in strategic priorities and assure our

3FINANCIAL STATEMENTS
financial sustainability. I would like to thank the Director of Finance and his team, and colleagues across the University, for their continued work to improve financial performance.
There have been positive developments in many areas, particularly in relation to our core goals of world-class research, outstanding learning and student experience, and social responsibility.
We saw total research income rise from £298.7 million to £323.5 million. Among the most significant awards were £8.7 million EPSRC funding for the Future Biomanufacturing Research Hub, a £6.7 million contract for applied health research collaboration in Greater Manchester, a £4.5 million Particle Physics Experimental Consolidated Grant and a £3.9 million contract extension with Boots UK.
While we are always cautious over the interpretation of league tables, it was very pleasing to see our University achieve our highest places in the Academic Ranking of World Universities (33rd) and the QS World Rankings (27th). The University was also ranked as the best higher education institution in Europe, and in the top three globally, for its social and environmental impact in the inaugural Times Higher Education University Impact Rankings. This ranking is based on the ‘societal impact’ of the University’s research using the UN Sustainable Development Goals as a framework. We also produced our own report on our impact in these 17 areas, which you can download at www.manchester.ac.uk/sdgs.
The University was the highest climber in the annual Reuters ranking of the world’s most innovative universities, reaching 53rd place, though we fell one place in the European table to eighth. Meanwhile, a report published by the European University Association, which looked at some of the innovative ways universities in Europe are working closely with companies, governmental agencies and other public organisations, featured the University prominently.
It was a busy year for colleagues working in our five research beacon areas: advanced materials, cancer, energy, global inequalities and industrial biotechnology. In advanced materials, the Graphene Engineering Innovation Centre (GEIC) opened and made a series of partnership announcements, including a collaboration with Highways England on improving transport infrastructure. We also welcomed the Chinese Minister for Science and Technology to the National Graphene Institute, the GEIC and the Manchester Institute for Biotechnology (MIB).
Continuing with industrial biotechnology, we celebrated the opening of the Future
Biomanufacturing Research Hub, building on the MIB’s groundbreaking work to drive clean growth, and welcomed leading businessman and entrepreneur Dr Gerald Chan on Foundation Day to speak about biotechnology and the conflation of science, business and ethics.
There was much exciting news in our cancer research. The £125 million Proton Beam Therapy Unit at The Christie, UK’s first NHS high-energy proton-beam therapy centre and dedicated research facility, treated its first-ever patient in December. We also progressed plans with The Christie and Cancer Research UK for a state-of-the-art facility to replace Paterson Building, which was damaged by fire in April 2017, boosted by a £25 million award from the Research England UK Research Partnership Investment Fund to the University.
Our energy researchers continued to make significant real-world impact, most notably in planning a greener future for our region. As part of the project commissioned by Greater Manchester Combined Authority and The Department for Business, Energy and Industrial Strategy, Tyndall Manchester calculated a carbon budget for Greater Manchester that is compatible with the commitment in the Paris Climate Agreement.
There were also successes for colleagues in global inequalities, notably for Professor Claire Alexander, whose contribution to the ‘Our Migration Story’ project helped it win a Guardian University Award. We welcomed United Nations Deputy High Commissioner for Human Rights Kate Gilmore to campus as we marked the 70th anniversary of the Universal Declaration of Human Rights.
Other major research developments included the official launch of our Lydia Becker Institute of Immunology and Inflammation, Creative Manchester, our project to champion culture and creativity, and our blueprint for Industry 4.0, the term given to the latest phase of the industrialisation process which will be transformed by digital technologies.
Many colleagues have been actively involved in discussions with leaders from Manchester City Council and the Greater Manchester Combined Authority on delivery of the Greater Manchester Local Industrial Strategy. The current plan very much aligns with our University’s strengths, with a major focus on health innovation and advanced materials/manufacturing, underpinned by digital, creative and environment.
Professors Peter Gatrell, Rebecca Herissone, David Langslow and Jennifer Mason were elected as Fellows of the British Academy, Professors John Radford and Rob Bristow
became Fellows of the Academy of Medical Sciences, while Professor Louise Walker received a Principal Fellowship of the Higher Education Academy. Dr Constance Smith, Dr Filipa Cox and Dr Conor Fitzpatrick were announced in first wave of Future Leaders Fellowships, which will see 41 early career researchers at universities across the UK each set to benefit from a share of £40 million towards cutting-edge research towards addressing fundamental global questions.
In our core goal of outstanding learning and student experience, the year brought many successes but also areas for improvement. We remained the most popular university for undergraduate applications, according to UCAS data, though we know that we cannot be complacent, with continued demographic and international changes lying ahead.
We were ranked equal 9th in the Times Higher Education European teaching rankings, down from 7th last year. This table does not take into account student satisfaction scores which are not available in many European countries. In the annual National Student Survey results most, but not all, subject areas achieved the 50% return rate required for reporting and our University return rate was 64%. Our overall satisfaction score was 84%, compared to 83% last year – a modest improvement. Our score is just above the English sector average and equal to the average for the Russell Group. We are looking in depth at these results to see how we can address the variability in results and support our staff in delivering the best possible experience for all our students.
We are very proud of our continuing commitment to helping talented students overcome barriers to education. An international example of this is our Equity and Merit Programme, which funds talented professionals from developing countries in sub-Saharan Africa to study at Manchester. It was therefore a delight to welcome the Ethiopian Ambassador, His Excellency Dr Hailemichael Aberra Afework, to the University to meet our scholars and our Chancellor, Lemn Sissay, who has strong ties to Ethiopia.
On a local level, we were pleased to be able to announce our partnership with Into University on IntoUniversity Manchester North, a centre that will work with up to 1,000 children and young people each year to improve their chances of gaining a university place. We also announced plans to partner with our neighbouring universities and the Greater Manchester Health and Social Care Partnership on a dedicated centre to help support higher education students with mental health needs – the first centre of its kind in any UK region.

4 FINANCIAL STATEMENTS
We launched the Graduates for a Greater Manchester scheme with Manchester Metropolitan University to improve the digital skills, confidence and employment prospects of local graduates from disadvantaged backgrounds. Funded by the Office for Students, the project is part of a wider government-backed project to keep talented graduates in their cities. We also merged a number of our own key change programmes to improve the student experience into a single programme.
At our summer graduations we celebrated with the first students to have completed three years of Stellify activities, thereby qualifying for our Stellify Award. Stellify gives students a framework of extra- and intra-curricular activities to develop beyond their studies, with key components including our annual Ethical Grand Challenges, volunteering, taking on leadership roles, and course units via our University College for Interdisciplinary Learning.
These students were not the only ones celebrating. First-year engineering student Luke Collinson was honoured as Construction and Engineering Undergraduate of the Year at this year’s TARGETjobs Awards, while Amelia Halls and Cristian Bodnar took home the coveted Thomas Clarkson Gold Medal for their academic research and presentations at the Undergraduate Awards in Dublin, Ireland. Meanwhile, the Tutor Trust, a charity for which more than 1,000 Manchester students tutor local pupils who need extra academic support, won the ‘Best New Charity’ at the 2016 Charity Times Awards in October. For the second year running, Manchester was named the most targeted university in the UK for top graduate employers by High Fliers Research.
We were the first UK university to place social responsibility as a core strategic priority, and this year saw a great deal of activity in this area. We became the first university to sign up to the Slave-Free Alliance and committed our support to asylum seekers as a university of sanctuary. We pledged, in collaboration with our Students’ Union, to eradicate avoidable single-use plastics where possible by 2022, and publically committed to supporting the UK government’s declaration of a climate change emergency.
Our School Governor Initiative, through which staff and alumni volunteer to support local schools, appointed its 1,000th governor, while The Works, the employment and skills service we provide in partnership with The Growth Company, was held up as an exemplar in the Civic Universities Commission’s report.
It was a fantastic year for our cultural institutions, which welcomed 1.3million visitors
in total. The world’s eyes were on Jodrell Bank Observatory as it was added to the UNESCO World Heritage List. Jodrell also hosted the fourth annual bluedot festival on the 50th anniversary of the Apollo 11 moon landing, welcoming almost 33,000 attendees over four days.
The John Rylands Library displayed rare historic documents relating to the 1819 Peterloo Massacre as part of a city-wide programme of events commemorating Peterloo’s 200th anniversary. One of Manchester Museum’s most famous artefacts, the skeleton of Maharajah the elephant, was exhibited in the city’s Piccadilly Station as part of an initiative to bring the Museum’s extraordinary objects to locations around Manchester.
Many of our staff and students are involved in engaging the public in our work and it was a joy to welcome 500 schoolchildren and their teachers to our Whitworth gallery for the Great Science Share. Our work in public engagement earned the University the National Coordinating Centre for Public Engagement’s Gold Engage Watermark.
We are a proud partner of the Manchester International Festival and many of our staff, students and alumni and institutions helped deliver another successful series of events. Notably, many of our engineering and drama students took placements on the interactive, city-wide Utopolis Manchester project.
Work continued apace on our Campus Masterplan with topping out ceremonies for our Manchester Engineering Campus Development (MECD) and the Henry Royce Institute (the UK’s national institute for materials science and research and innovation).
We officially opened the Masdar Building, which houses the GEIC, and we officially renamed our Manchester Cancer Research Centre Building as the Oglesby Cancer Research Building, recognising the long-running commitment and generosity of Michael Oglesby. Work was completed on Brunswick Park, bringing new seating areas, trees, shrubbery, wildflowers and a pedestrian/cycle path to the heart of campus, and we opened the refurbished Alliance Manchester Business School, the Schuster Building Annexe and the refurbished Coupland 3 Building.
A delegation from the University and the city region travelled to France in March for MIPIM, one of the largest property conferences in the world, to launch the search for a development partner for ID Manchester, the £1.5 billion world-class innovation district on our North Campus site.
Our campus plans will bring about a world-class estate for our world-class people. It was pleasing therefore to see some encouraging results in the 2019 Staff Survey. These include 92% of respondents saying that the University is a good place to work and 89% feeling proud to work for the University; 80% of our staff are satisfied with their job and 81% feel they are valued by the people they work with. There were also areas that we need to improve – notably in change management, communication, stress at work and how well our Senior Leadership Team listen, respond and communicate to staff. Senior colleagues and I are working on how we respond to the areas of greatest concern and support those things that our staff value.
We engaged with staff, students, alumni and stakeholders through the year in considering the University’s vision for its future. Through the Our Future initiative, we received around 4,000 ideas that have helped inform our new vision. We also asked all staff to contribute to what the University’s values should be. As well as reaffirming our core goals, the conversations revealed a number of cross-cutting themes, not least in terms of how we work best and collaborate. The themes will form the basis of a new strategic plan to be launched with the vision and values in early 2020.
Our annual gender pay gap (GPG) report showed that the median pay gap has shrunk a little from 13.1% to 12.0%, though there has been a small increase in the mean from 17.1% to 18.4% in favour of men. Our ethnicity pay gap analysis shows we have a mean pay gap of 10.5% and a median pay gap of 8.4% (in both cases in favour of white staff), which highlight the known issue of representation of Black, Asian and Minority Ethnic staff at more senior levels within our University. We are taking a number of actions to reduce the gaps as well as working to increase equality and diversity.
Our University became the 5,000th organisation to become accredited by the Living Wage Foundation (LWF). We applied for accreditation to affirm our long-term commitment to paying all our staff above the LWF rate.
There were many individual honours over the course of the year. We awarded the University’s medal of honour to Professor Tony Redmond to recognise his incredible career in emergency medicine; Rowena Burns, Executive Chair of Manchester Science Partnerships and Chair of Health Innovation Manchester, for her many senior roles in our city region; and Clive Rowland, our Associate Vice-President for Intellectual Property Matters and former Chief Executive of UMI3, for his role in many successes, innovations and investments to our University.

5FINANCIAL STATEMENTS
Professor Brian Cox was on our screens once again presenting the BBC series The Planets, while Professor Danielle George presented an episode of Horizon about avalanches. Professor David Olusoga, our new Professor of Public History, presented a second series of the acclaimed A House Through Time.
Our students, staff and alumni, and of course our Chancellor, Lemn Sissay, ran in the ‘Purple Wave’ as part of the Great Run in Manchester and raised money for charity. More than £11,000 was raised by 107 runners for the University’s Undergraduate Access Scholarships, Equity and Merit Scholarships and medical research at the University.
It was also a momentous year for an iconic personality from our past. Alan Turing, an LGBTQ+ icon and widely considered to be the father of theoretical computer science and artificial intelligence, was unveiled by the Bank of England as the new face of the £50 note following a public vote.
Our past and our present can be an inspiration as we look ahead. These financial statements show the importance of a bold, long-term vision, supported by a strategic plan that enables us to be responsive to more immediate challenges and opportunities. I believe that we enter a new year well prepared for our future.
Professor Dame Nancy RothwellPresident and Vice-Chancellor
Key performance indicators
Growth in research expenditure1 4.3%Total audited research expenditure in 2017/18 (latest available figure) was £556.0m, an increase of 4.3% on the previous year.
Growth in international student income of £20.9mInternational student fee income (full and part-time) increased by £20.9m (9.4%) during 2018/19.
External borrowing decreased to 35.8%External borrowing as a percentage of income has reduced from 38.1% to 35.8%.
Operating surplus2 is 3.7%Operating surplus as a percentage of income increased from 2.4% in 2017/18 to 3.7% in 2018/19 on a like-for-like basis.
1 Total audited research expenditure is defined as research expenditure as calculated in the University’s Transparent Approach to Costing (TRAC) return.
2 Operating surplus is taken as the surplus reported, adjusted for actuarial gains or losses in respect of pension schemes, revaluation of the USS deficit provision, capital income, depreciation and gains on investments (see page 14).

6 FINANCIAL STATEMENTS
The year in pictures
Image by Anthony Holloway
Image by David Gennard
Francine Hayfron, Cultural Park Keeper at the Whitworth
Imag
e by
Jill
Jen
ning
sManchester’s societal impact is best in Europe The University was ranked as the best higher education institution in Europe – and in the top three globally – for its social and environmental impact in the inaugural Times Higher Education University Impact Rankings.
Jodrell Bank added to UNESCO World Heritage ListJodrell Bank Observatory, home to the iconic Lovell Telescope, was inscribed as a UNESCO World Heritage Site.
The University-owned landmark and astronomical research centre joins international sites such as Machu Picchu, the Great Wall of China and the Taj Mahal on the prestigious list.

7FINANCIAL STATEMENTS
Imag
e by
Jill
Jen
ning
s
Manchester Town Hall
A new park on campusBrunswick Park opened at the start of the academic year, creating the largest green space on campus, with seating areas, tree, pedestrian/cycle paths and shrub and wildflower planting.
The parkland was created to benefit staff, students, visitors and the local community, and is a central part of the University’s Campus Masterplan vision.
Tyndall Manchester calculates carbon budget for Greater ManchesterAcademics at Tyndall Manchester collaborated with sustainability consultants Anthesis Group and Greater Manchester Combined Authority to develop and pilot a process for supporting cities to set ambitious climate change targets.
This approach is now being rolled out to other parts of the UK and Europe.

8 FINANCIAL STATEMENTS
Campus transformation continues A special event marked the ‘topping out’ of the Manchester Engineering Campus Development, the biggest building in Manchester. Other milestones we passed in our ongoing Campus Masterplan included the opening of the Masdar Building – home to the Graphene Engineering Innovation Centre – and of the redeveloped Alliance Manchester Business School, with its hotel, executive education centre and retail and leisure outlets.
Creative Manchester launchesJust under a year after playing a part in Manchester’s designation as a UNESCO City of Literature, we officially launched our Creative Manchester project in October 2018 to support our ambitious arts, cultural and creative industries strategy. The following July we announced an annual series of literature events as part of a new three-year artistic partnership with arts venue HOME.
1,000th school governor placedManchester became the first university in the UK to place more than 1,000 volunteers as school governors. The award-winning School Governor Initiative supports staff and alumni to take up positions in local schools and colleges where governors are in short supply.

9FINANCIAL STATEMENTS
Image by Jill JenningsStephen Gabriel, headteacher at St Peter’s Roman Catholic High School
Image by David Gennard
Stellify Award winners Bethan Counsell and Aya Wietzorrek
First Stellify Award winners graduateSummer 2019 saw the University confer degrees on the first students to have completed three years of transformative Stellify activities. Students who complete three annual Ethical Grand Challenges, 40 hours of volunteering and two leadership roles alongside their studies receive the Stellify Award – a mark of Manchester excellence.

10 FINANCIAL STATEMENTS
Lydia Becker Institute opensThe Lydia Becker Institute of Immunology and Inflammation was launched to undertake research into the immune system – the activity and regulation of which underpins many acute and chronic diseases. This development brings together the breadth and diversity of research across the University into one multidisciplinary institute.
Region’s students to benefit from first in mental health supportGreater Manchester will be the first place in the country to establish a dedicated centre to help support higher education students with mental health needs, thanks to a new partnership between the region’s four universities and the Greater Manchester Health and Social Care Partnership.
Government backs Manchester’s biomanufacturing expertiseOur new Future Biomanufacturing Research Hub was established, backed by £10 million in government investment, to drive clean growth. The hub will develop new technologies to transform the manufacturing processes of chemicals by using plants, algae, fungi, marine life and micro-organisms. Image by Jill Jennings

11FINANCIAL STATEMENTS
Concept artwork for the £50 note. © The Governor and Company of the Bank of England 2019
Alan Turing selected for new £50 noteThe Bank of England announced that Alan Turing, whose work at Manchester laid the foundations for artificial intelligence, would be the face of the new £50 note. Turing, a wartime codebreaker and an LGBTQ+ icon, was chosen by the Bank following a nationwide vote.

12 FINANCIAL STATEMENTS
Financial review
Operational and financial overviewThe University of Manchester has exempt charity status derived from the Charities Act 1993 and is responsible to the Office for Students, its principal regulator, which is charged with monitoring compliance with charity law obligations. The University, through its governing body, the Board of Governors, is aware of its responsibilities as a charity to act for the public benefit across all its activities and has had due regard to the latest version of the Charity Commission’s public benefit guidance (issued September 2013, updated September 2014). The objects of the University, as set out in the Royal Charter awarded in 2004, are “to advance education, knowledge and wisdom by research, scholarship, learning and teaching, for the benefit of individuals and society at large.” This overview includes references to the impact of our investments in these areas. These statements form our public benefit statement.
Total comprehensive income has decreased from £102.2m to a deficit of (£110.5m). Pensions accounting has had a significant impact on this position, with one-off charges of £143.3m included. Actuarial losses from our UMSS and GMPF pension schemes are also reflected in these figures, with a total loss of £35.3m this year, compared to a gain of £59.2m in the prior year. Excluding the effect of these and other specific accounting adjustments, the 2018/19 operating surplus of £40.8m has improved by £16.0m from prior year.
The cash generated by operating activities has declined and the cash and other liquid funds balance has reduced by £112.0m in line with expectations, with the main driver being the continued investment in our estate such as the new engineering campus. The cash position is a key measure of our financial sustainability and, as such, is closely managed as part of our financial performance and planning process.
Financial overview and key highlights
Key Highlights 2018/19 2017/18 % change £000 £000
Income excluding capital income 1,009,779 975,606 3.5%Capital income * 88,110 83,554 5.5%Total income 1,097,889 1,059,160 3.7%
Tuition Fee income 483,282 462,845 4.4%
Research income excluding capital 256,461 241,211 6.3%Research capital income 67,067 57,503 16.6%Total research income 323,528 298,714 8.3%
Operating surplus (see operating surplus table) 40,750 24,729 64.8%Operating surplus as % of income 3.7% 2.3%
Reported total comprehensive (deficit)/income ** (110,523) 102,225 (208.1%)
Net assets 1,606,245 1,716,768 (6.4%)Cash and short term investments 203,319 315,284 (35.5%)Operating cashflow 46,125 92,254 (50.0%)Tangible fixed assets 1,875,159 1,656,531 13.2%Heritage assets 257,539 257,239 0.1%Pension deficit (397,933) (221,669) 79.5%Borrowings (393,484) (403,663) (2.5%)
*Capital income relates to funding received for capital expenditure. Capital income can be either OFS, Research, or other funded.
** Total comprehensive income is the surplus/(deficit) for the year less the actuarial loss in respect of pension schemes.
Pensions
Impact post year end change in Adjust “Adjusted” USS deficit recovery plan 2018/19 for USS 2018/19 2017/18 £000 £000 £000 £000
Staff costs 569,656 - 569,656 537,408Change in USS deficit recovery plan 165,100 (109,808) 55,292 -UMSS change in benefits structure (27,267) - (27,267) -Past service costs 5,462 - 5,642 -
Total staff costs 712,951 (109,808) 603,143 537,408
Total expenditure 1,192,958 (109,808) 1,083,150 1,029,616
Reported (deficit)/surplus for the year (75,245) 109,808 34,563 43,059
Reported total comprehensive (deficit)/income (110,523) 109,808 (715) 102,225
Operating surplus 40,750 - 40,750 24,729 (per operating surplus table)

13FINANCIAL STATEMENTS
Pensions
On the face of the Statement of Comprehensive Income is a net charge of £143.3m as a result of pension charges, for clarity the movements are presented on page 12.
The largest adjustment of £165.1m relates to the increase in the liability for the USS pension scheme. The adjustment is based on the 31 March 2017 actuarial valuation which recognised a deficit of £7.5 billion in the scheme (a funding level of 89%). At the balance sheet date the University is required to recognise the contracted obligation presiding at the time. At 31 July 2019 there was a contractual deficit recovery plan in place based on the March 2017 valuation. To address the £7.5 billion shortfall this deficit recovery plan required that the deficit contribution rate increased from the previous 2.1% to 5% and the duration of the plan was extended from March 2031 to March 2034. This has resulted in the provision increasing by £165.1m as at the year end.
On the face of the Statement of Comprehensive Income there is also a £27.3m one-off reduction in the UMSS pension liability as a consequence of the benefit restructure which took place with effect from 1 January 2019 and which has reduced the scheme deficit going forward.
Finally, there are past service cost provisions of £5.5m for additional costs relating to UMSS and GMPF. £4.4m relates to estimates for the equalisation of the Guaranteed Minimum Pensions following a High Court ruling in October 2018. The remaining £1.1m relates to a recent legal judgement (called the McCloud case) which requires public sector schemes (GMPF) to adjust their benefits as a result of scheme reforms in 2015 being deemed unlawful as they were age discriminatory.
For the USS, a 2018 actuarial valuation has now been completed which shows a revised scheme deficit of £3.6 billion. Since the year end, and following this new actuarial valuation, a revised deficit recovery plan has been agreed.
This new plan requires deficit payments of 2% from 1 October 2019 to 30 September 2021 and then 6% to 31 March 2028. This reduces the deficit provision from £248.4m as at the year end to £138.6m, a reduction of £109.8m. If this revised contractual commitment had been agreed before 31 July 2019, the University would have had a surplus of £34.6m (as shown under the ‘Adjusted’ 2018/19 column on the pension table opposite) instead of the reported £75.2m deficit for the year (before Other Comprehensive Income).
Home tuition fees are under review and there are barriers to international fee growth
There is significant risk to the sector in relation to undergraduate fees and numbers. In May 2019 the Augar review of post-18 education proposed that the cap on the fee chargeable to Home Higher Education students should be reduced to £7,500 per year (from £9,250) and introduced by 2021/22 with Government replacing in full the lost fee income by increasing the teaching grant, leaving the average unit of funding unchanged. Whether the recommendations will be adopted is unknown. A significant risk to the sector would be if a fee cap is implemented without being fully replaced by the teaching grant. The forthcoming election also brings the possibility of significant policy changes.
Our plans to grow international student fee income depend on tuition fee price growth; reliance on postgraduate taught students; increasing global competition; the political climate surrounding the immigration status of students; and the geopolitical situation.
Pensions uncertainty may result in additional cost and industrial action
There is uncertainty about pension obligations, in particular for the USS pension scheme. A proposal that USS contributions should increase to 21.2% (previously 19.5%) of salary for employers and 9.6 % (previously 8.8%) for scheme members to meet the scheme’s financial commitments has been endorsed by the USS Joint Negotiating Committee, by the independent chair’s casting vote, but has been rejected by UCU, which maintains a position of “no detriment” for scheme members.
The University and College Union (UCU) opened its ballot of members on industrial action over pay and pensions, and UCU members have backed strike action.
Given the impact and volatility of pensions on the University’s risks and financial performance a detailed explanation is provided below.
Staff costs must be managed and balanced with income growth
The University has limited influence over the continued growth in wages and salaries, as this is driven by contractual increments and the national pay award. Staff costs must be managed in an environment where income growth is challenging. Projects to improve the efficiency of teaching, research and professional services are being progressed to balance cost growth with income.
Research cost recovery improvements are needed to ensure sustainability
A key factor of our strategy to increase research income is via initiatives to improve cost recovery. This is increasingly difficult to achieve not least due to the existing funding model for public sector research grants. This presents a long term risk for the sector, with full economic cost pricing proving hard to obtain from funders. Research funding in an increasingly multinational context continues to be highly competitive. If home and international tuition fees reduce, our ability to cross-subsidise research will be impacted.
The impact of Brexit The University sector is considerably impacted if the UK exits the EU without a deal.
In order to benefit from extended research contingency European funding and eligibility for new funds, the UK needs to pay its share of the EU budget for 2020 and allow for EU audits and controls. If the UK does not comply, and researchers no longer meet the eligibility requirements for their programme at the end of 2019, contracts may be terminated or payments suspended.
The long term impact on attracting and retaining EU national staff and students remains unclear.
Key Financial Risks

14 FINANCIAL STATEMENTS
What is your tuition fee spent on?
48% Staff costs for teaching
17% Maintaining buildings and facilities on the University campus
7% Bursaries
5% Central costs of student support
6% IT costs
5% Library costs
12% Central support services
1. Operating Surplus and Income Review
At an operational surplus level the University’s performance demonstrates the financial volatility of Higher Education Institutions. Operating surplus is often the key measure of financial performance, however the impact of pensions is so significant that it can obscure the picture. In order to provide a comparable measure significant one-off pensions adjustments (separately disclosed) have been excluded from Operating surplus calculations.
Operational performanceOperating surplus (excluding significant one-off pension adjustments) has improved by £16.0m, with an increase from 2.3% of income to 3.7%. As well as the significant one-off pension adjustments, this measure excludes non-cash items which are outside of the University’s direct control such as changes in the market value of investments (£4.3m) and actuarial gains and losses related to the UMSS and GMPF pension schemes (£35.3m). Capital income (£88.1m) and depreciation (£77.7m) are also removed, as the accounting treatment under FRS102 can cause significant volatility in the accounts, masking the underlying performance.
The University has experienced continuing growth in staff costs however the improvement in operating surplus has resulted from these costs being offset by increases to tuition fees income and a reduction in other operating expenditure. In 2018/19 the University spent a higher proportion of our income on staff costs (55.7% of income excluding capital compared to 54.4% in 2017/18). The continued growth in wages and salaries is driven by contractual increments and the national pay award, over which the University has limited control.
We have also seen a decrease in our other operating expenditure from 39.8% to 37.5% of our income (excluding capital), driven in part by investment in a number of strategic investments in prior year such as the SKA II programme.
With the volatility of the external landscape the financial resilience of the University remains a key focus. A programme of activities aimed at maintaining a sustainable financial future is being driven by the University’s executive. A number of these projects are ongoing and focus on strengthening and diversifying income generation whilst improving the efficiency of our activities.
During 2019/20, we will be updating our vision out to 2030, to address the opportunities and challenges higher education and our own University will face in the coming years. As we develop this strategy, we will be putting in place financial plans to support this vision whilst ensuring financial sustainability.
Operating surplus
2018/19 2017/18 £000 £000
Total comprehensive income as reported (110,523) 102,225
Add back: Depreciation and amortisation 77,732 78,438Significant one-off pension charges 143,295 -
Less: Capital income (88,110) (83,554)Gains on investments (4,308) (12,883)Gain on disposal of fixed assets (12,614) (331)Actuarial (gain)/loss in respect of pension schemes 35,278 (59,166)
Operating surplus 40,750 24,729
Operating surplus as % of total income 3.7% 2.3%
2018/19 income split
44% Tuition fees and education contracts
12% Funding body grants
29% Research grants and contracts
13% Other income
1% Investment income
1% Donations and endowments
1% 1%
44%
48%
12%
17%
29%
7%
5%
6%
5%
13%
12%

15FINANCIAL STATEMENTS
Total income
Total income increased to £1,097.9m, a growth of 4%. Excluding capital income of £88.1m, our income growth was £34.2m (3.5%) mainly driven by additional tuition fee income from international students. Our capital income has increased by £4.5m to £88.1m. This is due to a number of major capital projects in research, particularly the Henry Royce Institute and the Graphene Engineering Innovation Centre.
Our two major sources of income are tuition fees (44%) and research grants and contracts (29%), which is similar to the ratio in recent years.
2. Teaching and Learning
Teaching income
Income from tuition fees has increased by 4.4% to £483.3m in 2018/19. Full-time Home and EU student income has reduced from £210.1m in 2017/18 to £208m in 2018/19, an adverse variance of £2.1m. This is largely as a result of targeting an increased entry tariff and the change in student demographics. This reduction is in line with our strategy to raise the quality of our undergraduate students. Full-time international student fee income has increased from £203.7m in 2017/18 to £225.3m in 2018/19, growth of 11% from prior year. The growth in international students has mainly been driven by increases in post-graduate taught (PGT) student numbers with all three faculties growing PGT student numbers.
Income from part-time students has decreased by £0.3m from 2017/18 to £29m in 2018/19. This pattern of falling part time numbers mirrors the wider UK Higher Education market. Continuing efforts to diversify income streams have seen further increases in income from short course fees, with a 7% increase from 2017/18 to £20.8m. This favourable movement is due to Executive Education centre course mix within the Business School, the University Language Centre within the School of Arts Languages and Cultures and an increase in the delivery of Pharmacy short courses.
In line with the strategic plans further progress has been made in the expansion of online, blended, transnational education. Much of the support to this activity has been embedded into the Directorate of Student Experience and a number of new programmes, aligned with the University’s key teaching strengths, are being launched. The blended mode of delivery enables students from overseas and home access to innovative new programmes. This supports the improvement of student experience and also supports the strategy to diversify income streams.
Teaching value for moneyThe University is committed to providing clarity about how we use student income to deliver a high quality student experience. Analysis of our 2017/18 income (the latest year for which we have the full analysis) from home and EU undergraduate students shows that almost half of the £9,250 tuition fee (48%) was spent on teaching salaries and administrative support for teaching, a movement of 4% from 44% in 2016/17. A significant proportion (17%) was invested in our estate and buildings to ensure that we have excellent facilities and buildings for learning. Our teaching and learning activities can only be delivered with the support of central services, which account for 12% of the tuition fee. These services include the areas of social responsibility, compliance and risk management, finance and human resources.
Our annual analysis continues to show that the £9,250 tuition fee is being fully utilised for activities relating to undergraduate teaching and learning. Any reduction in the fee would impact on the quality of the teaching and learning experience or would require the University to subsidise our home and EU undergraduate education via other income sources or to make efficiency savings.
Investments in teaching
Our capital masterplan has seen significant investment in our estate to support teaching and learning. The Alliance Manchester Business School has been completed during 2018/19 and the Manchester Engineering Campus Development (MECD) is continuing to progress well. These projects will have a transformative impact on teaching and learning facilities.
We have continued to invest in our Student Lifecycle Project and the My Manchester digital platform with £9.4m of investment (£8.5m intangible capital software and £0.9m revenue expenditure) in Student Lifecycle and £2.0m in My Manchester.
Our widening participation activities are a key part of our social responsibility strategy, and the most recent analysis (using 2017/18 data) indicates that we spent in the region of £18m on these activities.
Teaching risksThe Augar review of post-18 education has recommended a significant reduction in fees for home undergraduates. The analysis above indicates that the £9,250 fee is fully spent supporting the provision of undergraduate education; a reduction in fee would impact the quality and sustainability of these programmes.
International full-time fees make up 47% of our tuition fee income and in 2018/19 surpassed Home/EU full-time fees as the
largest source of tuition fees income. The income generated from international student tuition fees is dependent on high numbers of post-graduate taught students. The demand for these programmes can be volatile and we are looking to mitigate this risk in future years by rebalancing between undergraduate and postgraduate students. International student numbers are reliant on students from a relatively small number of countries and so investment has been made in attracting students from a broader range of countries in order to mitigate the risk of disruption to traditionally successful groups.
Our plans to expand online, blended, transnational education are progressing, with assumptions for future growth included in our financial projections. The risk in terms of the speed and scale of this expansion is being monitored and managed by the University of Manchester Worldwide leadership team.
Teaching impactThrough our work to support access, student success, progression and employability the University proactively seeks to address the specific challenges which students from widening participation backgrounds often face in making the transition to university study and subsequent employment. The principles we developed in 2017 as a result of our review of widening participation activity continue to inform our Access and Participation plan with the Office for Students. This plan provides detailed information on the University’s responsibility to all students, regardless of background or financial considerations.
Parts of Greater Manchester have some of the lowest progression rates into higher education in the UK and we are committed to addressing this through the delivery of longer term outreach work and targeted pre-16 activities with the most able, disadvantaged students. To illustrate this, during 2018/19, 833 pupils participated in our activities for British Science Week, over 1,600 secondary school pupils participated in our Manchester Gateways Programme and 918 pupils were supported through our new INTO University of Manchester North Centre. The University is part of Greater Manchester Higher (GMH), a collaborative network of higher education institutions which delivers a programme of activities to target learners, including specific target groups such as care experienced and disabled students. During 2018/19, the partnership worked with 107 secondary schools and colleges across Greater Manchester engaging over 7,100 learners. Our commitment in this area is further emphasised by the strategic partnerships we have with a number of leading education charities including INTO University, The Brilliant Club, ReachOut and the Tutor Trust.

16 FINANCIAL STATEMENTS
Our post-16 work enables prospective higher education students to find out about studying at The University of Manchester and other research-intensive institutions. Access Manchester, is a coherent framework and website for our range of widening access programmes, which students and their key influencers can easily understand.
Our flagship initiative, the Manchester Access Programme (MAP), supports outstanding Year 12/13 students from under-represented groups in Greater Manchester and with no immediate family history of participation in higher education to progress successfully into The University of Manchester and other research-intensive universities. MAP is now firmly embedded in the work of the University; in 2018/19 472 students completed MAP and between 2005 and 2018 over 1,900 MAP students have been successful in gaining a place at The University of Manchester. In addition, many MAP students have also progressed to courses at other highly-selective, research-intensive universities. We have continued to expand our online Manchester Distance Access Scheme (MDAS), a national widening access programme for students who have been made an offer from the University. Students complete an academic piece of work related to the subject they plan to study at degree level and in 2018/19, 165 students successfully completed MDAS.
Since 2011, the University has provided admissions decision-makers with supplementary data to allow them to put the achievements of each individual applicant into context. Indeed, as a University we perform towards the top of the English Russell Group for the proportion of entrants from disadvantaged backgrounds. The latest HESA Performance Indicator Data for 2017/18 shows 7.8% of our entrants (380 students) were from Low Participation Neighbourhoods (LPNs, POLAR4, quintile 1), performing above the average for the English Russell Group of 6%. We also have a high proportion of entrants from lower socio-economic backgrounds at 23.5%. We recognise that some applicants may have previously faced social, socio-economic or educational disadvantages. For entry in 2019, in order to ensure that all applicants with the potential to succeed have equal opportunities through our selection process, we strengthened our use of contextual data and made contextually flagged students an offer of one A-level grade lower (or equivalent) than the standard offer for their course, if they placed Manchester as their firm choice.
In 2019, the University’s overall undergraduate student satisfaction, as measured in the National Student Survey (NSS) was 84% with a response rate of 64%. Over the last year the University has emphasised its commitment to enhance student satisfaction with continued development of our online support, promotion
of interdisciplinary learning and student choice (UCIL) and opportunities to engage beyond the curriculum (Stellify). We have also invested in the Student Lifecycle Project with the aim of improving processes across all aspects of the student journey from application to graduation.
Our capital programme will also support our students, with significant renovations of existing classrooms and new facilities for teaching and learning within the new Alliance Manchester Business School and Manchester Engineering Campus Development and new student residences in Fallowfield.
Non-continuation at the University is low with only 3.9% of all entrants no longer in HE by 2017/18 (of entrants in 2016/17). In 2017/18, 3.4% of our young entrants from LPNs were no longer in HE and this compares to an England average of 7.6%. Our data for 2016/17 indicates that 29.2% of our undergraduate students were from low income households of less than £25,000 per annum. The University is committed to ensuring that financial issues do not present an obstacle for learners to access the full student experience. Approximately a third of all our students will receive bursaries of up to £2,000 per year – and around 200 Widening Participation students will receive the University’s targeted Undergraduate Access Scholarship in each year.
As was reported last year, the metrics by which employability is measured have changed. Employability data is now captured via a new ‘Graduate Outcomes Survey’, which has replaced the Destinations of Leavers from Higher Education (DLHE) Survey. One significant difference with the new survey is the move of the census date from six months to 15 months after completion of degree. Destinations data on the University’s 2017/18 graduates, therefore, is being collected through late 2019 and will not be published until early 2020.
Another new employability metric that is likely to form part of future Teaching Excellence Framework (TEF) Awards is the Longitudinal Education Outcomes (LEO) which looks at employment and earnings of HE graduates 3 years after graduation. The University is currently developing a new employability strategy and associated targets to reflect these new metrics.
A key ambition of the University is to promote a 21st century, interdisciplinary approach to learning and scholarship through our University College for Interdisciplinary Learning (UCIL). UCIL offers credit-bearing course units that contribute to a student’s degree programme. Units bridge disciplines, with many focused on complex challenges of now and the future such as global conflict, sustainability, leadership and enterprise, mental
health, food security and the impact of artificial intelligence. UCIL has developed rigorous and innovative platforms and models for teaching, learning and assessment, from face-to-face, through blended, to interactive online learning. Units are delivered by pan-University teams of world-leading academics. Students from across the University study together, bringing their own subjects’ academic perspectives to an issue. In this way, they develop new ways of thinking that equip them for a rapidly changing world. They acquire key employability skills such as team-working, cultural awareness, problem-solving, critical analysis, adaptability and resilience. In 2018/19 2,039 students drawn from all faculties completed a UCIL unit.
3. World-class Research
Research incomeTotal research income has grown by 8.3% to £323.5m. Research income accounts for 29.5% of our total income, an increase of over 1% from 2017/18.
Underlying revenue research income (excluding capital income) has grown by 6.3% since prior year, this growth is a substantial improvement from the last 2 years when underlying growth has been at 1.4%. The Cancer beacon area, which had been impacted in prior years as a result of the fire at the Paterson Building in April 2017 has seen a particular rebound. The University is continuing to work in partnership with The Christie and Cancer Research UK to replace the Paterson building with an integrated state of the art cancer research facility. Funding from UK Industry and commerce has increased this year, mainly as a result of ongoing collaborations with industry partners.
Our funding from UK Research Councils has seen significant growth of £26.0m in the year, mainly driven by capital income relating to the Henry Royce Institute (£20.4m). The Henry Royce Institute will be the UK national centre for research and innovation of advanced materials, showcasing our position as a world-leader in developing new and existing materials and supporting the University’s ‘Advanced Materials’ research beacon. Construction of the Henry Royce Institute at Manchester has been progressing extremely well during 2018/19.
Our research funding from international sources has seen a decrease, in part due to the one-off capital income for the Graphene Engineering Innovation Centre funded by the Abu Dhabi Future Energy Company PJSC received during 2017/18.
In addition to these research funded facilities, the University’s capital developments for MECD and AMBS will continue to support world-class research. We have continued to invest in research through the Research

17FINANCIAL STATEMENTS
Lifecycle Programme, with the objective of improving our systems and processes.
Research income has grown for a number of years however the ‘leading indicator’ of new award and renewal value (excluding capital) has dropped for the second, consecutive year to £255.9m, a decrease of £12.3m and 4.6% on the prior year.
Funding body grants
Income from funding bodies was £131.7m, an increase of £4.5m compared to the prior year. £2.2m of the movement relates to capital funding received in 2018/19 to support the Alliance Manchester Business School development and MECD. There was a £1.3m uplift in recurrent funding, mainly as a result of additional funding for research and a £1.3m increase in funding for Special Initiatives over a number of projects with the largest being funding for Connecting Capability.
Research risks
Brexit presents a particular risk for research activity. Although UK government has committed to subsidising any European funded research, the logistics of this are not yet fully communicated. Internal planning for a no-deal Brexit is ongoing to ensure that the risk is well understood and planned for.
The research funding model presents a risk to the sustainability of research intensive Universities, with most funders not paying the full economic cost for research. As is seen at all research intensive Universities, international tuition fee income has to be used to subsidise research. Whilst this has the benefit to students of enabling research-led teaching, it restricts our ability to invest in research infrastructure and staffing.
A number of internal initiatives, aimed at improving research cost recovery, have continued implementation during 2018/19. However this continues to be challenging with increased pressure from funders to reduce costs and match their equipment funding with internal funds.
Research impact
The University of Manchester’s five research beacons, comprising Advanced Materials, Cancer, Energy, Global Inequalities and Industrial Biotechnology – see www.manchester.ac.uk/beacons - illustrate how our pioneering discoveries, interdisciplinary collaboration and cross-sector partnerships are tackling some of the biggest questions facing the planet. We have almost 900 research partnerships with public, private and third-sector organisations.
The University is at the forefront of tackling global inequalities, with more than 300 of our staff working in this area – from poverty to social justice, from living conditions to equality in the workplace. We are improving understanding of the world and changing it for the better. We seek to guide governments and policymakers towards new approaches to tackling poverty in countries such as Zimbabwe, Bangladesh and Tanzania and the University has been part of the response effort in significant global humanitarian crises in the Philippines, Gaza and Sierra Leone. Our Global Development Institute (GDI) is the largest dedicated research and teaching institute of its kind in Europe. Our Humanitarian and Conflict Response Institute is the most significant teaching and research institute in the UK for humanitarian studies and one of the top five worldwide. The GDI is the lead partner on the FutureDAMS consortium which received £8m from the UKRI Global Challenges Research Fund to co-develop an approach and toolset to help design and plan better human interventions in complex human-engineered natural resource systems, with a focus on developing countries.
The University’s work on advanced materials will allow people to work in the most demanding environments, on the frontiers of the energy sector or inside the human body. This research is developing innovative solutions to some of the world’s most critical problems. The University is recognised as the leading global knowledge base in graphene and 2D materials, with more than 300 dedicated researchers, two Nobel laureates and more than £195m of investment. UMI3, the University’s technology transfer organisation, has launched a number of spin-out businesses which use technology developed from our 2D materials research. One of these businesses enhances the performance of elastomers with 2D materials. Two use graphene to create new types of sensor, one of which measures small concentrations of polluting gasses in the atmosphere and the other measures variable force by means of a transparent and flexible interface. We have been chosen to host the national £235m Henry Royce Institute (due to open in 2020) and the University’s $100m partnership with BP has created in Manchester an international hub for advanced materials expertise.
In cancer research we are making a leading contribution to the fight against the disease. Survival rates have doubled in the last 40 years in the UK. The University’s approach to cancer research spans the full spectrum of combating the disease, from early diagnosis to help for carers. Our breakthroughs include clinical trials with AstraZeneca for Anastrozole, which prevents relapses in breast cancer. More than 1.5 million women have benefitted from breast cancer therapy developed by our researchers. We are partners in the Manchester Cancer

18 FINANCIAL STATEMENTS
Research Centre (MCRC) with the Christie NHS Foundation Trust and Cancer Research UK. Across the full domain of health research six NHS trusts work with us as part of the Manchester Academic Health Science Centre.
Following the 2017 fire at the Paterson Research Building, the MCRC partners agreed to financially support a £100-150m new research facility, currently known as the Paterson Redevelopment Project (PRP). The PRP has also been awarded £25m as a contribution by Research England via its UK Research Partnership Investment Fund (UKRPIF). The PRP aims to deliver the scale and diversity of infrastructure for the next 15-20 years to enable recruitment of additional world-class researchers, break down barriers between cancer research sectors and help to drive further research/clinical integration.
In 2016, Manchester was awarded a £28.5m NIHR grant for the Biomedical Research Centre which is driving forward pioneering research into new tests and treatments for a number of diseases including cancer. In 2018 a Manchester health consortium including the University of Manchester was awarded £6.8m to develop an Innovate Manchester Advanced Therapy Centre Hub (iMATCH) which will focus on cellular therapies for a wide range of illnesses, including cancer.
The University is also leading the European industrial renaissance driven by biotechnology, finding sustainable alternatives to the finite resources needed to manufacture products that we use every day. We have a grant portfolio in industrial biotechnology worth more than £100m and partnerships with leading companies – including GlaxoSmithKline, Shell, Unilever and Pfizer – which drive the creation of new bio-based chemicals. In 2019, the University was awarded £10m to launch the Future Biomanufacturing Research Hub which will develop new biotechnologies that will speed up bio-based manufacturing in three key sectors – pharmaceuticals, chemicals and engineering materials.
From the sustainability of sources to meeting the demands of urban communities, the world faces some big questions on energy. We are finding the solutions that will allow us to continue to heat our homes, light our buildings and travel more efficiently. We have 600 staff researching energy solutions for the future and £80m of ongoing energy projects, covering generation, storage, systems and use. Our Dalton Nuclear Institute is the UK’s most advanced academic centre for nuclear research and development and high-level skills development. The launch in July 2018 of our Manchester Environmental Research Institute further strengthens our capabilities and contribution to the challenges of developing sustainable energy sources. In
2019, EPSRC awarded the University funding to bring together diverse groups from across the University to tackle the grand challenge of plastic waste. We will seek solutions to the challenge of plastics pollution through an integrated approach that explicitly couples Manchester’s strength in sociotechnological understanding and influence to our industry-guided solutions across chemistry, safety, materials, engineering and social sciences.
The encouragement of enterprise is a critical part of our culture and the commercialisation and exploitation of our intellectual property is a fundamental part of our activity. New jobs have been created, many processes improved and valuable new products have been developed which have been sold here and abroad.
Our history of intellectual property commercialisation spans more than 25 years, during which time we have generated more than 100 spin-out companies, concluded over 300 technology licences and won several national awards for our social enterprise activities. Since 2004 our commercialisation activities have contributed over £500m to the UK economy. The Reuters Index ranks the University as Europe’s 8th most innovative university (and 4th in the UK). The University continues to invest in improving the effectiveness of its IP commercialisation activities. The University’s technology transfer organisation is being restructured with the objective of increasing the number of new IP licencing agreements and University spin-out businesses capable of creating positive social and economic impact.
Our research has major impacts in our local communities and city. The University entered a deal in September 2015 with leaders across health-care research, academia and industry to harness the partner organisations’ collective expertise to develop the infrastructure needed for clinical trials and health informatics. Health Innovation Manchester will speed up the discovery, development and delivery of innovative solutions to help improve the health of the almost three million people in Greater Manchester, and beyond.
The Greater Manchester conurbation has some of the poorest areas in the country, with persistent inequalities of treatment, opportunities and experiences of different social groups. A growing programme of research is aiming to address inequalities in Greater Manchester and maximise the benefits for the city region from our research through collaboration and engagement with the public and policymakers to address issues of equality and fairness. This includes £987,000 invested in a Greater Manchester Inclusive Growth Analysis Unit, with £400,000 of this coming from a partnership with the Joseph Rowntree Foundation. This programme has engaged
stakeholders to ensure that poverty reduction is central to the growth and devolution agendas in Greater Manchester and examples of activity include a Greater Manchester Fair Growth conference with the Greater Manchester Combined Authority, the development of reports on inclusive growth and a Human Development Index for Greater Manchester.
The University has had a particularly successful year in business engagement which has included first position nationally in value of all collaborative research with business and second position in the value of research contracts from UK firms. Examples of collaboration have included securing four Prosperity Partnerships, flagship projects for the Industrial Strategy, in partnership with Unilever, BP, Astra Zeneca and Akzo Nobel.
The year also saw the successful launch of the Scale Up Forum by the Alliance Manchester Business School, a peer-to-peer network catering for some of the fastest-growing firms in the Greater Manchester region. Work with SMEs has also been enhanced by new Knowledge Transfer Partnerships, a prestigious Innovate UK scheme supporting projects which engage a researcher to develop an innovation for a company. Projects have ranged from combating insurance fraud using machine learning techniques through to development of revolutionary graphene-soled running shoes. The University has the highest number of KTPs in England. Our success in business engagement creates an environment for student enterprise to flourish, for example through our competitions, Venture Further and the Eli and Britt Harari Graphene Enterprise Awards, delivered by the Masood Enterprise Centre from its dedicated new premises in the Alliance Manchester Business School.
4. Social ResponsibilityOur strategic commitment to social responsibility is unique among British universities and reflects the commitment we have to social and environmental wellbeing through our research, teaching, activities and operations. Our work on social responsibility activity has five priorities: research with impact; socially responsible graduates; engaging our communities; responsible processes; and environmental sustainability.
Across ‘research with impact’, we are tackling some of the world’s greatest challenges through our investment in research. As referred to above, these are exemplified by our five research beacons, where we are producing innovative research breakthroughs that are making a lasting difference to the world. For example on global inequalities we lead an inclusive growth analysis unit for Greater Manchester through our Manchester Urban Institute, in addition to supporting the professional

19FINANCIAL STATEMENTS
development of disaster and humanitarian professionals through our Humanitarian and Conflict Response Institute as referred to in the Research impact section above.
Across ‘socially responsible graduates’, we are ensuring the students we educate come from the widest variety of backgrounds and develop ethical, social and environmental responsibility towards the societies they serve. Locally, the work on the Manchester Access Programme is referred to above. Worldwide, we support Master’s students from some of the world’s least developed countries – Uganda, Tanzania, Rwanda and Bangladesh – to undertake a Manchester study programme at no cost, to support the development of their countries. In the past year 18 full-time campus students and 10 distance learning students benefited from this Equity and Merit Scholarship Scheme.
Upon arrival at Manchester, all new students are supported to ‘do more and be more’ during their time at Manchester through our Stellify initiative (referred to in the Teaching impact section above). This encourages students to consider their place in the world and how they can make a difference.
In 2018/19 examples of impact include the Ethical Grand Challenges Programme where 4,676 first year students undertook a sustainability challenge, 1,575 second year students did an online social justice challenge and 968 year 3+ students took part in a workplace ethics activity. 1,400 students undertook externally-verified volunteering activities that benefited wider society. This was also the first year that students were able to qualify for the Stellify Award. This is the University’s most prestigious extracurricular accolade presented to students who successfully complete all the University’s Ethical Grand Challenges, 40 hours of community volunteering and fulfilled two leadership roles.
Across ‘engaging our communities’, we became the first University in the UK to achieve a Gold Watermark for public engagement by the National Coordinating Centre for Public Engagement. We invest significant resource into our publicly-accessible cultural institutions to engage and inspire local communities and wider society with science, heritage, literature, the arts and wider culture. Specific importance is attached to the work of the Manchester Museum, the Whitworth, John Rylands Library and Jodrell Bank Discovery Centre in engaging with schoolchildren and people from under-represented groups. The total number of visits to our cultural institutions for 2018/19 was 1,258,593 comprising of Manchester Museum (381,234), the Whitworth (381,241), John Rylands Library (338,914), and Jodrell Bank Discovery Centre (157,204 – including attendance at the award-winning Bluedot festival of music, culture and science). In July
2019, in recognition of its internationally significant heritage, science and cultural impact, Jodrell Bank Observatory was awarded UNESCO World Heritage Site status and has been inscribed on the World Heritage List.
We encourage staff to support the educational achievement of pupils in state schools. To this end we encourage them to volunteer as School Governors through our multi-award winning School Governor Initiative – the largest of its kind in the UK. In the previous year, we became Britain’s first university to surpass 1,000 School Governors (comprising 234 staff and 904 alumni) who’ve supported around 450,000 learners and created £6 million of economic value. We also organize a Community Festival and a ScienceX showcase in a local shopping centre which engaged more than 7,000 members of the local community with our research and teaching.
Across ‘responsible processes’ we aim to use our position as a key anchor institution in the city region to benefit society through our significant business operations such as employment and procurement. Skills and employment levels in our local communities are lower than average in the UK. We are addressing this through our leadership of The Works – an award-winning and unique facility in British higher education based in the heart of our local community. This provides opportunities and support to jobseekers including pre-recruitment training and job matching to local employers, including to the University. Since 2011 The Works has supported 4,253 people from our local communities back into work, creating £62 million of economic value to the region. We have also recruited 33 new apprentices at the University this year from among surrounding communities.
We are keen to ensure that opportunities for women and Black, Asian and Minority Ethnic (BAME) staff to progress into and through the University are measured and have a number of initiatives to improve representation of these groups of staff. The proportion of female academics at senior lecturer and above was 32% in 2018/19 compared with 22% in 2007/08. This compares to a female lecturer pool of 47%. The proportion of ethnic minority staff at Grade 6 and above in the Professional Services who are BAME was 9% in 2018/19, whereas the proportion of BAME employed in professional occupations in the UK was 14%. The proportion of BAME staff who were senior lecturers, readers and professors across all Faculties in 2018/19 was 12%, whereas the BAME lecturer pool was 20%. This remains an area of focus for the University. In comparison to other Russell Group institutions the University has above average representation of BAME staff in both academic and professional and support services roles. We were also recognised the English University system leader for LGBT-inclusivity in the annual Stonewall index.

20 FINANCIAL STATEMENTS
Across ‘environmental sustainability’ we are using our full range of knowledge and influence to support a world that is environmentally sustainable. We have committed to Manchester’s zero-carbon target by 2038, supported the government’s declaration of a climate emergency and set out to eliminate avoidable single use plastics by 2022. Through our research we are at the forefront of tackling key global challenges such as climate change, population growth, rapid urbanisation, overconsumption, food and water security, loss of biodiversity and pollution. We are equipping all students with knowledge and experience to positively contribute to our world as professionals and citizens of tomorrow through formal study programmes and extra-curricular initiatives such as our Ethical Grand Challenges, which is offered to all 8,000 new undergraduate students.
We have ensured our organisational processes, such as our £1bn campus development programme, procurement, and energy and resource management, are creating opportunities for the efficient use of natural resources, with the additional benefits of financial savings and an environment that enhances health and wellbeing.
Over 61% of University staff members travel to work sustainably as their main mode of transport, with 36% of total journeys walking or cycling. 93% of our students travel sustainably, with 52% of total journeys walking or cycling. In addition, the University’s Bicycle Users’ Group (UMBUG) is one of the biggest in the HE sector with over a thousand members and UMRun is the first employer run-commute group established outside of London. We are also engaging with staff, students and alumni to embed a culture of environmental sustainability, and partnering with people and organisations in pursuit of shared goals around sustainability. For example we support our community of over 10,000 staff through the multi award-winning 10,000 Actions initiative, which, during 2018/19, has engaged 5% of staff in 986 actions on sustainability. Since the 2016 launch, more than 4,500 actions on sustainability have been completed.
Finally we subjected our operational processes, public engagement, teaching and research to a new global ranking based on the United Nations Sustainable Development Goals. This Times Higher Education University Impact Ranking placed the University as top in Europe and third globally for our social and environmental impact.
The Trade Union (Facility Time Publication Requirements) Regulations 2017 require the University to publish information on trade union facility time annually and the table of data for the reporting period 1 April 2018 to 31 March 2019 is as follows:
Staff costs (excluding ERVS) and staff costs as % of income (excluding capital income)
580 60%
560 50%
540 40%
520 30%
500 20%
480 10%
460 0% 2016 2017 2018 2019
Year
Staff costs as % of income (excluding capital)
Staff costs (excluding ERVS)
The Trade Union (Facility Time Publication Requirements) Regulations 2017: 1 April 2018 to 31 March 2019
Relevant union officials
Number of employees who were relevant union officials 33 during the relevant period
Full-time equivalent employee number 32.2fte
Percentage of time spent on facility time
Percentage of time Number of Employees
0% 3
1-50% 26
51%-99% 1
100% 3
Percentage of pay bill spent on facility time
Total cost of facility time £288,744
Total pay bill £403,722,941
Percentage of the total pay bill 0.07%spent on facility time, calculated as:(total cost of facility time ÷ total pay bill) x 100
Paid trade union activities
Time spent on paid trade union activities as a 1.99% percentage of total paid facility time hourscalculated as:(total hours spent on paid trade union activitiesby relevant union officials during the relevantperiod ÷ total paid facility time hours) x 100
5. Financial Management and Risks
£m %

21FINANCIAL STATEMENTS
Staff costsThe total staff costs reported on the SOCI have increased by £176m. Staff costs barring pension adjustments including ERVS have increased by £33m during 2018/19. The main driver of this increase is inflationary pay awards and increments. The M2020 strategic initiatives have continued to result in a reduction in headcount in a number of areas. ERVS costs in 2018/19 are £7.4m (2017/18 £6.3m). Staff costs excluding ERVS costs as a percentage of our income (excluding capital income) have increased from 54.4% to 55.7%. Staff costs have continued to grow more quickly than income.
Capital investmentsIn 2018/19, we have seen significant progress across our capital masterplan, resulting in an increase of £218.6m in the net book value of our tangible fixed assets at the year end. This investment is across a number of building projects to support our teaching and research, including Manchester Engineering Campus Development, Alliance Manchester Business School, Henry Royce Institute and Fallowfield student residences.
Capital risksAs the majority of projects within the Capital Masterplan are now under contract, this risk has been significantly mitigated. All risks relating to capital are monitored by the University’s Capital Planning Sub-Committee and Finance Sub-Committee with support from the University Estates and Finance teams. Recommendations from the sub-committees are reviewed for approval by Finance Committee.
The University continues to develop its vision for ID Manchester; the redevelopment of its North Campus site. The University of Manchester’s vision is that the 26 acre (10.5 hectare) ID Manchester will be a dynamic, world-class community with innovation, collaboration and enterprise at its heart, with the potential to create over 6,000 new jobs. ID Manchester will be where innovative new businesses and the wider community thrive in a connected enterprise and innovation ecosystem. Global firms will rub shoulders with dynamic start-ups and scale-ups to their mutual benefit.
Cash and liquidity and investmentsCash reserves are at £203.3m, a net reduction of £112m compared with prior year. This has resulted in a decrease in liquidity days from 121 in 2017/18 to 76 in 2018/19 (excluding £143.3m one-off pension charges, as set out on page 14, which are not a current cash requirement of the University). The major cash outflow during the year has been the planned investment in our Capital Masterplan with cash expenditure on fixed assets of £310.2m compared to £236.7m last year.
Our financial planning places a strong focus on maintaining a sustainable cash position. For planning purposes we have prepared a number of scenarios to highlight areas of risk and identify mitigating actions.
Endowment and investment performance continues to remain a risk with returns dependent on volatile financial markets notably due to the unknown impact of Brexit.
Financial instruments
Financial risk managementThe University’s Treasury function monitors and manages the financial risks relating to our operations through internal risk reports, which analyse exposure by degree and magnitude of risks. Compliance with policies and exposure limits is reviewed by Finance Committee on a regular basis. We do not enter into or trade financial instruments, including derivative financial instruments, for speculative purposes.
Credit risk managementCredit risk refers to the risk that a counterparty will default on its contractual obligations resulting in financial loss to the University. The credit risk on liquid funds and financial instruments is limited because our exposure is to counterparties with high credit-ratings which have been assigned by international credit-rating agencies. Our exposure and the credit ratings of our counterparties, are continuously monitored. Credit exposure is controlled by counterparty limits that are reviewed and approved by Finance Committee at least annually. Trade receivables consist of a large number of customers, spread across diverse sectors, populations and geographical areas.
Liquidity risk managementUltimate responsibility for liquidity risk management rests with the Board of Governors, which has built an appropriate liquidity risk management framework for the management of the University’s short, medium and long-term funding and liquidity management requirements.
We manage liquidity risk by maintaining adequate reserves and banking facilities, by continuously monitoring forecast and actual cash flows, and by matching the maturity profiles of certain financial assets and liabilities.
Price and interest rate riskPrice risk arises on financial instruments because of changes in, for example, commodity prices or equity prices. Listed investments with a fair value of £271.0m are exposed to price risk but this exposure is within the University’s risk appetite.
The University had £155.0m deposit investments with more than three months maturity at the year
end date. The majority of deposits are subject to fixed interest rates and we are therefore not subject to any significant exposure to fluctuating rates.
Going ConcernThe University ended the year with cash resources of £203.3m, including £155m of short term investments. The budget for 2019/20 continues to show a surplus. Forward cash forecasts demonstrate adequate available financial resources after sensitivities. The longer term position is also considered in the University’s five year plan.
All of the University’s external funding is long-term in nature with all repayable beyond 5 years. No material uncertainties that cast significant doubt about the ability of the University to continue as a going concern for the foreseeable future have been identified by the Board of Governors.
Reviews of our financial sustainability going forward are on-going. It is therefore considered appropriate for the University to adopt the going concern basis. Any concerns identified will be brought to the attention of the Board of Governors immediately.

22 FINANCIAL STATEMENTS
The University of Manchester is an independent corporation which came into existence on 1 October 2004. It was established by Royal Charter on the dissolution of the Victoria University of Manchester and the University of Manchester Institute of Science and Technology (UMIST), both of whose rights, properties, assets and obligations were transferred to the institution by means of the University of Manchester Act (2004). This Corporate Governance Statement relates to the financial year ended 31 July 2019 and is current until the date of approval of the audited financial statements.
As a recipient of substantial public funding and by virtue of its educational objectives, it is considered an exempt charity under Schedule 2 of the Charities Act 1993, with the Office for Students (OfS) acting as its Principal Regulator.
The University of Manchester has a duty to conduct its affairs in a responsible and transparent way, and to take into account the requirements of its regulators and the Governance Code of Practice published by the Committee of University Chairs (CUC). This includes compliance with the ongoing conditions of registration stipulated by the OfS. The University’s corporate governance arrangements were established in such a way as to meet these responsibilities and continue to comply with provisions in the First and Second Reports of the Committee on Standards in Public Life (the Nolan Principles). The CUC Code was revised and published in December 2014 and the University’s governing body, the Board of Governors, has reviewed its operations against the Code to ensure all relevant provisions are addressed in its governance arrangements. The Code was updated in June 2018 to include further guidance on the composition and operation of Remuneration Committees and the University is compliant with this revised guidance.
In addition, the University corporately, through its arrangements for governance, is committed in a demonstrable way to the principles of academic freedom and equality of opportunity, which are embodied in its Charter and Statutes. In addition and again, as articulated in Charter and Statutes, the University takes reasonably practicable steps to ensure that freedom of speech within the law is secured, and has adopted a Code of Practice on Freedom of Speech to enable this. Details of the University’s corporate governance arrangements are published on the University website: www.manchester.ac.uk/discover/governance. Minutes of Board and Board committee meetings are available through the Governance section of the website.
The University’s Corporate Governance Framework The Charter and Statutes provide for and empower ‘authoritative bodies’ within the University, each of which has a distinct role to play in its structure of governance.
The Board of Governors, is the University’s governing body, and carries the ultimate responsibility for the University’s overall strategic direction and for the management of its finances, property and affairs generally, including the employment arrangements for all staff. It is a specific role of the Board to satisfy itself that work being undertaken on its behalf, whether by committees or by officers, is consistent with corporate objectives and is within the bounds of accepted good practice. The Board meets formally six times in each academic year. In 2018/19, its membership of 25 had a majority of independent, lay members. The Chair of the Board of Governors, Mr Edward M Astle, is appointed by the Board of Governors from within the lay category of the membership and took up his role on 1 September 2016 (Mr Astle’s initial three year term as Chair was extended in 2018/19 for a further two years, i.e. until 31 August 2021). During 2018/19, the Privy Council approved amendments to Statutes and this included a reduction in overall Board size to 23, with a continued majority of independent, lay members. The changes to Board composition include an increase in student representation (from one to two members). As noted at various points in the Statement, students are represented and actively engage with governance processes across the University. The President and Vice-Chancellor, members of the Senate and a member of the Professional Services staff continue to serve on the Board
The Chair of the Board of Governors plays an important role in the governance of the University while working independently of its regular executive management. He is supported by a Deputy Chair, Mr John Stageman. The current members of the Board of Governors are listed on the contents page.
Last year’s corporate governance statement referred to the external, independent review of governance commissioned in 2016/17. The review concluded that the University is effectively governed, that the Board is very well chaired, that members of the Board have an extensive and impressive range of skills and experience and without exception display enthusiastic commitment. Annual internal evaluations of overall Board effectiveness and
individual member contribution are conducted and reported to the final Board meeting of the academic year. In 2018/19, overall evaluation was positive with many areas of strength highlighted and the Board reiterating its commitment to demonstrate and evidence appropriate and constructive challenge.
In 2018/19 implementation of recommendations arising from the external independent review concluded. As noted above, this included Privy Council approval of Statutes as well as Board approval of Ordinances. The Senate is responsible to the Board for the promotion of research and for monitoring standards in teaching. It acts as the University’s principal academic authority and the Board of Governors seeks assurance from Senate that arrangements for institutional academic governance are effective (see below). A large number of the statutory powers reserved to Senate are ‘regulatory’ in nature and control the academic business of the University. The Senate currently has 70 members drawn from five categories of membership. Across categories 1, 2 and 3, a third are designated ex-officio positions and reserved for those with academic management responsibilities centrally and in the faculties, the remaining two-thirds are elected academic members (professorial and non-professorial). Categories 4 and 5 are made up of co-opted and student representatives.
At its meeting in November 2018, the Board of Governors considered a report setting out the basis for its assurances concerning the oversight of the academic experience and the setting and maintenance of standards, as part of the Annual Assurance Return to the OfS. The Board confirmed that on the basis of the information presented and the additional reporting undertaken through the year;
• it had received and discussed a report and accompanying action plan relating to the continuous improvement of the student academic experience and student outcomes. This included evidence from internal periodic review processes, which fully involve students and include embedded external peer or professional review;
• to the best of its knowledge, the methodologies used as a basis to improve the student academic experience and student outcomes were robust and appropriate; and
• the standards of awards for which the University is responsible have been appropriately set and maintained.
Corporate governance statement

23FINANCIAL STATEMENTS
In addition, the Board of Governors receives regular updates on academic governance related matters through both reports from the Senate, specific agenda items and briefings (including, for example updates from each of the three Faculties, engagement with students as part of assurance of the overall student experience and approval of the institutional response to the independent review of the Teaching Excellence and Student Outcomes Framework)
The Board of Governors has an Audit Committee, a Finance Committee, a Remuneration Committee, a Staffing Committee and, jointly with the General Assembly (see later definition), a Nominations Committee, which report directly to it. The Board has also established processes which ensure both that it is kept regularly advised on the strategic and policy elements of estates, human resources and health and safety issues, and that it can act effectively and in an informed way with respect to these matters when it is required to do so. This includes the establishment of Board Working Groups to consider significant, strategic projects; in 2018/19 the Board established the North Campus Working Group to provide governance oversight of the University’s plans to develop its North Campus in conjunction with an investor and developer partner. In the context of institutional governance, the Audit Committee has a particularly important function in expressing opinions and giving assurances to the Board relating to its review of the effectiveness of the University’s arrangements for risk management, control and governance. The risk management element of this role includes the review of the processes which lead to the statement on internal control in the financial statements. The Audit Committee has co-opted independent members with specific expertise to augment existing membership.
The section headed risk management below provides further detail on the role of the Audit Committee in relation to risk oversight and assurance, including regular scrutiny of the institutional Risk Register and Risk Maps, and commissioning of “deep dive” reviews. As part of this process both the Committee and the Board reflect on the key risks facing the University. In 2018/19 this has included focus on a number of internal and external risks. Examples include risk arising from a “No Deal” Brexit, modelling of implications of potential outcomes from the post-18 Education Review led by Philip Augar and review of the Student Lifecycle Project (this will introduce improved processes and procedures across the student life cycle and is one of the biggest change projects the University has undertaken). Work on consideration of composite or cumulative risk, including inter-connected risk and coincidence of multiple risk, as part of overall risk assessment continued in 2018/19.
The Audit Committee will also, whenever appropriate, provide explicit confirmation to the Board that necessary actions have been, or are being taken to remedy any significant failings or weaknesses identified from the review of the effectiveness of internal control. The Committee also receives regular reports on any cases raised under the University’s Public Interest Disclosure procedures, and on the University’s data protection and cyber security work. The Finance Committee is primarily responsible for oversight of the University’s financial strategy its financial viability, and ensuring that requirements of University regulators to maintain financial solvency are met, the preparation of the financial statements, oversight of the University’s subsidiary companies (and relevant matters relating to associates and jointly controlled entities) and the management of capital projects. In support of the Board’s role as trustees of the endowment, the Committee also considers effective management of all University investments and is supported in this role by Investment Sub-Committee. The Finance Committee considers and forwards to the Board the University’s long-term financial plans, recommendations concerning borrowing, University budgets, and the financial plans and forecasts provided to regulators.
The Nominations Committee, recognises the continuing need to refresh membership of both the Board of Governors and the General Assembly. The Committee endeavours to ensure a broad and complementary range of skills, expertise and experience across categories of lay membership reflecting the needs and aspirations of the University and thus ensuring good and effective institutional governance. The Committee also endeavours to ensure that lay membership of both the Board of Governors and the General Assembly is representative of the diversity of the University and of the communities served by it. Robust recruitment and appointment processes ensure that the Board is comprised of fit and proper persons. The Committee welcomes the expectations concerning equality, diversity and inclusion in the CUC Code of Governance and appreciates that board diversity, in particular, promotes more constructive and challenging dialogue. The composition of the Committee will change with effect from 2019/20 as a result of approved amendments to Statutes. The Committee will now be chaired by the Chair of the Board and have increased representation from lay Board members, whilst retaining some lay General Assembly membership.
The Remuneration Committee provides a comprehensive report of its activity to the Board of Governors in July of each year. This provides information on its role, remit, and its working methods as well as a summary of the decisions it has taken and the conclusions of the salary review undertaken for senior staff. In
addition, the Board of Governors reviews and approves annually the remuneration framework within which the Committee operates. The Remuneration Committee report for the year ended 31 July 2019 is on page 26.
The University is aware of the need to balance the challenging financial climate, the external perception of senior salaries and the University’s ability to pay, with the need to recognise the contribution and performance of individuals and retain its best staff, and this informed the Committee’s decision making over 2018/19. The University’s approach to the requirements of the Office for Students Accounts Direction and the CUC Higher Education Senior Staff Remuneration Code is set out on the report from the Remuneration Committee referred to above.
The Staffing Committee is established by the Board under Statute and Ordinance to give full and proper consideration to any proposals notified to it to dismiss members of academic and academic-related staff on grounds of redundancy. For each instance, appropriate information is provided to the Committee to allow it to reach a reasoned assessment of the proposal and to consider alternative strategies for the resolution of the circumstances leading to the proposal. Its recommendations are then passed to the full Board of Governors for approval.
The Planning and Resources Committee (PRC), which is chaired by the President and Vice-Chancellor and includes in its membership the Vice-Presidents, the Registrar, Secretary and Chief Operating Officer, and the Director of Finance, with representation from Senate, Heads of Services and the Students’ Union, is the key central management committee. PRC serves as the primary source of advice to the Board of Governors on matters relating to the development and allocation of the University’s resources, on strategic planning issues and operational priorities, and on the financial, educational, research and social responsibility performance of the University against agreed goals and targets. Additionally, in consultation with other relevant committees, it develops, for approval by the Board, the University’s annual planning, budgeting, performance evaluation and accountability cycle, annual revisions of the University’s Strategic Plan and an annual University Budget.
The Safety, Health and Environment Committee (SHE), is the University’s principal committee responsible for the management of Health and Safety, and environmental and sustainability considerations. Key issues arising from its work are considered regularly by the Board of Governors.
The General Assembly is the interface between the University and the wider community. It

24 FINANCIAL STATEMENTS
is currently a much larger body (over 200 members) than the Board, and in common with it, has a majority of lay members. Lay members are drawn from a wide range of local, regional and national interests, and together they offer the University a wealth of experience and expertise from differing perspectives. The main purpose of the General Assembly is to act as a two-way channel of communication through which the University presents its achievements to its broader ‘constituencies’ and receives feedback and advice on matters relating to University business. It also includes University staff, alumni and students within its membership. Following consideration of recommendations arising from the external review of governance referred to above and consultation with the Board and General Assembly, the membership of General Assembly will be reduced over the course of the next few years. In moving towards a smaller (between 80 and 100 members), more streamlined and less prescriptive membership, General Assembly’s role in supporting the University’s mission as a civic university will be strengthened.
The Alumni Association is the body of the University’s graduates, and promotes fellowship among graduates while helping them to keep in touch with the University by providing opportunities to take an interest in its development and ongoing activities. General Meetings of the Association are held regularly, with its business between General Meetings conducted by an elected committee. The Association is represented on the governing body and on the General Assembly.
The members of the General Assembly and the Alumni Association, together with all members of paid University staff eligible to hold superannuable appointments, form the constituency for the election of the Chancellor, who is the ceremonial Head of the University, presiding over meetings of the General Assembly and over congregations of the University for the conferment of degrees. The role is currently held by Mr Lemn Sissay, MBE, who took up the role in August 2015.
The President and Vice-Chancellor (Professor Dame Nancy Rothwell) is the chief executive officer and the principal academic and administrative officer of the University. In fulfilling these functions the President and Vice-Chancellor has overall responsibility for the executive management of the University and for its day-to-day direction, being accountable to the Board of Governors for the exercise of these responsibilities and (as the designated ‘accountable officer’) to the Office for Students for the use of the public funds the University receives. As the chief executive officer of the University, the President and Vice-Chancellor exercises primary influence on the development of institutional policy and strategy, the identification and planning of new
developments and in shaping its institutional ethos. The Deputy President and Deputy Vice-Chancellor (Professor Luke Georghiou), the Vice-Presidents, the Registrar, Secretary and Chief Operating Officer (Mr Patrick Hackett) and the senior administrative officers contribute in various ways to this work, collectively acting as the University’s Senior Leadership Team, but the ultimate executive responsibility rests with the President and Vice-Chancellor.
The role of the University’s Professional Services (PS) is to work in partnership with academic colleagues to deliver the primary institutional objectives (teaching and the student experience, research, and social responsibility), to oversee the discharge of the University’s statutory and regulatory responsibilities and to implement the policy decisions of Senate and the Board. Through the provision of specialist expertise, it also contributes to and advises on the formulation of University policy. The Head of the unitary Professional Services is the Registrar, Secretary and Chief Operating Officer, who is also clerk to the governing body and responsible for the provision of secretariat support to the governing body, its committees, the General Assembly and Senate.
The University maintains a Register of Interests of members of the Board of Governors and for members of the Senior Leadership Team, which may be consulted by arrangement with the Registrar, Secretary and Chief Operating Officer. Schools and Directorates also maintain registers of interest for their staff. Members of the Board and of its Committees receive a reminder in the papers for each meeting of the need to declare any interest they may have in relation to the specific business to be transacted. In addition, and building on existing internal and external regulation and guidance, the Board adopted its current Conflicts of Interests Policy in 2017/18.
Statement of Internal ControlThis Statement of Internal Control relates to the financial year ended 31 July 2019 and is current until the date of approval of the audited financial statements.
The duties conferred upon the Board of Governors by the University’s Charter and Statutes require it to institute and maintain a sound system of internal control. This is designed to support the achievement by the University of its aims and objectives and, at the same time, safeguard public and other funds and assets for which the University is responsible. In that context, the Board is satisfied that the University complies with those provisions of the CUC Guide on the financial aspects of corporate governance which are applicable in a higher education institution and recently published OfS advice
on requirements for corporate governance and internal control. The Audit Committee acts, on behalf of the Board, in providing oversight of the University’s review and monitoring of the system of internal control. The Board receives regular reports, at each meeting, from the Audit Committee on the steps being taken to manage risks across the University. The Audit Committee also receives regular reports from the internal auditors (the Universities Internal Audit Consortium, Uniac), which include the internal auditors’ independent opinion on the adequacy and effectiveness of the University’s system of internal control, together with any recommendations for improvement. As set out below, the University’s approach is risk based, enabling evaluation of the likelihood and impact of risks being realised. Specific risks considered by the Audit Committee in the period covered by this Corporate Governance Statement and Statement of Internal Control are highlighted in the section above relating to the work of the Audit Committee. The external and internal auditors have not identified any significant areas of weakness or significant deficiencies in internal control during the course of their audit work for the year ended 31 July 2019.
The Board of Governors, both directly and through its Finance and Audit Committees, is responsible for financial control, i.e. ensuring the economical, efficient and effective management of the University resources and expenditure, and for safeguarding its assets, including specific responsibility for the oversight of systems that prevent and detect fraud, bribery and other irregularities. It must ensure that the University uses public funds only for the purposes for which they were provided. It is supported in this work through the external auditors, Ernst & Young LLP (EY), and the University’s internal auditors, Uniac, the work of both being overseen by the Audit Committee.
The system of internal financial control provides for comprehensive financial planning processes, assessments of annual income, expenditure, capital and cash flow budgets in conjunction with the monthly review of financial results, the reporting of variances and the projection of out-turns.
The University sets out matters concerning the broad policies relating to financial control in its Financial Regulations. The Regulations are approved by the Board and apply to the University and all its related undertakings, and include all funds passing through University accounts. They encompass the University’s processes to investigate fraud, bribery and other financial irregularities, budgeting and forecasting, the treatment of year-end balances and capital expenditure programmes and general issues with regard to the accounts and accounting returns of the University.
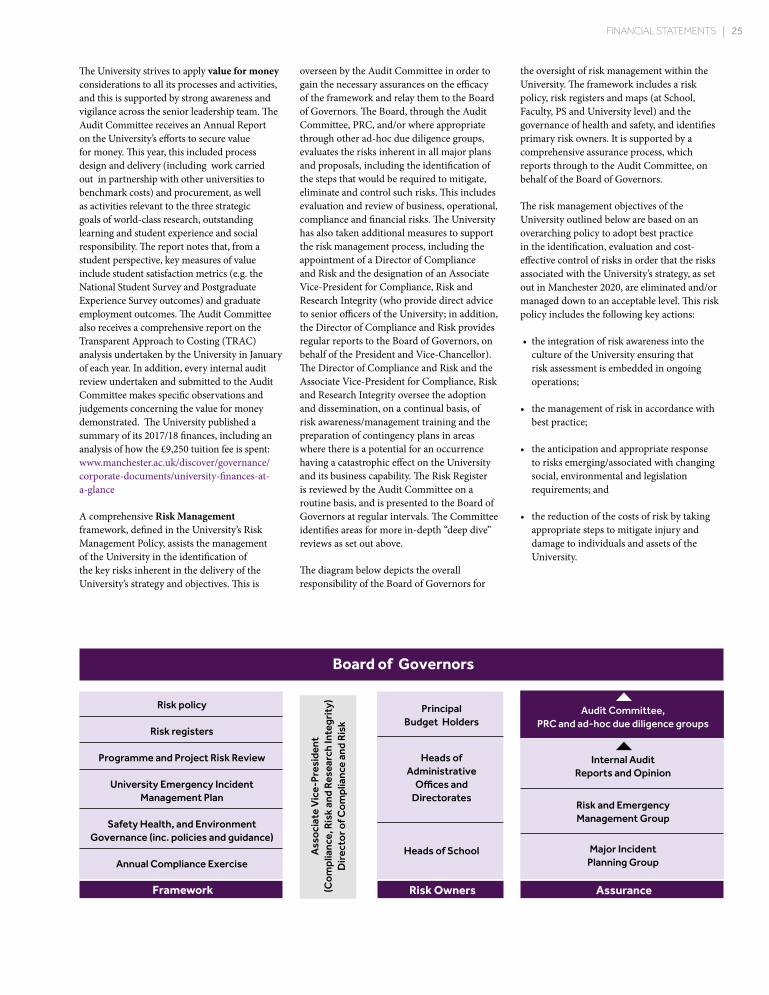
25FINANCIAL STATEMENTS
The University strives to apply value for money considerations to all its processes and activities, and this is supported by strong awareness and vigilance across the senior leadership team. The Audit Committee receives an Annual Report on the University’s efforts to secure value for money. This year, this included process design and delivery (including work carried out in partnership with other universities to benchmark costs) and procurement, as well as activities relevant to the three strategic goals of world-class research, outstanding learning and student experience and social responsibility. The report notes that, from a student perspective, key measures of value include student satisfaction metrics (e.g. the National Student Survey and Postgraduate Experience Survey outcomes) and graduate employment outcomes. The Audit Committee also receives a comprehensive report on the Transparent Approach to Costing (TRAC) analysis undertaken by the University in January of each year. In addition, every internal audit review undertaken and submitted to the Audit Committee makes specific observations and judgements concerning the value for money demonstrated. The University published a summary of its 2017/18 finances, including an analysis of how the £9,250 tuition fee is spent: www.manchester.ac.uk/discover/governance/corporate-documents/university-finances-at-a-glance
A comprehensive Risk Management framework, defined in the University’s Risk Management Policy, assists the management of the University in the identification of the key risks inherent in the delivery of the University’s strategy and objectives. This is
overseen by the Audit Committee in order to gain the necessary assurances on the efficacy of the framework and relay them to the Board of Governors. The Board, through the Audit Committee, PRC, and/or where appropriate through other ad-hoc due diligence groups, evaluates the risks inherent in all major plans and proposals, including the identification of the steps that would be required to mitigate, eliminate and control such risks. This includes evaluation and review of business, operational, compliance and financial risks. The University has also taken additional measures to support the risk management process, including the appointment of a Director of Compliance and Risk and the designation of an Associate Vice-President for Compliance, Risk and Research Integrity (who provide direct advice to senior officers of the University; in addition, the Director of Compliance and Risk provides regular reports to the Board of Governors, on behalf of the President and Vice-Chancellor). The Director of Compliance and Risk and the Associate Vice-President for Compliance, Risk and Research Integrity oversee the adoption and dissemination, on a continual basis, of risk awareness/management training and the preparation of contingency plans in areas where there is a potential for an occurrence having a catastrophic effect on the University and its business capability. The Risk Register is reviewed by the Audit Committee on a routine basis, and is presented to the Board of Governors at regular intervals. The Committee identifies areas for more in-depth “deep dive” reviews as set out above.
The diagram below depicts the overall responsibility of the Board of Governors for
the oversight of risk management within the University. The framework includes a risk policy, risk registers and maps (at School, Faculty, PS and University level) and the governance of health and safety, and identifies primary risk owners. It is supported by a comprehensive assurance process, which reports through to the Audit Committee, on behalf of the Board of Governors.
The risk management objectives of the University outlined below are based on an overarching policy to adopt best practice in the identification, evaluation and cost-effective control of risks in order that the risks associated with the University’s strategy, as set out in Manchester 2020, are eliminated and/or managed down to an acceptable level. This risk policy includes the following key actions:
• the integration of risk awareness into the culture of the University ensuring that risk assessment is embedded in ongoing operations;
• the management of risk in accordance with best practice;
• the anticipation and appropriate response to risks emerging/associated with changing social, environmental and legislation requirements; and
• the reduction of the costs of risk by taking appropriate steps to mitigate injury and damage to individuals and assets of the University.
Board of Governors
Risk policy
Risk registers
Programme and Project Risk Review
University Emergency Incident Management Plan
Safety Health, and Environment Governance (inc. policies and guidance)
Annual Compliance Exercise
Framework
Ass
ocia
te V
ice-
Pres
iden
t (C
ompl
ianc
e, R
isk
and
Rese
arch
Inte
grit
y)
Dir
ecto
r of C
ompl
ianc
e an
d R
isk
Principal
Budget Holders
Heads of Administrative
Offices and Directorates
Heads of School
Risk Owners
Audit Committee,
PRC and ad-hoc due diligence groups
Internal Audit Reports and Opinion
Risk and Emergency Management Group
Major Incident Planning Group
Assurance

26 FINANCIAL STATEMENTS
This report covers the following topics:
• The responsibilities of the Remuneration Committee.
• The remuneration policies that the Committee operates for the Senior Leadership Team and other Senior Managers.
The Committee’s principal matters of business are:
(i) To consider and determine on behalf of the Board of Governors the remuneration arrangements for certain senior officers of the University (including the President and Vice Chancellor, the Registrar, Secretary and Chief Operating Officer, Vice-Presidents and Deans, and Vice-Presidents).
(ii) To delegate to an appropriately constituted Senior Salaries Review Group (or Groups) the task of making recommendations on the remuneration of professorial and equivalent senior administrative staff not covered in ‘1’ above and to scrutinise such recommendations as appropriate for consistency and fairness.
(iii) To consider policies and procedures on the remuneration of senior staff, to recommend them to the Board of Governors and to oversee their implementation within the University.
(iv) To provide assurance to the Board of Governors that the University is adhering to guidance on senior pay as directed by the Office for Students and the Committee of University Chairs Higher Education Senior Staff Remuneration Code.
The Director of Human Resources is adviser to the Committee which can, if it wishes, call upon external advisers as appropriate.
This report provides a summary of the Committee’s work over the year and fully meets the requirements of the Committee of University Chairs (CUC) Higher Education Senior Staff Remuneration Code. The University will follow the regulatory guidance on preparing and publishing financial statements as provided by the Office for Students (OfS) in June 2018 on the disclosure of senior pay in its published accounts.
Remuneration Committee report for the year to 31 July 2019
Role and remitThe role and remit was reviewed and considered to remain relevant and would be reviewed again in November 2019.
To assist it in these tasks, the Committee received:
• Information on the President and Vice-Chancellor’s salary;
• performance report and recommendations for salary increases from the President and Vice-Chancellor in relation to the Deputy President and Deputy Vice-Chancellor; the Vice-Presidents and Deans; the Policy Vice-Presidents and the Registrar, Secretary and Chief Operating Officer;
• a summary report from the University’s Senior Salary Review Group covering proposals for salary awards to be applied to academic related Grade 9 staff;
• a report from the Director of Human Resources on national pay trends as background data;
• a summary report of the annual salary review for non-clinical professors ;
• a copy of the University’s Gender Pay Gap Report and Ethnicity Pay Gap Report;
• Forward annual plan.
Key decisions taken in 2018/19The University is aware of the need to balance the challenging financial climate, the external perception of senior salaries and the University’s ability to pay with the need to
recognise the contribution and performance of individuals and retain its best staff.
The University is seeking to create financial headroom to invest in staff, students and facilities. This is a significant challenge in the light of the increased financial, political and sector uncertainty and financial challenge. These uncertainties include greater global competition, the Augar Report, reductions in public funding, exchange rate fluctuations, a potential decline in student numbers and research income, the impact of TEF, Brexit and further increases in costs arising from pensions and inflation. These financial pressures are likely to impact on what the University can afford and sustain. This needs to be taken into account when presenting proposals for salary increases, ensuring they are justified through a clearly presented business case.
Against this background, the University increased salaries across the workforce as a whole by 2.0 % (the nationally agreed pay award effective from 1st August 2018) and by an average of a further 1.5% to account for 1.7% incremental progression i.e. a total of 3.2%. The Committee approved the recommended increase of 1.7% in total salary costs for the Senior Leadership Team. This included the salaries of the President and Vice-Chancellor and her direct reports.
(Note: The pay awards to this group of senior staff are effective from 1 April whilst the national pay award is effective from 1 August. Therefore the value of the pot is based on the national pay award likely to be effective in August 2019).
Membership of the Committee
Mr Gary Buxton (Chair) Mr Edward AstleMr Colin GillespieDr John Stageman (ex officio, as Chair of the Finance Committee) Ms Alice Webb
Secretary to the Committee: Registrar, Secretary and Chief Operating Officer (except in relation to matters affecting the remuneration for the Senior Leadership Team)
In attendance: The Director of Human Resources The President and Vice-Chancellor (not present at the separate meeting to determine her salary)
The President and Vice-Chancellor ceased to be a member of the Remuneration Committee in March 2018 as a result of a decision taken by the Board of Governors in March 2018 and with the full support of the President and Vice-Chancellor.

27FINANCIAL STATEMENTS
Element How element supports our strategy
Operation Maximum potential value Performance conditions and assessment
Elements of Remuneration for the Senior Leadership TeamThe table below shows the elements of remuneration for the Senior Leadership Team, the reasons for their inclusion and the way they operate.
Base salary
Supports the recruitment and retention of Senior Leaders with the experience and skills required to deliver the University’s strategic plan.
Salary increases whether consolidated or non-consolidated provide an opportunity to recognise outstanding individual contributions by Senior Leaders.
Base salary, paid monthly, reflects the size of the role (based on Hay evaluation) and its responsibilities, individual performance assessed annually and the skills and experience of the individual.
Increases to the President and Vice-Chancellor’s base salary are approved by the Remuneration Committee.
For all other members of the Senior Leadership Team except the Directors of HR and Finance, recommendations for base pay increases are made by the President and Vice-Chancellor and approved by the Remuneration Committee. Increases are effective from 1 April.
The Registrar, Secretary and Chief Operating Officer makes recommendations to the Senior Salaries Review Group (SSRG) for the Directors of HR and Finance. Subsequently reported to and approved by the Remuneration Committee. A national pay increase is effective from 1 August and any other performance increase is effective from 1 October.
Base pay increases can be either consolidated (a permanent increase to base salary which is pensionable) or non-consolidated. Non-consolidated increases are not pensionable and are paid as a lump sum shortly after they are awarded.
Increases to base salary are determined annually taking into account:
• Individual performance
• The scope of the role
• Pay levels in comparable organisations
• The levels of base salary increases for the staff of the University generally
• The financial position of the University and the available budget for increases
• Any retention issues
In benchmarking base salaries the Committee considers two comparator points being:
• The Upper Decile of the results of the UCEA Salary Survey across all Institutions;
• The median of the Industrial and Service Sector with a range of 80%-120%.
The Upper Decile of the Russell Group is considered appropriate on the basis that the University is one of the largest and most complex institutions with an ambitious agenda.
An individual’s skills and experience in the role is one of the factors considered when setting base salary levels.
Outstanding individual contributions are, from time to time, recognised through increases to base salary. In particular this may be through the award of a non-consolidated increase to base salary.
Senior Leadership Team (2018/19)
Name Role
Professor Dame Nancy J Rothwell President and Vice-ChancellorProfessor Luke Georghiou Deputy President and Deputy Vice-ChancellorMr Patrick Hackett Registrar, Secretary and Chief Operating OfficerProfessor Graham Lord Vice-President and Dean of Biology, Medicine and HealthProfessor Keith Brown Vice-President and Dean of HumanitiesProfessor Martin Schröder Vice-President and Dean of Science and EngineeringProfessor Colette Fagan Vice-President for ResearchProfessor James Thompson Vice-President for Social ResponsibilityProfessor Clive Agnew Vice-President for Teaching, Learning and Students
Recommendations for the Director of Human Resources and the Director of Finance are made via the Senior Salaries Review Group (SSRG) and reported to and approved by the Remuneration Committee.
Remuneration policy for the Senior Leadership Team (2018/19) The Remuneration Committee is directly responsible for setting the renumeration of the Senior Leadership Team reporting directly to the Presient and Vice-Chancellor.

28 FINANCIAL STATEMENTS
Elements of Remuneration for the Senior Leadership Team (continued)
Element How element supports our strategy
Operation Maximum potential value Performance conditions and assessment
Pension
Supports recruitment and retention of Senior Leaders in line with market practice in the University sector.
Provides flexibility for those who have reached HMRC limits for pension saving.
In general, members of the Senior Leadership Team will be members of an appropriate defined benefit pension arrangement. This will usually be the Universities Superannuation Scheme (USS) but may be the NHS Pension Scheme where appropriate.
Where the Senior Leader may be affected by the HMRC limits for pension saving, the University may pay a cash allowance (in line with the contributions the University would have made to the Scheme at no additional cost) in lieu of pension provision. This is dealt with on a case by case basis. Any cash allowance is subject to income tax and NI deductions.
The USS is a hybrid scheme and the NHS Pension Scheme is a defined benefit scheme and the cost to the University of providing the benefits varies depending on the actuarial position of the Scheme.
The University currently contributes 19.5% of base salary to USS (inclusive of 2.1% deficit payment) and 14.3% of base salary to the NHS Pension Scheme.
None applicable.
Benefits
To attract and retain Senior Leaders by providing benefits in line with market practice in the University sector.
A small range of benefits is available including life cover (which is automatic as it is linked to the pension scheme) and sick pay (six months full pay and six months half pay) in line with all employees.
The President and Vice-Chancellor receives private medical insurance.
The University bears the cost of providing benefits.
None applicable.
Additional justification for the President and Vice-Chancellor’s remunerationThe Chair of the Board of Governors undertakes the President and Vice-Chancellor’s annual performance and development review. The overall conclusion was that the President and Vice-Chancellor continues to do an outstanding job, met the vast majority of her objectives and targets, and therefore, as a minimum, should receive a cost of living increase. However, the President and Vice-Chancellor continues to assert that she does not wish to receive any pay increase as per the previous years. The Committee noted that the President and Vice-Chancellor is not highly paid in comparison to her counterparts (who in some cases also receive bonus payments) and acknowledged that she is leading a complex and large institution. The Committee recognises that the market rate would be significantly higher than her current package. However, the Committee supported the President and Vice-Chancellor’s personal view and wished to record that in any other circumstances she would be awarded a pay increase.
The President and Vice-Chancellor is not in receipt of a bonus payment and therefore there is no requirement to undertake an analysis against any defined objectives linked to a bonus payment.

29FINANCIAL STATEMENTS
Remuneration for other employeesAll employees of the University receive a base salary, benefits consistent with those available to the Senior Leadership Team, and are eligible to participate in the University’s pension arrangements.
The base salary levels for the Senior Leadership Team reflect their position as some of the most senior employees of the University and are therefore higher than most staff of the University.
In addition to receiving the annual cost of living award, Grade 9 academic related staff ’s salaries are reviewed in October against performance and contribution. Any increase takes into account the level of the annual cost of living award and the University’s ability to pay, together with any market/retention issues. Such awards can either be consolidated and therefore pensionable or non-consolidated and non-pensionable. Grade 1-8 staff receive an annual cost of living award and are eligible for incremental progression. In addition they may be nominated once a year for an award under the University’s Recognising
Exceptional Performance policy. Awards can be non-consolidated or a further incremental point. The size of the pot to be distributed is 1.5% of the total base salaries of the academic related grade 9 cohort which is the budgeted amount for incremental progression in grades 1-8. In fact increases of only 1.13% was awarded.
The University uses the Higher Education Role Evaluation (HERA) model to evaluate roles in grades 1 to 8. This translates into a 51 point pay spine with identified grade boundaries defining the minimum and maximum salary for each grade and the incremental progression points. The average salary across all staffing groups
(academic and PSS) is £41,546 per annum (this excludes on costs) and the President and Vice-Chancellors salary is £260,399 per annum. The President and Vice-Chancellor’s salary is 15.8 times greater than £16,460 per annum which is the lowest point on the University’s pay spine. The University monitors any increase in the minimum wage level proposed by the Living Wage Foundation, as an accredited member, and will adjust relevant salary points on its 51 point pay spine to meet the minimum proposed.
The median salary for the last five years set against the President and Vice-Chancellor’s salary is shown in the table below:
Median salary
Year Median Salary President and Vice-Chancellor’s Base Salary £ Ratio
18/19 £36,261 £260,399 1 : 7.2 17/18 £35,721 £260,399 1 : 7.3 16/17 £34,956 £260,399 1 : 7.5 15/16 £34,576 £260,399 1 : 7.5 14/15 £34,232 £256,399 1 : 7.5
Approach to recruitment remuneration
Overall, the University aims to recruit Senior Leaders using remuneration packages that are market-competitive and consistent with the existing remuneration structure. In doing so, the University seeks to pay no more than necessary to attract talented individuals to join the University.
Newly recruited Senior Leaders are eligible to receive the same remuneration elements as existing Senior Leaders as set out in the policy table above, namely:
• Salary – set at an appropriate level taking into account the experience and quality of the candidate
• Pension
The University does not expect to make special recruitment arrangements outside the standard policy, but may do so in exceptional circumstances in order to secure the appointment of the right candidate. All salaries at or above £120,000 must be approved by the President and Vice-Chancellor who may consult with the Chair of the Remuneration Committee.
Senior Leaders’ service contracts and notice periods
The service contracts and notice periods of the Senior Leadership Team are as follows:
Role Terms Names
President and Vice-Chancellor Employed on a seven year fixed term contract which is Professor Dame Nancy Rothwell renewable and is subject to six month notice period. Also holds a contract as Professor of Physiology which is retained when leaves office.
Deputy President Employed on a five year fixed term contract which is renewable Professor Luke Georghiou and Deputy Vice-Chancellor and is subject to a three month notice period. On completion remain employed as a Professor.
Vice-Presidents and Deans Appointed usually for a fixed five year term of office which is Professor Keith Brown renewable and on completion remain employed as professors Professor Graham Lord by the University but return to previous role. Professor Martin Schröder Subject to three month notice periods.
Vice-Presidents Appointed on a fixed five year contracts. Generally subject Professor Clive Agnew to a three month notice period. On completion remain Professor Colette Fagan employed as a professor. Professor James Thompson
Registrar, Secretary Employed on a permanent contract and subject to a three Mr Patrick Hackett and Chief Operating Officer month notice period.

30 FINANCIAL STATEMENTS
Policy on termination paymentsFor the academic roles it is usual for the individual to return to their previous role as a Professor when they complete their term as a member of the Senior Leadership Team. In such cases, their base salary is reviewed at that time and may be adjusted where necessary to reflect their ongoing responsibilities. No additional payments are made in respect of stepping down from the Senior Leadership Team.
The University’s overarching aim is to treat departing Senior Leaders fairly, taking into account the circumstances of their departure, but always taking care to ensure that the interests of the University are considered and that there are no rewards for failure.
Senior Leaders are entitled to be paid their Base Salary and contractual benefits (including pension contributions) during the notice period and none have been made during the year. The University has the discretion to pay these as a lump sum benefit in lieu of notice.
In general, no additional payments are made to compensate Senior Leaders when their employment terminates. If in exceptional circumstances a settlement agreement is needed the Committee may make payments it considers reasonable in settlement of potential legal claims (e.g. unfair dismissal). It may include in such payments reasonable reimbursements of legal fees in connection with such agreements (the normal maximum for legal fees for senior managers is £750 + VAT).
Consideration of conditions elsewhere in the UniversityThe Committee is responsible for approving the remuneration of the Senior Leadership Team and approves the base salaries recommended by the Senior Salaries Review Group for professorial staff in Zones B and A (the top two professorial zones) and Grade 9 academic related staff. When considering base salary increases for senior staff, the Committee takes careful account of the level of salary increases across the University in general, and the financial position of the University including the budget available for such increases.
History of President and Vice-Chancellor’s remuneration
This table shows the remuneration of the President and Vice-Chancellor over the last five years.
Year Remuneration (ending July)
2019 £260,399
2018 £260,399
2017 £260,399
2016 £260,399 (plus £12,128 supplement in lieu of pension from 1 April to 31 July)
2015 £256,399 (plus pension)
(Note: From 1 April 2016 the President and Vice–Chancellor was in receipt of a supplement in lieu of the employer pension contribution (shown in the table above.) The 2.1% deficit funding into USS and any additional national insurance contribution is deducted from the amount shown. From 1 September 2017 the President and Vice-Chancellor elected not to receive the pension supplement.)
Statement of implementation of Remuneration Policy in 2019/20The Committee intends that remuneration arrangements for 2019/20 will be operated in line with the policy set out above as directed by the Board of Governors and in line with the requirements of the Office for Students and the CUC Code for Higher Education Senior Staff.

31FINANCIAL STATEMENTS
This statement is made in accordance with section 54(1) of the Modern Slavery Act 2015 and constitutes our slavery and human trafficking statement for the financial year ending 31st July 2019. This is our fourth statement under the Act and provides an overview of our activities in this area.
We are a UK Higher Education Institution which provides a wide range of teaching, research and related activities. We were founded, and remain based, in Manchester but are a global institution. We have 40,140 students registered on courses in the UK and across the world. We are one of the largest employers in Greater Manchester with 12,695 staff and an annual income of more than £1 billion.
More information about us and our activities is available here: www.manchester.ac.uk
Our approach around the issue of modern slavery supports our institutional goals and commitments to social responsibility; this provides a clear focus in this area:
• Our starting point is a zero tolerance approach to modern slavery and human trafficking and our internal policies and processes support this;
• Understanding our diverse supply base and the wider supply chain on which we rely through supplier engagement;
• Taking an informed risk based approach to prioritise what we do and target our actions;
• Promoting awareness and openness of the issue by sharing our experiences, collaborating within and outside the HE sector, and by taking opportunities to train our colleagues, students, suppliers, and others.
Our Policies and Processes
There is a clear chain of accountability for modern slavery; overall responsibility rests with our Board of Governors who have devolved day-to day responsibility for implementing and monitoring the University’s approach to the Director of Finance.
We expect all of our business operations, interactions and transactions to be carried out ethically and with integrity; we are clear with regard to our zero-tolerance approach to modern slavery. We are committed to working with our suppliers to ensure that there is no modern slavery or human trafficking in our supply chains or in any part of our business.
Our policies and procedures support this approach:
• As part of this commitment we have had an Anti-Slavery and Human Trafficking Policy in place since 2016: http://documents.manchester.ac.uk/list.aspx
• Annually we review our standard terms and conditions of business; they require legal compliance with the Modern Slavery Act 2015 and also that our suppliers work with us in tackling modern slavery throughout our shared supply chains.
• Revision of our procurement documentation and processes is on-going to ensure that they continue to reflect best practice and support our objectives in this area.
We believe that transparency is essential, in driving up standards and highlighting all forms of human rights issues within supply chains, and we expect the same from our contractors, suppliers, business partners, and their supply chains. We signed up to the TISC Report (https://tiscreport.org/) the world’s largest open data repository of Modern Slavery and Human Trafficking Statements, in 2017. Following the resolution of technical issues, highlighted last year, our statements are again visible through this portal.
During the year we published details of how we are addressing the UN Sustainable Development Goals (SDGs) across all of our activities: research impact, learning and students, public engagement activity and responsible campus operations. Reinforcing our commitment to transparency, SDG 8: Decent Work and Economic Growth, provides additional focus for our activities to promote zero tolerance of forced labour, modern slavery and human trafficking as well as protecting labour rights and working practices more generally across our supply chains. More information can be found here: www.socialresponsibility.manchester.ac.uk/about/impact/sdgs
Over the coming year we will undertake a full, independent review of our policy, procedures and processes to ensure that they are appropriate and effective in responding to modern slavery. We will review our procurement activities in line with the SDGs to enhance transparency and coherent reporting.
Understanding and Engaging with Our Supply Chains
We have a large and complex supply chain to support our academic activities and campus operations. We purchase a very diverse range of works, goods and services and have in excess of 8,000 active suppliers listed on our Finance System. They provide us with items and services across almost every category of spend from apples to x-ray machines. Regardless of what we buy we are committed to acquiring it in a responsible manner.
Understanding our suppliers and their supply chains is a core component of our approach. During the year we have continued to use our on-line assessment tool to engage directly with all of our suppliers to identify their awareness of modern slavery and human trafficking. Each and every supplier is encouraged to share with us details of the impacts arising from their business activities, including slavery within their supply chains. This provides an opportunity for them to tell us how they are addressing these issues. To date over 1,800 suppliers have completed this information. The responses confirm that there remains a nervousness amongst suppliers over this issue but also provides evidence of positive supply chain practices that we can recognise, encourage and support. A snapshot of this data is provided on the accompanying graphic.
We have continued to work to map supply chains in high risk areas in conjunction with our contracted suppliers. Learning from previous experience we have tightened the focus of these exercises though they are still challenging to undertake. We hope to be able to publish some details of our work over the coming year.
In May 2019 as part of our commitment to support suppliers we hosted another event to raise awareness of slavery and trafficking within supply chains. We held this in collaboration with colleagues from The University Caterers Organisation (TUCO), and invited attendees from nationally contracted catering providers. The session was well attended with presentations from the University, TUCO, Programme Challenger, as well as a leading lawyer and a supplier. Opportunities to network and share experiences followed the presentations and feedback was very positive. We will look to hold similar sessions in the future.
Modern slavery and human trafficking statement

32 FINANCIAL STATEMENTS
A Risk Based Approach
We manage our suppliers using a category management model so that we can understand and manage risks within specific categories. Our high level supply chain risk is assessed using the UN Marrakech approach which provides a sound basis to focus our resources and actions. Effort is concentrated on categories and commodities that score highly on this and suppliers in the following areas (if not already captured) which have been highlighted elsewhere as being high-risk: agriculture, hospitality, construction, and staff agencies. Using this approach means we can target our limited resources to understand and promote best practice throughout all tiers of our supply chains.
We have reviewed and updated our on-line resources this year to provide more help and guidance for our suppliers. Building on our previous work, in conjunction with academic colleagues, we have re-drafted guidance for SMEs to assist them in addressing modern slavery within the context of their own businesses. We showcased this at a regional event, and are aware that some of our contracted suppliers are cascading this guidance down their own supply chains.
We continue to make use of a number of external standards and agencies to provide assurance on labour practices for applicable products and processes. We have maintained Fairtrade status since 2005 and affiliated with the Worker Rights Consortium in 2015.
This year has seen two significant developments in this area:
• In March 2019 we were officially accredited with the Living Wage Foundation (LWF). This is a positive step in demonstrating good labour practice. Whilst we have long paid our own staff more than the minimum hourly rate recommended by the LWF we are now able to use this national forum to promote and encourage good employment practices amongst our supply chain partners.
• In June 2019 we became the first higher education institution to join Slave Free Alliance, part of Hope for Justice, a Manchester-based charity. It exists to bring an end to modern slavery by preventing exploitation, rescuing victims, restoring lives and reforming society. By joining Slave Free Alliance the University has joined a global movement, demonstrating commitment to raising awareness of modern slavery and working to promote a zero tolerance approach to the practice in our supply chains. We will be working closely with Slave Free Alliance over the coming months to review our progress to date and to seek opportunities to engage and educate our staff and students.
These memberships and affiliations provide independent sureties on supply chain practice, and we continue to monitor the suitability of external validation in other areas as well.
We are, for example, currently investigating membership of Electronics Watch (EW). EW exists to assist public sector organisations to monitor rights of workers in the electronics industry. For a number of years most of our expenditure on IT equipment has been through bespoke sector frameworks let by the London Universities Purchasing Consortium (LUPC) which was a founder member of EW but individual membership would reinforce our commitments in a high risk area.
As a user of a variety of external framework contracts we continue to work closely with two locally based procurement consortia: the North West Universities Purchasing Consortium (NWUPC) and TUCO, to manage risks through contract management processes. As reported last year both consortia have incorporated a visual inspection, providing assurance around working practices to include any signs of slavery, as part of their supplier site visits. Over the course of the year the NWUPC have attended 4 supplier premises and TUCO have undertaken 19 visits; no issues or concerns have been reported.
Promoting Awareness and Training
Raising staff awareness of the problem of modern slavery remains a priority. Our staff engagement programme has been reviewed and refreshed during the year and the module on responsible procurement has been revised. Amongst changes are the inclusion of a link to a video from the Gangmasters and Labour Abuse Authority (GLAA) and access to updated guidance on our Central Procurement Office (CPO) webpages related to slavery and human trafficking. Evidence shows that our staff continue to actively engage with the content that the programme provides. This is confirmed by analysis of the traffic on our CPO webpages; these have seen an increase in the number of visits over the year and also an increase in the average length of time spent viewing the information they contain.
We have continued collaboration between our academic research and our professional activities in the sphere of modern slavery, human trafficking and broader human rights issues within supply chains. Our CPO benefitted from an internship from a PhD student from the Alliance Manchester Business School (AMBS) who was able to assist in assessing risks and engaging with suppliers across our laboratory and medical spend category. Academic and procurement colleagues are working together on several initiatives and jointly presented to business representatives from across the city at the event
in March detailed below. This highlights the ability of Universities, like ours, to combine cutting edge research with practical application and to build effective networks to share ideas and develop understanding of key issues like slavery and trafficking.
We have continued to engage widely: sharing best practice and keeping up to date on slavery and human trafficking considerations within the supply chain. Within the Higher Education arena our Head of Procurement continues to chair a sector wide Responsible Procurement Group whose remit includes modern slavery. Our procurement team also attended the inaugural meeting of the Universities Against Modern Slavery Alliance (UAMSA) in London in March 2019.
The University continues to support initiatives within our immediate region particularly as a member of the Greater Manchester Modern Slavery Business Network. We hosted a meeting of this group in March 2019 at the AMBS. The focus of the event was how larger organisations can support their supply chain partners and especially SMEs. In July our Deputy Head of Procurement attended a panel session at the Greater Manchester Chamber of Commerce Construction Summit, alongside two of our contracted construction firms, to discuss slavery and supply chain issues to businesses from across Greater Manchester. Events such as these raise awareness and provide opportunities to explore issues and experiences to tackle trafficking and its impacts within our city.
All of our central procurement team are professionally qualified and have completed The Chartered Institute of Purchasing and Supply Ethical Procurement and Supply course during the last 12 months. In addition several have attended relevant training courses addressing responsible procurement and various aspects of modern slavery and human rights in a purchasing context.
Edward M AstleChair of the Board of Governors and Pro Chancellor
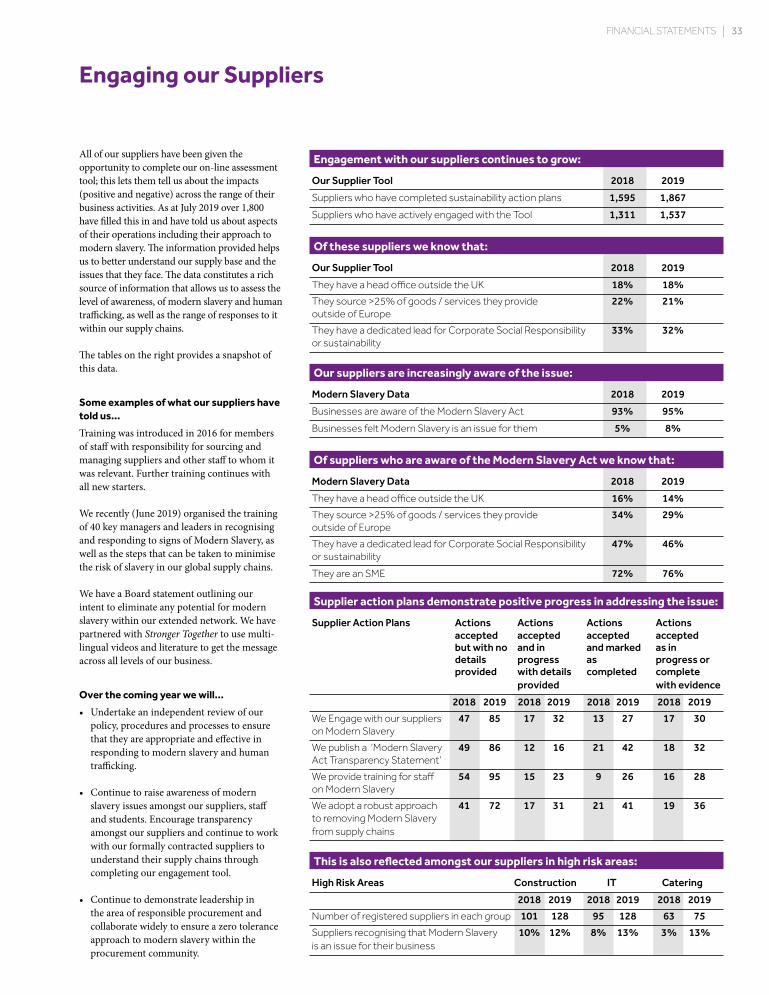
33FINANCIAL STATEMENTS
All of our suppliers have been given the opportunity to complete our on-line assessment tool; this lets them tell us about the impacts (positive and negative) across the range of their business activities. As at July 2019 over 1,800 have filled this in and have told us about aspects of their operations including their approach to modern slavery. The information provided helps us to better understand our supply base and the issues that they face. The data constitutes a rich source of information that allows us to assess the level of awareness, of modern slavery and human trafficking, as well as the range of responses to it within our supply chains.
The tables on the right provides a snapshot of this data.
Some examples of what our suppliers have told us…
Training was introduced in 2016 for members of staff with responsibility for sourcing and managing suppliers and other staff to whom it was relevant. Further training continues with all new starters.
We recently (June 2019) organised the training of 40 key managers and leaders in recognising and responding to signs of Modern Slavery, as well as the steps that can be taken to minimise the risk of slavery in our global supply chains.
We have a Board statement outlining our intent to eliminate any potential for modern slavery within our extended network. We have partnered with Stronger Together to use multi-lingual videos and literature to get the message across all levels of our business.
Over the coming year we will…
• Undertake an independent review of our policy, procedures and processes to ensure that they are appropriate and effective in responding to modern slavery and human trafficking.
• Continue to raise awareness of modern slavery issues amongst our suppliers, staff and students. Encourage transparency amongst our suppliers and continue to work with our formally contracted suppliers to understand their supply chains through completing our engagement tool.
• Continue to demonstrate leadership in the area of responsible procurement and collaborate widely to ensure a zero tolerance approach to modern slavery within the procurement community.
Engaging our Suppliers
Engagement with our suppliers continues to grow:
Our Supplier Tool 2018 2019
Suppliers who have completed sustainability action plans 1,595 1,867
Suppliers who have actively engaged with the Tool 1,311 1,537
Of these suppliers we know that:
Our Supplier Tool 2018 2019
They have a head office outside the UK 18% 18%
They source >25% of goods / services they provide 22% 21% outside of Europe
They have a dedicated lead for Corporate Social Responsibility 33% 32% or sustainability
Our suppliers are increasingly aware of the issue:
Modern Slavery Data 2018 2019
Businesses are aware of the Modern Slavery Act 93% 95%
Businesses felt Modern Slavery is an issue for them 5% 8%
Of suppliers who are aware of the Modern Slavery Act we know that:
Modern Slavery Data 2018 2019
They have a head office outside the UK 16% 14%
They source >25% of goods / services they provide 34% 29% outside of Europe
They have a dedicated lead for Corporate Social Responsibility 47% 46% or sustainability
They are an SME 72% 76%
Supplier action plans demonstrate positive progress in addressing the issue:
Supplier Action Plans Actions Actions Actions Actions accepted accepted accepted accepted but with no and in and marked as in details progress as progress or provided with details completed complete provided with evidence
2018 2019 2018 2019 2018 2019 2018 2019
We Engage with our suppliers 47 85 17 32 13 27 17 30 on Modern Slavery
We publish a ‘Modern Slavery 49 86 12 16 21 42 18 32 Act Transparency Statement’
We provide training for staff 54 95 15 23 9 26 16 28 on Modern Slavery
We adopt a robust approach 41 72 17 31 21 41 19 36 to removing Modern Slavery from supply chains
This is also reflected amongst our suppliers in high risk areas:
High Risk Areas Construction IT Catering
2018 2019 2018 2019 2018 2019
Number of registered suppliers in each group 101 128 95 128 63 75
Suppliers recognising that Modern Slavery 10% 12% 8% 13% 3% 13% is an issue for their business

34 FINANCIAL STATEMENTS
In accordance with the Royal Charter, the Board of Governors of The University of Manchester (‘the Board’) is responsible for the administration and management of the affairs of the University and is required to present audited financial statements for each financial year.
The Board is responsible for keeping proper accounting records, which disclose with reasonable accuracy at any time the financial position of The University of Manchester and which enable it to ensure that the financial statements are prepared in accordance with the ‘carried forward’ powers and duties of previous legislation (Further and Higher Education Act 1992 and the Higher Education Act 2004) and the new powers of the Higher Education and Research Act 2017 during the transition period to 31 July 2019, the Royal Charter, the Accounts Direction issued by the Office for Students, the Terms and conditions of funding for higher education institutions issued by the Office for Students, the Terms and conditions of Research England Grant, the Statement of Recommended Practice (SORP): Accounting for Further and Higher Education 2015, and applicable United Kingdom Law and Accounting Standards (United Kingdom Generally Accepted Accounting Practice), including Financial Reporting Standard 102, as well as reflecting current best practice in public sector corporate governance. In addition, under the terms and conditions of funding for higher education institutions issued by the Office for Students, the Board, through its designated office-holder, is required to prepare financial statements for each financial year which give a true and fair view of the state of affairs of the University and of the institutional surplus or deficit and cash flows for that year.
In causing the financial statements to be prepared, the Board has to ensure that:
• suitable accounting policies are selected and applied consistently;
• judgements and estimates are made that are reasonable and prudent;
• applicable UK law and accounting standards have been followed, subject to any material departures disclosed and explained in the financial statements; and
• financial statements are prepared on the going-concern basis unless it is inappropriate to presume that The University of Manchester will continue in operation. The Board is satisfied that the University has adequate resources to continue in operation for the foreseeable future; for this reason the going-concern basis continues to be adopted in the preparation of the financial statements.
The Board has taken reasonable steps to ensure the University:
- has a robust and comprehensive system of risk management, control and corporate governance. This includes arrangements for the prevention and detection of corruption, fraud, bribery and irregularities.
- has regular, reliable, timely and adequate information to monitor performance and track the use of public funds.
- plans and manages its activities to remain sustainable and financially viable.
- informs the Office for Students of any material change in its circumstances, including any significant developments that could impact on the mutual interests of the University and the Office for Students.
- uses public funds for proper purposes and seeks to achieve value for money from public funds.
- complies with the mandatory requirements relating to audit and financial reporting, set out in the Office for Students Audit Code of Practice and in the Office for Students annual accounts direction.
The governors who held office at the date of approval of this report confirm that, so far as they are each aware, there is no relevant audit information of which the University’s auditor is unaware; and each governor has taken all the steps that he or she ought to have taken to be aware of any relevant audit information and to establish that the University’s auditors are aware of that information.
The Board of Governors is responsible for the maintenance and integrity of the corporate and financial information included on the University’s website. Legislation in the United Kingdom governing the preparation and dissemination of financial statements may differ from legislation in other jurisdictions. The work carried out by the auditors does not involve consideration of these matters and, accordingly, the auditors accept no responsibility for any changes that may have occurred to the financial statements since they were initially presented on the website.
Mr Edward M AstleChair of the Board of Governors and Pro Chancellor
Statement of the Board of Governors’ responsibilities for the year ended 31 July 2019

35FINANCIAL STATEMENTS
Opinion
In our opinion:
• The University of Manchester’s group financial statements and parent institution’s financial statements (the “financial statements”) give a true and fair view of the state of the group’s and of the institution’s affairs as at 31 July 2019, and of the Group’s and parent institution’s income and expenditure, gains and losses and changes in reserves for the year then ended, and of the Group’s cash flows for the year then ended;
• the financial statements have been properly prepared in accordance United Kingdom Generally Accepted Accounting Practice.
• the financial statements have been properly prepared in accordance with the Statement of Recommended Practice: Accounting for Further and Higher Education, and relevant legislation.
The financial reporting framework that has been applied in their preparation is applicable law and United Kingdom Accounting Standards, including FRS 102 “The financial reporting standard applicable in the UK and Republic of Ireland” (United Kingdom Generally Accepted Accounting Practice).
Basis for opinion
We conducted our audit in accordance with International Standards on Auditing (UK) (ISAs (UK)) and applicable law. Our responsibilities under those standards are further described in the Auditor’s responsibilities for the audit of the financial statements section of our report below. We are independent of the group and parent institution in accordance with the ethical requirements that are relevant to our audit of the financial statements in the UK, including the FRC’s Ethical Standard as applied to listed public interest entities, and we have fulfilled our other ethical responsibilities in accordance with these requirements.
We believe that the audit evidence we have obtained is sufficient and appropriate to provide a basis for our opinion.
Conclusions relating to going concern
We have nothing to report in respect of the following matters in relation to which the ISAs (UK) require us to report to you where:
• the Board of Governors’ use of the going concern basis of accounting in the preparation of the financial statements is not appropriate; or
• the Board of Governors has not disclosed in the financial statements any identified material uncertainties that may cast significant doubt about the group’s or the parent institution’s ability to continue to adopt the going concern basis of accounting for a period of at least twelve months from the date when the financial statements are authorised for issue.
Independent Auditor’s Report to the Board of Governors of The University of Manchester
We have audited the financial statements of The University of Manchester which comprise:
Group Parent institution
Consolidated balance sheet as at 31 July 2019 Balance sheet as at 31 July 2019
Consolidated statement of comprehensive Statement of comprehensive income income and expenditure account for the year and expenditure for the year then ended then ended
Consolidated statement of changes in reserves University statement of changes in for the year then ended reserves for the year then ended
Consolidated statement of cash flows for the Related notes 1 to 32 to the financial year then ended statements including a statement of principal accounting policies
Related notes 1 to 32 to the financial statements, including a statement of principal accounting policies
Overview of our audit approach
Key audit matters • Risk of Fraud in Revenue Recognition
• Risk of misstatements due to Fraud or Error
• Valuation of defined benefit liabilities and assets in The University of Manchester Superannuation Scheme and Greater Manchester Pension Fund.
Audit scope • We performed an audit of the complete financial information of one component.
• The component where we performed full audit procedures accounted for 99.8% of Total income, 100% of Deficit before tax and 98.3% of Total assets.
Materiality • Overall group materiality of £11m which represents 1% of total income.

36 FINANCIAL STATEMENTS
Key audit matters
Key audit matters are those matters that, in our professional judgement, were of most significance in our audit of the financial statements of the current period and include the most significant assessed risks of material misstatement (whether or not due to fraud) that we identified. These matters included
those which had the greatest effect on: the overall audit strategy; the allocation of resources in the audit; and directing the efforts of the engagement team. These matters were addressed in the context of our audit of the financial statements as a whole, and in our opinion thereon, and we do not provide a separate opinion on these matters.
Independent Auditor’s Report to the Board of Governors of The University of Manchester
Risk Our response to the risk Key observations communicated to the Audit Committee
Risk of Fraud in Revenue Recognition (£1,098m total income, prior year comparative £1,059m)
Refer to the Accounting policies (page 44); and Notes 1-6 of the Consolidated financial statements.
Under ISA240 there is a presumed risk that revenue may be misstated due to improper recognition of revenue.
We specifically identify the risk as relating to :
• Research income recognition, which manifests in the balance sheet side of accrued and deferred income; Existence and Valuation assertions. The income statement assertions are Occurrence and Measurement to the extent they drive the year end balances.
• Tuition fees, specifically overseas students with variable rates; Occurrence assertion and Existence where income is accrued on the balance sheet.
• Capital Grants; Occurrence assertion as this drives the classification of income within the financial statements and could be subject to manipulation.
• Other income; Occurrence within the Income Statement.
• Receivables; valuation and existence assertions, including cut off, across all income categories due to the risk of recognition in the incorrect year.
Since there is no material judgement associated with the recognition of the University’s funding council grant income, we have determined that the risk of revenue recognition does not materialise within this area. Donation and endowment income and investment income is not material in the current year and such as we have not determined there is a risk of material manipulation around the recognition of this income for the year.
To address the identified risks we performed the following procedures:
Tested a sample of research grants and contracts included in the income statement (including any associated deferred income) substantively to assess performance related conditions and recognition in the correct year. We sample tested the valuation, and judgement to defer or accrue the income, of deferred and accrued income balances by comparing the total budget on the schemes to the contracts and the performance to date.
Tested for any evidence of clawback of balances relating to funding body grants or research income.
Performed substantive analytical review procedures relating to tuition fee income, corroborating student numbers and using this to correlate the numbers to the tuition fee income recognised. We sample tested short course fees using a lower threshold to respond to the income recognition specific risk.
Tested capital grant income substantively to the grant award to test that the income relates to the University and that the income is recognised in line with the award criteria.
Tested other income in note 4 to the financial statements substantively to assess occurrence and recognition in the financial statements
Substantively tested debtors to assess recoverability and performed cut off testing for transactions before and after the year end to confirm that they have been recorded in the correct financial year.
Tested a sample of journals specifically raised to move income between financial years.
Overall our audit work did not identify any material issues or unusual transactions to indicate any misreporting of the University’s revenue.
We identified one revenue recognition adjustment in relation to research deferred income, which has been corrected by management.
As this amount was not material and increased revenue recognised in the year we concluded that this item did not impact our opinion that our testing has not identified any material misstatements from revenue and expenditure recognition.

37FINANCIAL STATEMENTS
Risk Our response to the risk Key observations communicated to the Audit Committee
Risk Our response to the risk Key observations communicated to the Audit Committee
Risk of misstatements due to Fraud or Error
As identified in ISA (UK) 240, management is in a unique position to perpetrate fraud because of its ability to manipulate accounting records directly or indirectly and prepare fraudulent financial statements by overriding controls that otherwise appear to be operating effectively. We identify and respond to this fraud risk on every audit engagement.
We consider this risk to be relevant to the Group (and University as a single entity).
The risk has remained consistent with the prior year.
We assessed entity level controls established by management to control and detect fraud to consider their effectiveness, as well as making inquires of management around any identified instances of fraud in the year;
We sample tested the appropriateness of journal entries and adjustments made in preparing the financial statements;
We tested a sample of journal entries across the year based on appropriate risk-based criteria to identify potential manipulation of income and expenditure;
We tested a sample of capital additions to consider whether revenue items had been inappropriately capitalised;
We reviewed accounting estimates for evidence of management bias; the most significant estimates being in relation to provisions and in relation to pension fund assets and liabilities; and
We evaluated the business rationale and supporting documentation for the two significant unusual transactions we identified.
Overall our audit work did not identify any material issues or unusual transactions which indicate any misreporting of the University’s financial position.
We have identified two significant unusual transactions. We reviewed the business rationale and supporting information for both transactions and concur with management’s accounting treatment.
We identified no issues from our enquiries and review of fraud processes.
No issues were identified from other testing procedures.
Valuation of defined benefit liabilities and assets in the University of Manchester Superannuation Scheme and the Greater Manchester Pension Fund (£149.6m deficit, prior year comparative £138.6m deficit)
Refer to the Accounting policies (page 47); and Notes 21 and 25 of the Consolidated Financial Statements.
The University recognises three material pension schemes in the Statement of Financial Position. The valuation of assets and liabilities within the Greater Manchester Pension Fund (GMPF) and University of Manchester Superannuation Scheme (UMSS) are identified as a significant risk due to the significant estimation required for the liability figure and the risk of valuation error in relation to the assets. The third pension scheme, USS, is not identified as a significant risk to our opinion, as it is accounted for as a defined contribution pension scheme.
Accounting for these schemes involves significant estimation and judgement and therefore management engages an actuary to undertake the calculations on their behalf. ISAs (UK) 500 and 540 require us to undertake procedures on the use of management experts and the assumptions underlying fair value estimates.
We have focused on the following areas:
The reasonableness of the underlying assumptions used by the University’s actuarial expert, including those associated with recent judgements on McCloud and Guaranteed Minimum Pensions (GMP).
Ensuring the information supplied to the actuary in relation to the University was complete and accurate.
Ensuring the accounting entries and disclosures made in the financial statements were consistent with the report from the actuaries.
Testing the valuation of pension fund assets at the year-end.
We performed testing over asset valuations for UMSS to ensure assets are appropriately valued by engaging our own actuarial experts to provide a roll forward estimate against which we assessed the reported asset total. We obtained and reviewed fund manager reports and fund control reports to compare asset values reported by the actuary to assets at the reporting date. We completed analytical procedures on individual funds and we substantively tested movements between the valuation confirmation dates and the reporting date to supporting information.
We concluded that the assumptions used to value the liabilities in UMSS and GMPF schemes were within an acceptable range.
We concluded that the basis for the estimated increase in liabilities due to GMP in both UMSS and GMPF is considered reasonable.
University of Manchester Superannuation Scheme (UMSS):
We have reconciled the actuarial reports to the accounting entries included in the financial statements with no matters to report identified.
Based on these procedures we conclude the value to be fairly stated.
GMPF:
We have reconciled the actuarial reports to the accounting entries included in the financial statements with no matters to report identified.
The impact of the McCloud judgement on the University’s pension scheme is an increase in liabilities. The basis for this estimated increase is considered reasonable.

38 FINANCIAL STATEMENTS
Independent Auditor’s Report to the Board of Governors of The University of Manchester
Risk Our response to the risk Key observations communicated to the Audit Committee
We consider this risk to be relevant to the Group (and University as a single entity).
The risk has increased in the current year due to the impact of Guaranteed Minimum Pensions and McCloud judgements in the year, affecting the estimation of liabilities.
We have assessed the reported liabilities for UMSS and GMPF by considering the work of the Pension Fund actuaries. We engaged internal actuarial specialists to provide input on the consistency and appropriateness of assumptions underpinning the liability valuation of the pension schemes, including those associated with the estimate of liability in relation to GMP.We have considered the balances included in the audited Greater Manchester Pension Fund financial statements for the year ended 31 March 2019. We engaged our specialist to roll forward the asset value reported at 31 March 2019 to 31 July 2019 and compared this to the actuary’s estimate. We obtained information from the actuary to the pension fund and from the administrator of the pension fund to assess the impact of using the last triennial valuation as the basis for the 31 July 2019 valuation. We reviewed the audit committee reports of the pension fund from the date of the last triennial valuation to the current year to identify any possible indicators of material misstatement in relation to the GMPF assets, and performed analytical procedures on the University share of assets of the fund.We reviewed and tested the accounting entries and disclosures made within the University’s financial statements in relation to FRS 102. We have reconciled the actuarial reports to the accounting entries included in the financial statements.
Overall, based on procedures completed, we consider that the pension fund assets and liabilities as at 31 July 2019 disclosed in the financial statements for UMSS and GMPF are fairly stated.
In the prior year, our auditor’s report included a key audit matter in relation to accounting for the USS deficit liability due to the timing and availability of the valuation and revised deficit
contribution plan. In the current year, as we had no matters to report in the prior year and as the sector wide approach has been followed, we have not classified the risk as a significant risk or
key audit matter and have reported to the Audit Committee our work on USS as an inherent risk.
An overview of the scope of our audit
Tailoring the scope
Our assessment of audit risk, our evaluation of materiality and our allocation of performance materiality determine our audit scope for each entity within the Group. Taken together, this enables us to form an opinion on the consolidated financial statements. We take into account size, risk profile, the organisation of the group, changes in the business environment and other factors such as recent Internal audit results when assessing the level of work to be performed at each entity.
In assessing the risk of material misstatement to the Group financial statements, and to ensure we had adequate quantitative coverage of significant accounts in the financial statements, of the reporting components of the Group we
selected one component, which represents the principal business unit within the Group, being the University as an entity. We performed an audit of the complete financial information of the University (“full scope component”) based on its size or risk characteristics.
Except as explained below, we did not perform any audit procedures in respect of the other components because we did not consider there to be any accounts that had the potential for the greatest impact on the significant accounts in the financial statements either because of the size of these accounts or their risk profile. This was consistent with the approach that we followed in the previous year.
For the current year, the full scope component contributed 99.8% (2018: 99.6%) of the Group’s Total income, 100% of the Group’s Deficit before tax (2018: 85.7% of Group Surplus
before tax) and 98.3% (2018: 98.1%) of the Group’s Total assets.
Of the remaining components that together represent 0.2% of the Group’s Total Income, none are individually greater than 1% of the Group’s Total Income For these components, we performed other procedures, including analytical review and testing of consolidation journals and intercompany eliminations to respond to any potential risks of material misstatement to the Group financial statements.
The charts on the page opposite illustrate the coverage obtained from the work performed by our audit teams.
Involvement with component teams
All audit work performed for the purposes of the audit was undertaken by the Group audit team.

39FINANCIAL STATEMENTS
Total assets
98.3% Full scope components
0% Specific scope components
1.7% Other procedures
Total income
99.8% Full scope components
0% Specific scope components
0.2% Other procedures
Our application of materiality
We apply the concept of materiality in planning and performing the audit, in evaluating the effect of identified misstatements on the audit and in forming our audit opinion.
Materiality
The magnitude of an omission or misstatement that, individually or in the aggregate, could reasonably be expected to influence the economic decisions of the users of the financial statements. Materiality provides a basis for determining the nature and extent of our audit procedures.
We determined materiality for the Group to be £11.04 million (2018: £10.5 million), which is 1% (2018: 1%) of total income. We believe that total income provides us with a basis that is the most relevant for measuring the performance of the University by users of the financial statements of Higher Education providers.
We determined materiality for the parent institution to be £10.99 million (2018: £10.55 million), which is 1% (2018: 1%) of Total Income.
During the course of our audit, we reassessed initial planning materiality based on forecast figures and increased the materiality level for the Group and the University to reflect the draft financial statements outturn.
Performance materiality
The application of materiality at the individual account or balance level. It is set at an amount to reduce to an appropriately low level the probability that the aggregate of uncorrected and undetected misstatements exceeds materiality.
On the basis of our risk assessments, together with our assessment of the Group’s overall control environment, our judgement was that performance materiality was 75% (2018: 75%) of our planning materiality, namely £8.29m (2018: £7.9m). We have set performance materiality at this percentage due to our assessment of the control environment in place at the University and the low level of findings and adjustments found in the prior year and previous audits.
Reporting threshold
An amount below which identified misstatements are considered as being clearly trivial.
We agreed with the Audit Committee that we would report to them all uncorrected audit differences in excess of £0.55m (2018: £0.5m), which is set at 5% of materiality, as well as differences below that threshold that, in our view, warranted reporting on qualitative grounds.
Deficit before tax
100% Full scope components
0% Specific scope components
0% Other procedures
1.7%
0.2%
98.3%
99.8%
100%

40 FINANCIAL STATEMENTS
We evaluate any uncorrected misstatements against both the quantitative measures of materiality discussed above and in light of other relevant qualitative considerations in forming our opinion.
Other information
The other information comprises the information included in the annual report set out on pages 1 to 34, other than the financial statements and our auditor’s report thereon. Other information includes the Chair’s forward, Review of the year, Key performance indicators, The year in pictures, Financial Review, Corporate Governance Statement, Remuneration Committee report, Modern slavery and human trafficking statement and Statement of the Board of Governors’ responsibilities. The Board of Governors are responsible for the other information.
Our opinion on the financial statements does not cover the other information and, except to the extent otherwise explicitly stated in this report, we do not express any form of assurance conclusion thereon.
In connection with our audit of the financial statements, our responsibility is to read the other information and, in doing so, consider whether the other information is materially inconsistent with the financial statements or our knowledge obtained in the audit or otherwise appears to be materially misstated. If we identify such material inconsistencies or apparent material misstatements, we are required to determine whether there is a material misstatement in the financial statements or a material misstatement of the other information. If, based on the work we have performed, we conclude that there is a material misstatement of the other information, we are required to report that fact.
We have nothing to report in this regard.
Opinion on other matters prescribed by the Office for Students Terms and conditions of funding for higher education institutions
In our opinion, based on the work undertaken in the course of the audit, in all material respects:
• funds from whatever source administered by The University of Manchester have been properly applied to those purposes and managed in accordance with relevant legislation;
• funds provided by the Office for Students and Research England have been applied in accordance with the applicable Terms and conditions attached to them; and
• the requirements of the Office for Students accounts direction for the relevant year’s financial statements have been met.
Responsibilities of the Board of Governors
As explained more fully in the Statement of the Board of Governors’ responsibilities statement set out on page 34, the Board of Governors is responsible for the preparation of the financial statements and for being satisfied that they give a true and fair view, and for such internal control as the Board of Governors determine is necessary to enable the preparation of financial statements that are free from material misstatement, whether due to fraud or error.
In preparing the financial statements, the Board of Governors is responsible for assessing the group and parent institution’s ability to continue as a going concern, disclosing, as applicable, matters related to going concern and using the going concern basis of accounting unless management either intend to liquidate the group or the parent institution or to cease operations, or have no realistic alternative but to do so.
Auditor’s responsibilities for the audit of the financial statements
Our objectives are to obtain reasonable assurance about whether the financial statements as a whole are free from material misstatement, whether due to fraud or error, and to issue an auditor’s report that includes our opinion. Reasonable assurance is a high level of assurance, but is not a guarantee that an audit conducted in accordance with ISAs (UK) will always detect a material misstatement when it exists. Misstatements can arise from fraud or error and are considered material if, individually or in the aggregate, they could reasonably be expected to influence the economic decisions of users taken on the basis of these financial statements.
Explanation as to what extent the audit was considered capable of detecting irregularities, including fraud
The objectives of our audit, in respect to fraud, are; to identify and assess the risks of material misstatement of the financial statements due to fraud; to obtain sufficient appropriate audit evidence regarding the assessed risks of material misstatement due to fraud, through
designing and implementing appropriate responses; and to respond appropriately to fraud or suspected fraud identified during the audit. However, the primary responsibility for the prevention and detection of fraud rests with both those charged with governance of the entity and management.
Our approach was as follows:
• We obtained an understanding of the legal and regulatory frameworks that are applicable to the group and determined that the most significant are the Office for Students Terms and conditions of funding for higher education institutions and the Higher Education and Research Act 2017.
• We understood how The University of Manchester is complying with those frameworks by documenting the oversight of those charged with governance, considering the potential for override of controls or other inappropriate influence over the financial reporting process, the culture of honesty and ethical behaviour and whether a strong emphasis is placed on fraud prevention, which may reduce opportunities for fraud to take place, and fraud reporting and deterrence, which could persuade individuals not to commit fraud because of the likelihood of detection and punishment.
• We assessed the susceptibility of the group’s financial statements to material misstatement, including how fraud might occur by the use of journal entries or off ledger adjustments, accounting for significant or unusual items, or in applying bias to estimates and judgements.
• Based on this understanding we designed our audit procedures to identify non-compliance with such laws and regulations. Our procedures involved making enquiries of the Director of Legal Affairs and Board Secretariat, the Director of Finance and the Chair of the Audit Committee, inspecting the work performed by internal audit, reading the minutes of the Finance Committee, Board of Governors and Audit Committee, testing manual journal entries and testing estimates for unexpected changes in assumptions.
A further description of our responsibilities for the audit of the financial statements is located on the Financial Reporting Council’s website at www.frc.org.uk/auditorsresponsibilities. This description forms part of our auditor’s report.
Independent Auditor’s Report to the Board of Governors of The University of Manchester

41FINANCIAL STATEMENTS
Other matters we are required to address
• We were appointed by The University of Manchester on 23 April 2015 to audit the financial statements for the year ending 31 July 2015 and subsequent financial periods. We were appointed as auditors by The Board of Governors and signed an engagement letter on 23 April 2015.
• The period of total uninterrupted engagement including previous renewals and reappointments is 5 years, covering the years ending 2015 to 2019.
• The non-audit services prohibited by the FRC’s Ethical Standard were not provided to the group or the parent institution and we remain independent of the group and the parent institution in conducting the audit.
• The audit opinion is consistent with the additional report to the Audit Committee.
Use of our report
This report is made solely to the Board of Governors, as a body, in accordance with the Charters and Statutes of The University of Manchester. Our audit work has been undertaken so that we might state to the Board of Governors those matters we are required to state to them in an auditor’s report and for no other purpose. To the fullest extent permitted by law, we do not accept or assume responsibility to anyone other than the Board of Governors as a body, for our audit work, for this report, or for the opinions we have formed.
Ernst & Young LLP, Statutory AuditorBirmingham27 November 2019
The maintenance and integrity of The University of Manchester’s website is the responsibility of the Board of Governors; the work carried out by the auditors does not involve consideration of these matters and, accordingly, the auditors accept no responsibility for any changes that may have occurred to the financial statements since they were initially presented on the website.
Legislation in the United Kingdom governing the preparation and dissemination of financial statements may differ from legislation in other jurisdictions.

42 FINANCIAL STATEMENTS

43FINANCIAL STATEMENTS
FinancialStatementsFor the year ended 31 July 2019

44 FINANCIAL STATEMENTS
1. Basis of preparation
These financial statements have been prepared in accordance with the ‘carried forward’ powers and duties of previous legislation (Further and Higher Education Act 1992 and the Higher Education Act 2004) and the new powers of the Higher Education and Research Act 2017 during the transition period to 31 July 2019, the Royal Charter, the Accounts Direction issued by the Office for Students (OfS), the Terms and conditions of funding for higher education institutions issued by the Office for Students, the Terms and conditions of Research England Grant, the Statement of Recommended Practice (SORP): Accounting for Further and Higher Education (2015) and in accordance with Financial Reporting Standard (FRS) 102. The University is a public benefit entity and therefore has applied the relevant public benefit requirement of the applicable UK laws and accounting standards.
The University is not early adopting the 2019 SORP which is effective for the next financial year (2019/20). It is not anticipated that there will be any significant impact as a result of adopting the 2019 SORP.
The University’s activities, together with the factors likely to affect its future development, performance and position, are set out in the Director of Finance’s Financial Review of the year which forms part of the Board of Governors’ Report. The Board of Governors’ Report also describes the financial position of the University, its cash flows, liquidity position and borrowing facilities. The University’s objectives, policies and processes for managing its capital; its financial risk management objectives and its exposure to credit and liquidity risks are set out on page 21.
The Board of Governors has a reasonable expectation that the University has adequate resources to continue in operational existence for the foreseeable future. Thus it continues to adopt the going concern basis of accounting in preparing the annual financial statements.
2. Basis of Accounting
The financial statements have been prepared under the historical cost convention, with the exception of:• Certain investment properties which have
been revalued to fair value as at the year ended 31 July 2019.
• Where relevant, financial instruments are stated at fair value in accordance with FRS 102 as set out in policy 14.
These financial statements are presented in pounds sterling because that is the currency of the primary economic environment in which the University operates (the functional currency) and rounded to the nearest £’000.
The University has taken the exemption under 1.12 (b) of FRS 102 to not produce a cash flow statement for the University as it is the ultimate parent entity.
3. Basis of Consolidation
The consolidated financial statements include the University and all its subsidiaries for the financial year to 31 July 2019. The results of subsidiaries acquired or disposed of during the period are included in the Consolidated Statement of comprehensive income from the date of acquisition, being the date on which the Group obtains control of the entity, or up to the date of disposal. Intra-group transactions are eliminated on consolidation.
The consolidated financial statements do not include the income and expenditure of the Students’ Union as the University does not exert control or dominant influence over policy decisions.
Associated companies and joint ventures are accounted for using the equity method.
4. Income recognition
Income from the sale of goods or services is credited to the Statement of comprehensive income when the goods or services are supplied to the external customers or the terms of the contract have been satisfied.
Tuition fee income is stated gross of any expenditure which is not a discount and credited to the Statement of comprehensive income over the period in which students are studying. Where the amount of the tuition fee is reduced by a discount, income receivable is shown net of the discount. Bursaries and scholarships are accounted for gross as expenditure and not deducted from income. Education contracts are recognised when the University is entitled to the income, which is the period in which students are studying, or where relevant, when performance conditions have been met.
Grant fundingGrant funding including funding council block grants, research grants from government sources, grants (including research grants) from non-government sources are recognised as income when the University is entitled to the
income and any performance related conditions have been met. Income received in advance of any performance related condition being met is recognised as deferred income within creditors on the balance sheet and released to income as the conditions are met.
Capital grantsCapital grants are recognised in income when the University is entitled to the funds subject to any performance related conditions being met.
Insurance proceedsInsurance proceeds are recognised as receivable when confirmed by the insurance company. Proceeds relating to the loss of income are recognised as income when receivable. Proceeds which relate to the reimbursement of specific costs are netted off the costs to which they relate. Proceeds relating to the loss of a tangible fixed asset are disclosed within profit on disposal of fixed assets.
Donations and endowmentsDonations and endowments without performance related conditions are non-exchange transactions. Donations and endowments with donor imposed restrictions are recognised in income when the University is entitled to the funds. For donations with restrictions, income is retained within the restricted reserve until such time that it is utilised in line with such restrictions at which point the income is released to general reserves through a reserve transfer.
Donations with no restrictions are recognised in income when the University is entitled to the income.
Investment income and appreciation of endowments is recorded in income in the year in which it arises and as either restricted or unrestricted income according to the terms of the restriction applied to the individual endowment fund.
There are four main types of donations and endowments identified within reserves:
1. Restricted donations – the donor has specified that the donation must be used for a particular objective.
2. Unrestricted permanent endowments - the donor has specified that the fund is to be permanently invested to generate an income stream for the general benefit of the University.
Statement of principal accounting policies

45FINANCIAL STATEMENTS
3. Restricted expendable endowments - the donor has specified a particular objective other than the purchase or construction of tangible fixed assets, and the University has the power to use the capital.
4. Restricted permanent endowments - the donor has specified that the fund is to be permanently invested to generate an income stream to be applied to a particular objective.
Donations of fixed assets are included within income. The income recognised is valued using a reasonable estimate of their gross value or the amount actually realised. Donated tangible fixed assets are valued and accounted for as fixed assets under the appropriate fixed asset category
5. Intra-group transactions
Gains or losses on any intra-group transactions are eliminated in full. Amounts in relation to debts and claims between undertakings included in the consolidation are also eliminated.
Balances between the University and its associates and joint ventures are not eliminated. Normal trading transactions that are not settled by the balance sheet date are included as current assets or liabilities. Any gains or losses are included in the carrying amount of assets of either entity, the part relating to the Institution’s share is eliminated.
6. Foreign currency
Transactions in foreign currencies are translated to the respective functional currencies of Group entities at the foreign exchange rate ruling at the date of the transaction. Monetary assets and liabilities denominated in foreign currencies at the balance sheet date are translated to the functional currency at the foreign exchange rate ruling at that date. Foreign exchange differences arising on translation are recognised within surplus before tax in the Statement of comprehensive income.
Non-monetary assets and liabilities denominated in foreign currencies are measured in terms of historical cost are translated using the exchange rate at the date of the transaction. Non-monetary assets and liabilities denominated in foreign currencies that are stated at fair value are retranslated to the functional currency at foreign exchange rates ruling at the dates the fair value was determined.
The assets and liabilities of foreign operations, including goodwill and fair value adjustments arising on consolidation, are translated to the Group’s presentational currency, Sterling, at foreign exchange rates ruling at the balance sheet date. The revenues and expenses of foreign operations are translated at an average
rate for the year where this rate approximates to the foreign exchange rates ruling at the dates of the transactions.
7. Tangible fixed assets
Tangible fixed assets are stated at cost or, in the case of certain land and buildings and heritage assets at deemed cost, less accumulated depreciation and accumulated impairment losses. Certain items of fixed assets that had been revalued to fair value on or prior to the date of transition to the 2015 FE HE SORP, are measured on the basis of deemed cost, being the revalued amount at the date of that revaluation.
Where parts of a tangible fixed asset have different useful lives, they are accounted for as separate items of fixed assets (component accounting).
Land and buildings
Land and buildings are stated at cost or at deemed cost.
Where a property comprises two or more major components with substantially different useful economic lives (UELs), each component is accounted for separately and depreciated over its individual UEL. Expenditure relating to subsequent replacement of components is capitalised as incurred.
Major enhancements to existing buildings at a cost of more than £150,000 are capitalised and depreciated over their expected UEL, or less if the leasehold is shorter.
Depreciation is charged by component on a straight line basis over the estimated useful economic life of each component.
Useful economic lives for individual components of land and buildings are as follows:
Property Portfolio Years
Structure (Academic, 100 - 200 research, residential)
Structure (Sport, recreational, 20 – 50 administrative)
Fit-Out (Academic, research, 25 – 50 residential)
Fit-Out (Sport, recreational, 2 – 20 administrative)
Mechanical and electrical services 10 – 35
New Builds Years
Structure 100
Fit-Out 30
Mechanical and electrical services 20
Enhancements Years
Structure 50
Fit-Out 30
Mechanical and electrical services 20
Freehold land is not depreciated as it is considered to have an indefinite useful life. Leasehold land is depreciated over the life of the lease where the lease is for less than 50 years.
Buildings under construction are included at cost, based on the value of architect’s certificates and other costs incurred at 31 July 2019. They are not depreciated until they are brought into use.
EquipmentIndividual items of equipment and groups of functionally dependent items costing more than £50,000 are capitalised at cost. All other items are written off to the income and expenditure account in the year of acquisition.
Computer equipment consists of long-lived capital assets that normally are technological in nature and are the basis of the University’s information/connectivity infrastructure which exceed the £50,000 threshold. External specialist cost to bring the equipment into use will be considered as part of the asset. This includes all hardware, cabling and any incidental software required for the equipment to function.
Capitalised equipment is depreciated on a straight line basis over its expected useful economic life, generally assumed to be 3 years. Equipment acquired for a specific funded project is depreciated over its expected useful life which ordinarily equates to the term of the project.
ImpairmentA review for impairment of a tangible fixed asset is carried out if events or changes in circumstances indicate that the carrying amount of the tangible fixed asset may not be recoverable.
Maintenance The full costs of repairs and routine corrective maintenance of tangible fixed assets are charged to expenditure in the year in which they are incurred.
Assets held for resaleTangible fixed assets surplus to requirements are held at the lower of cost and net realisable value.
Borrowing costsBorrowing costs are recognised as expenditure in the year in which they are incurred. The University has opted not to capitalise borrowing costs.

46 FINANCIAL STATEMENTS
8. Heritage assets
Heritage assets are individual objects, collections, specimens or structures of historic, scientific or artistic value that are held and maintained principally for their contribution to knowledge and culture. Heritage assets are stated at cost or deemed cost. Heritage assets valued over £50,000 have been capitalised and recognised at the cost or value of the acquisition, where such a cost is reasonably obtainable.
Heritage assets are not depreciated as their long economic life and high residual value mean that any depreciation would not be material. The assets are subject to an annual impairment review in accordance with applicable accounting standards.
Where heritage assets have not been capitalised, details of the nature and age of these assets are disclosed.
9. Leases
Leases in which the University assumes substantially all the risks and rewards of ownership of the leased asset are classified as finance leases. Leased assets acquired by way of finance lease and the corresponding lease liabilities are initially recognised at an amount equal to the lower of their fair value and the present value of the minimum lease payments at inception of the lease.
Minimum lease payments are apportioned between the finance charge and the reduction of the outstanding liability. The finance charge is allocated to each period during the lease term so as to produce a constant periodic rate of interest on the remaining balance of the liability.
Leased assets acquired by way of finance lease are depreciated over the duration of the lease.
Costs in respect of operating leases are charged on a straight-line basis over the lease term. Any lease premiums or incentives are spread over the minimum lease term.
10. Goodwill
Goodwill arising on consolidation is based on the difference between the fair value of the consideration given for the undertaking acquired and the fair value of its separable net assets at the date of acquisition. Goodwill is amortised over its estimated life which is usually 5 years and is subject to periodic impairment reviews as appropriate.
Positive purchased goodwill is capitalised and classified as an asset on the balance sheet.
11. Intangible assets
Intangible assets purchased separately from a business are initially recognised at cost.
Purchased software costs Software costs are capitalised if externally purchased software and the wholly attributable external implementation costs as set out below exceed the £50,000 threshold.
External costs, associated with the application development and implementation phases are capitalised. This may involve the acquisition of computer equipment or third party software. Internal costs incurred in order to bring the software in to use are also capitalised where they can be reliably measured.
Costs to develop or obtain software that allows for access or conversion of old data by new information systems are also capitalised.
Training costs are expensed as incurred.
External costs and internal costs (where they can be reliably measured) in respect of upgrades and enhancements will be capitalised only if the expenditure results in additional functionality.
Internally-developed software and web-development costsDesign and content costs relating to the development of internal software and websites to support specific teaching or training courses, or for specific research projects, as well as design and content costs for websites that are for the general use of the institution and its staff are written off as incurred.
ImpairmentA review for impairment of an intangible asset is carried out if events or changes in circumstances indicate that the value of the intangible asset may not be recoverable.
12. Subsidiary undertakings, associate undertakings and joint ventures
In the University balance sheet investments in subsidiaries are stated at cost less provision for impairment. In the consolidated financial statements, investments in associated undertakings are stated at the University’s share of their net assets. The University accounts for its share of joint ventures using the equity method. The University accounts for its share of transactions from joint operations and jointly controlled assets in the Statement of comprehensive income.
13. Investment properties
Investment property is land and buildings (or part of buildings) held for rental income and/or capital appreciation rather than for use in delivering services.
Investment properties are measured initially at cost and subsequently at fair value at the balance sheet date. Changes in fair value are recognised immediately within the surplus before tax in the Statement of comprehensive income. Investment properties are not depreciated but are revalued or reviewed annually according to market conditions as at 31 July each year.
14. Financial instruments
The University has chosen to apply the provisions of sections 11 and 12 of FRS 102 in full. Financial assets and financial liabilities are recognised in the University’s balance sheet when the University becomes a party to the contractual provisions of the instrument. A financial asset and a financial liability are offset only when there is a legally enforceable right to set off the recognised amounts and an intention either to settle on a net basis, or to realise the asset and settle the liability simultaneously.
The University’s financial assets and liabilities all meet the criteria for basic financial instruments prescribed within FRS 102 Section 11.8. All financial assets and liabilities are initially recognised at the transaction price plus any additional directly attributable transaction costs. They are subsequently measured as follows:
InvestmentsInvestments within the scope of Section 11 of FRS 102 (therefore excluding investments in subsidiaries, associates and joint ventures) are recognised initially at fair value which is normally the transaction price (but excludes any transaction costs, where the investment is subsequently measured at fair value through the Statement of comprehensive income). Subsequently, they are measured at fair value if the investment is publicly traded or their fair value can otherwise be measured reliably with the changes in fair value recognised in the Statement of comprehensive income. All other investments are measured at cost less impairment.
Short-term debtors and creditorsDebtors and creditors with no stated interest rate and receivable or payable within one year are recorded at transaction price. Any losses arising from impairment are recognised in the Statement of comprehensive income in other operating expenses.

47FINANCIAL STATEMENTS
Loan notes receivable or payableDebt instruments, including loan notes, are basic financial instruments and are initially recorded at the transaction price, net of transaction costs. Subsequently, they are measured at amortised cost using the effective interest method. Debt instruments that are receivable or payable within one year are not discounted.
15. Stocks
Stocks are stated at the lower of their cost and net realisable value. Where necessary, provision is made for obsolete, slow-moving and defective stocks.
16. Cash and cash equivalents
Cash includes cash in hand, deposits repayable on demand and overdrafts. Deposits are repayable on demand if they are in practice available within 24 hours without penalty.
Cash equivalents are short term, highly liquid investments that are readily convertible to known amounts of cash with insignificant risk of change in value. Deposit investments are deemed to be cash equivalents if they have a maturity of three months or less from the date of placement.
17. Provisions, contingent liabilities and contingent assets
Provisions are recognised when: the University has a present legal or constructive obligation as a result of a past event; it is probable that a transfer of economic benefit will be required to settle the obligation; and a reliable estimate can be made of the amount of the obligation.
The amount recognised as a provision is determined by discounting the expected future cash flows at a pre-tax rate that reflects risks specific to the liability.
A contingent liability arises from a past event that gives the University a possible obligation whose existence will only be confirmed by the occurrence or otherwise of uncertain future events not wholly within the control of the University. Contingent liabilities also arise in circumstances where a provision would otherwise be made but either it is not probable that an outflow of resources will be required or the amount of the obligation cannot be measured reliably.
A contingent asset arises where an event has taken place that gives the University a possible asset whose existence will only be confirmed by the occurrence or otherwise of uncertain future events not wholly within the control of the University.
Contingent assets and liabilities are not recognised in the Balance Sheet but are disclosed in the notes.
18. Accounting for retirement benefits
The five principal schemes for the University’s staff are the Universities Superannuation Scheme (‘USS’), the NHS Pension scheme (‘NHSPS’), the University of Manchester Superannuation Scheme (‘UMSS’), the Greater Manchester Pension Fund (‘GMPF’) and the newly created University of Manchester Pension Saver (“UoMPS”). The first four schemes are defined benefit schemes whilst UoMPS is a defined contribution scheme.
The four defined benefit schemes are externally funded, with the assets of the schemes held separately from those of the group, in separate trustee administered funds. With the exception of NHSPS, each fund has a full valuation every three years carried out by professionally qualified independent actuaries.
Pension costs are assessed on the latest actuarial valuations of the Schemes and are accounted for on the basis of FRS 102.
Defined contribution plansA defined contribution plan is a post-employment benefit plan under which the University pays fixed contributions into a separate entity and will have no legal or constructive obligation to pay further amounts. Obligations for contributions to defined contribution pension plans are recognised as an expense in the income statement in the periods during which services are rendered by employees. UoMPS is such a defined contribution plan.
Defined benefit plansUMSS and GMPF schemes are accounted for as defined benefit plans under FRS 102. A defined benefit plan is a post-employment benefit plan other than a defined contribution plan. Under defined benefit plans the University’s obligation is to provide the agreed benefits to current and former employees, and actuarial risk (that benefits will cost more or less than expected) and investment risk (that returns on assets set aside to fund the benefits will differ from expectations) are borne in substance by the University.
The University should recognise a liability for its obligations under defined benefit plans net of plan assets. This net defined benefit liability is measured as the estimated amount of benefit that employees have earned in return for their service in the current and prior periods, discounted to determine its present value, less the fair value (at bid price) of plan assets at the balance sheet date. The calculation is performed by a qualified actuary using the projected unit credit method.
Where the defined benefit plan has changed the benefits in the current period, the University will increase or decrease its net defined liability to reflect this and shall recognise the increase or decrease as an expense or income respectively. Similarly if changes have come into effect that relate to prior periods (e.g due to legal rulings), these will be recognised as a past service cost or income in the period in which the decision / change is made.
If a defined benefit plan has been curtailed (i.e. benefits are significantly reduced) in the current period the defined benefit obligation shall be decreased and the University shall recognise the gain in the profit and loss in the current period. If significant it will be shown seperately within the statement of comprehensive income.
Where the calculation results in a net asset, recognition of the asset is limited to the extent to which the University is able to recover the surplus either through reduced contributions in the future or through refunds from the plan.
Multi-employer pension schemesOf the four schemes, USS and NHSPS are both multi-employer schemes. Because of the mutual nature of the schemes, the schemes’ assets are not hypothecated to individual institutions and scheme-wide contribution rates are set. The University is therefore exposed to actuarial risks associated with other institutions’ employees and is unable to identify its share of the underlying assets and liabilities of the two schemes on a consistent and reasonable basis. Therefore, as required by FRS 102, these schemes are accounted for as if they are defined contribution plans. As a result, the amount charged to the Statement of comprehensive income represents the contributions payable to the scheme in respect of the accounting period. As a contractual commitment is in place with USS to fund past deficits within the scheme, a liability is recorded within provisions in accordance with FRS 102.
19. Employment benefits
Short term employment benefits such as salaries and compensated absences are recognised as an expense in the year in which the employees render service to the University. Any unused benefits are accrued and measured as the additional amount the University expects to pay as a result of the unused entitlement.
20. Taxation status
The University is an exempt charity within the meaning of Schedule 3 of the Charities Act 2011. It is therefore a charity within the meaning of Paragraph 1 of Schedule 6 to the Finance Act 2010 and accordingly, the University is potentially exempt from UK Corporation Tax in respect of income or capital gains received within categories covered by

48 FINANCIAL STATEMENTS
Sections 478-488 of the Corporation Tax Act 2010 (CTA 2010) or Section 256 of the Taxation of Chargeable Gains Act 1992, to the extent that such income or gains are applied to exclusively charitable purposes.
The University receives no similar exemption in respect of Value Added Tax (VAT). Irrecoverable VAT on expenditure (revenue and capital) is included in the costs of such expenditure. Any irrecoverable VAT allocated to fixed assets is included in their cost.
The University’s subsidiary companies are subject to Corporation Tax and VAT in the same way as any commercial organisation.
21. Current and deferred taxation
Current tax, including UK Corporation Tax and foreign tax, is provided at amounts expected to be paid (or recovered) using the tax rates and laws that have been enacted or substantively enacted by the balance sheet date.
Deferred tax is provided in full on timing differences that exist at the balance sheet date and that result in an obligation to pay more tax or a right to pay less tax in the future. Deferred tax is measured at rates expected to apply when the tax crystallises based on current rates and law. Timing differences arise from the inclusion of items of income and expenditure in taxation computations in periods different from those in which they are included in financial statements. Deferred tax assets are recognised when it is more likely than not that they will be recovered. Deferred tax is measured using rates of tax that have been enacted or substantively enacted by the balance sheet date. Deferred tax assets and liabilities are not discounted.
22. Reserves
Reserves are classified as restricted or unrestricted.
Restricted endowment reserves include balances which, through endowment to the University, are held either as a permanently restricted fund where the University must hold the fund to perpetuity or as an expendable endowment where the capital can be spent.
Other restricted reserves include balances through which the donor has designated a specific purpose and therefore the University is restricted in the use of these funds.
23. Agency arrangements
Where the University receives and disburses funds as paying agent on behalf of a funding body for which the University is exposed to minimal risk or enjoys minimal economic benefit related to the transaction, then the related income and expenditure is excluded
from the Statement of comprehensive income. Details are disclosed within note 32 ‘Amounts disbursed as agent’.
24. Significant estimates and judgements
In the process of applying these accounting policies, the University is required to make certain estimates, judgements and assumptions that management believe are reasonable based on the information available. These are reviewed on a regular basis by the University’s senior management team. Significant estimates and material judgements used in the preparation of the financial statements are as follows:
Revenue recognitionAs outlined in accounting policy 4, grant and research revenue is recognised in the income statement as performance conditions are satisfied. Therefore management apply judgement in deferring income received for conditions not yet satisfied, and accruing for income not yet received. To assess these amounts management consider the individual grant conditions and the progress and expenditure incurred on each agreement.
Recoverability of debtorsThe provision for doubtful debts is based on our estimate of the expected recoverability of those debts. Assumptions are made based on the level of debtors which have defaulted historically, coupled with current economic knowledge. The provision is based on the current situation of the customer, the age profile of the debt and the nature of the amount due.
Investment propertiesValuations are undertaken every five years by an independent external team of chartered surveyors. This is then updated annually by senior management based on the current tenant rents and an estimate of the rental yield going forward.
ImpairmentsManagement make judgements as to whether any indicators of impairment are present for any of the University’s assets.
ProvisionsManagement apply judgement to arrive at the best estimate for any obligation required. The amount recognised as a provision is management’s best estimate of the present value of the amount required to settle the obligation. To arrive at this amount management assess the likelihood and extent of any future settlement and make judgements based on these.
TaxationThe University establishes provisions based on reasonable estimates, for possible consequences of audits by the tax authorities of the respective countries in which it operates.
The amount of such provisions is based on various factors, such as experience with previous tax audits and differing interpretations of tax regulations by the taxable entity and the responsible tax authority.
Management estimation is required to determine the amount of deferred tax assets that can be recognised, based upon likely timing and level of future taxable profits together with an assessment of the effect of future tax planning strategies.
Retirement benefit obligationsThe University operates within four defined pension schemes.
Two of these schemes are accounted for as defined benefit schemes. These are the University of Manchester Superannuation Scheme (‘UMSS’) and the Greater Manchester Pension Fund (‘GMPF’). Actuarial valuations are carried out as determined by the trustees annually. Pension costs under FRS 102 are based upon the latest actuarial valuation, which is based on assumptions agreed by management following actuarial advice. The liability may also take account of the estimated impact of changes in benefit structure or benefit calculations (e.g. due to legal rulings). The impact of this is estimated based on actuarial advice but also known conditions within the relevant scheme. The key assumptions used are documented within note 25.
The University also operates within two schemes which are accounted for as a defined contribution schemes, the Universities Superannuation Scheme (‘USS’) and the NHS pension scheme (‘NHSP’). These are accounted for as a defined contribution schemes as insufficient information is available to identify the University’s share of the underlying assets and liabilities.
As the University is contractually bound to make deficit recovery payments to USS, this is recognised as a liability on the balance sheet. The provision is currently based on the USS deficit recovery plan agreed after the 2017 actuarial valuation, which defines the deficit payment required as a percentage of future salaries until 2034. These contributions will be reassessed within each triennial valuation of the scheme. The provision is based on management’s estimate of expected future salary inflations, changes in staff numbers and the prevailing rate of discount. The rationale for using the 2017 valuation and the financial risks pertaining to the 2018 valuation, are set out in note 25(a).

49FINANCIAL STATEMENTS
Consolidated statement of comprehensive incomeYear ended 31 July 2019
Consolidated University
Year Ended Year Ended Year Ended Year Ended
Notes 31 July 2019 31 July 2018 31 July 2019 31 July 2018
£’000 £’000 £’000 £’000
Income
Tuition fees and education contracts 1 483,282 462,845 483,282 462,845
Funding body grants 2 131,653 127,126 131,653 127,126
Research grants and contracts 3 323,528 298,714 323,528 298,714
Other income 4 145,649 151,432 142,881 147,178
Investment income 5 7,639 8,044 7,889 8,273
Donations and endowments 6 6,138 10,999 6,138 10,999
Total income 1,097,889 1,059,160 1,095,371 1,055,135
Expenditure
Staff costs 7 569,656 537,408 556,110 524,649
Change in USS deficit recovery plan 7 165,100 - 165,100 -
UMSS change in benefits structure 7 (27,267) - (27,267) -
Past service costs 7 5,462 - 5,462 -
Total staff costs 7 712,951 537,408 699,405 524,649
Other operating expenses 8 378,674 388,641 388,503 405,105
Depreciation and amortisation 11 &12 77,732 78,438 76,801 77,474
Interest and other finance costs 9 23,601 25,129 23,601 25,127
Total expenditure 1,192,958 1,029,616 1,188,310 1,032,355
(Deficit) /surplus before other gains and share of operating surplus of associates (95,069) 29,544 (92,939) 22,780
Gain on disposal of fixed assets 12 12,614 331 12,614 331
Gain on investments (including investment properties) 14 4,308 12,883 4,220 13,696
Share of operating surplus in associate 15 2,706 174 - -
(Deficit) /surplus before tax (75,441) 42,932 (76,105) 36,807
Taxation 10 196 127 202 (31)
(Deficit) /surplus for the year (75,245) 43,059 (75,903) 36,776
Other comprehensive income
Actuarial (loss)/gain in respect of pension schemes 25 (35,278) 59,166 (35,278) 59,166
Total comprehensive (deficit) / income for the year (110,523) 102,225 (111,181) 95,942
Endowment comprehensive income for the year 3,299 12,895 3,299 12,895
Restricted comprehensive income for the year 43,950 9,189 43,950 9,189
Unrestricted comprehensive (deficit)/income for the year (157,772) 80,141 (158,430) 73,858
(110,523) 102,225 (111,181) 95,942
All items of income and expenditure relate to continuing activities

50 FINANCIAL STATEMENTS
Consolidated statement of changes in reservesYear ended 31 July 2019
(a) Consolidated Income and expenditure account Total
Endowment Restricted Unrestricted
£’000 £’000 £’000 £’000
Balance at 1 August 2018 235,092 40,134 1,441,542 1,716,768
Surplus/(deficit) from the income and expenditure statement 3,299 54,535 (133,079) (75,245)
Other comprehensive (deficit)/income - - (35,278) (35,278)
Release of restricted funds spent in year - (10,585) 10,585 -
Total comprehensive income/(deficit) for the year 3,299 43,950 (157,772) (110,523)
Balance at 31 July 2019 238,391 84,084 1,283,770 1,606,245
Income and expenditure account Total
Endowment Restricted Unrestricted
£’000 £’000 £’000 £’000
Balance at 1 August 2017 222,197 30,945 1,361,401 1,614,543
Surplus/(deficit) from the income and expenditure statement 12,895 50,902 (20,738) 43,059
Other comprehensive income - - 59,166 59,166
Release of restricted funds spent in year - (41,713) 41,713 -
Total comprehensive income for the year 12,895 9,189 80,141 102,225
Balance at 31 July 2018 235,092 40,134 1,441,542 1,716,768
(b) University Income and expenditure account Total
Endowment Restricted Unrestricted
£’000 £’000 £’000 £’000
Balance at 1 August 2018 235,092 40,134 1,397,512 1,672,738
Surplus/(deficit) from the income and expenditure statement 3,299 54,535 (133,737) (75,903)
Other comprehensive (deficit)/income - - (35,278) (35,278)
Release of restricted funds spent in year - (10,585) 10,585 -
Total comprehensive income/(deficit) for the year 3,299 43,950 (158,430) (111,181)
Balance at 31 July 2019 238,391 84,084 1,239,082 1,561,557
Income and expenditure account Total
Endowment Restricted Unrestricted
£’000 £’000 £’000 £’000
Balance at 1 August 2017 222,197 30,945 1,323,654 1,576,796
Surplus/(deficit) from the income and expenditure statement 12,895 50,902 (27,021) 36,776
Other comprehensive income - - 59,166 59,166
Release of restricted funds spent in year - (41,713) 41,713 -
Total comprehensive income for the year 12,895 9,189 73,858 95,942
Balance at 31 July 2018 235,092 40,134 1,397,512 1,672,738

51FINANCIAL STATEMENTS
Balance sheet as at 31 July 2019
Consolidated University
Notes 2019 2018 2019 2018
£’000 £’000 £’000 £’000
Non current assets
Intangible assets and goodwill 11 15,709 7,303 16,035 7,737
Fixed assets 12 1,875,159 1,656,531 1,838,391 1,619,419
Heritage assets 13 257,539 257,239 257,539 257,239
Investments 14 274,932 350,122 272,291 347,092
Investments in associates 15 9,694 7,296 - 308
2,433,033 2,278,491 2,384,256 2,231,795
Current assets
Stock 1,215 1,014 1,204 977
Trade and other receivables 16 117,963 114,855 128,995 125,734
Investments 17 155,000 255,000 155,000 255,000
Cash and cash equivalents 48,319 60,284 38,794 49,213
322,497 431,153 323,993 430,924
Less: Payables: amounts falling due within one year 18 (348,231) (362,921) (346,250) (360,626)
Net current (liabilities) / assets (25,734) 68,232 (22,257) 70,298
Total assets less current liabilities 2,407,299 2,346,723 2,361,999 2,302,093
Payables: amounts falling due after more than one year 19 (397,612) (404,720) (397,612) (404,720)
Provisions
Pension provisions 21 (397,933) (221,669) (397,933) (221,666)
Other provisions 21 (5,509) (3,566) (4,897) (2,969)
Total net assets 1,606,245 1,716,768 1,561,557 1,672,738
Restricted Reserves
Income and expenditure reserve - endowment reserve 22 238,391 235,092 238,391 235,092
Income and expenditure reserve - restricted reserve 23 84,084 40,134 84,084 40,134
Unrestricted Reserves
Income and expenditure reserve - unrestricted reserve 1,283,770 1,441,542 1,239,082 1,397,512
Total Reserves 1,606,245 1,716,768 1,561,557 1,672,738
The financial statements were approved by the Governing Body on 20th November 2019 and were signed on its behalf on that date by:
Mr Edward Astle Professor Dame Nancy Rothwell
Chair of the Board of Governors and Pro-Chancellor President and Vice-Chancellor

52 FINANCIAL STATEMENTS
Consolidated statement of cash flowsYear ended 31 July 2019
Notes Year ended Year ended
31 July 2019 31 July 2018
£’000 £’000
Cash flow from operating activities
(Deficit)/surplus for the year (75,245) 43,059
Adjustment for non-cash items
Depreciation 12 76,670 77,176
Amortisation of intangible assets 11 1,062 1,262
Gain on investments (4,308) (12,882)
(Increase)/decrease in stock (201) 587
Decrease/(increase) in receivables 16 1,092 (9,765)
(Decrease)/increase in payables 18-19 (4,664) 70,151
Increase/(decrease) in pension provision 21 140,986 (4,881)
Increase in other provisions 14, 15 & 21 3,472 6,633
Receipt of donated equipment (300) (1,200)
Share of operating surplus in associate 15 (2,706) (173)
Non controlling Interest - -
Adjustment for investing or financing activities Investment income 5 (7,639) (8,044)
Interest payable 9 18,597 18,449
New endowments 6 (1,227) (4,558)
Profit on sale of fixed assets (12,614) (331)
Capital grant income (88,110) (83,554)
Assets transferred to other operating expenditure 11-12 1,260 325
Net cash inflow from operating activities 46,125 92,254
Cash flows from investing activities Proceeds from sales of fixed assets 8,414 1,265
Disposal of non current asset investments 79,498 60,900
Capital grant receipts 85,287 71,972
Withdrawal/(placement) of deposits 100,000 (5,000)
Investment income 7,639 8,044
Payments made to acquire fixed assets and intangible assets (310,158) (236,655)
Payments made to acquire investments (1,221) (50,416)
Net cash outflow from investing activities (30,541) (149,890)
Cash flows from financing activities
Interest paid (18,597) (18,448)
Interest element of finance lease rental payment - -
Endowment cash received 1,227 4,558
Repayments of long-term loans (10,179) (3,806)
Net cash outflow from financing activities (27,549) (17,696)
Decrease in cash and cash equivalents in the year 26 (11,965) (75,332)
Cash and cash equivalents at beginning of the year 26 60,284 135,616
Cash and cash equivalents at the end of the year 26 48,319 60,284

53FINANCIAL STATEMENTS
Notes to the financial statementsYear ended 31 July 2019
1 Tuition fees and education contracts Consolidated University
2019 2018 2019 2018 £’000 £’000 £’000 £’000
Full-time home and EU students 208,002 210,131 208,002 210,131
Full-time international students 225,258 203,695 225,258 203,695
Part-time students 28,973 29,278 28,973 29,278
Short course fees 20,763 19,391 20,763 19,391
Research training support grants 286 350 286 350
483,282 462,845 483,282 462,845
2 Funding body grants Consolidated University
2019 2018 2019 2018 £’000 £’000 £’000 £’000
Recurrent grantHigher Education Funding Council - recurrent 105,050 103,702 105,050 103,702
Higher Education Funding Council - capital 18,897 16,706 18,897 16,706
Other recurrent grants 2,070 2,355 2,070 2,355
Specific grants
Special initiatives 5,636 4,363 5,636 4,363
131,653 127,126 131,653 127,126
3 Research grants and contracts Consolidated University
2019 2018 2019 2018 £’000 £’000 £’000 £’000
Research councils 149,273 123,251 149,273 123,251
UK based charities 58,828 56,688 58,828 56,688
UK central government, hospitals and health authorities 43,449 36,335 43,449 36,335
UK industry and commerce 24,490 19,971 24,490 19,971
Overseas 45,859 60,711 45,859 60,711
Other sources 1,629 1,758 1,629 1,758
323,528 298,714 323,528 298,714
The above includes £67.1m (2018: £57.5m) relating to income recognised in respect of capital additions.
Included within the above is £192.7m (2018: £159.3m) of income from UK Government sources. There are no significant unfulfilled conditions or contingencies relating to government income recognised. The University has not benefited from any other government revenue grants outside of that disclosed in notes 3 and note 4.
4 Other income Consolidated University
2019 2018 2019 2018 £’000 £’000 £’000 £’000
Residences, catering and conferences 54,588 52,869 51,906 50,501
Other grants 32,853 34,537 32,853 34,521
Income from supply of goods and services 18,220 18,006 18,158 17,942
Income from reimbursed salary costs 13,666 13,706 13,666 13,706
Premises income 3,950 1,648 3,187 3,017
Consultancy 2,953 3,102 2,953 3,102
Other capital income 2,146 9,345 2,146 9,345
Other 17,273 18,219 18,012 15,044
145,649 151,432 142,881 147,178
Included within the above is £47.9m (2018: 43.9m) of income from UK Government sources. There are no significant unfulfilled conditions or contingencies relating to government income recognised. The University has not benefited from any other government revenue grants outside of that disclosed in notes 3 and note 4.

54 FINANCIAL STATEMENTS
Notes to the financial statements (continued)Year ended 31 July 2019
5 Investment income Consolidated University
2019 2018 2019 2018 £’000 £’000 £’000 £’000
Interest from short-term investments 2,939 3,380 2,939 3,371
Dividend income 1,074 882 1,074 882
Endowment income 3,620 3,426 3,620 3,426
Investment income 6 356 256 594
7,639 8,044 7,889 8,273
6 Donations and endowments Consolidated University
2019 2018 2019 2018 £’000 £’000 £’000 £’000
New endowments 1,227 4,558 1,227 4,558
Donations 4,911 6,441 4,911 6,441
6,138 10,999 6,138 10,999
7 Staff costs Consolidated University
2019 2018 2019 2018 £’000 £’000 £’000 £’000
Staff Costs:
Wages and salaries 415,590 396,900 405,184 386,384
Social security costs 44,380 42,620 43,591 41,787
Pension costs 102,256 91,626 100,853 90,255
Early retirement and voluntary severance (ERVS) scheme costs 7,430 6,262 6,482 6,223
569,656 537,408 556,110 524,649
Change in USS deficit recovery plan 165,100 - 165,100 -
UMSS change in benefits structure (27,267) - (27,267) -
Past service costs 5,462 - 5,462 -
712,951 537,408 699,405 524,649
Clinical Excellence Awards paid to NHS Consultants employed on joint contracts between the NHS and the University are not borne by the University and are excluded from the above analysis and from the analysis of remuneration of higher paid staff. These amount to £3.8m for the year ended 31 July 2019 (2018: £3.6m).
Termination benefits (including ERVS costs) amounting to £7.9m ( 2018 : £6.7m) were paid to members of staff who left the University or its subsidiaries for the year ended 31 July 2019. These payments were made to 454 people in the year ended 31 July 2019 (2018 : 388 people). The majority relate to restructuring across a number of areas.
In June 2009 the University introduced a salary sacrifice arrangement known as PensionChoice for University employees who are members of the USS and UMSS pension schemes. Wages and salaries for the USS, UMSS and Pension Saver members participating in PensionChoice reflect the reduced gross pay earned by staff and the pension costs reflect the increased employer element of the USS, UMSS and Pension Saver pension contributions.
Change in USS deficit recovery plan - £165.1m. As set out in note 25 (a), this change in USS deficit recovery plan of £165.1m relates to the impact of the increase in deficit contribution rates from 2.1% to 5% and change in duration from the period ending March 2031 to March 2034.
UMSS change in benefits structure - £27.3m. As set out in note 25 (d) this relates to the reduction in the UMSS liability as a consequence of the benefit restructure within the scheme that took place with effect from 1 January 2019.
Past service cost - £5.5m. This relates to provisions for the additional costs required by UMSS and GMPF of meeting the Guaranteed Minimum Pensions (GMP) indexation and for GMPF the cost of meeting the McCloud judgement. Further details are set out in notes 25 (d) and (e).

55FINANCIAL STATEMENTS
7 Staff costs (continued) Consolidated University
2019 2018 2019 2018 No. No. No. No.
Average staff numbers:
Academic 2,723 2,688 2,723 2,688
Research 1,931 1,964 1,931 1,964
Administrative and management 1,667 1,563 1,533 1,422
Clerical and secretarial 2,021 1,909 1,994 1,873
Technical 2,386 2,333 2,206 2,147
Total number of staff 10,728 10,457 10,387 10,094
The number of staff disclosed relate to full time equivalents.
The basic salary of higher paid staff (other than the President and Vice-Chancellor), excluding employer’s pension contributions, was within the ranges set out below. Basic salary is prior to any adjustment for salary sacrifice and excludes market supplements, allowances, clinical excellence awards and any other one-off payments. Payments made on behalf of the NHS in respect of its contractual obligations to University staff under separate NHS contracts of employment are not included within this calculation. Of these staff, 13 staff held clinical roles in 2018/19 (2017/18: 9 staff (restated)). In addition for academics and other staff whose salary is partly funded by another body (e.g. research councils or other grant awarders), the basic salary is the amount paid by or charged to the University.
The number of higher paid staff has increased for a number of reasons including promotion, increments and pay awards.
Consolidated University
2019 2018 2019 2018 Average FTE Average FTE Average FTE Average FTE Number of Number of Number of Number of Employees Employees Employees Employees
£100,001 - £105,000 42 27 41 26£105,001 - £110,000 47 44 46 44£110,001 - £115,000 23 9 23 9£115,001 - £120,000 7 9 7 9£120,001 - £125,000 6 3 5 3£125,001 - £130,000 6 4 6 2£130,001 - £135,000 6 9 6 8£135,001 - £140,000 7 3 7 3£140,001 - £145,000 5 2 5 2£145,001 - £150,000 3 3 3 3£150,001 - £155,000 2 1 2 1£155,001 - £160,000 - 3 - 2£160,001 - £165,000 - 3 - 3£165,001 - £170,000 6 1 4 1£170,001 - £175,000 1 1 1 1£175,001 - £180,000 1 2 1 2£185,001 - £190,000 2 2 2 2£190,001 - £195,000 - 2 - 2£195,001 - £200,000 2 - 2 - £200,001 - £205,000 - 1 - 1£205,001 - £210,000 1 1 1 - £210,001 - £215,000 - 1 - 1£215,001 - £220,000 1 - 1 - £230,001 - £235,000 1 1 - - £265,001 - £270,000 - 1 - 1£275,001 - £280,000 1 - 1 - £280,001 - £285,000 - 1 - 1£285,001 - £290,000 1 - 1 -£300,001 - £305,000 1 - 1 -
172 134 166 127

56 FINANCIAL STATEMENTS
Notes to the financial statements (continued)Year ended 31 July 2019
7 Staff costs (continued) Consolidated and University
2019 2018 £’000 £’000
Emoluments of the President and Vice-Chancellor:
Salary 260 260
Supplement in lieu of employer pension contributions (ceased 31 August 2017) - 3
Benefits 1 4
Pension contributions to USS in respect of 2.1% enhanced opt-out 5 5
266 272
The benefits received by the President and Vice-Chancellor comprise private medical healthcare cover solely for herself. In 2018 benefits also included the taxable benefit in kind in relation to accommodation provided which the President and Vice-Chancellor vacated in February 2018.
The pension contributions to USS in respect of 2.1% enhanced opt-out is an employer obligation with no benefit to the employee.
Information regarding the justification for the President and Vice-Chancellor’s remuneration can be found within the Remuneration Committee Report on page 28.
The Chair of the Board of Governors and Pro-Chancellor for 2018/19 has waived his right to fees in respect of the current and prior year.
Termination payments totalling £299k (2018: £342k) were paid to three (2018: two) individuals whose annual remuneration exceeded £100,000.
The President and Vice-Chancellor’s basic salary is 8.08 times the median pay of staff (£32,236) where the median pay is calculated on a full-time equivalent basis for the salaries paid by the University to its staff, including atypical staff (as defined by HESA). Excluding atypical staff her salary is 7.40 times the median pay of staff (£35,211). Her total remuneration is 8.28 times the median total remuneration of staff (£32,236) calculated on a full-time equivalent basis including atypical staff. Excluding atypical staff her total remuneration is 7.36 times the median total remuneration of staff (£36,261). The median pay and pay ratios derived exclude agency staff (as these are not on the University payroll system) and fee records (as these do not record FTE numbers).
2019 2018 £’000 £’000
Amount of expenses claimed by members of the Board of Governors during the year 16 10
Number of members of the Board of Governors claiming expenses 6 16
Key management personnel
Key management personnel are the members of the Senior Leadership Team as defined in the Remuneration Report on page 26 and comprising the President and Vice-Chancellor; Deputy President and Vice-Chancellor; the three Faculty Deans; the three Vice-Presidents of Policy (Teaching, Learning and Students; Research; and Social Responsibility); the Registrar, Secretary and Chief Operating Officer; the Director of Finance and the Director of Human Resources.
Compensation paid to key management personnel (including the President and Vice-Chancellor) within the year was as follows:
Consolidated and University
2019 2018 £’000 £’000
Key management personnel 2,126 2,375
The Remuneration Committee report on page 26 sets out more detail in respect of senior staff pay.
8 Analysis of other operating expenses Consolidated University
2019 2018 2019 2018 £’000 £’000 £’000 £’000
Academic and related expenditure 111,496 97,944 118,684 104,921
Central administration and services 105,281 123,508 101,647 120,621
Premises 59,922 67,284 60,299 67,501
Residences, catering and conferences 20,445 20,643 26,404 26,447
Research grants and contracts 79,588 74,052 79,588 74,052
Other expenses 1,942 5,210 1,881 11,563
378,674 388,641 388,503 405,105

57FINANCIAL STATEMENTS
Consolidated
2019 2018 Included within operating expenses are the following costs: £’000 £’000
Fees payable to the University’s auditor for the audit of the University and its 169 195 subsidiaries’ annual accounts
Non-audit fees payable to the University’s auditor - 7
Total fees 169 202
The disclosures above are for the Group. The University is not required, in its individual financial statements, to disclose separately information about fees for non-audit services provided to the University. Lease payments recognised as an expense in the year amounted to £18.3m for the group (2018: £17.5m)In 2019 certain costs are now reported as Academic and related expenditure as opposed to Central administration and services in 2018.
9 Interest and other finance costs Consolidated University
2019 2018 2019 2018 £’000 £’000 £’000 £’000
Bank loans 807 658 807 658
Other loans 17,790 17,791 17,790 17,790
Interest on net defined pension liability (see notes 25 (d) and (e)) 3,209 4,949 3,209 4,949
Unwinding of USS pension deficit funding 1,795 1,731 1,795 1,730
23,601 25,129 23,601 25,127
10 Taxation Consolidated University
2019 2018 2019 2018 £’000 £’000 £’000 £’000
Recognised in the Statement of comprehensive income
Current tax
Current tax (202) 31 (202) 31
Foreign tax (9) (71) - -
Current tax (credit) / expense (211) (40) (202) 31
Deferred tax
Origination and reversal of timing differences 15 (87) - -
Deferred tax expense 15 (87) - -
Total tax (credit) / expense (196) (127) (202) 31
Tax paid in year 29 - - -
Factors affecting the tax charge:
The tax assessed for the year is lower than the standard rate of corporation tax in the UK. The difference is explained below:
Consolidated University
2019 2018 2019 2018 £’000 £’000 £’000 £’000
(Deficit)/surplus before taxation (75,441) 42,932 (76,105) 36,807
Surplus multiplied by the standard rate of corporation tax in the UK of 19% (2018: 19%) (14,334) 8,157 (14,460) 6,993
Effect of:
Surplus falling within charitable exemption 14,460 (8,083) 14,460 (6,962)
Museum and galleries tax credit claim (202) - (202) -
Other differences attributable to subsidiaries and associates (135) (114) - -
Deferred tax movement 15 (87) - -
Total tax expense (196) (127) (202) 31

58 FINANCIAL STATEMENTS
Notes to the financial statements (continued)Year ended 31 July 2019
10 Taxation (continued)
The University is an exempt charity within the meaning of Part 3 of the Charities Act 2011. It is therefore a charity within the meaning of Paragraph 1 of Schedule 6 to the Finance Act 2010 and accordingly, the University is potentially exempt from UK Corporation Tax in respect of income or capital gains received within categories covered by Sections 478-488 of the Corporation Tax Act 2010 (CTA 2010) or Section 256 of the Taxation of Chargeable Gains Act 1992, to the extent that such income or gains are applied to exclusively charitable purposes.
11 Intangible assets and goodwill Consolidated University
2019 2018 2019 2018 £’000 £’000 £’000 £’000
Cost
At 1 August 2018 10,513 6,192 11,013 6,149
Assets transferred to other operating expenditure - (55) - (55)
Additions at cost 9,468 6,029 9,468 6,572
Disposals - (1,653) - (1,653)
At 31 July 2019 19,981 10,513 20,481 11,013
Depreciation and amortisation
At 1 August 2018 3,210 3,602 3,276 3,559
Amortisation 1,062 1,262 1,170 1,371
Disposals - (1,654) - (1,654)
At 31 July 2019 4,272 3,210 4,446 3,276
Net book value
At 31 July 2019 15,709 7,303 16,035 7,737
At 1 August 2018 7,303 2,590 7,737 2,590
The amortisation period is 5 years.
12 Tangible fixed assets
Freehold land Lease Assets under Fixtures, fittings, Total and buildings premium construction tools and equipment (a) Consolidated £’000 £’000 £’000 £’000 £’000
Cost At 1 August 2018 1,428,796 - 332,936 302,953 2,064,685
Transferred to other operating expenditure - - (1,237) (23) (1,260)
Additions at cost 8,274 - 283,124 5,160 296,558
Transfers between categories 157,196 - (173,227) 16,031 -
Disposals - - - (2,747) (2,747)
At 31 July 2019 1,594,266 - 441,596 321,374 2,357,236
Depreciation At 1 August 2018 153,768 - - 254,386 408,154
Charge for the year 51,538 - - 25,132 76,670
Disposals - - - (2,747) (2,747)
At 31 July 2019 205,306 - - 276,771 482,077
Net book value At 31 July 2019 1,388,960 - 441,596 44,603 1,875,159
At 1 August 2018 1,275,028 - 332,936 48,567 1,656,531

59FINANCIAL STATEMENTS
12 Tangible fixed assets (continued)
Freehold land Lease Assets under Fixtures, fittings, Total and buildings premium construction tools and equipment (b) University £’000 £’000 £’000 £’000 £’000
Cost At 1 August 2018 1,387,374 5,400 332,936 296,733 2,022,443
Transferred to other operating expenditure - - (1,237) - (1,237)
Additions at cost 8,274 - 283,124 4,442 295,840
Transfers between categories 157,196 - (173,227) 16,031 -
Disposals - - - (2,747) (2,747)
At 31 July 2019 1,552,844 5,400 441,596 314,459 2,314,299
Depreciation
At 1 August 2018 151,002 1,480 - 250,542 403,024
Charge for the year 50,774 73 - 24,784 75,631
Disposals - - - (2,747) (2,747)
At 31 July 2019 201,776 1,553 - 272,579 475,908
Net book value
At 31 July 2019 1,351,068 3,847 441,596 41,880 1,838,391
At 1 August 2018 1,236,372 3,920 332,936 46,191 1,619,419
The University and its subsidiaries revalued some of its land and buildings on a fair value basis as at 31 July 2014, taking advantage of the transitional provisions of FRS 102 section 35.10. The University appointed Gerald Eve LLP, an independent external valuer which is regulated by the Royal Institution of Chartered Surveyors. The valuation was performed in accordance with the RICS Valuation – Professional Standards April 2015. In accordance with the FRS 102 transitional provisions these revised values are now used as the deemed cost of certain land and buildings going forward.
At 31 July 2019, freehold land and buildings included £217.0m (2018: £217.0m) in respect of freehold land which is not depreciated.
The gain on disposal of fixed assets for the year ended 31 July 2019 was £12.6m (2018 : £0.3m). The gain in the year comprises an “overage” receipt of £8.4m and £4.2m insurance proceeds in relation to the 2017 Paterson fire. The overage receipt is an additional payment made to the University as a result of an increase in property value post sale completion.
13 Heritage assets
The University revalued some of its heritage assets on a fair value basis as at 31 July 2014, taking advantage of the transitional provisions of FRS 102 section 35.10. The University appointed Sothebys, an independent external valuer. In accordance with the FRS 102 transitional provisions these revised values are now used as the deemed cost of certain heritage assets going forward. Heritage assets held at cost or valuation are not depreciated due to their indefinite life and high residual value.
Consolidated and University
Cost £’000
At 1st August 2018 257,239
Additions 300
At 31st July 2019 257,539
The University also holds heritage assets that are not capitalised as, due to their unique nature, reliable information on cost or valuation is not readily available on a cost-benefit basis. This is owing to the lack of information on original purchase cost and the fact that these assets are not readily realisable. All costs incurred in relation to preservation and conservation are expensed as incurred. Key heritage assets held by the University fall into the categories detailed on the following page. Their total value for insurance purposes is £1.4bn.

60 FINANCIAL STATEMENTS
Notes to the financial statements (continued)Year ended 31 July 2019
13 Heritage assets (continued)
Whitworth Art Gallery
Whitworth Art Gallery houses and displays collections including flat textiles ranging from 3rd Century AD to the present day; 17th century to modern day wallpapers; selections of prints, pre-1880 watercolours and modern art and sculpture collections.
Manchester Museum
The Manchester Museum houses and displays various artefacts and fossils, in particular it has a substantial collection of ancient Egyptian artefacts as part of its archaeology collection. It also houses and displays collections in the fields of botany, anthropology and palaeontology as well as collections of rocks and minerals for example.
John Rylands Library Deansgate
John Rylands Library at Deansgate, Manchester is a Grade 1 listed building from the late 1800s styled in Victorian Gothic architecture. The building also houses and displays a rare collection of more than a million ancient books and manuscripts, including the oldest known piece of the New Testament, first editions by William Shakespeare and medieval manuscripts.
Jodrell Bank
The University owns the 76 metre Lovell telescope sited at Jodrell Bank in Cheshire and a UNESCO World Heritage Site. It was built in 1957, is a grade 1 listed building and remains one of the most powerful radio telescopes in the world. It is still in operation as a working telescope.
Tabley House
The University also owns Tabley House, an 18th century Palladian mansion in Cheshire. The house is let on a long-lease of 125 years to a third party. Part of the house is open to the public and houses and displays various painting and furniture collections from that era.
Policy for management, preservation, acquisition and disposal of assets
The collections are managed by dedicated directors at each site. They are supported by a team of highly skilled and experienced curators who have responsibility over specialised areas of the collections.
The condition of the assets is maintained through a programme of effective collection care to reduce damage and deterioriation by reducing risk from physical damage (including handling), theft and vandalism, fire and water/flood, inappropriate relative humidity and temperature, light, pollutants and museum pests. A rolling programme of remedial conservation is ongoing to stabilise assets which may be deteriorating over time.
Further information on the University’s policies regarding conservation, preservation, management and disposal of heritage assets can be found on the University’s website www.manchester.ac.uk/discover/open-public.
Each site maintains extensive databases which itemise the assets held, and online databases of the assets held at The Manchester Museum, The Whitworth Art Gallery and John Rylands Library are freely available to the general public.
For more details of the collection held at:
The Manchester Museum please see www.museum.manchester.ac.uk/collection
The John Rylands Library please see www.library.manchester.ac.uk/search-resources/guide-to-special-collections
The Whitworth Art Gallery please see www.whitworth.manchester.ac.uk/collection
Public access to the collections is delivered in a variety of ways:
Gallery displays and a combination of permanent and temporary exhibitions at each site.
Education and outreach activities such as school trips.
Access by researchers and interested groups/individuals by arrangement.
Loans out to UK and international museums and galleries, or other venues.
The directors at each site, in partnership with their curators, are responsible for the identification and purchase of further items to further enhance the cultural value of the collections to both students and the wider general public.

61FINANCIAL STATEMENTS
14 Non current investments Consolidated University
2019 2018 2019 2018 Analysis of closing balance £’000 £’000 £’000 £’000
Interest in subsidiary undertakings (14a) - - 718 241
Investment properties (14b) 3,811 6,911 3,811 6,911
Investments carried at fair value through the Statement of Comprehensive Income (14c) 271,003 318,093 267,644 314,822
Investments carried at amortised cost (14d) - 25,000 - 25,000
Investments held at cost less impairment (14e) 118 118 118 118
274,932 350,122 272,291 347,092
Movement in year
Investment in Investments Investments Investments Total subsidiary Investment carried at carried at held at cost less undertakings properties fair value amortised cost impairmentConsolidated £’000 £’000 £’000 £’000 £’000 £’000
At 1 August 2018 - 6,911 318,093 25,000 118 350,122
Additions - - - - 1,221 1,221
Disposals - (3,100) (51,398) (25,000) - (79,498)
Net appreciation of investment portfolio and - - 4,308 - - 4,308
other listed investments
Impairment provision in the year - - - - (1,221) (1,221)
At 31 July 2019 - 3,811 271,003 - 118 274,932
University £’000 £’000 £’000 £’000 £’000 £’000
At 1 August 2018 241 6,911 314,822 25,000 118 347,092
Additions 477 - - - 1,221 1,698
Disposals - (3,100) (51,398) (25,000) - (79,498)
Net appreciation of investment portfolio - - 4,220 - - 4,220
Impairment provision in the year - - - - (1,221) (1,221)
At 31 July 2019 718 3,811 267,644 - 118 272,291

62 FINANCIAL STATEMENTS
Notes to the financial statements (continued)Year ended 31 July 2019
14 Non current investments (continued)
(a) Interests in subsidiary undertakings
At year end, investments in subsidiary undertakings after provisions comprise:
Group University Holding 2019 2018 Description % £ £
Graphene Enabled Systems Limited 100 - - Assisting the commercialisation of Graphene through Spin out companies
Manchester Innovation Limited 100 - - Construction of a biotech incubator building
The University of Manchester Innovation Centre Limited 100 50,000 50,000 Owns and operated a biotech incubator building
UMIST Ventures Limited 100 1 1 Provision of staff to sister companies, now dormant
The University of Manchester I3 Limited 100 50,000 50,000 Management of intellectual property
UMIP UPF Limited 100 10,000 10,000 Investment in the UMIP Premier Fund
The University of Manchester Conferences Limited 100 2 2 Management of conference and catering facilities
The University of Manchester Car Parks Limited 100 2 2 Maintenance and running of car park facilities
The University of Manchester Licensing Company Limited 100 1,000 1,000 Dormant
Vumpine Limited 50 50 50 Dormant
UMSS Limited 100 2 2 To undertake the duty of trustee of UMSS
The University of Manchester Worldwide Limited 100 601,288 124,288 Holding company
The University of Manchester Worldwide (Shanghai) 100 - - Consultancy and management services
Manchester Business School America Inc 100 - - Dormant
Manchester Worldwide Institute of Higher Education 100 - - Provision of distance learning (South Esat Asia) Pte Ltd
UoM Singapore PTE Ltd 100 5,260 5,260 Dissolved 4 September 2019
The University of Manchester (CLG) 100 - - Dormant
Owens College (CLG) 100 - - Dormant
Owens College Manchester (CLG) 100 - - Dormant
Manchester University (CLG) 100 - - Dormant
UMIST (CLG) 100 - - Dormant
717,605 240,605
Certain subsidiary undertakings above are shown as having nil cost of investment. In each case these are either indirectly owned as indicated, are limited by guarantee (‘CLG’) or are trusts.
Where applicable, the ‘group holding’ is equivalent to the proportion of voting rights and shares held.
All the subsidiary undertakings are incorporated in England and Wales, with the exception of UoM Singapore PTE Ltd and the subsidiaries of The University of Manchester Worldwide Limited.
All subsidiary undertakings prepare statutory accounts to the same year end date as the University.
(b) Investment properties
The investment properties totalling £3.8m (2018: £6.9m) were revalued on an open market basis as at 31 July 2015 by an external valuer, Edward Symmons LLP which is regulated by the Royal Institution of Chartered Surveyors. The valuation was performed in accordance with the RICS Valuation - Professional Standards 2014. This valuation has been updated as at 31 July 2019 by senior management at the University and there is currently no change in valuation. In 2018 Investment properties included £3.1m relating to a lease premium for the long leasehold of the Precinct land which was receivable upon completion of the Alliance Manchester Business School development. During the year practical completion took place and £3.1m was received in consideration for the lease , therefore this is no longer held as an investment property. As at 31 July 2019 the value of investment properties totals £3.8m.

63FINANCIAL STATEMENTS
Consolidated University
2019 2018 2019 2018 (c) Investments carried at fair value £’000 £’000 £’000 £’000
Listed investments 267,644 314,822 267,644 314,822
Other investments 3,359 3,271 - -
271,003 318,093 267,644 314,822
(d) Investments carried at amortised cost
Long-term cash deposits and uninvested bank balances - 25,000 - 25,000
- 25,000 - 25,000
(e) Investments carried at cost less impairment
Other investments 118 118 118 118
118 118 118 118
15 Investments in associates Consolidated University
2019 2018 2019 2018 Analysis of closing balance £’000 £’000 £’000 £’000
At 1 August 2018 7,296 7,923 308 1,109
Share of profits 2,706 174 - -
Provision against investments (308) (801) (308) (801)
At 31 July 2019 9,694 7,296 - 308
The Group had the following associated undertakings as at 31 July 2019:
Proportion Share of net Share of net held by the assets assets Class of share University 2019 2018 capital held and Group £’000 £’000
Name of associate Manchester Science Partnerships Limited £1 ordinary 12.2% 9,694 6,987
Financial year end 31 December
North West EHealth Ltd £1 ordinary 40% - 309
Financial year end 31 December
9,694 7,296
The associated companies are accounted for using the equity method. All associated companies were incorporated in the United Kingdom.

64 FINANCIAL STATEMENTS
Notes to the financial statements (continued)Year ended 31 July 2019
16 Trade and other receivables Consolidated University
2019 2018 2019 2018 £’000 £’000 £’000 £’000
Trade receivables 49,071 45,348 48,331 44,716
Other receivables 10,909 3,472 10,115 2,745
Accrued income on research grants and contracts 27,557 33,106 27,557 33,050
Prepayments and other accrued income 30,426 32,929 29,630 32,525
Amounts due from subsidiary companies - - 13,362 12,698
117,963 114,855 128,995 125,734
Included within the University balance above is £9.1m (2018: £9.6m) relating to debtors due in over 1 year. There are no debtors due in over one year on a consolidated basis in both the current and prior year.
17 Current investments Consolidated University
2019 2018 2019 2018 £’000 £’000 £’000 £’000
Deposits maturing:
Between three months and one year 155,000 255,000 155,000 255,000
Deposits are held with banks and building societies operating in the London market and licensed by the Financial Services Authority with more than three months maturity at the balance sheet date. The interest rates for these deposits are fixed for the duration of the deposit at time of placement.
At 31 July 2019 the weighted average interest rate of these fixed rate deposits was 1.05% per annum (2018: 1.06%) and the remaining weighted average period for which the interest rate is fixed on these deposits was 117 days (2018: 185 days). The fair value of these deposits was not materially different from the book value.
18 Payables: amounts falling due within one year Consolidated University
2019 2018 2019 2018 £’000 £’000 £’000 £’000
Bank and other loans (note 20) - 3,998 - 3,998
Trade payables 33,716 51,723 32,919 50,886
Social security and other taxation payable 13,504 13,032 12,908 12,388
Amounts owed to group undertakings - - 1,141 1,512
Other payables 39,841 30,355 39,432 29,883
Deferred income on research 110,953 121,215 110,953 121,349
Accruals and other deferred income 150,217 142,598 148,897 140,610
348,231 362,921 346,250 360,626
Accruals and deferred income includes an amount of £1.25m (2018 : £1m) in respect of the Alan Turing Institute, which is a commitment that the University has entered into over 5 years. The Institute is required to spend the funds for the purposes for which they were awarded.

65FINANCIAL STATEMENTS
19 Payables: amounts falling due after more than one year Consolidated University
2019 2018 2019 2018 £’000 £’000 £’000 £’000
Bank loans - 6,282 - 6,282
Other loans 393,484 393,383 393,484 393,383
Other payables 4,128 5,055 4,128 5,055
397,612 404,720 397,612 404,720
Accruals and deferred income includes an amount of £2.75m (2018 : £3.5m) in respect of the Alan Turing Institute, which is a commitment that the University has entered into over 5 years. The Institute is required to spend the funds for the purposes for which it has been awarded.
20 Borrowings Consolidated University
2019 2018 2019 2018 Unsecured borrowings at amortised cost: £’000 £’000 £’000 £’000
Bond 293,961 293,871 293,961 293,871
Bank loans - 10,280 - 10,280
Other loans 99,523 99,512 99,523 99,512
393,484 403,663 393,484 403,663
Analysis of unsecured loans:
Due within one year or on demand - 3,998 - 3,998
Due between one and two years - 3,057 - 3,057
Due between two and five years - 3,225 - 3,225
Due in five years or more 393,484 393,383 393,484 393,383
393,484 403,663 393,484 403,663
BondIn July 2013 an unsecured fixed rate public bond was issued for the sum of £300 million over a 40 year term with a coupon rate of 4.25%. It is listed on the London Stock Exchange. There are no capital payments to be made over the term, with the bond maturing in 2053.
The bond transaction costs of £7.5m are amortised over the life of the bond and charged to interest costs.
The University may, at its option, redeem some or all of the bond at the Redemption Price together with interest accrued to the date of redemption. The ‘Redemption Price’ shall be the higher of (a) the principal amount of the bond to be redeemed and (b) the product of the principal amount of the bond to be redeemed and the sum of the Gross Redemption Yield (4.25% Treasury Stocks due December 2055) and 0.15%.
Unsecured bank and other loansOther loan with an interest rate of 5.04%, repayable by one repayment and falling due in 2046 which totals £99.5m (2018: £99.5m).

66 FINANCIAL STATEMENTS
Notes to the financial statements (continued)Year ended 31 July 2019
21 Provisions for liabilities
(a) Consolidated Obligation to Defined benefit Total Other Deferred Total fund deficit on obligations pensions provisions tax USS pension (Note 25) provisions £’000 £’000 £’000 £’000 £’000 £’000
Balance at 1 August 2018 83,090 138,579 221,669 2,969 597 225,235
Movement during the year (4,016) (29,576) (33,592) 1,928 - (31,664)
Charged to the Statement of Comprehensive Income 169,295 40,561 209,856 - 15 209,871
Balance at 31 July 2019 248,369 149,564 397,933 4,897 612 403,442
(b) University Obligation to Defined benefit Total Other Deferred Total fund deficit on obligations pensions provisions tax USS pension (Note 25) provisions £’000 £’000 £’000 £’000 £’000 £’000
Balance at 1 August 2018 83,087 138,579 221,666 2,969 - 224,635 Utilised during the year (4,016) (29,576) (33,592) 1,928 - (31,664)
Charged to the Statement of Comprehensive Income 169,298 40,561 209,859 - - 209,859
Balance at 31 July 2019 248,369 149,564 397,933 4,897 - 402,830
The obligation to fund the past deficit on the Universities Superannuation Scheme (USS) arises from the contractual obligation with the USS to fund deficit payments in accordance with the deficit recovery plan. In calculating this provision, management have estimated future staff levels within the USS scheme for the duration of the contractual obligation and salary inflation. Key assumptions are set out below and further information is provided in note 25(a).
The adoption of the new deficit recovery plan following the 2017 actuarial valuation has given rise to a significant increase in the deficit provision which has increased from £83.1 million to £248.4 million. £165.1 million of this increase is attributable to the change in the deficit contributions contractual commitment. See also note 7 in respect of significant one-off pension costs / gains. More details on the 2017 actuarial valuation are set out in note 25 (a).
Since the year end, following the completion of the 2018 actuarial valuation, a new deficit recovery plan has been agreed of which more detail is given in note 25 (a). As at 31 July 2019 and with all other assumptions used to calculate the provision unchanged, this would have resulted in a revised provision of £138.6m, a decrease of £109.8m from the current year end provision.
The major assumptions used to calculate the obligation are: 2019 2018
Discount rate 1.58% 2.16%
Salary growth 3.40% for the first year and 3.40% for the next two years then 3.65% thereafter and then 3.65% thereafter
Sensitivity analysisAs set out in the accounting policies, there are some critical judgements made in estimating the obligation to fund the USS deficit. The sensitivity of the principal assumptions used to measure the USS deficit provision are set out below:
Change in assumptions at 31 July 2019 Approximate impact
0.5% pa decrease in discount rate £11.0m
0.5% pa increase in salary inflation over duration £10.7m
0.5% pa increase in salary inflation year 1 only £1.2m
0.5% increase in staff changes over duration £11.1m
0.5% increase in staff changes year 1 only £1.2m
1% increase in deficit contributions £48.6m
Other provisions
Other provisions comprises dilapidations for buildings.

67FINANCIAL STATEMENTS
21 Provisions for liabilities (continued)
Deferred tax (Consolidated) 2019 2018 £’000 £’000
Difference between accumulated depreciation and capital allowances 597 430
Other timing differences 15 167
Balance at 31 July 2019 612 597
22 Endowment Reserves (Consolidated and University)
Restricted net assets relating to endowments are as follows: Restricted Unrestricted Expendable permanent permanent endowments 2019 endowments endowments Total £’000 £’000 £’000 £’000
Balances as at 1st August 2018
Capital 155,067 14,670 50,946 220,683
Accumulated income 8,540 - 5,869 14,409
163,607 14,670 56,815 235,092
New endowments 180 63 984 1,227
Reclassification of endowments:
Capital (7,465) - 6,047 (1,418)
Accumulated income (1,180) - 888 (292)
Investment income 2,363 220 1,037 3,620
Expenditure from capital and income (1,337) (220) (4,689) (6,246)
(7,439) 63 4,267 (3,109)
Increase in market value of investments 4,229 337 1,842 6,408
At 31st July 2019 160,397 15,070 62,924 238,391
Represented by:Capital 152,012 15,070 58,700 225,782 Accumulated income 8,385 - 4,224 12,609 160,397 15,070 62,924 238,391
The following assets are currently held relating to endowments:
Non current asset investments held at fair value
Investments 110,935 10,998 42,841 164,774 Property 16,819 1,667 6,494 24,980 Cash 32,643 2,405 13,589 48,637 160,397 15,070 62,924 238,391

68 FINANCIAL STATEMENTS
Notes to the financial statements (continued)Year ended 31 July 2019
22 Endowment Reserves (continued)
Major endowments
There are no charitable funds that are over 5% of net assets. Set out below are details of material charitable funds:
Capital Value Opening Dividend Expenditure Endowment Closing at 31 July 2019 accumulated income from transfers Accumulated income income Income £’000 £’000 £’000 £’000 £’000 £’000
Significant funds and charities which are over 1% of net assets
Hallsworth Fund 31,484 351 502 (203) - 650
Simon Fund 17,401 149 277 9 - 435
Funds and charities which are less than 1% of net assets
Fellowships and scholarships (30 funds) 29,829 1,507 475 (333) - 1,649
Prize funds (7 funds) 2,790 193 45 - - 238
Chairs and lectureships (15 funds) 44,712 1,128 718 (469) - 1,377
Other (63 funds) 99,566 11,081 1,602 (4,215) (208) 8,260
225,782 14,409 3,619 (5,211) (208) 12,609
Endowment Funds (continued)The University has one connected institution which, under paragraph 28 of Schedule 3 to the Charities Act 2011, is exempt from registration with the Charity Commission. This connected institution is the Friends of the Whitworth and its income is less than £100,000 per annum.
All endowment capital is invested through investment managers.
Hallsworth FundThis restricted permanent endowment is to assist and advance the study of Political Economy by the establishment of Research Fellowships and Visiting Professorships. It also provides resources to assist projects of research in Political Economy and the publication of books and documents in that field. The original governing document of this endowment was altered by the Charity Commission in 1998. The management and administration of this Fund is run by the Hallsworth Committee which is appointed as trustee by the Board of Governors.
Simon FundThis restricted permanent endowment, operated by the Simon Fund Committee, primarily funds the appointment of Fellowships and Visiting Professorships in the field of Social Sciences, Professorial Industrial and Professorial Fellowships, Engineering Research Scholarships and a grant for entertainment to academic departments and Halls of Residence. Its purpose is also to promote research and teaching in the Social Sciences and a substantial portion of the income is to be used for Senior Fellowships. It also funds various ad hoc projects approved by the Simon Fund Committee.
23 Restricted Reserves (Consolidated and University)
Reserves with restrictions are as follows: Capital Grants Other Restricted 2019 Unspent Funds/Donations Total £’000 £’000 £’000
Balance as at 1st August 2018 40,040 94 40,134
New grants 54,535 - 54,535
Capital grants utilised (10,516) - (10,516)
Expenditure - (69) (69)
Balance as at 31st July 2019 84,059 25 84,084

69FINANCIAL STATEMENTS
24 Financial Instruments Consolidated University
Categories of financial instruments 2019 2018 2019 2018 £’000 £’000 £’000 £’000
Financial assets
Financial assets at fair value through Statement of Consolidated Income
Listed investments 267,644 314,822 267,644 314,822
Other investments 3,358 3,270 - -
Financial assets that are equity instruments measured at cost less impairment
Other investments 118 118 118 118
Financial assets that are debt instruments measured at amortised cost
Loan notes - 25,000 - 25,000
Trade and other receivables 59,980 48,820 71,808 60,159
331,100 392,030 339,570 400,099
Financial liabilities measured at amortised cost
Loans 393,484 403,663 393,484 403,663
Trade and other payables 77,685 87,133 77,620 87,336
471,169 490,796 471,104 490,999
25 Pension schemes
Different categories of staff were eligible to join one of five different schemes:
• Universities Superannuation Scheme (USS)
• University of Manchester Superannuation Scheme (UMSS)
• Greater Manchester Pension Fund (GMPF)
• National Health Service Pension Scheme (NHSPS)
• University of Manchester Pension Saver (UoMPS), with effect from 1 January 2019
According to the requirements of FRS102 (28), the net pension costs within the year, and movement within the pension schemes in the year are as follows:
Consolidated University
Statement of Comprehensive Income - net pension cost in year 2019 2018 2019 2018 £’000 £’000 £’000 £’000
USS 74,725 60,553 73,384 59,182
UMSS 22,735 27,208 22,735 27,208
GMPF 1,144 1,399 1,144 1,399
NHSPS 2,693 2,455 2,693 2,455
University of Manchester Pension Saver 937 - 875 -
Other 22 11 22 11
Pension costs within staff costs (note 7) 102,256 91,626 100,853 90,255
USS - change in USS deficit recovery plan 165,100 - 165,100 -
UMSS curtailment gain (27,267) - (27,267) -
Past service cost re GMP and McCloud 5,462 - 5,462 -
Pension costs shown separately on the face of the Statement of Comprehensive Income 143,295 - 143,295 -
Total pension costs 245,551 91,626 244,148 90,255

70 FINANCIAL STATEMENTS
Notes to the financial statements (continued)Year ended 31 July 2019
25 Pension schemes (continued) Consolidated University
Other comprehensive income - actuarial gain in respect of pension schemes 2019 2018 2019 2018 £’000 £’000 £’000 £’000
University of Manchester Superannuation Scheme (30,392) 48,803 (30,392) 48,803
Greater Manchester Pension Fund (4,886) 10,363 (4,886) 10,363
(35,278) 59,166 (35,278) 59,166
Balance sheet - Pension scheme deficits (note 21) 2019 2018 2019 2018 £’000 £’000 £’000 £’000
University of Manchester Superannuation Scheme (137,964) (132,783) (137,964) (132,783)
Greater Manchester Pension Fund (11,600) (5,796) (11,600) (5,796)
(149,564) (138,579) (149,564) (138,579)
(a) The Universities Superannuation Scheme
The institution participates in Universities Superannuation Scheme (USS) which is the main scheme covering most academic and academic-related staff. The Scheme is a hybrid pension scheme, providing defined benefits (for all members), as well as defined contribution benefits. The assets of the scheme are held in a separate trustee-administered fund.
Because of the mutual nature of the scheme, the assets are not attributed to individual institutions and a scheme-wide contribution rate is set. The institution is therefore exposed to actuarial risks associated with other institutions’ employees and is unable to identify its share of the underlying assets and liabilities of the scheme on a consistent and reasonable basis. As required by Section 28 of FRS 102 “Employee Benefits”, the institution therefore accounts for the scheme as if it were a wholly defined contribution scheme. As a result, the amount charged to the Consolidated Statement of Comprehensive Income represents the contributions payable to the scheme. Since the institution has entered into an agreement (the Recovery Plan) that determines how each employer within the scheme will fund the overall deficit, the institution recognises a liability for the contributions payable that arise from the agreement (to the extent that they relate to the deficit) and therefore an expense is recognised.
The total cost charged to the Consolidated Statement of Comprehensive Income is £74,725,000 (2018: £60,553,000) including PensionChoice, but excluding the impact of the change in the deficit recovery plan, as shown in note 25.
The latest available complete actuarial valuation of the Retirement Income Builder section of the Scheme is at 31 March 2017 (“the valuation date”), which was carried out using the projected unit method. A valuation as at 31 March 2018 is underway but not yet complete.
Since the institution cannot identify its share of Retirement Income Builder section of the scheme assets and liabilities, the following disclosures reflect those relevant for the section as a whole.
The 2017 valuation was the fourth valuation for USS under the scheme-specific funding regime introduced by the Pensions Act 2004, which requires schemes to adopt a statutory funding objective, which is to have sufficient and appropriate assets to cover their technical provisions. At the valuation date, the value of the assets of the scheme was £60.0 billion and the value of the scheme’s technical provisions was £67.5 billion indicating a shortfall of £7.5 billion and a funding ratio of 89%.
The key financial assumptions used in the 2017 valuation are described below. More detail is set out in the Statement of Funding Principles.
Discount rate (forward rates) “Years 1-10: CPI - 0.53% reducing linearly to CPI - 1.32% Years 11-20: CPI + 2.56% reducing linearly to CPI + 1.7% by year 21 Years 21 +: CPI + 1.7%”
Pension increase (CPI) Term dependent rates in line with the difference between the Fixed Interest and Index Linked yield curves, less 1.3% p.a.
The main demographic assumption used relates to the mortality assumptions. These assumptions are based on analysis of the scheme’s experience carried out as part of the 2017 actuarial valuation. The mortality assumptions used in these figures are as follows:
2017 valuationMortality base table Pre-retirement: 71% of AMC00 (duration 0) for males and 112% of AFC00 (duration 0) for females. Post-retirement: 96.5% of SAPS S1NMA “light” for males and 101.3% of RFV00 for females.
Future improvements to mortality CMI_2016 with a smoothing parameter of 8.5 and a long term improvement rate of 1.8% pa for males and 1.6% pa for females.

71FINANCIAL STATEMENTS
The current life expectancies on retirement at age 65 are: 2019 2018
Males currently aged 65 (years) 24.6 24.5
Females currently aged 65 (years) 26.1 26.0
Males currently aged 45 (years) 26.6 26.5
Females currently aged 45 (years) 27.9 27.8
The funding position of the scheme has since been updated on an FRS 102 basis:
2019 2018
Scheme assets £67.4bn £63.6bn
Total scheme liabilities £79.2bn £72.0bn
FRS 102 total scheme deficit £11.8bn £8.4bn
FRS 102 total funding level 85% 88%
Key assumptions used are: 2019 2018
Discount rate 2.44% 2.64%
Pensionable salary growth n/a n/a
Pension increases (CPI) 2.11% 2.02%
A new deficit recovery plan was put in place as part of the 2017 valuation and is set out in the new Schedule of Contributions dated 28 January 2019. This requires payment of 5% of salaries over the period 1 April 2020 to 30 June 2034. In accordance with the requirements of FRS 102 and the SORP, the University has made a provision for this contractual commitment to fund the past deficit. In the prior year, the deficit payments were 2.1% of salaries up to March 2031.
This significant increase in deficit contributions has given rise to a substantial increase in the deficit provision which has increased from £83.1 million to £248.4 million as set out in note 21. £165.1 million of this increase is attributable to the change in the deficit contributions contractual commitment. See also note 7 in respect of significant one-off pension costs / gains.
The 2018 actuarial valuation was finalised after the year end which indicated a shortfall of £3.6 billion and a funding ratio of 95%.
Since the year end, following the completion of the 2018 actuarial valuation, a new deficit recovery plan has been agreed. This amends the existing deficit recovery plan as set out in the 2017 valuation Schedule of Contributions. This new plan requires deficit payments of 2% of salaries from 1 October 2019 to 30 September 2021 and then payments of 6% of salaries from 1 October 2021 to 31 March 2028. As at 31 July 2019 and with all other assumptions used to calculate the provision unchanged, this would have resulted in a revised provision of £138.6m, a decrease of £109.8m from the current year end provision. As set out on page 12 and 13, if this lower provision had been used, the University’s consolidated deficit for the year of £75.2m would have been a surplus of £34.6m.
(b) NHS Pension Scheme
The University of Manchester also participates in the NHSPS. The notional assets of NHSPS are assessed by the Government Actuary and the benefits are underwritten by the Government.
The NHS Pension Scheme is a defined benefit public service pension scheme, which operates on a pay-as-you-go basis. A new reformed scheme was introduced on 1 April 2015 that calculates pension benefits based on career average earnings. Transitional arrangements permit individuals who on 1 April 2012 were within ten years of normal pension age to continue participating in the old ‘final salary’ NHS Pension Scheme arrangements (the 1995 and 2008 sections).
The scheme is not designed to be run in a way that would enable members to identify their share of the underlying scheme assets and liabilities. Therefore, the scheme is accounted for as if it were a defined contribution scheme: the cost to the NHS Body of participating in the scheme is taken as equal to the contributions payable to the scheme for the accounting period.
An HM Treasury pension scheme valuation for funding purposes was carried out as at March 2016. The Scheme Regulations have been changed to allow contribution rates to be set by the Secretary of State for Health, with the consent of HM Treasury, and consideration of the advice of the Scheme Actuary and appropriate employee and employer representatives as deemed appropriate. The contribution rate payable by the University during the year ended 31 July 2019 was equal to 14.38% of the total pensionable salaries up until end March 2019 with an increase of 1.8% to 16.18% due for the year ended 31 March 2020. With effect from 1 April 2020, employer contributions will increase a further 4.5% to 20.68%. This is in accordance with the conclusion of the Government Actuary’s report on the scheme.
The Supreme Court has refused permission for the Government to appeal the Court of Appeal’s December 2018 judgment in respect of the cases of McCloud and Sargeant. This means that the Court of Appeal’s judgment stands, and that ‘transitional protection’ gave rise to unlawful discrimination in the Judges’ and Firefighters’ schemes. The Government will now be required to introduce a remedy to compensate individuals for the difference in treatment since 2015 in those schemes. The Government is considering the impact of this judgment on transitional protection arrangements in the NHS Pensions.
The total pension cost for the University of Manchester was £2.7m (2018: £2.5m).

72 FINANCIAL STATEMENTS
Notes to the financial statements (continued)Year ended 31 July 2019
25 Pension schemes (continued)
(c) University of Manchester Pension Saver
This is a new Defined Contribution Scheme that was set up with effect from 1 January 2019 following the restructure of the UMSS scheme and its closure to new joiners (see note 25 (d)). The Pension Saver is run by Legal and General as a group personal pension scheme.
All new employees that were previously entitled to join UMSS are now automatically enrolled in the Pension Saver. The default position is that employees pay contributions of 4% of pensionable salary and the University pays 13.5%. Alternatively employees can contribute 0% to 7% and the University will contribute 9.5% to 16.5% dependent upon level of employee contribution.
The total consolidated pension cost for The University of Manchester was £0.9m (2018: £nil).
(d) University of Manchester Superannuation Scheme
UMSS is a defined benefit scheme in the UK. The benefits were restructured with effect from 1 January 2019. The final salary section (1/80th final pensionable salary and 3/80th cash) and the Career Average Revalued Earnings (CARE) section (1/80th and 3/80th cash) were closed on 31 December 2018. All existing UMSS members now receive a defined benefit provision under a new 1/100th pension plus 3/100th cash CARE section with effect from 1 January 2019. The scheme is closed to new joiners, who now join a new defined contribution (DC) scheme called the University of Manchester Pension Saver - see note 25 ( c).
A full actuarial valuation was carried out at 31 July 2016 and this most recent full valuation showed a deficit of £207.4m. The University has agreed with the trustees that it will eliminate the deficit over a period of 17 years and 6 months from 1 August 2017 by the payment of annual contributions of £6.0m per annum, increasing in line with RPI each 1 August until 31 January 2035. With effect from 1 January 2019, the University has agreed to pay contributions at the rate of 26.25% of pensionable pay for CARE members who participate in PensionChoice and 19.75% of pensionable pay for CARE members who do not participate in PensionChoice.
The best estimate of contributions to be paid by the University and its subsidiaries to the scheme for the year commencing 1 August 2019 is £29.4m.
The full actuarial valuation was updated to 31 July 2019 on an FRS 102 (28) basis by a qualified actuary, independent of the scheme’s sponsoring employer. The major assumptions used by the actuary are detailed below:
2019 2018
Discount rate 2.20% 2.70%
Inflation (RPI) 3.25% 3.20%
Inflation (CPI) 2.25% 2.20%
Salary growth 3.40% for the first year 3.40% for the next two years
and then 3.65% thereafter and then 3.65% thereafter
Allowance for revaluation of deferred pensions of RPI or 5% if less 3.25% 3.20%
Allowance for revaluation of deferred pensions of CPI or 5% if less 2.25% 2.20%
Allowance for pension in payment increases of RPI or 5% if less 3.15% 3.10%
Allowance for pension in payment increases of CPI or 5% if less 2.15% 2.10%
Allowance for pension in payment increases of CPI or 3% if less 2.15% 2.10%
Allowance for commutation of pension for cash at retirement No allowance No allowance
The mortality assumptions adopted imply the following life expectancies:
2019 2018
Life expectancy at Life expectancy at
age 62 Years age 62 Years
Male retiring in 2019 24.3 24.5
Female retiring in 2019 26.3 26.4
Male retiring in 2039 25.4 25.6
Female retiring in 2039 27.5 27.7

73FINANCIAL STATEMENTS
25 Pension schemes (continued)
The mortality assumptions adopted imply the following life expectancies: 2019 2018 2017 £’000 £’000 £’000
Equities 179,867 237,993 215,350
Bonds 388,521 253,751 220,460
Property 121,497 117,053 119,220
Fair value of scheme assets 689,885 608,797 555,030
Present value of defined benefit obligation (827,849) (741,580) (730,987)
Deficit in the scheme (137,964) (132,783) (175,957)
The pension scheme has not invested in any of the University’s own financial instruments or in properties or other assets used by the group.The amounts recognised in the group statement of comprehensive income and expenditure are analysed as follows:
2019 2018 Recognised in Statement of Comprehensive Income: £’000 £’000
Current service cost 21,023 25,907
Expenses 1,712 1,301
22,735 27,208
Reduction in liability following change in benefit structure (27,267) -
Past service cost 4,000 -
Total operating charge (532) 27,208
Net interest cost 3,090 4,583
Total recognised in surplus for the year 2,558 31,791
The £27.3m reduction in liability relates to the benefit restructure detailed above which took effect from 1 January 2019. The £4m past service cost relates to an approximate allowance for Guaranteed Minimum Pensions (GMP) equalisation. This additional provision is as a consequence of the High Court decision on 26 October 2018 which requires schemes with members with GMPs to take action to address inequalities in those GMPs if they were contracted-out of the State scheme between 1978 and 1997. See also note 7 in respect of significant one off pension costs / gains.
Taken to Other Comprehensive Income:
Return on scheme assets (excluding amounts included in net interest cost) 55,646 31,111
Experience gains and losses 379 (1,575)
Remeasurements - changes in demographic and financial assumptions (86,417) 19,267
Total amount recognised in Other Comprehensive Income (30,392) 48,803

74 FINANCIAL STATEMENTS
Notes to the financial statements (continued)Year ended 31 July 2019
25 Pension schemes (continued)
(d) University of Manchester Superannuation Scheme
Reconciliation of opening and closing balances of the defined benefit obligation 2019 2018 £’000 £’000
At start of year 741,580 730,987
Current service cost 21,023 25,907
Expenses 1,712 1,301
Interest expense 19,647 19,119
Contributions by scheme participants 729 805
Actuarial losses/(gains) 86,038 (17,692)
Benefits paid (19,613) (18,847)
Past service cost - loss due to benefit changes 4,000 -
Gain on curtailment (27,267) -
At end of year 827,849 741,580
Reconciliation of opening and closing balances of the fair value of scheme assets 2019 2018 £’000 £’000
At start of year 608,797 555,030
Interest income 16,557 14,536
Actuarial gains 55,646 31,111
Contributions by the University and subsidiaries 27,769 26,162
Contributions by scheme participants 729 805
Benefits paid (19,613) (18,847)
At end of year 689,885 608,797
The actual return on the scheme assets over the year ended 31 July 2019 was £72.2m.
Sensitivity analysisAs set out in the accounting policies, there are some critical judgements made in estimating the UMSS pension liability. The sensitivity of the principal assumptions used to measure the scheme liabilities are set out below:
Change in assumptions at 31 July 2019 Approximate impact
0.1% pa decrease in discount rate 2% or £16.6m increase in liability
0.1% pa increase in inflation linked assumptions 2% or £16.6m increase (of inflation linked liabilities)
One year increase in life expectancy 2% or £16.6m increase in liability

75FINANCIAL STATEMENTS
25 Pension schemes (continued)
(e) Greater Manchester Pension Fund (GMPF)
The GMPF is a final salary defined benefit scheme and a separate fund within the local government pension scheme (LGPS) which is contracted out of the State Second Pension (S2P). The LGPS is regulated by statute, with separate regulations for England and Wales and for Scotland. The benefits of LGPS funds are determined nationally by regulation and meet the definition of a defined benefit scheme. LGPS is a funded scheme, with some 100 separate funds administered locally by administering bodies. Each fund has many employing authorities. The LGPS is not therefore a national multi-employer scheme, but each separate LGPS fund is a multi-employer scheme. The University of Manchester is a member of one of these funds, the GMPF, which is administered by Tameside Metropolitan Borough Council.
A full actuarial valuation was carried out at 31 March 2016 and this most recent full valuation showed a deficit of £1,371m for all members and a funding level of 93%. The University currently pays contributions at a rate of 22.9% of pensionable pay and annual additional contributions towards the deficit of £750k 2018/19 and £771k for 2019/20. The contribution rate of 22.9% remains unchanged for the year commencing 1 August 2019.
The best estimate of contributions to be paid by the University and its subsidiaries to the scheme for the year commencing 1 August 2019 is £1.6m.
The full actuarial valuation was updated to 31 July 2019 on an FRS 102 (28) basis by a qualified actuary, independent of the scheme’s sponsoring employer. The major assumptions used by the actuary are detailed below:
2019 2018 £’000 £’000
Discount rate 2.20% 2.70%
Inflation (RPI) 3.25% 3.20%
Inflation (CPI) 2.25% 2.20%
Salary growth 3.6% 3.60%
Pension increase rate 2.3% 2.20%
The mortality assumptions adopted imply the following life expectancies:
2019 2018
Life expectancy at Life expectancy at
age 65 Years age 65 Years
Male future pensioners 22.0 23.7
Female future pensioners 24.8 26.2
Male current pensioners 20.6 21.5
Female current pensioners 23.1 24.1
2019 2018 2017The assets and liabilities within the scheme at 31 July were as follows: £’000 £’000 £’000
Fair value of scheme assets 130,075 125,562 117,287
Present value of defined benefit obligation (141,675) (131,358) (133,475)
Deficit in the scheme (11,600) (5,796) (16,188)
The split of assets by type is as follows: 2019 2018 2017
Equities 69% 68% 72%
Bonds 14% 16% 16%
Property 8% 7% 6%
Cash 9% 9% 6%

76 FINANCIAL STATEMENTS
Notes to the financial statements (continued)Year ended 31 July 2019
25 Pension schemes (continued)
(e) Greater Manchester Pension Fund (GMPF) (continued)
The pension scheme has not invested in any of the University’s own financial instruments or in properties or other assets used by the group.
The amounts recognised in the group statement of comprehensive income and expenditure are analysed as follows:
2019 2018 £’000 £’000
Recognised in Statement of Comprehensive Income:
Current service cost 1,144 1,362
Past service cost 1,462 37
Total operating charge 2,606 1,399
Net interest cost 119 366
Total recognised in surplus for the year 2,725 1,765
The current service cost includes an allowance for administration expenses of 0.3% (2018: 0.3%) of payroll.
The past service cost relates to both an approximate allowance for Guaranteed Minimum Pensions (GMP) equalisation and for the McCloud judgement. The GMP provision (£0.4m) is as a consequence of the High Court decision on 26 October 2018 which requires schemes with members with GMPs to take action to address inequalities in those GMPs if they were contracted-out of the State scheme between 1978 and 1997. The McCloud judgement provision (£1.1m) relates to a Public service age discrimination case where the Supreme Court ruled in December 2018 that transitional arrangements made in 2015 as a result of public sector scheme reforms were unlawful and must be remedied. See also note 7 in respect of significant one-off pension costs / gains.
Taken to Other Comprehensive Income:
Return on scheme assets (excluding amounts included in net interest cost) 3,830 7,867
Remeasurements - changes in demographic and financial assumptions (8,716) 2,496
Total amount recognised in Other Comprehensive Income (4,886) 10,363
Reconciliation of opening and closing balances of the defined benefit obligation 2019 2018 £’000 £’000
At start of year 131,358 133,475
Current service cost 1,144 1,362
Past service cost 1,462 37
Interest expense 3,471 3,380
Contributions by scheme participants 251 272
Contributions by the employer to the unfunded scheme (129) (150)
Actuarial losses/(gains) 8,716 (2,496)
Benefits paid (4,598) (4,522)
At end of year 141,675 131,358
Analysis of defined benefit obligation
Present value of funded liabilities 139,959 129,499
Present value of unfunded liabilities 1,716 1,859
141,675 131,358
Reconciliation of opening and closing balances of the fair value of scheme assetsAt start of year 125,562 117,287
Interest income 3,352 3,014
Actuarial gains 3,830 7,867
Contributions by the University 1,678 1,644
Contributions by scheme participants 251 272
Benefits paid (4,598) (4,522)
At end of year 130,075 125,562
The actual return on the scheme assets over the year ended 31 July 2019 was 5.8%.

77FINANCIAL STATEMENTS
25 Pension schemes (continued)
Sensitivity analysisAs set out in the accounting policies, there are some critical judgements made in estimating the GMPF pension liability. The sensitivity of the principal assumptions used to measure the scheme liabilities are set out below:
Change in assumptions at 31 July 2019 Approximate impact
0.5% decrease in discount rate 11% or £15.6m increase in liability
0.5% increase in salary increase rate 2% or £2.6m increase in liability
0.5% increase in pension increase rate 9% or £12.7m increase in liability
The principal demographic assumption is the longevity assumption (i.e. member life expectancy). For sensitivity purposes it is estimated that a one year increase in life expectancy would increase the University’s liability by around 3% - 5%.
26 Reconciliation of cash flow to Balance Sheet
At 1st August Cash At 31st July
2018 Flows 2019
£’000 £’000 £’000
Cash and cash equivalents 60,284 (11,965) 48,319
60,284 (11,965) 48,319
27 Capital and other commitments Consolidated University
Provision has not been made for the following capital commitments at 2019 2018 2019 2018 £’000 £’000 £’000 £’000
Authorised not contracted for 127,861 180,716 127,861 180,716
Contracted not provided 328,784 492,948 328,784 492,948
456,645 673,664 456,645 673,664
28 Lease obligations
2019 2018 Land & Other Buildings Leases Total £’000 £’000 £’000 £’000
Payable during the year 17,498 833 18,331 17,501
Future minimum lease payments due:
Not later than one year 9,661 797 10,458 17,698
Later than one year but not later than five years 18,990 1,975 20,965 20,396
Later than five years 44,510 337 44,847 9,489
Total lease payments due 73,161 3,109 76,270 47,583
29 Contingent liabilities Consolidated University
Guarantees 2019 2018 2019 2018 £’000 £’000 £’000 £’000
Bank guarantee 230 230 - -
The bank guarantee relates to a guarantee given by UMIST Ventures Ltd. (a wholly owned subsidiary) in respect of one of the University’s spin-outs.

78 FINANCIAL STATEMENTS
Notes to the financial statements (continued)Year ended 31 July 2019
30 Related party transactions
The operating statements of the University include transactions with related parties. In accordance with FRS 102 these are disclosed where members of the University of Manchester’s Board of Governors or Senior Leadership Team (SLT) disclose an interest in a body with whom the University undertakes transactions which are considered material to the University’s Financial Statements and/or the other party. Due to the nature of the University’s operations and the composition of the Board, being drawn from local public and private sector organisations, it is inevitable that transactions will take place with organisations in which a member of the Board or SLT may have an interest. All transactions involving organisations in which a member of the Board or SLT may have an interest, including those identified below, are conducted at arms length and in accordance with the University’s Financial Regulations and usual procurement procedures.
An updated register of the interests of the members of the Board of Governors is maintained.
The University has taken advantage of the exemption within FRS 102 and has not disclosed transactions with other group entities where it holds 100% of the voting rights. Included within the financial statements are the following transactions with related parties:
Income Expenditure Balance due to Balance due from recognised within recognised within the University the University the financial the financial recognised within recognised within statements statements the financial the financial statements statements £’000 £’000 £’000 £’000
AstraZeneca plc 2,399 4,736 673 34
Barclays Bank 176 - - -
Bruntwood Group Limited 9 16,264 4 3
Cancer Research UK 27,331 - - 1,458
Department for Business, Energy and Industrial Strategy (Northern Powerhouse campaign) 105 - - -
Department for Education (DfE) 568 - 1 -
Department for International Trade 366 - - -
GlaxoSmithKline plc (GSK) 946 - 70 -
University of Liverpool 1,749 2,896 1,428 451
Medical Research Council (MRC) 14,658 12 481 2
Newcastle University 345 1,072 - 86
Nuffield College, Oxford University 442 106 43 -
PricewaterhouseCoopers 107 - 13 -
The Royal Society of Chemistry 119 44 33 13
Universities UK - 298 - -
University of Manchester Students’ Union 253 571 41 99
BT Group plc 6 365 2 -
European Commission 16,694 - 743 -
Manchester University NHS Foundation Trust 17,927 8,044 2,265 1,132
Manchester Science Partnerships Ltd 9 313 3 -
84,209 34,721 5,800 3,278

79FINANCIAL STATEMENTS
30 Related party transactions (continued)
AstraZeneca plcAstraZeneca is a global integrated biopharmaceutical company. One member of the Board of Governors is a retired employee of the company.
Barclays BankBarclays plc is a British multinational investment bank and financial services company, headquartered in London. Apart from investment banking, Barclays is organised into four core businesses: personal banking, corporate banking, wealth management, and investment management. One member of the Board of Governors is an ex employee of the company.
Bruntwood Group LimitedBruntwood is a property group offering office space, serviced offices, retail space and virtual offices. One member of the Board of Governors has declared this company as a client.
Cancer Research UK Cancer Research UK is a registered charity, whose aim is to reduce the number of deaths from cancer. As the world’s largest independent cancer research charity it conducts research into the prevention, diagnosis and treatment of the disease. Research activities are carried out in institutes, universities and hospitals across the UK, both by the charity’s own employees and by its grant-funded researchers. One member of the Board of Governors is a member.
Department for Business, Energy and Industrial Strategy (Northern Powerhouse campaign)The Department for Business, Energy and Industrial Strategy (BEIS) is a department of the government of the United Kingdom, which was created through a merger between the Department for Business, Innovation and Skills (BIS) and Department of Energy and Climate Change (DECC). One member of the Board of Governors has declared this company as a client. Another member of the Board of Governors has declared being a member of the Northern Powerhouse Partnership Board.
Department for Education (DfE)The Department for Education is a department of Her Majesty’s Government responsible for child protection, education, apprenticeships and wider skills in England. One member of the Board of Governors has declared this company as a client.
Department for International TradeThe Department for International Trade is a United Kingdom government department responsible for striking and extending trade agreements between the United Kingdom and non EU states. One member of the Board of Governors has declared this company as a client.
GlaxoSmithKline plc (GSK)GSK is a major pharmaceutical company. One member of the Board of Governors acts as a consultant for the company.
University of LiverpoolThe University of Liverpool is a research intensive university. One member of the Board of Governors is a member of an Institute of that University.
Medical Research Council (MRC)The Medical Research Council aims to improve human health through world-class medical research. They support research across the biomedical spectrum and in all major disease areas. One member of the Board of Governors is a member of a Committee of this Council.
Newcastle UniversityNewcastle University is a research intensive university. One member of the Board of Governors chairs a unit there.
Nuffield College, Oxford UniversityNuffield College is one of the constituent colleges of the University of Oxford in England. It is a graduate college and specialises in the social sciences, particularly economics, politics and sociology. One member of the Board of Governors is an associate member of this College.
PricewaterhouseCoopersPricewaterhouseCoopers is a multinational professional services network with headquarters in London, United Kingdom. PwC ranks as the second largest professional services firm in the world and is one of the Big Four auditors, along with Deloitte, EY and KPMG. One member of the Board of Governors is an ex-partner of this company.
The Royal Society of ChemistryThe Royal Society of Chemistry (RSC) is a learned society (professional association) in the United Kingdom with the goal of “advancing the chemical sciences”. It was formed in 1980 from the amalgamation of the Chemical Society, the Royal Institute of Chemistry, the Faraday Society, and the Society for Analytical Chemistry with a new Royal Charter and the dual role of learned society and professional body. The organisation carries out research, publishes journals, books and databases, as well as hosting conferences, seminars and workshops. It is the professional body for chemistry in the UK, with the ability to award the status of Chartered Chemist (CChem) and, through the Science Council the awards of Chartered Scientist (CSci), Registered Scientist (RSci) and Registered Science Technician (RScTech) to suitably qualified candidates. One member of the Board of Governors is a member of this Society.

80 FINANCIAL STATEMENTS
Notes to the financial statements (continued)Year ended 31 July 2019
30 Related party transactions (continued)
Universities UKUniversities UK is the collective voice of 136 universities in England, Scotland, Wales and Northern Ireland. Their member universities’ core purpose is to maximise their positive impact for students and the public, both in the UK and globally through teaching, research and scholarship. Universities UK is led by its members and acts on behalf of universities, represented by their heads of institution. Their mission is to create the conditions for UK universities to be the best in the world; maximising their positive impact locally, nationally and globally.
University of Manchester Students’ UnionThe University of Manchester Students’ Union is the representative body for students at the University of Manchester. One member of the Board of Governors is a member of a group of this organisation.
BT Group plcBT is the UK’s largest telecommunications company, providing broadband, landline, mobile phone and TV services. The Chair of the Board is a non-executive director of a company within the BT group.
European CommissionThe European Commission is the executive branch of the European Union, responsible for proposing legislation, implementing decisions, upholding the EU treaties and managing the day-to-day business of the EU. A member of the senior leadership team is a member of a committee of this organisation.
Manchester University NHS Foundation TrustThe Manchester University NHS Foundation Trust formed when the University of South Manchester and Central Manchester University Hospitals NHS Foundation Trusts merged on 1 October 2017. The Trust runs Altrincham Hospital, Manchester Royal Infirmary, Royal Eye Hospital, Royal Manchester Children’s Hospital, St Mary’s, Trafford General Hospital ,Withington Community Hospital, Wythenshawe Hospital, and the University Dental Hospital. It works closely with the University in the teaching of medical students, as well as research. A member of the senior leadership team is a non executive director of the Trust.
Manchester Science Partnerships Ltd (MSP)MSP is the UK’s leading provider of specialist environments and growth support to science and technology companies on their journey to business success. With campus facilities across Manchester and Cheshire, it offers incubation, laboratory, office and meeting space for businesses at all the different stages of their lifecycle – from start-up to global corporate. A member of the senior leadership team is a member of the Board of Directors.
Members of the Board of Governors’ Expenses£15,926.22 was paid in expenses to members of the Board of Governors of the University and the Senior Leadership Team during the year (2018: £11,672.64). Where members of the Board are also employees of the University the amount includes expenses paid in relation to their employment.
31 Events after the reporting period
As set out in notes 21 and 25 (a) in respect of USS, since the year end and following the completion of the 2018 actuarial valuation, a new deficit recovery plan has been agreed. This amends the existing deficit recovery plan as set out in the 2017 valuation Schedule of Contributions. This new plan requires deficit payments of 2% of salaries from 1 October 2019 to 30 September 2021 and then payments of 6% of salaries from 1 October 2021 to 31 March 2028. As at 31 July 2019 and with all other assumptions used to calculate the provision unchanged, this would have resulted in a revised provision of £138.6m, a decrease of £109.8m from the current year end provision. As set out on page 12 and 13, if this lower provision had been used, the University’s consolidated deficit for the year of £75.2m would have been a surplus of £34.6m.
32 Amounts disbursed as agent (Consolidated and University)
The National College for Teaching and Leadership (formerly the Training and Development Agency for Schools (TDA))
Student Training Bursaries 2019 2018
£’000 £’000
Balance unspent at beginning of year 73 206
Funding Council grants 4,301 3,763
Disbursed to students (4,242) (3,896)
Balance unspent at year end 132 73
Funding Council grants are available solely for students. The University acts only as a paying agent. The grants and related disbursements are therefore excluded from the Income and Expenditure account.

81FINANCIAL STATEMENTS

82 FINANCIAL STATEMENTS
The University of ManchesterOxford RoadManchesterM13 9PLwww.manchester.ac.uk
Created by the Division of Communications and Marketing
Royal Charter Number RC0007972960 11.19