Embed Size (px)
DESCRIPTION
It gives the complete financial detail of GS E&C Corp. and of its subsidiaries which are located in different part of the globe.
Citation preview
GS Engineering & Construction Corporationand Subsidiaries
Consolidated Financial Statementsfor the years ended December 31, 2014 and 2013
with independent auditors’ report

Table of contents
Page Independent auditors’ report 1 Consolidated financial statements
Consolidated statements of financial position 3 Consolidated statements of profit or loss 4 Consolidated statements of comprehensive Income 5 Consolidated statements of changes in equity 6 Consolidated statements of cash flows 7 Notes to the consolidated financial statements 8-69

1
Independent auditors’ report
The Board of Directors and Stockholders
GS Engineering & Construction Corporation
We have audited the accompanying consolidated financial statements of GS Engineering & Construction Corporation (the “Company”) and its subsidiaries (collectively referred to as the “Group”), which comprise the consolidated statements of financial position as at December 31, 2014 and the consolidated statements of profit or loss and comprehensive income, consolidated statements of changes in equity and consolidated statements of cash flows for the years then ended.
Management's Responsibility for the Financial Statements
Management is responsible for the preparation and fair presentation of these financial statements in accordance with Korean International Financial Reporting Standards (KIFRS), and for such internal control as management determines is necessary to enable the preparation of financial statements that are free from material misstatement, whether due to fraud or error.
Auditors’ Responsibility
Our responsibility is to express an opinion on these financial statements based on our audit. We conducted our audit in accordance with auditing standards generally accepted in the Republic of Korea. Those standards require that we comply with ethical requirements and plan and perform the audit to obtain reasonable assurance about whether the financial statements are free from material misstatement.
An audit involves performing procedures to obtain audit evidence about the amounts and disclosures in the financial statements. The procedures selected depend on the auditors’ judgment, including the assessment of the risks of material misstatement of the financial statements, whether due to fraud or error. In making those risk assessments, the auditor considers internal control relevant to the entity's preparation and fair presentation of the consolidated financial statements in order to design audit procedures that are appropriate in the circumstances, but not for the purpose of expressing an opinion on the effectiveness of the entity's internal control. An audit also includes evaluating the appropriateness of accounting policies used and the reasonableness of accounting estimates made by management, as well as evaluating the overall presentation of the consolidated financial statements.
We believe that the audit evidence we have obtained is sufficient and appropriate to provide a basis for our audit opinion.
A member fi rm of Ernst & Young Global Limited
Opinion
In our opinion, the consolidated financial statements present fairly, in all material respects, the financial position of GS Engineering & Construction Corporation and its subsidiaries as at December 31, 2014 and the results of its financial performance and cash flows for the years then ended in accordance with Korean International Financial Reporting Standards.
Other Matter
The consolidated financial statements of GS Engineering & Construction Corporation and its subsidiaries for the year ended December 31, 2013, were audited by PWC who expressed an unqualified opinion on those statements on March 13, 2014.
February 24, 2015
This audit report is effective as at February 24, 2015, the independent auditors’ report date. Accordingly, certain material subsequent events or circumstances may have occurred during the period from the auditors’ report date to the time this report is used. Such events and circumstances could significantly affect the accompanying consolidated financial statements and may result in modifications to this report.
A member fi rm of Ernst & Young Global Limited
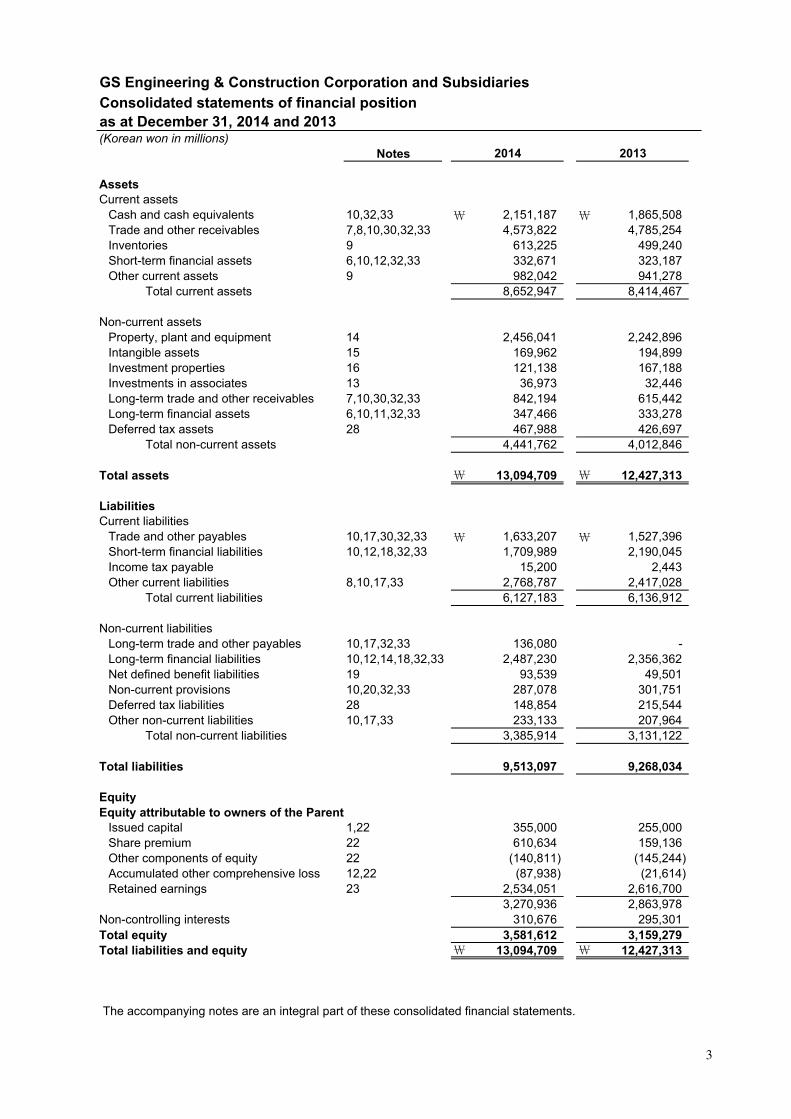
GS Engineering & Construction Corporation and SubsidiariesConsolidated statements of financial position as at December 31, 2014 and 2013(Korean won in millions)
Notes
AssetsCurrent assets
Cash and cash equivalents 10,32,33 \ 2,151,187 \ 1,865,508Trade and other receivables 7,8,10,30,32,33 4,573,822 4,785,254Inventories 9 613,225 499,240Short-term financial assets 6,10,12,32,33 332,671 323,187Other current assets 9 982,042 941,278
Total current assets 8,652,947 8,414,467
Non-current assetsProperty, plant and equipment 14 2,456,041 2,242,896Intangible assets 15 169,962 194,899Investment properties 16 121,138 167,188Investments in associates 13 36,973 32,446Long-term trade and other receivables 7,10,30,32,33 842,194 615,442Long-term financial assets 6,10,11,32,33 347,466 333,278Deferred tax assets 28 467,988 426,697
Total non-current assets 4,441,762 4,012,846
Total assets \ 13,094,709 \ 12,427,313
Liabilities Current liabilities
Trade and other payables 10,17,30,32,33 \ 1,633,207 \ 1,527,396Short-term financial liabilities 10,12,18,32,33 1,709,989 2,190,045Income tax payable 15,200 2,443Other current liabilities 8,10,17,33 2,768,787 2,417,028
Total current liabilities 6,127,183 6,136,912
Non-current liabilitiesLong-term trade and other payables 10,17,32,33 136,080 - Long-term financial liabilities 10,12,14,18,32,33 2,487,230 2,356,362Net defined benefit liabilities 19 93,539 49,501Non-current provisions 10,20,32,33 287,078 301,751Deferred tax liabilities 28 148,854 215,544Other non-current liabilities 10,17,33 233,133 207,964
Total non-current liabilities 3,385,914 3,131,122
Total liabilities 9,513,097 9,268,034
Equity Equity attributable to owners of the Parent
Issued capital 1,22 355,000 255,000Share premium 22 610,634 159,136Other components of equity 22 (140,811) (145,244)Accumulated other comprehensive loss 12,22 (87,938) (21,614)Retained earnings 23 2,534,051 2,616,700
3,270,936 2,863,978Non-controlling interests 310,676 295,301Total equity 3,581,612 3,159,279Total liabilities and equity \ 13,094,709 \ 12,427,313
20132014
The accompanying notes are an integral part of these consolidated financial statements.
3
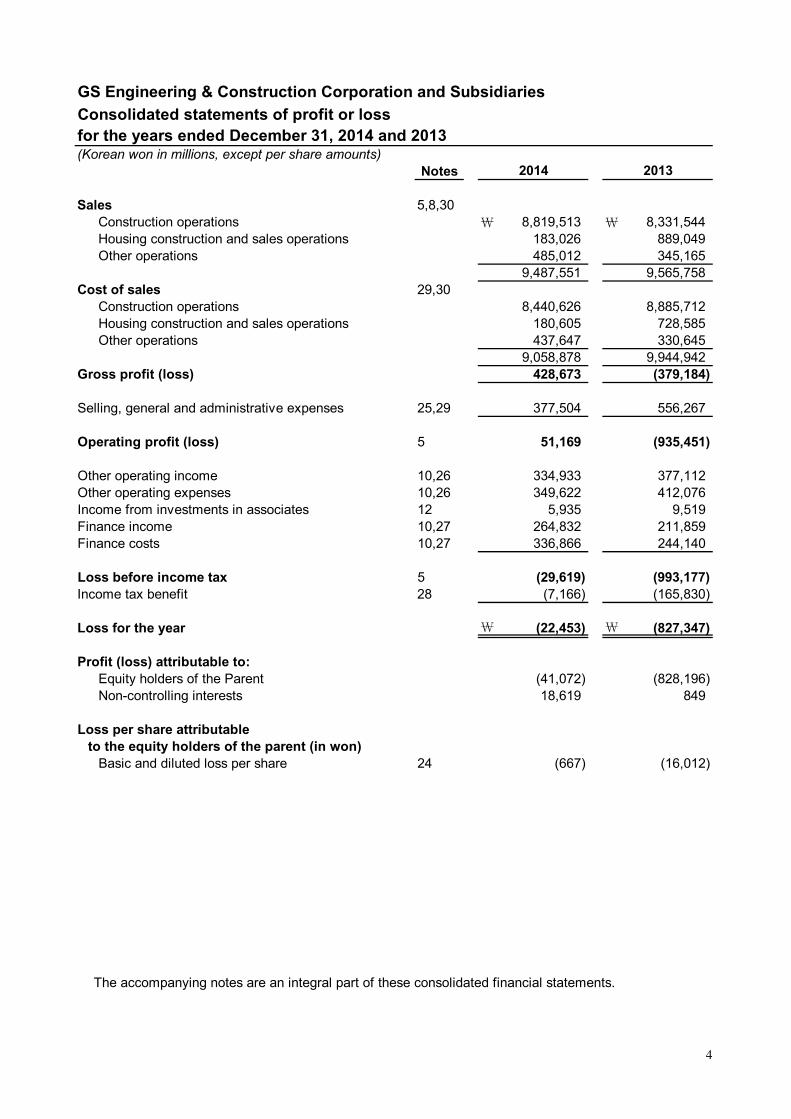
GS Engineering & Construction Corporation and Subsidiaries
Consolidated statements of profit or lossfor the years ended December 31, 2014 and 2013(Korean won in millions, except per share amounts)
Notes
Sales 5,8,30Construction operations \ 8,819,513 \ 8,331,544Housing construction and sales operations 183,026 889,049Other operations 485,012 345,165
9,487,551 9,565,758Cost of sales 29,30
Construction operations 8,440,626 8,885,712Housing construction and sales operations 180,605 728,585Other operations 437,647 330,645
9,058,878 9,944,942Gross profit (loss) 428,673 (379,184)
Selling, general and administrative expenses 25,29 377,504 556,267
Operating profit (loss) 5 51,169 (935,451)
Other operating income 10,26 334,933 377,112Other operating expenses 10,26 349,622 412,076Income from investments in associates 12 5,935 9,519Finance income 10,27 264,832 211,859Finance costs 10,27 336,866 244,140
Loss before income tax 5 (29,619) (993,177)Income tax benefit 28 (7,166) (165,830)
Loss for the year \ (22,453) \ (827,347)
Profit (loss) attributable to:Equity holders of the Parent (41,072) (828,196)Non-controlling interests 18,619 849
Loss per share attributable to the equity holders of the parent (in won)
Basic and diluted loss per share 24 (667) (16,012)
2014 2013
The accompanying notes are an integral part of these consolidated financial statements.
4
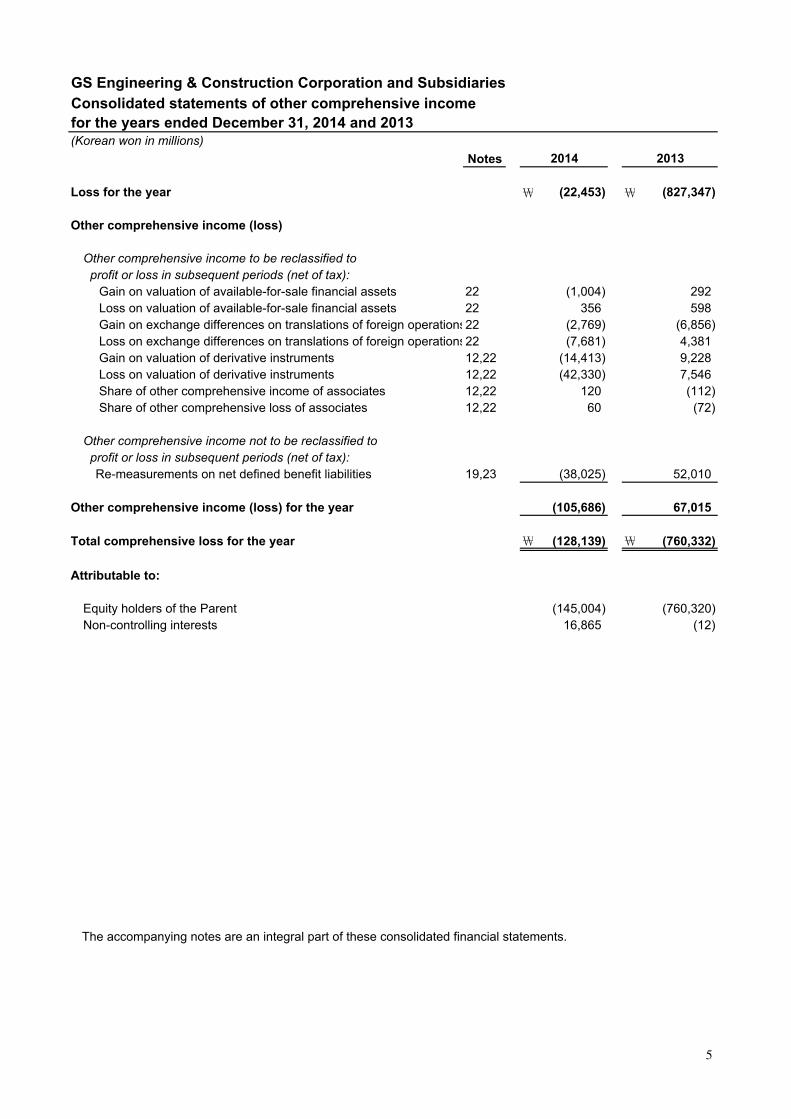
GS Engineering & Construction Corporation and SubsidiariesConsolidated statements of other comprehensive incomefor the years ended December 31, 2014 and 2013
Notes
Loss for the year \ (22,453) \ (827,347)
Other comprehensive income (loss)
Other comprehensive income to be reclassified to profit or loss in subsequent periods (net of tax):
Gain on valuation of available-for-sale financial assets 22 (1,004) 292 Loss on valuation of available-for-sale financial assets 22 356 598 Gain on exchange differences on translations of foreign operations22 (2,769) (6,856) Loss on exchange differences on translations of foreign operations22 (7,681) 4,381 Gain on valuation of derivative instruments 12,22 (14,413) 9,228 Loss on valuation of derivative instruments 12,22 (42,330) 7,546 Share of other comprehensive income of associates 12,22 120 (112) Share of other comprehensive loss of associates 12,22 60 (72)
Other comprehensive income not to be reclassified to profit or loss in subsequent periods (net of tax):
Re-measurements on net defined benefit liabilities 19,23 (38,025) 52,010
Other comprehensive income (loss) for the year (105,686) 67,015
Total comprehensive loss for the year \ (128,139) \ (760,332)
Attributable to:
Equity holders of the Parent (145,004) (760,320)Non-controlling interests 16,865 (12)
(Korean won in millions)
The accompanying notes are an integral part of these consolidated financial statements.
2014 2013
5
GS
En
gin
eeri
ng
& C
on
stru
ctio
n C
orp
ora
tio
n a
nd
Su
bsi
dia
ries
Co
nso
lidat
ed s
tate
men
ts o
f ch
ang
es in
eq
uit
yfo
r th
e ye
ars
end
ed D
ecem
ber
31,
201
4 an
d 2
013
(Kor
ean
won
in m
illio
ns)
To
tal
Bal
ance
as
at J
anu
ary
1, 2
013
\25
5,00
0
\15
9,01
3
\(1
45,4
09)
\(3
8,29
0)
\3,
397,
888
\3,
628,
202
\30
0,26
7
\3,
928,
469
To
tal c
om
pre
hen
sive
loss
Pro
fit (
loss
) fo
r th
e ye
ar-
-
-
-
(8
28,1
96)
(828
,196
)
84
9
(827
,347
)
G
ain
on v
alua
tion
of a
vaila
ble-
for-
sale
fina
ncia
l ass
ets
-
-
-
286
-
28
6
6
292
Lo
ss o
n va
luat
ion
of a
vaila
ble-
for-
sale
fina
ncia
l ass
ets
-
-
-
568
-
56
8
30
59
8
Sha
re o
f oth
er c
ompr
ehen
sive
inco
me
of a
ssoc
iate
s-
-
-
(1
12)
-
(1
12)
-
(1
12)
S
hare
of o
ther
com
preh
ensi
ve lo
ss o
f ass
ocia
tes
-
-
-
(49)
-
(4
9)
(23)
(7
2)
Gai
n on
exc
hang
e di
ffere
nces
on
tran
slat
ions
of f
orei
gn o
pera
tions
-
-
-
(4,1
55)
-
(4,1
55)
(2,7
01)
(6,8
56)
Loss
on
exch
ange
diff
eren
ces
on tr
ansl
atio
ns o
f for
eign
ope
ratio
ns-
-
-
4,
381
-
4,38
1
-
4,
381
Gai
n on
val
uatio
n of
der
ivat
ive
inst
rum
ents
-
-
-
9,22
8
-
9,
228
-
9,22
8
Lo
ss o
n va
luat
ion
of d
eriv
ativ
e in
stru
men
ts-
-
-
6,
529
-
6,52
9
1,
017
7,54
6
R
e-m
easu
rem
ents
on
net d
efin
ed b
enef
it lia
bilit
ies
-
-
-
-
51,2
00
51
,200
810
52
,010
To
tal c
om
pre
hen
sive
loss
fo
r th
e ye
ar-
-
-
16
,676
(776
,996
)
(7
60,3
20)
(12)
(7
60,3
32)
Tra
nsa
ctio
ns
wit
h e
qu
ity
ho
lder
s o
f th
e G
rou
p
Div
iden
ds to
equ
ity h
olde
rs o
f the
Gro
up-
-
-
-
(1
2,39
0)
(12,
390)
(9
86)
(1
3,37
6)
Cha
nges
in s
cope
of s
ubsi
diar
ies
-
-
-
-
-
-
613
61
3
Cha
nges
in th
e no
n-co
ntro
lling
inte
rest
s-
12
3
-
-
-
123
(3
,717
)
(3
,594
)
O
ther
s-
-
16
5
-
8,19
8
8,
363
(864
)
7,49
9
T
ota
l tra
nsa
ctio
ns
wit
h e
qu
ity
ho
lder
s o
f th
e G
rou
p
-
123
16
5
-
(4,1
92)
(3,9
04)
(4,9
54)
(8,8
58)
Bal
ance
as
at D
ecem
ber
31,
201
3\
255,
000
\
159,
136
\
(145
,244
)
\
(21,
614)
\
2,61
6,70
0
\
2,86
3,97
8
\
295,
301
\
3,15
9,27
9
Bal
ance
as
at J
anu
ary
1, 2
014
\25
5,00
0
\15
9,13
6
\(1
45,2
44)
\(2
1,61
4)
\2,
616,
700
\2,
863,
978
\29
5,30
1
\3,
159,
279
To
tal c
om
pre
hen
sive
loss
Pro
fit (
loss
) fo
r th
e ye
ar-
-
-
-
(4
1,07
2)
(41,
072)
18
,619
(22,
453)
G
ain
on v
alua
tion
of a
vaila
ble-
for-
sale
fina
ncia
l ass
ets
-
-
-
(998
)
-
(998
)
(6)
(1,0
04)
Loss
on
valu
atio
n of
ava
ilabl
e-fo
r-sa
le fi
nanc
ial a
sset
s-
-
-
43
6
-
436
(8
0)
356
S
hare
of o
ther
com
preh
ensi
ve in
com
e of
ass
ocia
tes
-
-
-
120
-
12
0
-
120
S
hare
of o
ther
com
preh
ensi
ve lo
ss o
f ass
ocia
tes
-
-
-
41
-
41
19
60
Gai
n on
exc
hang
e di
ffere
nces
on
tran
slat
ions
of f
orei
gn o
pera
tions
-
-
-
(1,5
33)
-
(1,5
33)
(1,2
36)
(2,7
69)
Loss
on
exch
ange
diff
eren
ces
on tr
ansl
atio
ns o
f for
eign
ope
ratio
ns-
-
-
(7
,681
)
-
(7
,681
)
-
(7
,681
)
G
ain
on v
alua
tion
of d
eriv
ativ
e in
stru
men
ts-
-
-
(1
4,41
3)
-
(14,
413)
-
(1
4,41
3)
Loss
on
valu
atio
n of
der
ivat
ive
inst
rum
ents
-
-
-
(42,
296)
-
(4
2,29
6)
(35)
(4
2,33
1)
Re-
mea
sure
men
ts o
n ne
t def
ined
ben
efit
liabi
litie
s-
-
-
-
(3
7,60
8)
(37,
608)
(4
17)
(3
8,02
5)
To
tal c
om
pre
hen
sive
loss
fo
r th
e ye
ar-
-
-
(6
6,32
4)
(78,
680)
(1
45,0
04)
16,8
64
(1
28,1
40)
Tra
nsa
ctio
ns
wit
h e
qu
ity
ho
lder
s o
f th
e G
rou
p
Div
iden
ds to
equ
ity h
olde
rs o
f the
Gro
up-
-
-
-
-
-
(1
,519
)
(1
,519
)
P
aid-
in c
apita
l inc
reas
e10
0,00
0
448,
369
-
-
-
54
8,36
9
-
548,
369
S
hare
s is
sued
upo
n co
nver
sion
of b
onds
-
3,12
9
-
-
-
3,
129
-
3,12
9
C
hang
es in
the
non-
cont
rolli
ng in
tere
st-
-
-
-
-
-
(1
27)
(1
27)
O
ther
s-
-
4,
433
-
(3,9
69)
464
15
7
621
T
ota
l tra
nsa
ctio
ns
wit
h e
qu
ity
ho
lder
s o
f th
e G
rou
p
100,
000
45
1,49
8
4,43
3
-
(3
,969
)
55
1,96
2
(1,4
89)
550,
473
Bal
ance
as
at D
ecem
ber
31,
201
4\
355,
000
\
610,
634
\
(140
,811
)
\
(87,
938)
\
2,53
4,05
1
\
3,27
0,93
6
\
310,
676
\
3,58
1,61
2
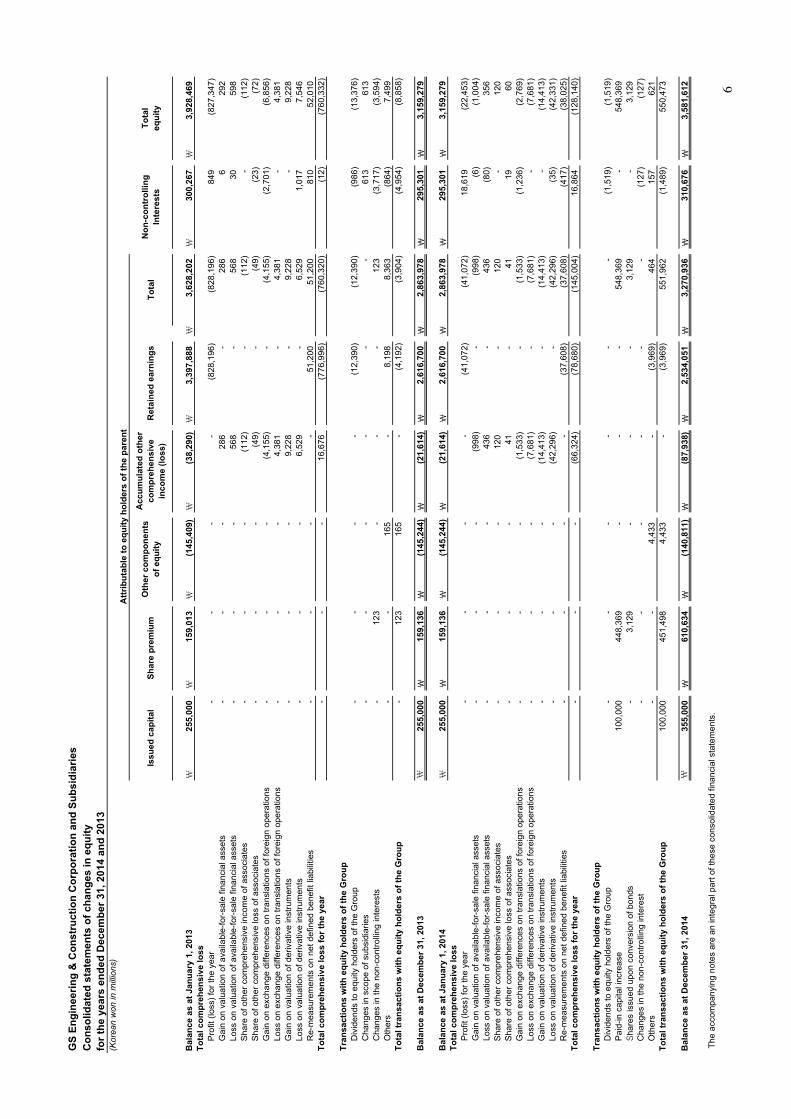
The
acc
ompa
nyin
g no
tes
are
an in
tegr
al p
art o
f the
se c
onso
lidat
ed fi
nanc
ial s
tate
men
ts.
Att
rib
uta
ble
to
eq
uit
y h
old
ers
of
the
par
ent
Issu
ed c
apit
alS
har
e p
rem
ium
No
n-c
on
tro
llin
gIn
tere
sts
Oth
er c
om
po
nen
tso
f eq
uit
y
Acc
um
ula
ted
oth
erco
mp
reh
ensi
vein
com
e (l
oss
)R
etai
ned
ear
nin
gs
To
tal
equ
ity
6
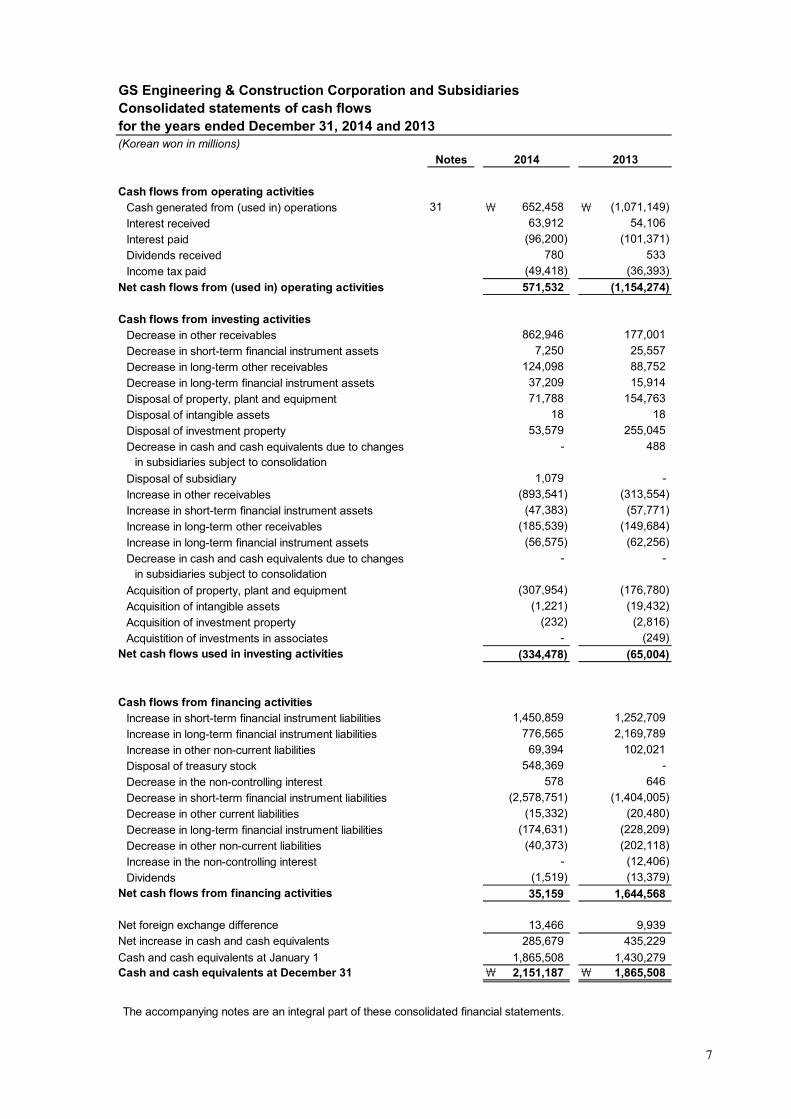
GS Engineering & Construction Corporation and SubsidiariesConsolidated statements of cash flowsfor the years ended December 31, 2014 and 2013(Korean won in millions)
Notes
Cash flows from operating activitiesCash generated from (used in) operations 31 \ 652,458 \ (1,071,149)
Interest received 63,912 54,106
Interest paid (96,200) (101,371)
Dividends received 780 533
Income tax paid (49,418) (36,393)
Net cash flows from (used in) operating activities 571,532 (1,154,274)
Cash flows from investing activitiesDecrease in other receivables 862,946 177,001
Decrease in short-term financial instrument assets 7,250 25,557
Decrease in long-term other receivables 124,098 88,752
Decrease in long-term financial instrument assets 37,209 15,914
Disposal of property, plant and equipment 71,788 154,763
Disposal of intangible assets 18 18
Disposal of investment property 53,579 255,045
Decrease in cash and cash equivalents due to changes - 488in subsidiaries subject to consolidation
Disposal of subsidiary 1,079 -
Increase in other receivables (893,541) (313,554)
Increase in short-term financial instrument assets (47,383) (57,771)
Increase in long-term other receivables (185,539) (149,684)
Increase in long-term financial instrument assets (56,575) (62,256)
Decrease in cash and cash equivalents due to changes - - in subsidiaries subject to consolidation
Acquisition of property, plant and equipment (307,954) (176,780)
Acquisition of intangible assets (1,221) (19,432)
Acquisition of investment property (232) (2,816)
Acquistition of investments in associates - (249)Net cash flows used in investing activities (334,478) (65,004)
Cash flows from financing activitiesIncrease in short-term financial instrument liabilities 1,450,859 1,252,709
Increase in long-term financial instrument liabilities 776,565 2,169,789
Increase in other non-current liabilities 69,394 102,021
Disposal of treasury stock 548,369 -
Decrease in the non-controlling interest 578 646
Decrease in short-term financial instrument liabilities (2,578,751) (1,404,005)
Decrease in other current liabilities (15,332) (20,480)
Decrease in long-term financial instrument liabilities (174,631) (228,209)
Decrease in other non-current liabilities (40,373) (202,118)
Increase in the non-controlling interest - (12,406)
Dividends (1,519) (13,379)Net cash flows from financing activities 35,159 1,644,568
Net foreign exchange difference 13,466 9,939Net increase in cash and cash equivalents 285,679 435,229
Cash and cash equivalents at January 1 1,865,508 1,430,279Cash and cash equivalents at December 31 \ 2,151,187 \ 1,865,508
The accompanying notes are an integral part of these consolidated financial statements.
2014 2013
7
GS Engineering & Construction Corporation and Subsidiaries Notes to the consolidated financial statements December 31, 2014 and 2013
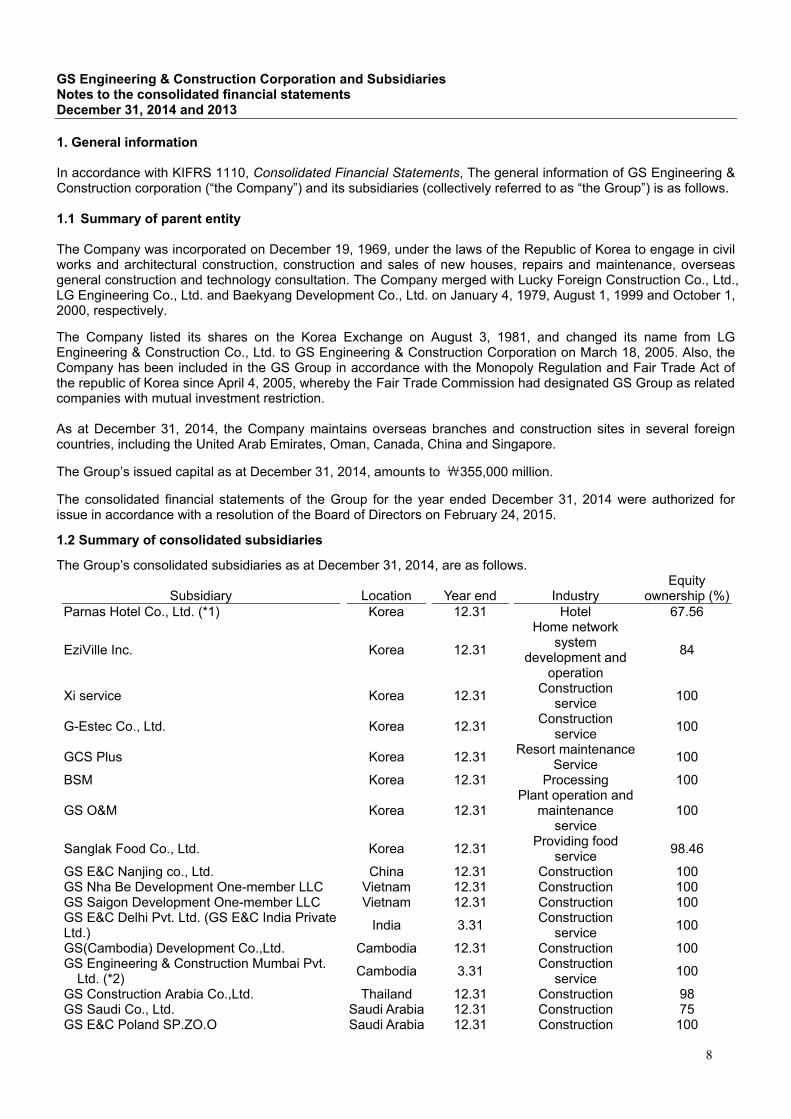
1. General information In accordance with KIFRS 1110, Consolidated Financial Statements, The general information of GS Engineering & Construction corporation (“the Company”) and its subsidiaries (collectively referred to as “the Group”) is as follows. 1.1 Summary of parent entity The Company was incorporated on December 19, 1969, under the laws of the Republic of Korea to engage in civil works and architectural construction, construction and sales of new houses, repairs and maintenance, overseas general construction and technology consultation. The Company merged with Lucky Foreign Construction Co., Ltd., LG Engineering Co., Ltd. and Baekyang Development Co., Ltd. on January 4, 1979, August 1, 1999 and October 1, 2000, respectively. The Company listed its shares on the Korea Exchange on August 3, 1981, and changed its name from LG Engineering & Construction Co., Ltd. to GS Engineering & Construction Corporation on March 18, 2005. Also, the Company has been included in the GS Group in accordance with the Monopoly Regulation and Fair Trade Act of the republic of Korea since April 4, 2005, whereby the Fair Trade Commission had designated GS Group as related companies with mutual investment restriction. As at December 31, 2014, the Company maintains overseas branches and construction sites in several foreign countries, including the United Arab Emirates, Oman, Canada, China and Singapore. The Group’s issued capital as at December 31, 2014, amounts to ₩355,000 million. The consolidated financial statements of the Group for the year ended December 31, 2014 were authorized for issue in accordance with a resolution of the Board of Directors on February 24, 2015. 1.2 Summary of consolidated subsidiaries The Group’s consolidated subsidiaries as at December 31, 2014, are as follows.
Subsidiary Location Year end Industry Equity ownership (%)
Parnas Hotel Co., Ltd. (*1) Korea 12.31 Hotel 67.56
EziVille Inc. Korea 12.31
Home network system
development and operation
84
Xi service Korea 12.31 Construction service
100
G-Estec Co., Ltd. Korea 12.31 Construction service
100
GCS Plus Korea 12.31 Resort maintenance Service
100
BSM Korea 12.31 Processing 100
GS O&M Korea 12.31 Plant operation and
maintenance service
100
Sanglak Food Co., Ltd. Korea 12.31 Providing food service
98.46
GS E&C Nanjing co., Ltd. China 12.31 Construction 100 GS Nha Be Development One-member LLC Vietnam 12.31 Construction 100 GS Saigon Development One-member LLC Vietnam 12.31 Construction 100 GS E&C Delhi Pvt. Ltd. (GS E&C India Private Ltd.)
India 3.31 Construction
service
100
GS(Cambodia) Development Co.,Ltd. Cambodia 12.31 Construction 100 GS Engineering & Construction Mumbai Pvt.
Ltd. (*2) Cambodia 3.31
Construction service
100
GS Construction Arabia Co.,Ltd. Thailand 12.31 Construction 98 GS Saudi Co., Ltd. Saudi Arabia 12.31 Construction 75 GS E&C Poland SP.ZO.O Saudi Arabia 12.31 Construction 100
8
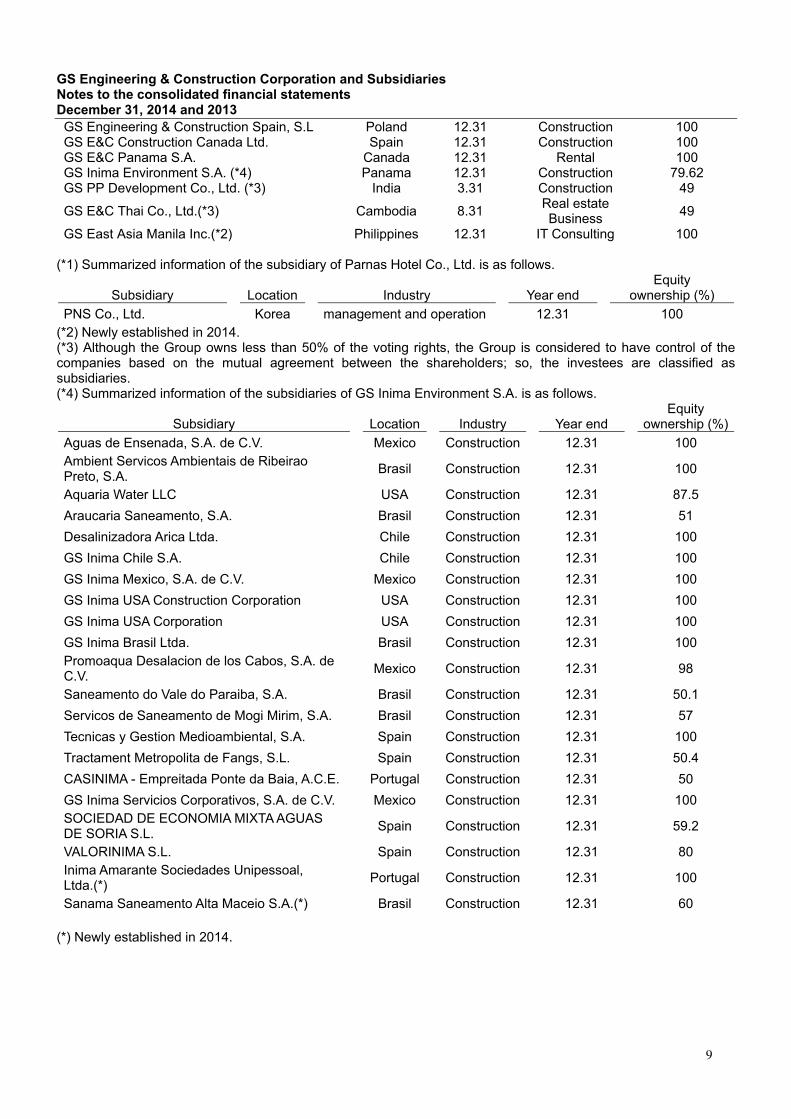
GS Engineering & Construction Corporation and Subsidiaries Notes to the consolidated financial statements December 31, 2014 and 2013
GS Engineering & Construction Spain, S.L Poland 12.31 Construction 100 GS E&C Construction Canada Ltd. Spain 12.31 Construction 100 GS E&C Panama S.A. Canada 12.31 Rental 100 GS Inima Environment S.A. (*4) Panama 12.31 Construction 79.62 GS PP Development Co., Ltd. (*3) India 3.31 Construction 49
GS E&C Thai Co., Ltd.(*3) Cambodia 8.31 Real estate Business
49
GS East Asia Manila Inc.(*2) Philippines 12.31 IT Consulting 100 (*1) Summarized information of the subsidiary of Parnas Hotel Co., Ltd. is as follows.
Subsidiary Location Industry Year end Equity
ownership (%)
PNS Co., Ltd. Korea management and operation 12.31 100 (*2) Newly established in 2014. (*3) Although the Group owns less than 50% of the voting rights, the Group is considered to have control of the companies based on the mutual agreement between the shareholders; so, the investees are classified as subsidiaries. (*4) Summarized information of the subsidiaries of GS Inima Environment S.A. is as follows.
Subsidiary Location Industry Year end Equity
ownership (%)
Aguas de Ensenada, S.A. de C.V. Mexico Construction 12.31 100 Ambient Servicos Ambientais de Ribeirao Preto, S.A.
Brasil Construction 12.31 100
Aquaria Water LLC USA Construction 12.31 87.5
Araucaria Saneamento, S.A. Brasil Construction 12.31 51
Desalinizadora Arica Ltda. Chile Construction 12.31 100
GS Inima Chile S.A. Chile Construction 12.31 100
GS Inima Mexico, S.A. de C.V. Mexico Construction 12.31 100
GS Inima USA Construction Corporation USA Construction 12.31 100
GS Inima USA Corporation USA Construction 12.31 100
GS Inima Brasil Ltda. Brasil Construction 12.31 100 Promoaqua Desalacion de los Cabos, S.A. de C.V.
Mexico Construction 12.31 98
Saneamento do Vale do Paraiba, S.A. Brasil Construction 12.31 50.1
Servicos de Saneamento de Mogi Mirim, S.A. Brasil Construction 12.31 57
Tecnicas y Gestion Medioambiental, S.A. Spain Construction 12.31 100
Tractament Metropolita de Fangs, S.L. Spain Construction 12.31 50.4
CASINIMA - Empreitada Ponte da Baia, A.C.E. Portugal Construction 12.31 50
GS Inima Servicios Corporativos, S.A. de C.V. Mexico Construction 12.31 100 SOCIEDAD DE ECONOMIA MIXTA AGUAS DE SORIA S.L.
Spain Construction 12.31 59.2
VALORINIMA S.L. Spain Construction 12.31 80 Inima Amarante Sociedades Unipessoal, Ltda.(*)
Portugal Construction 12.31 100
Sanama Saneamento Alta Maceio S.A.(*) Brasil Construction 12.31 60 (*) Newly established in 2014.
9

GS Engineering & Construction Corporation and Subsidiaries Notes to the consolidated financial statements December 31, 2014 and 2013
1. General information (continued) 1.3 Summary of financial information on subsidiaries Summary of financial information of subsidiaries as at December 31, 2014 and 2013 are as follows.
(Korean won in millions) 2014
Subsidiary Assets Liabilities Sales Profit (loss) for
the year Parnas Hotel Co., Ltd. (*1) \ 1,250,319 \ 542,935 \ 198,949 \ 9,261EziVille Inc. 34,334 13,166 77,448 823Xi service 8,356 7,498 13,579 92G-Estec Co., Ltd. 809 724 4,413 (22)GCS Plus 10,031 5,565 38,110 324BSM 1,106 988 7,881 58GS O&M 3,982 1,490 25,683 135Sanglak Food Co., Ltd. 4,910 2,072 14,101 (37)GL Project Financing Vehicle 1 Ltd. (*2) 23,713 5,232 (2,382) 11,390GS E&C Nanjing co., Ltd. 112,055 70,524 283,292 24,093GS Nha Be Development One-member LLC 144,853 121,568 - (1,627)GS Saigon Development One-member LLC 314,072 280,424 50,443 11,108GS E&C Delhi Pvt. Ltd. (GS E&C India Private Ltd.) 18,336 13,262 18,094
(5,796)
GS(Cambodia) Development Co., Ltd. 1,455 53 - (3)GS Engineering & Construction Mumbai Pvt.
Ltd. (*3) 6,609 3,418 3,660
(6,374)GS Construction Arabia Co., Ltd. 216,012 435,885 235,206 (94,367)GS Saudi Co., Ltd. 307 4,021 816 (1,172)GS E&C Poland SP.ZO.O 440 386 - 6GS Engineering & Construction Spain, S.L 85,034 87,614 121,910 11,866GS E&C Construction Canada Ltd. 13,285 19,978 80,005 (1,883)GS E&C Panama S.A. 840 - 79 (41)GS Inima Environment S.A. (*1) 536,819 318,740 147,822 1,784GS PP Development Co., Ltd. 59,058 139,998 79,561 29,256GS E&C Thai Co., Ltd. 684 15 - (277)GS East Asia Manila Inc. (*3) 3,816 97 - (274) (*1) Includes the financial information of its subsidiaries. (*2) Liquidated in 2014. (*3) Newly established in 2014. (Korean won in millions)
2013
Subsidiary Assets Liabilities Sales Profit (loss) for
the year Parnas Hotel Co., Ltd. (*) \ 1,210,595 \ 510,190 \ 180,841 \ 5,401 EziVille Inc. 32,552 12,214 74,609 562 Xi service 4,028 3,263 14,439 (6)G-Estec Co., Ltd. 957 851 5,088 (34)GLS Service 508 96 3,935 1 GCS Plus 9,024 4,882 36,504 (276)BSM 1,135 1,076 8,641 (518)GS O&M 3,723 2,367 25,705 (440)Sanglak Food Co., Ltd 5,753 2,879 19,403 634 GL Project Financing Vehicle 1 Ltd. 265,738 50,121 685,744 159,902 GS E&C Nanjing Co., Ltd 166,354 130,627 244,966 19,820
10
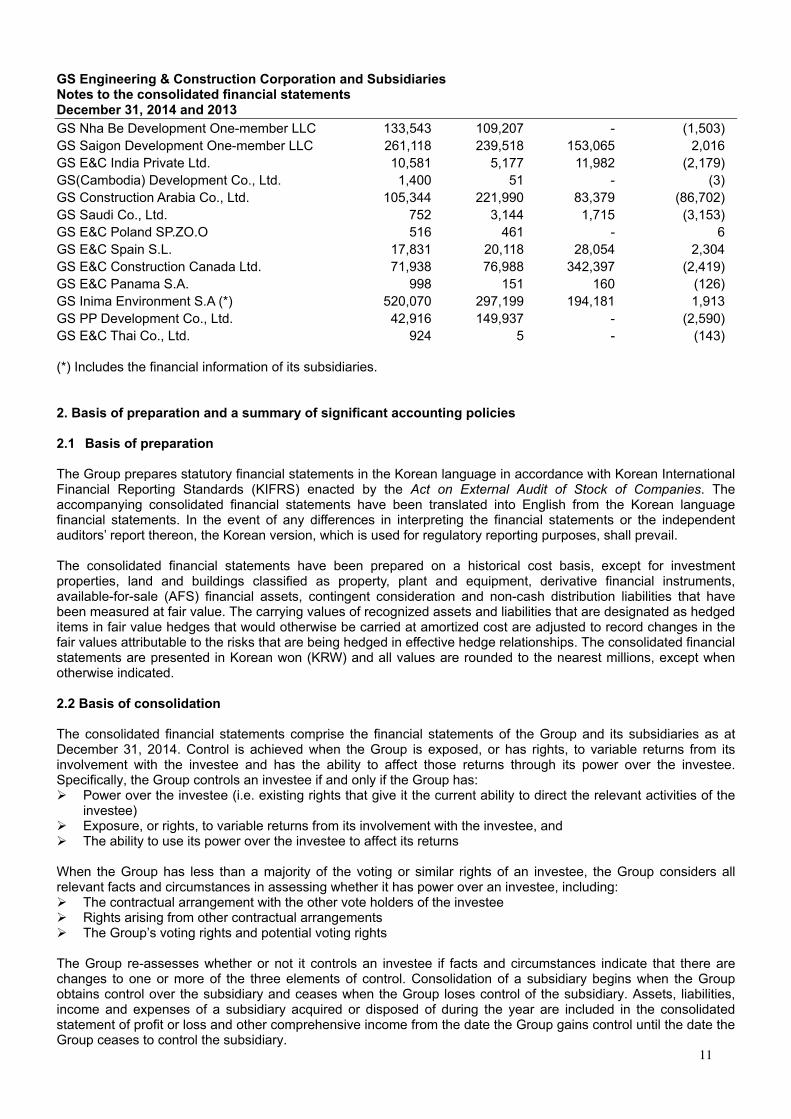
GS Engineering & Construction Corporation and Subsidiaries Notes to the consolidated financial statements December 31, 2014 and 2013
GS Nha Be Development One-member LLC 133,543 109,207 - (1,503)GS Saigon Development One-member LLC 261,118 239,518 153,065 2,016 GS E&C India Private Ltd. 10,581 5,177 11,982 (2,179)GS(Cambodia) Development Co., Ltd. 1,400 51 - (3)GS Construction Arabia Co., Ltd. 105,344 221,990 83,379 (86,702)GS Saudi Co., Ltd. 752 3,144 1,715 (3,153)GS E&C Poland SP.ZO.O 516 461 - 6 GS E&C Spain S.L. 17,831 20,118 28,054 2,304 GS E&C Construction Canada Ltd. 71,938 76,988 342,397 (2,419)GS E&C Panama S.A. 998 151 160 (126)GS Inima Environment S.A (*) 520,070 297,199 194,181 1,913 GS PP Development Co., Ltd. 42,916 149,937 - (2,590)GS E&C Thai Co., Ltd. 924 5 - (143) (*) Includes the financial information of its subsidiaries. 2. Basis of preparation and a summary of significant accounting policies 2.1 Basis of preparation The Group prepares statutory financial statements in the Korean language in accordance with Korean International Financial Reporting Standards (KIFRS) enacted by the Act on External Audit of Stock of Companies. The accompanying consolidated financial statements have been translated into English from the Korean language financial statements. In the event of any differences in interpreting the financial statements or the independent auditors’ report thereon, the Korean version, which is used for regulatory reporting purposes, shall prevail. The consolidated financial statements have been prepared on a historical cost basis, except for investment properties, land and buildings classified as property, plant and equipment, derivative financial instruments, available-for-sale (AFS) financial assets, contingent consideration and non-cash distribution liabilities that have been measured at fair value. The carrying values of recognized assets and liabilities that are designated as hedged items in fair value hedges that would otherwise be carried at amortized cost are adjusted to record changes in the fair values attributable to the risks that are being hedged in effective hedge relationships. The consolidated financial statements are presented in Korean won (KRW) and all values are rounded to the nearest millions, except when otherwise indicated. 2.2 Basis of consolidation The consolidated financial statements comprise the financial statements of the Group and its subsidiaries as at December 31, 2014. Control is achieved when the Group is exposed, or has rights, to variable returns from its involvement with the investee and has the ability to affect those returns through its power over the investee. Specifically, the Group controls an investee if and only if the Group has: Power over the investee (i.e. existing rights that give it the current ability to direct the relevant activities of the
investee) Exposure, or rights, to variable returns from its involvement with the investee, and The ability to use its power over the investee to affect its returns When the Group has less than a majority of the voting or similar rights of an investee, the Group considers all relevant facts and circumstances in assessing whether it has power over an investee, including: The contractual arrangement with the other vote holders of the investee Rights arising from other contractual arrangements The Group’s voting rights and potential voting rights The Group re-assesses whether or not it controls an investee if facts and circumstances indicate that there are changes to one or more of the three elements of control. Consolidation of a subsidiary begins when the Group obtains control over the subsidiary and ceases when the Group loses control of the subsidiary. Assets, liabilities, income and expenses of a subsidiary acquired or disposed of during the year are included in the consolidated statement of profit or loss and other comprehensive income from the date the Group gains control until the date the Group ceases to control the subsidiary.
11

GS Engineering & Construction Corporation and Subsidiaries Notes to the consolidated financial statements December 31, 2014 and 2013
2. Basis of preparation and a summary of significant accounting policies (continued) 2.2 Basis of consolidation (continued) Profit or loss and each component of other comprehensive income (OCI) are attributed to the equity holders of the parent of the Group and to the non-controlling interests, even if this results in the non-controlling interests having a deficit balance. When necessary, adjustments are made to the financial statements of subsidiaries to bring their accounting policies into line with the Group’s accounting policies. All intra-group assets and liabilities, equity, income, expenses and cash flows relating to transactions between members of the Group are eliminated in full on consolidation. A change in the ownership interest of a subsidiary, without a loss of control, is accounted for as an equity transaction. If the Group loses control over a subsidiary, it derecognizes the related assets (including goodwill), liabilities, non-controlling interest and other components of equity while any resultant gain or loss is recognized in profit or loss. Any investment is recognized at fair value. 2.3 Summary of significant accounting policies 2.3.1 Business combinations and goodwill Business combinations are accounted for using the acquisition method. The cost of an acquisition is measured as the aggregate of the consideration transferred measured at acquisition date fair value and the amount of any non-controlling interests in the acquiree. For each business combination, the Group elects whether to measure the non-controlling interests in the acquiree at fair value or at the proportionate share of the acquiree’s identifiable net assets. Acquisition-related costs are expensed as incurred and included in administrative expenses. When the Group acquires a business, it assesses the financial assets and liabilities assumed for appropriate classification and designation in accordance with the contractual terms, economic circumstances and pertinent conditions as at the acquisition date. This includes the separation of embedded derivatives in host contracts by the acquiree. If the business combination is achieved in stages, any previously held equity interest is re-measured at its acquisition date fair value and any resulting gain or loss is recognized in profit or loss. It is then considered in the determination of goodwill. Any contingent consideration to be transferred by the acquirer will be recognized at fair value at the acquisition date. Contingent consideration classified as an asset or liability that is a financial instrument and within the scope of KIFRS 1039 Financial Instruments: Recognition and Measurement, is measured at fair value with changes in fair value recognized either in either profit or loss or as a change to OCI. If the contingent consideration is not within the scope of KIFRS 1039, it is measured in accordance with the appropriate KIFRS. Contingent consideration that is classified as equity is not re-measured and subsequent settlement is accounted for within equity. Goodwill is initially measured at cost, being the excess of the aggregate of the consideration transferred and the amount recognized for non-controlling interests, and any previous interest held, over the net identifiable assets acquired and liabilities assumed. If the fair value of the net assets acquired is in excess of the aggregate consideration transferred, the Group re-assesses whether it has correctly identified all of the assets acquired and all of the liabilities assumed and reviews the procedures used to measure the amounts to be recognized at the acquisition date. If the re-assessment still results in an excess of the fair value of net assets acquired over the aggregate consideration transferred, then the gain is recognized in profit or loss. After initial recognition, goodwill is measured at cost less any accumulated impairment losses. For the purpose of impairment testing, goodwill acquired in a business combination is, from the acquisition date, allocated to each of the Group’s cash-generating units that are expected to benefit from the combination, irrespective of whether other assets or liabilities of the acquiree are assigned to those units. Where goodwill has been allocated to a cash-generating unit and part of the operation within that unit is disposed of, the goodwill associated with the disposed operation is included in the carrying amount of the operation when determining the gain or loss on disposal. Goodwill disposed in these circumstances is measured based on the relative values of the disposed operation and the portion of the cash-generating unit retained.
12

GS Engineering & Construction Corporation and Subsidiaries Notes to the consolidated financial statements December 31, 2014 and 2013
2. Basis of preparation and a summary of significant accounting policies (continued) 2.3 Summary of significant accounting policies (continued) 2.3.2 Investment in associates and joint ventures An associate is an entity over which the Group has significant influence. Significant influence is the power to participate in the financial and operating policy decisions of the investee, but is not control or joint control over those policies. A joint venture is a type of joint arrangement whereby the parties that have joint control of the arrangement have rights to the net assets of the joint venture. Joint control is the contractually agreed sharing of control of an arrangement, which exists only when decisions about the relevant activities require unanimous consent of the parties sharing control. The considerations made in determining significant influence or joint control are similar to those necessary to determine control over subsidiaries. The Group’s investments in its associate and joint venture are accounted for using the equity method. Under the equity method, the investment in an associate or a joint venture is initially recognized at cost. The carrying amount of the investment is adjusted to recognize changes in the Group’s share of net assets of the associate or joint venture since the acquisition date. Goodwill relating to the associate or joint venture is included in the carrying amount of the investment and is neither amortized nor individually tested for impairment. The consolidated statement of profit or loss and other comprehensive income reflects the Group’s share of the results of operations of the associate or joint venture. Any change in OCI of those investees is presented as part of the Group’s OCI. In addition, when there has been a change recognized directly in the equity of the associate or joint venture, the Group recognizes its share of any changes, when applicable, in the consolidated statement of changes in equity. Unrealized gains and losses resulting from transactions between the Group and the associate or joint venture are eliminated to the extent of the interest in the associate or joint venture. The aggregate of the Group’s share of profit or loss of an associate and a joint venture is shown on the face of the statement of profit or loss and other comprehensive income outside operating profit and represents profit or loss after tax and non-controlling interests in the subsidiaries of the associate or joint venture. The financial statements of the associate or joint venture are prepared for the same reporting period as the Group. When necessary, adjustments are made to bring the accounting policies in line with those of the Group. After application of the equity method, the Group determines whether it is necessary to recognize an impairment loss on its investment in its associate or joint venture. At each reporting date, the Group determines whether there is objective evidence that the investment in the associate or joint venture is impaired. If there is such evidence, the Group calculates the amount of impairment as the difference between the recoverable amount of the associate or joint venture and its carrying value, then recognizes the loss as ‘Share of profit of an associate and a joint venture’ in the consolidated statement of profit or loss and other comprehensive income. Upon loss of significant influence over the associate or joint control over the joint venture, the Group measures and recognizes any retained investment at its fair value. Any difference between the carrying amount of the associate or joint venture upon loss of significant influence or joint control and the fair value of the retained investment and proceeds from disposal is recognized in profit or loss. 2.3.3 Segment reporting Operating segments are reported in a manner consistent with the internal reporting provided to the chief operating decision-maker (Note 5). The chief operating decision-maker, who is responsible for allocating resources and assessing performance of the operating segments, has been identified as the board of directors who are responsible on the Group’s strategic decisions.
13
GS Engineering & Construction Corporation and Subsidiaries Notes to the consolidated financial statements December 31, 2014 and 2013
2. Basis of preparation and a summary of significant accounting policies (continued) 2.3 Summary of significant accounting policies (continued) 2.3.4 Current versus non-current classification The Group presents assets and liabilities in the consolidated statement of financial position based on current/non-current classification. An asset as current when it is: Expected to be realized or intended to sold or consumed in normal operating cycle Held primarily for the purpose of trading Expected to be realized within twelve months after the reporting period, or Cash or cash equivalent unless restricted from being exchanged or used to settle a liability for at least twelve
months after the reporting period All other assets are classified as non-current. A liability is current when: It is expected to be settled in normal operating cycle It is held primarily for the purpose of trading It is due to be settled within twelve months after the reporting period, or There is no unconditional right to defer the settlement of the liability for at least twelve months after the
reporting period The Group classifies all other liabilities as non-current. Deferred tax assets and liabilities are classified as non-current assets and liabilities. 2.3.5 Fair value measurement The Group measures financial instruments, such as, derivatives at fair value at each balance sheet date. Fair values of financial instruments and fair value hierarchy are disclosed in Note 33. Fair value is the price that would be received to sell an asset or paid to transfer a liability in an orderly transaction between market participants at the measurement date. The fair value measurement is based on the presumption that the transaction to sell the asset or transfer the liability takes place either: In the principal market for the asset or liability, or In the absence of a principal market, in the most advantageous market for the asset or liability The principal or the most advantageous market must be accessible to by the Group. The fair value of an asset or a liability is measured using the assumptions that market participants would use when pricing the asset or liability, assuming that market participants act in their economic best interest. The Group uses valuation techniques that are appropriate in the circumstances and for which sufficient data are available to measure fair value, maximizing the use of relevant observable inputs and minimizing the use of unobservable inputs. All assets and liabilities for which fair value is measured or disclosed in the consolidated financial statements are categorized within the fair value hierarchy, described as follows, based on the lowest level input that is significant to the fair value measurement as a whole: Level 1 — Quoted (unadjusted) market prices in active markets for identical assets or liabilities Level 2 — Valuation techniques for which the lowest level input that is significant to the fair value measurement
is directly or indirectly observable Level 3 — Valuation techniques for which the lowest level input that is significant to the fair value measurement
is unobservable
14
GS Engineering & Construction Corporation and Subsidiaries Notes to the consolidated financial statements December 31, 2014 and 2013
2. Basis of preparation and a summary of significant accounting policies (continued) 2.3 Summary of significant accounting policies (continued) For assets and liabilities that are recognized in the financial statements on a recurring basis, the Group determines whether transfers have occurred between Levels in the hierarchy by re-assessing categorization (based on the lowest level input that is significant to the fair value measurement as a whole) at the end of each reporting period. For the purpose of fair value disclosures, the Group has determined classes of assets and liabilities on the basis of the nature, characteristics and risks of the asset or liability and the level of the fair value hierarchy as explained above. 2.3.6 Foreign currencies The Group’s consolidated financial statements are presented in Korean won, which is also the Group’s functional and reporting currency. 1) Transactions and balances Transactions in foreign currencies are initially recorded by the Group entities at their respective functional currency spot rates at the date the transaction first qualifies for recognition. Monetary assets and liabilities denominated in foreign currencies are retranslated at the functional currency spot rate of exchange at the reporting date. Differences arising on settlement or translation of monetary items are recognized in profit or loss. Non-monetary items that are measured in terms of historical cost in a foreign currency are translated using the exchange rates as at the dates of the initial transactions. Non-monetary items measured at fair value in a foreign currency are translated using the exchange rates at the date when the fair value is determined. The gain or loss arising on retranslation of non-monetary items is treated in line with the recognition of gain or loss on change in fair value of the item. (i.e. translation differences on items whose fair value gain or loss is recognized in other comprehensive income or profit or loss is also recognized in other comprehensive income or profit or loss, respectively). 2) Translation in foreign operations The assets and liabilities of foreign operations are translated into Korean won at the rate of exchange prevailing at the reporting date and their statements of profit or loss and other comprehensive income are translated at exchange rates prevailing at the dates of the transactions. The exchange differences arising on translation of foreign operations are recognized in other comprehensive income. On disposal of a foreign operation, the component of OCI relating to that particular foreign operation is recognized in profit or loss. 2.3.7 Financial instruments - initial recognition and subsequent measurement 1) Financial assets Initial recognition and measurement Financial assets within the scope of KIFRS 1039 are classified as financial assets at fair value through profit or loss, loans and receivables, held-to-maturity investments, available-for-sale financial assets, or as derivatives designated as hedging instruments in an effective hedge, as appropriate. All financial assets are recognized initially at fair value plus transactions costs, except in the case of financial assets recorded at fair value through profit and loss. Purchases or sales of financial assets that require delivery of assets within a time frame established by regulation or convention in the marketplace (regular way trades) are recognized on the trade date, i.e., the date that the Group commits to purchase or sell the asset. The Group’s principal financial assets include cash and other financial assets, trade and other receivables, marketable (non-marketable) financial instruments, and derivative instruments. Subsequent measurement The subsequent measurement of financial assets depends on their classification as described below:
15
GS Engineering & Construction Corporation and Subsidiaries Notes to the consolidated financial statements December 31, 2014 and 2013
2. Basis of preparation and a summary of significant accounting policies (continued) 2.3 Summary of significant accounting policies (continued) Loans and receivables Loans and receivables are non-derivative financial assets with fixed or determinable payments that are not quoted in an active market. After initial measurement, such financial assets are subsequently measured at amortized cost using the effective interest rate method (EIR), less impairment. Amortized cost is calculated by taking into account any discount or premium on acquisition and fee or costs that are an integral part of the EIR. The EIR amortization is included in finance income in the statement of profit or loss and other comprehensive income. The losses arising from impairment are recognized in consolidated the statement of profit or loss and other comprehensive income in operating expenses. Held-to-maturity investments Non-derivative financial assets with fixed or determinable payments and fixed maturities are classified as held-to maturity when the Group has the positive intention and ability to hold it to maturity. After initial measurement held-to-maturity investments are measured at amortized cost using the EIR, less impairment. Amortized cost is calculated by taking into account any discount or premium on acquisition and fee or costs that are an integral part of the EIR. The EIR amortization is included in finance income in the consolidated statement of profit or loss and other comprehensive income. The losses arising from impairment are recognized in the consolidated statement of profit or loss and other comprehensive income in finance costs. Available-for-sale financial investments Available-for-sale financial investments include equity investments and debt securities. Equity investments classified as available-for sale are those, which are neither classified as held for trading nor designated at fair value through profit or loss. Debt securities in this category are those which are intended to be held for an indefinite period of time and which may be sold in response to needs for liquidity or in response to changes in the market conditions. After initial measurement, available-for-sale financial investments are subsequently measured at fair value with unrealized gains or losses recognized as other comprehensive income in the available-for-sale reserve until the investment is derecognized, at which time the cumulative gain or loss is recognized in other operating income, or the investment is determined to be impaired, when the cumulative loss is reclassified from the available-for-sale reserve to the consolidated statement of profit or loss and other comprehensive income in finance costs. The Group evaluates whether the ability and intention to sell its available-for-sale financial assets in the near term is still appropriate. When in rare circumstances, the Group is unable to trade those financial assets due to inactive markets and management’s intention to do so significantly changes in the foreseeable future, the Group may elect to reclassify these financial assets. Reclassification to loans and receivables is permitted when the financial asset meets the definition of loans and receivables and has the intent and ability to hold these assets for the foreseeable future or maturity. Reclassification to the held-to-maturity category is permitted only when the entity has the ability and intention to hold the financial asset accordingly. For a financial asset reclassified from the available-for-sale category, the fair value at the date of reclassification becomes its new amortized cost and any previous gain or loss on that asset that has been recognized in equity is amortized to profit or loss over the remaining life of the investment using the EIR. Any difference between the new amortized cost and the maturity amount is also amortized over the remaining life of the asset using the EIR. Derecognition A financial asset (or, where applicable a part of a financial asset or part of a group of similar financial assets) is derecognized when: The rights to receive cash flows from the asset have expired, or The Group has transferred its rights to receive cash flows from the asset or has assumed an obligation to pay
the received cash flows in full without material delay to a third party under a ‘pass-through’ arrangement; and either (a) the Group has transferred substantially all the risks and rewards of the asset, or (b) the Group has neither transferred nor retained substantially all the risks and rewards of the asset, but has transferred control of the asset.
16

GS Engineering & Construction Corporation and Subsidiaries Notes to the consolidated financial statements December 31, 2014 and 2013
2. Basis of preparation and a summary of significant accounting policies (continued) 2.3 Summary of significant accounting policies (continued) When the Group has transferred its rights to receive cash flows from an asset or has entered into a pass-through arrangement, it evaluates if and to what extent it has retained the risks and rewards of ownership. When it has neither transferred nor retained substantially all of the risks and rewards of the asset, nor transferred control of the asset, the asset is recognized to the extent of the Group’s continuing involvement in the asset. Continuing involvement that takes the form of a guarantee over the transferred asset is measured at the lower of the original carrying amount of the asset and the maximum amount of consideration that the Group could be required to repay. In that case, the Group also recognizes an associated liability. The transferred asset and the associated liability are measured on a basis that reflects the rights and obligations that the Group has retained. 2) Impairment of financial assets The Group assesses at each reporting date whether there is any objective evidence that a financial asset or a group of financial assets is impaired. A financial asset or a group of financial assets is deemed to be impaired if, and only if, there is objective evidence of impairment as a result of one or more events that has occurred after the initial recognition of the asset (an incurred ‘loss event’) and that loss event has an impact on the estimated future cash flows of the financial asset or the group of financial assets that can be reliably estimated. Evidence of impairment may include indications that the debtors or a group of debtors is experiencing significant financial difficulty, default or delinquency in interest or principal payments, the probability that they will enter bankruptcy or other financial reorganization and where observable data indicate that there is a measurable decrease in the estimated future cash flows, such as changes in arrears or economic conditions that correlate with defaults. Financial assets carried at amortized cost For financial assets carried at amortized cost the Group first assesses individually whether objective evidence of impairment exists individually for financial assets that are individually significant, or collectively for financial assets that are not individually significant. If the Group determines that no objective evidence of impairment exists for an individually assessed financial asset, whether significant or not, it includes the asset in a group of financial assets with similar credit risk characteristics and collectively assesses them for impairment. Assets that are individually assessed for impairment and for which an impairment loss is, or continues to be, recognized are not included in a collective assessment of impairment. If there is objective evidence that an impairment loss has incurred, the amount of the loss is measured as the difference between the asset’s carrying amount and the present value of estimated future cash flows (excluding future expected credit losses that have not yet been incurred). The present value of the estimated future cash flows is discounted at the financial assets original effective interest rate. If a loan has a variable interest rate, the discount rate for measuring any impairment loss is the current EIR. The carrying amount of the asset is reduced through the use of an allowance account and the amount of the loss is recognized in the consolidated statement of profit or loss and other comprehensive income. Interest income continues to be accrued on the reduced carrying amount and is accrued using the rate of interest used to discount the future cash flows for the purpose of measuring the impairment loss. The interest income is recorded as part of finance income in the consolidated statement of profit or loss and other comprehensive income. Loans together with the associated allowance are written off when there is no realistic prospect of future recovery and all collateral has been realized or has been transferred to the Group. If, in a subsequent year, the amount of the estimated impairment loss increases or decreases because of an event occurring after the impairment was recognized, the previously recognized impairment loss is increased or reduced by adjusting the allowance account.
17

GS Engineering & Construction Corporation and Subsidiaries Notes to the consolidated financial statements December 31, 2014 and 2013
2. Basis of preparation and a summary of significant accounting policies (continued) 2.3 Summary of significant accounting policies (continued) Available-for-sale financial investments For available-for-sale financial investments, the Group assesses at each reporting date whether there is objective evidence that an investment or a group of investments is impaired. In the case of equity investments classified as available-for-sale, objective evidence would include a significant or prolonged decline in the fair value of the investment below its cost. ‘Significant’ is to be evaluated against the original cost of the investment and ‘prolonged’ against the period in which the fair value has been below its original cost. Where there is evidence of impairment, the cumulative loss – measured as the difference between the acquisition cost and the current fair value, less any impairment loss on that investment previously recognized in the consolidated statement of profit or loss and other comprehensive income – is removed from other comprehensive income and recognized in the consolidated statement of profit or loss and other comprehensive income. Impairment losses on equity investments are not reversed through the consolidated statement of profit or loss and other comprehensive income; increases in their fair value after impairment are recognized directly in OCI. In the case of debt instruments classified as available-for-sale, impairment is assessed based on the same criteria as financial assets carried at amortized cost. However, the amount recorded for impairment is the cumulative loss measured as the difference between the amortized cost and the current fair value, less any impairment loss on that investment previously recognized in the consolidated statement of profit or loss and other comprehensive income. Future interest income continues to be accrued based on the reduced carrying amount of the asset and is accrued using the rate of interest used to discount the future cash flows for the purpose of measuring the impairment loss. The interest income is recorded as part of finance income. If, in a subsequent year, the fair value of a debt instrument increases and the increase can be objectively related to an event occurring after the impairment loss was recognized in the consolidated statement of profit or loss and other comprehensive income, the impairment loss is reversed through the consolidated statement of profit or loss and other comprehensive income. 3) Financial liabilities Initial recognition and measurement Financial liabilities within the scope of KIFRS 1039 are classified as financial liabilities at fair value through profit or loss, loans and borrowings, or as derivatives designated as hedging instruments in an effective hedge, as appropriate. All financial liabilities are recognized initially at fair value and in the case of loans and borrowings, plus directly attributable transaction costs. The Group’s financial liabilities include trade and other payables, current financial liabilities and long-term financial liabilities. Subsequent measurement The measurement of financial liabilities depends on their classification as described below: Loans and borrowings After initial recognition, interest bearing loans and borrowings are subsequently measured at amortized cost using the EIR method. Gains and losses are recognized in the statement of profit or loss and other comprehensive income when the liabilities are derecognized as well as through EIR amortization process. Amortized cost is calculated by taking into account any discount or premium on acquisition and fee or costs that are an integral part of the EIR. The EIR amortization is included in finance cost in the consolidated statement of profit or loss and other comprehensive income.
18
GS Engineering & Construction Corporation and Subsidiaries Notes to the consolidated financial statements December 31, 2014 and 2013
2. Basis of preparation and a summary of significant accounting policies (continued) 2.3 Summary of significant accounting policies (continued) Financial guarantee contracts Financial guarantee contracts issued by the Group are those contracts that require a payment to be made to reimburse the holder for a loss it incurs because the specified debtor fails to make a payment when due in accordance with the terms of a debt instrument. Financial guarantee contracts are recognized initially as a liability at fair value, adjusted for transaction costs that are directly attributable to the issuance of the guarantee. Subsequently, the liability is measured at the higher of the best estimate of the expenditure required to settle the present obligation at the reporting date and the amount recognized less cumulative amortization Derecognition A financial liability is derecognized when the obligation under the liability is discharged or cancelled or expires. When an existing financial liability is replaced by another from the same lender on substantially different terms, or the terms of an existing liability are substantially modified, such an exchange or modification is treated as a derecognition of the original liability and the recognition of a new liability, and the difference in the respective carrying amounts is recognized in the consolidated statement of profit or loss and other comprehensive income. 4) Offsetting of financial instruments Financial assets and financial liabilities are offset and the net amount reported in the consolidated statement of financial position if, and only if, there is a currently enforceable legal right to offset the recognized amounts and there is an intention to settle on a net basis, or to realize the assets and settle the liabilities simultaneously. 2.3.8 Derivative financial instruments and hedge accounting Derivatives are initially recognized at fair value on the date when a derivative contract is entered into and are subsequently re-measured at their fair value. Changes in the fair value of the derivatives that are not qualified for hedge accounting are recognized in the consolidated statements of profit or loss within 'other operating income (expenses)' or 'finance income (expenses)' according to the nature of transactions. The Group designates certain derivatives as either: hedges of the fair value of recognized assets or liabilities or a firm commitment (fair valuehedge); or hedges of a particular risk associated with a recognized asset or liability or a highly probable forecast
transaction (cash flow hedge) The Group documents at the inception of the transaction the relationship between hedging instruments and hedged items, as well as its risk management objectives and strategy for undertaking various hedging transactions. The Group also documents its assessment, both at hedge inception and on an ongoing basis, of whether the derivatives that are used in hedging transactions are highly effective in offsetting changes in fair values or cash flows of hedged items. The fair values of various derivative instruments used for hedging purposes are disclosed in Note 12. Movements on the hedging reserve in other comprehensive income are shown in Note 12. The full fair value of a hedging derivative is classified as a non-current asset or liability when the remaining maturity of the hedged item is longer than the Group’s normal business cycle and as a current asset or liability when the remaining maturity of the hedged item is shorter than the Group’s normal business cycle. Trading derivatives are classified as a non-current asset or liability when the remaining maturity of the hedged item is more than 12 months and as a current asset or liability when the remaining maturity of the hedged item is less than 12 months. (a) Fair value hedge Changes in the fair value of derivatives that are designated and qualify as fair value hedges are recorded in the consolidated statements of profit or loss, together with any changes in the fair value of the hedged asset or liability that are attributable to the hedged risk.
19

GS Engineering & Construction Corporation and Subsidiaries Notes to the consolidated financial statements December 31, 2014 and 2013
2. Basis of preparation and a summary of significant accounting policies (continued) 2.3 Summary of significant accounting policies (continued) (b) Cash flow hedge The effective portion of changes in the fair value of derivatives that are designated and qualify as cash flow hedges is recognized in other comprehensive income. The gain or loss relating to the ineffective portion is recognized immediately in the consolidated statements of profit or loss within other operating income (expenses). Amounts accumulated in equity are reclassified to profit or loss in the periods when the hedged item affects profit or loss (for example, when the forecast purchase that is hedged takes place). When a hedging instrument expires or is sold, or when a hedge no longer meets the criteria for hedge accounting, any cumulative gain or loss existing in equity at that time remains in equity and is recognized when the forecast transaction is ultimately recognized in the consolidated statements of profit or loss. When a forecast transaction is no longer expected to occur, the cumulative gain or loss that was reported in equity is immediately transferred to the consolidated statements of profit or loss within other operating income (expenses). 2.3.9 Inventories Inventories are stated at the lower of cost and net realizable value. Raw materials and supplies are determined using the periodic average method. Other inventories are determined using the specific identification method. 2.3.10 Property, plant and equipment All property, plant and equipment are stated at cost, net of accumulated depreciation and accumulated impairment losses, if any. Such cost includes the cost of replacing part of the property, plant and equipment and borrowing costs for long-term construction projects if the recognition criteria are met. Likewise, when a major inspection is performed, its cost is recognized in the carrying amount of the plant and equipment as a replacement if the recognition criteria are satisfied. All other repair and maintenance costs are recognized in profit or loss as incurred. Land is not depreciated but depreciation on other assets is calculated using the straight-line method to allocate the difference between their cost and their residual values over their estimated useful lives, as follows:
Buildings 10 to 50 years Structures 10 to 40 years Machinery 5 to 20 years Construction equipment 6 to 12 years Vehicles 6 to 10 years Tools 5 to 6 years Equipment 3 to 20 years The assets’ residual values, useful lives and methods of depreciation are reviewed at each financial year end, and adjusted prospectively, if appropriate. 2.3.11 Borrowing costs Borrowing costs directly attributable to the acquisition, construction or production of an asset that necessarily takes a substantial period of time to get ready for its intended use or sale are capitalized as part of the cost of the asset. All other borrowing costs are expensed in the period in which they occur. Borrowing costs consist of interest and other costs that an entity incurs in connection with the borrowing of funds.
20
GS Engineering & Construction Corporation and Subsidiaries Notes to the consolidated financial statements December 31, 2014 and 2013
2. Basis of preparation and a summary of significant accounting policies (continued) 2.3 Summary of significant accounting policies (continued) 2.3.12 Intangible assets Amortization of intangible assets is calculated using the straight-line method over their estimated useful lives. Membership rights are regarded as intangible assets with indefinite useful life and not amortized because there is no foreseeable limit to the period over which the asset is expected to be utilized. Rental rights 20 years Technical rights 10 years Concession assets 18 years Software 4 to 6 years Others 4 to 6 years 2.3.13 Investment properties Investment property is held to earn rentals or for capital appreciation or both. Investment property is measured initially at its cost including transaction costs incurred in acquiring the asset. After recognition as an asset, investment property is carried at cost less accumulated depreciation and impairment losses. Investment property, except for land, is depreciated using straight-line method over their useful lives of 40 years. 2.3.14 Impairment of non-financial assets The Group assesses, at each reporting date, whether there is an indication that an asset may be impaired. If any indication exists, or when annual impairment testing for an asset is required, the Group estimates the asset’s recoverable amount. An asset’s recoverable amount is the higher of an asset’s or cash-generating unit’s (CGU) fair value less costs of disposal and its value in use. Recoverable amount is determined for an individual asset, unless the asset does not generate cash inflows that are largely independent of those from other assets or groups of assets. When the carrying amount of an asset or CGU exceeds its recoverable amount, the asset is considered impaired and is written down to its recoverable amount. In assessing value in use, the estimated future cash flows are discounted to their present value using a pre-tax discount rate that reflects current market assessments of the time value of money and the risks specific to the asset. In determining fair value less costs of disposal, recent market transactions are taken into account. If no such transactions can be identified, an appropriate valuation model is used. These calculations are corroborated by valuation multiples, quoted share prices for publicly traded companies or other available fair value indicators. Impairment losses of continuing operations are recognized in the consolidated statement of profit or loss and other comprehensive income in expense categories consistent with the function of the impaired asset. For assets excluding goodwill, an assessment is made at each reporting date to determine whether there is an indication that previously recognized impairment losses no longer exist or have decreased. If such indication exists, the Group estimates the asset’s or CGU’s recoverable amount. A previously recognized impairment loss is reversed only if there has been a change in the assumptions used to determine the asset’s recoverable amount since the last impairment loss was recognized. The reversal is limited so that the carrying amount of the asset does not exceed its recoverable amount, nor exceed the carrying amount that would have been determined, net of depreciation, had no impairment loss been recognized for the asset in prior years. Such reversal is recognized in the consolidated statement of profit or loss and other comprehensive income unless the asset is carried at a revalued amount, in which case, the reversal is treated as a revaluation increase. Intangible assets with indefinite useful lives are tested for impairment annually as at December 31 each assets or at the CGU level.
21

GS Engineering & Construction Corporation and Subsidiaries Notes to the consolidated financial statements December 31, 2014 and 2013
2. Basis of preparation and a summary of significant accounting policies (continued) 2.3 Summary of significant accounting policies (continued) 2.3.15 Pension benefits The Group operates defined benefit plan, which requires contributions to be made to insurance companies or trustee administered funds. The contributions are determined by periodic actuarial calculations. Typically amount of pension benefit that an employee will receive on retirement is defined based on one or more factors such as age, years of service and compensation and others. The liability recognized in the consolidated statements of financial position in respect of defined benefit pension plans is the present value of the defined benefit obligation at the end of the reporting period less the fair value of plan assets. The defined benefit obligation is calculated annually by independent actuaries using the projected unit credit method. The present value of the defined benefit obligation is determined by discounting the estimated future cash outflows using interest rates of high-quality corporate bonds whose maturity is approximate to the payment date of related pension obligation. The remeasurements of the net defined benefit liability are recognized in profit or loss. If any plan amendments, curtailments, or settlements occur, past service costs or any gains or losses on settlement are recognized as profit or loss for the year. 2.3.16 Provisions Provisions are recognized when the Group has a present obligation (legal or constructive) as a result of a past event, it is probable that an outflow of resources embodying economic benefits will be required to settle the obligation and a reliable estimate can be made of the amount of the obligation. When the Group expects some or all of a provision to be reimbursed, for example, under an insurance contract, the reimbursement is recognized as a consolidated asset, but only when the reimbursement is virtually certain. The expense relating to a provision is presented in the consolidated statement of profit or loss and other comprehensive income net of any reimbursement. 2.3.17 Current and deferred income tax Current income tax Current income tax assets and liabilities for the current and prior periods are measured at the amount expected to be recovered from or paid to the taxation authorities. The tax rates and tax laws used to compute the amount are those that are enacted or substantively enacted, by the reporting date, in the countries where the Group operates and generates taxable income. Current income tax relating to items recognized directly in equity is recognized in equity and not in the statement of profit or loss and other comprehensive income. Management periodically evaluates positions taken in the tax returns with respect to situations in which applicable tax regulations are subject to interpretation and establishes provisions where appropriate. Deferred tax Deferred tax is provided using the liability method on temporary differences at the reporting date between the tax bases of assets and liabilities and their carrying amounts for financial reporting purposes at the reporting date. Deferred tax liabilities are recognized for all taxable temporary differences, except: Where the deferred tax liability arises from the initial recognition of goodwill or of an asset or liability in a
transaction that is not a business combination and, at the time of the transaction, affects neither the accounting profit nor taxable profit or loss.
In respect of taxable temporary differences associated with investments in subsidiaries, associates and interests in joint ventures, where the timing of the reversal of the temporary differences can be controlled and it is probable that the temporary differences will not reverse in the foreseeable future.
22

GS Engineering & Construction Corporation and Subsidiaries Notes to the consolidated financial statements December 31, 2014 and 2013
2. Basis of preparation and a summary of significant accounting policies (continued) 2.3 Summary of significant accounting policies (continued) Deferred tax assets are recognized for all deductible temporary differences, carry forward of unused tax credits and unused tax losses, to the extent that it is probable that taxable profit will be available against which the deductible temporary differences, and the carry forward of unused tax credits and unused tax losses can be utilized except:
Where the deferred tax asset relating to the deductible temporary difference arises from the initial recognition
of an asset or liability in a transaction that is not a business combination and, at the time of the transaction, affects neither the accounting profit nor taxable profit or loss
In respect of deductible temporary differences associated with investments in subsidiaries, associates and interests in joint ventures, deferred tax assets are recognized only to the extent that it is probable that the temporary differences will reverse in the foreseeable future and taxable profit will be available against which the temporary differences can be utilized
The carrying amount of deferred tax assets is reviewed at each reporting date and reduced to the extent that it is no longer probable that sufficient taxable profit will be available to allow all or part of the deferred tax asset to be utilized. Unrecognized deferred tax assets are reassessed at each reporting date and are recognized to the extent that it has become probable that future taxable profits will allow the deferred tax asset to be recovered. Deferred tax assets and liabilities are measured at the tax rates that are expected to apply in the year when the asset is realized or the liability is settled, based on tax rates (and tax laws) that have been enacted or substantively enacted at the reporting date. Deferred tax relating to items recognized outside profit or loss is recognized outside profit or loss. Deferred tax items are recognized in correlation to the underlying transaction either in other comprehensive income or directly in equity. Deferred tax assets and deferred tax liabilities are offset, if a legally enforceable right exists to set off current tax assets against current income tax liabilities and the deferred taxes relate to the same taxable entity and the same taxation authority. 2.3.18 Revenue recognition Revenue is measured at the fair value of the consideration received or receivable, and represents amounts receivable for goods and rendering of services arising from normal activities of the Group. It is stated as net of value added taxes, returns, rebates and discounts, after elimination of inter-company transactions. The Group recognizes revenue when the amount of revenue can be reliably measured; when it is probable that future economic benefits will flow to the Group; and when specific criteria have been met for each of the Group’s activities, as described below. The revenue can be reliably measured only when any contingency related to sales is resolved. The Group bases its estimate on historical results, taking into consideration the type of customer, the type of transaction and the specifics of each arrangement. (a) Construction contracts A construction contract as defined by KIFRS 1011, Construction Contracts, is a contract specifically negotiated for the construction of an asset. When the outcome of a construction contract can be estimated reliably and it is probable that the contract will be profitable, contract revenue is recognized over the period of the contract by reference to the stage of completion. Contract costs are recognized as expenses by reference to the stage of completion of the contract activity at the end of the reporting period. When it is probable that total contract costs will exceed total contract revenue, the expected loss on the construction contract is immediately recognized as an expense. When the outcome of a construction contract cannot be estimated reliably, contract revenue is recognized only to the extent of contract costs incurred that are likely to be recoverable. Variations in contract work, claims and incentive payments are included in contract revenue to the extent that may have been agreed with the customer and are capable of being reliably measured. Contract costs are recognized as an expense in the period in which they are incurred.
23
GS Engineering & Construction Corporation and Subsidiaries Notes to the consolidated financial statements December 31, 2014 and 2013
2. Basis of preparation and a summary of significant accounting policies (continued) 2.3 Summary of significant accounting policies (continued) The stage of completion is measured by reference to the contract costs incurred up to the end of the reporting period as a percentage of total estimated costs for each contract. Costs incurred in the year in connection with future activity on a contract are excluded from contract costs in determining the stage of completion. These amounts are recognized as inventory, prepaid expenses or other assets. On the consolidated statements of financial position, the Group reports the net contract position for each contract as either an asset or a liability. A contract represents an asset where costs incurred plus recognized profits (less recognized losses) exceed progress billings (due from customers for contract work); a contract represents a liability where the opposite is the case (due to customers for contract work). The Group uses the percentage-of-completion method to recognize its revenues from building and selling apartment houses in accordance with “2011-I-KQA”, an official opinion issued by Korea Accounting Institute. This accounting treatment is valid only under the Korean International Financial Reporting Standards as stated in sub-clause 1 of clause 1, Article 13 of the Act on External Audit of Corporations. (b) Rendering of services Revenue is recognized at the time of completion when the services are rendered. Other revenue are recognized when the risks have been transferred to customers, the amount of revenue can be reliably measured and high probability that future economic benefits will flow to the Group. (c) Interest income Interest income is recognized using the effective interest method according to the time passed. When a loan and receivable is impaired, the Group reduces the carrying amount to its recoverable amount and continues unwinding the discount as interest income. Interest income on impaired loan and receivables is recognized using the original effective interest rate. (d) Dividend income Dividend income is recognized when the right to receive payment is established. 2.4 New and amended standards and interpretations The Group applied for the first time certain standards and amendments, which are effective for annual periods beginning on or after January 1, 2014. The nature and the impact of each new standard and amendment are described below: Investment Entities (Amendments to KIFRS 1110, KIFRS 1112 and KIFRS 1027) These amendments provide an exception to the consolidation requirement for entities that meet the definition of an investment entity under KIFRS 1110 Consolidated Financial Statements and must be applied retrospectively, subject to certain transition relief. The exception to consolidation requires investment entities to account for subsidiaries at fair value through profit or loss. These amendments have no impact on the Group, since the Group is not qualified to be an investment entity under KIFRS 1110. Offsetting Financial Assets and Financial Liabilities - Amendments to KIFRS 1032 These amendments clarify the meaning of ’currently has a legally enforceable right to set-off’ and the criteria for non-simultaneous settlement mechanisms of clearing houses to qualify for offsetting and is applied retrospectively. These amendments have no impact on the Group. Recoverable Amount Disclosures for Non-Financial Assets – Amendments to KIFRS 1036 Impairment of Assets These amendments remove the unintended consequences of KIFRS 1113 on the disclosures required under KIFRS 1036. In addition, these amendments require disclosure of the recoverable amounts for the assets or CGUs for which impairment loss has been recognized or reversed during the period.
24
GS Engineering & Construction Corporation and Subsidiaries Notes to the consolidated financial statements December 31, 2014 and 2013
2.4 New and amended standards and interpretations (continued) Novation of Derivatives and Continuation of Hedge Accounting – Amendments to KIFRS 1039 These amendments provide relief from discontinuing hedge accounting when novation of a derivative designated as a hedging instrument meets certain criteria and retrospective application is required. These amendments have no impact on the Group as the Group has not novated its derivatives during the current or prior periods. KIFRS 2021 Levies (Enactment) KIFRS 2021 clarifies that an entity recognizes a liability for a levy when the activity that triggers payment, as identified by the relevant legislation, occurs. For a levy that is triggered upon reaching a minimum threshold, the interpretation clarifies that no liability should be anticipated before the specified minimum threshold is reached. The Group is expecting that the impact of this enactment is not material to its consolidated financial statements. 3. Significant accounting judgments, estimates and assumptions The preparation of the Group’s consolidated financial statements requires management to make judgments, estimates and assumptions that affect the reported amounts of revenues, expenses, assets and liabilities, and the disclosure of contingent liabilities, at the end of the reporting period. However, uncertainty about these assumptions and estimates could result in outcomes that require a material adjustment to the carrying amount of the asset or liability affected in future periods. Other disclosures relating to the Group’s exposure to risks and uncertainties are provided in Note 32. 3.1 Estimates and assumptions The key assumptions concerning the future and other key sources of estimation uncertainty at the reporting date, that have a significant risk of causing a material adjustment to the carrying amounts of assets and liabilities within the next financial year are discussed below. The Group based its assumptions and estimates on parameters available when the consolidated financial statements were prepared. Existing circumstances and assumptions about future developments, however, may change due to market changes or circumstances arising beyond control of the Group. Such changes are reflected in the assumptions when they occur. Impairment of non-financial assets The Group assesses at each reporting date whether there is an indication that an asset may be impaired. Goodwill and Intangible assets with indefinite useful lives are tested for impairment annually as at December 31 either individually or at the cash generating unit level, as appropriate and when circumstances indicate that the carrying value may be impaired. Other non-financial assets are assessed when there is an indication that an asset may be impaired. To calculate the value in use, the Group estimates the expected future cash inflows derived from cash generating units and selects the appropriate discount rate to calculate the present value of the expected future cash inflows. Taxes Deferred tax assets are recognized for unused tax losses to the extent that it is probable that taxable profit will be available against which the losses can be utilized. Significant management judgment is required to determine the amount of deferred tax assets that can be recognized, based upon the likely timing and the level of future taxable profits together with future tax planning strategies.
25

GS Engineering & Construction Corporation and Subsidiaries Notes to the consolidated financial statements December 31, 2014 and 2013
3. Significant accounting judgments, estimates and assumptions (continued) Defined benefit plans The present value of the defined benefit pension plan is determined using actuarial valuations. An actuarial valuation involves making various assumptions that may differ from actual developments in the future. These include the determination of the discount rate, future salary increases and mortality rates. Due to the complexities involved in the valuation and its long-term nature, a defined benefit obligation is highly sensitive to changes in these assumptions. All assumptions are reviewed at each reporting date. In determining the appropriate discount rate, management considers the interest rates of corporate bonds in currencies consistent with the currencies of the post-employment benefit obligation with at least an ‘AA+’ rating or above, as set by an internationally acknowledged rating agency. The mortality rate is based on publicly available mortality tables for the specific countries. Future salary increases and pension increases are based on expected future inflation rates for the respective countries. Further details about pension obligations are given in Note 19. 4. Standards issued but not yet effective The standards and interpretations that are issued, but not yet effective, up to the date of issuance of the Group’s consolidated financial statements are disclosed below. The Group intends to adopt these standards, if applicable, when they become effective. Amendments to KIFRS 1019 Defined Benefit Plans: Employee Contributions KIFRS 1019 requires an entity to consider contributions from employees or third parties when accounting for defined benefit plans. Where the contributions are linked to service, they should be attributed to periods of service as a negative benefit. These amendments clarify that, if the amount of the contributions is independent of the number of years of service, an entity is permitted to recognize such contributions as a reduction in the service cost in the period in which the service is rendered, instead of allocating the contributions to the periods of service. This amendment is effective for annual periods beginning on or after July 1, 2014. It is not expected that this amendment would be relevant to the Group, since none of the entities within the Group has defined benefit plans with contributions from employees or third parties. Amendments to KIFRS 1111 Joint Arrangements: Accounting for Acquisitions of Interests The amendments to KIFRS 1111 require that a joint operator accounting for the acquisition of an interest in a joint operation, in which the activity of the joint operation constitutes a business must apply the relevant KIFRS 1103 principles for business combinations accounting. The amendments also clarify that a previously held interest in a joint operation is not remeasured on the acquisition of an additional interest in the same joint operation while joint control is retained. In addition, a scope exclusion has been added to KIFRS 1111 to specify that the amendments do not apply when the parties sharing joint control, including the reporting entity, are under common control of the same ultimate controlling party. The amendments apply to both the acquisition of the initial interest in a joint operation and the acquisition of any additional interests in the same joint operation and are prospectively effective for annual periods beginning on or after January 1, 2016, with early adoption permitted. These amendments are not expected to have any impact to the Group. Amendments to KIFRS 1016 and KIFRS 1038: Clarification of Acceptable Methods of Depreciation and Amortization The amendments clarify the principle in KIFRS 1016 and KIFRS 1038 that revenue reflects a pattern of economic benefits that are generated from operating a business (of which the asset is part) rather than the economic benefits that are consumed through use of the asset. As a result, a revenue-based method cannot be used to depreciate property, plant and equipment and may only be used in very limited circumstances to amortize intangible assets. The amendments are effective prospectively for annual periods beginning on or after January 1, 2016, with early adoption permitted. These amendments are not expected to have any impact to the Group given that the Group has not used a revenue-based method to depreciate its non-current assets.
26
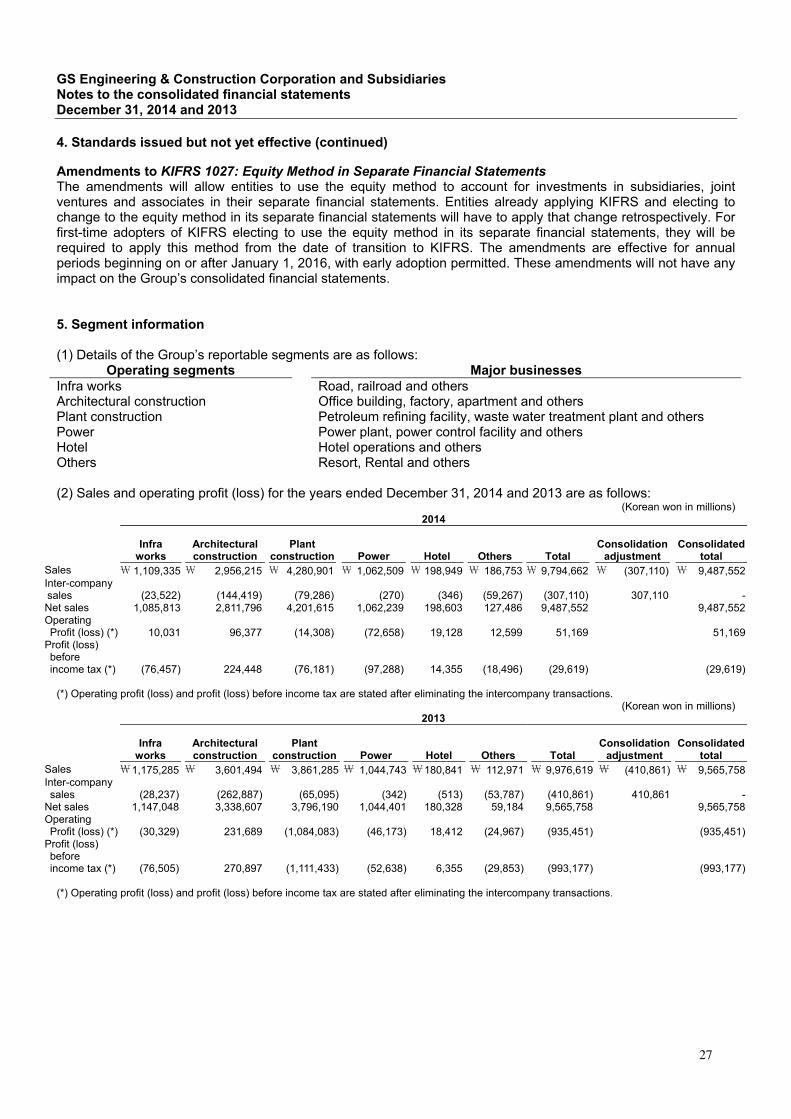
GS Engineering & Construction Corporation and Subsidiaries Notes to the consolidated financial statements December 31, 2014 and 2013
4. Standards issued but not yet effective (continued) Amendments to KIFRS 1027: Equity Method in Separate Financial Statements The amendments will allow entities to use the equity method to account for investments in subsidiaries, joint ventures and associates in their separate financial statements. Entities already applying KIFRS and electing to change to the equity method in its separate financial statements will have to apply that change retrospectively. For first-time adopters of KIFRS electing to use the equity method in its separate financial statements, they will be required to apply this method from the date of transition to KIFRS. The amendments are effective for annual periods beginning on or after January 1, 2016, with early adoption permitted. These amendments will not have any impact on the Group’s consolidated financial statements. 5. Segment information (1) Details of the Group’s reportable segments are as follows:
Operating segments Major businesses Infra works Road, railroad and others Architectural construction Office building, factory, apartment and others Plant construction Petroleum refining facility, waste water treatment plant and others Power Power plant, power control facility and others Hotel Hotel operations and others Others Resort, Rental and others (2) Sales and operating profit (loss) for the years ended December 31, 2014 and 2013 are as follows:
(Korean won in millions) 2014
Infra works
Architectural construction
Plant construction Power Hotel Others Total
Consolidationadjustment
Consolidatedtotal
Sales \ 1,109,335 \ 2,956,215 \ 4,280,901 \ 1,062,509 \ 198,949 \ 186,753 \ 9,794,662 \ (307,110) \ 9,487,552Inter-company sales
(23,522) (144,419) (79,286) (270) (346) (59,267) (307,110) 307,110 -
Net sales 1,085,813 2,811,796 4,201,615 1,062,239 198,603 127,486 9,487,552 9,487,552Operating Profit (loss) (*)
10,031 96,377 (14,308) (72,658) 19,128 12,599 51,169 51,169
Profit (loss) before income tax (*)
(76,457) 224,448 (76,181) (97,288) 14,355 (18,496) (29,619) (29,619) (*) Operating profit (loss) and profit (loss) before income tax are stated after eliminating the intercompany transactions.
(Korean won in millions) 2013
Infra works
Architectural construction
Plant construction Power Hotel Others Total
Consolidationadjustment
Consolidatedtotal
Sales \1,175,285 \ 3,601,494 \ 3,861,285 \ 1,044,743 \180,841 \ 112,971 \ 9,976,619 \ (410,861) \ 9,565,758Inter-company sales
(28,237) (262,887) (65,095) (342) (513) (53,787) (410,861) 410,861 -
Net sales 1,147,048 3,338,607 3,796,190 1,044,401 180,328 59,184 9,565,758 9,565,758Operating Profit (loss) (*)
(30,329) 231,689 (1,084,083) (46,173) 18,412 (24,967) (935,451) (935,451)
Profit (loss) before income tax (*)
(76,505) 270,897 (1,111,433) (52,638) 6,355 (29,853) (993,177) (993,177) (*) Operating profit (loss) and profit (loss) before income tax are stated after eliminating the intercompany transactions.
27
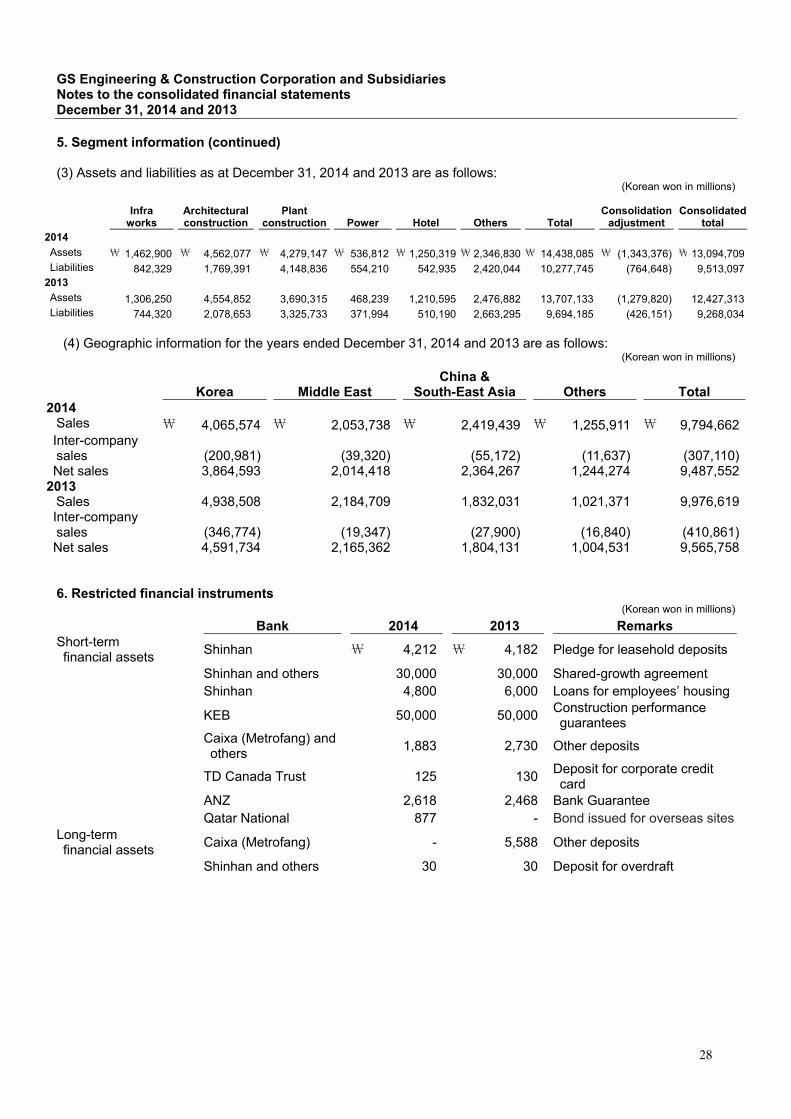
GS Engineering & Construction Corporation and Subsidiaries Notes to the consolidated financial statements December 31, 2014 and 2013
5. Segment information (continued) (3) Assets and liabilities as at December 31, 2014 and 2013 are as follows:
(Korean won in millions)
Infra works
Architectural construction
Plant construction Power Hotel Others Total
Consolidationadjustment
Consolidatedtotal
2014 Assets \ 1,462,900 \ 4,562,077 \ 4,279,147 \ 536,812 \ 1,250,319 \ 2,346,830 \ 14,438,085 \ (1,343,376) \ 13,094,709Liabilities 842,329 1,769,391 4,148,836 554,210 542,935 2,420,044 10,277,745 (764,648) 9,513,097
2013 Assets 1,306,250 4,554,852 3,690,315 468,239 1,210,595 2,476,882 13,707,133 (1,279,820) 12,427,313Liabilities 744,320 2,078,653 3,325,733 371,994 510,190 2,663,295 9,694,185 (426,151) 9,268,034 (4) Geographic information for the years ended December 31, 2014 and 2013 are as follows:
(Korean won in millions)
Korea Middle East China &
South-East Asia Others Total 2014 Sales \ 4,065,574 \ 2,053,738 \ 2,419,439 \ 1,255,911 \ 9,794,662 Inter-company sales
(200,981) (39,320) (55,172) (11,637) (307,110)
Net sales 3,864,593 2,014,418 2,364,267 1,244,274 9,487,552 2013 Sales 4,938,508 2,184,709 1,832,031 1,021,371 9,976,619 Inter-company sales
(346,774) (19,347) (27,900) (16,840) (410,861)
Net sales 4,591,734 2,165,362 1,804,131 1,004,531 9,565,758 6. Restricted financial instruments
(Korean won in millions) Bank 2014 2013 Remarks
Short-term financial assets
Shinhan \ 4,212 \ 4,182 Pledge for leasehold deposits
Shinhan and others 30,000 30,000 Shared-growth agreement Shinhan 4,800 6,000 Loans for employees’ housing
KEB 50,000 50,000 Construction performance guarantees
Caixa (Metrofang) and
others 1,883 2,730 Other deposits
TD Canada Trust 125 130 Deposit for corporate credit card
ANZ 2,618 2,468 Bank Guarantee Qatar National 877 - Bond issued for overseas sitesLong-term financial assets
Caixa (Metrofang) - 5,588 Other deposits
Shinhan and others 30 30 Deposit for overdraft
28
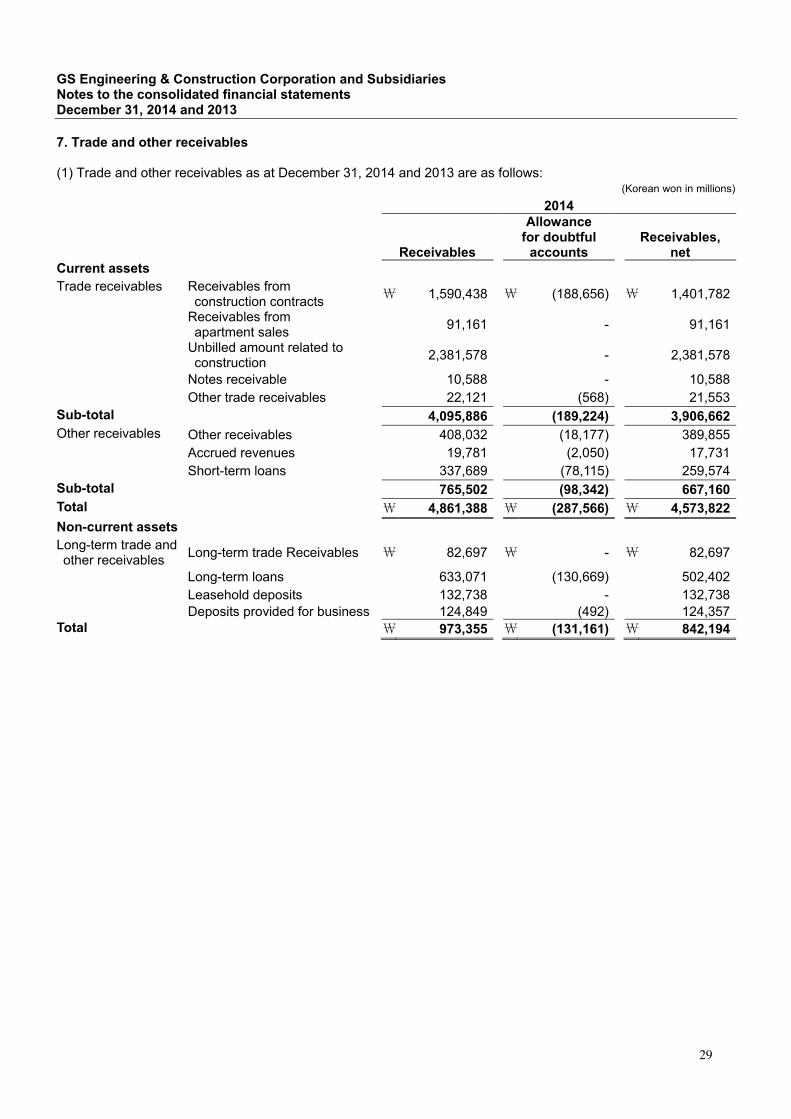
GS Engineering & Construction Corporation and Subsidiaries Notes to the consolidated financial statements December 31, 2014 and 2013
7. Trade and other receivables (1) Trade and other receivables as at December 31, 2014 and 2013 are as follows:
(Korean won in millions) 2014
Receivables
Allowance for doubtful
accounts Receivables,
net Current assets Trade receivables Receivables from
construction contracts \ 1,590,438 \ (188,656) \ 1,401,782
Receivables from apartment sales
91,161 - 91,161
Unbilled amount related to construction
2,381,578 - 2,381,578
Notes receivable 10,588 - 10,588 Other trade receivables 22,121 (568) 21,553 Sub-total 4,095,886 (189,224) 3,906,662 Other receivables Other receivables 408,032 (18,177) 389,855 Accrued revenues 19,781 (2,050) 17,731 Short-term loans 337,689 (78,115) 259,574 Sub-total 765,502 (98,342) 667,160 Total \ 4,861,388 \ (287,566) \ 4,573,822
Non-current assets Long-term trade and other receivables
Long-term trade Receivables \ 82,697 \ - \ 82,697
Long-term loans 633,071 (130,669) 502,402 Leasehold deposits 132,738 - 132,738 Deposits provided for business 124,849 (492) 124,357 Total \ 973,355 \ (131,161) \ 842,194
29
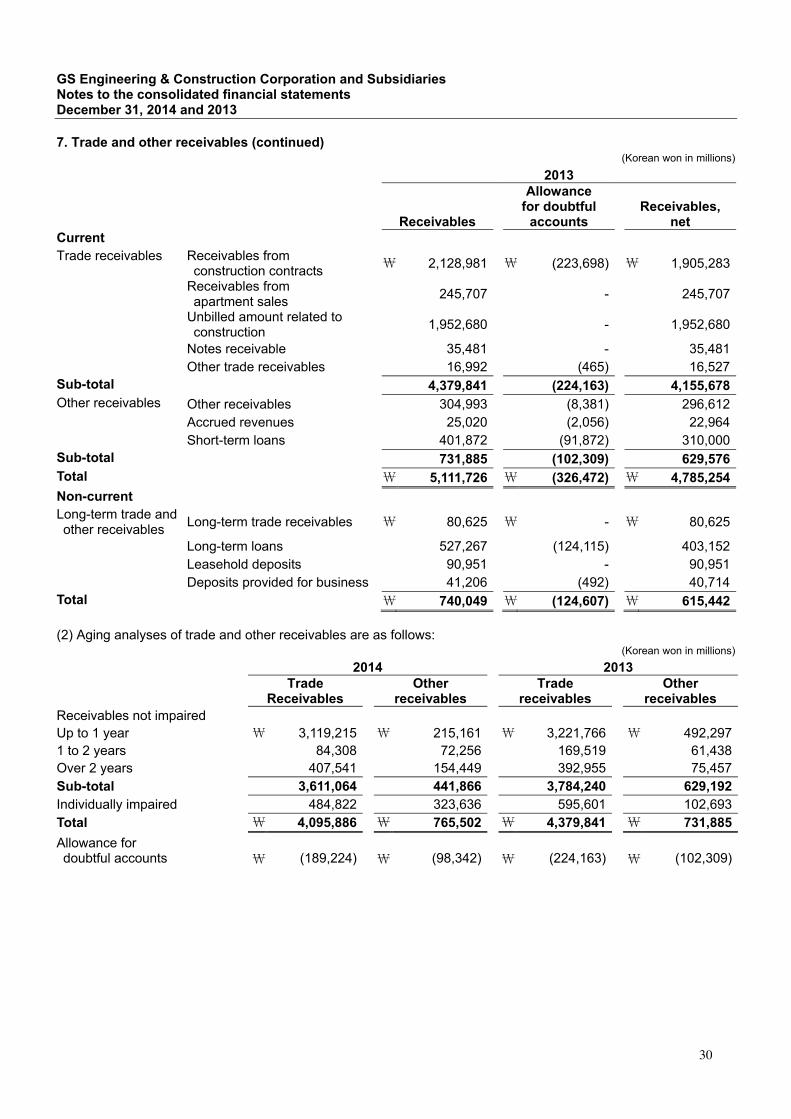
GS Engineering & Construction Corporation and Subsidiaries Notes to the consolidated financial statements December 31, 2014 and 2013
7. Trade and other receivables (continued)
(Korean won in millions) 2013
Receivables
Allowance for doubtful
accounts Receivables,
net Current Trade receivables Receivables from
construction contracts \ 2,128,981 \ (223,698) \ 1,905,283
Receivables from apartment sales
245,707 - 245,707
Unbilled amount related to construction
1,952,680 - 1,952,680
Notes receivable 35,481 - 35,481 Other trade receivables 16,992 (465) 16,527 Sub-total 4,379,841 (224,163) 4,155,678 Other receivables Other receivables 304,993 (8,381) 296,612 Accrued revenues 25,020 (2,056) 22,964 Short-term loans 401,872 (91,872) 310,000 Sub-total 731,885 (102,309) 629,576 Total \ 5,111,726 \ (326,472) \ 4,785,254
Non-current Long-term trade and other receivables
Long-term trade receivables \ 80,625 \ - \ 80,625
Long-term loans 527,267 (124,115) 403,152 Leasehold deposits 90,951 - 90,951 Deposits provided for business 41,206 (492) 40,714 Total \ 740,049 \ (124,607) \ 615,442 (2) Aging analyses of trade and other receivables are as follows:
(Korean won in millions) 2014 2013
Trade Receivables
Other receivables
Trade receivables
Other receivables
Receivables not impaired Up to 1 year \ 3,119,215 \ 215,161 \ 3,221,766 \ 492,297 1 to 2 years 84,308 72,256 169,519 61,438 Over 2 years 407,541 154,449 392,955 75,457 Sub-total 3,611,064 441,866 3,784,240 629,192 Individually impaired 484,822 323,636 595,601 102,693 Total \ 4,095,886 \ 765,502 \ 4,379,841 \ 731,885
Allowance for doubtful accounts \ (189,224) \ (98,342) \
(224,163)
\ (102,309)
30

GS Engineering & Construction Corporation and Subsidiaries Notes to the consolidated financial statements December 31, 2014 and 2013
7. Trade and other receivables (continued) (3) Changes in allowance for doubtful accounts as at December 31, 2014 and 2013 are as follows:
(Korean won in millions) 2014
Beginning
Allowance for doubtful
accounts Reversal / write-off Ending
Trade and other receivables
Trade receivables \ 224,163 \ 1,565 \ (36,504) \ 189,224 Other receivables 8,381 11,686 (1,890) 18,177 Accrued revenues 2,056 - (6) 2,050 Short-term loans 91,872 - (13,757) 78,115
Sub-total 326,472 13,251 (52,157) 287,566 Long-term trade and other receivables
Long-term loans 124,115 19,370 (12,816) 130,669 Deposits provided
for business 492 - - 492
Sub-total 124,607 19,370 (12,816) 131,161 Total \ 451,079 \ 32,621 \ (64,973) \ 418,727
(Korean won in millions) 2013
Beginning
Allowance for doubtful
accounts Reversal / write-off Ending
Trade and other receivables
Trade receivables \ 266,244 \ 62,539 \ (104,620) \ 224,163 Other receivables 10,573 6,008 (8,200) 8,381 Accrued revenues 2,378 1,913 (2,235) 2,056 Short-term loans 194,903 2,385 (105,416) 91,872
Sub-total 474,098 72,845 (220,471) 326,472 Long-term trade and other receivables
Long-term loans 139,646 15,065 (30,596) 124,115 Deposits provided
for business
1,117 - (625) 492
Leasehold deposits - 181 (181) -Sub-total 140,763 15,246 (31,402) 124,607 Total \ 614,861 \ 88,091 \ (251,873) \ 451,079 8. Construction contracts (1) Changes in the outstanding balances construction contracts for the years ended December 31, 2014 and 2013 are as follows:
(Korean won in millions) 2014
Beginning Increase (*) Sales recognized Ending Infra works \ 3,360,436 \ 1,475,382 \ 1,078,656 \ 3,757,162 Architectural construction 3,861,800 2,868,179 2,523,841 4,206,138 Plant construction 8,630,228 5,594,009 4,073,389 10,150,848 Power 1,408,845 1,109,978 1,058,368 1,460,455 Total \ 17,261,309 \ 11,047,548 \ 8,734,254 \ 19,574,603 (*) Includes increase from changes in scope of consolidation.
31
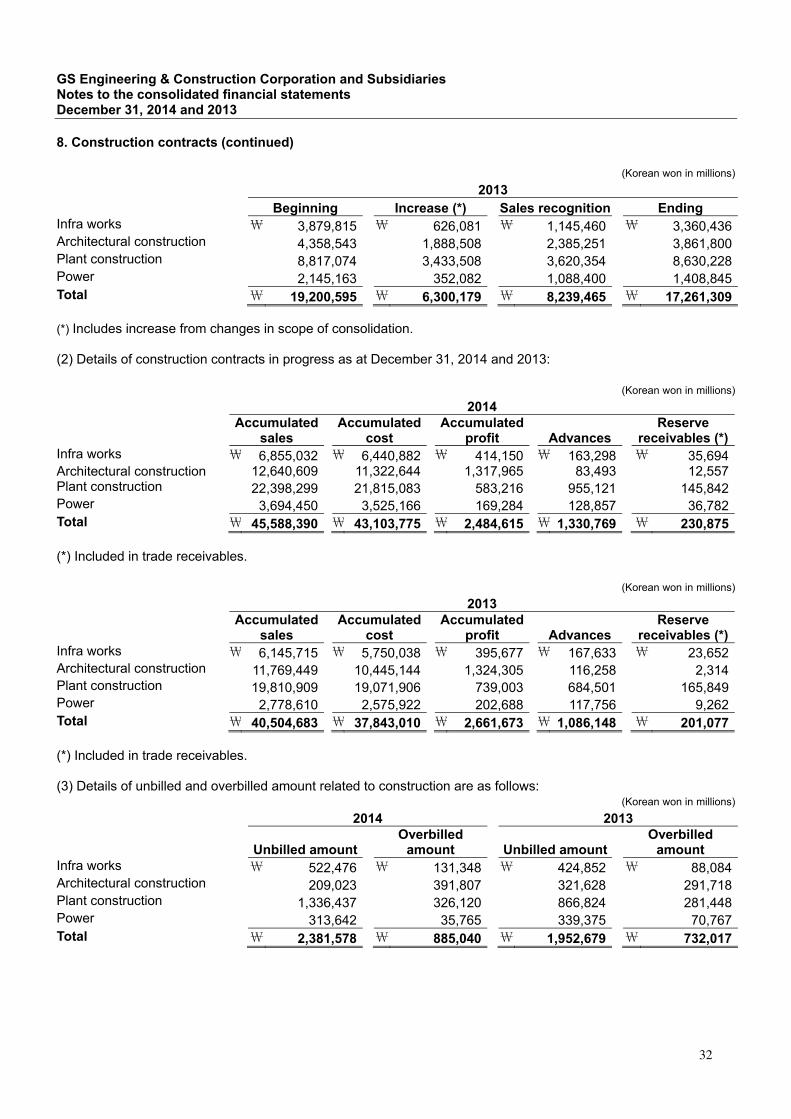
GS Engineering & Construction Corporation and Subsidiaries Notes to the consolidated financial statements December 31, 2014 and 2013
8. Construction contracts (continued)
(Korean won in millions) 2013
Beginning Increase (*) Sales recognition Ending Infra works \ 3,879,815 \ 626,081 \ 1,145,460 \ 3,360,436 Architectural construction 4,358,543 1,888,508 2,385,251 3,861,800 Plant construction 8,817,074 3,433,508 3,620,354 8,630,228 Power 2,145,163 352,082 1,088,400 1,408,845 Total \ 19,200,595 \ 6,300,179 \ 8,239,465 \ 17,261,309 (*) Includes increase from changes in scope of consolidation. (2) Details of construction contracts in progress as at December 31, 2014 and 2013:
(Korean won in millions)
2014 Accumulated
sales Accumulated
cost Accumulated
profit Advances Reserve
receivables (*)Infra works \ 6,855,032 \ 6,440,882 \ 414,150 \ 163,298 \ 35,694 Architectural construction 12,640,609 11,322,644 1,317,965 83,493 12,557 Plant construction 22,398,299 21,815,083 583,216 955,121 145,842 Power 3,694,450 3,525,166 169,284 128,857 36,782 Total \ 45,588,390 \ 43,103,775 \ 2,484,615 \ 1,330,769 \ 230,875 (*) Included in trade receivables.
(Korean won in millions) 2013
Accumulated sales
Accumulatedcost
Accumulatedprofit Advances
Reserve receivables (*)
Infra works \ 6,145,715 \ 5,750,038 \ 395,677 \ 167,633 \ 23,652 Architectural construction 11,769,449 10,445,144 1,324,305 116,258 2,314 Plant construction 19,810,909 19,071,906 739,003 684,501 165,849 Power 2,778,610 2,575,922 202,688 117,756 9,262 Total \ 40,504,683 \ 37,843,010 \ 2,661,673 \ 1,086,148 \ 201,077 (*) Included in trade receivables. (3) Details of unbilled and overbilled amount related to construction are as follows:
(Korean won in millions) 2014 2013
Unbilled amountOverbilled
amount Unbilled amount Overbilled
amount Infra works \ 522,476 \ 131,348 \ 424,852 \ 88,084 Architectural construction 209,023 391,807 321,628 291,718 Plant construction 1,336,437 326,120 866,824 281,448 Power 313,642 35,765 339,375 70,767 Total \ 2,381,578 \ 885,040 \ 1,952,679 \ 732,017
32

GS Engineering & Construction Corporation and Subsidiaries Notes to the consolidated financial statements December 31, 2014 and 2013
8. Construction contracts (continued) (4) Details of major joint construction contracts as at December 31, 2014 are as follows:
(Korean won in millions)
Total contractamount
Amounts attributable to
the Group
(%) attributable to
the Group Principal
contractee Karbala Refinery Project \ 6,573,981 \ 2,465,243 37.50% Hyundai E&C Clean Fuels Project 4,811,704 1,603,741 33.33% JGC NSRP Project 5,543,912 1,385,978 25.00% JGC STAR Project 4,033,744 1,344,447 33.33% GS E&C Ruwais 4th NGL Project 2,407,027 1,272,836 52.88% Petrofac PP-12 Combined Thermal Power Plant
1,365,940 682,970 50.00% Arabian Bemco
Contracting Co., Ltd.UHV Plant Project 1,092,478 655,487 60.00% GS E&C Singapore Marina South 1,379,130 551,652 40.00% Hyundai E&C P8E C/R & Utility Construction 751,215 450,729 60.00% GS E&C Boryeong LNG Terminal Project 781,629 429,896 55.00% GS E&C 9. Inventories and other current assets (1) Inventories as at December 31, 2014 and 2013 are as follows:
(Korean won in millions) 2014 2013 Land held for development \ 249,993 \ 156,534 Finished housing 10,394 42,618 Goods and products 500 432 Raw materials 23,220 32,314 Supplies 1,275 1,314 Finished buildings - 7,599 Unfinished building construction - 111,787 Unfinished housing construction 327,843 146,642 Total \ 613,225 \ 499,240
(2) Other current assets as at December 31, 2014 and 2013 are as follows:
(Korean won in millions)
2014 2013 Prepaid construction cost \ 355,363 \ 372,527 Advance payments 451,366 449,875 Prepaid expenses 62,270 35,665 Prepaid value added tax 80,279 63,970 Prepaid income taxes 32,765 19,241 Total \ 982,043 \ 941,278
33
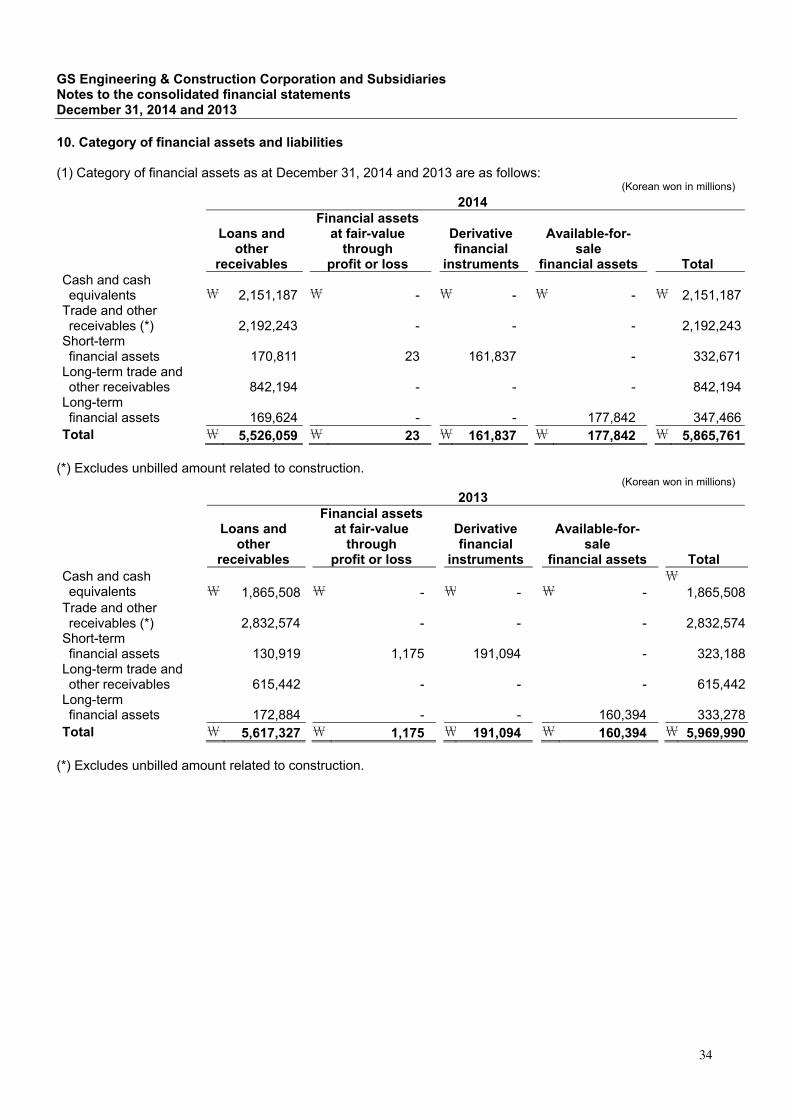
GS Engineering & Construction Corporation and Subsidiaries Notes to the consolidated financial statements December 31, 2014 and 2013
10. Category of financial assets and liabilities (1) Category of financial assets as at December 31, 2014 and 2013 are as follows:
(Korean won in millions)
2014
Loans and
other receivables
Financial assets at fair-value
through profit or loss
Derivative financial
instruments
Available-for- sale
financial assets Total Cash and cash equivalents \ 2,151,187 \ - \ - \ - \ 2,151,187
Trade and other receivables (*) 2,192,243 - - - 2,192,243
Short-term financial assets
170,811
23 161,837 -
332,671
Long-term trade and other receivables
842,194
- - -
842,194
Long-term financial assets 169,624 - - 177,842 347,466Total \ 5,526,059 \ 23 \ 161,837 \ 177,842 \ 5,865,761
(*) Excludes unbilled amount related to construction.
(Korean won in millions)
2013
Loans and
other receivables
Financial assets at fair-value
through profit or loss
Derivative financial
instruments
Available-for-sale
financial assets Total Cash and cash equivalents \ 1,865,508 \ - \ - \ -
\ 1,865,508
Trade and other receivables (*) 2,832,574 - - - 2,832,574Short-term financial assets
130,919
1,175 191,094 - 323,188
Long-term trade and other receivables
615,442
- - - 615,442
Long-term financial assets 172,884 - - 160,394 333,278Total \ 5,617,327 \ 1,175 \ 191,094 \ 160,394 \ 5,969,990
(*) Excludes unbilled amount related to construction.
34
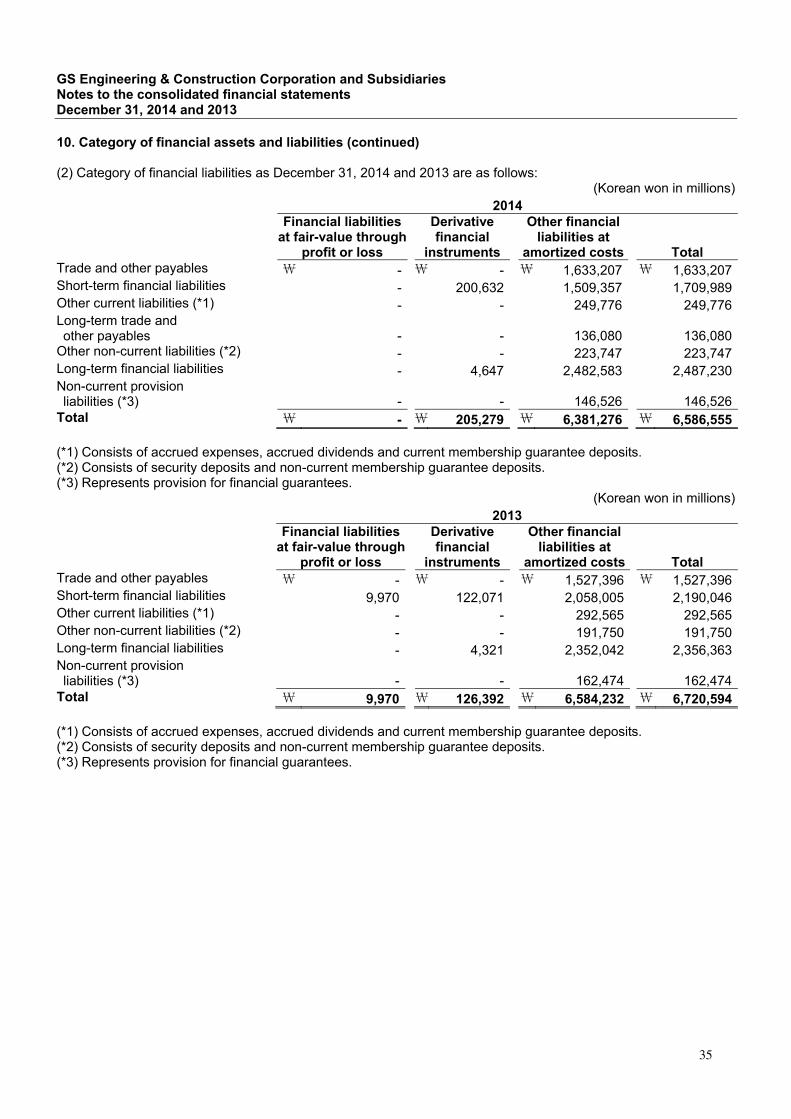
GS Engineering & Construction Corporation and Subsidiaries Notes to the consolidated financial statements December 31, 2014 and 2013
10. Category of financial assets and liabilities (continued) (2) Category of financial liabilities as December 31, 2014 and 2013 are as follows:
(Korean won in millions) 2014
Financial liabilities
at fair-value through profit or loss
Derivative financial
instruments
Other financial liabilities at
amortized costs Total Trade and other payables \ - \ - \ 1,633,207 \ 1,633,207 Short-term financial liabilities - 200,632 1,509,357 1,709,989 Other current liabilities (*1) - - 249,776 249,776 Long-term trade and other payables
- - 136,080 136,080
Other non-current liabilities (*2) - - 223,747 223,747 Long-term financial liabilities - 4,647 2,482,583 2,487,230 Non-current provision liabilities (*3)
- - 146,526 146,526
Total \ - \ 205,279 \ 6,381,276 \ 6,586,555 (*1) Consists of accrued expenses, accrued dividends and current membership guarantee deposits. (*2) Consists of security deposits and non-current membership guarantee deposits. (*3) Represents provision for financial guarantees.
(Korean won in millions) 2013
Financial liabilities
at fair-value through profit or loss
Derivative financial
instruments
Other financial liabilities at
amortized costs Total Trade and other payables \ - \ - \ 1,527,396 \ 1,527,396 Short-term financial liabilities 9,970 122,071 2,058,005 2,190,046 Other current liabilities (*1) - - 292,565 292,565 Other non-current liabilities (*2) - - 191,750 191,750 Long-term financial liabilities - 4,321 2,352,042 2,356,363 Non-current provision liabilities (*3)
- - 162,474 162,474
Total \ 9,970 \ 126,392 \ 6,584,232 \ 6,720,594 (*1) Consists of accrued expenses, accrued dividends and current membership guarantee deposits. (*2) Consists of security deposits and non-current membership guarantee deposits. (*3) Represents provision for financial guarantees.
35
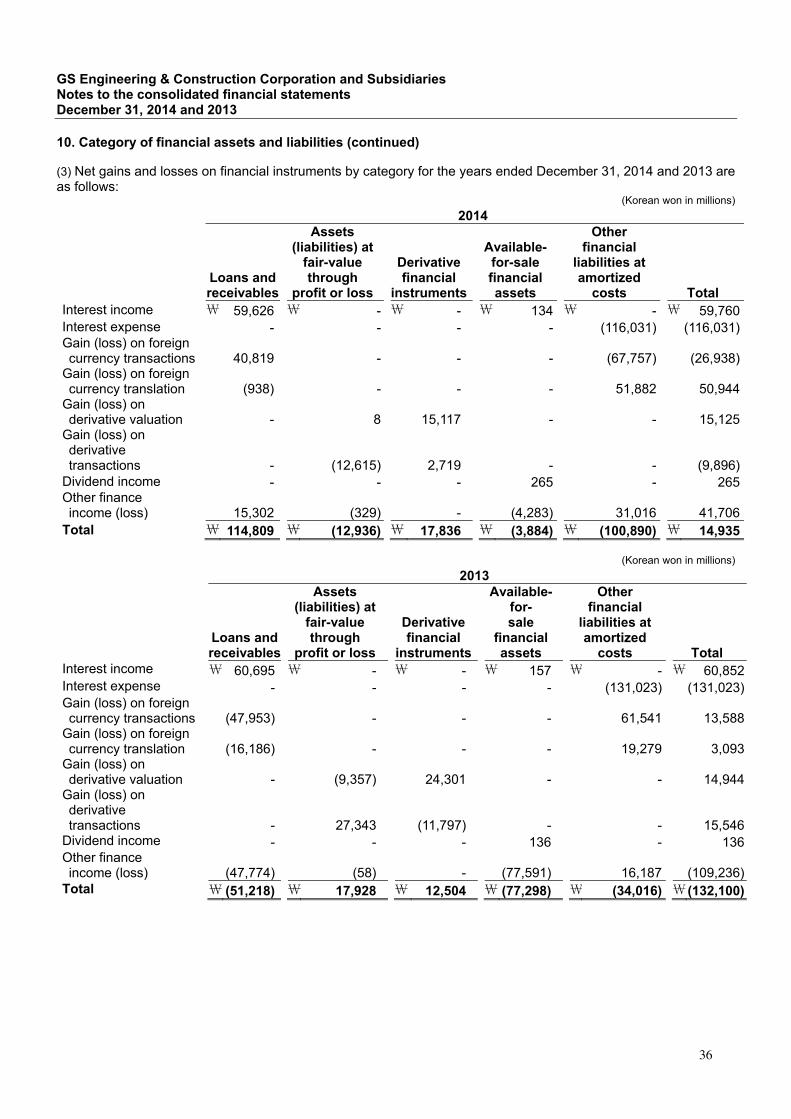
GS Engineering & Construction Corporation and Subsidiaries Notes to the consolidated financial statements December 31, 2014 and 2013
10. Category of financial assets and liabilities (continued) (3) Net gains and losses on financial instruments by category for the years ended December 31, 2014 and 2013 are as follows:
(Korean won in millions)
2014
Loans and receivables
Assets (liabilities) at
fair-value through
profit or loss
Derivativefinancial
instruments
Available-for-sale financial assets
Other financial
liabilities at amortized
costs Total Interest income \ 59,626 \ - \ - \ 134 \ - \ 59,760Interest expense - - - - (116,031) (116,031)Gain (loss) on foreign currency transactions
40,819
- - - (67,757) (26,938)
Gain (loss) on foreign currency translation
(938)
- - - 51,882 50,944
Gain (loss) on derivative valuation
-
8 15,117 - - 15,125
Gain (loss) on derivative transactions
-
(12,615) 2,719 - - (9,896)Dividend income - - - 265 - 265Other finance income (loss)
15,302
(329) - (4,283) 31,016 41,706
Total \ 114,809 \ (12,936) \ 17,836 \ (3,884) \ (100,890) \ 14,935
(Korean won in millions)
2013
Loans and receivables
Assets (liabilities) at
fair-value through
profit or loss
Derivative financial
instruments
Available-for- sale
financial assets
Other financial
liabilities at amortized
costs Total Interest income \ 60,695 \ - \ - \ 157 \ - \ 60,852Interest expense - - - - (131,023) (131,023)Gain (loss) on foreign currency transactions
(47,953)
- - -
61,541 13,588
Gain (loss) on foreign currency translation
(16,186)
- - -
19,279 3,093
Gain (loss) on derivative valuation
-
(9,357) 24,301 -
- 14,944
Gain (loss) on derivative transactions
-
27,343 (11,797) -
- 15,546Dividend income - - - 136 - 136Other finance income (loss)
(47,774)
(58) - (77,591)
16,187 (109,236)
Total \ (51,218) \ 17,928 \ 12,504 \ (77,298) \ (34,016) \ (132,100)
36
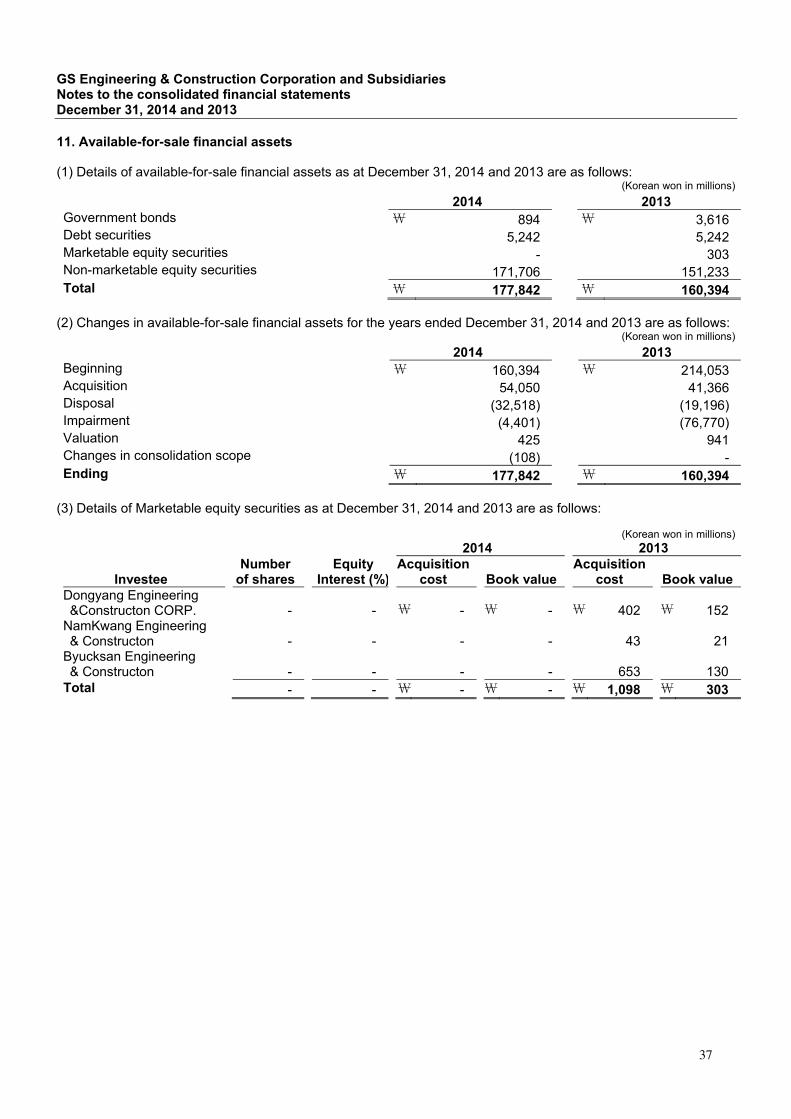
GS Engineering & Construction Corporation and Subsidiaries Notes to the consolidated financial statements December 31, 2014 and 2013
11. Available-for-sale financial assets (1) Details of available-for-sale financial assets as at December 31, 2014 and 2013 are as follows:
(Korean won in millions)
2014 2013 Government bonds \ 894 \ 3,616 Debt securities 5,242 5,242 Marketable equity securities - 303 Non-marketable equity securities 171,706 151,233 Total \ 177,842 \ 160,394
(2) Changes in available-for-sale financial assets for the years ended December 31, 2014 and 2013 are as follows:
(Korean won in millions)
2014 2013 Beginning \ 160,394 \ 214,053 Acquisition 54,050 41,366 Disposal (32,518) (19,196)Impairment (4,401) (76,770)Valuation 425 941 Changes in consolidation scope (108) -Ending \ 177,842 \ 160,394
(3) Details of Marketable equity securities as at December 31, 2014 and 2013 are as follows:
(Korean won in millions) 2014 2013
Investee Number
of shares Equity
Interest (%)Acquisition
cost Book value Acquisition
cost Book valueDongyang Engineering &Constructon CORP. - - \ - \ - \ 402 \ 152
NamKwang Engineering & Constructon
- - - - 43 21
Byucksan Engineering & Constructon
- - - - 653 130
Total - - \ - \ - \ 1,098 \ 303
37
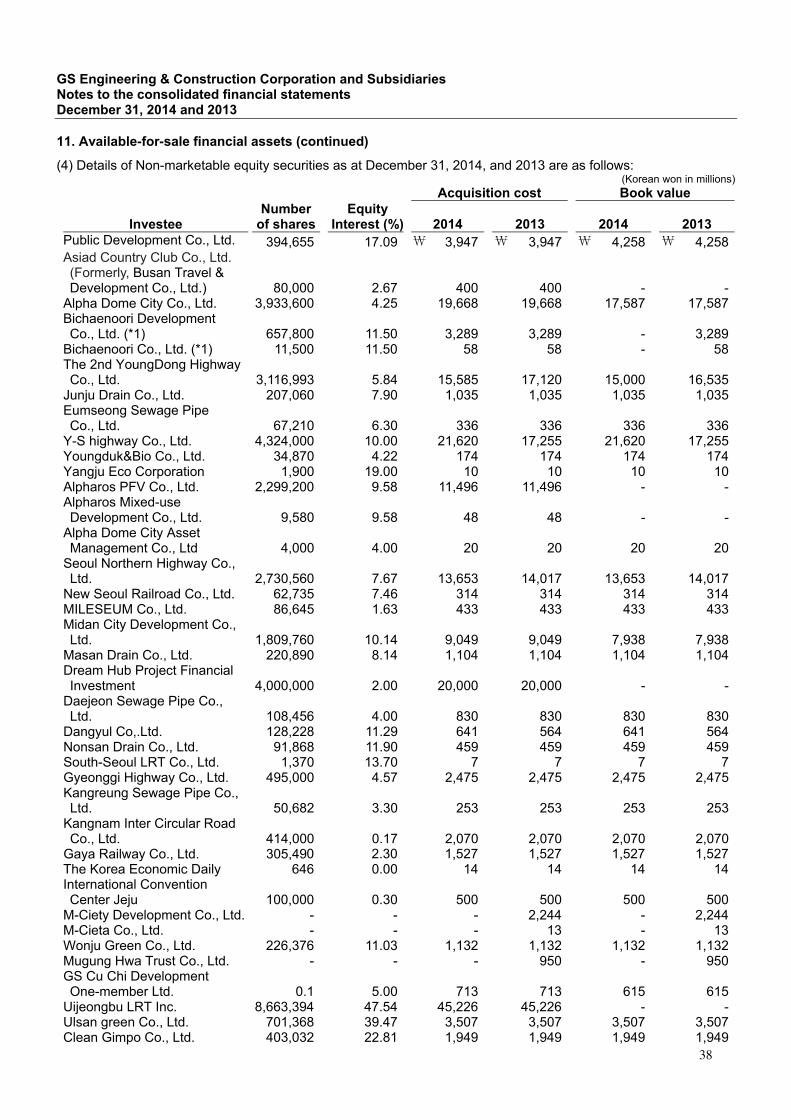
GS Engineering & Construction Corporation and Subsidiaries Notes to the consolidated financial statements December 31, 2014 and 2013
11. Available-for-sale financial assets (continued) (4) Details of Non-marketable equity securities as at December 31, 2014, and 2013 are as follows:
(Korean won in millions) Acquisition cost Book value
Investee Number
of shares Equity
Interest (%) 2014 2013 2014 2013 Public Development Co., Ltd. 394,655 17.09 \ 3,947 \ 3,947 \ 4,258 \ 4,258Asiad Country Club Co., Ltd. (Formerly, Busan Travel & Development Co., Ltd.)
80,000 2.67 400 400 - -
Alpha Dome City Co., Ltd. 3,933,600 4.25 19,668 19,668 17,587 17,587Bichaenoori Development Co., Ltd. (*1)
657,800 11.50 3,289 3,289 - 3,289
Bichaenoori Co., Ltd. (*1) 11,500 11.50 58 58 - 58The 2nd YoungDong Highway Co., Ltd.
3,116,993 5.84 15,585 17,120 15,000 16,535
Junju Drain Co., Ltd. 207,060 7.90 1,035 1,035 1,035 1,035Eumseong Sewage Pipe Co., Ltd.
67,210 6.30 336 336 336 336
Y-S highway Co., Ltd. 4,324,000 10.00 21,620 17,255 21,620 17,255Youngduk&Bio Co., Ltd. 34,870 4.22 174 174 174 174Yangju Eco Corporation 1,900 19.00 10 10 10 10Alpharos PFV Co., Ltd. 2,299,200 9.58 11,496 11,496 - -Alpharos Mixed-use Development Co., Ltd.
9,580 9.58 48 48 - -
Alpha Dome City Asset Management Co., Ltd
4,000 4.00 20 20 20 20
Seoul Northern Highway Co., Ltd.
2,730,560 7.67 13,653 14,017 13,653 14,017
New Seoul Railroad Co., Ltd. 62,735 7.46 314 314 314 314MILESEUM Co., Ltd. 86,645 1.63 433 433 433 433Midan City Development Co., Ltd.
1,809,760 10.14 9,049 9,049 7,938 7,938
Masan Drain Co., Ltd. 220,890 8.14 1,104 1,104 1,104 1,104Dream Hub Project Financial Investment
4,000,000 2.00 20,000 20,000 - -
Daejeon Sewage Pipe Co., Ltd.
108,456 4.00 830 830 830 830
Dangyul Co,.Ltd. 128,228 11.29 641 564 641 564Nonsan Drain Co., Ltd. 91,868 11.90 459 459 459 459South-Seoul LRT Co., Ltd. 1,370 13.70 7 7 7 7Gyeonggi Highway Co., Ltd. 495,000 4.57 2,475 2,475 2,475 2,475Kangreung Sewage Pipe Co., Ltd.
50,682 3.30 253 253 253 253
Kangnam Inter Circular Road Co., Ltd.
414,000 0.17 2,070 2,070 2,070 2,070
Gaya Railway Co., Ltd. 305,490 2.30 1,527 1,527 1,527 1,527The Korea Economic Daily 646 0.00 14 14 14 14International Convention Center Jeju
100,000 0.30 500 500 500 500
M-Ciety Development Co., Ltd. - - - 2,244 - 2,244M-Cieta Co., Ltd. - - - 13 - 13Wonju Green Co., Ltd. 226,376 11.03 1,132 1,132 1,132 1,132Mugung Hwa Trust Co., Ltd. - - - 950 - 950GS Cu Chi Development One-member Ltd.
0.1 5.00 713 713 615 615
Uijeongbu LRT Inc. 8,663,394 47.54 45,226 45,226 - -Ulsan green Co., Ltd. 701,368 39.47 3,507 3,507 3,507 3,507Clean Gimpo Co., Ltd. 403,032 22.81 1,949 1,949 1,949 1,949
38

GS Engineering & Construction Corporation and Subsidiaries Notes to the consolidated financial statements December 31, 2014 and 2013
11. Available-for-sale financial assets (continued) (Korean won in millions) Acquisition cost Book value
Investee Number
of shares Equity
Interest (%) 2014 2013 2014 2013 Seoul Tunnel Co., Ltd. 270,689 12.05 1,353 65 1,353 65Green Energy Development Co., Ltd.
81,000 27.00 405 405 405 405
Seoul-Munsan Highway Co., Ltd.
572,815 46.14 2,864 2,637 2,864 2,637
Oksan Ochang Highway Corporation
3,782,040 60.00 18,910 3,015 18,910 3,015
Eun Pyung New Road Corp. 435,200 55.06 2,176 2,176 2,176 2,176Gumi Green Water Co., Ltd. 380 0.45 2 2 2 2Paju-Yangju Powerful Army Co., Ltd.
89,289 8.00 447 442 447 442
Evergreen Goyang Co., Ltd. 24,267 1.83 121 95 121 95Seoul Beltway Corporation 400 20.00 2 2 2 2Daegu Green Energy Center CO., Ltd.
474,400 40.01 2,372 2,372 2,372 2,372
Geoje Big Island PFV CO., Ltd. - - - 1,000 - 1,000Geoje Big Island asset Management
- - - 10 - 10
HANIL ENGINEERING & CONSTRUCT CO., Ltd.
13,810 0.46 69 154 69 154
KUKDONG E&C 28,948 0.59 145 145 145 145POONGLIM INDUSTRIAL CO.,LTD.
280 0.00 1 1 1 1
Bumyang Kunyoung - - - 9 - 9DAEJEON Green Energy Centre Ltd.
396,792 51.08 1,984 - 1,984 -
Bumyang asset management 725 0.14 4 - 4 -Seo-seoul City Expressway Co., Ltd.
290 29.00 1 - 1 -
Seoseoul highway (Fnds) 35,158 39.06 176 - 176 -Seoul National University Medical Hub Co., Ltd.
3,750 25.00 19 - 19 -
Shiheung echopia Co., Ltd. 30,530 3.51 153 - 153 -Ssangyong E&C Co., Ltd. 70,608 0.48 353 - 353 -STX E&C Co., Ltd. 7,598 0.25 38 - 38 -Korea Investment Trust Management
1 29.07 9,960 - 9,960 -
Engineering Construction Financial Cooperative
8,950 1.26 3,925 180 3,925 180
Electric Construction Financial Cooperative
600 0.02 98 98 98 98
Construction Guarantee Cooperative
14,263 0.36 14,092 12,092 14,244 12,244
Information & Communication Financial Cooperative
440 0.05 61 61 61 61
Fire Guarantee Cooperative 40 0.02 20 20 20 20Korea Housing Guarantee Co., Ltd. (*2)
1,038,490 0.16 21,532 21,532 8,462 8,462
LIG E&C and Others 5,035 0.15 846 608 3,880 4,096Equity fund - 8,768 - 10,070Total \ 265,671 \ 240,095 \ 171,706 \ 151,233
(*1) Impaired in 2014 (*2) Provided as collateral to Korea Housing Guarantee Co., Ltd. in relation to the long-term borrowings (Note 18).
39
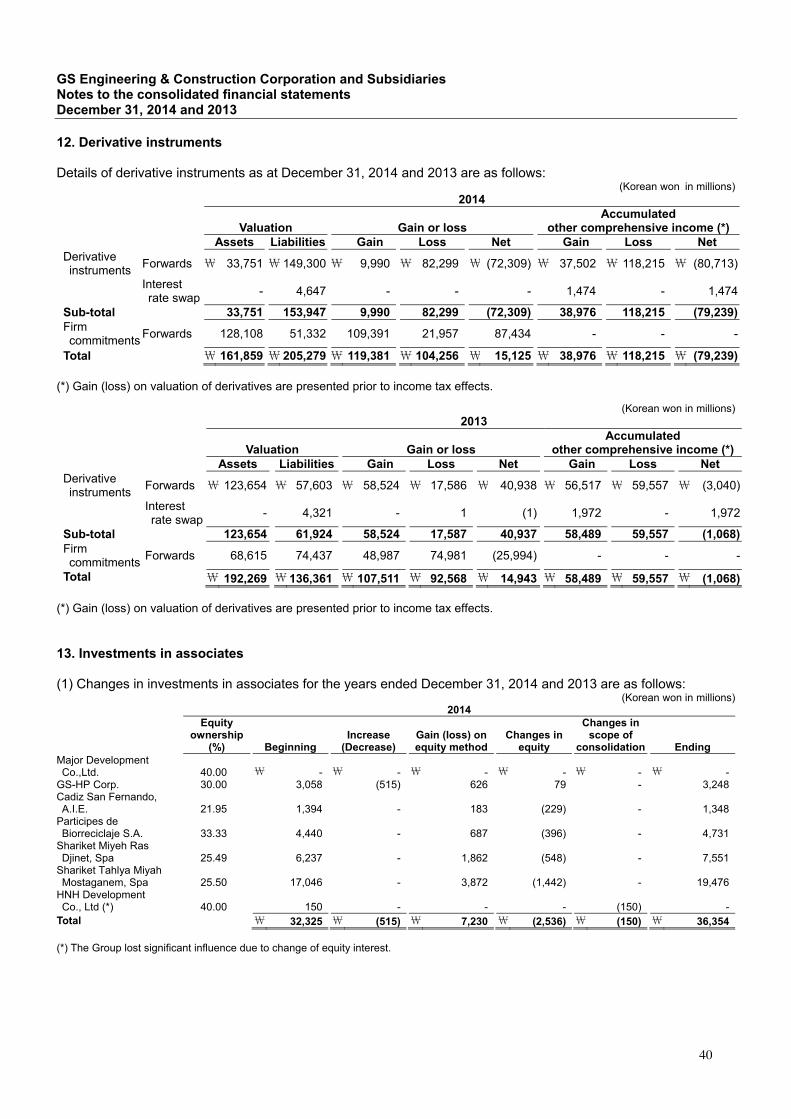
GS Engineering & Construction Corporation and Subsidiaries Notes to the consolidated financial statements December 31, 2014 and 2013
12. Derivative instruments Details of derivative instruments as at December 31, 2014 and 2013 are as follows:
(Korean won in millions)
2014
Valuation Gain or loss
Accumulatedother comprehensive income (*)
Assets Liabilities Gain Loss Net Gain Loss NetDerivative instruments
Forwards \ 33,751 \ 149,300 \ 9,990 \ 82,299 \ (72,309) \ 37,502 \ 118,215 \ (80,713)
Interest rate swap
- 4,647 - - - 1,474 - 1,474
Sub-total 33,751 153,947 9,990 82,299 (72,309) 38,976 118,215 (79,239)Firm commitments
Forwards
128,108 51,332 109,391 21,957 87,434 - - -
Total \ 161,859 \ 205,279 \ 119,381 \ 104,256 \ 15,125 \ 38,976 \ 118,215 \ (79,239)
(*) Gain (loss) on valuation of derivatives are presented prior to income tax effects.
(Korean won in millions)
2013
Valuation Gain or loss
Accumulatedother comprehensive income (*)
Assets Liabilities Gain Loss Net Gain Loss NetDerivative instruments
Forwards \ 123,654 \ 57,603 \ 58,524 \ 17,586 \ 40,938 \ 56,517 \ 59,557 \ (3,040)
Interest rate swap
- 4,321 - 1 (1) 1,972 - 1,972
Sub-total 123,654 61,924 58,524 17,587 40,937 58,489 59,557 (1,068)Firm commitments
Forwards 68,615 74,437 48,987 74,981 (25,994) - - -
Total \ 192,269 \ 136,361 \ 107,511 \ 92,568 \ 14,943 \ 58,489 \ 59,557 \ (1,068) (*) Gain (loss) on valuation of derivatives are presented prior to income tax effects. 13. Investments in associates (1) Changes in investments in associates for the years ended December 31, 2014 and 2013 are as follows:
(Korean won in millions) 2014
Equity
ownership (%) Beginning
Increase (Decrease)
Gain (loss) on equity method
Changes in equity
Changes in scope of
consolidation Ending Major Development Co.,Ltd.
40.00 \ - \ - \ - \ - \ - \ -
GS-HP Corp. 30.00 3,058 (515) 626 79 - 3,248 Cadiz San Fernando, A.I.E.
21.95 1,394 - 183 (229) - 1,348
Participes de Biorreciclaje S.A.
33.33 4,440 - 687 (396) - 4,731
Shariket Miyeh Ras Djinet, Spa
25.49 6,237 - 1,862 (548) - 7,551
Shariket Tahlya Miyah Mostaganem, Spa
25.50 17,046 - 3,872 (1,442) - 19,476
HNH Development Co., Ltd (*)
40.00 150 - - - (150) -
Total \ 32,325 \ (515) \ 7,230 \ (2,536) \ (150) \ 36,354 (*) The Group lost significant influence due to change of equity interest.
40
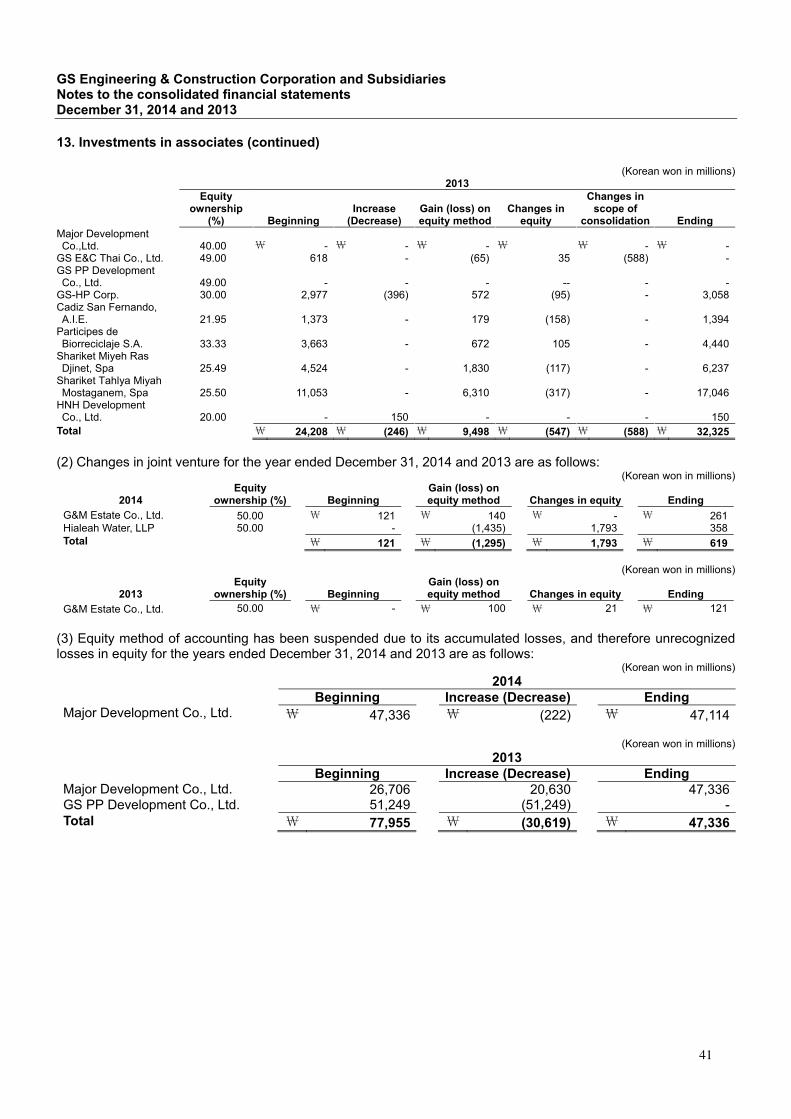
GS Engineering & Construction Corporation and Subsidiaries Notes to the consolidated financial statements December 31, 2014 and 2013
13. Investments in associates (continued)
(Korean won in millions) 2013
Equity
ownership (%) Beginning
Increase (Decrease)
Gain (loss) on equity method
Changes in equity
Changes in scope of
consolidation Ending Major Development Co.,Ltd.
40.00 \ - \ - \ - \ \ - \ -
GS E&C Thai Co., Ltd. 49.00 618 - (65) 35 (588) -GS PP Development Co., Ltd.
49.00 - - - -- - -
GS-HP Corp. 30.00 2,977 (396) 572 (95) - 3,058 Cadiz San Fernando, A.I.E.
21.95 1,373 - 179 (158) - 1,394
Participes de Biorreciclaje S.A.
33.33 3,663 - 672 105 - 4,440
Shariket Miyeh Ras Djinet, Spa
25.49 4,524 - 1,830 (117) - 6,237
Shariket Tahlya Miyah Mostaganem, Spa
25.50 11,053 - 6,310 (317) - 17,046
HNH Development Co., Ltd.
20.00 - 150 - - - 150
Total \ 24,208 \ (246) \ 9,498 \ (547) \ (588) \ 32,325
(2) Changes in joint venture for the year ended December 31, 2014 and 2013 are as follows:
(Korean won in millions)
2014 Equity
ownership (%) Beginning Gain (loss) on equity method Changes in equity Ending
G&M Estate Co., Ltd. 50.00 \ 121 \ 140 \ - \ 261 Hialeah Water, LLP 50.00 - (1,435) 1,793 358 Total \ 121 \ (1,295) \ 1,793 \ 619
(Korean won in millions)
2013 Equity
ownership (%) Beginning Gain (loss) on equity method Changes in equity Ending
G&M Estate Co., Ltd. 50.00 \ - \ 100 \ 21 \ 121
(3) Equity method of accounting has been suspended due to its accumulated losses, and therefore unrecognized losses in equity for the years ended December 31, 2014 and 2013 are as follows:
(Korean won in millions) 2014 Beginning Increase (Decrease) Ending
Major Development Co., Ltd. \ 47,336 \ (222) \ 47,114
(Korean won in millions) 2013 Beginning Increase (Decrease) Ending
Major Development Co., Ltd. 26,706 20,630 47,336 GS PP Development Co., Ltd. 51,249 (51,249) -Total \ 77,955 \ (30,619) \ 47,336
41
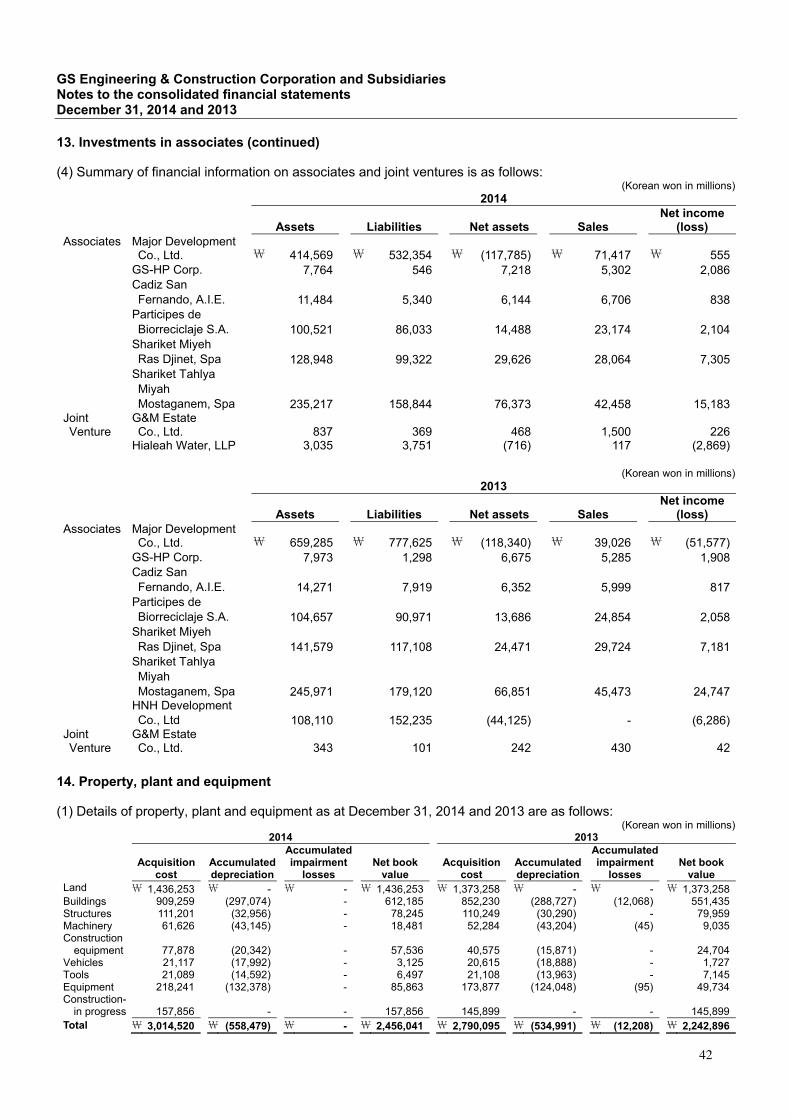
GS Engineering & Construction Corporation and Subsidiaries Notes to the consolidated financial statements December 31, 2014 and 2013
13. Investments in associates (continued) (4) Summary of financial information on associates and joint ventures is as follows:
(Korean won in millions) 2014
Assets Liabilities Net assets Sales
Net income (loss)
Associates Major Development Co., Ltd. \ 414,569 \ 532,354 \ (117,785) \ 71,417 \ 555
GS-HP Corp. 7,764 546 7,218 5,302 2,086 Cadiz San
Fernando, A.I.E. 11,484 5,340 6,144 6,706 838 Participes de
Biorreciclaje S.A. 100,521 86,033 14,488 23,174 2,104 Shariket Miyeh
Ras Djinet, Spa 128,948 99,322 29,626 28,064 7,305 Shariket Tahlya
Miyah Mostaganem, Spa 235,217 158,844 76,373 42,458 15,183
Joint Venture
G&M Estate Co., Ltd. 837 369 468 1,500 226
Hialeah Water, LLP 3,035 3,751 (716) 117 (2,869)
(Korean won in millions) 2013
Assets Liabilities Net assets Sales
Net income (loss)
Associates Major Development Co., Ltd. \ 659,285 \ 777,625 \ (118,340) \ 39,026 \ (51,577)
GS-HP Corp. 7,973 1,298 6,675 5,285 1,908 Cadiz San
Fernando, A.I.E. 14,271 7,919 6,352 5,999 817 Participes de
Biorreciclaje S.A. 104,657 90,971 13,686 24,854 2,058 Shariket Miyeh
Ras Djinet, Spa 141,579 117,108 24,471 29,724 7,181 Shariket Tahlya
Miyah Mostaganem, Spa 245,971 179,120 66,851 45,473 24,747
HNH Development Co., Ltd 108,110 152,235 (44,125) - (6,286)
Joint Venture
G&M Estate Co., Ltd. 343 101 242 430 42
14. Property, plant and equipment (1) Details of property, plant and equipment as at December 31, 2014 and 2013 are as follows:
(Korean won in millions) 2014 2013
Acquisition cost
Accumulated depreciation
Accumulatedimpairment
losses Net book
value Acquisition
cost Accumulated depreciation
Accumulatedimpairment
losses Net book
value Land \ 1,436,253 \ - \ - \ 1,436,253 \ 1,373,258 \ - \ - \ 1,373,258 Buildings 909,259 (297,074) - 612,185 852,230 (288,727) (12,068) 551,435 Structures 111,201 (32,956) - 78,245 110,249 (30,290) - 79,959 Machinery 61,626 (43,145) - 18,481 52,284 (43,204) (45) 9,035 Construction
equipment
77,878 (20,342) - 57,536 40,575 (15,871) - 24,704 Vehicles 21,117 (17,992) - 3,125 20,615 (18,888) - 1,727 Tools 21,089 (14,592) - 6,497 21,108 (13,963) - 7,145 Equipment 218,241 (132,378) - 85,863 173,877 (124,048) (95) 49,734 Construction-
in progress
157,856 - - 157,856 145,899 - - 145,899 Total \ 3,014,520 \ (558,479) \ - \ 2,456,041 \ 2,790,095 \ (534,991) \ (12,208) \ 2,242,896
42
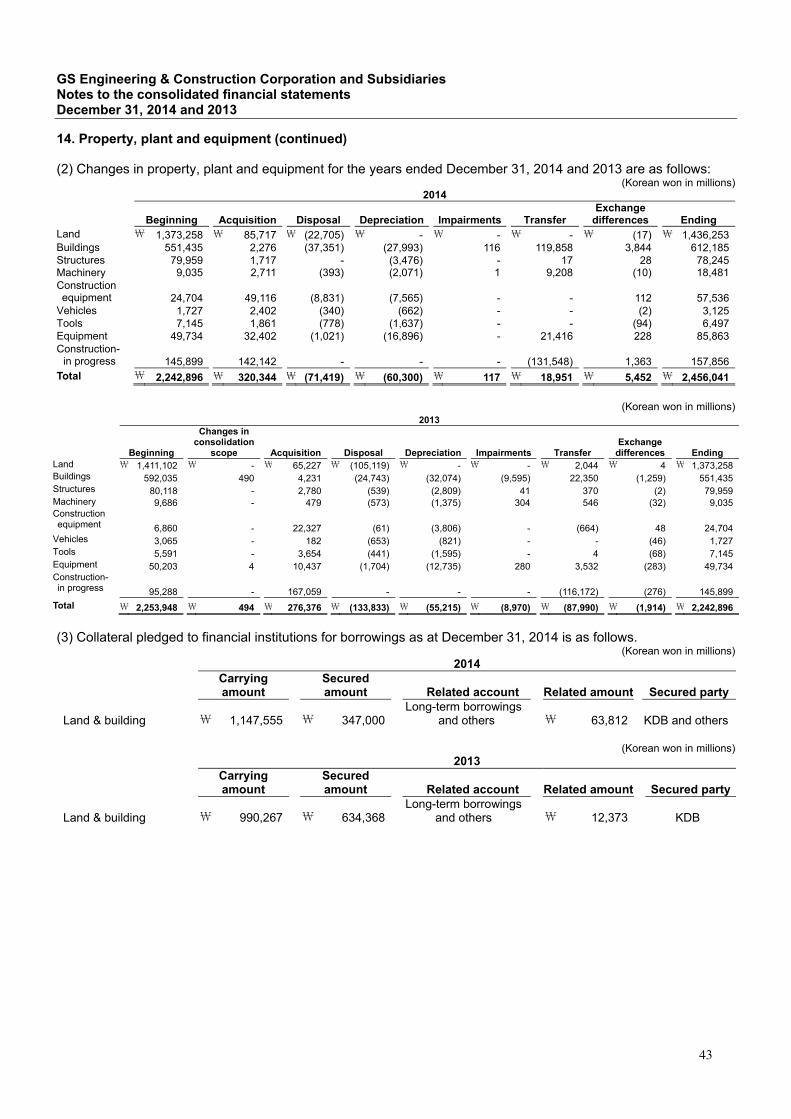
GS Engineering & Construction Corporation and Subsidiaries Notes to the consolidated financial statements December 31, 2014 and 2013
14. Property, plant and equipment (continued) (2) Changes in property, plant and equipment for the years ended December 31, 2014 and 2013 are as follows:
(Korean won in millions) 2014
Beginning Acquisition Disposal Depreciation Impairments Transfer
Exchange differences Ending
Land \ 1,373,258 \ 85,717 \ (22,705) \ - \ - \ - \ (17) \ 1,436,253 Buildings 551,435 2,276 (37,351) (27,993) 116 119,858 3,844 612,185 Structures 79,959 1,717 - (3,476) - 17 28 78,245 Machinery 9,035 2,711 (393) (2,071) 1 9,208 (10) 18,481 Construction equipment
24,704
49,116
(8,831) (7,565) - - 112 57,536
Vehicles 1,727 2,402 (340) (662) - - (2) 3,125 Tools 7,145 1,861 (778) (1,637) - - (94) 6,497 Equipment 49,734 32,402 (1,021) (16,896) - 21,416 228 85,863 Construction-
in progress
145,899
142,142
- - - (131,548) 1,363 157,856 Total \ 2,242,896 \ 320,344 \ (71,419) \ (60,300) \ 117 \ 18,951 \ 5,452 \ 2,456,041
(Korean won in millions)
2013
Beginning
Changes in consolidation
scope Acquisition Disposal Depreciation Impairments Transfer Exchange
differences Ending Land \ 1,411,102 \ - \ 65,227 \ (105,119) \ - \ - \ 2,044 \ 4 \ 1,373,258 Buildings 592,035 490 4,231 (24,743) (32,074) (9,595) 22,350 (1,259) 551,435 Structures 80,118 - 2,780 (539) (2,809) 41 370 (2) 79,959 Machinery 9,686 - 479 (573) (1,375) 304 546 (32) 9,035 Construction equipment
6,860 - 22,327 (61) (3,806) - (664) 48 24,704 Vehicles 3,065 - 182 (653) (821) - - (46) 1,727 Tools 5,591 - 3,654 (441) (1,595) - 4 (68) 7,145 Equipment 50,203 4 10,437 (1,704) (12,735) 280 3,532 (283) 49,734 Construction-in progress
95,288 - 167,059 - - - (116,172) (276) 145,899
Total \ 2,253,948 \ 494 \ 276,376 \ (133,833) \ (55,215) \ (8,970) \ (87,990) \ (1,914) \ 2,242,896
(3) Collateral pledged to financial institutions for borrowings as at December 31, 2014 is as follows.
(Korean won in millions) 2014
Carrying amount
Securedamount Related account Related amount Secured party
Land & building
\ 1,147,555 \ 347,000Long-term borrowings
and others \ 63,812 KDB and others
(Korean won in millions) 2013
Carrying amount
Securedamount Related account Related amount Secured party
Land & building
\ 990,267 \ 634,368Long-term borrowings
and others \ 12,373 KDB
43
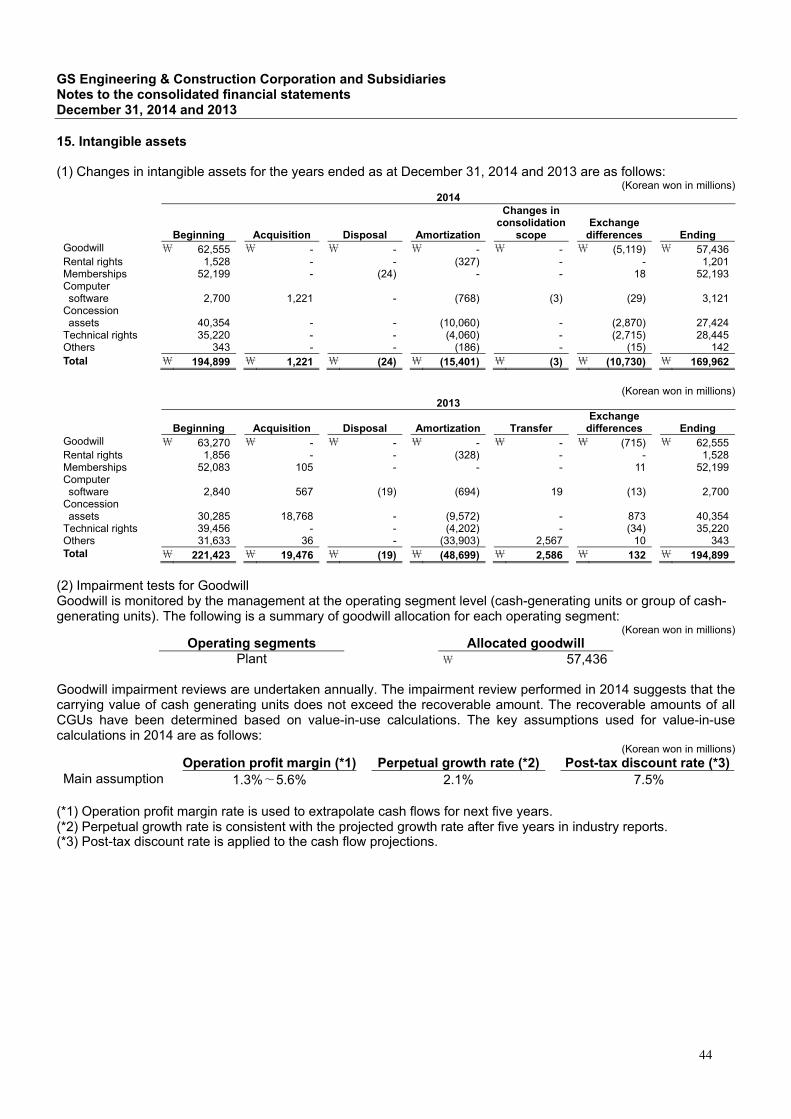
GS Engineering & Construction Corporation and Subsidiaries Notes to the consolidated financial statements December 31, 2014 and 2013
15. Intangible assets (1) Changes in intangible assets for the years ended as at December 31, 2014 and 2013 are as follows:
(Korean won in millions) 2014
Beginning Acquisition Disposal Amortization
Changes in consolidation
scope Exchange
differences Ending Goodwill \ 62,555 \ - \ - \ - \ - \ (5,119) \ 57,436 Rental rights 1,528 - - (327) - - 1,201 Memberships 52,199 - (24) - - 18 52,193 Computer software
2,700 1,221 - (768) (3) (29) 3,121
Concession assets
40,354 - - (10,060) - (2,870) 27,424
Technical rights 35,220 - - (4,060) - (2,715) 28,445 Others 343 - - (186) - (15) 142 Total \ 194,899 \ 1,221 \ (24) \ (15,401) \ (3) \ (10,730) \ 169,962
(Korean won in millions)
2013
Beginning Acquisition Disposal Amortization Transfer
Exchange differences Ending
Goodwill \ 63,270 \ - \ - \ - \ - \ (715) \ 62,555 Rental rights 1,856 - - (328) - - 1,528 Memberships 52,083 105 - - - 11 52,199 Computer software
2,840 567 (19) (694) 19 (13) 2,700
Concession assets
30,285 18,768 - (9,572) - 873 40,354
Technical rights 39,456 - - (4,202) - (34) 35,220 Others 31,633 36 - (33,903) 2,567 10 343 Total \ 221,423 \ 19,476 \ (19) \ (48,699) \ 2,586 \ 132 \ 194,899
(2) Impairment tests for Goodwill Goodwill is monitored by the management at the operating segment level (cash-generating units or group of cash-generating units). The following is a summary of goodwill allocation for each operating segment:
(Korean won in millions) Operating segments Allocated goodwill Plant \ 57,436
Goodwill impairment reviews are undertaken annually. The impairment review performed in 2014 suggests that the carrying value of cash generating units does not exceed the recoverable amount. The recoverable amounts of all CGUs have been determined based on value-in-use calculations. The key assumptions used for value-in-use calculations in 2014 are as follows:
(Korean won in millions) Operation profit margin (*1) Perpetual growth rate (*2) Post-tax discount rate (*3)
Main assumption 1.3%∼5.6% 2.1% 7.5% (*1) Operation profit margin rate is used to extrapolate cash flows for next five years. (*2) Perpetual growth rate is consistent with the projected growth rate after five years in industry reports. (*3) Post-tax discount rate is applied to the cash flow projections.
44
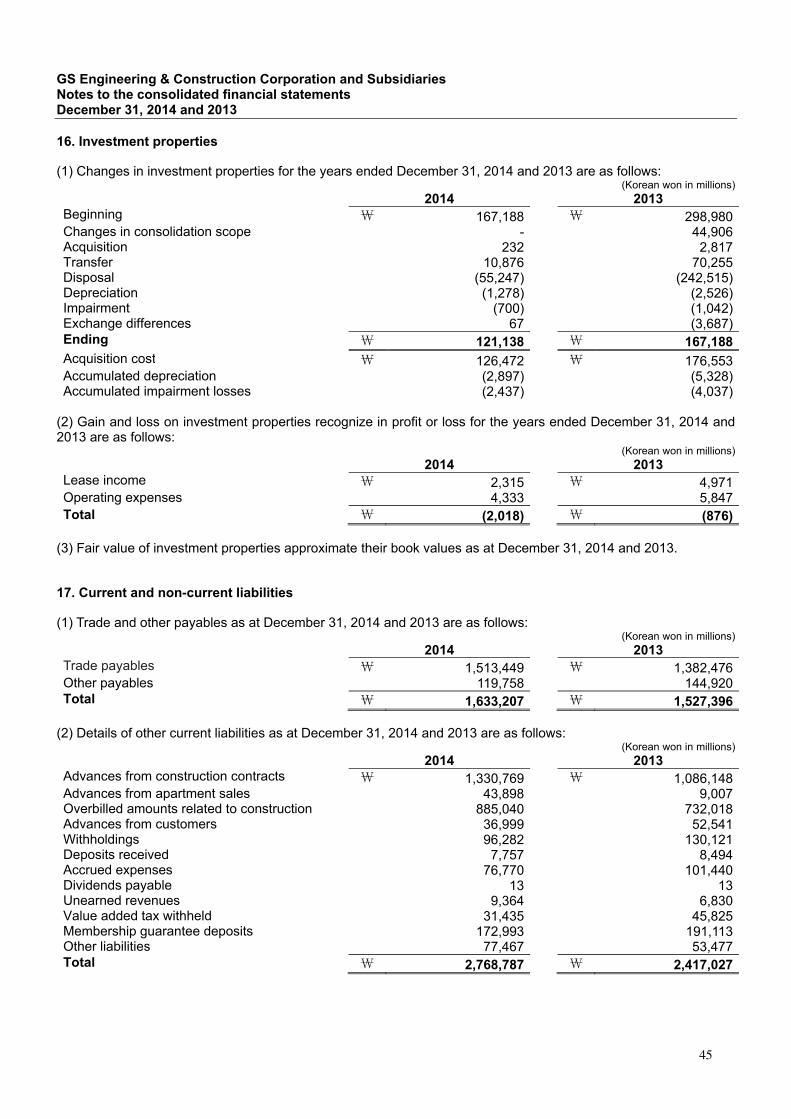
GS Engineering & Construction Corporation and Subsidiaries Notes to the consolidated financial statements December 31, 2014 and 2013
16. Investment properties (1) Changes in investment properties for the years ended December 31, 2014 and 2013 are as follows:
(Korean won in millions) 2014 2013
Beginning \ 167,188 \ 298,980 Changes in consolidation scope - 44,906 Acquisition 232 2,817 Transfer 10,876 70,255 Disposal (55,247) (242,515)Depreciation (1,278) (2,526)Impairment (700) (1,042)Exchange differences 67 (3,687)Ending \ 121,138 \ 167,188 Acquisition cost \ 126,472 \ 176,553 Accumulated depreciation (2,897) (5,328)Accumulated impairment losses (2,437) (4,037)
(2) Gain and loss on investment properties recognize in profit or loss for the years ended December 31, 2014 and 2013 are as follows:
(Korean won in millions) 2014 2013
Lease income \ 2,315 \ 4,971 Operating expenses 4,333 5,847Total \ (2,018) \ (876)
(3) Fair value of investment properties approximate their book values as at December 31, 2014 and 2013. 17. Current and non-current liabilities (1) Trade and other payables as at December 31, 2014 and 2013 are as follows:
(Korean won in millions) 2014 2013
Trade payables \ 1,513,449 \ 1,382,476 Other payables 119,758 144,920 Total \ 1,633,207 \ 1,527,396
(2) Details of other current liabilities as at December 31, 2014 and 2013 are as follows:
(Korean won in millions) 2014 2013
Advances from construction contracts \ 1,330,769 \ 1,086,148 Advances from apartment sales 43,898 9,007 Overbilled amounts related to construction 885,040 732,018 Advances from customers 36,999 52,541 Withholdings 96,282 130,121 Deposits received 7,757 8,494 Accrued expenses 76,770 101,440 Dividends payable 13 13 Unearned revenues 9,364 6,830 Value added tax withheld 31,435 45,825 Membership guarantee deposits 172,993 191,113 Other liabilities 77,467 53,477 Total \ 2,768,787 \ 2,417,027
45
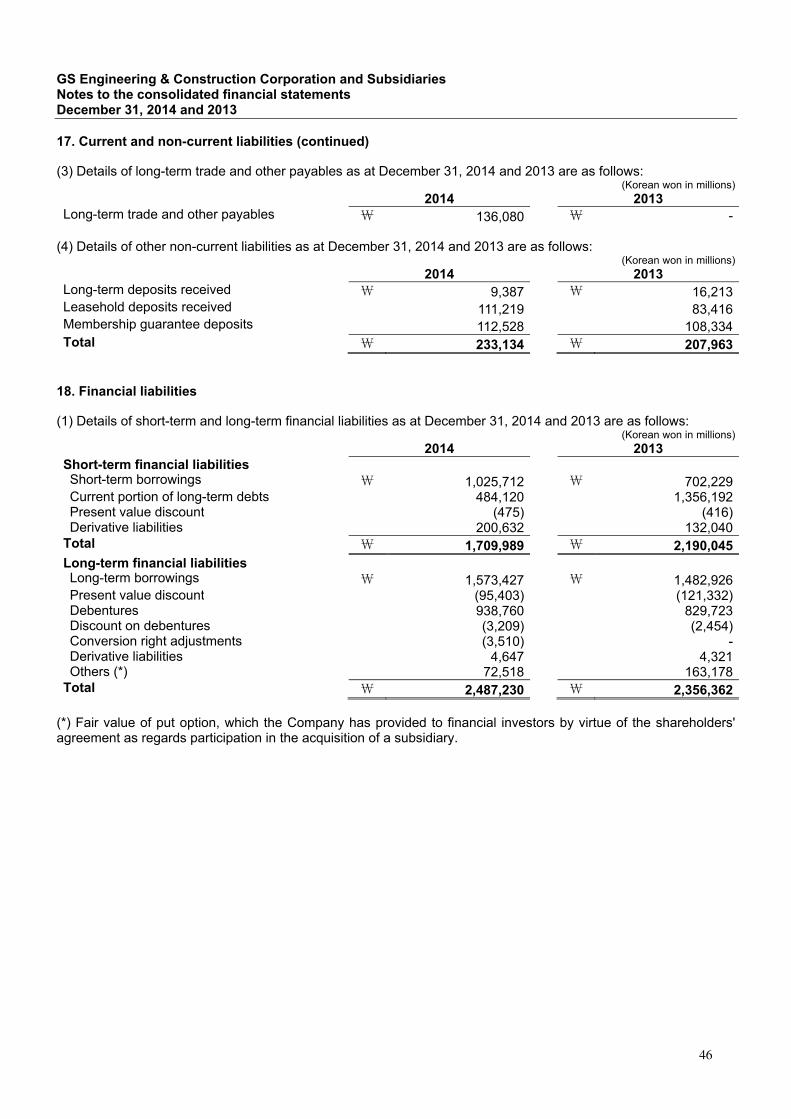
GS Engineering & Construction Corporation and Subsidiaries Notes to the consolidated financial statements December 31, 2014 and 2013
17. Current and non-current liabilities (continued) (3) Details of long-term trade and other payables as at December 31, 2014 and 2013 are as follows:
(Korean won in millions) 2014 2013 Long-term trade and other payables \ 136,080 \ -
(4) Details of other non-current liabilities as at December 31, 2014 and 2013 are as follows:
(Korean won in millions) 2014 2013
Long-term deposits received \ 9,387 \ 16,213 Leasehold deposits received 111,219 83,416 Membership guarantee deposits 112,528 108,334 Total \ 233,134 \ 207,963
18. Financial liabilities (1) Details of short-term and long-term financial liabilities as at December 31, 2014 and 2013 are as follows:
(Korean won in millions) 2014 2013
Short-term financial liabilities Short-term borrowings \ 1,025,712 \ 702,229 Current portion of long-term debts 484,120 1,356,192 Present value discount (475) (416)Derivative liabilities 200,632 132,040
Total \ 1,709,989 \ 2,190,045 Long-term financial liabilities Long-term borrowings \ 1,573,427 \ 1,482,926 Present value discount (95,403) (121,332)Debentures 938,760 829,723 Discount on debentures (3,209) (2,454)Conversion right adjustments (3,510) -Derivative liabilities 4,647 4,321 Others (*) 72,518 163,178
Total \ 2,487,230 \ 2,356,362 (*) Fair value of put option, which the Company has provided to financial investors by virtue of the shareholders' agreement as regards participation in the acquisition of a subsidiary.
46
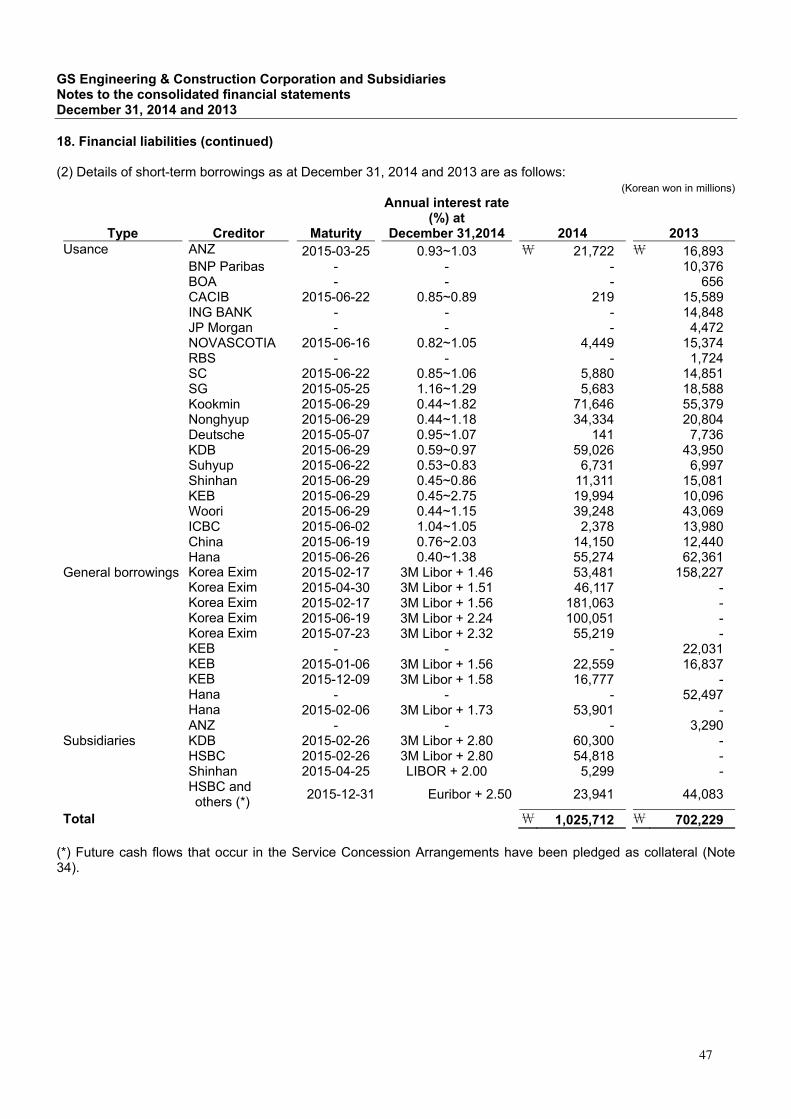
GS Engineering & Construction Corporation and Subsidiaries Notes to the consolidated financial statements December 31, 2014 and 2013
18. Financial liabilities (continued) (2) Details of short-term borrowings as at December 31, 2014 and 2013 are as follows:
(Korean won in millions)
Type Creditor Maturity
Annual interest rate(%) at
December 31,2014 2014 2013 Usance ANZ 2015-03-25 0.93~1.03 \ 21,722 \ 16,893 BNP Paribas - - - 10,376 BOA - - - 656 CACIB 2015-06-22 0.85~0.89 219 15,589 ING BANK - - - 14,848 JP Morgan - - - 4,472 NOVASCOTIA 2015-06-16 0.82~1.05 4,449 15,374 RBS - - - 1,724 SC 2015-06-22 0.85~1.06 5,880 14,851 SG 2015-05-25 1.16~1.29 5,683 18,588 Kookmin 2015-06-29 0.44~1.82 71,646 55,379
Nonghyup 2015-06-29 0.44~1.18 34,334 20,804 Deutsche 2015-05-07 0.95~1.07 141 7,736 KDB 2015-06-29 0.59~0.97 59,026 43,950
Suhyup 2015-06-22 0.53~0.83 6,731 6,997 Shinhan 2015-06-29 0.45~0.86 11,311 15,081 KEB 2015-06-29 0.45~2.75 19,994 10,096 Woori 2015-06-29 0.44~1.15 39,248 43,069 ICBC 2015-06-02 1.04~1.05 2,378 13,980 China 2015-06-19 0.76~2.03 14,150 12,440 Hana 2015-06-26 0.40~1.38 55,274 62,361General borrowings Korea Exim 2015-02-17 3M Libor + 1.46 53,481 158,227 Korea Exim 2015-04-30 3M Libor + 1.51 46,117 - Korea Exim 2015-02-17 3M Libor + 1.56 181,063 - Korea Exim 2015-06-19 3M Libor + 2.24 100,051 - Korea Exim 2015-07-23 3M Libor + 2.32 55,219 - KEB - - - 22,031 KEB 2015-01-06 3M Libor + 1.56 22,559 16,837 KEB 2015-12-09 3M Libor + 1.58 16,777 - Hana - - - 52,497 Hana 2015-02-06 3M Libor + 1.73 53,901 - ANZ - - - 3,290Subsidiaries KDB 2015-02-26 3M Libor + 2.80 60,300 - HSBC 2015-02-26 3M Libor + 2.80 54,818 - Shinhan 2015-04-25 LIBOR + 2.00 5,299 - HSBC and
others (*) 2015-12-31 Euribor + 2.50 23,941 44,083
Total \ 1,025,712 \ 702,229 (*) Future cash flows that occur in the Service Concession Arrangements have been pledged as collateral (Note 34).
47
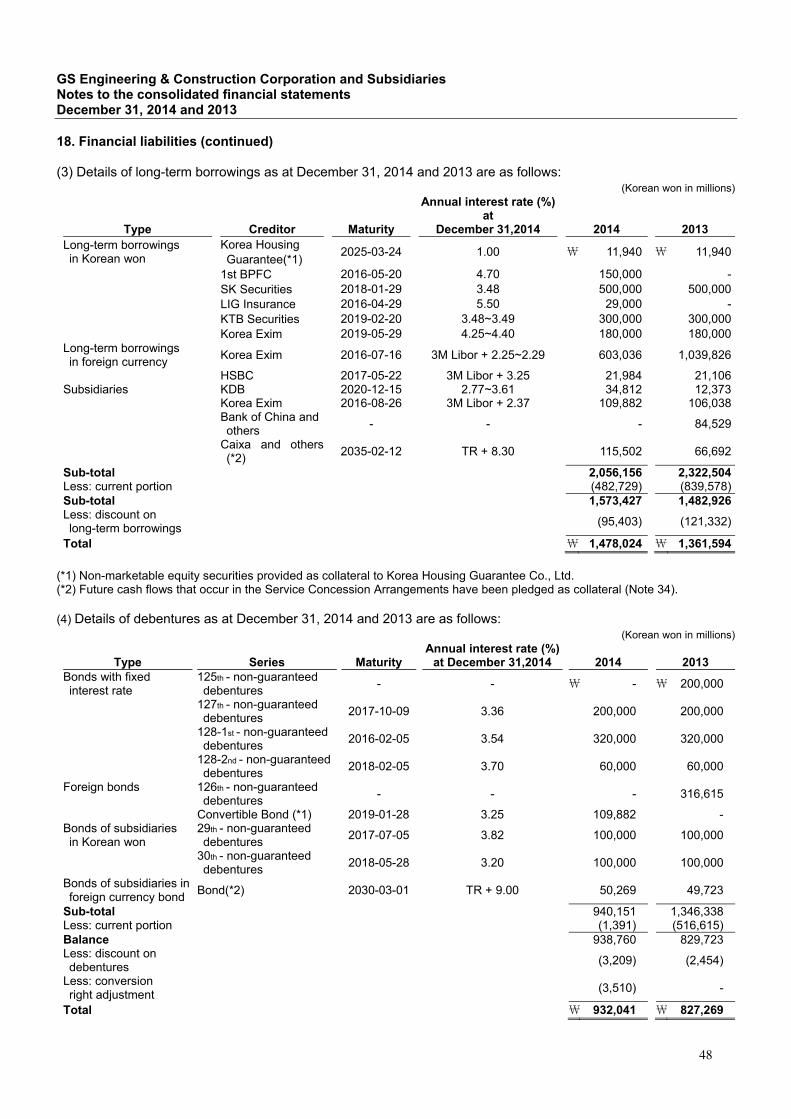
GS Engineering & Construction Corporation and Subsidiaries Notes to the consolidated financial statements December 31, 2014 and 2013
18. Financial liabilities (continued) (3) Details of long-term borrowings as at December 31, 2014 and 2013 are as follows:
(Korean won in millions)
Type Creditor Maturity
Annual interest rate (%) at
December 31,2014 2014 2013 Long-term borrowings in Korean won
Korea Housing Guarantee(*1)
2025-03-24 1.00 \ 11,940 \ 11,940
1st BPFC 2016-05-20 4.70 150,000 - SK Securities 2018-01-29 3.48 500,000 500,000 LIG Insurance 2016-04-29 5.50 29,000 - KTB Securities 2019-02-20 3.48~3.49 300,000 300,000 Korea Exim 2019-05-29 4.25~4.40 180,000 180,000Long-term borrowings in foreign currency
Korea Exim 2016-07-16 3M Libor + 2.25~2.29 603,036 1,039,826
HSBC 2017-05-22 3M Libor + 3.25 21,984 21,106Subsidiaries KDB 2020-12-15 2.77~3.61 34,812 12,373 Korea Exim 2016-08-26 3M Libor + 2.37 109,882 106,038
Bank of China and others
- - - 84,529
Caixa and others(*2)
2035-02-12 TR + 8.30 115,502 66,692
Sub-total 2,056,156 2,322,504Less: current portion (482,729) (839,578)Sub-total 1,573,427 1,482,926Less: discount on long-term borrowings
(95,403) (121,332)
Total \ 1,478,024 \ 1,361,594
(*1) Non-marketable equity securities provided as collateral to Korea Housing Guarantee Co., Ltd. (*2) Future cash flows that occur in the Service Concession Arrangements have been pledged as collateral (Note 34). (4) Details of debentures as at December 31, 2014 and 2013 are as follows:
(Korean won in millions)
Type Series Maturity Annual interest rate (%)
at December 31,2014 2014 2013 Bonds with fixed interest rate
125th - non-guaranteed debentures
- - \ - \ 200,000
127th - non-guaranteed debentures
2017-10-09 3.36
200,000 200,000
128-1st - non-guaranteeddebentures
2016-02-05 3.54
320,000 320,000
128-2nd - non-guaranteeddebentures
2018-02-05 3.70
60,000 60,000
Foreign bonds 126th - non-guaranteed debentures
- -
- 316,615
Convertible Bond (*1) 2019-01-28 3.25 109,882 -Bonds of subsidiaries in Korean won
29th - non-guaranteed debentures
2017-07-05 3.82
100,000 100,000
30th - non-guaranteed debentures
2018-05-28 3.20
100,000 100,000
Bonds of subsidiaries in foreign currency bond
Bond(*2) 2030-03-01 TR + 9.00
50,269 49,723
Sub-total 940,151 1,346,338 Less: current portion (1,391) (516,615)Balance 938,760 829,723 Less: discount on debentures
(3,209) (2,454)
Less: conversion right adjustment
(3,510) -
Total \ 932,041 \ 827,269
48
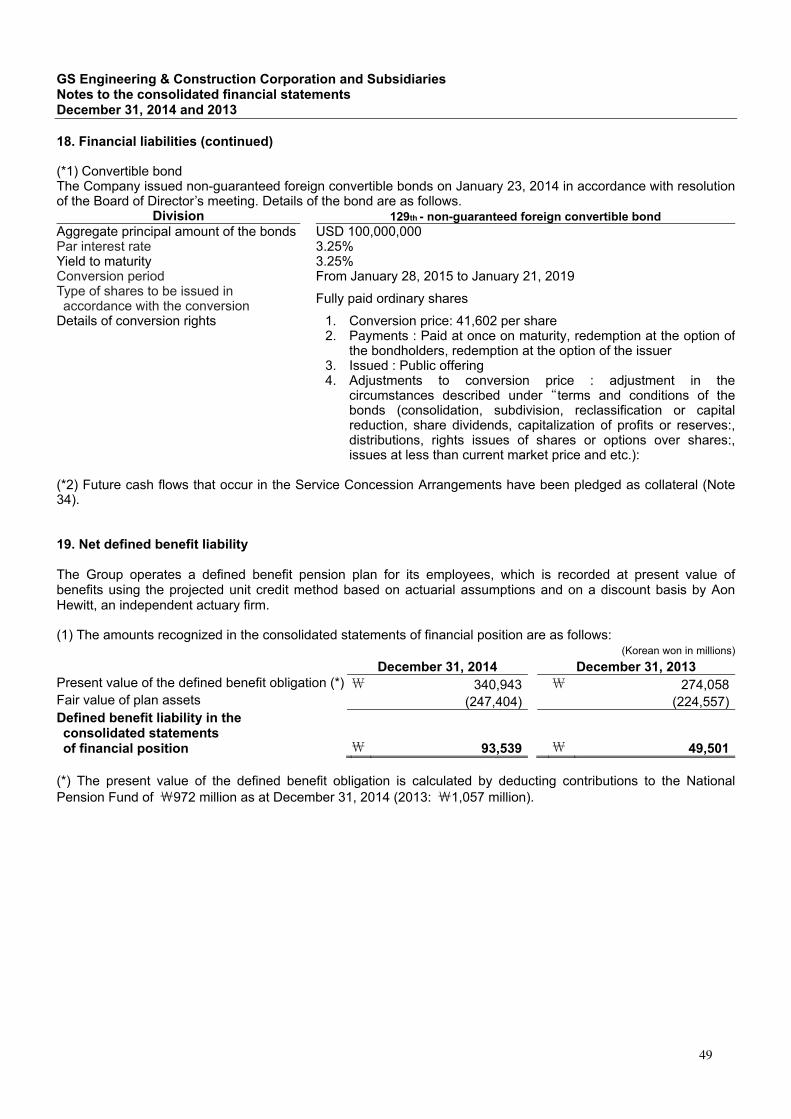
GS Engineering & Construction Corporation and Subsidiaries Notes to the consolidated financial statements December 31, 2014 and 2013
18. Financial liabilities (continued) (*1) Convertible bond The Company issued non-guaranteed foreign convertible bonds on January 23, 2014 in accordance with resolution of the Board of Director’s meeting. Details of the bond are as follows.
Division 129th - non-guaranteed foreign convertible bond Aggregate principal amount of the bonds USD 100,000,000Par interest rate 3.25%Yield to maturity 3.25%Conversion period From January 28, 2015 to January 21, 2019 Type of shares to be issued in accordance with the conversion
Fully paid ordinary shares
Details of conversion rights 1. Conversion price: 41,602 per share2. Payments : Paid at once on maturity, redemption at the option of
the bondholders, redemption at the option of the issuer 3. Issued : Public offering 4. Adjustments to conversion price : adjustment in the
circumstances described under “terms and conditions of the bonds (consolidation, subdivision, reclassification or capital reduction, share dividends, capitalization of profits or reserves:, distributions, rights issues of shares or options over shares:, issues at less than current market price and etc.):
(*2) Future cash flows that occur in the Service Concession Arrangements have been pledged as collateral (Note 34). 19. Net defined benefit liability The Group operates a defined benefit pension plan for its employees, which is recorded at present value of benefits using the projected unit credit method based on actuarial assumptions and on a discount basis by Aon Hewitt, an independent actuary firm. (1) The amounts recognized in the consolidated statements of financial position are as follows:
(Korean won in millions)
December 31, 2014 December 31, 2013 Present value of the defined benefit obligation (*) \ 340,943 \ 274,058 Fair value of plan assets (247,404) (224,557)Defined benefit liability in the consolidated statements of financial position \ 93,539 \ 49,501
(*) The present value of the defined benefit obligation is calculated by deducting contributions to the National Pension Fund of ₩972 million as at December 31, 2014 (2013: ₩1,057 million).
49
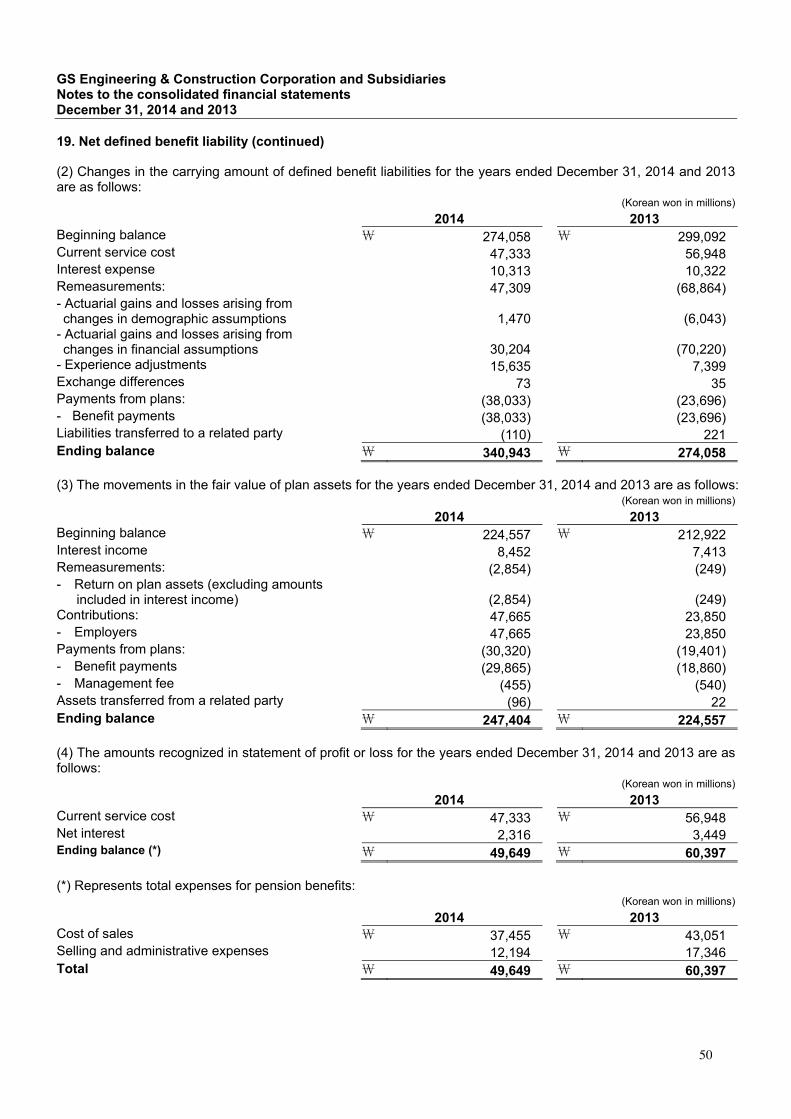
GS Engineering & Construction Corporation and Subsidiaries Notes to the consolidated financial statements December 31, 2014 and 2013
19. Net defined benefit liability (continued) (2) Changes in the carrying amount of defined benefit liabilities for the years ended December 31, 2014 and 2013 are as follows:
(Korean won in millions)
2014 2013 Beginning balance \ 274,058 \ 299,092 Current service cost 47,333 56,948 Interest expense 10,313 10,322 Remeasurements: 47,309 (68,864)- Actuarial gains and losses arising from changes in demographic assumptions
1,470 (6,043)
- Actuarial gains and losses arising from changes in financial assumptions
30,204 (70,220)
- Experience adjustments 15,635 7,399 Exchange differences 73 35 Payments from plans: (38,033) (23,696)- Benefit payments (38,033) (23,696)Liabilities transferred to a related party (110) 221 Ending balance \ 340,943 \ 274,058 (3) The movements in the fair value of plan assets for the years ended December 31, 2014 and 2013 are as follows:
(Korean won in millions)
2014 2013 Beginning balance \ 224,557 \ 212,922 Interest income 8,452 7,413 Remeasurements: (2,854) (249)- Return on plan assets (excluding amounts
included in interest income)
(2,854) (249)Contributions: 47,665 23,850 - Employers 47,665 23,850 Payments from plans: (30,320) (19,401)- Benefit payments (29,865) (18,860)- Management fee (455) (540)Assets transferred from a related party (96) 22 Ending balance \ 247,404 \ 224,557 (4) The amounts recognized in statement of profit or loss for the years ended December 31, 2014 and 2013 are as follows:
(Korean won in millions)
2014 2013 Current service cost \ 47,333 \ 56,948 Net interest 2,316 3,449 Ending balance (*) \ 49,649 \ 60,397 (*) Represents total expenses for pension benefits:
(Korean won in millions)
2014 2013 Cost of sales \ 37,455 \ 43,051 Selling and administrative expenses 12,194 17,346 Total \ 49,649 \ 60,397
50
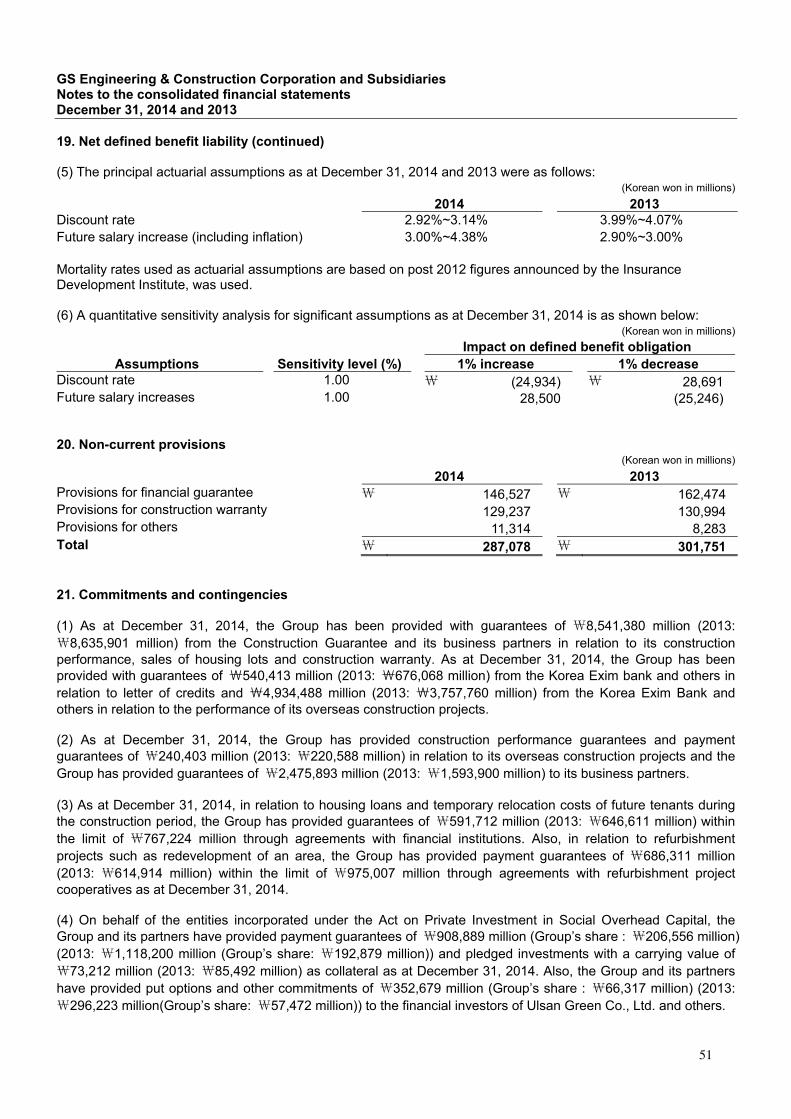
GS Engineering & Construction Corporation and Subsidiaries Notes to the consolidated financial statements December 31, 2014 and 2013
19. Net defined benefit liability (continued) (5) The principal actuarial assumptions as at December 31, 2014 and 2013 were as follows:
(Korean won in millions)
2014 2013 Discount rate 2.92%~3.14% 3.99%~4.07% Future salary increase (including inflation) 3.00%~4.38% 2.90%~3.00% Mortality rates used as actuarial assumptions are based on post 2012 figures announced by the Insurance Development Institute, was used. (6) A quantitative sensitivity analysis for significant assumptions as at December 31, 2014 is as shown below:
(Korean won in millions)
Impact on defined benefit obligation Assumptions Sensitivity level (%) 1% increase 1% decrease
Discount rate 1.00 \ (24,934) \ 28,691 Future salary increases 1.00 28,500 (25,246) 20. Non-current provisions
(Korean won in millions)
2014 2013 Provisions for financial guarantee \ 146,527 \ 162,474 Provisions for construction warranty 129,237 130,994 Provisions for others 11,314 8,283 Total \ 287,078 \ 301,751 21. Commitments and contingencies (1) As at December 31, 2014, the Group has been provided with guarantees of ₩8,541,380 million (2013: ₩8,635,901 million) from the Construction Guarantee and its business partners in relation to its construction performance, sales of housing lots and construction warranty. As at December 31, 2014, the Group has been provided with guarantees of ₩540,413 million (2013: ₩676,068 million) from the Korea Exim bank and others in relation to letter of credits and ₩4,934,488 million (2013: ₩3,757,760 million) from the Korea Exim Bank and others in relation to the performance of its overseas construction projects. (2) As at December 31, 2014, the Group has provided construction performance guarantees and payment guarantees of ₩240,403 million (2013: ₩220,588 million) in relation to its overseas construction projects and the Group has provided guarantees of ₩2,475,893 million (2013: ₩1,593,900 million) to its business partners. (3) As at December 31, 2014, in relation to housing loans and temporary relocation costs of future tenants during the construction period, the Group has provided guarantees of ₩591,712 million (2013: ₩646,611 million) within the limit of ₩767,224 million through agreements with financial institutions. Also, in relation to refurbishment projects such as redevelopment of an area, the Group has provided payment guarantees of ₩686,311 million (2013: ₩614,914 million) within the limit of ₩975,007 million through agreements with refurbishment project cooperatives as at December 31, 2014. (4) On behalf of the entities incorporated under the Act on Private Investment in Social Overhead Capital, the Group and its partners have provided payment guarantees of ₩908,889 million (Group’s share : ₩206,556 million) (2013: ₩1,118,200 million (Group’s share: ₩192,879 million)) and pledged investments with a carrying value of ₩73,212 million (2013: ₩85,492 million) as collateral as at December 31, 2014. Also, the Group and its partners have provided put options and other commitments of ₩352,679 million (Group’s share : ₩66,317 million) (2013: ₩296,223 million(Group’s share: ₩57,472 million)) to the financial investors of Ulsan Green Co., Ltd. and others.
51
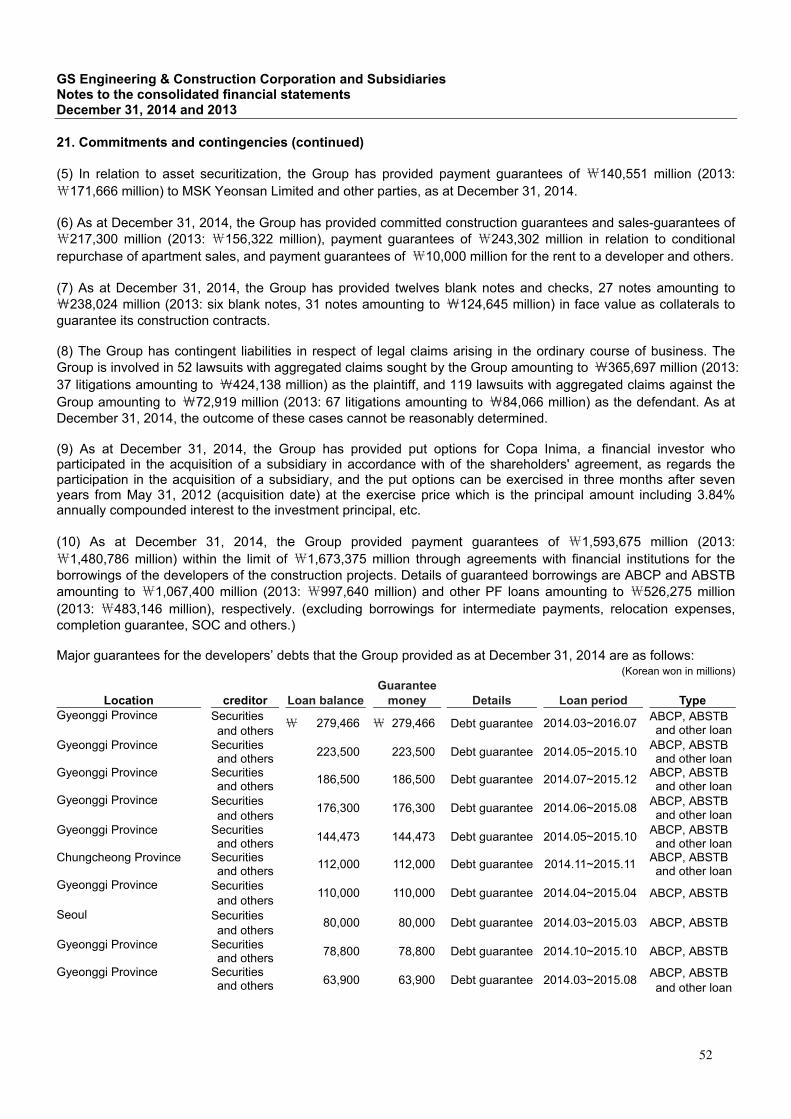
GS Engineering & Construction Corporation and Subsidiaries Notes to the consolidated financial statements December 31, 2014 and 2013
21. Commitments and contingencies (continued) (5) In relation to asset securitization, the Group has provided payment guarantees of ₩140,551 million (2013: ₩171,666 million) to MSK Yeonsan Limited and other parties, as at December 31, 2014. (6) As at December 31, 2014, the Group has provided committed construction guarantees and sales-guarantees of ₩217,300 million (2013: ₩156,322 million), payment guarantees of ₩243,302 million in relation to conditional repurchase of apartment sales, and payment guarantees of ₩10,000 million for the rent to a developer and others. (7) As at December 31, 2014, the Group has provided twelves blank notes and checks, 27 notes amounting to ₩238,024 million (2013: six blank notes, 31 notes amounting to ₩124,645 million) in face value as collaterals to guarantee its construction contracts. (8) The Group has contingent liabilities in respect of legal claims arising in the ordinary course of business. The Group is involved in 52 lawsuits with aggregated claims sought by the Group amounting to ₩365,697 million (2013: 37 litigations amounting to ₩424,138 million) as the plaintiff, and 119 lawsuits with aggregated claims against the Group amounting to ₩72,919 million (2013: 67 litigations amounting to ₩84,066 million) as the defendant. As at December 31, 2014, the outcome of these cases cannot be reasonably determined. (9) As at December 31, 2014, the Group has provided put options for Copa Inima, a financial investor who participated in the acquisition of a subsidiary in accordance with of the shareholders' agreement, as regards the participation in the acquisition of a subsidiary, and the put options can be exercised in three months after seven years from May 31, 2012 (acquisition date) at the exercise price which is the principal amount including 3.84% annually compounded interest to the investment principal, etc. (10) As at December 31, 2014, the Group provided payment guarantees of ₩1,593,675 million (2013: ₩1,480,786 million) within the limit of ₩1,673,375 million through agreements with financial institutions for the borrowings of the developers of the construction projects. Details of guaranteed borrowings are ABCP and ABSTB amounting to ₩1,067,400 million (2013: ₩997,640 million) and other PF loans amounting to ₩526,275 million (2013: ₩483,146 million), respectively. (excluding borrowings for intermediate payments, relocation expenses, completion guarantee, SOC and others.) Major guarantees for the developers’ debts that the Group provided as at December 31, 2014 are as follows:
(Korean won in millions)
Location creditor Loan balanceGuarantee
money Details Loan period Type Gyeonggi Province Securities
and others \ 279,466 \ 279,466 Debt guarantee 2014.03~2016.07
ABCP, ABSTB and other loan
Gyeonggi Province Securities and others
223,500 223,500 Debt guarantee 2014.05~2015.10 ABCP, ABSTB and other loan
Gyeonggi Province Securities and others
186,500 186,500 Debt guarantee 2014.07~2015.12 ABCP, ABSTB and other loan
Gyeonggi Province Securities and others
176,300 176,300 Debt guarantee 2014.06~2015.08
ABCP, ABSTB and other loan
Gyeonggi Province Securities and others
144,473 144,473 Debt guarantee 2014.05~2015.10 ABCP, ABSTB and other loan
Chungcheong Province Securities and others
112,000 112,000 Debt guarantee 2014.11~2015.11 ABCP, ABSTB and other loan
Gyeonggi Province Securities and others
110,000 110,000 Debt guarantee 2014.04~2015.04
ABCP, ABSTB
Seoul Securities and others
80,000 80,000 Debt guarantee 2014.03~2015.03
ABCP, ABSTB
Gyeonggi Province Securities and others
78,800 78,800 Debt guarantee 2014.10~2015.10 ABCP, ABSTB
Gyeonggi Province Securities and others
63,900 63,900 Debt guarantee 2014.03~2015.08
ABCP, ABSTB and other loan
52
GS Engineering & Construction Corporation and Subsidiaries Notes to the consolidated financial statements December 31, 2014 and 2013
21. Commitments and contingencies (continued) (11) Parnas Hotel Co., Ltd. (“Parnas”), a subsidiary, amended its contract with Intercontinental Hotels Group PLC. (“IHG”) on January 1, 2011, wherein, Grand Intercontinental Seoul Parnas and Intercontinental Seoul Coex should be directly managed by Parnas, and only supporting services on hotel operation and sales should be provided by IHG. The supporting service fees recognized for the years ended December 31, 2014 and 2013, amount to ₩4,214 million and ₩3,940 million, respectively. (12) Parnas, a subsidiary, entered into a lease contract with the Korea International Trade Association (“KITA”) on land used by Intercontinental Seoul Coex on July 22, 1997. The lease contract is effective until December 31, 2019, with a renewal option for another ten years upon mutual agreement. According to this contract, Parnas shall pay to KITA rental fees corresponding to a prescribed proportion of the sales. For the years ended December 31, 2014 and 2013, Parnas recognized lease expenses of ₩4,996 million and ₩5,606 million, respectively. (13) Parnas, a subsidiary, entered into a lease contract with Sengbo No. 1 REITs Co., Ltd. for operation of Nine Tree Hotel on December 15, 2011. The lease contract is effective from December 1, 2012 until December 31, 2032, with a renewal option upon mutual agreement. According to this contract, Parnas shall pay rental fees corresponding to a prescribed proportion of the sales and at least ₩3,300 million should be guaranteed as rental fees each year. For the years ended December 31, 2014 and 2013, Parnas paid expenses of ₩3,325 million and ₩3,300 million (guaranteed amount calculated by daily basis), respectively. (14) GS Inima Environment S.A., a subsidiary has provided collateral of future cash flows that occur in the Service Concession Arrangements and has pledged supplemental funding obligation for borrowings from financial institute. 22. Issued capital and share premium (1) Details of issued capital as at December 31, 2014 and 2013 are as follows: 2014 2013 Authorized shares 200,000,000 shares 200,000,000 shares Par value per share ₩ 5,000 ₩ 5,000 Outstanding shares 71,000,000 shares 51,000,000 shares Issued capital (*) ₩ 355,000 million ₩ 255,000 million (*) The Company issued 20,000,000 shares at \5,000 par value during the year ended December 31, 2014 and issued at a price of \27,600 per share. (2) Details of share premium as at December 31, 2014 and 2013 are as follows:
(Korean won in millions)
2014 2013 Gain on sale of treasury stock \ 9,724 \ 9,724 Additional paid-in capital 558,104 109,735 Gain on business combination 15,002 15,002 Other additional capital 27,804 24,675 Total \ 610,634 \ 159,136 (3) Details of other components of equity as at December 31, 2014 and 2013, are as follows:
(Korean won in millions)
2014 2013 Treasury stock (*1) \ (75,733) \ (75,733) Other component of equity (*2) (65,078) (69,510) Total \ (140,811) \ (145,243) (*1) To stabilize the Group’s share price, the Group purchased 1,439,281 shares of own stock. (*2) Present value of exercising price of put option, which the Group has provided to financial investors by virtue of the shareholders' agreement as regards participation in the acquisition of a subsidiary, was recorded.
53
GS Engineering & Construction Corporation and Subsidiaries Notes to the consolidated financial statements December 31, 2014 and 2013
22. Issued capital and share premium (continued) (4) Details of other comprehensive loss as at December 31, 2014 and 2013 are as follows:
(Korean won in millions)
2014 2013 Gain on valuation of derivative instruments \ 28,427 \ 42,840 Loss on valuation of derivative instruments (86,681) (44,385) Gain on valuation of available-for-sale financial assets 6,766 7,765 Loss on valuation of available-for-sale financial assets (3,337) (3,773) Gain on exchange differences on translations of foreign operations
56,814
58,347
Loss on exchange differences on translations of foreign operations
(90,940)
(83,258)
Share of other comprehensive income of associates 1,243 1,122 Share of other comprehensive loss of associates (230) (271) Total \ (87,938) \ (21,613) 23. Retained earnings Retained earnings as at December 31, 2014 and 2013 consist of:
(Korean won in millions)
2014 2013 Legal reserves \ 79,869 \ 79,639 Appropriated retained earnings for business stabilization 844,653 844,653 Discretionary reserves 2,870,344 2,871,604 Remeasurements of net defined benefit liability (26,040) 11,567 Other consolidated retained earnings 18,294 11,222 Unappropriated accumulated deficit (1,253,069) (1,201,985) Total \ 2,534,051 \ 2,616,700 24. Loss per share Basic and diluted loss per share of equity holders of parent company for the years ended December 31, 2014 and 2013 are as follows:
(Korean won except for shares)
2014 (*1) 2013 Loss attributable to equity holders of
the parent company \ (41,071,813,801) \ (828,196,424,626)
Weighted average number of ordinary shares in issue (*2)
61,595,606 51,724,730 Basic and diluted loss per share \ (667) \ (16,012) (*1) Although the Group holds convertible bonds which have a potential dilutive effect, diluted loss per share amounts are the same as basic loss per share amounts due to an anti-dilutive effect on loss per share.
54
GS Engineering & Construction Corporation and Subsidiaries Notes to the consolidated financial statements December 31, 2014 and 2013
24. Loss per share (continued) (*2) Details of calculation of weighted average number of ordinary shares outstanding are as follows:
(Korean won except for shares)
2014
Period Number of
shares Number of
days Number of shares X Number of days
Shares at the beginning 2014.1.1~2014.12.31 51,000,000 365 18,615,000,000 Treasury stock 2014.1.1~2014.12.31 (1,439,281) 365 (525,337,565) Paid-in capital increase 2014.6.13~2014.12.31 17,089,783 202 3,452,136,166 Increase in capital stock without consideration (*)
2014.6.13~2014.12.31 746,206 202 150,733,612 2014.1.1~2014.12.31 2,164,011 365 789,864,015
Total 22,482,396,228 Weighted average number of ordinary shares outstanding 61,595,606
(*) Effect of increase in capital stock without consideration due to paid-in capital increase at the price less than under the market price is reflected.
(Korean won except for shares)
2013
PeriodNumber of
sharesNumber of
daysNumber of shares X Number of days
Shares at the beginning 2013.1.1~2013.12.31 51,000,000 365 18,615,000,000 Treasury stock 2013.1.1~2013.12.31 (1,439,281) 365 (525,337,565) increase in capital stock without consideration (*)
2013.1.1~2013.12.31 2,164,011 365 789,864,015
Total 18,879,526,450 Weighted average number of ordinary shares outstanding 51,724,730
(*) Effect of increase in capital stock without consideration due to paid-in capital increase at the price less than under the market price is reflected.
55
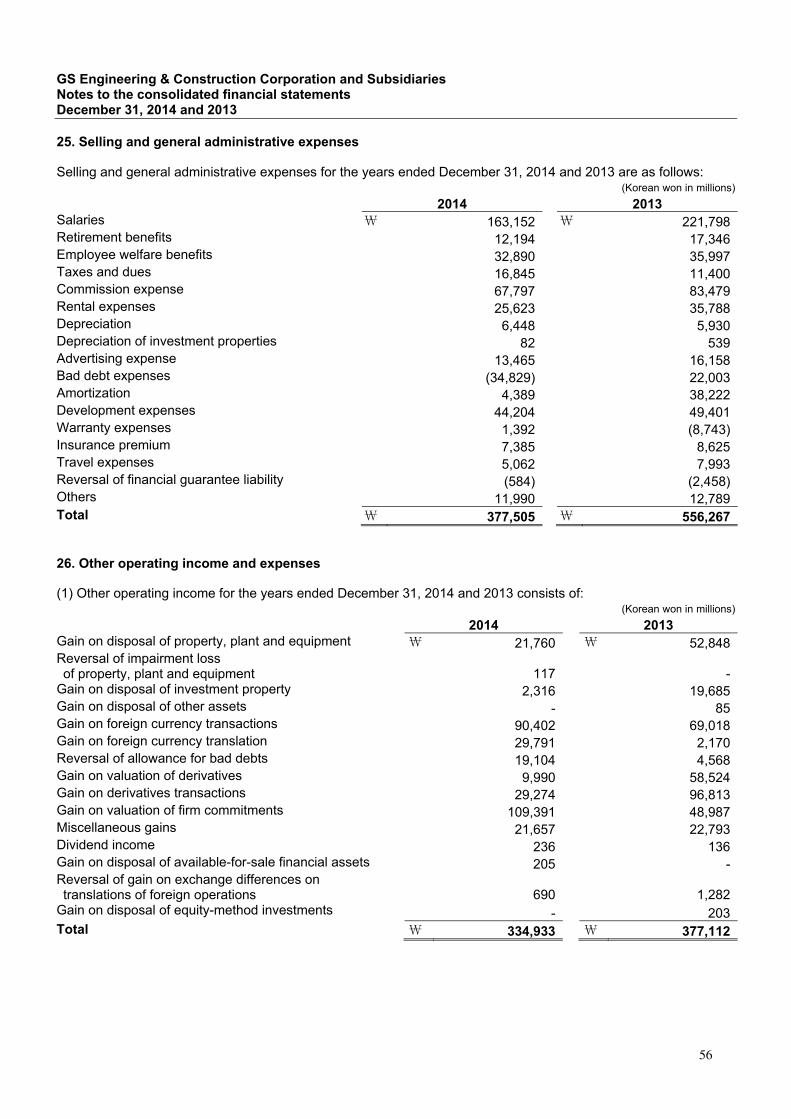
GS Engineering & Construction Corporation and Subsidiaries Notes to the consolidated financial statements December 31, 2014 and 2013
25. Selling and general administrative expenses Selling and general administrative expenses for the years ended December 31, 2014 and 2013 are as follows:
(Korean won in millions)
2014 2013 Salaries \ 163,152 \ 221,798 Retirement benefits 12,194 17,346 Employee welfare benefits 32,890 35,997 Taxes and dues 16,845 11,400 Commission expense 67,797 83,479 Rental expenses 25,623 35,788 Depreciation 6,448 5,930 Depreciation of investment properties 82 539 Advertising expense 13,465 16,158 Bad debt expenses (34,829) 22,003 Amortization 4,389 38,222 Development expenses 44,204 49,401 Warranty expenses 1,392 (8,743)Insurance premium 7,385 8,625 Travel expenses 5,062 7,993 Reversal of financial guarantee liability (584) (2,458)Others 11,990 12,789 Total \ 377,505 \ 556,267 26. Other operating income and expenses (1) Other operating income for the years ended December 31, 2014 and 2013 consists of:
(Korean won in millions)
2014 2013 Gain on disposal of property, plant and equipment \ 21,760 \ 52,848 Reversal of impairment loss of property, plant and equipment 117 -
Gain on disposal of investment property 2,316 19,685 Gain on disposal of other assets - 85 Gain on foreign currency transactions 90,402 69,018 Gain on foreign currency translation 29,791 2,170 Reversal of allowance for bad debts 19,104 4,568 Gain on valuation of derivatives 9,990 58,524 Gain on derivatives transactions 29,274 96,813 Gain on valuation of firm commitments 109,391 48,987 Miscellaneous gains 21,657 22,793 Dividend income 236 136 Gain on disposal of available-for-sale financial assets 205 -Reversal of gain on exchange differences on translations of foreign operations 690 1,282 Gain on disposal of equity-method investments - 203 Total \ 334,933 \ 377,112
56

GS Engineering & Construction Corporation and Subsidiaries Notes to the consolidated financial statements December 31, 2014 and 2013
26. Other operating income and expenses (continued) (2) Other operating expenses for the years ended December 31, 2014 and 2013 consist of:
(Korean won in millions)
2014 2013 Bad debts expense \ 41,692 \ 25,873 Loss on disposal of property, plant, and equipment 21,255 1,631 Impairment loss of property, plant, and equipment - 8,970 Loss on disposal of intangible assets 6 1 Loss on disposal of investment property 3,984 7,155 Impairment loss of investment property 700 1,042 Loss on foreign currency transactions 56,252 53,136 Loss on foreign currency translation 14,280 49,060 Loss on valuation of derivatives 82,299 8,615 Loss on derivatives transactions 26,599 81,267 Loss on valuation of firm commitments 21,957 74,981 Loss on disposal of trade receivables 1,836 4,466 Reversal of gain on exchange differences on translations of foreign operations 20 3,033 Loss on disposal of financial assets 811 52 Impairment loss of financial assets 4,401 76,770 Miscellaneous losses and others 73,530 16,024 Total \ 349,622 \ 412,076 27. Finance income and expenses (1) Finance income for the years ended December 31, 2014 and 2013 consists of:
(Korean won in millions)
2014 2013 Interest income \ 59,760 \ 60,852 Dividend income 29 -Gain on foreign currency transactions 80,554 34,822 Gain on foreign currency translation 31,044 66,153 Gain on disposal of long-term financial assets 862 32 Reversal of financial guarantee liabilities 92,583 50,000 Total \ 264,832 \ 211,859 (2) Finance costs for the years ended December 31, 2014 and 2013 are as follows:
(Korean won in millions)
2014 2013 Interest expense \ 116,031 \ 131,023 Loss on foreign currency transaction 63,760 47,611 Loss on foreign currency translation 73,493 5,677 Loss on disposal of short-term financial assets 329 58 Loss on disposal of long-term financial assets 137 800 Loss on derivatives transactions 12,571 -Loss on valuation of derivatives - 8,971 Loss on disposal of equity-method investments 1,915 -Financial guarantee expenses 68,629 50,000 Total \ 336,865 \ 244,140
57
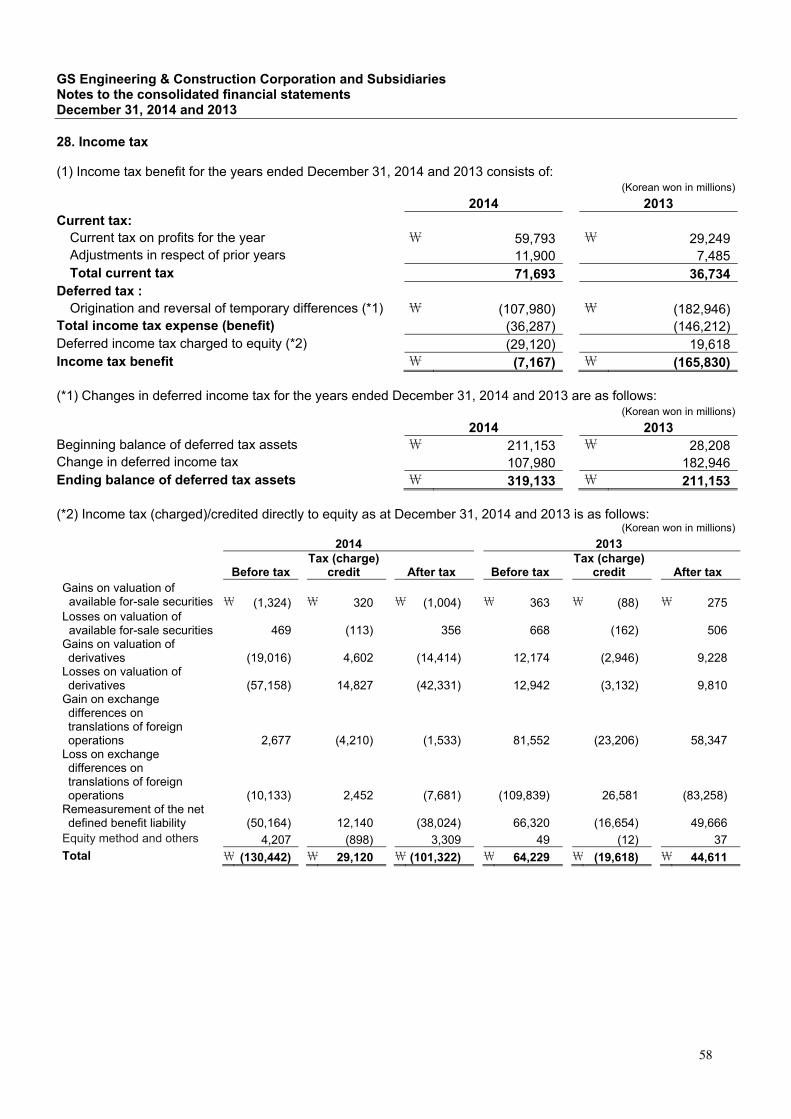
GS Engineering & Construction Corporation and Subsidiaries Notes to the consolidated financial statements December 31, 2014 and 2013
28. Income tax (1) Income tax benefit for the years ended December 31, 2014 and 2013 consists of:
(Korean won in millions)
2014 2013 Current tax:
Current tax on profits for the year \ 59,793 \ 29,249 Adjustments in respect of prior years 11,900 7,485 Total current tax 71,693 36,734
Deferred tax :
Origination and reversal of temporary differences (*1) \ (107,980) \ (182,946)Total income tax expense (benefit) (36,287) (146,212)Deferred income tax charged to equity (*2) (29,120) 19,618 Income tax benefit \ (7,167) \ (165,830) (*1) Changes in deferred income tax for the years ended December 31, 2014 and 2013 are as follows:
(Korean won in millions)
2014 2013 Beginning balance of deferred tax assets \ 211,153 \ 28,208 Change in deferred income tax 107,980 182,946 Ending balance of deferred tax assets \ 319,133 \ 211,153 (*2) Income tax (charged)/credited directly to equity as at December 31, 2014 and 2013 is as follows:
(Korean won in millions)
2014 2013
Before tax Tax (charge)
credit After tax Before tax Tax (charge)
credit After tax Gains on valuation of available for-sale securities
\ (1,324) \ 320 \ (1,004) \ 363 \ (88) \ 275
Losses on valuation of available for-sale securities
469 (113) 356 668 (162) 506
Gains on valuation of derivatives
(19,016) 4,602 (14,414) 12,174
(2,946)
9,228
Losses on valuation of derivatives
(57,158) 14,827 (42,331) 12,942
(3,132)
9,810
Gain on exchange differences on translations of foreign operations
2,677 (4,210) (1,533) 81,552
(23,206)
58,347 Loss on exchange differences on translations of foreign operations
(10,133) 2,452 (7,681) (109,839)
26,581
(83,258) Remeasurement of the net defined benefit liability
(50,164) 12,140 (38,024) 66,320
(16,654)
49,666
Equity method and others 4,207 (898) 3,309 49 (12) 37 Total \ (130,442) \ 29,120 \ (101,322) \ 64,229 \ (19,618) \ 44,611
58
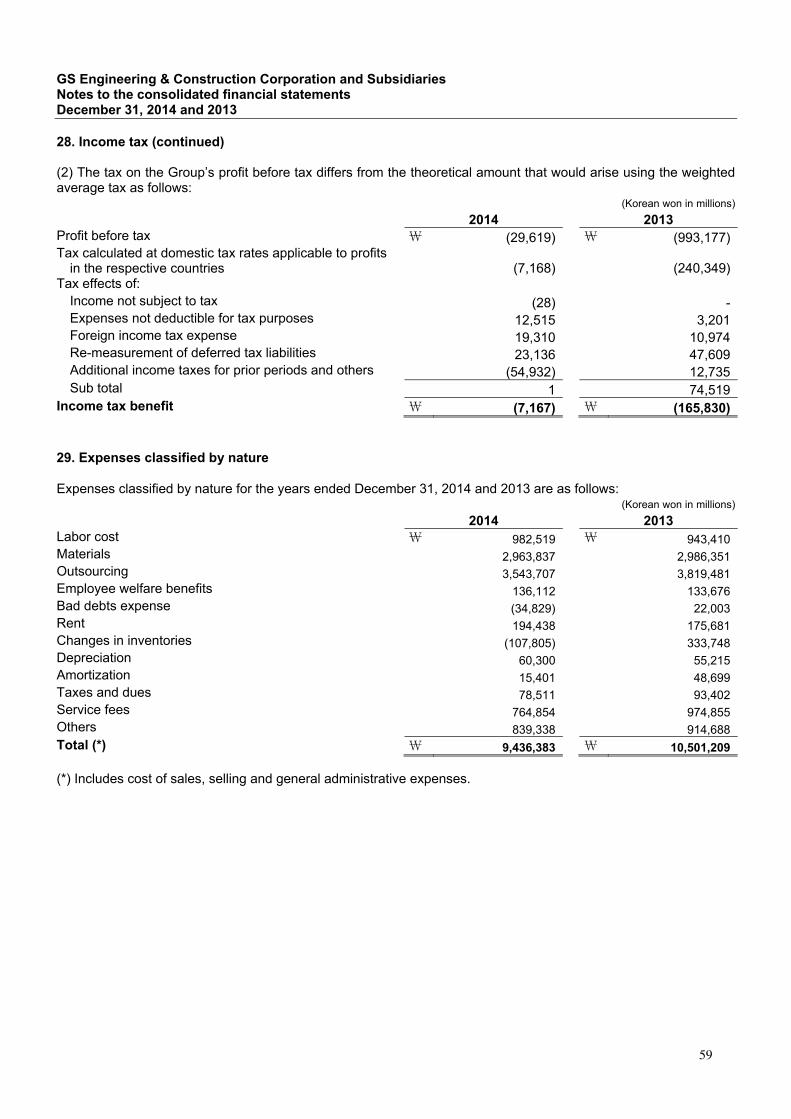
GS Engineering & Construction Corporation and Subsidiaries Notes to the consolidated financial statements December 31, 2014 and 2013
28. Income tax (continued) (2) The tax on the Group’s profit before tax differs from the theoretical amount that would arise using the weighted average tax as follows:
(Korean won in millions)
2014 2013 Profit before tax \ (29,619) \ (993,177)Tax calculated at domestic tax rates applicable to profits
in the respective countries (7,168) (240,349)Tax effects of:
Income not subject to tax (28) -Expenses not deductible for tax purposes 12,515 3,201 Foreign income tax expense 19,310 10,974 Re-measurement of deferred tax liabilities 23,136 47,609 Additional income taxes for prior periods and others (54,932) 12,735 Sub total 1 74,519
Income tax benefit \ (7,167) \ (165,830) 29. Expenses classified by nature Expenses classified by nature for the years ended December 31, 2014 and 2013 are as follows:
(Korean won in millions)
2014 2013 Labor cost \ 982,519 \ 943,410 Materials 2,963,837 2,986,351 Outsourcing 3,543,707 3,819,481 Employee welfare benefits 136,112 133,676 Bad debts expense (34,829) 22,003 Rent 194,438 175,681 Changes in inventories (107,805) 333,748 Depreciation 60,300 55,215 Amortization 15,401 48,699 Taxes and dues 78,511 93,402 Service fees 764,854 974,855 Others 839,338 914,688 Total (*) \ 9,436,383 \ 10,501,209 (*) Includes cost of sales, selling and general administrative expenses.
59
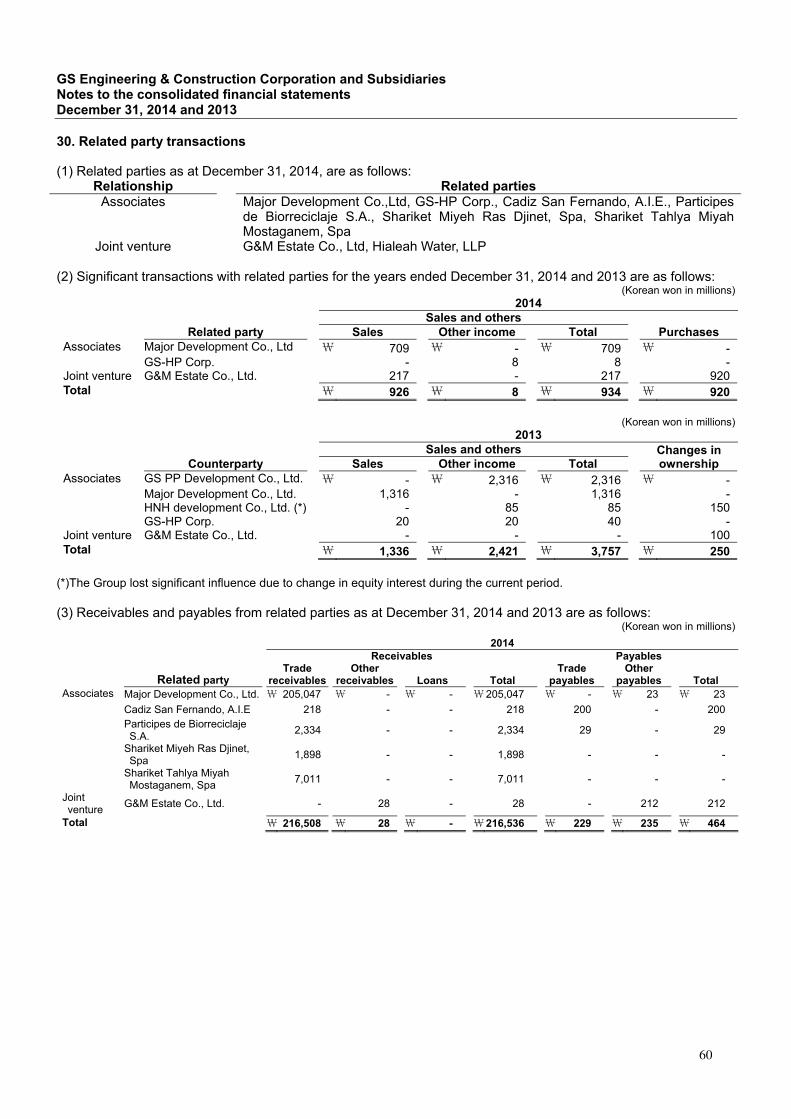
GS Engineering & Construction Corporation and Subsidiaries Notes to the consolidated financial statements December 31, 2014 and 2013
30. Related party transactions (1) Related parties as at December 31, 2014, are as follows:
Relationship Related partiesAssociates Major Development Co.,Ltd, GS-HP Corp., Cadiz San Fernando, A.I.E., Participes
de Biorreciclaje S.A., Shariket Miyeh Ras Djinet, Spa, Shariket Tahlya Miyah Mostaganem, Spa
Joint venture G&M Estate Co., Ltd, Hialeah Water, LLP (2) Significant transactions with related parties for the years ended December 31, 2014 and 2013 are as follows:
(Korean won in millions) 2014 Sales and others Related party Sales Other income Total Purchases
Associates Major Development Co., Ltd \ 709 \ - \ 709 \ - GS-HP Corp. - 8 8 -Joint venture G&M Estate Co., Ltd. 217 - 217 920 Total \ 926 \ 8 \ 934 \ 920
(Korean won in millions)
2013 Sales and others Changes in
ownership Counterparty Sales Other income Total Associates GS PP Development Co., Ltd. \ - \ 2,316 \ 2,316 \ - Major Development Co., Ltd. 1,316 - 1,316 - HNH development Co., Ltd. (*) - 85 85 150 GS-HP Corp. 20 20 40 -Joint venture G&M Estate Co., Ltd. - - - 100 Total \ 1,336 \ 2,421 \ 3,757 \ 250
(*)The Group lost significant influence due to change in equity interest during the current period. (3) Receivables and payables from related parties as at December 31, 2014 and 2013 are as follows:
(Korean won in millions) 2014
Receivables Payables
Related party Trade
receivables Other
receivables Loans Total Trade
payables Other
payables Total Associates Major Development Co., Ltd. \ 205,047 \ - \ - \ 205,047 \ - \ 23 \ 23 Cadiz San Fernando, A.I.E 218 - - 218 200 - 200 Participes de Biorreciclaje
S.A.
2,334 - - 2,334 29 - 29
Shariket Miyeh Ras Djinet, Spa
1,898 - - 1,898 - - -
Shariket Tahlya Miyah Mostaganem, Spa
7,011 - - 7,011 - - -
Joint venture
G&M Estate Co., Ltd.
- 28 - 28 - 212 212
Total \ 216,508 \ 28 \ - \ 216,536 \ 229 \ 235 \ 464
60
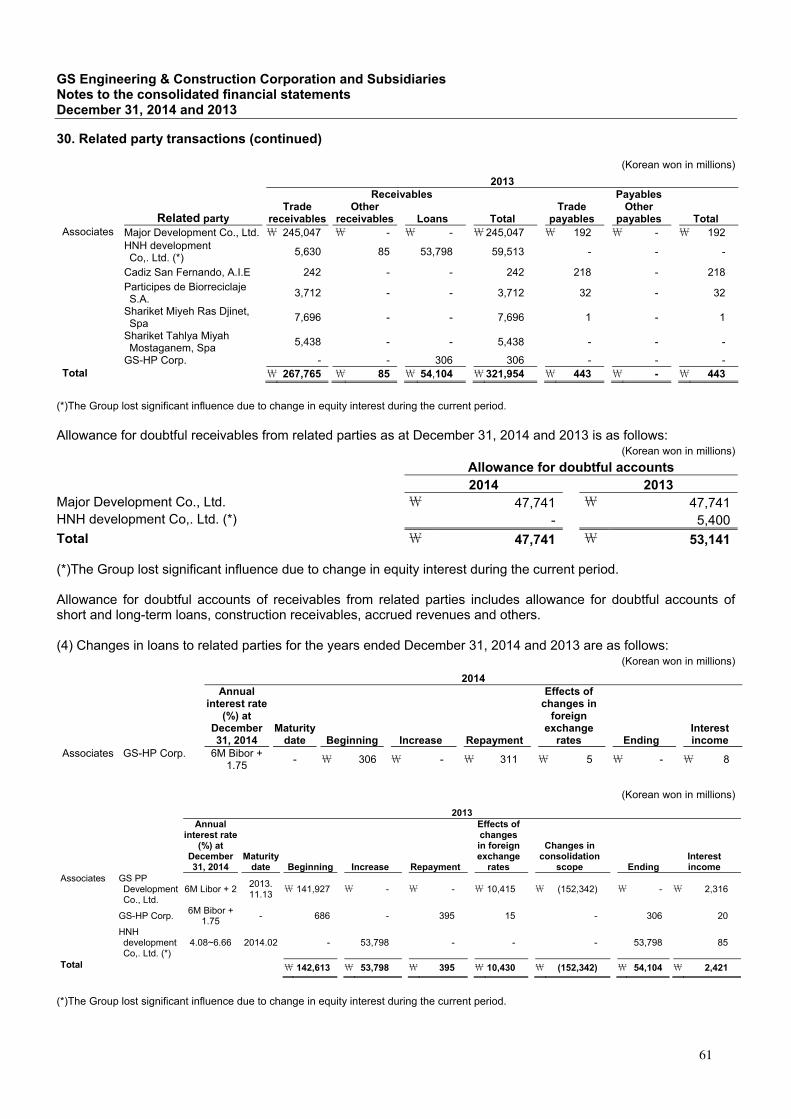
GS Engineering & Construction Corporation and Subsidiaries Notes to the consolidated financial statements December 31, 2014 and 2013
30. Related party transactions (continued)
(Korean won in millions)
2013 Receivables Payables
Related party Trade
receivables Other
receivables Loans Total Trade
payables Other
payables Total Associates Major Development Co., Ltd. \ 245,047 \ - \ - \ 245,047 \ 192 \ - \ 192 HNH development
Co,. Ltd. (*)
5,630 85 53,798 59,513 -
- -
Cadiz San Fernando, A.I.E 242 - - 242 218 - 218 Participes de Biorreciclaje
S.A.
3,712 - - 3,712 32 - 32
Shariket Miyeh Ras Djinet, Spa
7,696 - - 7,696 1 - 1
Shariket Tahlya Miyah Mostaganem, Spa
5,438 - - 5,438 - - -
GS-HP Corp. - - 306 306 - - - Total \ 267,765 \ 85 \ 54,104 \ 321,954 \ 443 \ - \ 443
(*)The Group lost significant influence due to change in equity interest during the current period. Allowance for doubtful receivables from related parties as at December 31, 2014 and 2013 is as follows:
(Korean won in millions)
Allowance for doubtful accounts 2014 2013
Major Development Co., Ltd. \ 47,741 \ 47,741 HNH development Co,. Ltd. (*) - 5,400 Total \ 47,741 \ 53,141 (*)The Group lost significant influence due to change in equity interest during the current period. Allowance for doubtful accounts of receivables from related parties includes allowance for doubtful accounts of short and long-term loans, construction receivables, accrued revenues and others. (4) Changes in loans to related parties for the years ended December 31, 2014 and 2013 are as follows:
(Korean won in millions)
2014
Annual interest rate
(%) at December 31, 2014
Maturity date Beginning Increase Repayment
Effects of changes in
foreign exchange
rates Ending Interest income
Associates GS-HP Corp. 6M Bibor + 1.75
-
\ 306 \ - \ 311 \ 5 \ - \ 8
(Korean won in millions)
2013
Annual interest rate
(%) at December 31, 2014
Maturity date Beginning Increase Repayment
Effects of changes in foreign exchange
rates
Changes in consolidation
scope EndingInterest income
Associates GS PP Development Co., Ltd.
6M Libor + 2
2013. 11.13
\ 141,927 \ - \ - \ 10,415 \ (152,342) \ - \ 2,316
GS-HP Corp.
6M Bibor +1.75
-
686 - 395 15 - 306 20
HNH development Co,. Ltd. (*)
4.08~6.66 2014.02
- 53,798 - - - 53,798 85
Total \ 142,613 \ 53,798 \ 395 \ 10,430 \ (152,342) \ 54,104 \ 2,421
(*)The Group lost significant influence due to change in equity interest during the current period.
61
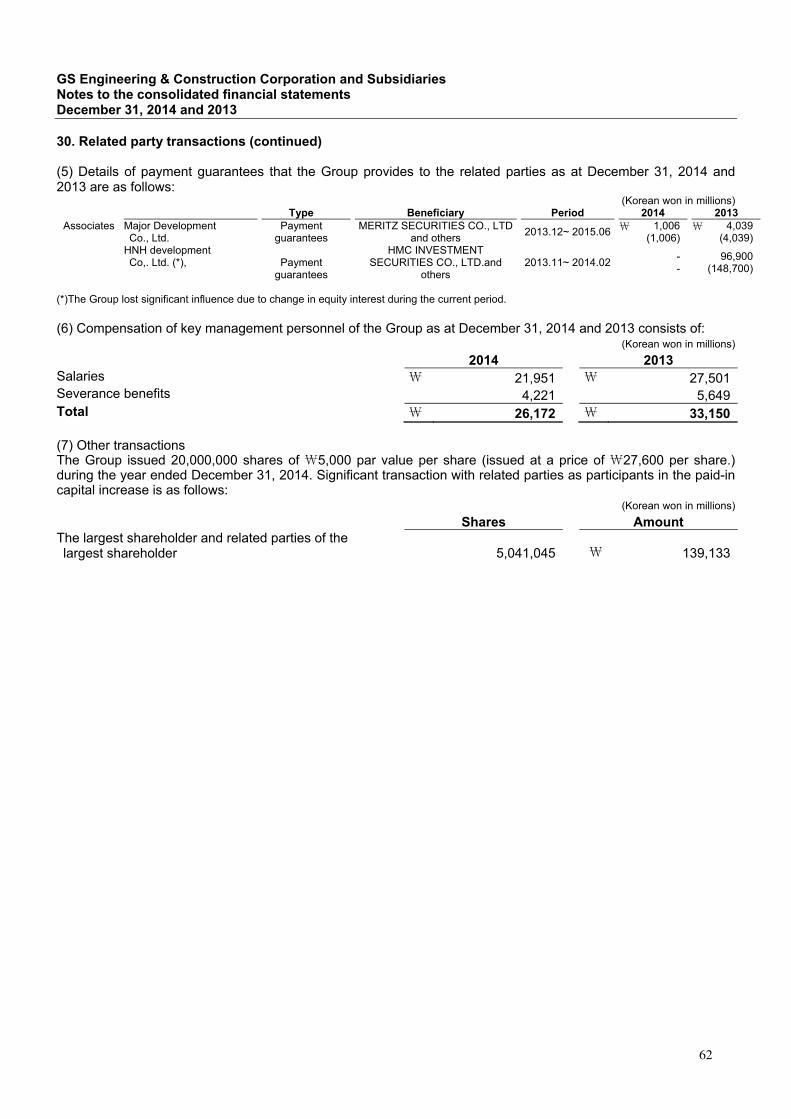
GS Engineering & Construction Corporation and Subsidiaries Notes to the consolidated financial statements December 31, 2014 and 2013
30. Related party transactions (continued)
(5) Details of payment guarantees that the Group provides to the related parties as at December 31, 2014 and 2013 are as follows:
(Korean won in millions) Type Beneficiary Period 2014 2013
Associates Major Development Co., Ltd.
Payment guarantees
MERITZ SECURITIES CO., LTD and others
2013.12~ 2015.06 \ 1,006(1,006)
\ 4,039(4,039)
HNH development Co,. Ltd. (*), Payment
guarantees
HMC INVESTMENT SECURITIES CO., LTD.and
others 2013.11~ 2014.02
--
96,900(148,700)
(*)The Group lost significant influence due to change in equity interest during the current period. (6) Compensation of key management personnel of the Group as at December 31, 2014 and 2013 consists of:
(Korean won in millions)
2014 2013 Salaries \ 21,951 \ 27,501 Severance benefits 4,221 5,649 Total \ 26,172 \ 33,150 (7) Other transactions The Group issued 20,000,000 shares of \5,000 par value per share (issued at a price of \27,600 per share.) during the year ended December 31, 2014. Significant transaction with related parties as participants in the paid-in capital increase is as follows:
(Korean won in millions)
Shares Amount The largest shareholder and related parties of the largest shareholder 5,041,045 \ 139,133
62
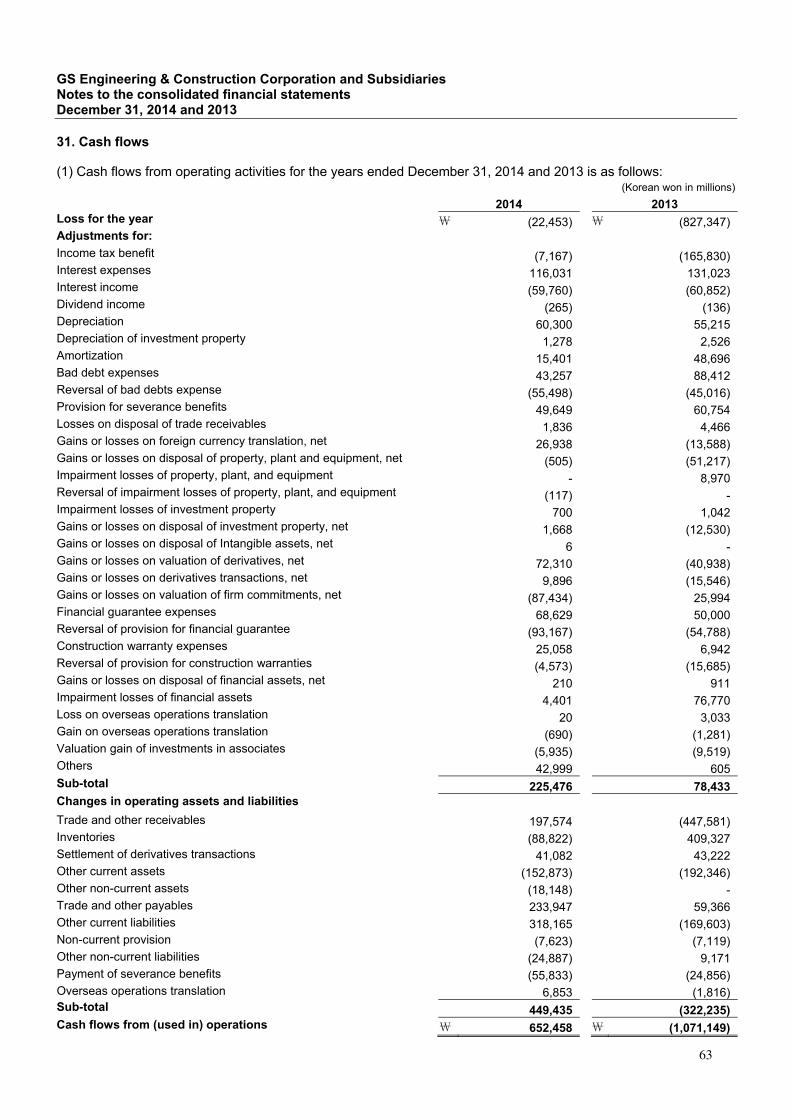
GS Engineering & Construction Corporation and Subsidiaries Notes to the consolidated financial statements December 31, 2014 and 2013
31. Cash flows (1) Cash flows from operating activities for the years ended December 31, 2014 and 2013 is as follows:
(Korean won in millions)
2014 2013 Loss for the year \ (22,453) \ (827,347)Adjustments for: Income tax benefit (7,167) (165,830)Interest expenses 116,031 131,023 Interest income (59,760) (60,852)Dividend income (265) (136)Depreciation 60,300 55,215 Depreciation of investment property 1,278 2,526 Amortization 15,401 48,696 Bad debt expenses 43,257 88,412 Reversal of bad debts expense (55,498) (45,016)Provision for severance benefits 49,649 60,754 Losses on disposal of trade receivables 1,836 4,466 Gains or losses on foreign currency translation, net 26,938 (13,588)Gains or losses on disposal of property, plant and equipment, net (505) (51,217)Impairment losses of property, plant, and equipment - 8,970 Reversal of impairment losses of property, plant, and equipment (117) -Impairment losses of investment property 700 1,042 Gains or losses on disposal of investment property, net 1,668 (12,530)Gains or losses on disposal of Intangible assets, net 6 -Gains or losses on valuation of derivatives, net 72,310 (40,938)Gains or losses on derivatives transactions, net 9,896 (15,546)Gains or losses on valuation of firm commitments, net (87,434) 25,994 Financial guarantee expenses 68,629 50,000 Reversal of provision for financial guarantee (93,167) (54,788)Construction warranty expenses 25,058 6,942 Reversal of provision for construction warranties (4,573) (15,685)Gains or losses on disposal of financial assets, net 210 911 Impairment losses of financial assets 4,401 76,770 Loss on overseas operations translation 20 3,033 Gain on overseas operations translation (690) (1,281)Valuation gain of investments in associates (5,935) (9,519)Others 42,999 605 Sub-total 225,476 78,433 Changes in operating assets and liabilities
Trade and other receivables 197,574 (447,581)Inventories (88,822) 409,327 Settlement of derivatives transactions 41,082 43,222 Other current assets (152,873) (192,346)Other non-current assets (18,148) -Trade and other payables 233,947 59,366 Other current liabilities 318,165 (169,603)Non-current provision (7,623) (7,119)Other non-current liabilities (24,887) 9,171 Payment of severance benefits (55,833) (24,856)Overseas operations translation 6,853 (1,816)Sub-total 449,435 (322,235)Cash flows from (used in) operations \ 652,458 \ (1,071,149)
63
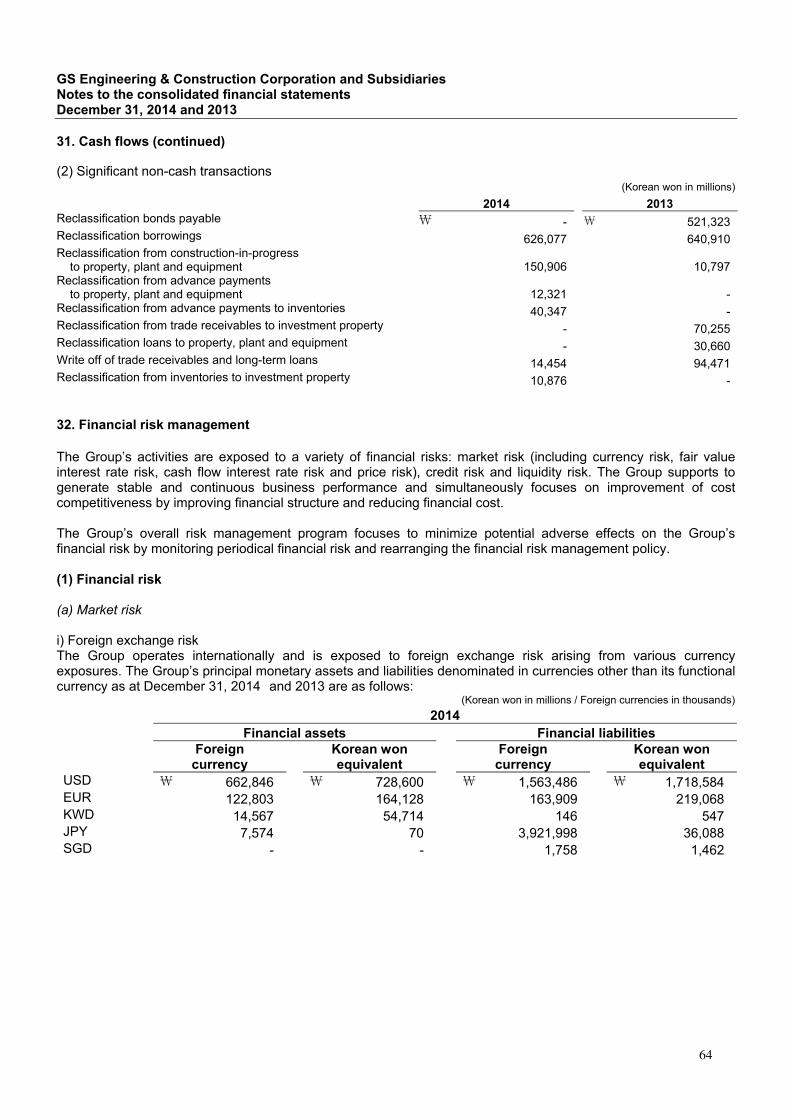
GS Engineering & Construction Corporation and Subsidiaries Notes to the consolidated financial statements December 31, 2014 and 2013
31. Cash flows (continued) (2) Significant non-cash transactions
(Korean won in millions)
2014 2013 Reclassification bonds payable \ - \ 521,323 Reclassification borrowings 626,077 640,910 Reclassification from construction-in-progress
to property, plant and equipment 150,906 10,797 Reclassification from advance payments
to property, plant and equipment 12,321 -Reclassification from advance payments to inventories 40,347 -Reclassification from trade receivables to investment property - 70,255 Reclassification loans to property, plant and equipment - 30,660 Write off of trade receivables and long-term loans 14,454 94,471 Reclassification from inventories to investment property 10,876 - 32. Financial risk management The Group’s activities are exposed to a variety of financial risks: market risk (including currency risk, fair value interest rate risk, cash flow interest rate risk and price risk), credit risk and liquidity risk. The Group supports to generate stable and continuous business performance and simultaneously focuses on improvement of cost competitiveness by improving financial structure and reducing financial cost. The Group’s overall risk management program focuses to minimize potential adverse effects on the Group’s financial risk by monitoring periodical financial risk and rearranging the financial risk management policy. (1) Financial risk (a) Market risk i) Foreign exchange risk The Group operates internationally and is exposed to foreign exchange risk arising from various currency exposures. The Group’s principal monetary assets and liabilities denominated in currencies other than its functional currency as at December 31, 2014 and 2013 are as follows:
(Korean won in millions / Foreign currencies in thousands)
2014 Financial assets Financial liabilities
Foreign
currency Korean won equivalent
Foreign currency
Korean won equivalent
USD \ 662,846 \ 728,600 \ 1,563,486 \ 1,718,584 EUR 122,803 164,128 163,909 219,068 KWD 14,567 54,714 146 547 JPY 7,574 70 3,921,998 36,088 SGD - - 1,758 1,462
64

GS Engineering & Construction Corporation and Subsidiaries Notes to the consolidated financial statements December 31, 2014 and 2013
32. Financial risk management (continued)
(Korean won in millions / Foreign currencies in thousands)
2013 Financial assets Financial liabilities
Foreign
currency Korean won equivalent
Foreign currency
Korean won equivalent
USD \ 1,259,811 \ 1,329,479 \ 2,258,803 \ 2,383,694 EUR 131,132 142,258 146,084 200,697 KWD 11,526 43,129 20,373 76,238 JPY 815,200 8,190 2,995,782 30,097 SGD 1,030 858 8,769 7,302
As at December 31, 2014 and 2013, if the Group’s functional currency had weakened/strengthened by 5% against foreign currencies with all other variables held constant, profit before income tax would have been affected as follows:
(Korean won in millions)
2014 2013 5% increase 5% decrease 5% increase 5% decrease USD \ (49,499) \ 49,499 \ (52,712) \ 52,712 EUR (2,747) 2,747 (1,089) 1,089 KWD 2,708 (2,708) (1,655) 1,655 JPY (1,801) 1,801 (1,095) 1,095 SGD (73) 73 (322) 322
ii) Interest rate risk The Group’s interest rate risk arises from variable-rate borrowings, and related interest expense is exposed to interest risk. As at December 31, 2014, the financial liabilities that are exposed to interest risk are the variable-rate borrowings issued at variable rates amounting to \1,580,622 million (2013: \2,163,066 million). As at December 31, 2014, and 2013, if interest rates had been fluctuated by 100bp with all other variables held constant, interest expenses would have been affected as follows:
(Korean won in millions) 2014 2013
100bp increase 100bp decrease 100bp increase 100bp decrease Interest expense \ 12,884 \ (12,884) \ 15,154 \ (15,154)
(b) Credit Risk The credit risk occurs in the ordinary course of business and investment activities of the Group when the customers or counterparties could not comply with the obligations of the contract. To manage the credit risk, the Group evaluates the credit of customers periodically, considering past experience and other factors and sets individual credit limit considering the credit quality of customer. Credit risk arises from cash equivalents, derivative financial instruments and deposits with banks and financial institutions, as well as credit risk to primary customers, including outstanding receivables and firm committed transactions. The Group’s credit risk is managed in accordance with the Group’s credit policy with the purpose of minimizing possible loss through efficient credit risk management, support of rapid decision making and preparation of safety measures on the Group’s accounts receivable.
65

GS Engineering & Construction Corporation and Subsidiaries Notes to the consolidated financial statements December 31, 2014 and 2013
32. Financial risk management (continued) Details of maximum exposure to credit risk as at December 31, 2014 and 2013 are as follows:
(Korean won in millions)
2014 2013 Cash equivalents (excluding cash on hands) \ 2,142,808 \ 1,854,816 Trade and other receivables 4,573,822 4,785,254 Short-term financial assets 332,671 323,187 Long-term financial assets (*1) 175,760 181,742 Long-term trade and other receivables 842,194 615,442 Non-current provision (*2) 2,849,829 2,718,190 (*1) Excludes equity securities. (*2) The maximum exposure to credit risk is the principal amount of contractual cash flow from the PF, redevelopment projects, SOC, overseas operations and others that are subject to provision of non-current liabilities. (c) Liquidity risk The Group’s liquidity risk arises when it does not have sufficient cash to fulfill payment obligations from financial liabilities or to meet operational needs. The Group manages possible liquidity risk in advance through monitoring forecasts of the Group’s liquidity requirements to ensure it has sufficient cash to meet operational needs. Major commitments related to the credit limit of domestic financial institutions as at December 31, 2014 and 2013, are as follows:
(Korean won in millions) 2014 2013
Financial
institutions Limited
amount Used
amount Limited
amount Used
Amount Short-term and long-term financial liability (*)
Korea Eximbank
and others \ 6,302,201 \ 4,145,887 \ 6,933,090 \ 4,471,970 (*) Excludes firm commitment liability. The table below summarizes the maturity profile of the Group’s financial assets based on contractual undiscounted payments.
(Korean won in millions)
2014
Residual maturity
Book value Cash flow
on contract Less than 1
year
Between 1 year and
2 years
Between 2 years and
3 years Over
3 years Trade and other payables
\ 1,633,207 \ 1,634,002 \ 1,634,002 \ - \ - \ -
Long-term trade and other payables
136,080 147,765 - 49,255 98,510 -
Short-term and long-term financial liability (*1)
4,145,887 4,248,460 1,428,662 881,705 453,001 1,485,092
Non-current provision (*2) 146,526 2,849,829 2,115,807 230,703 327,500 175,819
Total \ 6,061,700 \ 8,880,056 \ 5,178,471 \ 1,161,663 \ 879,011 \ 1,660,911
(*1) Excludes firm commitment liability and includes interest income. (*2) The cash flow on contract is the principal amount from the PF, redevelopment projects, SOC, overseas operations and others that are subject to provision of non-current liabilities.
66
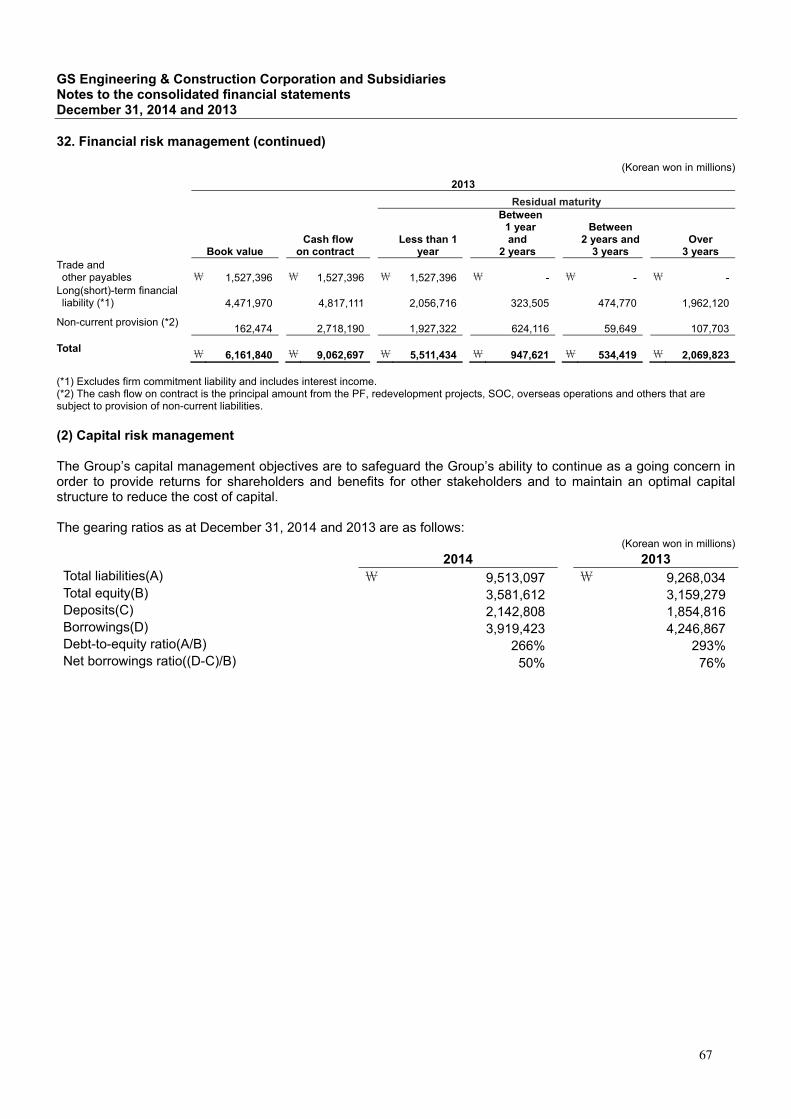
GS Engineering & Construction Corporation and Subsidiaries Notes to the consolidated financial statements December 31, 2014 and 2013
32. Financial risk management (continued)
(Korean won in millions)
2013
Residual maturity
Book value Cash flow
on contract Less than 1
year
Between 1 year and
2 years
Between 2 years and
3 years Over
3 years Trade and other payables
\ 1,527,396 \ 1,527,396 \ 1,527,396 \ - \ - \ -
Long(short)-term financial liability (*1)
4,471,970 4,817,111 2,056,716 323,505 474,770 1,962,120
Non-current provision (*2) 162,474 2,718,190 1,927,322 624,116 59,649 107,703
Total \ 6,161,840 \ 9,062,697 \ 5,511,434 \ 947,621 \ 534,419 \ 2,069,823
(*1) Excludes firm commitment liability and includes interest income. (*2) The cash flow on contract is the principal amount from the PF, redevelopment projects, SOC, overseas operations and others that are subject to provision of non-current liabilities. (2) Capital risk management The Group’s capital management objectives are to safeguard the Group’s ability to continue as a going concern in order to provide returns for shareholders and benefits for other stakeholders and to maintain an optimal capital structure to reduce the cost of capital. The gearing ratios as at December 31, 2014 and 2013 are as follows:
(Korean won in millions)
2014 2013 Total liabilities(A) \ 9,513,097 \ 9,268,034 Total equity(B) 3,581,612 3,159,279 Deposits(C) 2,142,808 1,854,816 Borrowings(D) 3,919,423 4,246,867 Debt-to-equity ratio(A/B) 266% 293% Net borrowings ratio((D-C)/B) 50% 76%
67
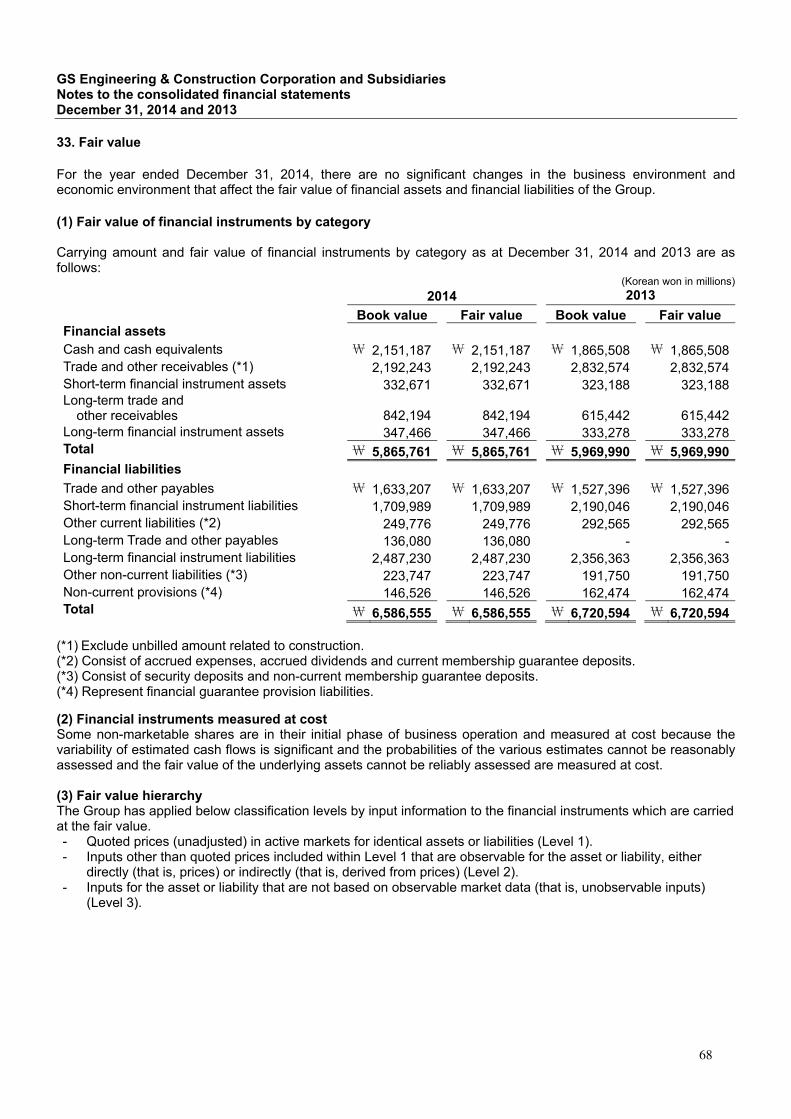
GS Engineering & Construction Corporation and Subsidiaries Notes to the consolidated financial statements December 31, 2014 and 2013
33. Fair value For the year ended December 31, 2014, there are no significant changes in the business environment and economic environment that affect the fair value of financial assets and financial liabilities of the Group. (1) Fair value of financial instruments by category Carrying amount and fair value of financial instruments by category as at December 31, 2014 and 2013 are as follows:
(Korean won in millions)
2014 2013
Book value Fair value Book value Fair value Financial assets Cash and cash equivalents \ 2,151,187 \ 2,151,187 \ 1,865,508 \ 1,865,508 Trade and other receivables (*1) 2,192,243 2,192,243 2,832,574 2,832,574 Short-term financial instrument assets 332,671 332,671 323,188 323,188 Long-term trade and
other receivables 842,194 842,194 615,442
615,442 Long-term financial instrument assets 347,466 347,466 333,278 333,278 Total \ 5,865,761 \ 5,865,761 \ 5,969,990 \ 5,969,990 Financial liabilities
Trade and other payables \ 1,633,207 \ 1,633,207 \ 1,527,396 \ 1,527,396 Short-term financial instrument liabilities 1,709,989 1,709,989 2,190,046 2,190,046 Other current liabilities (*2) 249,776 249,776 292,565 292,565 Long-term Trade and other payables 136,080 136,080 - -Long-term financial instrument liabilities 2,487,230 2,487,230 2,356,363 2,356,363 Other non-current liabilities (*3) 223,747 223,747 191,750 191,750 Non-current provisions (*4) 146,526 146,526 162,474 162,474 Total \ 6,586,555 \ 6,586,555 \ 6,720,594 \ 6,720,594
(*1) Exclude unbilled amount related to construction. (*2) Consist of accrued expenses, accrued dividends and current membership guarantee deposits. (*3) Consist of security deposits and non-current membership guarantee deposits. (*4) Represent financial guarantee provision liabilities.
(2) Financial instruments measured at cost Some non-marketable shares are in their initial phase of business operation and measured at cost because the variability of estimated cash flows is significant and the probabilities of the various estimates cannot be reasonably assessed and the fair value of the underlying assets cannot be reliably assessed are measured at cost. (3) Fair value hierarchy The Group has applied below classification levels by input information to the financial instruments which are carried at the fair value. - Quoted prices (unadjusted) in active markets for identical assets or liabilities (Level 1). - Inputs other than quoted prices included within Level 1 that are observable for the asset or liability, either
directly (that is, prices) or indirectly (that is, derived from prices) (Level 2). - Inputs for the asset or liability that are not based on observable market data (that is, unobservable inputs)
(Level 3).
68
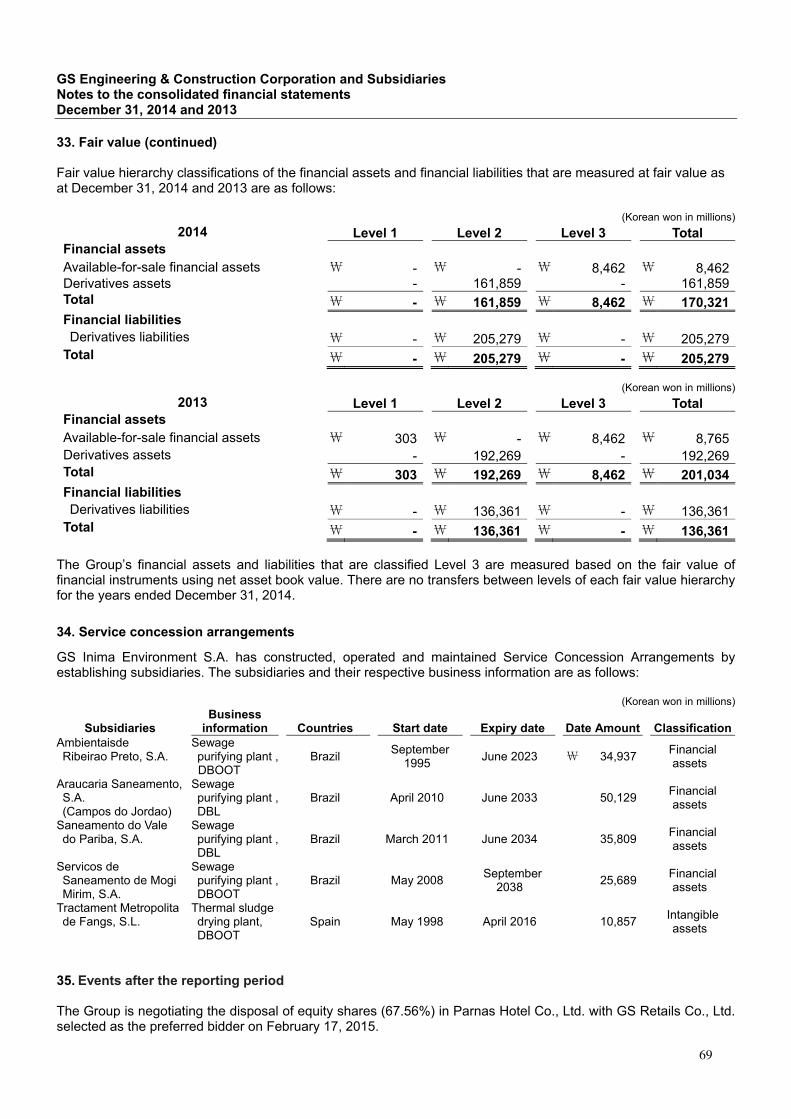
GS Engineering & Construction Corporation and Subsidiaries Notes to the consolidated financial statements December 31, 2014 and 2013
33. Fair value (continued) Fair value hierarchy classifications of the financial assets and financial liabilities that are measured at fair value as at December 31, 2014 and 2013 are as follows:
(Korean won in millions)
2014 Level 1 Level 2 Level 3 Total Financial assets
Available-for-sale financial assets \ - \ - \ 8,462 \ 8,462 Derivatives assets - 161,859 - 161,859 Total \ - \ 161,859 \ 8,462 \ 170,321 Financial liabilities Derivatives liabilities \ - \ 205,279 \ - \ 205,279 Total \ - \ 205,279 \ - \ 205,279
(Korean won in millions)
2013 Level 1 Level 2 Level 3 Total Financial assets
Available-for-sale financial assets \ 303 \ - \ 8,462 \ 8,765 Derivatives assets - 192,269 - 192,269 Total \ 303 \ 192,269 \ 8,462 \ 201,034 Financial liabilities Derivatives liabilities \ - \ 136,361 \ - \ 136,361 Total \ - \ 136,361 \ - \ 136,361
The Group’s financial assets and liabilities that are classified Level 3 are measured based on the fair value of financial instruments using net asset book value. There are no transfers between levels of each fair value hierarchy for the years ended December 31, 2014. 34. Service concession arrangements GS Inima Environment S.A. has constructed, operated and maintained Service Concession Arrangements by establishing subsidiaries. The subsidiaries and their respective business information are as follows:
(Korean won in millions)
Subsidiaries Business
information Countries Start date Expiry date Date Amount ClassificationAmbientaisde Ribeirao Preto, S.A.
Sewage purifying plant , DBOOT
Brazil September
1995 June 2023 \ 34,937
Financial assets
Araucaria Saneamento, S.A. (Campos do Jordao)
Sewage purifying plant ,
DBL Brazil April 2010 June 2033 50,129
Financial assets
Saneamento do Vale do Pariba, S.A.
Sewage purifying plant ,
DBL Brazil March 2011 June 2034 35,809
Financial assets
Servicos de Saneamento de Mogi Mirim, S.A.
Sewage purifying plant , DBOOT
Brazil May 2008 September
2038 25,689
Financial assets
Tractament Metropolita de Fangs, S.L.
Thermal sludge drying plant, DBOOT
Spain May 1998 April 2016 10,857 Intangible assets
35. Events after the reporting period The Group is negotiating the disposal of equity shares (67.56%) in Parnas Hotel Co., Ltd. with GS Retails Co., Ltd. selected as the preferred bidder on February 17, 2015.
69