Embed Size (px)
Citation preview

FINANCIAL STABILITYREPORT 28
Stability and Security. DECEMBER 2014

The OeNB’s semiannual Financial Stability Report provides regular analyses of Austrian and international developments with an impact on financial stability. In addition, it includes studies offering in-depth insights into specific topics related to financial stability.
Publisher and editor Oesterreichische NationalbankOtto-Wagner-Platz 3, 1090 ViennaPO Box 61, 1011 Vienna, [email protected] (+43-1) 40420-6666Fax (+43-1) 40420-046698
Editorial board Philip Reading, Vanessa Redak, Doris Ritzberger-Grünwald, Martin Schürz
Coordinator Andreas Greiner, Stefan Kavan
Editing Dagmar Dichtl, Jennifer Gredler, Ingrid Haussteiner, Henry Meyer, Rena Mühldorf, Susanne Steinacher
Layout and typesetting Walter Grosser, Birgit Jank
Design Communications and Publications Division
Printing and production Oesterreichische Nationalbank, 1090 Vienna
DVR 0031577
ISSN 2309-7264 (print)ISSN 2309-7272 (online)
© Oesterreichische Nationalbank, 2014. All rights reserved.
May be reproduced for noncommercial, educational and scientific purposes provided that the source is acknowledged.
Printed in accordance with the Austrian Ecolabel guideline for printed matter. REG.NO. AT- 000311
Please collect used paper for recycling. EU Ecolabel: AT/28/024

FINANCIAL STABILITY REPORT 28 – DECEMBER 2014 3
Call for Applications: Visiting Research Program 4
ReportsManagement Summary 8
International Macroeconomic Environment: Weaker Global Growth
and Geopolitical Tensions Rekindle Financial Sector Volatilities 11
Corporate and Household Sectors in Austria: Expansion of Debt Remains Muted 22
Austrian Financial Intermediaries: Challenging Environment Calls for Further Efforts 39
Special TopicsAustrian Banks in the Comprehensive Assessment 54Maximilian Fandl, Robert Ferstl
Austrian Subsidiaries’ Profitability in the Czech Republic and Slovakia –
CESEE Margins with an Austrian Risk Profile 59Stefan Kavan, Daniela Widhalm
Workshop Summary: Are House Prices Endangering Financial Stability?
If So, How Can We Counteract This? 69Martin Schneider, Karin Wagner
The Banking Recovery and Resolution Directive and the EU’s Crisis Management
Framework: Principles, Interplay with the Comprehensive Assessment
and the Consequences for Recapitalizing Credit Institutions in Crisis Situations 75Dieter Huber, Georg Merc
Annex of Tables 92
NotesList of Special Topics Published in the Financial Stability Report Series 108
Periodical Publications 110
Addresses 112
Editorial close: November 17, 2014
Opinions expressed by the authors of studies do not necessarily reflect the official
viewpoint of the OeNB or of the Eurosystem.
Contents

4 OESTERREICHISCHE NATIONALBANK
Call for Applications: Visiting Research Program
The Oesterreichische Nationalbank (OeNB) invites applications from external researchers for participation in a Visiting Research Program established by the OeNB’s Economic Analysis and Research Department. The purpose of this program is to enhance cooperation with members of academic and research institutions (preferably postdoc) who work in the fields of macroeconomics, international economics or financial economics and/or pursue a regional focus on Central, Eastern and Southeastern Europe.
The OeNB offers a stimulating and professional research environment in close proximity to the policymaking process. Visiting researchers are expected to collaborate with the OeNB’s research staff on a prespecified topic and to participate actively in the department’s internal seminars and other research activities. They will be provided with accommodation on demand and will, as a rule, have access
to the department’s computer resources. Their research output may be published in one of the department’s publication outlets or as an OeNB Working Paper. Research visits should ideally last between three and six months, but timing is flexible.
Applications (in English) should include
– a curriculum vitae, – a research proposal that motivates
and clearly describes the envisaged research project,
– an indication of the period envisaged for the research visit, and
– information on previous scientific work.
Applications for 2015 should be emailed to [email protected] May 1, 2015.
Applicants will be notified of the jury’s decision by midJune. The following round of applications will close on November 1, 2015.

Financial stability means that the financial system – financial intermediaries, financial markets and financial infrastructures – is capable of ensuring the efficient allocation of financial resources and fulfilling its key macroeconomic functions even if financial imbalances and shocks occur. Under conditions of financial stability, economic agents have confidence in the banking system and have ready access to financial services, such as payments, lending, deposits and hedging.


Reports
The reports were prepared jointly by the Foreign Research Division, the Economic Analysis Division and the Financial Stability and Macroprudential Supervision Division, with contributions by Nicolás Albacete, Andreas Breitenfellner, Gernot Ebner, Judith Eidenberger, Eleonora Endlich, Andreas Greiner, Stefan Kavan, David Liebeg, Stefan Schmitz, Josef Schreiner, Alexander Trachta, Eva Ubl, Walter Waschiczek, Daniela Widhalm and Tina Wittenberger.

8 OESTERREICHISCHE NATIONALBANK
Financial Markets Reflect Impact of Central Bank Measures and Geopolitical TensionsThe world economy remains fragile as the pace of economic activity continues to diverge across regions. The recovery in Europe is still delicate, and growth has recently ground to a halt again. Given recent years’ fiscal consolidation efforts, the public sector remains a drag on growth. Furthermore, private and government debt levels in many European countries are still high, and it will take time for structural reforms to be implemented and show the expected results. Regulatory initiatives and central bank measures have helped to calm financial markets and to support the economy by easing lending conditions through low policy interest rates and the provision of liquidity.
The economic recovery in Central, Eastern and Southeastern Europe (CESEE) lost some steam in the first half of 2014, and especially in recent months, as weaker growth in the euro area and heightened geopolitical tensions started to weigh on sentiment and external demand. Nevertheless, financial markets remained broadly stable in most countries. CDS premiums and exchange rates traded mostly flat and credit growth improved somewhat in many countries. Also, lending surveys point to stable or improved credit supply and demand. Credit quality continues to be rather weak, however, and bank profits remain subdued, but local banking sectors continue to be well capitalized. Austrian banks’ exposure to CESEE is heterogeneous, with some markets still generating stable profits.
Russia and Ukraine are two major exceptions in this regional pattern; the armed conflict in eastern Ukraine and the accompanying geopolitical tensions weigh on economic and financial sector
activity. Both countries experienced a marked deterioration in their macrofinancial risk profile, with reduced economic momentum, rising CDS premiums, rating downgrades, weakening credit expansion, currency depreciations and capital outflows. Western sanctions imposed on Russia increased uncertainty, which in turn negatively affected investment and sentiment. The direct impact of the sanctions on the Russian banking sector, however, is expected to be rather small in the short term, as its external position is fairly robust. Likewise, the impact of the sanctions and Russian countersanctions on other CESEE countries has also been limited.
Economic activity in Austria, which had slightly accelerated in the second half of 2013 owing to increased export demand, flattened again in the first half of 2014, as the sluggish euro area economy and uncertainties in export markets weighed on economic performance.
Subdued Growth of Credit to the Austrian Real Economy
As Austrian corporate profitability was on a downward trend in the first half of 2014, the internal financing capacity of the sector weakened noticeably, and given weak growth prospects, recourse to external financing also remained moderate. Bank loans were the primary source of debt finance; corporate loan growth accelerated somewhat in the course of 2014 but remained weak. Equity instruments accounted for almost ninetenths of external funds in the first half of 2014.
Bank lending to households also remained subdued until the third quarter of 2014. A breakdown by currencies shows that eurodenominated loans continued to expand, while foreign
Management Summary

Management Summary
FINANCIAL STABILITY REPORT 28 – DECEMBER 2014 9
currency loans continued to recede by about 10% year on year. The growth of housing loans has gained some momentum for more than a year, but at 3.3% it remained moderate. In the first half of 2014, the prices on the Austrian residential property market continued to rise, but price dynamics were heterogeneous across regions: While the increase slowed down in Vienna, the upward movement in the rest of Austria accelerated.
Financing conditions for enterprises and households remained favorable. Low interest rate levels supported Austrian firms’ and households’ ability to service their debt, but an above average share of variable rate loans (in comparison to the euro area) might pose risks if interest rates were to rise again.
Financial investment by households rebounded slightly in the first half of 2014, with almost onethird going into cash and deposits with banks. While investments in life insurance plans and pension funds had a stabilizing effect on financial investment in the first half of 2014, net investment in capital market assets, which had already been muted in 2013, more than halved.
Austrian Banking Sector Headed for Aggregate Loss in 2014 Due to One-Off Effects
Since the start of the financial crisis, Austrian banks have significantly increased their capital levels and accelerated balance sheet repair both at home and abroad. But progress has been uneven across banks, and many institutions need to do more to close the capital gap between them and their competitors. More than half of Austrian banks’ assets are held by banks with CET1 ratios between 10% and 12%. Austrian banks’ average (consolidated) leverage ratio was 5.4% in June 2014, with individual ratios varying mark
edly. More than half of the assets are held by banks with leverage ratios between 4% and 6%. While the results of the ECB’s comprehensive assessment of significant banks’ balance sheets show the improved resilience of Austrian banks under the simulated conditions of the adverse stress test scenario, the results also indicate that most Austrian banks need to further strengthen their capital positions.
After the Austrian banking system posted a loss in 2013, the negative trend in profitability continued in the first half of 2014 in a challenging environment of slow economic growth and continuously low interest rate margins. Even if exceptional oneoff effects are not taken into account, Austrian banks’ operating income was below the corresponding 2013 figure, and persistently weak credit quality was an additional burden on profitability. As of mid2014, the nonperforming loan ratio at the group level increased to 8.9% (+0.3 percentage points compared to yearend 2013). At the same time, Austrian banks raised their loan loss provision ratio. All factors considered, the Austrian banking sector is again expected to close the year with an aggregate loss.
Recommendations by the OeNB
To strengthen financial stability in Austria and in Austrian financial intermediaries’ host markets, the OeNB makes the following recommendations:• Banks should continue strengthening
their capital levels.• After the Asset Quality Review by
the ECB, banks should further pursue riskadequate provisioning and coverage policies to deal with credit quality issues, especially in CESEE.
• Given persistent pressure on profitability, banks should continue to
Management Summary
10 OESTERREICHISCHE NATIONALBANK
address structural issues and proactively improve their cost efficiency.
• Banks should continue fulfilling supervisory minimum standards relating to foreign currency loans and loans with repayment vehicles.
• Banks should strive for sustainable loantolocal stable funding ratios at the subsidiary level and for risk adequate pricing of intragroup liquidity transfers.
• Banks and insurance undertakings should ensure high standards of risk management so that risks are properly addressed and effectively controlled; they should also proactively prepare for contingency situations.
• Insurance undertakings should continue to prepare for Solvency II.

FINANCIAL STABILITY REPORT 28 – DECEMBER 2014 11
Advanced Economies: Uneven Economic RecoveryGlobal economic activity showed signs of softening in the review period from June to October 2014 and is expected to expand less than anticipated until 2015. Contradictory signs in advanced economies have been going hand in hand with a slowdown of growth in emerging economies in a less favorable external financial environment. In the euro area, macrofinancial risks have been nourished by low nominal growth reflecting both economic slack and very low inflation. Muted price pressures, in turn, have resulted from subdued demand and falling commodity prices, which have more than offset a depreciation of the euro’s nominal effective exchange rate.
In the U.S.A., economic growth accelerated during the second and third quarters of 2014 but is expected to smooth out in the coming quarters. Labor market indicators have shown further improvement in employment and unemployment despite declining participation rates. The biggest drivers of growth have been private investment and consumption; also, fiscal policy has been less tight, and monetary policy has remained accommodative. While the Federal Reserve decided in October to end its largescale bond purchasing program, it pledged to keep its benchmark federal funds rate near zero “for a considerable time.” Inflation has been gradually decreasing below the longrun target of 2%, and inflation expectations over ten years have also declined below this rate.
In Japan, GDP growth has been very volatile: After a strong start in early 2014, it contracted severely in the
second quarter – after a hike of the consumption tax in April – and appeared to rebound somewhat thereafter. The negative effects of declining real disposable incomes have been partly offset by the main growth drivers – private investment and exports – supported by a great fiscal stimulus, a cut in the corporate income tax rate and a substantial depreciation of the yen (by 25% in tradeweighted terms since late 2012). However, the downtrend of the unemployment rate seems to have stopped recently, and the inflation rate has started to fall from its recent peak in the second quarter. In line with its proactive stance against deflation and in the face of a second consumption tax hike (which, in the meantime, has been postponed until early 2016), the Bank of Japan further expanded its quantitative and qualitative monetary easing at the end of October, primarily through purchases of government bonds. In the long run, sustainable growth will also depend on structural reforms, the “third arrow” of the Japanese prime minister’s “Abenomics.”
The Swiss National Bank (SNB) has remained committed to its exchange rate ceiling of CHF 1.20 per euro and reiterated its readiness to buy “unlimited quantities” of foreign currencies to protect the barrier.
The weak recovery of the euro area economy has further softened as GDP grew by 0.1% in the second quarter and by 0.2% in the third quarter. Generally, growth in the larger euro area economies, such as Germany, France and Italy, has been disappointing, whereas stressed economies, such as Spain, have shown signs of a pickup, as rebalancing efforts have improved their
Economic growth faster in the U.S.A. but slower in Japan and emerging markets
Euro area recovery stalls, with inflation running very low
International Macroeconomic Environment: Weaker Global Growth and Geopolitical Tensions Rekindle Financial Sector Volatilities

International Macroeconomic Environment: Weaker Global Growth and Geopolitical Tensions Rekindle Financial Sector Volatilities
12 OESTERREICHISCHE NATIONALBANK
competitiveness and current accounts. The inflation rate fell below 0.5% in the summer and has remained there since then. This can be partly explained by energy and food prices, but core inflation has also remained considerably below 1% given the amount of idle capacities. Even in Germany, which had seen relatively more growth until the recent dip owing to a decrease of export demand, headline inflation has continued to slide, falling below 1%. Across the euro area, an almost neutral fiscal stance is expected to lift growth after years of procyclicality. The gradual decline of unemployment rates, however, has stalled since the summer. Although employment has been increasing, unemployment is expected to remain at elevated levels throughout 2016.
Turning to monetary policy, the Governing Council of the ECB cut its main refinancing rate to 0.05%, its deposit facility rate to –0.20% and its marginal lending facility rate to 0.30% in two steps in June and September. In order to boost lending to SMEs, the Governing Council decided to implement targeted longerterm refinancing operations (TLTROs) in two steps (September and December). Moreover, the ECB announced to purchase nonfinancial private sector assets, i.e. asset backed securities and covered bonds, and suspended the sterilization of its expiring Securities Markets Programme (SMP). Under its forward guidance, the ECB continued to reassure markets that it would maintain its accommodative stance for as long as necessary (at least until end2016). All these measures are expected to enhance the functioning of the monetary policy transmission mechanism, facilitate lending to the broader economy as well as underpin the anchoring of medium to longterm inflation expectations. The Governing Council also communicated
its readiness to use additional unconventional instruments if needed to address risks of too prolonged a period of low inflation. Since the beginning of May, the euro exchange rate has gradually depreciated following news about ECB measures and a weaker growth outlook for the euro area, losing about 10% against the U.S. dollar and roughly 5% in nominal effective terms against a basket of 21 currencies.
After a period of constantly improving stability, volatility has returned to financial markets recently. Global stock markets dropped in the first half of October due to fears of recession and geopolitical uncertainty, notably the crisis in Ukraine. Despite its recent recovery, at the end of October the representative stock index DJ Euro Stoxx remained around 5% below its value of one month earlier. At the same time, sovereign risk spreads in stressed economies widened after a period of constant narrowing. On the one hand, yields of German tenyear sovereign bonds fell temporarily to record lows (0.72%) as investors’ mounting risk awareness implied safe haven effects. On the other hand, risk premiums of Greek government bonds rose by around 1 percentage point, reflecting uncertainty surrounding the country’s program exit, while the risk premiums on Irish, Italian and Portuguese sovereign bonds rose by still roughly ¼ percentage point. On a positive note, the market reaction to the publication of the ECB’s bank stress test results at the end of October was relatively benign. It is hoped that this further step toward the implementation of the banking union helps to improve market sentiment toward euro area banks – particularly toward those in stressed economies with large stocks of nonperforming loans.
The ECB imple-ments further
conventional and nonstandard
monetary policy measures

International Macroeconomic Environment: Weaker Global Growth and Geopolitical Tensions Rekindle Financial Sector Volatilities
FINANCIAL STABILITY REPORT 28 – DECEMBER 2014 13
CESEE: Overall Sound Macro-financial Developments Over-shadowed by Russia and Ukraine The economic recovery in Central, Eastern and Southeastern Europe (CESEE) lost some steam in the first half of 2014 and especially in recent months, as weaker growth in the euro area and heightened geopolitical tensions started to weigh on sentiment and external demand.1
Financial market developments, however, were stable in the review period, with the major exceptions of Russia and Ukraine (see below). Exchange rates against the euro as well as CDS premiums remained broadly stable throughout the past few months, reflecting a comparatively sound macrofinancial environment and favorable global liquidity conditions. Notable increases in CDS premiums, however, were observed in Turkey and Bulgaria.
The risk assessment of Turkey had improved since the beginning of the year against the background of decreasing domestic political risk. Starting in early September, however, CDS premiums again embarked on an upward path, which was probably related to the escalating conflict in neighboring Syria and Iraq. The Turkish lira stabilized following a decisive policy rate hike in late January 2014 (leading to an effective increase by 225 basis points to 10%), but has remained weak since then, in a setting of monetary easing (in three consecutive steps by a cumulative 125 basis points to 8.25%) that started in May.
In Bulgaria, bank runs on Corporate Commercial Bank (CCB) and First Investment Bank (FIB) in June 2014 pushed CDS premiums moderately upward. The two banks account for about 20% of the banking system’s total
assets. The Bulgarian National Bank revoked the banking license of CCB in early November. The reimbursement of guaranteed deposits has to start within 20 business days, but this deadline could be extended by another 10 business days under exceptional circumstances. As the existing assets of the deposit insurance fund cover only 60% of all guaranteed deposits at CCB, the shortfall of about 2% of GDP will have to be covered with funds from the domestic debt market and/or the fiscal reserve account. The spillovers of CCB’s problems to the rest of the Bulgarian banking sector have been contained (at least as suggested by figures for the second quarter of 2014). Neither has the country’s currency board arrangement come under pressure as the abundant coverage of base money by gross foreign reserves (of about 180%) has remained unchanged.
The situation was vastly different in Ukraine due to the armed conflict in the eastern part of the country. CDS premiums retreated somewhat – to around 800 basis points – from May to July amid international financial support, before climbing up to more than 1,500 basis points again from August to midNovember. The ceasefire between separatists in eastern Ukraine and Ukrainian forces of early September, which has remained fragile, did not bring about a reversal of this trend.
Following the sizeable depreciation of the hryvnia in early 2014, the situation on the foreign exchange market stayed tense, while deposit outflows from the banking system continued and high foreign currency demand met low supply. The hryvnia repeatedly came under considerable pressure, prompting the central bank to raise its key
Financial markets are broadly stable in most CESEE countries
Armed conflict weighs on risk assessment of Ukraine
1 For a more thorough examination of macroeconomic conditions and the outlook for CESEE countries, see the OeNB’s Focus on European Economic Integration Q4/14.

International Macroeconomic Environment: Weaker Global Growth and Geopolitical Tensions Rekindle Financial Sector Volatilities
14 OESTERREICHISCHE NATIONALBANK
policy rate (currently at 12.5%), introduce new administrative measures and tighten existing ones and to conduct regular foreign exchange auctions. In midNovember, the currency hit an alltime low at UAH 15.85 against the U.S. dollar amid rising tensions on the RussianUkrainian border. The depreciation since the beginning of the year (–47% against the U.S. dollar and –41% against the euro) negatively affected unhedged foreign currency debtors.
Despite the very difficult environment, Ukrainian authorities have so far implemented policies broadly as agreed under the IMF Standby Arrangement. The positive conclusion of the first review in August enabled the disbursement of a further USD 1.4 billion tranche. This notwithstanding, the IMF noted that a deterioration in the economic outlook, fiscal and quasifiscal pressures, and heightened balance of payment difficulties are putting the initial program targets in jeopardy. The policy effort should focus on compensatory measures to meet key program ob
jectives, while allowing some temporary deviations from initial targets.
Frictions between Ukraine and Russia had escalated due to Russia’s annexation of Crimea and support for separatist forces in eastern Ukraine, but have also been fueled by the ongoing gas conflict and pressure from Moscow on Kiev not to implement any parts of its Deep and Comprehensive Free Trade Agreement (DCFTA) with the EU, which was ratified in September. The provisional application of the DCFTA was postponed until end2015.
The political tensions triggered by the conflict in eastern Ukraine have also adversely affected Russian financial markets. CDS premiums increased strongly in July and have oscillated between 200 and 300 basis points during the past few months, displaying a high degree of volatility. Capital outflows have been swelling recently against the background of the persistently tough investment climate, actual and expected tapering by the U.S. Federal Reserve, the downgrading of Russia’s sovereign rating, the stepbystep
Financial market conditions deterio-
rate also in Russia
Basis points
300
250
200
150
100
50
0
1,600
1,400
1,200
1,000
800
600
400
200
0
Five-Year Credit Default Swap Premiums
Chart 1
Source: Thomson Reuters.
Czech Republic Poland Slovakia
Bulgaria Turkey Russia
Ukraine Slovenia Croatia
Romania Hungary
Latest observation: November 17, 2014 Basis points Latest observation: November 17, 2014
Jan. Mar. May July Sep. Nov.
2013
Jan. Mar. May July Sep. Nov.
2014
Jan. Mar. May July Sep. Nov.2013
Jan Mar. May July Sep. Nov.2014

International Macroeconomic Environment: Weaker Global Growth and Geopolitical Tensions Rekindle Financial Sector Volatilities
FINANCIAL STABILITY REPORT 28 – DECEMBER 2014 15
strengthening of Western sanctions and adverse expectations emanating from the latter: Over the first three quarters of 2014, private net capital outflows came to USD 85.2 billion, by far exceeding the outflows of 2013 as a whole. In the third quarter, net capital outflows declined compared to the first half of the year, as banks on a large scale repatriated capital invested abroad.
Capital flight and falling oil prices were primarily responsible for the depreciation of the ruble, which lost 31% against the U.S. dollar and 23.5% against the euro from the beginning of 2014 to midNovember. The ruble would have fallen even more if the Central Bank of Russia (CBR) had not taken countermeasures, including increases of the key interest rate by 400 basis points to 9.5% between March and July. Furthermore, the CBR formally abolished its exchange rate policy mechanism and moved to a floating exchange rate regime in early November. The new approach, however, does not imply the complete abandonment of foreign exchange interventions, which can be implemented in case financial stability is under threat. Mainly as a result of foreign exchange interventions, the CBR’s international reserves have declined by about USD 88 billion (or 17%) since the beginning of the year. In earlyNovember, however, international reserves still stood at a comfortable USD 421 billion (about 22% of GDP).
The current sanctions against Russia include selective travel bans and account freezes, bans on arms trade, restrictions on the transfer of high technology for oil extraction and on the export of dualuse goods (usable for military as well as civilian purposes) as well as tight limits on Russian stateowned banks’ and oil and defense com
panies’ access to EU and U.S. capital markets and bank loans.
The economic impact of financing restrictions on the Russian banking sector is expected to be limited in the short term, as its external position is fairly robust (showing a net external creditor position, see below). Yet, refinancing costs are likely to rise through direct and indirect effects. The direct impact on sanctioned nonfinancial companies is more difficult to assess due to the lack of sectoral data (e.g. for the oil sector), but also nonsanctioned companies might find it more difficult to access international markets. Available figures show, that “other sectors” (nonfinancial corporations and households) hold a net external debtor position. Gross external liabilities mainly consist of longterm debt (at original maturity) and equity portfolio investments. However, other sectors’ external debt repayments (excluding maturing FDI debt liabilities) until end2015 amount to USD 72 billion. Against this background, some nonfinancial companies might be vulnerable also in the short term. However, current macrofinancial conditions give Russia sufficient room for maneuver for the time being, and the government as well as the central bank stand ready to provide support if necessary.
In the medium to long term, the sanctions may have more tangible and sustained negative effects on the Russian economy. Indirect effects resulting from heightened uncertainty have already triggered larger capital outflows and impacted negatively on investment. Direct investor restraint and the suspension of technology transfers in certain fields are further clouding the outlook for a modernization of the Russian economy in the medium to long term.
Impact of sanctions on the Russian economy expected to be more tangible in the medium to long term

International Macroeconomic Environment: Weaker Global Growth and Geopolitical Tensions Rekindle Financial Sector Volatilities
16 OESTERREICHISCHE NATIONALBANK
The direct spillovers of the geopolitical tensions emanating from the UkraineRussia crisis and the accompanying sanctions to other CESEE countries have so far been contained. Nevertheless, a further escalation of the conflict, including titfortat sanctions, poses a nonnegligible risk. Exports to Russia amount to more than 2% of GDP in Poland and Hungary and to more than 3% in the Czech Republic, Slovenia and Slovakia. Given these large export shares, a prolonged economic stagnation or even recession in Russia could become a notable factor for GDP growth in CESEE, especially if this factor were amplified further by adverse repercussions resulting from deteriorating sentiment and demand in the euro area. As far as the euro area is concerned, trade with Russia accounts for only 0.9% of GDP; however, this share is higher for a number of euro
area countries that are important trading partners of CESEE (e.g. Germany, whose trade with Russia amounts to 1.3% of GDP). The impact of the sanctions on Austria is discussed in detail in box 3.
The Russian trade embargo on selected food items from the EU imposed in August has a fairly limited impact on CESEE EU Member States. The sanctioned products account for a fairly high share in total exports to Russia only in Poland and, to a lesser extent, in Hungary and Bulgaria. But even in these countries, only 0.1% to 0.6% of total exports are affected. The embargo might even help Turkey’s agricultural exports to Russia, as Russian importers seek to substitute supplies from EU markets. Turkey trades substantial volumes of goods that are covered by Russia’s sanctions against the EU (especially fruit and vegetables), and these food exports could be stepped up quickly.
Spillovers of sanctions to other
CESEE countries remain contained
so far
January 1, 2013 = 100; rise = appreciation
110
105
100
95
90
85
80
75
70
65
60
55
50
Exchange Rates of Selected Currencies against the Euro
Chart 2
Source: Thomson Reuters.
EUR/CZK EUR/PLN EUR/RUB EUR/TRL
EUR/HUF EUR/ROL EUR/HRK EUR/UAH
Jan. Mar. May July Sep. Nov. Jan. Mar. May July2013 2014
Sep. Nov.
Latest observation: November 17, 2014

International Macroeconomic Environment: Weaker Global Growth and Geopolitical Tensions Rekindle Financial Sector Volatilities
FINANCIAL STABILITY REPORT 28 – DECEMBER 2014 17
While fewer exports to Russia could dampen economic activity only to a limited extent, a disruption of supplies from Russia, especially of energy, would have a severe impact on CESEE countries. Most CESEE EU Member States are heavily dependent on Russian gas supplies. As a case in point, Bulgaria, Slovakia and Hungary obtain more than 80% of their gas from Russia. The two notable exceptions from this pattern are Romania, where the share of Russian gas in total gas consumption is rather moderate, and Croatia, which does not buy gas from Russia at all.
In comparison to their linkages in the real economy, the CESEE countries’ direct financial linkages with Russia are less important. Nevertheless, a further escalation of the conflict could induce spillovers to CESEE financial markets. This risk would again be most pronounced if sanctions were to affect energy supplies.
Turning to banking sector developments, credit growth in CESEE was ei
ther unchanged or somewhat improving in most countries during the review period. The latter is especially true for Poland, Slovakia, the Czech Republic and Bulgaria. In Hungary, central bank measures to support credit expansion had some positive effect; the utilization of the funding for growth scheme (FGS) increased during the review period. Against this background, the Hungarian central bank (MNB) decided to double the maximum refinancing volume of the current tranche (available until end2014) to around 3.3% of GDP. Credit growth beyond the FGS has remained weak, however. Banks’ profitability and capital positions received a blow in July 2014, when the Hungarian parliament passed legislation which obliges banks to retroactively apply the MNB’s official exchange rate for the disbursement and servicing of consumer loans denominated in foreign currency (and hence pay back exchange rate margins) and to compensate consumers for unilateral
Credit growth picks up moderately in Central Europe
%, year on year, adjusted for exchange rate changes%, year on year, adjusted for exchange rate changes
10
8
6
4
2
0
–2
–4
–6
–8
–10
40
30
20
10
0
–10
–20
–30
Growth of Credit to the Private Sector
Chart 3
Source: National central banks.
Bulgaria Czech RepublicPoland Slovakia
Hungary Romania CroatiaSlovenia Turkey
RussiaUkraine
Jan. Apr. July Oct. Jan. Apr.2013 2014
July Jan. Apr. July Oct. Jan. Apr.2013 2014
July

International Macroeconomic Environment: Weaker Global Growth and Geopolitical Tensions Rekindle Financial Sector Volatilities
18 OESTERREICHISCHE NATIONALBANK
increases in interest rates, charges and fees relating to local and foreign currency loans. The two measures are expected to cost financial institutions around 3% of GDP or nearly 30% of their capital. Moreover, the government announced legislation to convert households’ foreign currency loans into domestic currency loans at market exchange rates. The MNB already started to provide foreign currency liquidity to banks for the conversion.
According to lending surveys covering CESEE, stable or improved credit supply and demand conditions can be expected for the region:2 For example, the bank lending conditions index in emerging Europe as collected by the Institute of International Finance showed some easing for the first time since the second quarter of 2013, with the overall index increasing noticeably by 6 points in the second quarter of 2014. The index for funding conditions even surged by 17 points as both domestic and international funding conditions eased considerably for the first time in a year. Loan demand also increased amidst a recovery in domestic demand. The demand for business loans continued to trend higher, and the demand for consumer loans recovered after dipping temporarily in the previous quarter. On the other hand, nonperforming loans (NPLs) continued to trend up, though banks expect NPLs to start declining in the coming quarters.
The CESEE Bank Lending Survey by the European Investment Bank is only marginally less optimistic. Banks reported a stabilization of credit demand and supply conditions, albeit at comparatively low levels. Both supply and demand are expected to improve in the next six months, however. Credit
supply has eased for households (especially consumer credit), but continued to be tight for corporates. Banks expect an easing of supply conditions. NPLs and regulation, at both the national and international level, remain the most evident factors constraining supply. Demand for loans has improved marginally, although at a slow pace. Funding conditions are considered to be fairly favorable, with access to funding rated positive across all sources other than intragroup funding. Easy access to retail and corporate deposits supports a positive outlook. NPL figures have deteriorated further and remain a key concern for the region’s banks. However, the speed of deterioration has been decreasing.
Unlike in the larger Central European countries, credit growth remained negative in Slovenia, Romania and Croatia, and it continued to decelerate in Turkey, Russia and Ukraine. In the latter, credit growth even came to a standstill in August.
In Slovenia, the banking sector is still in a process of restructuring, including the transfer of nonperforming loans to a bank asset management company and the recapitalization of banks. The European Commission approved Abanka’s restructuring plan in mid August, thus giving green light to the second tranche of recapitalization and the transfer of bad assets to the Bank Asset Management Company. Furthermore, Slovenia has committed itself to merging Abanka with Banka Celje (a small bank which requested state aid at endApril 2014) and to submit a restructuring plan for the joint entity by end2014. The ECB’s comprehensive assessment revealed a combined capital shortage of the country’s two biggest
Lending surveys point to stabilizing supply and demand
conditions
Credit expansion, however, remains
weak in several countries
2 It needs to be noted, however, that those surveys were conducted in May and June 2014, before the recent deterio-ration in the international environment.

International Macroeconomic Environment: Weaker Global Growth and Geopolitical Tensions Rekindle Financial Sector Volatilities
FINANCIAL STABILITY REPORT 28 – DECEMBER 2014 19
banks (Nova Ljubljanska Banka and Nova Kreditna Banka Maribor) of EUR 65.3 million in the adverse stress test scenario and a substantial reclassification of bad loans.
Turning to credit growth in the remaining CESEE countries, the ongoing recession and economic uncertainty have weighed on loan developments in Croatia, even though the central bank has already taken measures to stimulate private sector lending (e.g. lower reserve requirements provided that the released liquidity is used to grant loans to nonfinancial enterprises). The Turkish central bank vigorously tightened monetary policy in January 2014 and set several macroprudential measures to put a brake on the swift credit expansion seen recently. Shortterm growth figures, however, suggest that credit growth started to pick up again after the central bank began to lower policy rates in May. In Russia and Ukraine, credit growth was negatively affected by geopolitical tensions weighing on sentiment and the outlook and limiting international refinancing pos
sibilities. Furthermore, policy rates have increased markedly since March 2014.
The share of foreign currency loans in total loans to households declined in most CESEE countries, most strongly in Romania (by 5 percentage points to 61.5% between end2013 and September 2014), but remained high not only in Romania but also in Hungary and Croatia (at 52.9% and 72.5%, respectively, in September 2014). While in Russia foreign currency loans do not play an important role in the household credit stock, in Ukraine, their share came to 43.9% in the third quarter of 2014, having substantially risen from 35% at the end of 2013 against the background of a substantial depreciation of the hryvnia.
NPL ratios remained clearly elevated and credit quality even deteriorated somewhat further in many countries of the region in the first half of 2014. This trend was most pronounced in Ukraine, but also Bulgaria reported a notable increase in NPLs. Furthermore, NPLs rose again somewhat in Slovenia after a first tranche of bad as
Foreign currency loans continue their downward trend
Credit quality still weak
Nonperforming loans (NPLs) and loan loss provisions (LLPs) in % of total credit at end of period
35
30
25
20
15
10
5
0NPLs
Slovenia
Banking Sector: Credit Quality
Chart 4
Source: IMF, national central banks, OeNB.
Note: Data are not comparable between countries. NPLs include substandard, doubtful and loss loans, except for Romania and Ukraine (doubtful and loss loans) and Slovenia(loans in arrears for more than 90 days).
End-2013 Mid-2014
LLPs NPLsSlovakia
LLPs NPLsCzech Republic
LLPs NPLsPoland
LLPs NPLsHungary
LLPs NPLsBulgaria
LLPs NPLsRomania
LLPs NPLsCroatia
LLPs NPLsUkraine
LLPs NPLsRussia
LLPs NPLsTurkey
LLPs

International Macroeconomic Environment: Weaker Global Growth and Geopolitical Tensions Rekindle Financial Sector Volatilities
20 OESTERREICHISCHE NATIONALBANK
sets had been transferred to a bad bank in December 2013.
The gap between total outstanding domestic claims and total domestic deposits (relative to GDP) remained broadly unchanged in many countries during the review period. A fairly strong narrowing of the funding gap was observed only in Slovenia (–5 percentage points of GDP) while it widened noticeably in Poland, Russia, Turkey and especially Ukraine, where it was by far the largest in the region (24% of GDP). In all of the latter countries, deposits were somewhat lower in the second quarter of 2014 than they had been at the end of 2013. At the same time, claims continued to grow moderately. Only in Ukraine did the growth of claims turn negative in the second quarter.
The developments outlined above are broadly reflected in banks’ net external positions, which have not changed substantially in most cases.
Slovenia has reduced its reliance on external funding noticeably against the background of a declining funding gap, while Ukraine has increasingly turned to international sources to finance credit expansion as its funding gap has been widening. The banking sector continued to hold net external liabilities in many countries, mostly at around 8% to 9% of GDP. Only in Turkey were net external liabilities substantially larger. Slovenia and Bulgaria became international creditors in 2013 and further consolidated this position in the review period. The Czech Republic and Slovakia continued to report positive net external assets, as did Russia.
Banking sector profits in CESEE remained rather subdued by historical standards, ranging from a return on assets (RoA) of 0.1% in Romania to an RoA of 1.7% in Turkey in mid2014. Hungary was the only country to report losses in the review period (–2.3% RoA) as profitability suffered due to higher reserves and provisions against the background of new legislation concerning foreign currency loans. Operating income increased marginally, however.
Compared to a year earlier, profitability remained broadly unchanged in mid2014 in many CESEE countries. Only the Slovenian banking sector generated a substantially higher profit, given higher operating income and lower provisioning. Russia, Turkey and Romania, by contrast, reported a notable decline in RoA. In Romania, the deterioration was mostly due to higher taxes on profits, in Turkey and Russia lower operating income was responsible, and higher provisioning also played a role.
The banking sectors in CESEE have remained well capitalized. In mid2014, capital adequacy ratios ranged
Loan-to-deposit ratio deteriorates
especially in Ukraine
Profits continue to be subdued…
…but banking sectors remain well
capitalized
As a percentage of GDP at mid-2014
30
25
20
15
10
5
0
–5
–10
–15
–20Slovenia
Banking Sector: Gap between Claims and Deposits and Net External Position
Chart 5
Source: ECB, Eurostat, national central banks, national statistical offices, OeNB.
Domestic claims less private sector depositsNet foreign assets (positive value) or liabilities (negative value)
Slovakia Czech Republic
Poland Hungary Bulgaria Romania Croatia Ukraine Russia Turkey
11
–5
–14
5 6
0 1 0
24
13 12
6
4 4
–8 –9
2
–9 –9 –8
4
–17

International Macroeconomic Environment: Weaker Global Growth and Geopolitical Tensions Rekindle Financial Sector Volatilities
FINANCIAL STABILITY REPORT 28 – DECEMBER 2014 21
from 12.8% in Russia to 21.1% in Croatia. Compared to mid2014, all countries recorded increases in their capital adequacy ratios (in a range from 0.3 to 4.2 percentage points), except for Poland, Russia and Ukraine. While the
decline in Poland and Russia was rather modest (–0.4 and –0.7 percentage points to 14.8% and 12.8%, respectively), it was more notable in Ukraine (–2.1 percentage points to 15.9%).
Return on assets (RoA) in %
3
2
1
0
–1
–2
–3Slovenia
Banking Sector: Profitability
Chart 6
Source: IMF, national central banks, OeNB.
Note: Data are not comparable between countries. Data are based on annual after-tax profits, except for Russia’s, which are based on pretax profits.
Mid-2013 Mid-2014
Slovakia CzechRepublic
Poland Hungary Bulgaria Romania Croatia Ukraine Russia Turkey

22 OESTERREICHISCHE NATIONALBANK
Declining Profitability of Nonfinancial Corporations Economic Activity Subdued in the First Three Quarters of 2014After having picked up slightly in the second half of 2013, economic activity in Austria again became flat in the first three quarters of 2014. Both external and domestic factors contributed to this moderation. The external macroeconomic environment was unfavorable. In addition to the sustained sluggishness of the euro area economy, geopolitical tensions impacted negatively on confidence. Against this background, exports lost momentum in the course of 2014. Investment growth was subdued as companies postponed investment in view of persistent uncertainties and unfavorable sales expectations. Moreover, housing investment
was also unexpectedly weak over the year.
Reflecting the sluggish economic environment, corporate profitability, which had improved slightly in 2013, remained on a downward trend in 2014. Looking at fourquarter moving sums to control for seasonality, the gross operating surplus was 2.0% down year on year in nominal terms in the second quarter of 2014 (see chart 7). However, low interest rates continued to support the nonoperational component of corporate profitability. Viewed in terms of the gross value added of the corporate sector, the downward trend in the gross operating surplus that has now been observed for three years persisted. By the second quarter of 2014, the gross profit ratio had fallen to 41.0%.
Downward trend in corporate
investment
Falling corporate profits
Corporate and Household Sectors in Austria: Expansion of Debt Remains Muted1
1 All national and financial accounts data in this chapter are based on the European System of Accounts 2010 (ESA 2010), and are thus not comparable with the respective data in previous editions of the Financial Stability Report.
% %
15
10
5
0
–5
–10
–15
50
49
48
47
46
45
44
43
42
41
402007 2008 2009 2010 2011 2012 2013 2014
Gross Operating Surplus of Nonfinancial Corporations
Chart 7
Source: Statistics Austria.
Annual change (left-hand scale) Profit ratio (% of gross value added; right-hand scale)

Corporate and Household Sectors in Austria: Expansion of Debt Remains Muted
FINANCIAL STABILITY REPORT 28 – DECEMBER 2014 23
Marked Reliance of Nonfinancial Corporations on Internal FinancingReduced earnings weakened the internal financing potential of the Austrian corporate sector. Measured as the sum of changes in net worth and depreciation, internal financing decreased by 17.8% in the first half of 2014, as compared with the same period of the year before, to stand at EUR 6.1 billion. It nonetheless remained the primary source of financing for nonfinancial corporations since recourse to external financing remained moderate, amounting to EUR 4.2 billion. Overall, the structure of corporate financing was still marked by a significant weight of “own funds.” If internal financing and external equitybased financing are taken together, 95% of financing in the first half of 2014 was accounted for by “own funds,” slightly more than the already high value recorded for the corresponding period in 2013 (92%).
Equity the Predominant Source of External Financing in the First Half of 2014
At EUR 3.6 billion in the first half of 2014, equity financing of nonfinancial corporations – issuance of both quoted and unquoted shares – was about 60% higher than in the corresponding period of the preceding year, accounting for the bulk (87%) of external financing. Unquoted shares and other equity instruments, mainly sales to foreign strategic investors, made up almost half (48%) of all external financing in the period under review. Almost 40% was generated through listed stocks, which had long been affected by the crisis, but began to show some signs of expansion
in the course of the year. In the first nine months of 2014, net issuance of capital on the stock exchange – the sum total of new listings, capital increases and delistings – amounted to EUR 1.9 billion, according to securities issues statistics, compared with a decline of EUR 0.3 billion in net issuance in the corresponding period of the year before.2 Most of this overall issuance volume was attributable to two new listings on the Vienna Stock Exchange.
Debt Financing Muted
Mirroring the great recourse to equity financing, only 13% of the external financing raised in the first half of 2014 was accounted for by the issuance of debt instruments. The primary source of debt financing were bank loans, extended by both domestic and foreign banks, from which Austrian nonfinan
Slight increase in stock market financing
Moderate bank loan growth
EUR billion
70
60
50
40
30
20
10
0
–10
–20
–302007
Internal and External Financing of Nonfinancial Corporations
Chart 8
Source: OeNB, Statistics Austria.
Internal financing External financing – equity External financing – debt
2008 2009 2010 2011 2012 2013 H1 12 H1 13 H1 14
2 At the cutoff date, financial accounts data were available up to the second quarter of 2014. More recent develop-ments in financing flows are discussed on the basis of data from MFI balance sheet statistics and securities issues statistics.

Corporate and Household Sectors in Austria: Expansion of Debt Remains Muted
24 OESTERREICHISCHE NATIONALBANK
cial corporations borrowed EUR 1.1 billion in the first half of the year.
Looking at lending by Austrian banks to domestic nonfinancial corporations, growth remained weak. In September 2014, MFI balance sheet statistics put the annual growth rate (adjusted for reclassifications, valuation changes and exchange rate effects) at 0.9% in nominal terms (see chart 10), implying that the decreases in real terms that had been witnessed throughout most of the year have come to an end. Growth was confined to mediumterm maturities (of over one year and up to five years), while loans with longer maturities – which accounted for most of the loan growth recorded in past years – as well as shortterm loans decreased in the course of 2014.
Loan growth was affected by both supply and demandside factors. On the one hand, banks became more restrictive in their lending policies over the past few years. According to the euro area bank lending survey (BLS), Austrian banks tightened their credit standards for corporate loans slightly but steadily between the second half of 2011 and the first half of 2013 as well as in the first half of this year (despite their remaining unchanged in the third quarter of 2014). Large firms were affected more than small and mediumsized enterprises (SMEs). The tightening of lending policies was driven both by banks’ capital positions and by heightened risk concerns.
On the other hand, loan demand was weak in the current cyclical environment. The banks surveyed in the BLS noted a slight decline in demand for corporate loans – again primarily from large companies – which they felt were due mainly to lower funding requirements for fixed investment. Moreover, firms had built up substantial liquidity in recent years, although
they began, in 2014, to reduce the deposits they had increased markedly in 2012 and 2013. Furthermore, the total amount of undrawn credit lines available to enterprises has recently risen significantly, namely by EUR 5 billion, or 28%, since the end of 2012, according to the OeNB’s quarterly statistics on new lending business (see chart 9). These liquidity buffers may reflect both a lack of investment opportunities and precautionary motives. That notwithstanding, the restrictive policies of Austrian banks did not constitute a binding constraint, at least not in the current environment of weak demand for loans (for a discussion of the financing of SMEs, see also box 1 “Austrian SMEs’ Access to Finance – Evidence in BACH Data”).
The tighter credit standards affected not only the volume of bank loans, but also their terms and conditions. Wider margins on loans partially dampened the effects of monetary policy easing on
Tighter credit standards and weak
demand for loans
Lending rates remain low
EUR billion
24
23
22
21
20
19
18
17
16
15
14
132009 2010 2011 2012 2013 2014
Undrawn Credit Lines of Nonfinancial Corporations
Chart 9
Source: OeNB (statistics on new lending business).

Corporate and Household Sectors in Austria: Expansion of Debt Remains Muted
FINANCIAL STABILITY REPORT 28 – DECEMBER 2014 25
financing costs. Thus, the passthrough of the seven key interest rate cuts undertaken by the ECB between November 2011 and September 2014 (which totaled 145 basis points) was incomplete. Over the period from October 2011, the month before the first of the cuts in key interest rates, and September 2014, corporate lending rates declined by 115 basis points. Although interest rates fell for all loan amounts and maturities, they decreased more markedly in the case of both longerterm loans and larger loan amounts (more than EUR 1 million). The spread between interest rates on larger loans and those on loans of lesser amounts, which – given the lack of other data – is commonly used as an indicator of the
relative cost of financing for SMEs, averaged 52 basis points in the first nine months of 2014, one of the lowest levels recorded in any euro area country.
While the dynamics of bank lending have increased slightly in recent months, the expansion of marketbased debt issuance, which had been a major source of external finance for the corporate sector in the past years, has stalled since mid2014 and no longer offsets the subdued loan growth. In September 2014, corporate bond issuance decreased by 0.2% year on year, according to securities issues statistics. However, this form of funding is available only to a limited number of mainly larger companies.
Bond financing on a downward trend
Annual change in %1
Loans
20
15
10
5
0
–5
Annual change in %
Bonds
30
25
20
15
10
5
0
–5
Annual change in %
Quoted Stocks
18
16
14
12
10
8
6
4
2
0
–22007 2008 2009 2010 2011 2012 2013 2014 2007 2008 2009 2010 2011 2012 2013 2014 2007 2008 2009 2010 2011 2012 2013 2014
Key Elements of Nonfinancial Corporations’ Financing Volumes
Chart 10
Source: OeNB, ECB.1 Adjusted for reclassifications, changes in valuation and exchange rate effects.
Austria Euro area

Corporate and Household Sectors in Austria: Expansion of Debt Remains Muted
26 OESTERREICHISCHE NATIONALBANK
Box 1
Austrian SMEs’ Access to Finance – Evidence in BACH Data
Since the onset of the crisis, the question of SMEs’ access to finance – especially to bank loans – has attracted special attention. As SMEs are more dependent on bank funding than larger corporations, they tend to be more vulnerable when bank lending is reduced. Capital market-related financing instruments are not available to most SMEs because of the volumes required and the cost associated. Against this background, this box looks at the development of Austrian SMEs’ bank loans and equity finance over the past decade as a percentage of balance sheet totals. To put the situation of Austrian SMEs into perspective, it is compared to that of larger Austrian enterprises and SMEs in other countries between 2000 and 2012. The conclusion is that balance sheet data do not point to financing difficulties of Austrian SMEs during that period.
Most of the analyses that addressed this issue before were based on the results of sur-veys, such as the BLS1 and the SAFE2. These surveys indicated that Austrian SMEs generally had sufficient access to sources of external finance in recent years. Even if these surveys pro-vide valuable insights, they cannot completely substitute an analysis of balance sheet data. Therefore, this box uses data from the BACH3 database, which provides aggregated and
1 Bank lending survey for the euro area. 2 Survey on the access to f inance of small and medium-sized enterprises in the euro area. 3 Bank for the Accounts of Companies Harmonized.
% of total assets % of total assets
Amounts Owed to Credit Institutions by Enterprise Size
Equity by Enterprise Size
45
40
35
30
25
20
15
10
40
35
30
25
20
152000
% of total assets % of total assets
Amounts Owed by SMEs to Credit Institutions by Country
SMEs’ Equity by Country
35
30
25
20
15
50
45
40
35
30
25
20
Capital Structure of Austrian Enterprises
Source: BACH database.
AT
Large Small and medium Small Medium
DE FR IT BE ES
2002 2004 2006 2008 2010 2012 2000 2002 2004 2006 2008 2010 2012
2000 2002 2004 2006 2008 2010 2012 2000 2002 2004 2006 2008 2010 2012

Corporate and Household Sectors in Austria: Expansion of Debt Remains Muted
FINANCIAL STABILITY REPORT 28 – DECEMBER 2014 27
Reduced Earnings Hamper Debt-Servicing Capacity of the Corporate Sector
Mirroring the slowdown in external financing, as well as the strong recourse to equity financing, corporate debt (viewed in terms of total loans raised and bonds issued) rose very modestly – by 0.6% – in the first six months of 2014. Despite the moderate expansion of debt and the high proportion of both internal funds and equity financing used, however, the fall in profits caused
the ratio of corporate debt to gross operating surplus to increase by 4 percentage points to 482%, resulting in a further slight deterioration of the sustainability of corporate debt (see chart 11). The fact that the debttoincome ratio is still considerably above precrisis levels implies that the increase in the vulnerability of the corporate sector in the period from 2007 to 2009 has not yet been reversed. Moreover, the debttoincome ratio in Austria is currently higher than anywhere else in
Debt-to-income ratio increases slightly
relatively harmonized accounting data of nonfinancial incorporated enterprises in a number of European countries as well as a breakdown by enterprise size. The ratios based on BACH data, which are based on book values, may differ from those calculated from financial accounts data that use market prices. The BACH database applies a broader definition of equity (capital, reserves, earnings and other equity instruments plus revaluations, adjustments on financial investments and other comprehensive income) than that underlying financial ac-counts data, which does not cover the claims of investors and lenders against nonfinancial assets. Moreover, it has a time lag of more than one year (currently, BACH data are available for most countries, including Austria, up until 2012).
As the upper left-hand panel of the chart shows, Austrian SMEs rely on bank loans to a considerable extent. The share of bank financing – defined as amounts owed to credit institu-tions and finance companies (including leasing) – in total assets is still much higher than for SMEs in other countries. Moreover, after having declined in 2007 and 2008, when banks had tightened their credit standards considerably and the global recession reduced the funding needs of enterprises, the amounts owed to credit institutions in percent of total assets remained steady since then and even experienced a slight rebound in recent years. The striking difference in the bank financing ratio between large and small companies in Austria persisted. At the end of 2012, the gap between SMEs and large enterprises amounted to 16 percentage points in Austria. Only in Germany, this gap was wider. The comparatively high bank loan ratio implies that Austrian SMEs can access bank loans to finance their investment plans if they meet creditworthiness requirements.
Moreover, the upper right-hand panel illustrates that the crisis did not compress the equity ratios of Austrian SMEs. On the contrary, the last decade was characterized by a considerable increase in SMEs’ equity ratios. The gap between large and small enterprises evident throughout most of the previous decades was closed. This also has to be attributed, to a large extent, to a decrease in large enterprises’ equity ratios. The higher equity ratios undoubtedly contributed to improved creditworthiness and lower vulnerability among Austrian SMEs. The rise in equity ratios might in part be due to the changed lending conditions of banks, which in the past years became increasingly differentiated according to the level of risk associated with borrowers. This provided an incentive for enterprises to strengthen their balance sheets. However, especially for SMEs, equity ratios are still lower in Austria than in most other European countries, as the latter have witnessed similar increases in the equity ratios of their SMEs.
Thus, balance sheet data confirm survey evidence indicating that access to bank loans has not been a major concern for Austrian SMEs in recent years. On the contrary, if at all, strengthening the equity base of SMEs seems to be more of an issue than increasing leverage.

Corporate and Household Sectors in Austria: Expansion of Debt Remains Muted
28 OESTERREICHISCHE NATIONALBANK
the euro area, which reflects not only the importance of debt financing in Austria, but also the ongoing deleveraging of corporates in a number of other euro area countries.
The environment of low interest rates continued to support the ability of firms to service their debt. In the first half of 2014, the proportion of corporate earnings (gross operating surplus)
spent on interest payments for bank loans declined slightly further, benefiting from the very high share of variable rate loans. While Austrian companies currently, therefore, have lower interest expenses than their euro area peers, their exposure to interest rate risk is considerably higher. A rebound of interest rates could thus become a significant burden, especially for highly in
Variable rate loans imply interest rate
risk
% of gross operating surplus
Debt
560
540
520
500
480
460
440
420
400
% of gross operating surplus
Interest Expenses1
16
14
12
10
8
6
4
2
0
2007
2007
% of total new lending
Variable Rate Loans
99
97
95
93
91
89
87
85
% of total loans
Foreign Currency Loans
10
9
8
7
6
5
4
3
2
1
0
Risk Indicators for Nonfinancial Corporations
Chart 11
Source: OeNB, ECB, Eurostat.1 Euro area: euro loans only.
Austria Euro area
2009 2011 Q1 Q3 Q1 Q3 Q1Q2 Q4 Q2 Q42012 20142013
Q2 2007 2009 2011 Q1 Q3 Q1 Q3 Q1Q2 Q4 Q2 Q42012 20142013
Q2
2009 2011 Q1 Q22012
Q3 Q4 Q1 Q22013
Q3 Q1 Q22014
Q3Q4 2007 2009 2011 Q1 Q22012
Q3 Q4 Q1 Q22013
Q3 Q1 Q22014
Q3Q4

Corporate and Household Sectors in Austria: Expansion of Debt Remains Muted
FINANCIAL STABILITY REPORT 28 – DECEMBER 2014 29
debted companies, even though rising debt servicing costs may eventually be partially offset by the positive impact an economic recovery would have on firms’ earnings.
The exposure of the corporate sector to foreign exchange risk, which has never been as high as that of the household sector, further declined slightly over the year to date. The share of foreign currency loans fell to 4.7% in September 2014 (a level more than 4 percentage points below that of 2010), and thus below the figure for the euro area as a whole.
Household Indebtedness Low, but Not without RiskDevelopment of Households’ Real Income Subdued in the First Three Quarters of 2014
Subdued economic activity in the first three quarters of 2014 had a marked negative impact on the labor market. Employment dynamics were sluggish, whereas the supply of labor, in particular that from abroad, continued to expand, resulting in rising unemployment. The growth of households’ real disposable income was negative in the first three quarters of 2014, which was due to the fact that real wage growth was more than offset by declining property income. Despite the contraction of households’ real disposable income, which – together with weak consumer confidence – dampened consumers’ propensity to spend, the saving rate continued to fall. On the one hand, the environment of low interest rates may have reduced the attractiveness of saving. On the other hand, the decline in the saving ratio may reflect the muted development of property income as this is a part of disposable income that is more likely to be saved than labor income. Moreover, low saving rates are typical of periods of low income
growth, when households save less in order to maintain their consumption at the usual level.
Financial Investment by Households Low
After having dropped sharply in the first half of 2013, financial investment by households rebounded slightly in the corresponding period this year, to stand at EUR 3.9 billion. However, although the level was 60% higher than that of 2013, it was just half that recorded in 2012 (see chart 12).
Almost onethird of the financial investment by households yet again flowed into cash holdings and deposits with banks. Bank deposits with agreed maturity continued to decline over the year thus far, while overnight deposits saw further significant inflows. The inflows to cash and deposits with shorter maturities suggest a high preference of households for liquidity, given the low opportunity costs as a result of low interest rates.
Households’ net financial investment in capital market instruments, which had already been muted in 2013, fell to EUR 0.2 billion in the first six months of 2014, just over onethird the level recorded in the corresponding period of the year before. As in the case of deposits, households shunned investments with longer interest rate fixation periods and reduced their direct holdings of longterm debt securities. Conversely, mutual fund shares as well as direct holdings of quoted stocks, were increased, with the latter reflecting both the pronounced increase in share prices on international markets in the first half of 2014 and an ongoing search for yield in a lowinterest environment.
Investment in life insurance and pension entitlements (both claims on pension funds and direct pension benefits
Further drop in the saving ratio
Shift to cash holdings and bank deposits with shorter maturities
Capital market investment shrinks
Stabilizing effect of insurance investment

Corporate and Household Sectors in Austria: Expansion of Debt Remains Muted
30 OESTERREICHISCHE NATIONALBANK
granted by private employers) continued to stabilize financial investment. At EUR 1.7 billion, such investment accounted for 44% of total financial investment in the first half of 2014. However, a large proportion of the inflows into these instruments were not an outcome of current investment decisions, but rather – given the long maturities and commitment periods involved – reflected past decisions. A key factor in this context is demand for funded pension instruments; moreover, life insurance policies often serve as repayment vehicles for foreign currency bullet loans.
As a result of rising share and bond prices, the Austrian household sector, on aggregate, recorded considerable (unrealized) valuation gains. The valuation gains on their securities portfolios totaled EUR 1.9 billion in the first half of 2014, an amount equivalent to 1.9% of their securities holdings at the end of 2013. Valuation gains were registered for longterm debt securities, mutual fund shares and quoted stocks. Another EUR 1.3 billion of (unrealized) valuation gains were recorded for investments in life insurance and pension
funds. While this has led to a notional increase in the financial wealth of households in the first half of 2014, it must be borne in mind that valuation developments are very volatile and can move in the opposite direction as well (as they have done in the past).
Slight Increase in Housing Loan Growth
The expansion of bank lending to households remained subdued until the third quarter of 2014, although annual growth rates have recovered slightly since the middle of last year. In September 2014, bank loans to households (adjusted for reclassifications, valuation changes and exchange rate effects) increased by 1.2% in nominal terms. A breakdown by currency shows that eurodenominated loans continued to grow at a brisk pace (by 4.5% in September 2014), while foreign currency loans continued to contract at doubledigit rates – in September 2014, they had fallen by 10.9%, year on year. Broken down by loan purpose (see chart 13), consumer credit and other loans shrank by 3.2% and 0.8%, respectively, in yearonyear terms in September 2014. Housing loans grew by 3.2% year on year, with growth gaining some momentum since mid2013. The favorable financing conditions probably supported the dynamics of lending for house purchase, with housing market indicators also pointing to an increase in demand for such loans. Rising house prices (see below) may have boosted the funding households need for real estate investment. Moreover, the significant increase in the number of residential building permits issued in 2013 suggests an ensuing expansion of construction activity (although the number of such permits issued in the first half of 2014 fell by 4.3%), as well as a later increase in
(Unrealized) valuation gains
Foreign currency loans continue to
decline
EUR billion
25
20
15
10
5
0
–52007
Financial Investment of Households
Chart 12
Source: OeNB.1 Debt securities, mutual fund shares and listed stocks.2 Unlisted stocks and other equity.
Cash and deposits Life insurance, pension entitlements Capital market instruments1
Other Direct equity holdings2
Total
2008 2009 2010 2011 2012 2013 H1 12 H1 13 H1 14

Corporate and Household Sectors in Austria: Expansion of Debt Remains Muted
FINANCIAL STABILITY REPORT 28 – DECEMBER 2014 31
households’ purchases of new homes.3 However, there are no indications that banks have relaxed their credit standards for housing loans. According to the BLS results for Austrian banks, standards have been eased somewhat only twice since the beginning of 2013, and had shown very little movement in the years before.
Lending terms and conditions remained favorable. Interest rates on shortterm loans (for interest rate fixation periods of up to one year) stood at 2.70% in September 2014, 0.83 percentage points below the level in October 2011, reflecting the seven cuts in key ECB interest rates between November 2011 and September 2014,
Financing conditions remain favorable
3 Up-to-date data on newly completed housing projects are not available.
Annual change in %1
Housing Loans: Volumes
14
12
10
8
6
4
2
0
–2
–4
–6
Annual change in %1
Consumer Loans: Volumes
14
12
10
8
6
4
2
0
–2
–4
–6
Annual change in %1
Other Loans: Volumes
14
12
10
8
6
4
2
0
–2
–4
–62006 2007 2008 2009 2010 2011 2012 2013 2014 2006 2007 2008 2009 2010 2011 2012 2013 2014 2006 2007 2008 2009 2010 2011 2012 2013 2014
%
Housing Loans: Interest Rates
9
8
7
6
5
4
3
2
1
0
%
Consumer Loans: Interest Rates
9
8
7
6
5
4
3
2
1
0
%
Other Loans: Interest Rates
9
8
7
6
5
4
3
2
1
02006
MFI Loans to Households: Volumes and Conditions
Chart 13
Source: OeNB, ECB.1 Adjusted for reclassifications, valuation changes and exchange rate effects.
Austria Euro area
2007 2008 2009 2010 2011 2012 2013 2014 2006 2007 2008 2009 2010 2011 2012 2013 2014 2006 2007 2008 2009 2010 2011 2012 2013 2014

Corporate and Household Sectors in Austria: Expansion of Debt Remains Muted
32 OESTERREICHISCHE NATIONALBANK
and the associated decline in money market rates. Looking at data on lending rates across the entire maturity spectrum, interest rates on new housing loans stood at 2.27% in September 2014, 0.76 percentage points lower than in October 2011. Over the same period, interest rates on consumer credit dropped by 0.17 percentage points to 4.96%.
Households’ Currency and Interest Rate RisksIn mid2014, the household sector’s total liabilities stood at EUR 164.9 billion, according to financial accounts data, a mere EUR 0.1 billion or 0.05% down in nominal terms on the figure at the end of 2013, thereby reflecting low loan growth. Expressed as a percentage of net disposable income, household debt decreased by 0.5 percentage points to 88.3% (see chart 14). The debt ratio
Household debt decreases slightly
% of disposable income
Liabilites
110
105
100
95
90
85
80
75
% of disposable income
Interest Expenses
6
5
4
3
2
1
02007
% of total loans
Foreign Currency Loans
35
30
25
20
15
10
5
0
% of total new loans
Variable Rate Loans
100
90
80
70
60
50
40
30
20
10
02007
Household Risk Indicators
Chart 14
Source: OeNB, Statistics Austria, ECB, Eurostat.
Note: Figures for the euro area reperesent only the interest expenses on euro-denominated loans.
Austria Euro area
2009 2011 Q1 Q2 Q1 Q22012
Q3 Q4 Q1 Q22013 2014
Q3 Q4 2007 2009 2011 Q1 Q2 Q1 Q22012
Q3 Q4 Q1 Q22013 2014
Q3 Q4
2009 2011 Q1 Q22012
Q3 Q4 Q1 Q22013
Q3 Q4 Q1 Q22014
Q3 2007 2009 2011 Q1 Q22012
Q3 Q4 Q1 Q22013
Q3 Q4 Q1 Q22014
Q3

Corporate and Household Sectors in Austria: Expansion of Debt Remains Muted
FINANCIAL STABILITY REPORT 28 – DECEMBER 2014 33
of households in Austria thus continued to be lower than in the euro area as a whole (104.3% at the end of the first quarter of 2014).
Given the combined prevalence of moderate debt growth and low interest rates, households’ interest expenses remained low. In the first half of 2014, they equaled 2.0% of their aggregate disposable income, about 2 percentage points less than in 2008, i.e. the year before interest rates had begun to fall. One of the factors behind the acceleration of the decline was the high share of variable rate loans: In the third quarter of 2014, loans with an initial rate fixation period of up to one year accounted for almost 90% of new lending (in euro) to households, a very high proportion by international standards. The passthrough of the ECB’s lower key interest rates to lending rates in Austria was consequently faster than in the euro area as a whole. Loan quality may
have also played a role, given Austrian households’ comparatively low level of indebtedness. The high share of variable rate loans in total lending implies considerable interest rate risk in the balance sheet of the household sector. However, an analysis of survey data indicates that the risk is largely concentrated on highincome households, which are better able to bear it (see box 2).
The high share of foreign currency loans in total lending remains a major risk factor with respect to the financial position of Austrian households. Although the proportion of such loans has fallen by 12 percentage points since 2008, 18.9% of the total volume of loans extended to Austrian households was still denominated in foreign currency in September 2014. About 96% of the foreign currency loans outstanding were denominated in Swiss francs, compared with less than 4% in Japanese yen.
Interest expenses remain low
Share of foreign currency loans falls significantly
Box 2
Microsimulations – Household Debt
In recent years, interest rates for loans to households have strongly decreased (see chart 13). Following a peak in November 2008 (at 6.32%), interest rates on outstanding loans with an agreed maturity of up to one year started to decline, reaching 2.36% in August 2014. This represents a decrease by 3.96 percentage points. Indebted Austrian households have strongly benefited from this development because a large majority holds adjustable rate mortgages (ARMs). According to interest rate statistics, more than 80% of new euro-denominated hous-ing loans granted in the first eight months of 2014 had an initial fixed-rate period of up to one year. While this share was somewhat lower than the comparable figure for overall loans to households in Austria, it was distinctively higher than the figure for the entire euro area, where the corresponding share was just above one-quarter. Though households’ interest burden has been reduced thanks to the decline in the interest rate level, their debt service costs would increase once interest rates rise again.
Macrodata-based risk indicators only partially reflect financial stability risks stemming from the household sector. Data from the Household Finance and Consumption Survey (HFCS) show that adjustable rate mortgages are not equally distributed among households (see table 1 below).
− Households with no risk aversion (self-assessment) hold adjustable rate mortgages more often than households with risk aversion (but their share in total ARM debt is lower, i.e. 31%).
− Household heads with a higher education level tend to take out adjustable rate mortgages more often than persons with a lower level of education.

Corporate and Household Sectors in Austria: Expansion of Debt Remains Muted
34 OESTERREICHISCHE NATIONALBANK
− There is a positive correlation between the frequency of adjustable rate mortgages and age for household heads up to the age of 54; for older persons the frequency decreases again.
− The frequency of adjustable rate mortgages strongly rises with income and total gross wealth (the upper quartiles hold most of the overall adjustable rate mortgage debt).
− Adjustable rate mortgages are higher in terms of mortgage amount (mean: EUR 80,910, median: EUR 43,089) than nonadjustable mortgages (mean: EUR 51,134, median: EUR 19,540).
The risk of fast interest rate increases is concentrated in the group of high-income households, which are better equipped to bear these risks. But to have a broader picture of households’ risk-bearing capacity, other factors must be considered, too, e.g. expenses and mortgage amount.
Therefore, we present stress test results to show the effects of interest rate increases on households’ risk-bearing capacity in aggregated and disaggregated terms. We use data obtained from the HFCS Austria 2010. The scenarios simulated with the model described in Albacete et al. (2014)1 have been updated according to the most recent interest rate develop-ments.
1 Albacete, N., J. Eidenberger, G. Krenn, P. Lindner, M. Sigmund. 2014. Risk-Bearing Capacity of Households – Linking Microlevel Data to the Macroprudential Toolkit. In: Financial Stability Report 27. OeNB. 95–110.
Table 1
Households with Adjustable Rate Mortgages (ARMs)
Share of households with ARMs
Outstanding ARM balance1 Share in total ARM debt
Mean Median
% EUR %
All mortgage holders 70 80,910 43,089 100Risk aversion (household head)
Yes 68 74,000 40,370 69No 77 103,157 58,326 31
Education (household head)Compulsory school education or lower 59 59,823 29,349 8Apprenticeship or medium technical school 70 74,820 34,995 50Upper secondary school 72 105,400 82,737 18University-level education 76 91,713 58,200 24
Age (household head)16–34 65 99,003 54,821 1835–44 69 102,948 79,053 4145–54 80 80,433 35,537 2855–64 69 46,174 17,872 965+ 60 34,402 26,249 4
Gross income quartiles1st quartile 40 92,608 37,341 42nd quartile 64 48,328 28,404 103rd quartile 73 76,694 40,314 284th quartile 75 94,344 54,013 58
Gross wealth quartiles1st quartile . . . . . . . .2nd quartile 54 24,951 6,720 13rd quartile 64 68,162 39,437 334th quartile 77 93,362 51,086 66
Source: HFCS Austria 2010, OeNB.1 The mean and median outstanding ARM balances are calculated across the sample of households that actually have ARMs.

Corporate and Household Sectors in Austria: Expansion of Debt Remains Muted
FINANCIAL STABILITY REPORT 28 – DECEMBER 2014 35
Apart from the baseline scenario (no change in interest rates) the following scenarios are tested:
− Scenario 1: The interest rate of adjustable rate mortgages increases by 0.7 percentage points (corresponds to the average absolute year-on-year interest rate change from January 2009 to August 2014).
− Scenario 2: The interest rate of adjustable rate mortgages increases by 1.3 percentage points (corresponds to the absolute interest rate change between the peak in August 2011 and August 2014).
− Scenario 3: The interest rate of adjustable rate mortgages increases by 2.9 percentage points (corresponds to the absolute interest rate change between the average for the pe-riod from 2003 to 2008 and August 2014).
The stress test results are presented in table 2. They are summarized in terms of three typical risk indicators. The first risk indicator shows how the share of indebted households with nega-tive financial margins changes in the different scenarios. The financial margin of a household is its income minus basic living costs and minus debt service costs. If it is negative, it indicates that the household could have problems repaying its debt. As the interest rate increases, the debt service costs of adjustable rate mortgage holders go up, which raises the probability that a household may encounter repayment problems. Table 2 shows that, in the baseline scenario, 8.5% of debtors have a negative financial margin. In a scenario where interest rates increase by 0.7 percentage points each year (scenario 1), the proportion of vulnerable households increases by 0.4 percentage points to 8.9%. Assuming an interest rate increase by 2.9 per-centage points (scenario 3), this share goes up by 1.8 percentage points to 10.3%.
To estimate the related risk for the financial sector, one additionally has to take into account these vulnerable households’ assets and outstanding debt. This information is incorpo-rated in the next two risk indicators captured in table 2. If first we only take into account outstanding debt, the second risk indicator shows that in scenario 1 the 8.9% of households with a negative financial margin hold 22% of aggregate debt. If we deduct their wealth from their debt, the third risk indicator shows that the remaining risk for the financial sector is small: Only 3.2% of aggregate debt is debt of vulnerable households that is not covered by their total wealth (in the baseline scenario this share is the same). As could be expected, real assets (as opposed to financial assets) cover the largest part of total household debt.
The difference between scenario 3 and the baseline scenario (represented in table 2, last column) expresses how the risk indicators would be affected if interest rates increased to the
Table 2
Stress Test: General Results
Baseline Interest rate increase by… Change1
0.7 percent-age points
1.3 percent-age points
2.9 percent-age points
Households with a negative financial margin (% of debtors) 8.5 8.9 9.5 10.3 1.8Debt of these households (% of total household debt) 21.3 22.0 23.2 25.1 3.8
Debt of these households not covered by their total wealth (% of total household debt) 3.2 3.2 3.6 4.0 0.8Debt of these households not covered by their real assets (% of total household debt) 4.6 4.6 5.0 5.4 0.9
Source: HFCS Austria 2010, OeNB.1 Difference between scenario 3 (+2.9 percentage points) and the baseline scenario, given in percentage points.

Corporate and Household Sectors in Austria: Expansion of Debt Remains Muted
36 OESTERREICHISCHE NATIONALBANK
average level observed prior to the financial crisis. The proportion of households with a nega-tive financial margin would increase by 1.8 percentage points, their share in total household debt by 3.8 percentage points and the share of vulnerable households’ uncovered debt by 0.8 percentage points.
These stress test results should be interpreted as upper limits for the following reasons: First, these are not households in bankruptcy but households with an estimated negative financial margin; they probably have several options before going bankrupt, e.g. debt restructuring by banks or help from family or friends. Second, outstanding debt as defined for the second and third risk indicators refers to all loans of households with a negative financial margin and not only adjustable rate mortgages. Thus, if a household with a negative financial margin holds several loans, then we assume that this household cannot repay any of its
% of indebted households % of aggregated debt % of aggregated debt
Baseline Scenario
18
16
14
12
10
8
6
4
2
0
% of indebted households
Scenario 1: Increase by 0.7 Percentage Points
18
16
14
12
10
8
6
4
2
0
14
12
10
8
6
4
2
0
14
12
10
8
6
4
2
01st quartile
% of indebted households % of aggregated debt % of aggregated debt
Scenario 2: Increase by 1.3 Percentage Points
18
16
14
12
10
8
6
4
2
0
% of indebted households
Scenario 3: Increase by 2.9 Percentage Points
18
16
14
12
10
8
6
4
2
0
14
12
10
8
6
4
2
0
14
12
10
8
6
4
2
0
OeNB Household Stress Test: Interest Rate Increase (across Income Groups)
Source: HFCS Austria 2010, OeNB.
Debt of households with a negative financial margin not covered by their total wealth (right-hand scale) Debt of households with a negative financial margin (right-hand scale) Households with a negative financial margin (left-hand scale)
2nd quartile 3rd quartile 4th quartile 1st quartile 2nd quartile 3rd quartile 4th quartile
1st quartile 2nd quartile 3rd quartile 4th quartile 1st quartile 2nd quartile 3rd quartile 4th quartile
Chart 1

Corporate and Household Sectors in Austria: Expansion of Debt Remains Muted
FINANCIAL STABILITY REPORT 28 – DECEMBER 2014 37
Residential Property Prices Rise FurtherIn the first half of 2014, prices on the Austrian residential property market continued to rise. The price dynamics were again heterogeneous across regions. While the upward movement of residential property prices slowed down in Vienna (to 5.8% in the second quarter of the year), the pace of such price increases elsewhere in Austria accelerated during the first half of 2014 (to 4.3% in the second quarter). On aggregate, residential property prices in Austria increased by 45% between the first quarter of 2007 and the second quarter of 2014 (24% in real terms, adjusted for HICP inflation). The fundamental residential property price indicator compiled by the OeNB points to a persistent overvaluation of residential property in Vienna (by 23% in the second quarter of 2014). For Austria as
a whole, this indicator shows that, on aggregate, prices are in line with economic fundamentals.
In part, the increases in Austrian residential property prices reflect a catchingup process since price dynamics had been virtually flat in the years before 2007. Moreover, demand has been driven by demographic change and by investors’ choices. Since 2011, population growth in Austria has steadily picked up speed, with 2013 seeing an increase (27,800 persons) that was three times the average annual population growth recorded between 2008 and 2010 (9,900 persons). In addition, the heightened propensity of investors to choose real estate over other assets for investment also seems to have played a role in strengthening demand. From an investor’s perspective, the rising ratio of property prices to rents observed in Vienna – and also
Heterogeneous price dynamics across different regions
loans, not even partially. Finally, one has to take into account that the estimated losses for banks and households are only unrealized losses. They would only be realized if all loans fell due right after the occurrence of the scenario. But in general, credit periods are quite long.
The simulated interest rate shocks predominantly hit households whose debt is mainly covered by their total wealth. This result is shown in chart 1; it is consistent with the finding from table 1 indicating that adjustable rate mortgages are held by higher income households. Although households with a negative financial margin are concentrated in the lower income groups, their shares in aggregated debt are relatively small: Of the 21.3% of total debt held by households with a negative financial margin in the baseline scenario (see table 2), 2 percent-age points are attributable to the lowest income group, 3.8 percentage points to the 2nd income quartile, 4.2 percentage points to the 3rd income quartile and 11.3 percentage points to the highest income group (see chart). The simulated scenarios 1 to 3 show that interest rate rises affect the debt of higher income households most strongly. For example, if interest rates rise by 2.9 percentage points (scenario 3), the share of vulnerable high-income house-holds (4th quartile) in aggregated debt rises by 1.6 percentage points (from 11.3% to 12.9%), that of households in the 3rd income quartile increases by 1.1 percentage points (from 4.2% to 5.2%). In the first and second income groups, this share does not change much (0.7 and 0.4 percentage points, respectively). The debt of vulnerable households that is not covered by their total wealth stays very low across all income groups and across all scenarios, especially in the highest income groups.
Even if the risk for financial stability can be classified as rather low, the burden for indi-vidual indebted households could be enormous. Many of them would have to use substantial parts of their financial and/or real assets to repay their debt. Furthermore, if interest rate rises were to occur together with other shocks, like income losses or appreciations of foreign currencies like the Swiss franc, this burden would be even higher.

Corporate and Household Sectors in Austria: Expansion of Debt Remains Muted
38 OESTERREICHISCHE NATIONALBANK
in the rest of Austria in the first half of 2014 – is an indication of decreasing yields on real estate investment. On the supply side of the real estate market, there was a certain lag before the mar
ket reacted to steppedup demand. After having developed at a subdued pace over the past few years, residential construction activity saw an upturn in the course of 2013.
Annual change in %
Residential Property Prices in Austria
25
20
15
10
5
0
–5
Deviation from fundamental price in %
OeNB Fundamental Residential Property Price Indicator
25
20
15
10
5
0
–5
–10
–15
–202007 2008 2009 2010 2011 2012 2013 2014 2007 2008 2009 2010 2011 2012 2013 2014
Austrian Residential Property Market
Chart 15
Source: Wolfgang Feilmayr, Department of Spatial Planning, Vienna University of Technology; OeNB.
Vienna Austria excluding Vienna Vienna Austria

FINANCIAL STABILITY REPORT 28 – DECEMBER 2014 39
Banks’ Capital Position Needs to Be StrengthenedSince the start of the financial crisis, Austrian banks have built up substantial capital and accelerated their balance sheet repair at home and abroad. Impro vements have been achieved through a combination of capital increases (e.g. via rights issues and retained earnings) and reductions of riskweighted assets, but progress has been uneven across banks.
The common equity tier 1 (CET1) ratio of the Austrian banking system was 11.8% in June 2014, while the tier 1 ratio and the total capital ratio stood at 11.9% and 15.6%, respectively. More than half of Austrian banks’ total assets were held by banks with CET1 ratios between 10% and 12%, and more than threequarters by banks with ratios between 9% and 13% (chart 16). The capitalization of the big Austrian banking groups continues to be weaker than that of smaller locally active banks. As of June 2014, the top three Austrian banks on average had a total capital ratio of 14.9%, i.e.
more than 70 basis points below the average of the Austrian market.
A minimum nonriskweighted leverage ratio will be added as a new tool of banking supervision to complement riskweighted capital requirements. Disclosure starts in 2015; leverage ratios will then be monitored until 2017, and the requirement will be migrated to Pillar 1 in 2018. This requirement has been introduced to provide a “backstop” against overly optimized (i.e. too low) risk weighing. The relevant recommendation by the Basel Committee on Banking Supervision stipulates that a bank’s tier 1 capitaltoexposure ratio (including offbalance sheet items) must be at least 3%. Austrian banks’ average leverage ratio1 (for the consolidated business) was 5.4% in June 2014, with banks’ individual ratios varying markedly. Banks with a leverage ratio between 4% and 6% account for more than onehalf of the sector’s total assets (chart 17). Comparable European banks show lower leverage ratios2 than Austrian banks.
Austrian banks with CET1 ratios between 10% and 12% hold more than half of sector’s total assets
Leverage ratios of Austria banks vary markedly
Austrian Financial Intermediaries: Challenging Environment Calls for Further Efforts
1 The leverage ratio is defined according to the definition in the Capital Requirements Regulation (CRR).2 In this comparison of European banks, the proxy for the leverage ratio was defined as tier 1 capital to total assets.
Distribution on the basis of consolidated total assets in %
Common Equity Tier 1 Ratio of Austrian Banks
Chart 16
Source: OeNB.
<10% 10%–11% 12%–13% 13%–15% >15%
11%–12%
19
6
12 7
28
28
Distribution on the basis of consolidated total assets in %
Leverage Ratio of Austrian Banks
Chart 17
Source: OeNB.
Note: Using a fully phased-in definition of core tier 1 capital.
<3% 3%–4% 5%–6% >6%
4%–5%
23
23 21
31
2

Austrian Financial Intermediaries: Challenging Environment Calls for Further Efforts
40 OESTERREICHISCHE NATIONALBANK
The OeNB acknowledges Austrian banks’ progress in increasing their capitalization. The outcome of the ECB’s comprehensive assessment of significant European banks’ balance sheets has shown that most participating Austrian banks have sufficient capital buffers, even under the severe stress scenario.3 But this should not be a reason for complacency, as more needs to be done: Austrian banks continue to lag behind their peer groups abroad in terms of capitalization and should aim at closing this gap. In particular, the difference between the average capitalization (tier 1 ratio) of Austria’s top three banks (11.2%) and their European (12.6%) and CESEE peers (12.2%) remains significant.
In addition, shareholders’ capacity to recapitalize banks during a crisis is often weak. Many shareholders are leveraged themselves (e.g. decentralized sectors).
For many banks of the state mortgage bank sector, the main shareholder is the public sector, where recapitaliza
tions under stress are complicated by the EU’s state aid rules. Across this sector, internal capital generation is hampered by dividends, which are paid out despite structurally low profitability (with few exceptions).
Profitability of Austrian Banks Still under Pressure
After recording a loss in 2013, the negative trend in the profitability of the Austrian banking system continued in the first half of 2014 in a challenging environment of slow economic growth, weak credit quality and continuously low interest rate margins. Furthermore, large expenses in connection with the planned sale of foreign subsidiaries of Hypo Alpe Adria as well as higher risk provisioning by other institutions are weighing on banks’ profits. As a result, Austrian banks’ consolidated net result after tax in the first half of 2014 amounted to –EUR 0.6 billion, down from EUR 1.1 billion a year before. The consolidated return on (average) assets (RoA) is expected to amount to –0.1% in 2014. Even adjusted for the losses of Hypo Alpe Adria, the Austrian banking system is expected to deliver only a balanced profitandloss performance in 2014.
In the first half of 2014, Austrian banks’ underlying operating income, including numerous oneoff effects, was 3.1% below the corresponding 2013 figure. Interest income, which accounted for more than half of operating income, declined by 2.2%, while trading income increased but did not offset the decrease in other income components. Despite a reduction in personnel and administrative costs, operating costs increased by 12.6% due to rising depreciations and higher other costs.
The capital position of Austrian banks
must be strengthened
further
Austrian banks’ profitability affected
by weak operating environment
3 See “Austrian Banks in the Comprehensive Assessment” in the Special Topics section of this Financial Stability Report.
EUR billion
20
15
10
5
0
–5
–10
–15
–202008
Operating Income and Credit Risk Costs of Austrian Banks
Chart 18
Source: OeNB.
Note: Consolidated data. 1 Nonannualized data and therefore not comparable to year-end figures.
Operating income (before risk) Credit risk costs
2009 2010 2011 2012 2013 H1 121 H1 131 H1 141

Austrian Financial Intermediaries: Challenging Environment Calls for Further Efforts
FINANCIAL STABILITY REPORT 28 – DECEMBER 2014 41
Provisions to cover credit risks in the loan portfolios amounted to EUR 2.6 billion or 91% of total operating profit on a consolidated level in the first six months of 2014. This amount is approximately 19.8% lower than in the first half of 2013, but this decrease did not outweigh the decline in operating profit and, thus, remains a substantial drag on overall profitability. Also, Austrian banks did not substantially improve their operating efficiency, as the costtoincome ratio weakened further to 77.7% in June 2014 (end2013: 73.0%). Therefore, efficiencyenhancing programs need to be pursued.
Profitability in the domestic business of Austrian banks has slightly recovered. After declining for several years, operating income increased in the first three quarters of 2014 by 6.7% year on year. This increase was driven by a strong rise in securities and investment earnings thanks to a favorable market environment. Furthermore, the interest margin improved slightly (both for the whole sector and for small and locally active banks), benefiting from low deposit rates and the repricing of loans. Nevertheless, the interest margin in Austria is still below the European average. Subdued new lending also resulted in stagnating fee income.
Operating expenses continued to grow compared to September 2013: Personnel expenses and other administrative costs increased in the domestic business by 9.0% and 3.4%, respectively. This points to rigid cost structures that negatively affect profitability, while the market remains very competitive due to its high concentration. While in the first nine months of 2014 the number of credit institutions was reduced by 24 year on year, the decentralized sectors with their large number of local branches and staff (relative
to population size) still play a prominent role. Given the described profitability pressures, the ongoing process of restructuring and redimensioning of cost structures is likely to continue.
Furthermore, the Austrian banking system should prepare for the envisaged reduction/removal of implicit government guarantees in the EU (due to the implementation of the EU Bank Recovery and Resolution Directive), which is likely to lead to rating downgrades and increasing funding costs as well as a potential systemic spread shock unless banks increase their capitalization. The refinancing advantage resulting from this implicit guarantee is estimated to have amounted to between 25% and 40% of Austrian bank profits over the period from 2006 to 2013.
The operating profit on an unconsolidated level rose by 7.9% year on year in the first three quarters of 2014, and the expected (annualized) net risk costs decreased by nearly 15% to a share of 57% of operating profit. Despite this, tight competition in the domestic market, structural weaknesses and the still low interest margin are set to remain a particular concern for a large number of banks. Based on figures of September 2014, Austrian banks expect net profits of around EUR 1.1 billion in 2014 in the domestic market. This would correspond to an RoA of approximately 0.1%. But downside risks remain, as adverse developments continued to weigh on the business environment in late 2014.
Overall, the low profitability of the Austrian market used to be an incentive for international expansion in the past; now it is rather seen as a longterm structural risk for the banking sector. Not least because of Austrian banks’ foreign exposure, the size of the sector is relatively large, with total assets of 350% of Austrian GDP. In addition,
Domestic market recovers slightly in the first half of 2014

Austrian Financial Intermediaries: Challenging Environment Calls for Further Efforts
42 OESTERREICHISCHE NATIONALBANK
the number of banks is significantly higher in Austria than in other European countries (see chart 19), and Austrian banks’ dominant intermediation role makes the real economy vulnerable to negative shocks emanating from the banking sector.
Most small open economies with banking sectors of a comparable size (the Netherlands, Sweden and Switzerland) have launched macroprudential
measures to address similar systemic issues as those seen in Austria: a large banking sector relative to GDP that is dominated by a few very large and complex banking groups with a substantial foreign exposure, also in countries outside the Single Supervisory Mechanism (SSM) regime. At the center of these macroprudential policies are capital buffers that go well beyond the minimum levels required under the EU Capital Requirements Regulation.
The Austrian banking sector’s foreign exposure is high, and twothirds of this exposure are concentrated in CESEE, with a heterogeneous distribution across the region. As a result, the Austrian banking sector has the largest share of emerging market exposure among advanced economies’ banking sectors.4 Higher profitability in this region has often been accompanied by heightened credit, geopolitical (e.g. Russia, Hungary and Ukraine) and exchange rate risks.
The aggregate net profit after tax of Austrian subsidiaries in CESEE came to EUR 1.0 billion in the first half of 2014, decreasing by more than onethird
Austrian banks’ net profits in CESEE fall
to EUR 1 billion in the first half of 2014
%
600
500
400
300
200
100
0UK1
Total Banking Assets to GDP
Chart 19
Source: ECB (data as of June 2014), Eurostat, SNB.1 Macroprudential measures have been implemented or scheduled for 2014.
Euro area average
CH1 CY1 NL1 SE1 ES AT FR BE1 DE GR IT1 HR1 CZ1 SI1 HU1 PL1 SK1 RO1
4 IMF (2014). Global Financial Stability Report. May.
EUR billion
4.5
3.5
2.5
1.5
0.5
–0.5
–1.52008
Net Profit after Tax of Austrian Subsidiaries in CESEE
Chart 20
Source: OeNB.1 Please note that half-year data are not comparable with year-end data.
RU CZ SK HRRO HU UA Other
RU
CZ
SK
2009 2010 2011 2012 2013 H1 131 H1 141

Austrian Financial Intermediaries: Challenging Environment Calls for Further Efforts
FINANCIAL STABILITY REPORT 28 – DECEMBER 2014 43
compared to the same period in the previous year.5 This is mostly attributable to higher provisioning of Austrian subsidiaries in Romania and Hungary, as well as to the economic slowdown in some CESEE countries. Losses incurred by subsidiaries in Ukraine widened in the first half of 2014. While these losses were more than compen
sated for by the relatively high profits stemming from subsidiaries in the Czech Republic, Russia, Turkey and Slovakia, the increasing concentration of high profits in just a few markets entails a concentration risk and highlights the need for a cautious and sustainable growth strategy in the region.
5 The total amount includes business in Turkey, whereas the growth rate does not.
Box 3
Financial and Economic Ties with Russia and the Effects of the Sanctions
In response to Russia’s annexation of Crimea and deliberate destabilization of a neighboring sovereign country, the EU has imposed restrictive measures against Russia in several steps. These sanctions include:
− diplomatic measures against Russia − restrictive measures against individual persons and entities − restrictions for Crimea and Sevastopol − economic sanctions such as:
• financial restrictions with regard to credit provision to major state-owned Russian banks • trade embargo on arms and related materials • export embargo on dual-use goods and technology for military use and certain energy-
related equipment and technologyRussia retaliated with a trade embargo against agricultural products from the EU. Austria, which has long-standing economic ties with Russia, is affected in various ways:
− In 2013, Russia was Austria’s 10th most important trading partner for goods, with a share of 2.8% in total Austrian goods exports (source: Statistics Austria) and its 11th most import-ant trading partner for services exports, with a share of 2.3% in total services exports (source: balance of payments statistics). Exports of machinery and transport equipment accounted for more than 41% and chemical products and other manufactured products for 52% of total goods exports from Austria to Russia. Regarding all potential export goods on the embargo list, the maximum loss is estimated to total EUR 478 million.
− Austria is also affected by Russia’s countersanctions: According to first estimates, the max-imum loss caused by a one-year embargo against food products could amount to around EUR 50 million.
Restrictions on Russia’s access to EU capital markets have been tightened. EU nationals and companies may no longer provide loans to five major Russian state-owned banks. Also, trade in new bonds, equity or similar financial instruments with a maturity exceeding 30 days, issued by said banks, has been prohibited. The same restrictions have been imposed on three major Russian defense companies and three major energy companies. Providing services re-lated to the issuing of the above financial instruments (e.g. brokering) is also barred by the prohibition. However, EU subsidiaries of Russian state-owned banks are not covered by the restrictions.
Although profits stemming from Austrian subsidiaries in Russia were still substantial, they decreased by 19% year on year in the first half of 2014. The geopolitical tensions and imposed sanctions as well as the depreciation of the Russian ruble have underlined the fragility of the earnings situation in Russia. A further slowdown in economic growth, decreased lending growth as well as weaker credit quality and thus lower profitability are amongst the greatest risks for banks operating in the country.

Austrian Financial Intermediaries: Challenging Environment Calls for Further Efforts
44 OESTERREICHISCHE NATIONALBANK
Positive but Divergent Credit Growth in AustriaIn September 2014, the outstanding amount of bank loans to nonbanks in Austria amounted to EUR 331 billion, having grown by 0.5% year on year. While bank lending to households and corporates continued to increase, loans to government and nonbank financial intermediaries continued to decline. Austrian banks granted new loans to domestic households amounting to approximately EUR 15 billion in the first nine months of 2014, which is the highest volume since 2009,6 with loans for housing purposes being the main driver. New loans to nonfinan cial corporations amounted to around EUR 54 billion in the same period.7
Austrian supervisory initiatives targeted at curbing foreign currency lending8 continue to fulfill their purpose: As of September 2014, the outstanding stock of foreign currency loans granted to Austrian nonbank borrowers had declined by 11% on a yearly basis (adjusted for exchange rate effects). Foreign currency loans taken out by domestic households and nonfinancial corporations had fallen by 11% and 14%, respectively.
The focus of the supervisory initiatives is on foreign currency loans taken out by households, which are deemed to be the most vulnerable borrower group. The outstanding stock of their foreign currency loans was EUR 26.7 billion at the end of September 2014, which is markedly below the alltime high of EUR 42 billion registered in July 2011. The share of foreign currency loans in total loans to households came to nearly 19% and will decline further, as foreign currency lending continues to be
of marginal relevance in banks’ new business; in the second quarter of 2014, only 1% of newly granted loans to households were denominated in a foreign currency.
While the volume of domestic foreign currency loans is slowly declining, the legacy of loans extended in the past continues to constitute a risk to financial stability in Austria. As of June 2014, approximately 80% of outstanding foreign currency loans were set to mature in 2019 or later, representing significant redemption risks to Austrian banks, as more than threequarters of foreign currency loans in Austria are bullet loans linked to a repayment vehicle. Besides the risk that the foreign currency appreciates against the euro, these loans and their borrowers are also vulnerable to adverse capital market developments reducing the value of the repayment vehicle.
Further Deterioration in Credit Quality
European banks have recently seen divergent asset quality trends; a deterioration was mostly recorded by euro area banks in countries that had witnessed sovereign stress over the past few years. But asset quality has also continued to be a challenge for Austrian banks, given that the loan quality of the Austrian banking system deteriorated further in the first half of 2014.
Compared to the end of 2013, both the nonperforming loan (NPL) ratio and the loan loss provision ratio (LLP) increased, albeit at a slower pace than in the past few years. In June 2014, the consolidated NPL ratio was 8.9% and the LLP ratio 4.9%, with the quality of
New lending to Austrian households
reaches EUR 15 billion in the first nine months of
2014, foreign currency lending
declines
6 Figures have been available only since 2009.7 Only loans denominated in euro are included. For more details on new lending in Austria, see
http://oenb.at/isaweb/report.do?lang=DE&report=1.5.51.8 http://www.fma.gv.at/en/legal-framework/minimum-standards/banks.html.

Austrian Financial Intermediaries: Challenging Environment Calls for Further Efforts
FINANCIAL STABILITY REPORT 28 – DECEMBER 2014 45
retail loans being slightly higher than the quality of corporate loans. The coverage ratio of Austrian banks was 54.7%, slightly lower than in 2013, as NPLs grew faster than banks’ provisioning.
Driven by the economic slowdown and issues with the workout of nonperforming loans in CESEE, the NPL ratio of Austrian banks is still markedly above the European average, as Western European banks have been better able to streamline their loan portfolios. A key concern is now that a growing NPL problem could become a drag on economic growth in certain CESEE markets, as NPL resolution has proceeded at too slow a pace so far, despite efforts by banks and the official sector. A long list of legal, judicial, tax and regulatory obstacles is holding up NPL resolution; what is needed is a proactive and cooperative approach to deal with the NPL problem to strengthen the foundation for future economic growth.
Efforts to address these issues come from the Vienna Initiative 2.9
Nonperforming Loans in CESEE Still Rising in Several Countries
Loans provided by Austria’s top six credit institutions’ subsidiaries in CESEE had increased by 0.8% year on year by mid2014. However, there were major differences in loan growth by country: While exposure toward Ukraine contracted markedly due to the planned sale of a subsidiary of a major Austrian bank, exposure toward core markets increased. Doubledigit growth rates in loan volumes were observed in Russia and Turkey (12.1% and 15.4% year on year, respectively), raising concerns about the sustainability of these activities. On the other hand, Austrian subsidiaries’ loan volume decreased in Romania (–7.4%), Hungary (–8.2%) and Slovenia (–6.2%) in the first half of 2014.
NPL ratios of Austrian banking groups above European average
Ratio for the consolidated nonbank loan portfolio in % Ratio for the consolidated nonbank loan portfolio in %
10
9
8
7
6
5
4
3
2
1
0
57
56
55
54
53
52
51
50
49
48
472009
Loan Quality in the Austrian Banking System
Chart 21
Source: OeNB.
Nonperforming loan ratio (left-hand scale) Loan loss provision ratio (left-hand scale) Coverage ratio (right-hand scale)
2010 2011 2012 2013 Q2 14
9 http://vienna-initiative.com/wp-content/uploads/2014/10/NPL-Press-Release.pdf.

Austrian Financial Intermediaries: Challenging Environment Calls for Further Efforts
46 OESTERREICHISCHE NATIONALBANK
The share of loans to households in the overall loan portfolio of Austria’s CESEE subsidiaries has continued its upward trend over the past three years, amounting to 42.2% in mid2014 compared to 38.7% in mid2013. On the other hand, the share of loans to nonfinancial corporations continued to fall and stood at 57.8% at mid2014.
The various supervisory initiatives targeted at curbing loans denominated in foreign currency can be considered to be effective, with these loans having declined by 6% year on year by mid2014 while the overall loan volume increased over the same time period. Consequently, the aggregate share of foreign currency loans in total loans fell to 41.6% at mid2014 compared to 44.7% one year earlier. Overall, the euro remains the predominant foreign currency in the loan portfolio of Austria’s subsidiaries in CESEE.
Turning to nonperforming loans, the NPL ratio of Austrian bank’s subsidiaries in CESEE improved slightly to 13.9% at mid2014 (14.5% at mid2013). Similarly, the NPL ratio of foreign currency loans also decreased and stood at 19% at mid2014 (19.0% at mid2013). This decrease of the NPL ratio is mainly attributable to a reduction of NPLs in Ukraine due to the planned sale of a subsidiary as well as the sale of an NPL portfolio of a single bank to external investors in Romania. However, the overall crosscountry differences in NPL ratios remain high. While ratios remained below or close to 5% in some of the most important host countries of Austrian banks (e.g. the Czech Republic, Slovakia and Russia), NPL ratios in other countries were close to or even above 25% (e.g. Croatia, Hungary, Romania, Slovenia). The shares of restructured loans and renegotiated loans stood at 7.1% and 3.6%, respectively (June 2014), both slightly higher compared to last year.
Generally, the coverage of nonperforming loans with provisions and collateral has improved significantly in recent years. The NPL coverage ratio I (ratio of loan loss provisions for NPLs to NPLs) increased from 49.1% at mid2013 to 54.3% at mid2014. For loans denominated in foreign currency, this ratio improved even more – from 44.3% to 51.3% – during the same time period. The NPL coverage ratio II, which also includes eligible collateral for NPLs according to Basel II, is substantially higher, mainly due to a high share of mortgage loans. It improved from 68.6% at mid2013 to 71.7% at mid2014; the respective figures for the foreign currency loan portfolio are 66.6% and 68.6%.
The leasing portfolio of major Austrian banks in CESEE increased by 1.2% to EUR 12.7 billion in the first half of 2014. The overall diminishing leasing activities in CESEE have been counterbalanced by increases in exposure due to the incorporation of several leasing companies in CESEE. Still, the leasing exposure denominated in foreign currency declined by 2.6% to EUR 5.3 billion in the first half of 2014. Measures taken by Austrian banks to improve the overall quality of the leasing exposure are reflected by a decreasing ratio of nonperforming leasing contracts, which was 20% at mid2014. The quality of the leasing exposure denominated in foreign currency improved even more (21.4% nonperforming leasing contracts compared to 35.1% one year earlier).
Sound Liquidity Situation
The macroprudential assessment of the liquidity situation of the Austrian banking system is based on the stress test embedded in the Austrian liquidity reporting framework (with a time horizon of three months, beginning on
Coverage of NPLs in CESEE improves

Austrian Financial Intermediaries: Challenging Environment Calls for Further Efforts
FINANCIAL STABILITY REPORT 28 – DECEMBER 2014 47
Box 4
Banks’ Business Models in CESEE: The Importance of Funds Transfer Pricing and the Loan-to-Local Stable Funding Ratio
From a financial stability perspective, the relevant guidelines1 issued by the Committee of European Banking Supervisors (CEBS; today: the European Banking Authority – EBA) highlight that adequate funds transfer pricing (FTP) improves the pricing process for products, helps performance measure-ment and serves to align the risk-taking incentives of individual business lines with the liquidity risk exposures and associated costs their activities create for the bank as a whole. Product pricing and approval should therefore take into account FTP. Selling only fairly (i.e. risk-adequately) priced products contributes to the long-term sustainability of an institution, given that a scarce resource (liquidity) needs to be priced correctly to avoid subsidizing inefficient business lines or products or contributing to the buildup of credit bubbles via cheap foreign funding. According to the principle-based CEBS/EBA guidelines, which provide high-level guidance, FTP needs to capture two components: First, the costs of raising funds and the interest rate curve cost component (direct costs of funding), and second, indirect liquidity costs broken down into: (1) the mismatch liquidity cost, for which, the liquidity tenor is relevant (i.e. corresponding maturities); (2) the cost of contingent liquidity risk; and (3) other categories of liquidity risk exposure that an institution may have (e.g. country risk cost that may arise for institutions where balance sheets in non-fungible currencies are being funded). Ultimately, “internal prices should be aligned with wholesale market transaction prices where available,” which underlines the fact that FTP should not be used to cross-subsidize activities, but that intragroup transactions should be priced at arm’s length.
The Austrian “Sustainability Package”2 stipulates that, besides the stock and flow loan-to-local stable funding ratios (LLSFRs), the risk-adequate pricing of intragroup liquidity transfers to subsidiaries be monitored.
The LLSFR measure was introduced based on the Austrian supervisors’ experience that banking subsidiaries which entered the financial crisis with high LLSFRs were significantly more likely to exhibit higher loan loss provisioning rates than other subsidiaries that followed a more conservative business and growth model. The volume of intragroup liquidity transfers to subsidiaries is analyzed to assess the dependency of foreign subsidiaries on parent bank funding, whereas the applied funds transfer prices (charged by the parent and paid by the subsidiary) serve to judge the adequacy of banks’ internal liquidity pricing models.
As of the second quarter of 2014, the monitoring results show that the refinancing situation of only two (out of 34 monitored) foreign banking subsidiaries is currently to be considered unsustainable with regard to the provisions of the Sustainability Package (although a final assessment can only be made with year-end data). This means that these two subsidiaries had a stock LLSFR above the early warning threshold of 110% and an elevated flow LLSFR over the past twelve months. Another three subsidiaries exhibited an elevated stock LLSFR, but a positive development in their new business. Data also show that the volume of liquidity transfers to CESEE subsidiaries was substantially reduced over the course of the financial crisis, which reflects the increased importance of local funding sources. This is a welcome indicator of subsidiaries’ reduced liquidity dependence.3
The OeNB also analyzes the internal FTP basis curve and the spread, which add up to the intragroup funding cost at the subsidiary level. The basis curve represents the price paid by the parent bank for funding itself on the market (i.e. a market benchmark adjusted for the institution’s credit risk); it is reported for major currencies and maturities. The spread inter alia includes the cost of managing l iquidity, country risk premiums and/or the creditworthiness and liquidity position of each individual subsidiary.
1 CEBS. 2010. Guidelines on Liquidity Cost Benefit Allocation. For more details, refer to: https://www.eba.europa.eu/documents/10180/16094/cebs18_Guidelines.pdf.
2 FMA and OeNB. 2012. Supervisory guidance on the strengthening of the sustainability of the business models of large internationally active Austrian banks. For more details, refer to: http://www.oenb.at/en/Financial-Stability/System-ic-Risk-Analysis/Sustainability-of-Large-Austrian-Banks--Business-Models.html.
3 The sustainability monitoring also includes data on the volume of liquidity transfers from subsidiaries to their respective parent banks, which provides a netted exposure perspective for each maturity.

Austrian Financial Intermediaries: Challenging Environment Calls for Further Efforts
48 OESTERREICHISCHE NATIONALBANK
October 3). The scenario used stipulates the following mild market deterioration: Unsecured interbank markets and foreign exchange swap markets dry up completely; banks can only roll over twothirds of their maturing shortterm and longterm issuances; wholesale deposits of nonbank financials and nonbank corporates decrease by almost 6%. Haircuts in the counterbalancing capacity reflect conservative, but not individually stressed values based on banks’ reported haircuts.
This mild market deterioration scenario yields the following results: The Austrian banking system’s cumulated net funding gap across all currencies would amount to –EUR 9.9 billion. After covering this gap, the cumulated counterbalancing capacity would stand at EUR 130 billion. The cumulated counterbalancing capacities in U.S. dollars and Swiss francs are well in positive terrain and would amount to EUR 6.3 billion and EUR 2.8 billion, respectively. The liquidity riskbearing capacity of the Austrian banking system
is therefore solid relative to its liquidity risk exposure.
Compared to the end of May 2014 (the cutoff date for Financial Stability Report 27), the counterbalancing capacity (maturities up to three months without money market operations and foreign exchange swaps, aggregated across all currencies) increased further from EUR 124 billion to EUR 130 billion (+5%). Relative to October 2013, the increase even amounts to 16%. Deposit inflows continue to outpace loan growth, which has remained weak.
Challenging Environment for Austrian Insurance Sector
The sustained low interest rate environment remains the key risk for the Austrian insurance sector, especially for life insurance companies offering guaranteed interest rates. Low profitability that has induced a search for yield, the potential reemergence of the sovereign debt crisis and close ties to the banking sector via investments in
Strong deposit inflows outpace
weak loan demand
%
7
6
5
4
3
2
1
0
–1
–2Q1
Annual Growth Rates in Austrian Banks’ Domestic Business with Households and Corporations
Chart 22
Source: OeNB.
Deposits Loans
Q2 Q32009
Q4 Q1 Q2 Q32010
Q4 Q1 Q2 Q32011
Q4 Q1 Q2 Q32012
Q4 Q1 Q2 Q3 Q32013
Q4 Q1 Q22014

Austrian Financial Intermediaries: Challenging Environment Calls for Further Efforts
FINANCIAL STABILITY REPORT 28 – DECEMBER 2014 49
bank securities are additional sources of risks to the sector.
Austrian insurance companies still generated investment earnings of about 4% in the first half of 2014, but an increased reinvestment risk can be observed, as assets with a duration similar to that of the related liabilities are typically not available in a low interest rate environment. Insurers need to adjust to these challenging conditions and reconsider their investment strategies. From a macroprudential perspective, it is crucial to monitor investment portfolios to detect a potential shift to riskier assets at an early stage.
The Austrian insurance sector invests primarily in the bond market (more than 64%, with the share for the life insurance sector being even 77% in the second quarter of 2014), while the remaining assets are invested in equity interests, real estate and stocks (about
3.5%). Because of this strong dependency on bond yields, the prevailing low interest environment is extremely challenging for insurance undertakings.10 On the other hand, a sudden interest rate rise would hit the insurance sector through a decrease of market values in their bond portfolio and a potential increase in lapses of life insurance policies, the holders of which may be attracted by higher yields offered by alternative investment opportunities. From a geographic perspective, CESEE has been the key growth market not only for Austrian banks, but also for Austrian insurance companies, as these new markets have offered higher margins and growth in developed economies has been subdued. Currently, Austrian insurance companies are active in 22 countries of the region, which accounted for about EUR 7 billion in premium income in 2013 (compared
Low profitability fuels search for yield
10 Austrian and European supervisors have already responded to the risk of a prolonged period of low interest rates: At the national level, the FMA introduced additional requirements to increase provisioning over the next ten years, depending on the individual company’s (stock) guaranteed interest rate and a benchmark interest rate. At the European level, the European Insurance and Occupational Pensions Authority (EIOPA) included scenarios of a prolonged period of low interest rates in its 2014 insurance stress test.
Local market size in terms of premium income in EUR billion
16
14
12
10
8
6
4
2
00 5 10 15 20 25 30 35 40 45 50Market share of Austrian subsidiaries in %
Exposure of Austrian Insurance Groups in CESEE
Chart 23
Source: SwissRe, FMA, Datastream.
Note: Figures in parentheses denote premium income of Austrian subsidaries in EUR billion.
Ø Sovereign 5-year CDS spread up to 100 Ø Sovereign 5-year CDS spread up to 200Ø Sovereign 5-year CDS spread up to 350 Ø Sovereign 5-year CDS spread > 350 No CDS spread available
BG (0.2)
RS (0.2)
CZ (2.5)
HR (0.2)
HU (0.3)
PL (1.4)
RO (0.5)
SI (0.1)
SK (0.9)
UA (0.2)

Austrian Financial Intermediaries: Challenging Environment Calls for Further Efforts
50 OESTERREICHISCHE NATIONALBANK
to EUR 16.6 billion in the domestic Austrian market). The most important host markets are the Czech Republic and Slovakia, where Austrian insurance companies hold market shares of more than 40% (see chart 23). However, in emerging markets, insurers are exposed to higher legal, political and market risks; also, the financial crisis has slowed down the growth of insurance penetration in the region, while growth prospects are limited in the current macroeconomic environment. Nevertheless, Austrian insurers’ CESEE exposure is still profitable, especially when compared to the domestic business.
From a regulatory point of view, the biggest challenge for the European insurance sector is the preparation for Solvency II. Also, Austrian insurance undertakings and groups are currently finalizing the forwardlooking assessment of their own risks (ORSA), which they have to submit for the first time to the FMA by the beginning of 2015.
The European Insurance and Occupational Pensions Authority (EIOPA)
ran a stress test in 2014 with the aim of testing the resilience of insurers regarding market risk under a combination of historical and hypothetical scenarios. Additionally, insurance risk was tested, with EIOPA having included a lowyield element in the exercise.
In April 2014, the European Parliament adopted UCITS V, focusing on a clarification of the depositary duties and liabilities and a review of remuneration practices, with the objective of aligning the interests of UCITS managers with the longterm interests of investors as well as harmonizing and strengthening sanctioning regimes.
In Austria, the fund industry prepared for the implementation of the Alternative Investment Fund Managers (AIFM) Directive, which for the first time subjects institutional funds, hedge funds and private equity funds to a common European regulatory framework. Most of the licensing and registrations of AIFMs in Austria was completed in 2014.
The net asset value of Austrian mutual funds reached EUR 156 billion in the second quarter of 2014 (+5.6%
Solvency II starts in 2016
New regulatory framework for mutual funds:
European Parlia-ment adopts
UCITS V
Managed net asset value grows but remains below precrisis levels
% %
Return on Assets of Austrian Insurance Companies Premium Growth Rates of Austrian Insurance Companies in CESEE and Austria from 2007 to 2013
3.0
2.5
2.0
1.5
1.0
0.5
0.0
25
20
15
10
5
0
–5
–102006
Austrian Insurance Companies: Return on Assets and Premiums
Chart 24
Source: FMA.
AT CESEE AT subsidaries in CESEE AT
2007 2008 2009 2010 2011 2012 2013 2007 2008 2009 2010 2011 2012 2013

Austrian Financial Intermediaries: Challenging Environment Calls for Further Efforts
FINANCIAL STABILITY REPORT 28 – DECEMBER 2014 51
year on year), but is still below its precrisis level of EUR 170 billion of early 2007. Growth has been driven by equity funds (+14%), mixed funds (+12%) and real estate funds (+17%). The share of specialized funds (owned by institutional investors) is still growing, accounting for about 45% of the total net asset value in mid2014. The overall investment performance of funds was moderate in 2013 (2.7% return on investment), with equity funds being the main positive driver (5%), while bond funds only yielded 2.3%. The main challenges for the Austrian fund industry are ongoing uncertainty in financial markets and the lack of retail investors’ confidence.
OeNB Assessment and RecommendationsEurope still feels the impact of the financial and sovereign debt crisis. The “new normal” with low economic and credit growth as well as loose monetary policies and low inflation rates remains a formidable challenge for the European banking sector and its profitability. Austrian banks are facing headwinds on several fronts: On the cyclical front, credit growth remains weak and credit quality continues to deteriorate. This resulted in a loss in the first half of 2014 for the banking sector as a whole, thereby extending the negative trend started in 2013. The current geopolitical tensions in Ukraine and the financial sanctions affecting Russia, while not having had a sizeable impact on Austrian banks yet, add to the uncertain outlook.
Regarding structural risks, banks are still confronted with many issues raised in previous editions of the OeNB Financial Stability Report, including low profitability, high costincome ratios, reliance on earnings generated in only a few foreign markets and comparatively low capitalization. The OeNB therefore recommends the following action:
– Banks should continue strengthening their capital levels.
– After the Asset Quality Review by the ECB, riskadequate provisioning and coverage policies should be further pursued by banks to deal with credit quality issues, especially in CESEE.
– Given persistent pressure on profitability, banks should continue to address structural issues and proactively improve their cost efficiency.
– Banks should continue fulfilling supervisory minimum standards relating to foreign currency loans and loans with repayment vehicles.
– Banks should strive for sustainable loantolocal stable funding ratios at the subsidiary level and for riskadequate pricing of intragroup liquidity transfers.
– Banks and insurance undertakings should ensure high standards of risk management so that risks are properly addressed and effectively controlled; they should also proactively prepare for contingency situations.
– Insurance undertakings should continue to prepare for Solvency II.


Special Topics

54 OESTERREICHISCHE NATIONALBANK
2014 was a historical year for banking supervision in the euro area and in Austria. After an assessment of the European banking system of an unprecedented scale known as the comprehensive assessment, the Single Supervisory Mechanism (SSM) entered into force in November, with the ECB taking over supervisory responsibility for 120 significant institutions, including 8 Austrian banks.2 This short article gives an overview of the results of the comprehensive assessment (CA) of the participating Austrian banks and compares them to those of other European banks.
The comprehensive assessment consisted of an asset quality review (AQR) and a stress test. The AQR was based on banks’ end2013 balance sheets and took an indepth look at their loan books, including an assessment at the individual credit file level. The stress test, as the second component of the exercise, was forwardlooking and assessed the banks’ ability to withstand hypothetical adverse conditions in the years 2014 to 2016. To reach a consistent view, the AQR findings were integrated into the stress test and thus made the final results more conservative than those of previous European stress tests. The exercise was truly European in the sense that it was based on common scenarios and methodologies for all banks combined with
an indepth quality assurance process under the aegis of the ECB for all 130 participating banks in 19 countries.3 This process was strongly supported by the national central banks and supervisory authorities.
The results of the comprehensive assess-ment were published on October 26, 2014. The widely reported headline result was an aggregate capital shortfall of EUR 24.6 billion across 25 banks, including one Austrian bank (Volksbanken Verbund) with a capital shortfall of EUR 865 million. After deducting capital measures taken during 2014, the net capital shortfall that remained at the euro area level was EUR 9.5 billion. The affected banks were requested to submit capital plans and take measures in order to cover the identified capital shortfalls within six to nine months.4 The capital plan submitted by Volksbanken Verbund is currently being assessed by the Joint Supervisory Team under the lead of the ECB as the new supervisory authority. Apart from Volksbanken Verbund, the other five Austrian banks passed the CA without capital shortfalls.5
Beyond the headline figures, the gra-nular CA results provide a useful basis for comparisons between Austrian and other European banks. The waterfall charts 1 and 2 illustrate the main drivers of the
Maximilian Fandl, Robert Ferstl1
Austrian Banks in the Comprehensive Assessment
1 Oesterreichische Nationalbank, Supervision Policy, Regulation and Strategy Division, [email protected] and [email protected]
2 The six Austrian banks in the assessment were BAWAG PSK, Erste Group Bank, Raiffeisen Zentralbank Österreich, Raiffeisenlandesbank Niederösterreich-Wien, Raiffeisenlandesbank Oberöstereich and Volksbanken Verbund. The two other Austrian SSM banks, Sberbank Europe and VTB Bank, were classified as significant institutions in September 2014 due to their cross-border activities but were not included in the comprehensive assessment sample. UniCredit Bank Austria was assessed as part of the Italian-based UniCredit group.
3 The euro area and Lithuania, which will join the euro area in 2015. The vast majority of the 130 participating banks in the CA were classified as significant credit institutions in September 2014 and have thus been under direct supervision of the ECB since November 2014.
4 Nine months if the capital shortfall arose under the adverse scenario.5 The ECB and the EBA published the individual bank results of the CA on their websites.

Austrian Banks in the Comprehensive Assessment
FINANCIAL STABILITY REPORT 28 – DECEMBER 2014 55
AQRadjusted results in the adverse scenario for Austrian banks compared to the euro area average.
The waterfall charts should be read from top to bottom. The first blue column indicates the starting common equity tier 1 (CET1) ratio at end2013, followed by the AQR impact (orange column in percentage points) that adjusts the starting point for the stress test downward (second blue column). The subsequent red and green columns illustrate the main drivers of the stress test. The most important ones are operating income excluding the costoffunding and market risk shock (OpInc (excl. CoF, MR)), the costoffunding shock (Delta NII) and credit risk costs (CR costs). The third blue column (CET1R YE16 (phase-in)) shows the CET1 ratio in the adverse scenario at end2016 (postAQR and joinup effects). This column represents the final CA stress test result that is used to determine capital shortfalls in the adverse scenario if the ratio of the individual bank falls below 5.5%. The final adverse CET1 ratio is different from the socalled “fully loaded” Basel III CET1 ratio. While the former only includes Basel III phasein effects (i.e. changes in the CET1 capital definition) from 2014 to 2016 (B3 phase-in (<=2016)), the latter also incorporates Basel III phasein effects after 2016 (B3 phase-in (>2016)). The adverse fully loaded Basel III CET1 ratio is disclosed as a memorandum item in the last column of charts 1 and 2.6
This relative analysis yields the follo-wing main observations:• The starting CET1 ratio of the Aus
trian banks stood slightly below the
euro area average, driven by the belowaverage CET1 ratios of the two large Austrian banks.
• The AQR impact was more than twice as high for Austrian banks (91 basis points) than for the euro area average (41 basis points), mainly driven by CESEE portfolios with elevated risk profiles, in particular in Hungary and Romania. This observation is in line with the euro areawide result that AQR findings tended to be higher in countries with on average riskier portfolios (e.g. in the euro area periphery or in CESEE). For the overall exercise it should be noted, however, that the total impact was driven by the stress test rather than by the AQR.
• The development of the profit and loss components in the stress test results for the Austrian banks is broadly comparable to the euro area average (see charts 1 and 2). Austrian banks were on average more affected by the costoffunding shock, credit risk costs and Basel III phasein effects after 2016 than the euro area average. As mentioned above, the latter are included as information items and are not considered in the determination of the capital shortfall.
• Austrian banks also show higher operating profits than the euro area average, which mainly reflect their significant CESEE operations. Furthermore, Austrian banks are less affected by the increase in riskweighted assets (RWAs) than the euro area average, which is partly due to less reliance on internal ratings in their RWA determination.
6 The reported Basel III phase-in effects for Austria still include the participation capital of BAWAG PSK and Raiffeisen Zentralbank Österreich that was repaid in the first half of 2014. Participation capital is not eligible as CET1 capital under the fully loaded Basel III definition.

Austrian Banks in the Comprehensive Assessment
56 OESTERREICHISCHE NATIONALBANK
• Since the business profiles of the six participating Austrian banks are rather heterogeneous, it is also useful to analyze the main drivers at the individual bank level. In this comparison, the results of large Austrian banks with a CESEE focus were driven more by higher operating profits and credit risks costs, as were those of European peers with significant CESEE or other emerging market operations. Domestically focused Austrian banks were primarily affec
ted by weaker operating profits, mainly because they have lower net interest income and other income components but also partly because of idiosyncratic factors, such as the net trading income shock for BAWAG PSK. The only Austrian bank with a capital shortfall, Volksbanken Verbund, reported low results in all main drivers of the stress test and could not make much use of the exemption from the static balance sheet assumption, as it is significantly
%
CET1R YE13 (pre-AQR)
AQR impact
CET1R YE13 (post-AQR)
OpInc (excl. CoF, MR)
Delta NII (vs. 2013)
Delta NTI (vs. 2013)
CR costs
SOV risk (FV)
Other income
Div, minorities & tax
OCI (excl. SOV)
RWA
B3 Phase-in (<=2016)
Other effects
CET1R YE16 (phase-in)
B3 phase-in (>2016)
CET1R YE2016 (fully loaded)(memo item)2
0 1 2 3 4 5 6 7 8 9 10 11 12 13 14 15 16 17 18 19 20
Comprehensive Assessment – Austrian Banks in the Adverse Scenario1
Chart 1
Source: ECB, EBA, OeNB.1 All figures next to the bars are in percentage points of the CET1 ratio as of 2016 (adverse scenario).2 Fully loaded Basel III CET1 ratio including capital measues taken from January to September 2014: 6.25%.
Capital ratios AQR impact Positive P&L impactFully loaded capital ratioOther impact B3 (>2016) impact
Negative P&L impact
11.46
0.91
10.55
4.76
–2.01
–0.22
–5.29
–0.41
–0.03
–0.59
–0.36
–0.28
–0.04
–0.05
7.45
–2.08
5.37

Austrian Banks in the Comprehensive Assessment
FINANCIAL STABILITY REPORT 28 – DECEMBER 2014 57
ahead of its European Commissionapproved restructuring plan.7
It is important to note that the CA results are based on end-2013 balance sheets and do not take capital measures in 2014 into account. In interpreting the CA results, the capital measures and other developments during 2014 must thus be considered as well. In the case of the Aus
trian banks, this aspect is particularly relevant with respect to the capital increases and repayment of participation capital by two Austrian banks in the first half of 2014, which impact the results based on the fully loaded Basel III capital definition.8 Moreover, the interpretation of results must also take into account the methodology and
7 Under the static balance sheet assumption, the components of the banks’ balance sheets do not grow or decline during the stress horizon and the business mix remains unchanged. For banks under restructuring, such as Volks-banken Verbund, an exemption from the balance sheet assumption applies. These banks consider the European Commission-approved restructuring plans in the projection of balance sheets components.
8 BAWAG PSK and Raiffeisen Zentralbank Österreich.
%
CET1R YE13 (pre-AQR)
AQR impact
CET1R YE13 (post-AQR)
OpInc (excl. CoF, MR)
Delta NII (vs. 2013)
Delta NTI (vs. 2013)
CR costs
SOV risk (FV)
Other income
Div, minorities & tax
OCI (excl. SOV)
RWA
B3 Phase-in (<=2016)
Other effects
CET1R YE16 (phase-in)
B3 phase-in (>2016)
CET1R YE2016 (fully loaded)(memo item)
0 1 2 3 4 5 6 7 8 9 10 11 12 13 14 15 16 17 18 19 20
Comprehensive Assessment – Euro Area Banks in the Adverse Scenario (Weighted Average of the 130 Participating Banks)1
Chart 2
Source: ECB, EBA, OeNB.1 All figures next to the bars are in percentage points of the CET1 ratio as of 2016 (adverse scenario).
Capital ratios AQR impact Positive P&L impactFully loaded capital ratiosOther impact B3 (>2016) impact
Negative P&L impact
11.77
–0.41
11.36
3.61
–1.17
–0.17
–4.12
–0.35
0.28
0.24
–0.24
–0.85
–0.19
–0.03
8.37
–1.09
7.28

Austrian Banks in the Comprehensive Assessment
58 OESTERREICHISCHE NATIONALBANK
the scenarios. The recent changes in the macroeconomic outlook for the euro area are not incorporated, even though current growth forecasts are still considerably above the paths in the adverse scenario. Moreover, only intraEU exchange rate fluctuations are included in the stress test. Ukraine and Russia are subject to severe macroeconomic stress in the adverse scenario, but an outright escalation of political tensions in Ukraine is not taken into account. Lastly, as with any stress testing exercise, limits of scope have to be considered.
The OeNB actively supported the CA as an important step in promoting the trans-parency of banks’ balance sheets and in
fostering confidence in euro area banks. While the results show the improved resilience of Austrian banks under the simulated conditions of the adverse scenario, the results also indicate the need for most Austrian banks to further strengthen their earnings potential and capital positions, in particular with a view to the transition to Basel III. In this respect, the results of the CA support the OeNB’s ongoing analysis and longstanding policy stance – as reported in recent OeNB Financial Stability Reports – that Austrian banks need to take further action to continue increasing their CET1 ratios in the next few years.

FINANCIAL STABILITY REPORT 28 – DECEMBER 2014 59
After the recent financial and economic crisis, it is only a few markets in Central, Eastern and Southeastern Europe (CESEE) that continue to be substantial profit generators for Austrian banks, most of all Russia as well as the Czech Republic and Slovakia, where Austrian subsidiaries posted a return on assets (RoA) of 2.9% (Russia) and 1.2% (for each the Czech Republic and Slovakia) in 2013, which compares with an RoA of 0.8% for all CESEE subsidiaries of Austrian banks. As a result, Austria’s financial stability has become vulnerable to a deterioration in financial and economic conditions in these countries.2 This special topic study explores the reasons for Austrian subsidiaries’ sustained profitability in the Czech Republic and Slova
kia, especially when compared to other CESEE markets.3 Our analysis starts out with a look at the competitive and cost situation of banks in both countries to better understand the operating environment; subsequently, we turn to the sources of income and funding and carry out a peer group comparison of net interest margins before risk costs. The last facets discussed in this study are asset quality and coverage level, before we conclude with the lessons learned.
1 Competitive Environment and Cost Structures
Austrian banks were among the first Western banks entering the Czech and Slovak markets in the early 1990s. In 2013, their subsidiaries had total assets of
Austrian Subsidiaries’ Profitability in the Czech Republic and Slovakia – CESEE Margins with an Austrian Risk Profile
The Czech Republic and Slovakia belong to the small and increasingly concentrated group of countries in Central, Eastern and Southeastern Europe (CESEE) whose banking markets have continued to generate substantial profits for Austrian banks also after the outbreak of the financial crisis in 2008. This short study sheds light on why Austrian subsidiaries have been able to maintain their profitability in these two countries especially when compared to those in other CESEE countries. We find that the strong quality of their asset portfolios is the main contributing factor; also, the Czech and Slovak markets now offer net interest margins well above Austrian levels, while the credit risk level is close to that in Austria. By contrast, several other CESEE markets have recorded worsening credit quality and, consequently, dwindling returns. Despite some downside risks related to the low interest rate environment, the openness of the Czech and Slovak economies and a potential intensification in competition, it seems that, from a current perspective, Czech and Slovak subsidiaries can be considered the most stable earnings generators in Austrian banks’ international portfolio.
JEL classification: G21, G28, P34Keywords: Banking sector, Austrian banks, financial stability, profitability, risks, Czech Republic, Slovakia
Stefan Kavan, Daniela Widhalm1
1 Oesterreichische Nationalbank, Financial Stability and Macroprudential Supervision Division, [email protected] and [email protected].
2 Please refer to the section on CESEE profitability in this Financial Stability Report.3 For more information on Austrian banks in Russia, please refer to Wittenberger et al. (2014). Unless indicated
otherwise, the presented figures for the Czech Republic (CZ) and Slovakia (SK) are figures relating to Austrian subsidiaries. The peer group is composed of Austrian subsidiaries in 14 other CESEE countries: Albania (AL), Belarus (BY), Bosnia and Herzegovina (BA), Bulgaria (BG), Croatia (HR), Hungary (HU), Montenegro (ME), the former Yugoslav Republic of Macedonia (MK), Poland (PL), Romania (RO), Russia (RU), Serbia (RS), Slovenia (SI) and Ukraine (UA).

Austrian Subsidiaries’ Profitability in the Czech Republic and Slovakia – CESEE Margins with an Austrian Risk Profile
60 OESTERREICHISCHE NATIONALBANK
EUR 88.5 billion in these two countries. Both markets are dominated by foreign banks (see charts 1 and 2), with Austrian banks holding a share of more than onethird in the Czech Republic and close to onehalf in Slovakia. For the purpose of this study, the figures of the Czech and Slovak banking sector are often aggregated, as both markets share similar characteristics and UniCredit’s decision
to turn its Slovak subsidiary into a branch of its Czech subsidiary at the end of 2013 disrupted the time series.
In a regional comparison, the high degree of concentration in the Czech and Slovak banking sectors is evidenced by the comparatively large shares of the top five credit institutions in their banking system’s aggregate total assets (see chart 3). This can have a positive
% of total loans
Czech Republic: Bank Market Shares at End-2013
Chart 1
Source: RBI (2014), OeNB.
CS (Erste)
CSOB (KBC)KB (SocGen)
UniCredit
Raiffeisen BankGE MoneyPPF BankaJ&T BankaSberbank (Volksbank) Air BankOther
17.2
5.61.9
10.9
8.0
15.9
3.51.2
1.50.9
33.5
% of total assets
Slovakia: Bank Market Shares at End-2013
Chart 2
Source: RBI (2014), OeNB.
Slovenska Sporitelna (Erste)
VUB Banka (Intesa)
Tatra Banka (Raiffeisen)CSOB (KBC)
UniCredit Postova BankaPrima Banka (Penta)
Volksbank Slovensko (Sberbank) OTP Banka Other
20.7
6.9
15.7
2.919.0
9.3
5.5
3.42.3
14.2
% Number of inhabitants
80
70
60
50
40
30
20
10
0
400
350
300
250
200
150
100
50
0CZ
Market Concentration and Staff Levels
Chart 3
Source: ECB.
Shares of five largest credit institutions in sector’s total assets at end-2013 Inhabitants per employee at end-2013 (right-hand scale)
SK HR HU RO AT

Austrian Subsidiaries’ Profitability in the Czech Republic and Slovakia – CESEE Margins with an Austrian Risk Profile
FINANCIAL STABILITY REPORT 28 – DECEMBER 2014 61
effect on cost efficiency via economies of scale and tame competitive pressures, but may also be a barrier for new entrants. Also, staff levels seem relatively low, as the ratio of inhabitants to employees shows. Despite these favorable structural indicators, the cost income ratio of Czech and Slovak banks stood at 52% in 2013 and was rangebound over the last few years (48% to 52%), more or less on par with the ratio of their peers in other CESEE countries (see chart 4). Therefore, the operational cost structure of Austrian subsidiaries in the Czech Republic and Slovakia can be discarded in the search for the main determining factors of higher profitability.
2 Operating Income and the Importance of Net Interest Income
Net interest income accounted for around twothirds of operating income of Austrian subsidiaries in the Czech Republic
and Slovakia in 2013, while the share of fee income was around 25%. These two dominating sources of income remained fairly stable throughout the crisis (at around EUR 2.5 billion and EUR 1 billion, respectively) and their shares in operating income are similar at other Austrian CESEE subsidiaries (see chart 5). This is indicative of a traditional business model with deposit taking and lending at its core but cannot explain the differences in profitability compared with other CESEE countries.
For a closer analysis of profitability, we decompose net interest income into interestearning assets (for size and growth effects) and net interest margins earned before risk (relative profitability of these assets). Lastly, we look at the risk costs incurred (via provisioning).
2.1 Interest-Earning Assets The growth of interestearning assets can affect profitability in two ways: First, it raises the base on which to earn
%
54
53
52
51
50
49
48
47
46
45
44CZ & SK CESEE excl. CZ & SK
Cost-Income Ratio of Austrian Subsidiaries
Chart 4
Source: OeNB.
2009 2010 2011
2012 2013
%
100
90
80
70
60
50
40
30
20
10
02009
Breakdown of Austrian Subsidiaries’ Operating Income
Chart 5
Source: OeNB.
Net interest income Fee income Other
2010 2011 2012 2013 2009 2010 2011CZ & SK CESEE excl. CZ & SK
2012 2013

Austrian Subsidiaries’ Profitability in the Czech Republic and Slovakia – CESEE Margins with an Austrian Risk Profile
62 OESTERREICHISCHE NATIONALBANK
income, and second, it may (temporarily) improve asset quality by adding new nondefaulted assets to the existing stock. Both of these effects seem to have played a minor role for Austrian subsidiaries in the Czech Republic and Slovakia. Loans to nonbanks (59%) and debt (including government) securities (24%) dominate the balance sheet; their respective compound annual growth rates were moderate at 2% and 6% between end2008 and end2013 (see chart 6). Also, the apparent switch from loans to credit institutions to (government) debt securities should not have affected asset quality in any substantial way, given that both categories are generally assumed to have very low default probabilities.4
2.2 Net Interest Margin before RiskIn order to gain a regional perspective of the net interest margin (NIM) before risk of Austrian banks’ subsidiaries in the Czech Republic and Slovakia, we conduct a peer group analysis with Austrian subsidiaries in other countries (Croatia, Hungary and Romania; see chart 7). It shows that the prerisk NIM developed heterogeneously over recent years; in the Czech Republic and Slovakia it was broadly comparable to that in Croatia, while Austrian subsidiaries in Romania and Hungary earned substantially higher prerisk NIMs. Moreover, the prerisk NIM for the Czech Republic and Slovakia is below the average for all other Austrian CESEE subsidiaries. Again, this factor does not explain the
EUR billion
100
90
80
70
60
50
40
30
20
10
02009
Breakdown of Assets of Austrian Subsidiaries in the Czech Republic and Slovakia
Chart 6
Source: OeNB.
Loans to nonbanks Debt securities Loans to credit institutions Cash and central bank deposits Other
2010 2011 2012 2013
4 Please note that growth figures for the Czech Republic and Slovakia are distorted by several effects in 2013, which include, inter alia, the forced devaluation of the Czech crown (through an intervention by the Czech central bank in November 2013). In general, it can be said that there was no credit crunch in these countries during the financial crisis, but loan growth remained moderate due to weak domestic demand and a slow economic recovery.
%
5.0
4.5
4.0
3.5
3.0
2.5
2.0
1.5
1.0
0.5
0.0
Net Interest Margins of Austrian Subsidiaries
Chart 7
Source: OeNB.
Note: The net interest margin is calculated as net interest income over total assets.
CZ & SK CESEE excl. CZ & SKHR HURO AT (unconsolidated)
2009 2010 2011 2012 2013

Austrian Subsidiaries’ Profitability in the Czech Republic and Slovakia – CESEE Margins with an Austrian Risk Profile
FINANCIAL STABILITY REPORT 28 – DECEMBER 2014 63
relatively good profitability levels after risk in the Czech Republic and Slovakia. It does, however, provide a good explanation for the attractiveness of CESEE markets, when comparing their prerisk NIMs to those in the domestic Austrian market.
Given its crucial importance for the Czech and Slovak banks’ business model and their profitability, we analyze the NIM in more detail, with the rate paid on customer deposits and the rate earned on lending to nonbanks and the local government as the main drivers.
2.2.1 Rates Paid on Customer Deposits
The funding base5 of the Austrian subsidiaries in the Czech Republic and Slovakia is characterized by a high share of nonbank deposits (87% of total funding volume, compared with 70% for the rest of CESEE), while bank
deposits account for only 6% of the total funding base (compared with 25% for other CESEE subsidiaries). Hence, Czech and Slovak banking subsidiaries’ reliance on more volatile interbank (and often intragroup) funding is very low, while customer deposits are generally considered to be “sticky,” contributing to a more stable and locally funded refinancing structure. Concerning the pricing of customer deposits, Czech and Slovak banks have offered low rates over recent years in comparison to banks in Croatia, Hungary and Romania (see chart 8), influenced by the ECB’s and Ceská národní banka’s very accommodating monetary stance.
2.2.2 Rates Earned on Loans to Nonbanks
The portfolio of loans to the real economy of Austrian banks’ Czech and
5 This includes customer deposits, bank deposits, liabilities evidenced by paper and subordinated debt.
%
Households and Nonprofit Institutions Serving Households (New Business)
10
9
8
7
6
5
4
3
2
1
02010
MFI Interest Rates on Deposits of ...
%
Nonfinancial Corporations (New Business)
10
9
8
7
6
5
4
3
2
1
0
Chart 8
Source: ECB.
Note: MFI interest rate data type: annualized agreed rate (AAR) / narrowly defined effective rate (NDER); deposits with agreed maturity of up to one year at credit and other institutions (MFI except MMFs and central banks).
CZ (CZK) SK (EUR) HR (HRK) HU (HUF) RO (RON) AT (EUR) Euro area (changing composition)
2011 2012 2013 2014 2010 2011 2012 2013 2014

Austrian Subsidiaries’ Profitability in the Czech Republic and Slovakia – CESEE Margins with an Austrian Risk Profile
64 OESTERREICHISCHE NATIONALBANK
Slovak subsidiaries is evenly distributed between loans to households (49%) and corporate loans (51%), compared with the respective shares of 41% and 59% recorded for other CESEE countries. As regards lending to households, mortgage loans accounted for a share of 70%, whereas (riskier) consumer credit amounted to 27% at the end of 2013 (other CESEE countries: 58% and 38%, respectively). In 2013, total loans to nonbanks by Austrian subsidiaries in the Czech Republic and Slovakia expanded by 4% and 5%, respectively. The pace of growth differs by borrower segment, however: On the one hand, corporate loans registered weak growth of 3.1% in the Czech Republic, and the corresponding figure for Slovakia was even negative (–2.4%). On the other hand, loans to households showed a strong increase in both countries, expanding by 5.4% in the Czech Republic and even 12.6% in Slovakia. We focus on the more dynamic segment and find
that Czech and Slovak banks strongly differentiate their pricing of household loans by loan purpose: While new house purchase loans display an annual rate of charge more or less in line with the (comparatively low) euro area and Austrian averages, new consumer loans in the Czech Republic and Slovakia are much more costly than in the euro area and Austria and more in line with those in Romania (see chart 9).
2.2.3 Yield Earned on (Domestic) Government Bond Holdings
As Czech and Slovak banks are characterized by large liquidity buffers, they invest heavily in domestic government bonds (see chart 10). This has ambiguous implications for profitability and financial stability. On the one hand, Czech and Slovak sovereign bonds’ longterm yields are the lowest in CESEE (see chart 11), and large holdings (also in terms of the outstanding amount of such bonds6) may create concentration and
%
25
20
15
10
5
0
35
30
25
20
15
10
5
02010
Chart 9
Source: ECB.
CZ SK HR HU RO AT Euro area (changing compositon)
2011 2012 2013
House Purchase Loans to Households (New Business)
%
Consumer Loans to Households (New Business)
Annual Percentage Rate of Charge for...
2009 2010 2011 2012 2013
6 According to Národná banka Slovenska (2014a), the Czech (>40%) and Slovak (>30%) banking sector’s holdings of domestic government bonds as a share of the total outstanding amount of such bonds is considerably above the euro area average (<20%). Only few EU banking sectors show larger relative holdings.

Austrian Subsidiaries’ Profitability in the Czech Republic and Slovakia – CESEE Margins with an Austrian Risk Profile
FINANCIAL STABILITY REPORT 28 – DECEMBER 2014 65
liquidity risks. On the other hand, low yields also positively reflect on the stability and credit worthiness of the Czech and Slovak sovereign,7 which fa
vorably influences the stability of these assets and the stability of the financial sector overall. 3 The (All Important) Risk
Perspective and Lessons Learned
The (falling) nonperforming loans (NPL) ratio of Austrian banks’ Czech and Slovak subsidiaries remains substantially below the (still increasing) average NPL ratio of other Austrian CESEE subsidiaries (5% compared with 19% at the end of 2013; see chart 12). Also, the risks from NPLs were comparatively well provisioned for in the Czech Republic and Slovakia, given that the coverage ratio had substantially improved and remains above the CESEE average. Therefore, this strong credit quality can be seen as the most important contributor to the good profitability levels of Austrian subsidiaries in the Czech Republic and Slovakia.
From a macroprudential perspective, this can be attributed both to exogenous and endogenous factors. Regarding the former, both countries are characterized by a stable and open economic environment that benefits from its export dependency on Germany and a rather predictable legal, political and regulatory framework. Regarding the endogenous factors – i.e. those related to banks’ own business decisions – banks in the Czech Republic and in Slovakia avoided several risks in the runup to the financial crisis that materialized in other CESEE countries: • Although the growth of the loan
exposure to nonbanks was strong – at 50% overall – from end2006 to end2008, it was underpinned by a parallel increase in deposits, resulting in a sustainable loantodeposit ratio
7 The Standard & Poor’s long-term foreign currency rating (as of December 5, 2014) is AA– for the Czech Republic and A for Slovakia.
%
25
20
15
10
5
02010
Domestic Government Bonds as a Share of MFIs’ Total Assets
Chart 10
Source: ECB, OeNB calculations.
Note: Data type: outstanding amounts at the end of period (stocks); MFIs excluding ESCB; balance sheet items: “securities other than shares” (counterpart area: domestic; counterpart sector: general government).
2011 2012 2013 2014
CZ SK HRHU RO ATEuro area (changing compositon)
%
10
9
8
7
6
5
4
3
2
12010
Long-Term Government Bond Yields
Chart 11
Source: OeNB.
2011 2012 2013 2014
CZ SK HR HU ROAT Euro area (changing compositon)

Austrian Subsidiaries’ Profitability in the Czech Republic and Slovakia – CESEE Margins with an Austrian Risk Profile
66 OESTERREICHISCHE NATIONALBANK
that stayed at a healthy 80%. This strong local liquidity position also translates into a funding autonomy
with very low levels of liquidity transfers from their Austrian parent banks (see charts 13 and 14). In the remaining CESEE region, Austrian subsidiaries’ loan growth was much stronger, as the loan exposure nearly doubled, the loanto deposit ratio went up from 119% to 143% and intragroup liquidity transfers exceeded 20% of the subsidiaries’ total assets. These very high precrisis growth rates in many CESEE countries often resulted in heightened provisioning levels, writedowns and (sometimes) costly market exits later on.
• Foreign currency lending is almost nonexistent in Slovakia (a member of the euro area) and to Czech households; the share of loans to corporates denominated in foreign currency was 27% in the Czech Republic at the end of 2013 (94% of which are denominated in euro). As many of these
Index %
220
200
180
160
140
120
100
180
160
140
120
100
80
602006 2007 2008 2009 2010 2011 2012 2013
Loan Exposure Growth and Loan-to-Deposit Ratios
Chart 13
Source: OeNB.
Note: Loan exposure indexed to 100 at the start and not adjusted for bought or sold subsidiaries (i.e. changing sample composition).
CZ & SK (before provisions) CZ & SK (after provisions)
CESEE excl. CZ & SK (before provisions) CESEE excl. CZ & SK (after provisions)
LDR in CZ & SK (right-hand scale)
LDR in CESEE excl. CZ & SK (right-hand scale)
%
60
55
50
45
40
35
30
25
20
15
10
5
0CZ & SK
NPL and Coverage Ratios
Chart 12
Source: OeNB.
Note: Limited sample of banks.
2009 2010 2011 2012 2013
CESEE excl. CZ & SK CZ & SK CESEE excl. CZ & SKNPL ratio Coverage ratio

Austrian Subsidiaries’ Profitability in the Czech Republic and Slovakia – CESEE Margins with an Austrian Risk Profile
FINANCIAL STABILITY REPORT 28 – DECEMBER 2014 67
borrowers are (presumably) hedged exporters, the NPL ratio for the Czech corporate segment is very low compared to the average for other CESEE subsidiaries (4% versus 24%).
• Also, riskier consumer loans play a smaller role in the Czech and Slovak subsidiaries’ loan portfolios (see also section 2.2.2).
Against the background of the discussed strengths that helped Austrian subsidiaries in the Czech Republic and Slovakia to weather the financial crisis well, it is also worth considering potential downside risks to future profitability: • Margins: Czech and Slovak banks’
net interest margins are affected by the low interest rate environment, with both Ceská národní banka’s twoweek repo rate and the ECB’s main refinancing rate at 0.05% (as of December 5, 2014). Given that deposit rates have a zero lower bound, banks’ net interest margins may experience a further compression. Weak
demand for higheryielding consumer loans, a trend toward less profitable mortgages8 and low yields on government bond holdings may exacerbate this effect and create pressures for a risky “hunt for yield.” Risks in retail lending have recently been addressed in Slovakia,9 while Ceská národní banka (2014) cautioned that “the coverage of NPLs by provisions may not be sufficiently prudent from the aggregate perspective.”
• Macroeconomic vulnerabilities: The Czech and Slovak economies are small, concentrated and very open, which makes their growth outlook as well as the creditworthiness and liquidity of exposed bank customers vulnerable in case crossborder spillover effects were to arise (e.g. via the trade channel).
• Market structure: The future intensity of competition in these profitable banking markets remains an open question. Given the low earnings potential international banks face in other markets, it is surprising that there is not much more competition for creditworthy Czech and Slovak customers – either from new market entrants or established banks trying to increase their market share. If competition intensified significantly, there would be increased pressure on local profitability levels.
4 Conclusions
The Czech Republic and Slovakia might have seemed less promising than the rest of CESEE in terms of profitability before the crisis, but they now provide net interest margins well above Aus
% of total assets
25
20
15
10
5
02009
Intragroup Liquidity Transfers to CESEE Subsidiaries
Chart 14
Source: OeNB.
Note: Liquidity transfers to credit institutions only and on a gross basis.
CZ & SK CESEE excl. CZ & SK
2010 2011 2012 2013
8 According to Moody’s (2014), in the Czech Republic “[t]he growth in total loans was mostly driven by mortgage lending (up 5.2% year-on-year in 2013) […] while consumer lending grew by a modest 0.4% during the same period.”
9 In October 2014, Národná banka Slovenska (2014b) published the macroprudential Recommendation No1/2014 on risks related to market developments in retail lending.
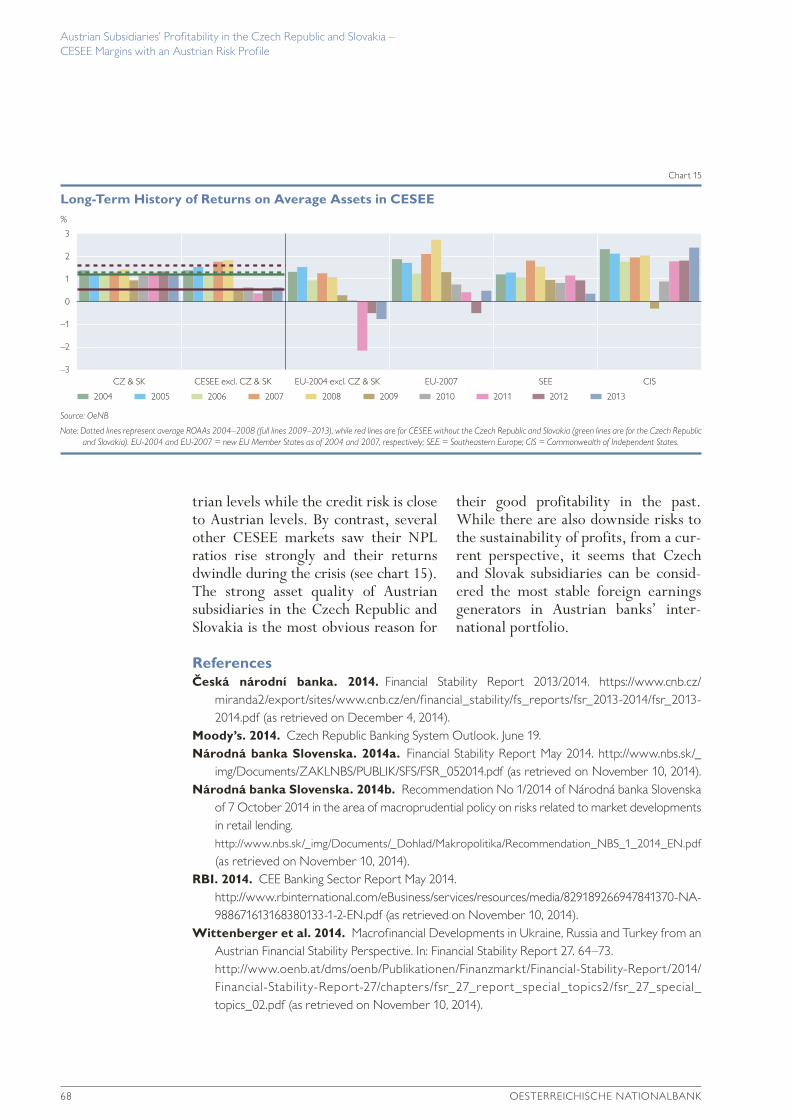
Austrian Subsidiaries’ Profitability in the Czech Republic and Slovakia – CESEE Margins with an Austrian Risk Profile
68 OESTERREICHISCHE NATIONALBANK
trian levels while the credit risk is close to Austrian levels. By contrast, several other CESEE markets saw their NPL ratios rise strongly and their returns dwindle during the crisis (see chart 15). The strong asset quality of Austrian subsidiaries in the Czech Republic and Slovakia is the most obvious reason for
their good profitability in the past. While there are also downside risks to the sustainability of profits, from a current perspective, it seems that Czech and Slovak subsidiaries can be considered the most stable foreign earnings generators in Austrian banks’ international portfolio.
%
3
2
1
0
–1
–2
–3CZ & SK
Long-Term History of Returns on Average Assets in CESEE
Chart 15
Source: OeNB
Note: Dotted lines represent average ROAAs 2004–2008 (full lines 2009–2013), while red lines are for CESEE without the Czech Republic and Slovakia (green lines are for the Czech Republic and Slovakia). EU-2004 and EU-2007 = new EU Member States as of 2004 and 2007, respectively; SEE = Southeastern Europe; CIS = Commonwealth of Independent States.
2004 2005 2006 2007 2008 2009 2010 2011 2012 2013
CESEE excl. CZ & SK EU-2004 excl. CZ & SK EU-2007 SEE CIS
ReferencesČeská národní banka. 2014. Financial Stability Report 2013/2014. https://www.cnb.cz/
miranda2/export/sites/www.cnb.cz/en/financial_stability/fs_reports/fsr_2013-2014/fsr_2013-2014.pdf (as retrieved on December 4, 2014).
Moody’s. 2014. Czech Republic Banking System Outlook. June 19.Národná banka Slovenska. 2014a. Financial Stability Report May 2014. http://www.nbs.sk/_
img/Documents/ZAKLNBS/PUBLIK/SFS/FSR_052014.pdf (as retrieved on November 10, 2014).Národná banka Slovenska. 2014b. Recommendation No 1/2014 of Národná banka Slovenska
of 7 October 2014 in the area of macroprudential policy on risks related to market developments in retail lending. http://www.nbs.sk/_img/Documents/_Dohlad/Makropolitika/Recommendation_NBS_1_2014_EN.pdf (as retrieved on November 10, 2014).
RBI. 2014. CEE Banking Sector Report May 2014. http://www.rbinternational.com/eBusiness/services/resources/media/829189266947841370-NA-988671613168380133-1-2-EN.pdf (as retrieved on November 10, 2014).
Wittenberger et al. 2014. Macrofinancial Developments in Ukraine, Russia and Turkey from an Austrian Financial Stability Perspective. In: Financial Stability Report 27. 64–73.
http://www.oenb.at/dms/oenb/Publikationen/Finanzmarkt/Financial-Stability-Report/2014/ Financial-Stability-Report-27/chapters/fsr_27_report_special_topics2/fsr_27_special_ topics_02.pdf (as retrieved on November 10, 2014).

FINANCIAL STABILITY REPORT 28 – DECEMBER 2014 69
Housing markets and housing finance have seen a pronounced boom and bust cycle during the past decade, both in the U.S.A. and in Europe. In the vast majority of European countries, house prices and housing wealth have risen sharply since the mid1990s. At the same time, household debt has reached record levels in many countries, largely as a result of the decrease in real and nominal interest rates and the introduction of a wide range of financial innovations on the mortgage markets. Problems in the U.S. mortgage market triggered the financial crisis, which resulted in an enormous loss of wealth and output around the globe.
The crisis has changed the way how policymakers deal with house price booms. Instead of neglecting the boom and “picking up the pieces” after the bust, a new consensus on the need for more preventive policies has evolved. In Europe, a new macroprudential policy framework centered on the European Systemic Risk Board (ESRB) has been installed. However, the detection of unsound developments in real time and
the implementation of adequate policy instruments require sound knowledge in several fields.1, 2
In order to shed some light on these issues, the OeNB organized a workshop entitled “Are House Prices Endangering Financial Stability? If So, How Can We Counteract This?” It was held on October 9 and 10, 2014, in Vienna and aimed to bring together international experts in the field to share their expertise.
The workshop was organized around four sessions which dealt with the most important issues – from a central bank’s perspective – of monitoring housing market developments and assessing their implications for financial stability. Session 1 dealt with house price measurement, which is a prerequisite for assessing upcoming house price bubbles. Session 2 looked at the drivers of house prices. Session 3 discussed methods to identify house price bubbles and session 4 looked at the relevant experience of countries whose authorities have already implemented measures to contain possible future bubbles.
Workshop Summary: Are House Prices Endangering Financial Stability? If So, How Can We Counteract This?
Against the background of recent house price increases in several European countries, the OeNB organized a workshop entitled “Are House Prices Endangering Financial Stability? If So, How Can We Counteract This?” It was held in Vienna on October 9 and 10, 2014. The work-shop contributions2 demonstrated the complexity of assessing house price developments and of implementing macroprudential policy measures. One of the main policy conclusions was that collecting data on individual loan characteristics is a key priority for monitoring develop-ments in the housing and mortgage loan markets.
JEL classification: R3, G2, E6Keywords: Housing markets, bubble, financial stability
Martin Schneider,Karin Wagner1
1 Oesterreichische Nationalbank, Economic Analysis Division, [email protected] and [email protected]. 2 The workshop presentations are available on the OeNB website at www.oenb.at/Monetary-Policy/real-estate-
market-analysis/workshops-and-conferences.html.

Workshop Summary: Are House Prices Endangering Financial Stability? If So, How Can We Counteract This?
70 OESTERREICHISCHE NATIONALBANK
In his keynote speech, Professor John Muellbauer (University of Oxford) shed light on the interactions between the housing sector, the mortgage sector and the real sector of the economy. He concentrated on the housing wealth channel and the credit channel. While the credit channel turns out to be important for explaining the impact of house prices on aggregate consumption (including imputed housing), the wealth effect is small or even negative in some countries. In Germany, where households’ liquid assets far exceed their debt, higher interest rates dampen aggregate consumption. The indirect effects of higher interest rates, however, stimulate consumption in Germany via lower house prices. Poorly developed credit markets in other countries imply that aggregate consumption falls when house prices rise, since future firsttime buyers have to save more for downpayment. The application of Muellbauer’s estimated model shows that in France and Germany higher house prices reduce consumption. This result can be explained by low loantovalue (LTV) ratios and conservative debt service ratios. The U.S.type financial accelerator link is missing in Germany and France. Hence, a German house price boom will not produce a consumption boom that pulls the euro area out of recession.
1 House Price Measurement: A Prerequisite for Assessing Upcoming Bubbles
The construction of residential property price indices is a complex task, as each piece of property is a unique good with unique characteristics that change over time (deterioration, renovation, etc.). Most often, data on residential property sales are irregular and heterogeneous. Session 1 of the workshop dealt with the various approaches and challenges
of index construction and with the question whether there is a potential for mismeasurement that could blur the assessment of upcoming bubbles sufficiently to keep the authorities from adequately fulfilling their task of maintaining financial stability.
Mick Silver (IMF) showed indices calculated on the basis of appraisal data and repeat sales data. He performed a regression of house prices (with panel data), showing that measurement variables alone have little to no explanatory power. When he included time and country effects, however, the explanatory power increased. Furthermore, he showed pooled regression results for house price indices with measurementadjusted and unadjusted house prices and pointed out that commercial property price indices constitute important data. Their construction and/or calculation, however, is even more complicated than the construction of residential property price indices. Houses differ in both their physical characteristics and their individual location. Hedonic methods are used to construct qualityadjusted house price indices. The increased availability of geospatial data (i.e. the longitude and latitude coordinates of individual locations) means that more sophisticated approaches than simple hedonic models can be applied for the calculation of residential property price indices.
Michael Scholz (University of Graz) presented such approaches. Together with his coauthor Robert J. Hill, he constructed a hedonic model of the housing market that includes a spline surface defined by geospatial data (i.e. the longitude and latitude coordinates of individual dwellings). House price indices are then obtained by imputing prices for individual dwellings from the hedonic model and inserting them into the Fisher price index formula. Using

Workshop Summary: Are House Prices Endangering Financial Stability? If So, How Can We Counteract This?
FINANCIAL STABILITY REPORT 28 – DECEMBER 2014 71
data for Sydney, Australia, the authors compare the performance of four models: (1) a generalized additive model (GAM) with a geospatial spline, (2) a GAM with postal code dummies, (3) a semilog with geospatial spline, (4) a semilog with postal code dummies. Their results clearly confirm the superiority of geospatial splines, in terms of both the deviation between actual and imputed prices and – with repeatsales observations – the deviation between the actual and the corresponding imputed price relative pt+k,h / pt,h (price of house h in time period t and time period t+k). Splines combined with the hedonic imputation method provide a flexible way of incorporating geospatial data into a house price index. The cumulative increase in their Fisher price indices is between 15% and 25% higher (depending on the functional form of the model) over the 2001 to 2011 period when a geospatial spline is used. This difference can be attributed to the failure of postal code dummies to fully adjust for omitted locational characteristics.
Wolfgang Brunauer (Real(e)value) and Wolfgang Feilmayr (Vienna University of Technology), who calculate the Residential Property Price Index (RPPI) for Austria in cooperation with the OeNB, elaborated on the challenges of index construction. They gave an overview of available (residential) propertyrelated indices in Austria. First, they presented the time dummy index (using data series starting in 1986) – a multiple linear regression model where the price index is explained by attributes and district dummy variables. Next, they demonstrated the spatial imputation index, the calculation of which is based on semiparametric models that take nonlinearity and spatial heterogeneity into account and produce unbiased qualityadjusted time effects as omitted variable effects are modeled
adequately. Moreover, the use of imputation methods ensures that structural changes in the estimated effects do not have any distorting effects. Brunauer and Feilmayr presented their results for condominiums and singlefamily houses (at census level) for Austria and for Vienna.
2 Which Factors Drive House Prices?
House prices are determined by a complex interplay of various demand and supply factors, some of which tend to produce cyclical price movements. Session 2 discussed the differences between, and similarities of, individual countries and dealt with the question whether we can learn something from the experience gained in other countries.
Christophe André (OECD) gave an overview of the latest global housing cycle, the price pickups in Austria, Germany and Switzerland, the soaring investment in Ireland and Spain, and the arrears in the U.K., Ireland and Spain. Then he turned to some factors driving house prices – declining interest rates, innovations in mortgage markets, low mortgage rates – and stated that local factors also play a role (e.g. disposable income, population characteristics and households’ expectations). His overview ended with some conclusions on the implications of the development of these factors and of house prices for financial stability, explaining that excessive loan maturity and currency mismatches create funding risks and that low interest rates create risks of new bubbles. Therefore, a holistic approach to housing is needed, entailing e.g. a number of changes in tax regulation and a relaxation of planning regulations to boost the rental market and the supply of affordable housing.
Kostas Tsatsaronis (BIS) tested whether the institutional characteristics

Workshop Summary: Are House Prices Endangering Financial Stability? If So, How Can We Counteract This?
72 OESTERREICHISCHE NATIONALBANK
of housing finance markets have any effects on house price dynamics. Using a simple Vector Autoregressive (VAR) framework, he and his coauthor analyze the joint dynamics of macrovariables (GDP, inflation), house prices and (mortgage) credit growth. They test how market structure affects the interaction between macrovariables and house prices. To this end, they group countries by the characteristics of housing finance (interest rate structure (fixed or floating rate), the existence of mortgage equity withdrawal and the size of LTV ratios) and label the resulting three groups of countries “conservative,” “aggressive fixed” and “aggressive variable.” Applying a VAR specification, they find that house price dynamics themselves seem to be by far the most important driver of house prices – a finding they interpret as “momentum effect” (while, alternatively, it could also indicate poor model specification). He concluded that mortgage market characteristics explain the development of some variables, but not all.
Christian Hott (Zürich Insurance Group) gave a presentation on “Explaining House Price Fluctuations.” He showed that in most countries, house prices fluctuate more strongly than fundamentals. He developed a model of fundamental house prices that tries to solve the question which part of house price dynamics can be explained by fundamentals. He defined the fundamental house price as the present value of future imputed rents. Imputed rents were calculated as the fundamental value of rents by including the mortgage rate, the sum of maintenance costs and the risk premium as factors. The comparison of fundamental house prices with actual house prices indicates that house prices fluctuate more than fundamentally justified. To explain this, he developed several variations of the basis
model with alternative assumptions about agents’ expectations. By assuming that agents do not react to changes in user costs (i.e. the mortgage rate), he concluded that agents overreact to current fundamentals as well as to past returns and that they are influenced by their sentiment. Stating that forecasting models that rely on fundamentals miss part of the development of house prices, Hott showed that the excess fluctuations of actual house prices can be partly explained by incorporating herding behavior and speculation into his house price model.
3 How Can We Identify House Price Bubbles in Advance?
Session 3 dealt with the question of how to identify house price bubbles in advance. Whenever house prices are rising, the question is whether this rise actually means that a bubble is building up. Still, it is notoriously difficult to define and identify house price bubbles in real time. The presentations in this session gave a good overview of commonly used empirical methods.
Florian Kajuth (Deutsche Bundesbank) presented an assessment of house prices in Germany using an estimated stockflow model. His model is estimated with a panel estimator using regional data. Explanatory variables are the housing stock, income, the population aged between 30 and 55, population density, interest rate and growth expectations. Estimation results show that low growth expectations and declining interest rates can explain the decline of real house prices during the last decade. Currently, the model shows an overvaluation by 5% to 20% of apartments in certain German cities.
Martin Schneider (OeNB) presented the OeNB’s fundamentals indicator for residential property prices, which serves to assess deviations of house prices from
Workshop Summary: Are House Prices Endangering Financial Stability? If So, How Can We Counteract This?
FINANCIAL STABILITY REPORT 28 – DECEMBER 2014 73
fundamentally justified prices. The indicator consists of seven subindicators that address a variety of perspectives, including those related to households, investors and systemic factors. For Vienna, the indicator points to an increasing degree of overvaluation in property prices (by 23% in the second quarter of 2014). The overvaluation evident in the indicator does not suggest that an abrupt price correction will occur in the near future. Rather, such imbalances may subside gradually, as happened in the wake of the price hikes experienced in the early 1990s. For Austria as a whole, the indicator suggests that house prices are in line with fundamentals. Schneider also applied this indicator to a total of 11 euro area countries. His results suggest that, currently, residential property is overvalued in Belgium and France. In Austria and Finland, house prices are in line with fundamentals, while in Germany, Ireland, Greece, Spain, Italy, the Netherlands and Portugal, they are below fundamentally justified values.Christian Dreger (German Institute for Economic Research – DIW Berlin) introduced an early warning system for predicting house price bubbles based on three alternative approaches: a signaling approach, logit models and probit models. To start with, he constructed a house price bubble chronology for 12 OECD countries. His empirical results show that while the signaling approach does not produce reliable forecasts, the predictive accuracy of the logit and probit models is high enough to make them useful in forecasting bubbles in the housing market.
4 Which Instruments Are Available to Contain Upcoming Bubbles?
House price bubbles can pose a serious threat to financial stability, especially
if accompanied by a strong increase in credit. Having identified an upcoming bubble, the central question is what instruments are available to contain it. Policymakers have a variety of instruments at their disposal for this purpose. Session 4 looked at the experience of other countries whose authorities have already implemented such measures.
Thomas Schepens (Nationale Bank van België/Banque Nationale de Belgique – NBB) presented recent developments in Belgian housing and mortgage markets and the related prudential measures implemented recently. The NBB has developed a new graphical early warning indicator methodology. The basic idea behind this new methodology is to identify thresholds for early warning indicators, e.g. the credittoGDP ratio, the credittoGDP gap, nominal house price growth or the pricetoincome ratio. The identification of early warning indicators that signal excessive developments (e.g. in credit and leverage) and the potential occurrence of banking crises is based on a clustering of countries with banking crises, noncrisis countries and tranquil periods. Based on the results of this approach, prudential measures were implemented in Belgium in the fourth quarter of 2013 (comprising an addon of 5 percentage points to risk weights for mortgages).
Fergus Cumming (Bank of England – BoE) gave an overview of macroprudential regulation in the U.K. residential mortgage market. House prices and indebtedness have increased rapidly in the U.K. over recent months. The BoE uses a modeling approach based on individual loan data to assess risks arising from mortgage indebtedness. By using forecasts for macroeconomic variables such as house prices or incomes, distributions for the LTV and loantoincome (LTI) ratios of future borrowers

Workshop Summary: Are House Prices Endangering Financial Stability? If So, How Can We Counteract This?
74 OESTERREICHISCHE NATIONALBANK
can be simulated. This approach allows for simulating different scenarios of mortgage indebtedness. Based on the results of this method, the BoE published two recommendations in its June 2014 Financial Stability Report. While the first recommendation to lenders targets loan affordability by stating that lenders should assess whether borrowers could still afford a 3 percentage point interest rate increase, the second recommendation explicitly focuses on the distribution of LTI ratios. Banks have to ensure that mortgage lenders do not extend more than 15% of their total number of new residential mortgages at LTI ratios of 4.5 or above.
Srobona Mitra (IMF) reported on experience made with implementing macroprudential measures, focusing on the implementation of caps to LTV and debttoincome ratios. While there is no onesizefitsall solution, some generalizations can be made. Usually, a number of different national institutions decide which prudential and macroeconomic policy tools to use while their central bank monitors systemic risks. This means that actions taken by these institutions are usually not coordinated with the central bank’s monetary policy. In most cases, these prudential and macroeconomic policy tools were applied immediately, with only a narrow gap between the announcement that a specific instrument was to be used and its application. In many cases, high LTV ratios, long maturities and speculation (as measured by the share of multiple loan holders) were alerting signals of a property price boombust cycle. Often, the respective instruments were applied in a discretionary manner and had an effect on credit growth, but not on house price growth. Measures targeting
risky mortgages worked better than broad measures.
Conclusions: What Have We Learned?The OeNB workshop on house prices and financial stability clearly demonstrated how challenging it is for authorities to deal with house price booms and their possible impact on financial stability. Contributions in session 1 provided insight into the construction of residential property price indices, which are the basis of any further analysis of housing market developments. This construction process requires sound theoretical and technical capabilities and requires a lot of data. Papers presented in session 2 demonstrated the diversity and interplay of the various factors that drive house prices. It became evident that both structural and cyclical factors play a crucial role and that house prices tend to overshoot, i.e. they fluctuate more strongly than fundamental factors. Among the relevant structural factors, tax policy seems to be most important. The papers delivered in session 3 discussed the difficulties of identifying house price bubbles in real time. Although there is no single, absolutely reliable method, it is crucial for central banks to integrate adequate methods for the identification of house price bubbles in their tool kits. Session 4 looked at the experience of countries whose authorities have already implemented measures to contain upcoming house price bubbles. The main takeaway from this session was – as the Belgian example showed – that collecting granular data on loantovalue, debttoincome and debt servicetoincome ratios is a key priority for monitoring developments in housing and mortgage markets.

FINANCIAL STABILITY REPORT 28 – DECEMBER 2014 75
Since the beginning of the financial crisis in 2008, the EU has made substantial progress in drawing conclusions from the lessons learned and in finding an answer to the question as to how to regulate, supervise and govern the financial sector more effectively. With the establishment of the Single Supervisory Mechanism (SSM) and the assumption of supervisory responsibility for banks in the euro area by the European Central Bank (ECB) in November 2014, on the one hand, and the transposition of the Bank Recovery and Resolution Directive2 (BRRD) into national law by the beginning of 2015, on the other, two key elements of the
banking union that will add a new dimension to banking supervision in Europe have come into effect only recently.
A lack of adequate tools to deal with unsound credit institutions and to minimize negative repercussions by preserving banks’ systemically important functions when insolvency occurs had been observed in many EU Member States. That made it necessary for several governments in the EU to intervene in their financial sectors in order to stabilize banks. More than 100 EU banks, which accounted for around 25% of the banking system’s total assets, received state aid, and 22 Member
The Banking Recovery and Resolution Directive and the EU’s Crisis Management Framework: Principles, Interplay with the Comprehensive Assessment and the Consequences for Recapitalizing Credit Institutions in Crisis Situations
Within the EU, a new framework has been designed to define, when banks are considered no longer viable, how such banks can exit the market without creating widespread financial distress and how a smooth exit or recovery should be financed. It consists of a complex set of rules and international agreements, with responsibility for their implementation assigned to various authorities. This study analyzes the objectives of the new regime and the new powers of the various authorities involved, as well as the main underlying tradeoffs that are defining the policy debate in terms of the allocation of losses to various stakeholders, the associated conditionality and the degree of mutualization of decision-making and financing within the euro area and the EU at large.
JEL classification: K230, K330, F360, F330Keywords: Bank recovery and resolution, banking union, ESM, Single Resolution Mechanism, burden sharing, bail-in, precautionary recapitalization
Dieter Huber, Georg Merc1
1 Oesterreichische Nationalbank, Supervision Policy, Regulation and Strategy Division, [email protected] and [email protected].
2 Directive 2014/59/EU of the European Parliament and of the Council of 15 May 2014 establishing a framework for the recovery and resolution of credit institutions and investment firms and amending Council Directive 82/891/EEC, and Directives 2001/24/EC, 2002/47/EC, 2004/25/EC, 2005/56/EC, 2007/36/EC, 2011/35/EU, 2012/30/EU and 2013/36/EU, and Regulations (EU) No 1093/2010 and (EU) No 648/2012, of the European Parliament and of the Council.

The Banking Recovery and Resolution Directive and the EU’s Crisis Management Framework: Principles, Interplay with the Comprehensive Assessment and the Consequences for Recapitalizing Credit Institutions in Crisis Situations
76 OESTERREICHISCHE NATIONALBANK
States provided aid in support of the financial sector.3 Hence, the aim was to break the link between banks and sovereigns, and to put an end to the old paradigm of bank bailouts.
Beginning in 2008, the European Commission reacted promptly to the crisis and developed a comprehensive framework of rules for crisisrelated state aid that defined general conditions under which Member States could support banks. In 2013, the European Commission decided to strengthen these rules with a further Communication4 requiring banks to elaborate restructuring plans before recapitalization measures can be authorized and, in the event of capital shortfalls, banks’ shareholders and subordinated creditors to assume a first part of the burden before banks can ask for public funding.
Even though the European Commission launched a first consultation on an EU framework for crossborder crisis management in the banking sector at the beginning of 2010, a harmonized regime ensuring that shareholders and creditors bear losses first, and thus minimizing the cost for taxpayers, while preserving financial stability, did not come about, and reaching common
agreement for the BRRD at the European level took almost five years.
That was why many EU Member States decided in the meantime to adopt bank recovery and resolution tools of their own, with the drawback of creating different national regimes to handle crisis situations. However, the BRRD will bring harmonization to this area as of January 1, 2015.
The perceived need for an instrument that allows a direct recapitalization of banks at a supranational level has been a driving force behind the whole move toward a banking union. European leaders considered an EU institutional architecture and regulatory framework comprising, in particular, the SSM,5 the BRRD, the Single Resolution Mechanism6 (SRM) and amendments to the Deposit Guarantee Schemes Directive7 (DGSD), to be a prerequisite for any financial backstop, via the establishment of the European Stability Mechanism (ESM), that might be used if national funding were to prove insufficient for dealing with domestic challenges. Consequently, in June 2014, the EU Member States came to a preliminary agreement on the future ESM direct recapitalization instrument.
3 See Almunia, J. 2014. “Some highlights from EU competition enforcement”. Speech presented by the Vice- President of the European Commission responsible for Competition Policy. Florence. September 19. Available at http://europa.eu/rapid/press-release_SPEECH-14-608_en.htm?locale=FR.
4 Communication from the Commission on the application, from 1 August 2013, of state aid rules to support mea-sures in favor of banks in the context of the financial crisis (2013 Banking Communication).
5 Council Regulation (EU) No 1024/2013 of 15 October 2013 conferring specific tasks on the European Central Bank concerning policies relating to the prudential supervision of credit institutions. The SSM was established to align supervisory responsibility at the European level and to reflect that EU financial markets are highly integrated and interconnected, with many institutions operating extensively across national borders. The Regula-tion grants the ECB authority to supervise the banking sector in the euro area and to ensure that a single rulebook for financial services is applied in a coherent and effective manner and that credit institutions are subject to supervision of the highest quality.
6 Regulation (EU) No 806/2014 of the European Parliament and of the Council of 15 July 2014 establishing uniform rules and a uniform procedure for the resolution of credit institutions and certain investment firms in the framework of a Single Resolution Mechanism and a Single Resolution Fund.
7 Directive 2014/49/EU of the European Parliament and of the Council of 16 April 2014 on deposit guarantee schemes to amend Directive 94/19/EC.

The Banking Recovery and Resolution Directive and the EU’s Crisis Management Framework: Principles, Interplay with the Comprehensive Assessment and the Consequences
for Recapitalizing Credit Institutions in Crisis Situations
FINANCIAL STABILITY REPORT 28 – DECEMBER 2014 77
The forthcoming establishment of the SRM will further reduce differences between national resolution rules in the euro area and will address the lack of unified decisionmaking for the resolution of banks. That will mean a break with the past where banks operating across borders were international in life, but national in death.
1 Key Elements of the BRRD
The BRRD comprises three key elements that provide authorities with a set of tools to intervene in an institution in different phases, and sufficiently early and quickly, to ensure the continuity of the institution’s critical economic functions. The first element consists of an improvement of preparatory and preventive measures to the effect that, on the one hand, institutions are required to draw up recovery plans and outline possible measures they themselves will take to restore their financial position, including support through institutional protection schemes (IPSs)8 or measures based on intragroup crossborder support agreements.9 On the other hand, newly established resolution authorities will have to prepare for future crisis situations by drafting resolution plans10 and to ensure, inter alia, by setting a minimum requirement of own funds and eligible liabilities (MREL),11 the resolvability of an institution, so that the impact of its failure on the economy and financial system is minimized. Resolution plans
will be drawn up for each institution or group, and will provide a roadmap of actions to be taken when the respective institution fulfils the prerequisites for resolution. Such plans shall be scenariobased and updated at least once a year. If the resolution authority is not convinced that a smooth market exit is possible, it has various powers for removing material impediments, including the right to require the institution to limit exposures, divest assets and restrict business lines, or even to require changes to the institution’s legal or operational structure, in order to ensure that critical functions can be carried out separately if necessary. That means that resolution authorities have the power to take intrusive actions that affect the institution as a going concern and should, therefore, cooperate very closely with the competent authorities.
The second element is that the early intervention powers of competent authorities will be strengthened. They will be entitled to intervene earlier and more effectively by requiring an institution to implement measures set out in the recovery plan or by appointing a special manager for a limited period to restore the institution’s financial viability when its solvency is deemed to be at risk.
Finally, the BRRD introduces a resolution regime and requires resolution authorities to take action on the basis of a determination that an institution is
8 According to Article 113(7) of the Regulation (EU) No 575/2013 of the European Parliament and of the Council of 26 June 2013 on prudential requirements for credit institutions and investment firms and amending Regula-tion (EU) No 648/2012 (known as the Capital Requirements Regulation – CRR), an IPS is a “contractual or statutory liability arrangement which protects those institutions and in particular ensures their liquidity and solvency to avoid bankruptcy where necessary”.
9 See Articles 19 to 26 of the BRRD.10 See Articles 10 to 14 of the BRRD.11 See Article 45 of the BRRD.

The Banking Recovery and Resolution Directive and the EU’s Crisis Management Framework: Principles, Interplay with the Comprehensive Assessment and the Consequences for Recapitalizing Credit Institutions in Crisis Situations
78 OESTERREICHISCHE NATIONALBANK
failing or likely to fail,12 and that there is no reasonable prospect that any alternative private sector measures would prevent the failure of the institution within a reasonable timeframe.
Therefore, the provision of extraordinary public financial support13 usually triggers resolution. However, this is not the case when, for economic and financial stability reasons,14 it takes the form of a state guarantee for specific liabilities15 or if the support is granted by way of an injection of own funds or a purchase of capital instruments at prices, and on terms, that do not confer an advantage upon the institution (pre-cautionary public recapitalization).16 In any event, such public support measures must be confined to solvent institutions, be proportionate, be precautionary and temporary in nature and may not be used to offset losses that the institution has incurred or is likely to incur in the near future. Furthermore, they are conditional on final approval under the EU’s state aid framework.
In addition, the use of precautionary public recapitalizations in the form of capital injections is limited to addressing a capital shortfall that has been
established in national, EU or SSMwide stress tests, asset quality reviews or equivalent exercises conducted by the ECB, the European Banking Authority (EBA) or national authorities. Under such circumstances, public capital injections would not trigger the mandatory writedown or conversion of capital instruments that would generally be required if the support takes the form of a state guarantee.17 Against the backdrop of the aforementioned requirements, it would appear that there is only a very narrow scope of application for precautionary public recapitalization in the form of capital injections without triggering resolution.
The broad range of new powers resolution authorities have been provided with include taking control of an institution under resolution and exercising all the rights and powers conferred upon shareholders, transferring assets or liabilities out of a failing institution to another entity, reducing the principal amount of the outstanding liabilities of an institution under resolution or converting them into ordinary shares, and removing or replacing the management body of a failing bank.
12 The determination is primarily the responsibility of the competent authority. However, Member States may also entrust resolution authorities with this task, whenever they have the necessary tools at their disposal. According to Article 32(4) of the BRRD, an institution is deemed to be failing or likely to fail if (1) it infringes or will, in the near future, infringe the requirements for continuing authorization in a way that would justify the withdrawal of the authorization, (2) its assets are or will, in the near future, be less than its liabilities, (3) it is or will, in the near future, be unable to pay its debts or other liabilities as they fall due, and/or (4) extraordinary public finan-cial support is required.
13 According to Article 1(28) of the BRRD, extraordinary public financial support is state aid within the meaning of Article 107(1) of the Treaty on the Functioning of the European Union (TFEU), or any other public financial support at supra-national level, which would, if provided for at national level, constitute state aid that is provided in order to preserve or restore the viability, liquidity or solvency of a bank.
14 In order to remedy a serious disturbance in the economy of a Member State and preserve financial stability.15 To either back liquidity facilities provided by central banks according to the central banks’ conditions or newly
issued liabilities.16 The institution must not be likely to fail for any other reason at the time the public support is granted. Also, none
of the circumstances cited in Article 59(3) of the BRRD may be given, especially not that of the bank no longer being viable unless relevant capital instruments were written down.
17 Article 59(3)(e) of the BRRD stipulates that any support in the form of a state guarantee requires an assessment of whether or not a write-down or conversion of capital instruments is necessary. Depending on whether the underlying liquidity shortfall also involves a need for recapitalization, the amount of a write-down and the conversion rate are to be determined on the basis of an independent valuation.

The Banking Recovery and Resolution Directive and the EU’s Crisis Management Framework: Principles, Interplay with the Comprehensive Assessment and the Consequences
for Recapitalizing Credit Institutions in Crisis Situations
FINANCIAL STABILITY REPORT 28 – DECEMBER 2014 79
These powers are intended to enable authorities to uphold uninterrupted access to critical functions, in particular deposits and payment transactions, avoiding a destruction of values. When applying resolution tools, authorities should take into account and follow the measures provided for in the resolution plan unless circumstances specific to the case warrant a different course of action.
The BRRD does not preclude an institution from being declared to be insolvent, nor the windingup of nonsystemic parts. If it is deemed to be in the public interest18 to do so, however, an institution must be resolved, in particular in order to ensure the continuity of critical functions, to protect depositors, to avoid significant adverse effects on the financial system and to protect public funds.
2 Rules for the New Loss- Absorption Sequence and Resolution Financing under the BRRD against the Backdrop of the Rules on State Aid
Shareholders and creditors will become the primary source of financing for restoration or resolution and will have to bear losses, provided that no creditor incurs losses greater than those incurred if the institution were wound up under normal insolvency proceedings (principle of “no creditor worse off”). Contributions from holders of
capital instruments in the form of a writedown or conversion of relevant capital instruments are required prior to resolution if the authority responsible19 determines that the institution will be no longer viable unless that is done. As shown in chart 1 below, the BRRD has established a clear hierarchical order for the writingdown of liabilities that observes the priority of claims under normal insolvency proceedings and stipulates that higherranking liabilities are touched only if lowerranking liabilities do not suffice to achieve the required capital effect. Common equity tier I (CET1) capital items are the first to be permanently reduced, followed by additional tier 1 capital and then tier 2 capital instruments.20 Only thereafter will remaining eligible liabilities be written down or converted in line with the hierarchy of claims in normal insolvency proceedings.
The BRRD provides for covered deposits and deposit guarantee schemes subrogated to the rights and obligations of covered depositors to have the highest ranking in the hierarchical order of creditors,21 followed by the proportion of eligible deposits of natural persons and small and mediumsized enterprises that would have been deemed to be covered deposits if they had not exceeded the coverage level.22 Covered deposits up to a coverage level of EUR 100,000 are excluded from any bailin.
18 In this context, resolution is in the public interest if it is necessary and proportionate to achieve a resolution objective and if that objective cannot be attained to the same extent by winding up the institution under normal insolvency proceedings. The protection of depositors is one of the objectives of any resolution.
19 According to Article 61 of the BRRD, each Member State is required to designate either the competent authority or the resolution authority as that which is to be responsible for making this determination.
20 An alternative provided for under certain circumstances is the possibility of converting the latter into CET1 capital instruments.
21 Hence, deposit guarantee schemes profit from that high ranking, which typically significantly reduces the contri-bution of the respective deposit guarantee scheme during resolution. This treatment is aimed at safeguarding the funds of deposit guarantee schemes for fulfilment of their primary pay-out function when deposits are unavail-able.
22 See Article 48(1)(e) of the BRRD, in connection with Article 108 thereof.

The Banking Recovery and Resolution Directive and the EU’s Crisis Management Framework: Principles, Interplay with the Comprehensive Assessment and the Consequences for Recapitalizing Credit Institutions in Crisis Situations
80 OESTERREICHISCHE NATIONALBANK
However, as the losses of an institution under resolution have to be distributed in accordance with the aforementioned principles, other eligible liabilities have to suffer relatively higher haircuts – similar to what occurs in the theory of communicating vessels.
This hierarchical order is applicable both under the BRRD and under the state aid regime. In principle, state aid rules require burdensharing up to the level of subordinated debt prior to any public intervention in cases of precautionary recapitalization as well as during resolution, unless that would endanger financial stability or lead to disproportionate results.23 The Commission decides on whether or not to grant an exemption on a casebycase basis. The Commission finding that the requirements for granting an exemption are not met could lead to a divergence of state aid rules from the BRRD provisions, in particular when the competent authorities or the resolution authorities assess the situation differently and do not require shareholders and creditors to contribute, or at least not on the same scale. While the divergence in resolution cases would probably be limited to a possible involvement of subordinated debt,24 capital instruments could also be an issue in cases of precautionary public recapitalization.
According to the BRRD, the bailin tool covering creditors with claims ranging from subordinated debt to preferred liabilities needs to be transposed into national law by January 1, 2016. However, several Member States have
decided to implement the bailin tool together with the transposition of remaining BRRD provisions, thus applying it as from January 1, 2015, in order to strengthen internal lossabsorption capacity. One of these countries is Austria, according to the draft implementing act25 that is scheduled for adoption by parliament in December 2014. That may affect the ratings of Austrian banks as a consequence both of the shifting of the burden of bearing losses from the taxpayer to the shareholders and creditors of failing banks and of a changed perception of implicit government support.
In any event, the burdensharing approach will be supported by funds established under resolution financing mechanisms and the deposit guarantee scheme (DGS). The latter will finance resolution up to certain limits. Both these funds will be built up through annual contributions of banking institutions and will provide for ex ante backstops to ensure that the financial sector bears the costs of future crises, thereby avoiding any injection of capital by the public sector or any other equivalent public financial support. This notwithstanding, the use of resolution financing mechanisms or DGS funds to assist in the resolution of failing institutions must always comply with the relevant state aid provisions.
In exceptional circumstances,26 however, the support of public resources may be necessary, and the BRRD explicitly provides Member States with the possibility to put in place govern
23 This could hold true of cases where the amount of state aid that could be granted is small in comparison with a bank’s risk-weighted assets and where the original capital shortfall has been reduced significantly through capital-raising measures.
24 Resolution authorities may – under certain circumstances – exclude subordinated debt instruments from bail-in while the European Commission could have a diverging view.
25 This act will replace the already applicable national implementation act (Banking Intervention and Restructur-ing Act – BIRG) that had anticipated certain elements of the BRRD.
26 For details, see Section 2 above.

The Banking Recovery and Resolution Directive and the EU’s Crisis Management Framework: Principles, Interplay with the Comprehensive Assessment and the Consequences
for Recapitalizing Credit Institutions in Crisis Situations
FINANCIAL STABILITY REPORT 28 – DECEMBER 2014 81
ment financial stabilization facilities for use, as a last resort, to finance the resolution of an institution. The effects of any use of such government stabilization facilities should be fiscally neutral over the medium term. If such resources prove insufficient, the ESM can, under specific circumstances, provide a supranational backstop.27 According to the BRRD, contributions from preferred liabilities and from eligible deposit holdings above the ceiling
of EUR 100,000 are not required prior to recapitalization through the ESM (as highlighted with a red box in chart 1).
2.1 Independent Valuation the Basis for Write-Downs, Conversion-of- Capital Instruments and Bail-Ins
Before writing down or converting relevant capital instruments and before designing the actual resolution, including the application of the bailin tool, resolution authorities must ensure that a fair, pru
27 For details, see section 2.2 below.
Burden sharing except when it would endanger financial stability or lead to disproportionate results
No burden sharing required when support takes the form of a capital injection; burden sharing including capital instruments when a state guarantee is granted
Burden sharing: (i) no exception for capital instruments (ii) for subordinated debt, other and preferred liabilities it is at the discretion of resolution authorities2
Commission communicationState aid rules
BRRD resolutionBRRD precautionary public recapitalization1
Excluded liabilities (covered deposits, secured liabilities ...)
Preferred liabilities (client deposits – households, micro, SMEs > EUR 100,000)
Other liabilities
Subordinated debt
Tier 2 capital
Additional tier 1 capital
Core equity tier 1
Internal absorption of at least 8% of liabilities or
20% of RWAs before use of RF
RF may contribute up to 5% of liabilities1
Use of other alternative financing sources (ESM)
Burden sharing of preferred liabilities and eligible depositsnot a condition
Use of public fundsor further use of the RF3
DGS may contribute up to 50% of its target level
Senior debt Eligible deposits(corporates > EUR 100,000)
Possible gaps between state aid and BRRD
Liabilitieseligible for bail-in
Capital instrumentseligible for write- down/conversion
Applicable only in systemic crisis + EC state aid approval required
Loss Absorbency Regimes
Chart 1
Source: Authors’ illustration.1 Required for economic and financial stability reasons to remedy a serious disturbance in the economy of a Member State and preserve financial stability. 2 In exceptional circumstances if not possible within reasonable time, would cause destruction in value, necessary for continuity of critical functions or to avoid widespread contagion.3 Incl. use of other national compartments of the SRF.
Excluded liabilities (covered deposits, secured liabilities ...)
Preferred liabilities (client deposits – households, micro, SMEs > EUR 100,000)
Other liabilities
Subordinated debt
Tier 2 capital
Additional tier 1 capital
Core equity tier 1
Senior debt Eligible deposits(corporates > EUR 100,000)
Excluded liabilities (covered deposits, secured liabilities ...)
Preferred liabilities (client deposits – households, micro, SMEs > EUR 100,000)
Other liabilities
Subordinated debt
Tier 2 capital
Additional tier 1 capital
Core equity tier 1
Eligible deposits(corporates > EUR 100,000)
Senior debt

The Banking Recovery and Resolution Directive and the EU’s Crisis Management Framework: Principles, Interplay with the Comprehensive Assessment and the Consequences for Recapitalizing Credit Institutions in Crisis Situations
82 OESTERREICHISCHE NATIONALBANK
dent and realistic valuation28 is carried out by an independent body. Since such valuations tend to be highly complex and timeconsuming, the required information should be collected as early as possible.
Such an ex ante resolution valuation has different dimensions and purposes. It forms the basis for a number of decisions that have to be taken by the resolution authority during the resolution process and has to be distinguished from the ex post insolvency valuation of differences in treatment in comparison with treatment under normal insolvency proceedings.
First, it provides an assessment of the assets and liabilities of the struggling institution to determine whether the prerequisites for resolution or a writedown and conversion of capital are given and to ascertain the appropriate amounts of capital instruments and, where necessary, eligible liabilities that need to be written down or converted to restore compliance with regulatory requirements and market expectations.
Furthermore, the ex ante resolution valuation should entail a breakdown of creditors into classes based on the priority of consideration under applicable insolvency law and an estima-tion of the treatment that each class of shareholder/creditor would enjoy if the institution were wound up under normal insolvency proceedings (a fictitious
insolvency valuation). That estimation is needed to allow resolution authorities to take the principle of “no creditor worse off” into account.
Depending on the financial situation of the institution under resolution, the resolution authority has to decide which action is appropriate, i.e. whether existing shares or other instruments of ownership should be canceled or transferred to bailedin creditors, and/or whether they should be diluted as a result of the conversion of relevant capital instruments or eligible liabilities to equity.29
A full cancelation or full transfer of shares or other instruments of ownership is necessary if the going-concern value determined in the ex ante resolution valuation is zero or negative. That would necessitate writing down liabilities according to the hierarchical order of creditors. A writedown of liabilities would not be appropriate as long as shareholders retain some value. If the institution has a positive net asset value both on the basis of the assessment of its assets and liabilities and according to the fictitious insolvency valuation, a dilution of existing shareholdings would suffice, making it appropriate to give holders of equity a share in the upside potential.30 In cases where the asset value is zero only according to the fictitious insolvency valuation, authorities may choose from the whole set of
28 The methodology for assessing the value of the assets and liabilities, and for calculating a buffer for additional losses in the provisional valuation, will be specified in further detail by the EBA, in accordance with Article 36(15) of the BRRD. See EBA. Draft regulatory technical standard on valuation. Consultation paper. Novem-ber 7, 2014.
29 See EBA. Draft Guidelines on the treatment of shareholders in bail-in or the write-down and conversion of capital instruments. Consultation Paper. November 11, 2014.
30 Depending on the situation, a dilution may be combined with a partial cancelation or transfer of shares. Where certain shares entail special voting rights, authorities may consider it to be more appropriate, in order to simplify the structure of the reorganized institution, to cancel those shares than to transfer them. Where shares of a public limited company are listed on an official stock exchange, transferring shares, rather than canceling them, may help avoid an interruption of listing and any discontinuity in the valuation of the shares. Although the resolution authority has the power to have new shares or other instruments of ownership listed or admitted to trading, its doing so may be operationally burdensome and cause unnecessary delays.

The Banking Recovery and Resolution Directive and the EU’s Crisis Management Framework: Principles, Interplay with the Comprehensive Assessment and the Consequences
for Recapitalizing Credit Institutions in Crisis Situations
FINANCIAL STABILITY REPORT 28 – DECEMBER 2014 83
options and decide which serves best oper ationally to take the BRRD principles into account.31
The valuation also serves other purposes, including, when the bailin tool is applied, that of informing the decision on the extent of the writedown or conversion of eligible liabilities32 and the eventual contribution of a deposit guarantee scheme.33
On a slightly different note, in the context of the ESM direct bank recapitalization instrument,34 a valuation of the bank’s assets conducted under the guidance of the ESM, in liaison with the ECB and European Commission, is used to determine the contributions of the requesting ESM Member and the ESM under a burdensharing scheme.
Finally, the ex post insolvency valua-tion of differences in treatment in comparison with treatment under normal insolvency proceedings is an element foreseen – in addition to, and separate from, the ex ante resolution valuation – as a tool to safeguard shareholders and creditors against any possible misalignments. It serves to determine whether the treatment of shareholders and creditors in the context of the resolution was worse than that they would have enjoyed in the event of normal insolvency proceedings. If a difference in treatment is ascertained, they will be compensated by the resolution financing mechanism.
31 Where more than one option is appropriate, the contractual terms of instruments of ownership or provisions of national company law may affect the choice between dilution solely through the issuance of new shares, dilution through a combination of canceling shares and issuance of new shares, or dilution through the transfer of some shares, possibly in combination with new issuance.
32 See EBA. Draft Guidelines on the rate of conversion of debt to equity in bail-in or the write-down and conversion of capital instruments. Consultation Paper. November 11, 2014.
33 In accordance with Article 109(1) of the BRRD, and with the safeguards provided for in Article 75 there.34 For details on the ESM direct recapitalization instrument, see Section 2.2 below.
Ex ante resolution valuation Ex post insolvency valuation
Conditions for write-down/conversion of capital instruments
Appropriate resolution action(s)
Conditions forresolution
Determine any difference in treatment
RF payment to shareholdets/creditors/DGS
Valuation of assets and liabilitiesEstimate of insolvency treatmentincl. subdivision of creditors in
classes (priority under insolvency)
Extent of write-down/conversion of eligible liabilities (BAIL-IN)
Extent of transfer of assets/liabilities(incl. consideration to be paid)
Treatment thatshareholders/creditors would
have received under insolvency
Resolution treatment
Valuation Types and Purposes
Chart 2
Source: Authors’ illustration.
• Extent of cancelation/dilution of shares or other instruments of ownership• Extent of write-down/conversion of relevant capital instruments

The Banking Recovery and Resolution Directive and the EU’s Crisis Management Framework: Principles, Interplay with the Comprehensive Assessment and the Consequences for Recapitalizing Credit Institutions in Crisis Situations
84 OESTERREICHISCHE NATIONALBANK
Absorbing losses by means of the bail-in toolIn addition to the saleofbusiness, bridgeinstitution and assetseparation tools at the disposal of the resolution authority, bailin is a further tool that the resolution authority may apply.35 The purposes of the bailin tool are twofold: first, the recapitalization of an institution under resolution so as to restore its ability to comply with the conditions of authorization and to continue to conduct banking activities. This also includes recapitalization to the extent necessary to sustain market confidence in the institution concerned.
Second, the bailin tool may also be applied to reduce principal amounts of debt instruments or to convert them into equity, if such instruments are transferred to a bridge institution or disposed of by way of the saleofbusiness or assetseparation tools. The haircut on debt instruments in this context, or their conversion into equity instruments, also provides capital for the absorption of losses.36 The tool must be deployed in accordance with the resolution principles,37 and must meet the resolution objectives.
The bailin tool is not applicable to covered deposits, client money and fiduciary liabilities, as well as shortdated liabilities to certain infrastructures and institutions.38 Moreover, secured liabilities, including covered bonds, are ex
cluded from any bailin to the extent covered by collateral.
Exclusion of eligible debt from bail-inIn exceptional circumstances, resolution authorities may exclude liabilities from coverage of the bailin tool on an adhoc basis, thus potentially altering the waterfall of liabilities’ loss absorbency. This may have repercussions on the pricing of the instruments concerned.
Specifically, eligible liabilities may be excluded if it is impossible to bail them in within reasonable time, or for financial stability purposes to avoid contagion if the exclusion is necessary and proportionate, or to avoid a destruction of value.39 In such cases, the losses would have to be borne by other creditors to the extent the principle of “no creditor worse off”, i.e. the insolvency counterfactual, allows this.40 Before using its discretionary powers to exclude an eligible liability from bailin, the resolution authority must notify the European Commission. Where contributions of the resolution financing arrangements or an alternative source of financing41 is required, the Commission may prohibit, or require amendments to, the proposed exclusion in order to protect the integrity of the internal market. This is without prejudice to the application by the Commission of the EU’s state aid framework.42
35 The resolution tools are listed in Article 37(2) of the BRRD.36 See Article 43 of the BRRD for both purposes.37 As specified in Article 34 of the BRRD.38 See Article 44(2) of the BRRD for the full list of liabilities excluded from bail-in.39 This is the case if the losses of other creditors would be even higher as a result of the application of the bail-in tool.40 At the same time, however, two further principles must be upheld, namely the principle that losses must be borne
by shareholders and creditors and the principle that adequate resources for resolution financing must be main-tained.
41 See section 2.2 below for details on alternative sources of financing.42 Article 44(12) of the BRRD.

The Banking Recovery and Resolution Directive and the EU’s Crisis Management Framework: Principles, Interplay with the Comprehensive Assessment and the Consequences
for Recapitalizing Credit Institutions in Crisis Situations
FINANCIAL STABILITY REPORT 28 – DECEMBER 2014 85
Resolution financing arrangements, deposit guarantee scheme funds and alternative sources of financing to fill the gap caused by bail-in exclusionsIf losses cannot be passed on to other creditors to any sufficient extent, the required contributions43 may be made by resolution financing arrangements only if (1) prior contributions to loss absorbance by other holders of equity and debt amount to at least 8% of the total liabilities, including own funds, of the institution under resolution and (2) the contribution of the resolution financing arrangement does not exceed 5% of said total liabilities, including own funds.44 Only in exceptional circumstances and only if all unsecured, nonpreferred liabilities other than eligible de-posits have been written down or converted in full and the resolution fund has been used to contribute to bailin in lieu of those liabilities to the limits permissible (i.e. 5%), may the resolution authority seek further funding from alternative sources of financing.45 By way of an alternative, or as an additional measure, recourse may be taken to available resources from ex ante contributions to the resolution financing arrangements that have not yet been used.
It is this possible source of financing (other banking industry contributions to resolution financing arrangements and funding of public sources, including direct or indirect funds from other
Member States)46 that makes the discretionary power to exclude liabilities from bailin a highly sensitive issue. Interesting in this respect is also the fact that not all eligible liabilities have to be written down before such sources can be drawn upon, within the scope defined by the BRRD, because write-downs of eligible deposits are not deemed to be a prerequisite.
The use of deposit guarantee scheme funds in the context of resolution requires that depositors continue to have access to their deposits and that the usual case of a payout has been avoided through the application of resolution tools. In all cases, the liability of a deposit guarantee scheme in resolution may not exceed the net losses the scheme would have incurred in the event of a windingup under normal insolvency pro-ceedings and the overall amount thereof may not be greater than 0.4% of the cove-red deposits, i.e. the equivalent of 50% of the overall target level for the financial resources that have to be available to deposit guarantee schemes at the end of the settingup phase.47
When the bail-in tool is applied, the deposit guarantee scheme is liable for payment of the amount by which covered deposits would have been written down to absorb losses if they had been included within the amount of eligible liabilities to ensure that the net asset value of the institution under resolution is equal to zero and had been written
43 Article 44(4) and (5) of the BRRD.44 Instead of the limit of 8% of the total liabilities, including own funds, of the institution under resolution, a
limit of 20% of the risk-weighted assets of the institution concerned may be referred to.45 According to Article 105 of the BRRD, Member States must ensure that financing arrangements under their
jurisdiction are enabled to contract borrowings or other forms of support from institutions or other third parties in the event that the ex ante contributions are not sufficient to cover losses, and that the extraordinary ex post contributions provided for in Article 104 are not immediately accessible or sufficient. Also, according to Article 37(10) of the BRRD, in the very exceptional situation of a systemic crisis, the resolution authority may seek fund-ing from alternative sources of financing through the use of government stabilization tools provided for in Articles 56 to 58 of the BRRD.
46 Subject to the financial stability reasons as indicated in the BRRD.47 Unless a Member State decides to set a higher limit (Article 109 of the BRRD).

The Banking Recovery and Resolution Directive and the EU’s Crisis Management Framework: Principles, Interplay with the Comprehensive Assessment and the Consequences for Recapitalizing Credit Institutions in Crisis Situations
86 OESTERREICHISCHE NATIONALBANK
down to the same extent as the liabilities of creditors with the same level of priority under national insolvency proceedings. Not involving the deposit guarantee scheme would constitute an unfair advantage over the rest of creditors subject to resolution powers.
When one or more resolution tools ot-her than the bail-in tool are applied, the deposit guarantee scheme is liable for payment of the amount of losses covered depositors would have suffered, according to the BRRD waterfall of liabilities’ lossabsorbency, under national insolvency proceedings.
The financial resources of the deposit guarantee scheme do not compete with the resolution financing mechanism, nor can they be used instead of the latter. They are independent from each other. The decision of a resolution authority, in exceptional circumstances, to exclude or partially exclude certain eligible liabilities from bailin under the conditions laid down in the BRRD and a potential use of the resolution financing mechanism to cover the losses that have not been absorbed does not have any impact on the liability of the deposit guarantee scheme. In such cases, the financial resources of a deposit guarantee scheme may be used in addition to those
of a resolution mechanism. The latter may be needed to capitalize, or grant loans to, a bridge bank or an asset management vehicle, irrespective of the contribution of a deposit guarantee scheme.
2.2 Public Resources, the European Stability Mechanism and the Single Resolution Fund to Support Resolution
ESM direct bank recapitalization the last line of defense (really?), but depositors not in the line of fireIn June 2014, the euro area Member States reached a preliminary agreement on the future ESM direct recapitalization instrument.48 Together with the forthcoming Single Resolution Fund (SRF), it is a manifestation of the transnational pooling of resources within the euro area to backstop bank recapitalization, and thus accommodate possible financial stability concerns associated with resolution cases.
The ESM direct recapitalization instrument may only be used if a set of strict conditions is met, e.g. that the requesting ESM Member is unable to provide financial assistance to the beneficiary bank49 without very serious effects on its own fiscal sustainability.50 Furthermore, to minimize conflicts of
48 On December 8, 2014, the ESM Board of Governors adopted the ESM direct recapitalization instrument for euro area financial institutions. Until then, the ESM can only recapitalize banks indirectly through loans to the Member States where the troubled bank is located. As regards the statistical treatment of ESM operations and their impact on Maastricht debt, it is important to note that the ESM has the status of an international organi-zation (see Decision of Eurostat on deficit and debt and the Statistical classification of the European Stability Mechanism of 31 January 2013). Operations undertaken by the ESM, such as borrowing on financial markets and granting loans to beneficiaries, will not be rerouted to the euro area Member States. Also, payment of the paid-in capital is considered as an increase in equity for the participating Member States, with no impact on government deficit. Only in the case when the ESM would have to record a loss in a support operation and would compensate this loss by a call in capital, it will be treated as a capital transfer and, thus, an expenditure of government.
49 Including any indirect recapitalization by the ESM through the routing of funds to the respective Member State.50 The decision to provide stability support through the ESM, the choice of instruments and the financial terms and
conditions are taken by the ESM Board of Governors by mutual agreement (Article 5(6)( f) of the ESM Treaty). However, an emergency voting procedure can be used in cases where the economic and financial sustainability of the euro area is threatened. In that case, a qualified majority of 85% of the votes cast is required (Article 4(4) of the ESM Treaty).

The Banking Recovery and Resolution Directive and the EU’s Crisis Management Framework: Principles, Interplay with the Comprehensive Assessment and the Consequences
for Recapitalizing Credit Institutions in Crisis Situations
FINANCIAL STABILITY REPORT 28 – DECEMBER 2014 87
interest, the requesting ESM Member would need to contribute financially to the recapitalization, and a Memorandum of Understanding detailing policy conditions for that Member State’s financial sector would be concluded. The request addressed to the ESM by the ESM Member will include, inter alia, the amount of capital needed, an opinion of the ECB51 on the bank’s financial situation and the result of the most recent stress test. The design of the mandatory private sector contribution as a prerequisite for the use of the ESM direct recapitalization instrument will require a staggered introduction over the period from 2015 and 2016 since the bailin instrument may not be available in all Member States until January 2016.
The ESM may contribute to the resolution of an institution by way of acquiring shares or other capital instruments including hybrid instruments or contingent capital in the beneficiary institution, subject to the ESM Board of Governors authorization. The participation is intended to be temporary and a limit on the total amount of ESM resources available for the ESM direct recapitalization instrument is intended to be set at EUR 60 billion. The ESM direct recapitalization instrument is not
intended to be used as a precautionary instrument as defined in the BRRD.
The interplay between the BRRD – specifically the discretion to exclude liabilities from bailin – and the requirements for the ESM direct recapitalization instrument will be a sensitive issue as under the BRRD52 eligible deposits need not be written down as a prerequisite for (directly or indirectly through the SRF, once available) seeking funds from alternative funding sources.
The SRM, the SRF and the Intergovern-mental Agreement
In July 2014, an EU regulation establishing uniform rules and a uniform procedure for the resolution of credit institutions and certain investment firms within the framework of a Single Resolution Mechanism was published.53 While the substantive provisions generally correspond to those of the BRRD, the regulation is aimed mainly at tackling the lack of a unified decisionmaking process for resolution.54 What is important is that, as from January 1, 2016, the SRF will be considered to be the resolution financing arrangement of the participating Member States.55
In this context, the representatives of all EU Member States except the
51 In cases where the institution is already directly supervised by the ECB. Otherwise, the national competent au-thority will provide such an opinion, and the ECB would be requested to take over direct supervision.
52 Subject to other conditions set out in the BRRD, including financial stability aspects.53 Regulation (EU) No 806/2014 of the European Parliament and the European Council of 15 July 2014 establish-
ing uniform rules and a uniform procedure for the resolution of credit institutions and certain investment firms in the framework of a Single Resolution Mechanism and a Single Resolution Fund and amending Regulation (EU) No 1093/2010.
54 For Member States participating in the Single Supervisory Mechanism (SSM), centralized powers of resolution have been established and entrusted to the Single Resolution Board (SRB) that will cooperate with national resolution authorities. The SRM is a further element in the process of harmonization regarding prudential super-vision, brought about by the establishment of the EBA, the single rulebook on prudential supervision and the establishment of the SSM, which is responsible for the application of the EU’s prudential supervision rules. The SRB will become operational on January 1, 2015.
55 Article 96 of the SRM Regulation. However, the implementation may be postponed if the conditions for the trans-fer of contributions to the SRF have not been met.

The Banking Recovery and Resolution Directive and the EU’s Crisis Management Framework: Principles, Interplay with the Comprehensive Assessment and the Consequences for Recapitalizing Credit Institutions in Crisis Situations
88 OESTERREICHISCHE NATIONALBANK
United Kingdom and Sweden have signed an intergovernmental agreement on the transfer and progressive mutualization of contributions to the SRF (the “IGA”).56 Under the terms of the IGA, contributions by banks that are levied at the national level57 will be transferred to the SRF, which will initially consist of “compartments”, i.e. segments comprising the contributions from each individual Member State.58
These segments will be gradually merged over a transitional period of eight years. The signatories to the IGA have agreed that, if the resources available in the SRF are not sufficient for a particular case of resolution and if the ex post contributions that are then to be collected from the banks in order to cover the additional amounts required are not immediately accessible, the Member States involved in that particular act of resolution should provide bridge financing from national sources, or from the ESM, in line with agreed procedures. Furthermore, a common backstop to facilitate borrowings by the SRF will be developed.
In any event, systematic recourse to the bailin of shareholders and creditors, as provided for in both the BRRD and the SRM Regulation, will also be a prerequisite for access to the resources of the SRF. Against the backdrop of the progressive mutualization of contributions to the SRF, the discretionary power to exclude liabilities from a bailin becomes a particularly delicate issue.
3 Follow-Up to the ECB’s Comprehensive Assessment – A Test Case for the Application of BRRD Principles, also with a View to Future Stress Tests
The BRRD, together with the EU’s state aid regime and the supervisory rules set out in the CRR/CRD IV,59 is the key legal framework for the followup to the ECB’s comprehensive assessment exercise and the EUwide stress tests. Against the backdrop of this new framework, several scenarios are conceivable with respect to how banks, supervisors and resolution authorities might deal with capital
56 Council of the European Union. Agreement on the transfer and mutualisation of contributions to the Single Resolution Fund. 8457/14. May 14, 2014. This intergovernmental agreement was deemed necessary because the participating Member States that collect the contributions from institutions located in their respective territories according to the BRRD and the SRM Regulation, remain responsible for transferring those contributions to the SRF. The signatories to the agreement adopted a declaration signaling that they will strive to complete the rati-fication process in time to permit the SRM to become fully operational by January 1, 2016. It is in this context that the Council’s implementing act to specify the methodology for the calculation of contributions of banks to the SRF has been debated so intensively.
57 The methodology used for the calculation of the risk-based contributions under the BRRD will be the same as that used for the SRM. However, the shift from a national to a single funding target (SRM level) will cause the individual and aggregate contributions of banks established in each Member State to change.
58 The obligation to transfer the contributions levied at the national level to the SRF is not derived from EU law. Said obligation is established by the IGA, which lays down the conditions under which the contracting parties agree, in accordance with their respective constitutional requirements, to transfer the contributions they levy at the national level to the SRF. Channeling financial resources to the SRF is intended to enable it to function properly.
59 CRR/CRD IV is used to refer to the combined package of legal provisions set out in the Regulation (EU) No 575/2013 of the European Parliament and of the Council of 26 June 2013 on prudential requirements for credit institutions and investment firms and amending Regulation (EU) No 648/2012 and the Directive 2013/36/EU of the European Parliament and of the Council of 26 June 2013 on access to the activity of credit institutions and the prudential supervision of credit institutions and investment firms, amending Directive 2002/87/EC and repealing Directives 2006/48/EC and 2006/49/EC.
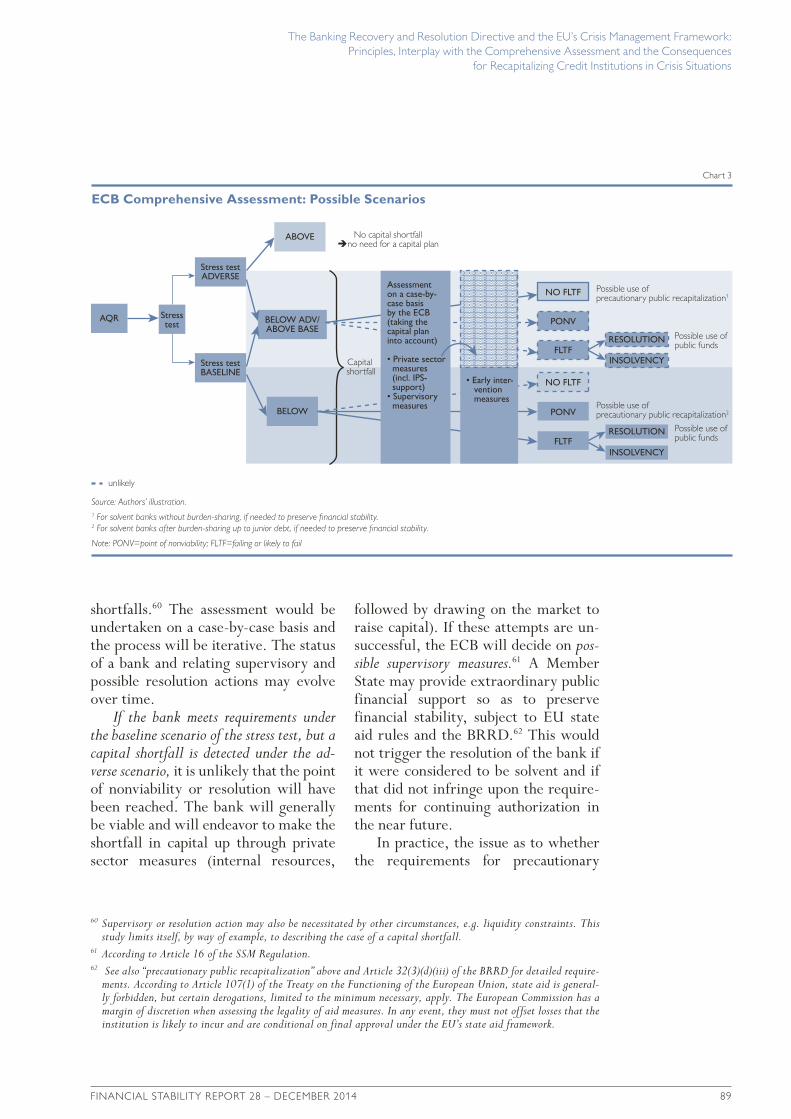
The Banking Recovery and Resolution Directive and the EU’s Crisis Management Framework: Principles, Interplay with the Comprehensive Assessment and the Consequences
for Recapitalizing Credit Institutions in Crisis Situations
FINANCIAL STABILITY REPORT 28 – DECEMBER 2014 89
shortfalls.60 The assessment would be undertaken on a casebycase basis and the process will be iterative. The status of a bank and relating supervisory and possible resolution actions may evolve over time.
If the bank meets requirements under the baseline scenario of the stress test, but a capital shortfall is detected under the ad-verse scenario, it is unlikely that the point of nonviability or resolution will have been reached. The bank will generally be viable and will endeavor to make the shortfall in capital up through private sector measures (internal resources,
followed by drawing on the market to raise capital). If these attempts are unsuccessful, the ECB will decide on pos-sible supervisory measures.61 A Member State may provide extraordinary public financial support so as to preserve financial stability, subject to EU state aid rules and the BRRD.62 This would not trigger the resolution of the bank if it were considered to be solvent and if that did not infringe upon the requirements for continuing authorization in the near future.
In practice, the issue as to whether the requirements for precautionary
60 Supervisory or resolution action may also be necessitated by other circumstances, e.g. liquidity constraints. This study limits itself, by way of example, to describing the case of a capital shortfall.
61 According to Article 16 of the SSM Regulation.62 See also “precautionary public recapitalization” above and Article 32(3)(d)(iii) of the BRRD for detailed require-
ments. According to Article 107(1) of the Treaty on the Functioning of the European Union, state aid is general-ly forbidden, but certain derogations, limited to the minimum necessary, apply. The European Commission has a margin of discretion when assessing the legality of aid measures. In any event, they must not offset losses that the institution is likely to incur and are conditional on final approval under the EU’s state aid framework.
No capital shortfall no need for a capital plan
Capital shortfall
ECB Comprehensive Assessment: Possible Scenarios
Chart 3
Source: Authors’ illustration.1 For solvent banks without burden-sharing, if needed to preserve financial stability.2 For solvent banks after burden-sharing up to junior debt, if needed to preserve financial stability.
Note: PONV=point of nonviability; FLTF=failing or likely to fail
ABOVE
BELOW
NO FLTF Possible use of precautionary public recapitalization1
Possible use of precautionary public recapitalization2
Possible use of public funds
Possible use of public funds
PONV
FLTF
FLTF
RESOLUTION
INSOLVENCY
RESOLUTION
INSOLVENCY
NO FLTF
PONV
Stress testADVERSE
Stress testBASELINE
Stresstest BELOW ADV/
ABOVE BASEAQR
unlikely
Assessment on a case-by- case basisby the ECB (taking the capital plan into account)
• Private sector measures (incl. IPS- support)• Supervisory measures
• Early inter- vention measures

The Banking Recovery and Resolution Directive and the EU’s Crisis Management Framework: Principles, Interplay with the Comprehensive Assessment and the Consequences for Recapitalizing Credit Institutions in Crisis Situations
90 OESTERREICHISCHE NATIONALBANK
public recapitalization are given is not decided by a single body on its own responsibility,63 so that there is scope for a possible conflict with respect to the interpretation of burdensharing requirements under the BRRD and that under state aid rules.
A capital shortfall under the baseline scenario indicates a higher probability that a capital shortfall will materialize, so that there would be less room for any “precautionary public recapitalization.”64 From the perspective of competition law, a bank that does not meet minimum regulatory capital requirements can generally receive state aid only after holders of equity and hybrid capital, as well as subordinate creditors, have contributed adequately to offset losses. That aside, an assessment of the viability of the respective bank would have to be carried out from a BRRD perspective.
4 Summary
A new framework has been built to define when banks are considered not to be viable any longer, how such banks can exit the market without creating widespread financial distress and how a smooth exit or repositioning should be financed. It comprises a complex set of rules and international agreements, with various authorities in charge.
The key to understanding them is an acknowledgement of the embedded
tradeoffs between coordinative arrangements to ensure financial stability and marketbased policies. The interests of the owners and creditors of banks, of the banking industry that contributes to resolution funds and of the general public need to be brought into balance. The waterfall of liabilities’ loss absorbency is characterized by a policy preference for protecting depositors, which in turn leads to a higher share in recapitalization contributions that must be made by subordinated and senior unsecured creditors and, in exceptional circumstances, by resolution funds that are potentially underpinned by euro areawide support mechanisms.
Crossborder aspects play a prominent role in terms of the distribution of resolution costs and decisionmaking powers. The shared responsibility for banking supervision at the euro area level will lead to a gradual sharing of resolution costs within the Single Resolution Mechanism. The terms of the Single Resolution Fund, and the potential role of the ESM as provider of a backstop for this fund, and a prospective direct recapitalization instrument for banks all bear the hallmarks of the aforementioned tradeoffs in terms of the allocation of losses to various stakeholders, associated conditionalities and the degree of mutualization within the euro area.
63 According to Article 32(1)(a) of the BRRD, it is the responsibility of the competent authority ( for significant institutions, the ECB), after consulting the resolution authority, or, if a Member State avails itself of this option, that of the resolution authority, after consulting the competent authority, to make this determination. However, the European Commission is responsible for assessing the compatibility of aid measures with the internal market.
64 As it could be argued that the public measure would offset losses that the bank is likely to incur, such a measure would probably not qualify as “precautionary” within the meaning of Article 32(4)(d) of the BRRD.

Annex of Tables

92 OESTERREICHISCHE NATIONALBANK
International Financial Market Indicators Table
Short-Term Interest Rates A1
Long-Term Interest Rates A2
Stock Indices A3
Corporate Bond Spreads A4
Financial Indicators of the Austrian Corporate and Household Sectors
Financial Investment of Households A5
Household Income and Savings A6
Financing of Nonfinancial Corporations A7
Insolvency Indicators A8
Housing Market Indicators A9
Austrian Financial Intermediaries
Total Assets and Off-Balance Sheet Operations A10
Sectoral Distribution of Domestic Loans A11
Loan Quality A12
Exposure to CESEE A13
Profitability on an Unconsolidated Basis A14
Profitability of Austrian Banks’ Subsidiaries in CESEE A15
Profitability on a Consolidated Basis A16
Solvency A17
Liquidity Risk A18
Market Risk A19
Market Indicators of Selected Austrian Financial Instruments A20
Key Indicators of Austrian Insurance Companies A21
Assets Held by Austrian Mutual Funds A22
Structure and Profitability of Austrian Fund Management Companies A23
Assets Held by Austrian Pension Funds A24
Assets Held by Austrian Severance Funds A25
Transactions and System Disturbances in Payment and Securities Settlement Systems A26
Cutoff date for data: November 17, 2014
Conventions used in the tables:
x = No data can be indicated for technical reasons
. . = Data not available at the reporting date
Revisions of data published in earlier volumes are not indicated.
Discrepancies may arise from rounding.
Annex of Tables

Annex of Tables
FINANCIAL STABILITY REPORT 28 – DECEMBER 2014 93
International Financial Market Indicators
Table A1
Short-Term Interest Rates1
2008 2009 2010 2011 2012 2013 H1 13 H1 14
Three-month rates, period average, %
Euro area 4.63 1.23 0.81 1.39 0.57 0.22 0.21 0.30U.S.A. 2.91 0.69 0.34 0.34 0.43 0.27 0.28 0.23Japan 0.85 0.59 0.39 0.34 0.33 0.24 0.26 0.21United Kingdom 5.49 1.23 0.74 0.88 0.86 0.50 0.50 0.50Switzerland 2.58 0.38 0.19 0.12 0.07 0.02 0.02 0.02Czech Republic 4.04 2.19 1.31 1.19 1.00 0.46 0.48 0.37Hungary 8.87 8.64 5.51 6.19 6.98 4.31 4.99 2.68Poland 6.36 4.42 3.92 4.54 4.91 3.02 3.36 2.71
Source: Bloomberg, Eurostat, Thomson Reuters.1 Average rate at which a prime bank is willing to lend funds to another prime bank for three months.
Table A2
Long-Term Interest Rates1
2008 2009 2010 2011 2012 2013 H1 13 H1 14
Ten-year rates, period average, %
Euro area 4.31 3.82 3.62 4.41 3.92 3.00 2.94 2.44U.S.A. 3.65 3.24 3.20 2.77 1.79 2.34 1.96 2.68Japan 1.49 1.34 1.17 1.12 0.85 0.71 0.71 0.61United Kingdom 4.50 3.36 3.36 2.87 1.74 2.03 1.74 2.35Switzerland 2.90 2.20 1.63 1.47 0.65 0.95 0.78 0.87Austria 4.36 3.94 3.23 3.32 2.37 2.01 1.84 1.83Czech Republic 4.63 4.84 3.88 3.71 2.78 2.11 1.93 2.03Hungary 8.24 9.12 7.28 7.64 7.89 5.92 5.94 5.42Poland 6.07 6.12 5.78 5.96 5.00 4.03 3.76 4.10
Source: ECB, Eurostat, Thomson Reuters, national sources.1 Yields of long-term government bonds.

Annex of Tables
94 OESTERREICHISCHE NATIONALBANK
Table A3
Stock Indices
2008 2009 2010 2011 2012 2013 H1 13 H1 14
Annual change in %, period average
Euro area: EURO STOXX –24.7 –25.3 13.4 –3.6 –6.4 17.5 15.6 19.1U.S.A.: S&P 500 –17.3 –22.4 20.2 11.3 8.7 19.1 15.9 19.7Japan: Nikkei 225 –28.5 –23.1 7.2 –5.9 –3.4 48.8 37.0 19.9United Kingdom: FTSE 100 –16.2 –14.9 19.8 3.9 1.0 12.8 12.1 5.6Switzerland: SMI –22.9 –18.2 14.3 –7.0 4.9 24.1 26.4 10.2Austria: ATX –27.3 –36.5 19.9 –3.7 –14.8 16.9 17.9 5.4Czech Republic: PX 50 –23.5 –29.2 21.7 –5.1 –14.6 2.5 4.6 2.7Hungary: BUX –24.3 –18.7 40.1 –8.7 –12.0 3.3 4.1 –2.8Poland: WIG –31.0 –21.3 33.6 4.4 –6.7 16.1 15.4 12.2
Source: Thomson Reuters.
Table A4
Corporate Bond Spreads1
2008 2009 2010 2011 2012 2013 H1 13 H1 14
Percentage points, period average
Euro area
AAA 2.04 2.17 1.33 1.90 1.47 0.89 0.94 0.70BBB 3.84 5.23 2.95 3.75 3.56 2.25 2.35 1.80
U.S.A.
AAA 3.03 2.57 1.32 1.68 1.50 1.12 1.12 0.87BBB 4.16 4.51 2.21 2.34 2.59 2.17 2.15 1.75
Source: Thomson Reuters.1 Spreads of seven- to ten-year corporate bonds against ten-year government bonds (euro area: German government bonds).

Annex of Tables
FINANCIAL STABILITY REPORT 28 – DECEMBER 2014 95
Financial Indicators of the Austrian Corporate and Household Sectors
Table A7
Financing of Nonfinancial Corporations
2008 2009 2010 2011 2012 2013 H1 13 H1 14
EUR billion, four-quarter moving sum
Debt securities1 1.8 4.3 1.4 4.2 2.8 0.9 2.9 –2.1Loans 13.0 –18.0 9.7 13.0 –1.8 –1.6 –4.8 –1.4Shares and other equity 8.1 2.9 0.5 9.7 2.6 6.9 4.7 8.3Other accounts payable –0.2 –5.9 5.8 3.3 1.7 2.2 –0.2 4.7Total external financing 22.7 –16.7 17.4 30.2 5.3 8.4 2.6 9.5
Source: OeNB (financial accounts).1 Including financial derivatives.
Table A6
Household1 Income and Savings
2008 2009 2010 2011 2012 2013 H1 13 H1 14
EUR billion, four-quarter moving sum
Net disposable income 171.6 171.9 174.1 178.0 185.7 185.8 181.3 188.0Savings 20.7 19.5 16.6 14.0 16.9 13.6 11.2 14.1Saving ratio in %2 11.9 11.3 9.4 7.8 9.0 7.3 6.1 7.4
Source: Statistics Austria (national accounts broken down by sectors).1 Including nonprofit institutions serving households.2 Saving ratio = savings / (disposable income + increase in accrued occupational pension benefits).
Table A5
Financial Investment of Households1
2008 2009 2010 2011 2012 2013 H1 13 H1 14
EUR billion, four-quarter moving sum
Currency 0.7 0.9 1.0 1.1 0.6 1.2 0.7 1.2Deposits 11.6 7.6 1.6 4.6 3.8 1.9 –1.5 3.7Debt securities2 4.8 –0.4 1.5 1.8 0.1 –1.8 –1.0 –2.2Shares and other equity3 1.6 1.7 1.7 0.8 1.1 –0.1 0.4 0.2Mutual fund shares –4.0 0.9 2.4 –1.5 0.9 2.7 2.6 2.5Insurance technical reserves 3.7 4.6 3.7 2.1 2.7 2.4 2.6 2.6Other accounts receivable 1.1 0.2 0.8 1.0 1.6 1.2 1.4 1.2Total financial investment 19.5 15.5 12.7 9.9 10.8 7.5 5.2 9.2
Source: OeNB (financial accounts).1 Including nonprofit institutions serving households.2 Including financial derivatives.3 Other than mutual fund shares.

Annex of Tables
96 OESTERREICHISCHE NATIONALBANK
Table A8
Insolvency Indicators
2008 2009 2010 2011 2012 2013 H1 13 H1 14
Default liabilities (EUR million) 2,969 4,035 4,700 2,775 3,206 6,255 3,746 1,093Defaults (number) 3,270 3,741 3,522 3,260 3,505 3,266 1,639 1,654
Source: Kreditschutzverband von 1870.
Note: Default liabilities for 2013 (first half ) include one large insolvency.
Table A9
Housing Market Indicators
2006 2007 2008 2009 2010 2011 2012 2013
2000=100Residential Property Price IndexVienna 113.4 119.2 125.5 133.5 143.9 156.1 180.7 196.3Austria 109.0 114.1 115.4 119.8 127.3 132.7 149.1 156.0Austria excluding Vienna 107.4 112.3 111.6 114.8 121.1 124.0 137.4 141.1
2000=100Rents1
Vienna: condominiums 106.2 114.9 116.8 116.3 117.7 121.0 126.3 129.5Austria excluding Vienna: condominiums 111.8 115.9 122.7 144.7 145.9 148.2 144.1 162.5Austria excluding Vienna: single-family houses 101.0 108.5 112.9 101.5 101.7 97.1 94.6 95.5Dwelling rents excluding operational costs (as measured in the CPI) 89.5 91.2 92.4 96.7 100.0 103.3 107.8 111.2
OeNB fundamentals indicator for residential property prices
Deviation from fundamental price in %
Vienna –6.7 –5.1 –1.6 –2.7 0.4 6.1 15.2 19.6Austria –9.0 –7.6 –7.3 –12.8 –8.9 –5.4 0.3 –0.6
Source: OeNB, Vienna University of Technology.1 Free and controlled prices..

Annex of Tables
FINANCIAL STABILITY REPORT 28 – DECEMBER 2014 97
Table A10
Total Assets and Off-Balance Sheet Operations
2008 2009 2010 2011 2012 2013 H1 13 H1 14
End of period, EUR million
Total assets on an unconsolidated basis 1,069,100 1,029,043 978,559 1,014,278 982,114 927,973 945,531 917,824 of which: total domestic assets 692,566 691,466 659,561 693,394 678,500 645,275 644,481 634,299Total assets on a consolidated basis 1,175,646 1,139,961 1,130,853 1,166,313 1,163,595 1,089,713 1,125,442 1,071,601 Total assets of CESEE subsidiaries1 267,484 254,356 263,810 270,052 276,352 264,998 267,184 284,191 of which: NMS-20042 131,809 126,916 130,530 126,737 136,631 130,478 132,573 128,303
NMS-20073 40,679 40,488 41,275 42,316 40,886 39,764 39,623 39,094 SEE4 46,745 48,667 49,122 51,489 50,976 50,209 50,924 73,464 CIS5 48,251 38,285 42,883 49,510 47,859 44,547 44,064 43,331
Leverage ratio (consolidated in %)6 4.5 5.2 5.8 5.8 6.1 6.5 6.4 5.4
Source: OeNB.1 Excluding Yapı ve Kredi Bankası (not fully consolidated by parent bank UniCredit Bank Austria).2 New EU Member States since 2004: Czech Republic, Estonia, Latvia, Lithuania, Hungary, Poland, Slovenia, Slovakia.3 New EU Member States since 2007: Bulgaria, Romania.4 Southeastern Europe: Albania, Bosnia and Herzegovina, Croatia, Kosovo, Montenegro, former Yugoslav Republic of Macedonia, Serbia, Turkey.5 Commonwealth of Independent States: Armenia, Azerbaijan, Belarus, Kazakhstan, Kyrgyzstan, Moldova, Russia, Tajikistan, Turkmenistan, Ukraine, Uzbekistan, including Georgia.6 Definition up to 2013: Tier 1 capital after deduction in % of total assets. Definition as of 2014 according to Basel III.
Note: Data on off-balance sheet operations refer to nominal values on an unconsolidated basis.
Austrian Financial Intermediaries1
1 Since 2007, the International Monetary Fund (IMF) has published Financial Soundness Indicators (FSIs) for Austria (see also www.imf.org). In contrast to some FSIs that take only domestically-owned banks into account, the OeNB’s Financial Stability Report takes into account all banks operating in Austria. For this reason, some of the figures presented here may deviate from the figures published by the IMF.
Table A11
Sectoral Distribution of Domestic Loans
2008 2009 2010 2011 2012 2013 H1 13 H1 14
End of period, EUR million
All currencies combined
Banks 208,218 195,737 169,596 184,789 191,921 172,024 162,290 147,161 Nonbanks 314,399 311,794 321,524 330,057 330,378 326,820 328,472 327,993 of which: nonfinancial corporations 134,897 132,346 135,427 138,930 140,383 140,291 141,073 141,303
households1 127,828 128,178 135,215 138,355 139,048 139,052 137,729 139,915 general government 24,056 24,923 26,374 29,015 27,972 26,007 26,995 25,180 other financial intermediaries 27,213 26,063 24,324 23,586 22,806 21,244 22,439 21,456
Foreign currency
Banks 54,977 42,780 25,851 25,288 41,979 19,704 19,384 16,254 Nonbanks 56,797 56,515 58,746 57,301 47,652 40,108 43,341 38,546 of which: nonfinancial corporations 12,441 11,473 12,550 12,181 9,155 6,985 8,011 6,536
households1 39,138 37,064 40,040 38,718 32,904 28,385 30,008 27,219 general government 1,673 1,628 2,627 3,266 2,827 2,477 2,522 2,713 other financial intermediaries 3,514 3,374 3,525 3,133 2,761 2,257 2,793 2,073
Source: OeNB.1 Including nonprofit institutions serving households.
Note: Figures are based on monetary statistics.
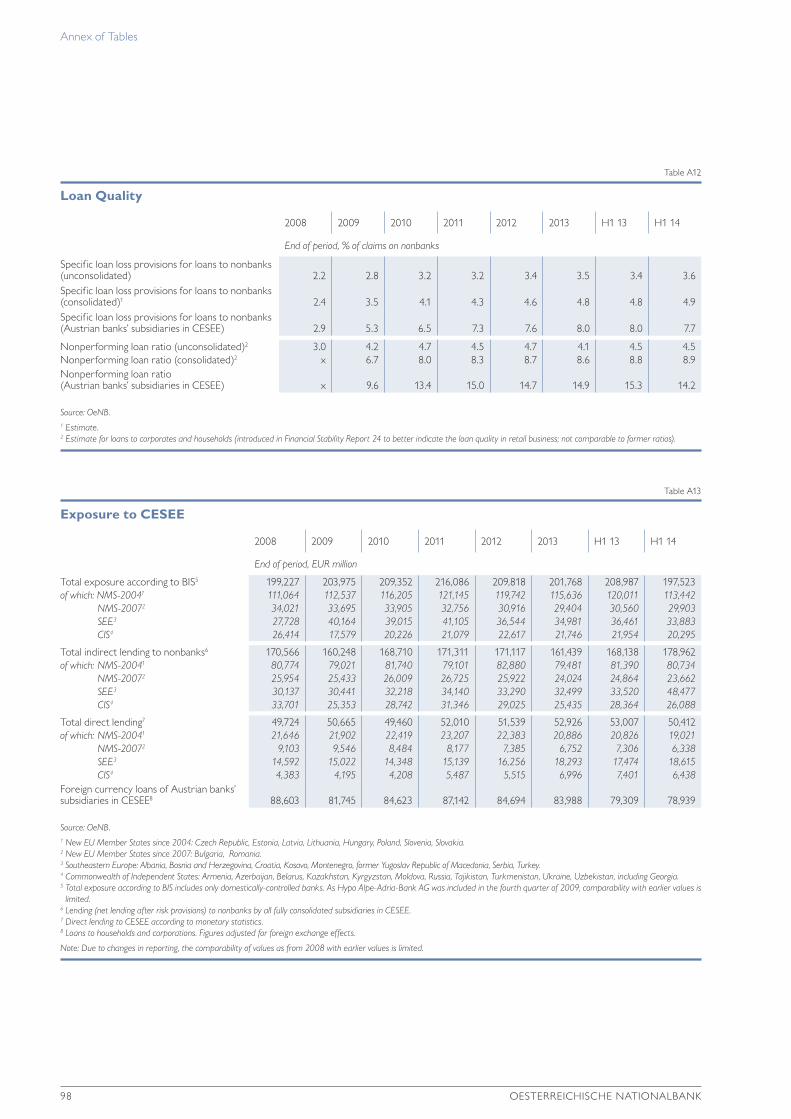
Annex of Tables
98 OESTERREICHISCHE NATIONALBANK
Table A12
Loan Quality
2008 2009 2010 2011 2012 2013 H1 13 H1 14
End of period, % of claims on nonbanks
Specific loan loss provisions for loans to nonbanks (unconsolidated) 2.2 2.8 3.2 3.2 3.4 3.5 3.4 3.6 Specific loan loss provisions for loans to nonbanks (consolidated)1 2.4 3.5 4.1 4.3 4.6 4.8 4.8 4.9 Specific loan loss provisions for loans to nonbanks (Austrian banks’ subsidiaries in CESEE) 2.9 5.3 6.5 7.3 7.6 8.0 8.0 7.7
Nonperforming loan ratio (unconsolidated)2 3.0 4.2 4.7 4.5 4.7 4.1 4.5 4.5 Nonperforming loan ratio (consolidated)2 x 6.7 8.0 8.3 8.7 8.6 8.8 8.9 Nonperforming loan ratio (Austrian banks’ subsidiaries in CESEE) x 9.6 13.4 15.0 14.7 14.9 15.3 14.2
Source: OeNB.1 Estimate.2 Estimate for loans to corporates and households (introduced in Financial Stability Report 24 to better indicate the loan quality in retail business; not comparable to former ratios).
Table A13
Exposure to CESEE
2008 2009 2010 2011 2012 2013 H1 13 H1 14
End of period, EUR million
Total exposure according to BIS5 199,227 203,975 209,352 216,086 209,818 201,768 208,987 197,523 of which: NMS-20041 111,064 112,537 116,205 121,145 119,742 115,636 120,011 113,442 NMS-20072 34,021 33,695 33,905 32,756 30,916 29,404 30,560 29,903 SEE3 27,728 40,164 39,015 41,105 36,544 34,981 36,461 33,883 CIS4 26,414 17,579 20,226 21,079 22,617 21,746 21,954 20,295
Total indirect lending to nonbanks6 170,566 160,248 168,710 171,311 171,117 161,439 168,138 178,962 of which: NMS-20041 80,774 79,021 81,740 79,101 82,880 79,481 81,390 80,734 NMS-20072 25,954 25,433 26,009 26,725 25,922 24,024 24,864 23,662 SEE3 30,137 30,441 32,218 34,140 33,290 32,499 33,520 48,477 CIS4 33,701 25,353 28,742 31,346 29,025 25,435 28,364 26,088
Total direct lending7 49,724 50,665 49,460 52,010 51,539 52,926 53,007 50,412 of which: NMS-20041 21,646 21,902 22,419 23,207 22,383 20,886 20,826 19,021 NMS-20072 9,103 9,546 8,484 8,177 7,385 6,752 7,306 6,338 SEE3 14,592 15,022 14,348 15,139 16,256 18,293 17,474 18,615 CIS4 4,383 4,195 4,208 5,487 5,515 6,996 7,401 6,438 Foreign currency loans of Austrian banks’ subsidiaries in CESEE8 88,603 81,745 84,623 87,142 84,694 83,988 79,309 78,939
Source: OeNB.1 New EU Member States since 2004: Czech Republic, Estonia, Latvia, Lithuania, Hungary, Poland, Slovenia, Slovakia.2 New EU Member States since 2007: Bulgaria, Romania.3 Southeastern Europe: Albania, Bosnia and Herzegovina, Croatia, Kosovo, Montenegro, former Yugoslav Republic of Macedonia, Serbia, Turkey.4 Commonwealth of Independent States: Armenia, Azerbaijan, Belarus, Kazakhstan, Kyrgyzstan, Moldova, Russia, Tajikistan, Turkmenistan, Ukraine, Uzbekistan, including Georgia.5 Total exposure according to BIS includes only domestically-controlled banks. As Hypo Alpe-Adria-Bank AG was included in the fourth quarter of 2009, comparability with earlier values is
limited.6 Lending (net lending after risk provisions) to nonbanks by all fully consolidated subsidiaries in CESEE.7 Direct lending to CESEE according to monetary statistics.8 Loans to households and corporations. Figures adjusted for foreign exchange effects.
Note: Due to changes in reporting, the comparability of values as from 2008 with earlier values is limited.
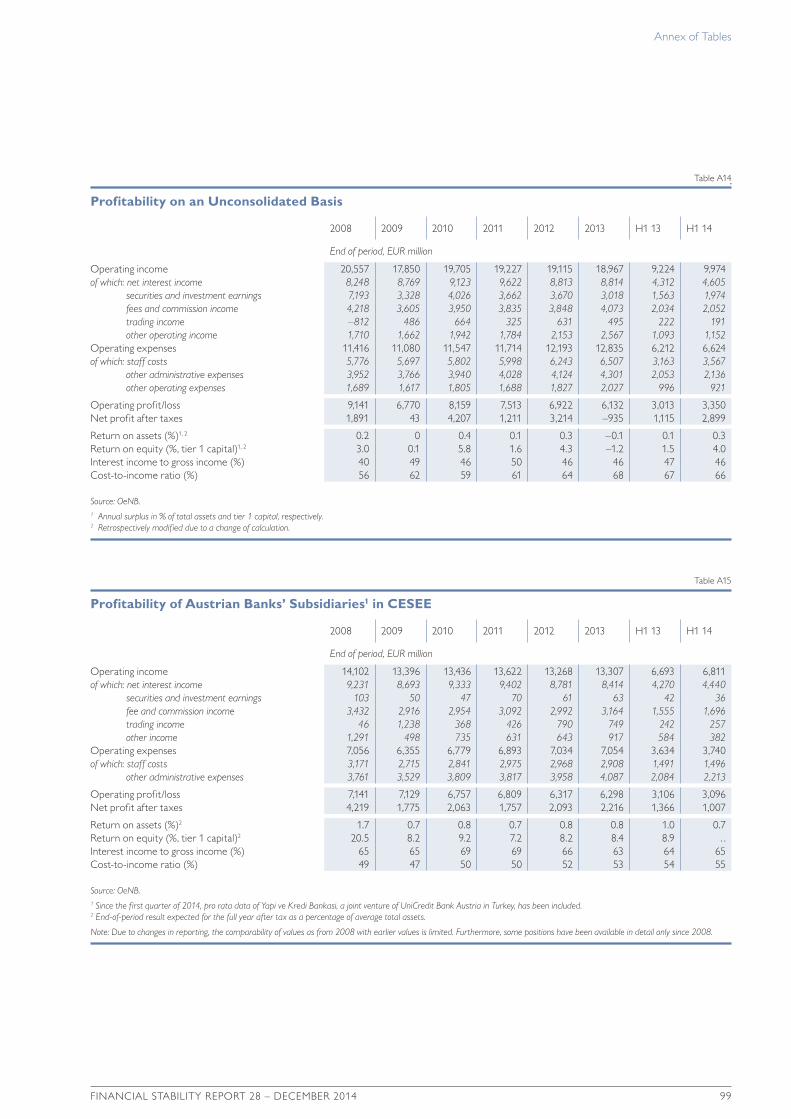
Annex of Tables
FINANCIAL STABILITY REPORT 28 – DECEMBER 2014 99
Table A14
Profitability on an Unconsolidated Basis
2008 2009 2010 2011 2012 2013 H1 13 H1 14
End of period, EUR million
Operating income 20,557 17,850 19,705 19,227 19,115 18,967 9,224 9,974of which: net interest income 8,248 8,769 9,123 9,622 8,813 8,814 4,312 4,605
securities and investment earnings 7,193 3,328 4,026 3,662 3,670 3,018 1,563 1,974fees and commission income 4,218 3,605 3,950 3,835 3,848 4,073 2,034 2,052trading income –812 486 664 325 631 495 222 191other operating income 1,710 1,662 1,942 1,784 2,153 2,567 1,093 1,152
Operating expenses 11,416 11,080 11,547 11,714 12,193 12,835 6,212 6,624of which: staff costs 5,776 5,697 5,802 5,998 6,243 6,507 3,163 3,567
other administrative expenses 3,952 3,766 3,940 4,028 4,124 4,301 2,053 2,136other operating expenses 1,689 1,617 1,805 1,688 1,827 2,027 996 921
Operating profit/loss 9,141 6,770 8,159 7,513 6,922 6,132 3,013 3,350Net profit after taxes 1,891 43 4,207 1,211 3,214 –935 1,115 2,899
Return on assets (%)1, 2 0.2 0 0.4 0.1 0.3 –0.1 0.1 0.3Return on equity (%, tier 1 capital)1, 2 3.0 0.1 5.8 1.6 4.3 –1.2 1.5 4.0Interest income to gross income (%) 40 49 46 50 46 46 47 46Cost-to-income ratio (%) 56 62 59 61 64 68 67 66
Source: OeNB.1 Annual surplus in % of total assets and tier 1 capital, respectively.2 Retrospectively modified due to a change of calculation.
Table A15
Profitability of Austrian Banks’ Subsidiaries1 in CESEE
2008 2009 2010 2011 2012 2013 H1 13 H1 14
End of period, EUR million
Operating income 14,102 13,396 13,436 13,622 13,268 13,307 6,693 6,811of which: net interest income 9,231 8,693 9,333 9,402 8,781 8,414 4,270 4,440
securities and investment earnings 103 50 47 70 61 63 42 36fee and commission income 3,432 2,916 2,954 3,092 2,992 3,164 1,555 1,696trading income 46 1,238 368 426 790 749 242 257other income 1,291 498 735 631 643 917 584 382
Operating expenses 7,056 6,355 6,779 6,893 7,034 7,054 3,634 3,740of which: staff costs 3,171 2,715 2,841 2,975 2,968 2,908 1,491 1,496
other administrative expenses 3,761 3,529 3,809 3,817 3,958 4,087 2,084 2,213
Operating profit/loss 7,141 7,129 6,757 6,809 6,317 6,298 3,106 3,096Net profit after taxes 4,219 1,775 2,063 1,757 2,093 2,216 1,366 1,007
Return on assets (%)2 1.7 0.7 0.8 0.7 0.8 0.8 1.0 0.7Return on equity (%, tier 1 capital)2 20.5 8.2 9.2 7.2 8.2 8.4 8.9 . .Interest income to gross income (%) 65 65 69 69 66 63 64 65 Cost-to-income ratio (%) 49 47 50 50 52 53 54 55
Source: OeNB.1 Since the first quarter of 2014, pro rata data of Yapi ve Kredi Bankasi, a joint venture of UniCredit Bank Austria in Turkey, has been included.2 End-of-period result expected for the full year after tax as a percentage of average total assets.
Note: Due to changes in reporting, the comparability of values as from 2008 with earlier values is limited. Furthermore, some positions have been available in detail only since 2008.

Annex of Tables
100 OESTERREICHISCHE NATIONALBANK
Table A16
Profitability on a Consolidated Basis
2008 2009 2010 2011 2012 2013 H1 13 H1 14
End of period, EUR million
Operating income 33,642 37,850 37,508 37,207 37,673 35,271 17,454 16,922 of which: net interest income 19,308 19,451 20,390 20,426 19,259 18,598 9,342 9,135
net fee-based income 8,469 7,160 7,678 7,592 7,260 7,590 3,797 3,661 net profit/loss on financial operations –2,135 2,560 997 845 1,137 670 17 497 other operating income 8,001 8,679 8,443 8,344 10,016 8,413 4,299 3,629
Operating expenses1 25,788 22,230 24,030 26,839 25,582 27,318 12,500 14,068 of which: staff costs 10,166 9,522 9,941 10,279 10,391 10,378 5,172 4,951
other administrative expenses 6,364 5,979 6,262 6,316 6,410 6,628 3,278 3,207 other operating expenses 9,257 6,729 7,827 10,244 8,781 10,311 4,050 5,910
Operating profit/loss 7,855 15,620 13,478 10,369 12,090 7,953 4,954 2,854 Net profit after taxes 586 1,530 4,577 711 2,966 –1,035 1,061 –594
Return on assets (%)2,5 0.10 0.18 0.46 0.10 0.33 –0.04 0.28 –0.10Return on equity (%, tier 1 capital)2,5 2.12 3.59 8.19 1.71 5.14 –0.68 4.27 –1.59 Interest income to gross income (%)3 69 59 64 66 61 63 65 71Cost-to-income ratio (%)4 72 53 58 66 62 73 66 78
Source: OeNB.1 As from 2008, operating expenses refer to staff costs and other administrative expenses only. 2 End-of-period result expected for the full year before minority interests as a percentage of average total assets and average tier 1 capital, respectively.3 All f igures represent the ratio of net interest income to total operating income less other operating expenses.4 All f igures represent the ratio of total operating expenses less other operating expenses to total operating income less other operating expenses.5 Retrospectively modified due to a change of calculation.
Note: Due to changes in reporting, the comparability of consolidated values as from 2008 with earlier values is limited.
Table A17
Solvency
2008 2009 2010 2011 2012 2013 H1 13 H1 14
End of period, EUR million
Own funds 74,707 80,574 86,228 88,071 88,204 88,994 89,351 90,460 Own funds requirements 678,163 633,313 653,313 649,613 621,925 578,425 601,813 580,740
End of period, eligible capital and tier 1 capital, respectively, as a percentage of risk-weighted assets
Consolidated total capital adequacy ratio 11.0 12.8 13.2 13.6 14.2 15.4 14.9 15.6 Consolidated tier 1 capital ratio 7.7 9.3 10.0 10.3 11.0 11.9 11.5 11.9 Consolidated core tier 1 capital ratio (core equity tier 1 as from 2014) 6.9 8.5 9.4 9.8 10.7 11.6 11.3 11.8
Source: OeNB.
Note: As from 2014, figures are calculated according to CRD IV requirements. Therefore, comparability with previous figures is limited.

Annex of Tables
FINANCIAL STABILITY REPORT 28 – DECEMBER 2014 101
Table A19
Market Risk1
2008 2009 2010 2011 2012 2013 H1 13 H1 14
End of period, EUR million and %
Interest rate riskBasel ratio for interest rate risk, %2 3.9 3.7 3.9 5.0 4.0 3.8 4.1 4.0 Capital requirement for the position risk of interest rate instruments in the trading book 953.3 780.9 618.3 625 441.9 324.2 438.2 x
Exchange rate riskCapital requirement for open foreign exchange positions 110.3 75.2 81.1 92.3 70.8 61.7 80.3 x
Equity price riskCapital requirement for the position risk of equities in the trading book 186.9 176.9 197.1 191.3 151.5 107.1 136.1 x
Source: OeNB.1 Based on unconsolidated data. The calculation of capital requirements for market risk combines the standardized approach and internal value-at-risk (VaR) calculations. The latter use
previous day values without taking account of the multiplier. Capital requirements for interest rate instruments and equities are computed by adding up both general and specific position risks.
2 Average of the Basel ratio for interest rate risk (loss of present value following a parallel yield curve shift of all currencies by 200 basis points in relation to regulatory capital) weighted by total assets of all Austrian credit institutions excluding banks that operate branches in Austria under freedom of establishment. For banks with a large securities trading book, interest rate instruments of the trading book are not included in the calculation.
Table A18
Liquidity Risk
2008 2009 2010 2011 2012 2013 H1 13 H1 14
End of period, %
Short-term loans to short-term liabilities 67.0 72.5 64.2 65.9 66.0 59.0 66.4 66.7Short-term loans and other liquid assets to short-term liabilities 109.0 124.8 118.9 118.1 120.6 109.0 119.7 121.9Liquid resources of the first degree: 5% quantile of the ratio between available and required liquidity of degree 11 149.4 139.9 145.1 152.4 295.4 278.2 252.7 xLiquid resources of the second degree: 5% quantile of the ratio between available and required liquidity of degree 2 113.5 110.8 111.3 110.9 112.1 110.1 116.2 x
Source: OeNB.1 Short-term loans and short-term liabilities (up to three months against banks and nonbanks). Liquid assets (quoted stocks and bonds, government bonds and eligible collateral, cash and
liquidity reserves at apex institutions). The liquidity ratio relates liquid assets to the corresponding liabilities. Article 25 of the Austrian Banking Act defines a minimum ratio of 2.5% for liquid resources of the first degree (cash ratio) and of 20% for liquid resources of the second degree (quick ratio). The 5% quantile indicates the ratio between available and required liquidity surpassed by 95% of banks on the respective reporting date.

Annex of Tables
102 OESTERREICHISCHE NATIONALBANK
Table A20
Market Indicators of Selected Austrian Financial Instruments
2008 2009 2010 2011 2012 2013 H1 13 H1 14
Share prices % of mid-2005 prices
Erste Group Bank 38.9 66.4 91.7 35.8 61.2 64.9 52 61Raiffeisen Bank International 37 75.7 82.5 40.3 60.3 49.1 42.8 48EURO STOXX – Banks 47.2 70.3 52.4 32.8 35.9 45.2 32.9 48Uniqa 111.8 80.3 90.2 57.8 61.1 60 58.9 60.8Vienna Insurance Group 54.2 81 88.6 71.7 90.8 81.4 81.3 85.8EURO STOXX – Insurance 68.9 75 71 58.8 76.4 101.8 82.8 98
Relative valuation Price-to-book value ratio
Erste Group Bank 0.5 0.80 1.30 0.48 0.88 0.93 0.74 0.87Raiffeisen Bank International 0.55 1.12 1.15 0.53 0.83 0.68 0.59 0.66EURO STOXX – Banks 0.57 0.94 0.64 0.36 0.60 0.96 0.68 0.8Uniqa 1.94 1.41 2.25 1.18 1.05 1.03 1.01 1.05Vienna Insurance Group 0.71 1.03 1.21 0.90 1.21 1.08 1.08 1.14EURO STOXX – Insurance 0.84 1.03 0.94 0.69 0.81 0.93 0.74 1.00
Source: Thomson Reuters, Bloomberg.
Table A21
Key Indicators of Austrian Insurance Companies
2008 2009 2010 2011 2012 2013 H1 13 H1 14
End of period, EUR million
Business and profitabilityPremiums 16,180 16,381 16,652 16,537 16,341 16,608 9,080 9,251Expenses for claims and insurance benefits 11,608 12,348 11,882 12,826 12,973 13,150 6,509 6,767Underwriting results –119 132 373 295 455 592 377 425Profit from investments 2,370 2,729 3,203 2,964 3,391 3,354 1,804 1,857Profit from ordinary activities 411 744 1,101 1,162 1,395 1,524 1,015 1,098Acquisition and administrative expenses 3,315 3,241 3,382 3,541 3,499 3,528 1,807 1,793Total assets 93,911 99,227 105,099 105,945 108,374 110,391 109,021 113,324
InvestmentsTotal investments 87,698 92,260 98,300 99,776 103,272 105,496 103,355 106,894of which: debt securities 35,209 36,397 38,223 37,813 37,614 39,560 37,770 41,463
stocks and other equity securities1 12,531 12,811 12,559 12,363 12,505 12,464 12,415 12,521real estate 5,138 5,246 5,703 5,236 5,371 5,689 5,522 5,719
Investments for unit-linked and index-linked life insurance 9,319 12,822 15,325 15,870 18,330 19,127 18,483 19,911Claims on domestic banks 16,079 17,168 16,458 16,405 16,872 16,687 17,305 16,802Reinsurance receivables 1,272 1,218 1,229 1,733 1,933 824 899 1,041
Risk capacity (solvency ratio), % 300.0 300.0 356.0 332.0 350.0 368.0 x 377.7
Source: FMA, OeNB.1 Contains shares, share certif icates (listed and not listed) and all equity instruments held by mutual funds.

Annex of Tables
FINANCIAL STABILITY REPORT 28 – DECEMBER 2014 103
Table A22
Assets Held by Austrian Mutual Funds
2008 2009 2010 2011 2012 2013 H1 13 H1 14
End of period, EUR million
Domestic securities 48,777 48,765 51,001 50,046 50,963 49,757 50,576 50,643of which: debt securities 14,601 16,013 15,884 16,683 17,527 16,203 17,125 15,481 stocks and other equity securities 1,473 2,863 3,696 2,991 3,637 3,610 3,467 3,618Foreign securities 78,655 89,845 96,684 87,458 96,854 99,647 97,538 105,705of which: debt securities 57,598 61,961 61,744 58,695 63,661 62,972 63,363 66,280 stocks and other equity securities 8,899 12,663 15,540 12,097 14,208 16,278 14,498 17,441Net asset value 127,432 138,610 147,684 137,504 147,817 149,404 148,114 156,348of which: retail funds 82,804 85,537 88,313 78,299 84,158 83,238 83,342 85,370 institutional funds 44,628 53,073 59,372 59,205 63,659 66,167 64,772 70,978Consolidated net asset value 105,620 115,337 123,794 116,747 126,831 128,444 127,491 133,570
Source: OeNB.
Table A23
Structure and Profitability of Austrian Fund Management Companies
2008 2009 2010 2011 2012 2013 H1 13 H1 14
End of period, EUR million
Total assets 504 642 699 661 644 670 659 634Operating profit 89 106 142 125 111 131 61 70Net commissions and fees earned 269 258 302 284 283 310 152 170Administrative expenses1 196 185 199 195 205 219 105 114Number of fund management companies 29 30 29 29 29 29 29 29Number of reported funds 2,308 2,182 2,203 2,171 2,168 2,161 2,135 2,123
Source: OeNB.1 Administrative expenses are calculated as the sum of personnel and material expenses.

Annex of Tables
104 OESTERREICHISCHE NATIONALBANK
Table A24
Assets Held by Austrian Pension Funds
2008 2009 2010 2011 2012 2013 H1 13 H1 14
End of period, EUR million
Total assets 11,936 13,734 14,976 14,798 16,335 17,385 16,564 18,363 of which: direct investment x 1,239 968 1,139 1,139 1,640 1,042 973 mutual funds x 11,235 13,944 13,626 15,278 15,745 15,522 17,390 foreign currency (without derivatives) x x x x 5,714 5,964 5,857 6,761 stocks x x x x 4,805 5,472 5,088 6,038 debt x x x x 8,464 7,650 8,261 8,261 real estate x x x x 567 583 588 580 cash and deposits x x 1,181 1,624 1,488 2,033 1,554 1,480
Source: OeNB, FMA.
Table A25
Assets Held by Austrian Severance Funds
2008 2009 2010 2011 2012 2013 H1 13 H1 14
End of period, EUR million
Total direct investment 1,062 884 1,004 1,393 1,442 1,528 1,400 1,488 of which: euro-denominated 1,043 866 985 1,363 1,415 1,507 1,381 1,429 foreign currency-denominated 19 17 19 30 27 21 19 59 Accrued income claims from direct investment 17 15 16 19 22 21 19 16 Total indirect investment 1,076 1,946 2,569 2,891 3,834 4,701 4,281 5,281 of which: total of euro-denominated investment in
mutual fund shares 1,039 1,858 2,379 2,741 3,540 4,220 3,887 4,669 total of foreign currency-denominated
investment in mutual fund shares 38 88 190 151 294 481 394 612 Total assets assigned to investment groups 2,139 2,830 3,573 4,284 5,254 6,218 5,680 6,769
Source: OeNB.
Note: Due to special balance sheet operations, total assets assigned to investment groups deviate from the sum of total indirect investments.

Annex of Tables
FINANCIAL STABILITY REPORT 28 – DECEMBER 2014 105
Table A26
Transactions and System Disturbances in Payment and Securities Settlement Systems
2008 2009 2010 2011 2012 2013 H1 13 H1 14
Number of transactions in million, value of transactions in EUR billion
HOAM.ATNumber 3 1 1 1 1 1 0 2 Value 6,724 9,305 9,447 7,667 9,974 5,906 2,824 3,682 System disturbances 5 5 4 1 1 3 0 0 Securities settlement systemsNumber 2 2 2 2 2 2 1 1 Value 502 365 398 439 418 369 178 209 System disturbances 0 0 0 0 1 5 2 1 Retail payment systemsNumber 528 574 617 665 688 1,005 490 457 Value 42 46 49 50 55 72 35 36 System disturbances 16 19 25 4 4 2 0 1 Participation in international payment systemsNumber 25 31 31 36 41 53 24 51 Value 1,995 1,225 1,164 1,306 1,820 1,643 850 1,711 System disturbances 0 0 0 0 0 0 0 0
Source: OeNB.
Note: Annual data refer to the respective 12-month period, semiannual data refer to the respective six-month period.


Notes

108 OESTERREICHISCHE NATIONALBANK
The following contributions can be downloaded at www.oenb.at.
Financial Stability Report 25The Single Supervisory Mechanism within the Banking Union – Novel Features and Implications for Austrian Supervisors and Supervised EntitiesDieter Huber, Elisabeth von Pföstl
Household Vulnerability in Austria – A Microeconomic Analysis Based on the Household Finance and Consumption SurveyNicolás Albacete, Peter Lindner
Stress Test Robustness: Recent Advances and Open ProblemsThomas Breuer, Martin Summer
Macroeconomic, Market and BankSpecific Determinants of the Net Interest Margin in AustriaUlrich Gunter, Gerald Krenn, Michael Sigmund
Measuring Financial (In)Stability in Emerging Europe: A New IndexBased ApproachPetr Jakubík, Tomáš Slacík
Financial Stability Report 26Macroprudential Policy: A Complementing Pillar in Prudential Supervision – The EU and Austrian FrameworksDavid Liebeg, Alexander Trachta
Quantifying Financial Stability in Austria – New Tools for Macroprudential SupervisionJudith Eidenberger, Benjamin Neudorfer, Michael Sigmund, Ingrid Stein
Credit Boom in Russia despite Global Woes – Driving Forces and RisksStephan Barisitz
ARNIE in Action: The 2013 FSAP Stress Tests for the Austrian Banking SystemMartin Feldkircher, Gerhard Fenz, Robert Ferstl, Gerald Krenn, Benjamin Neudorfer, Claus Puhr, Thomas Reininger, Stefan W. Schmitz, Martin Schneider, Christoph Siebenbrunner, Michael Sigmund, Ralph Spitzer
Financial Stability Report 27The Priorities of Deleveraging in the Euro Area and Austria and Its Implications for CESEEJudith Eidenberger, Stefan W. Schmitz, Katharina Steiner
Macrofinancial Developments in Ukraine, Russia and Turkey from an Austrian Financial Stability PerspectiveTina Wittenberger, Daniela Widhalm, Mathias Lahnsteiner, Stephan Barisitz
List of Special TopicsPublished in the Financial Stability Report Series

FINANCIAL STABILITY REPORT 28 – DECEMBER 2014 109
Capital Market Development in CESEE and the Need for Further ReformKrisztina Jäger-Gyovai
Macroprudential Supervision: A Key Lesson from the Financial CrisisJudith Eidenberger, David Liebeg, Stefan W. Schmitz, Reinhardt Seliger, Michael Sigmund, Katharina Steiner, Peter Strobl, Eva Ubl
RiskBearing Capacity of Households – Linking MicroLevel Data to the Macroprudential ToolkitNicolás Albacete, Judith Eidenberger, Gerald Krenn, Peter Lindner, Michael Sigmund
List of Special Topic Published in the Financial Stability Report Series

110 OESTERREICHISCHE NATIONALBANK
Periodical Publications
See www.oenb.at for further details.
Geschäftsbericht (Nachhaltigkeitsbericht) German 1 annuallyAnnual Report (Sustainability Report) English 1 annuallyThis report informs readers about the Eurosystem’s monetary policy and underlying economic conditions as well as about the OeNB’s role in maintaining price stability and financial stability. It also provides a brief account of the key activities of the OeNB’s core business areas. The OeNB’s financial statements are an integral part of the report.http://www.oenb.at/en/Publications/Oesterreichische-Nationalbank/Annual-Report.html
Konjunktur aktuell German 1 seven times a yearThis online publication provides a concise assessment of current cyclical and financial developments in the global economy, the euro area, Central, Eastern and Southeastern European countries, and in Austria. The quarterly releases (March, June, September and December) also include short analyses of economic and monetary policy issues. http://www.oenb.at/Publikationen/Volkswirtschaft/Konjunktur-aktuell.html
Monetary Policy & the Economy English 1 quarterlyThis publication assesses cyclical developments in Austria and presents the OeNB’s regular macroeconomic forecasts for the Austrian economy. It contains economic analyses and studies with a particular relevance for central banking and summarizes findings from macroeconomic workshops and conferences organized by the OeNB.http://www.oenb.at/en/Publications/Economics/Monetary-Policy-and-the-Economy.html
Fakten zu Österreich und seinen Banken German 1 twice a yearFacts on Austria and Its Banks English 1 twice a yearThis online publication provides a snapshot of the Austrian economy based on a range of structural data and indicators for the real economy and the banking sector. Comparative international measures enable readers to put the information into perspective.http://www.oenb.at/en/Publications/Financial-Market/Facts-on-Austria-and-Its-Banks.html
Financial Stability Report English 1 twice a yearThe Reports section of this publication analyzes and assesses the stability of the Austrian financial system as well as developments that are relevant for financial stability in Austria and at the international level. The Special Topics section provides analyses and studies on specific financial stabilityrelated issues.http://www.oenb.at/en/Publications/Financial-Market/Financial-Stability-Report.html
Focus on European Economic Integration English 1 quarterlyThis publication presents economic analyses and outlooks as well as analytical studies on macroeconomic and macrofinancial issues with a regional focus on Central, Eastern and Southeastern Europe.http://www.oenb.at/en/Publications/Economics/Focus-on-European-Economic-Integration.html
Statistiken – Daten & Analysen German 1 quarterlyThis publication contains analyses of the balance sheets of Austrian financial institutions, flowof funds statistics as well as external statistics (English summaries are provided). A set of 14 tables (also available on the OeNB’s website) provides information about key financial and macroeconomic indicators. http://www.oenb.at/Publikationen/Statistik/Statistiken---Daten-und-Analysen.html

Periodical Publicationsof the Oesterreichische Nationalbank
FINANCIAL STABILITY REPORT 28 – DECEMBER 2014 111
Statistiken – Daten & Analysen: Sonderhefte German 1 irregularlyStatistiken – Daten & Analysen: Special Issues English 1 irregularlyIn addition to the regular issues of the quarterly statistical series “Statistiken – Daten & Analysen,” the OeNB publishes a number of special issues on selected statistics topics (e.g. sector accounts, foreign direct investment and trade in services).http://www.oenb.at/en/Publications/Statistics/Special-Issues.html
Research Update English 1 quarterlyThis online newsletter informs international readers about selected research findings and activities of the OeNB’s Economic Analysis and Research Department. It offers information about current publications, research priorities, events, conferences, lectures and workshops. Subscribe to the newsletter at: http://www.oenb.at/en/Publications/Economics/Research-Update.html
CESEE Research Update English 1 quarterlyThis online newsletter informs readers about research priorities, publications as well as past and upcoming events with a regional focus on Central, Eastern and Southeastern Europe. Subscribe to the newsletter at:http://www.oenb.at/en/Publications/Economics/CESEE-Research-Update.html
OeNB Workshops Proceedings German, English 1 irregularlyThis series, launched in 2004, documents contributions to OeNB workshops with Austrian and international experts (policymakers, industry experts, academics and media representatives) on monetary and economic policymakingrelated topics.http://www.oenb.at/en/Publications/Economics/Proceedings-of-OeNB-Workshops.html
Working Papers English 1 irregularlyThis online series provides a platform for discussing and disseminating economic papers and research findings. All contributions are subject to international peer review. http://www.oenb.at/en/Publications/Economics/Working-Papers.html
Proceedings of the Economics Conference English 1 annuallyThe OeNB’s annual Economics Conference provides an international platform where central bankers, economic policymakers, financial market agents as well as scholars and academics exchange views and information on monetary, economic and financial policy issues. The proceedings serve to document the conference contributions.http://www.oenb.at/en/Publications/Economics/Economics-Conference.html
Proceedings of the Conference on European Economic Integration English 1 annuallyThe OeNB’s annual Conference on European Economic Integration (CEEI) deals with current issues with a particular relevance for central banking in the context of convergence in Central, Eastern and Southeastern Europe as well as the EU enlargement and integration process. For an overview see:http://www.oenb.at/en/Publications/Economics/Conference-on-European-Economic-Integration-CEEI.htmlThe proceedings have been published with Edward Elgar Publishers, Cheltenham/UK, Northampton/MA, since the CEEI 2001.www.e-elgar.com
Publications on Banking Supervisory Issues German, English 1 irregularlyCurrent publications are available for download; paper copies may be ordered free of charge. See www.oenb.at for further details.http://www.oenb.at/en/Publications/Financial-Market/Publications-of-Banking-Supervision.html

112 OESTERREICHISCHE NATIONALBANK
Addresses
Postal address Phone/fax/e-mail
Head OfficeOtto-Wagner-Platz 3 PO Box 61 Phone: (+43-1) 404 20-6666 1090 Vienna, Austria 1011 Vienna, Austria Fax: (+43-1) 404 20-042399 Internet: www.oenb.at E-mail: [email protected]
Branch OfficesNorthern Austria Branch Office Coulinstraße 28 PO Box 346 Phone: (+43-732) 65 26 11-04020 Linz, Austria 4021 Linz, Austria Fax: (+43-732) 65 26 11-046399 E-mail: [email protected]
Southern Austria Branch OfficeBrockmanngasse 84 PO Box 8 Phone: (+43-316) 81 81 81-08010 Graz, Austria 8018 Graz, Austria Fax: (+43-316) 81 81 81-046799 E-mail: [email protected]
Western Austria Branch Office Adamgasse 2 Adamgasse 2 Phone: (+43-512) 908 100-06020 Innsbruck, Austria 6020 Innsbruck, Austria Fax: (+43-512) 908 100-046599 E-mail: [email protected]
Representative OfficesNew York Representative Office Phone: (+1-212) 888-2334 Oesterreichische Nationalbank Fax: (+1-212) 888-2515450 Park Avenue, Suite 1202 10022 New York, U.S.A.
Brussels Representative Office Phone: (+32-2) 285 48-41, 42, 43Oesterreichische Nationalbank Fax: (+32-2) 285 48-48 Permanent Representation of Austria to the EUAvenue de Cortenbergh 30 1040 Brussels, Belgium