Embed Size (px)
Citation preview
Financial Stability and Payment Systems Report 2010
1
byDato’ Mohd Razif Abd. Kadir
Deputy Governor
23 March 2011
Financial Stability and Payment Systems Report 2010
Briefing to Analysts & Fund Managers

Financial Stability and Payment Systems Report 2010
2
Stability of the financial sector was preserved throughout 2010
- strong fundamentals contributed towards efficient financial intermediation
- orderly and efficient conditions in financial markets, and payments and settlements systems facilitated trade and domestic activities

Financial Stability and Payment Systems Report 2010
3
Financial system continues to be resilient
• Strong capital and liquidity buffers
• Improved profitability
• High asset quality
• Have capacity to withstand extreme macroeconomic and financial conditions
Banking Sector (%) 2009 Jan’11Capital Adequacy
Risk-Weighted Capital RatioCore Capital RatioCapital Buffer (RM bil)
15.413.864.6
14.112.460.5
ProfitabilityReturn on AssetsReturn on Equity
1.214.0
1.819.7
Asset QualityNet Non Performing Loan* Ratio 1.8 2.2
Liquidity PositionLiquidity buffer (<1 mth, % of deposits) 18.2 14.8
Insurance/Takaful Sector (%) 2009 2010Capital Adequacy
Capital Adequacy Ratio^Capital Buffer^ (RM bil)
225.718.6
224.618.6
ProfitabilityProfit Before Tax (RM bil) 14.7 16.3
* 2011 position based on impairment methodology ^ Conventional industry only
Financial Stability and Payment Systems Report 2010
4
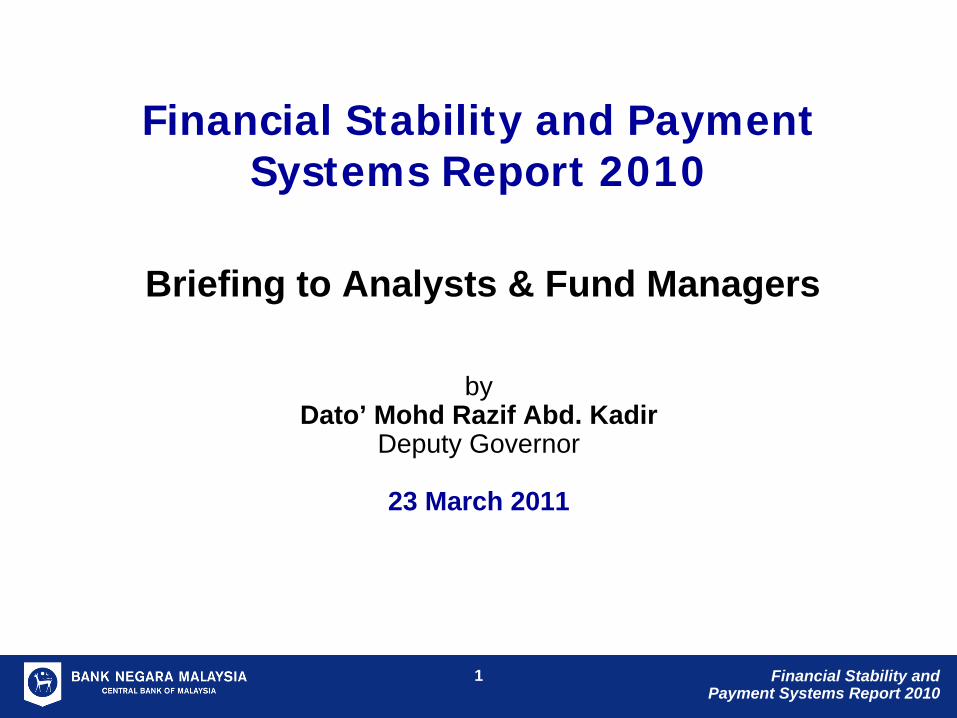
Banking system recorded RM22.8 bil in pre-tax profit
Conventional Banking System
2010 RM bil
2010 growth
Net interest income 27.5 +15.8%
Fee/Commission-based income
8.1 +11.2%
Net trading & investment gains
7.4 +62.4%
Staff cost and overheads 20.2 +14.4%
Pre-tax profit 19.7 +37.1%
Islamic Banking System
2010 RM bil
2010 growth
Net income 6.8 +12.2%
Fee/Commission-based income
0.7 +13.7%
Net trading & investment gains
0.4 +17.8%
Staff cost and overheads
3.6 +56.1%
Pre-tax profit 3.1 +16.9%
Conventional banking system: PBT of RM19.7 billion
Islamic banking system: PBT of RM3.1 billion
Financial Stability and Payment Systems Report 2010
5
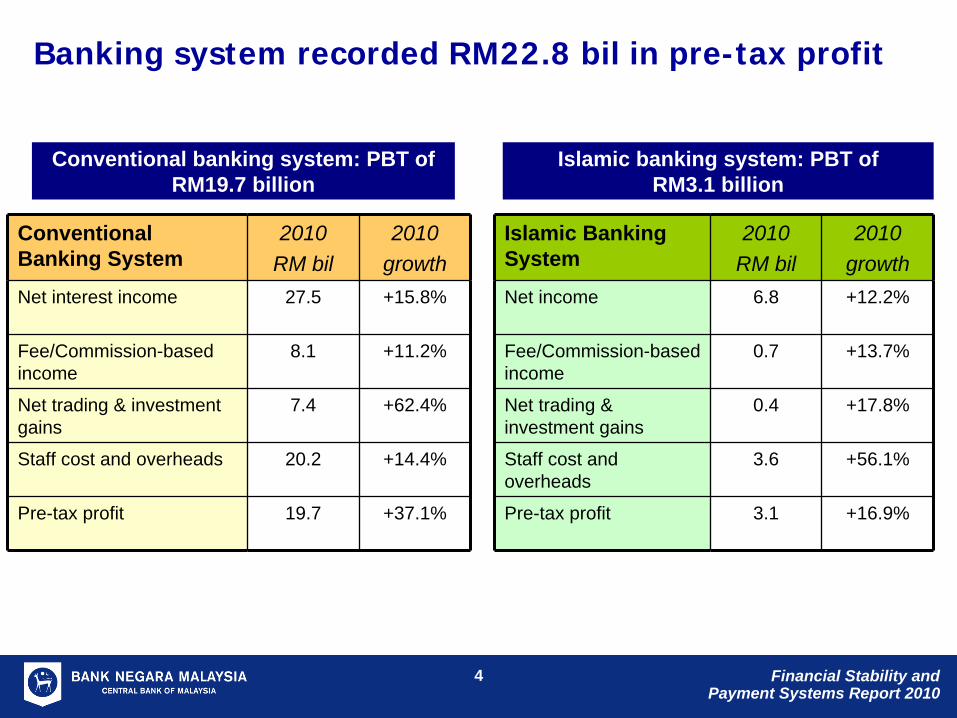
Life insurance & family takaful: Excess of income over outgo of RM14.1 bil
Insurance and takaful sector registered RM16.3 bil in pre-tax profit
2010Life Insurance Family Takaful Total
RM bil growth RM bil growth RM bil growthNet premiums/ contribution 21.9 15.9% 3.3 21.3% 25.2 11.5%Net policy/ certificate benefits 13 9.2% 1.6 75.8% 14.6 14.7%Net Investment income 5.4 10.2% 0.5 42.9% 5.9 11.5%
Net unrealised and capital gains 4.2 44.9% 0.01 -83.3% 4.3 46%
Excess income over outgo 12.7 16.5% 1.4 -15.6% 14.1 12.1%
General insurance & takaful: Operating profits of RM2.2 bil
2010General Insurance General Takaful TotalRM bil growth RM bil growth RM bil growth
Gross direct premiums/ contribution 15.2 8.6% 1.4 26.3% 16.6 10%Net claims incurred 6.8 11.5% 0.5 34.5% 7.3 12.3%Net Investment income 0.8 3.9% 0.1 17.7% 0.9 6.2%Net unrealised and capital gains 0.06 -75% 0.04 96.7% 0.1 -68.1%Operating Profit 1.9 2.7% 0.2 12.5% 2.1 3.8%
Financial Stability and Payment Systems Report 2010
6
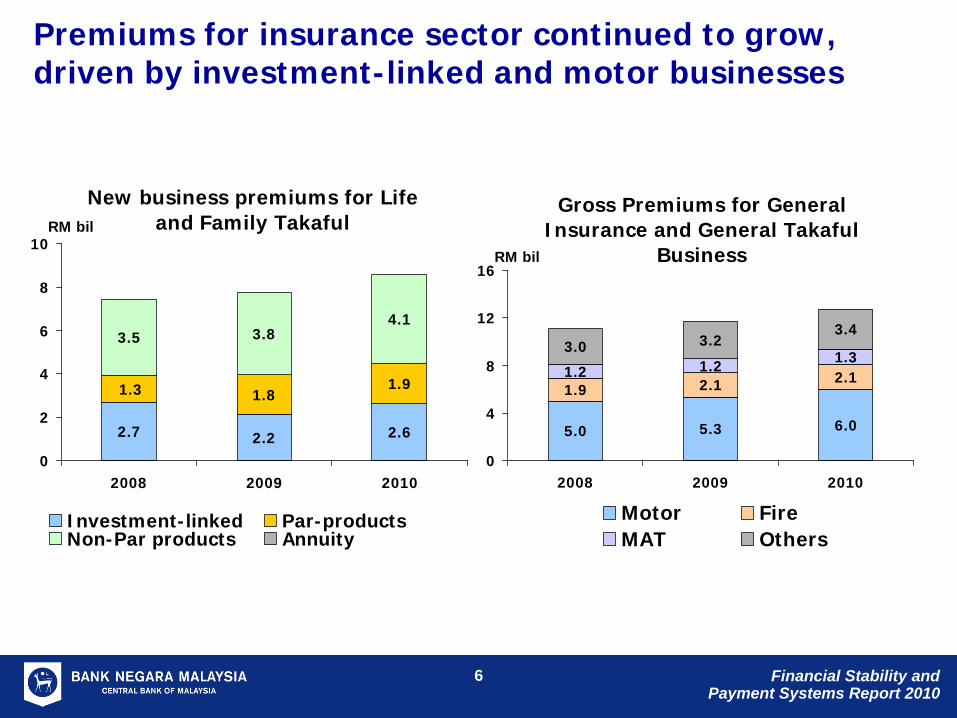
Premiums for insurance sector continued to grow, driven by investment-linked and motor businesses
New business premiums for Life and Family Takaful
2.62.22.7
1.91.81.3
4.13.83.5
0
2
4
6
8
10
2008 2009 2010
RM bil
Investment-linked Par-productsNon-Par products Annuity
Gross Premiums for General Insurance and General Takaful
Business
6.05.35.0
2.12.11.9
1.31.21.2
3.43.23.0
0
4
8
12
16
2008 2009 2010
RM bil
Motor FireMAT Others

Financial Stability and Payment Systems Report 2010
7
Manageable trend in payouts of benefits and claims
6.8
0.9
0
1
2
3
4
5
6
7
8
1H 2H 1H 2H 1H 2H
%
Total benefits payments (Life Insurance)
Total benefit payments (Family Takaful)
2008 2009 2010
80.5
70.8
62.5
59.6
40
50
60
70
80
90
100
1H 2H 1H 2H 1H 2H
%
Gen. Insurance (Motor) Gen. Takaful (Motor)Gen. Insurance (Total) Gen. Takaful (Total)
2008 2009 2010
Total benefit payments of RM13 bil or 58.1% of premium
New motor cover framework that is being formulated to preserve access to affordable motor cover while ensuring its sustainability over the longer term
Claims experience in motor continues to remain high

Financial Stability and Payment Systems Report 2010
8
Continued access to financing by all sectors
• Outstanding banking system financing grew by 13.1%
– Continued expansion to all segments, including SMEs
• Bank deposits increased by 9.1%– Loan-to-deposit ratio stable at 81.2%
• Favourable condition since 2H 2010 facilitated fund raising in PDS market
– New corporate debt securities and sukuk issuances of RM76 bil
– Danajamin approved RM4.6 bil worth of guarantees
Financial System: Outstanding Financing1,190.21,145.11,120.11,080.9
0200
400600
8001000
12001400
Mar Jun Sept Jan 2011
RM bil
6
8
10
12
14%
Large Enterprises SMEHousehold OthersDebt securities Annual growth (RHS)
Banking System: Deposits
1,091.41,073.3 1,159.41,113.7
0200400600800
1,0001,2001,400
Mar Jun Sept Jan 2011
RM bil
8
8.2
8.4
8.6
8.8
9
9.2%
Business HouseholdOthers Annual growth (RHS)
Financial Stability and Payment Systems Report 2010
9
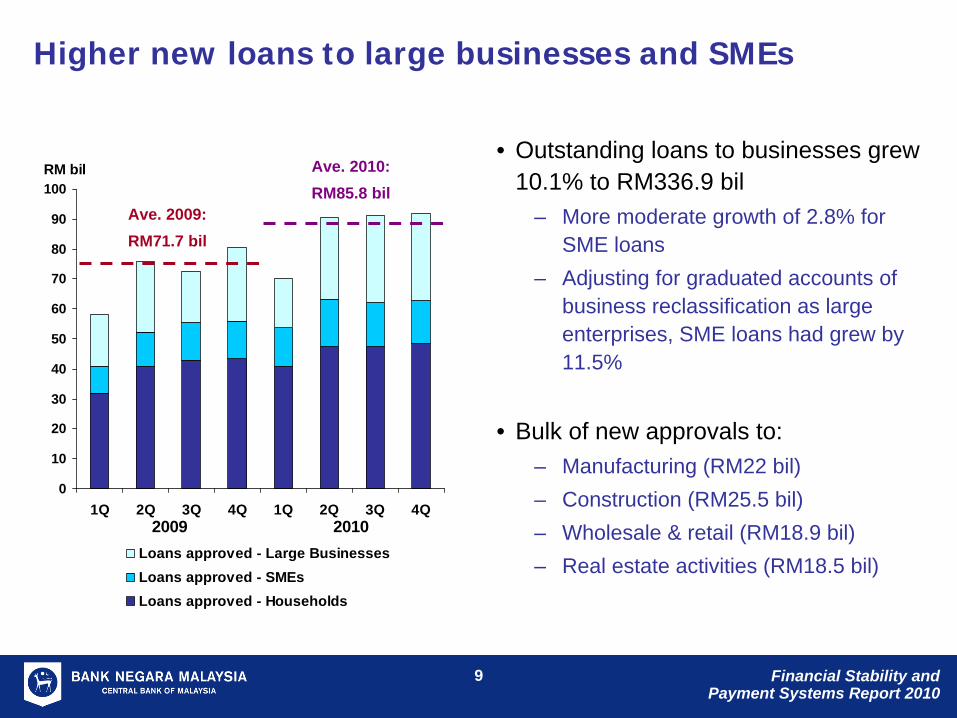
Higher new loans to large businesses and SMEs
0
10
20
30
40
50
60
70
80
90
100
1Q 2Q 3Q 4Q 1Q 2Q 3Q 4Q
RM bil
Loans approved - Large BusinessesLoans approved - SMEsLoans approved - Households
20102009
• Outstanding loans to businesses grew 10.1% to RM336.9 bil
– More moderate growth of 2.8% for SME loans
– Adjusting for graduated accounts of business reclassification as large enterprises, SME loans had grew by 11.5%
• Bulk of new approvals to:– Manufacturing (RM22 bil)– Construction (RM25.5 bil)– Wholesale & retail (RM18.9 bil)– Real estate activities (RM18.5 bil)
Ave. 2009: RM71.7 bil
Ave. 2010: RM85.8 bil
Financial Stability and Payment Systems Report 2010
10
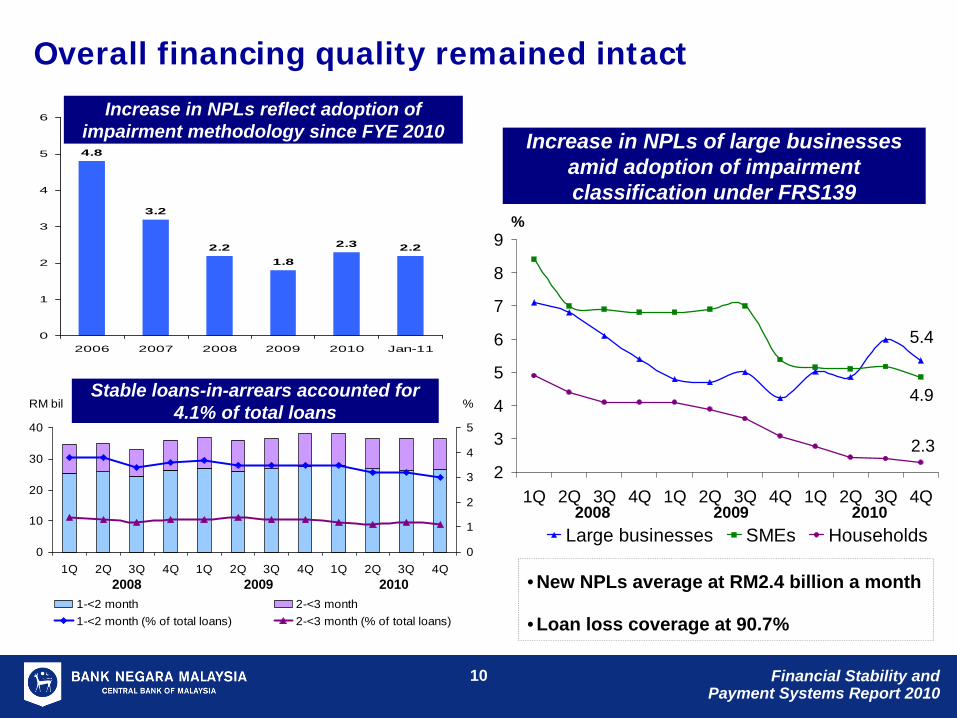
Overall financing quality remained intact
4.8
3.2
2.21.8
2.3 2.2
0
1
2
3
4
5
6
2006 2007 2008 2009 2010 Jan-11
Increase in NPLs reflect adoption of impairment methodology since FYE 2010
5.4
4.9
2.32
3
4
5
6
7
8
9
1Q 2Q 3Q 4Q 1Q 2Q 3Q 4Q 1Q 2Q 3Q 4Q
%
Large businesses SMEs Households
Stable loans-in-arrears accounted for 4.1% of total loans
0
10
20
30
40
1Q 2Q 3Q 4Q 1Q 2Q 3Q 4Q 1Q 2Q 3Q 4Q
RM bil
0
1
2
3
4
5
%
1-<2 month 2-<3 month1-<2 month (% of total loans) 2-<3 month (% of total loans)
Increase in NPLs of large businesses amid adoption of impairment classification under FRS139
2008 2009 2010
2008 2009 2010
• New NPLs average at RM2.4 billion a month
• Loan loss coverage at 90.7%
Financial Stability and Payment Systems Report 2010
11
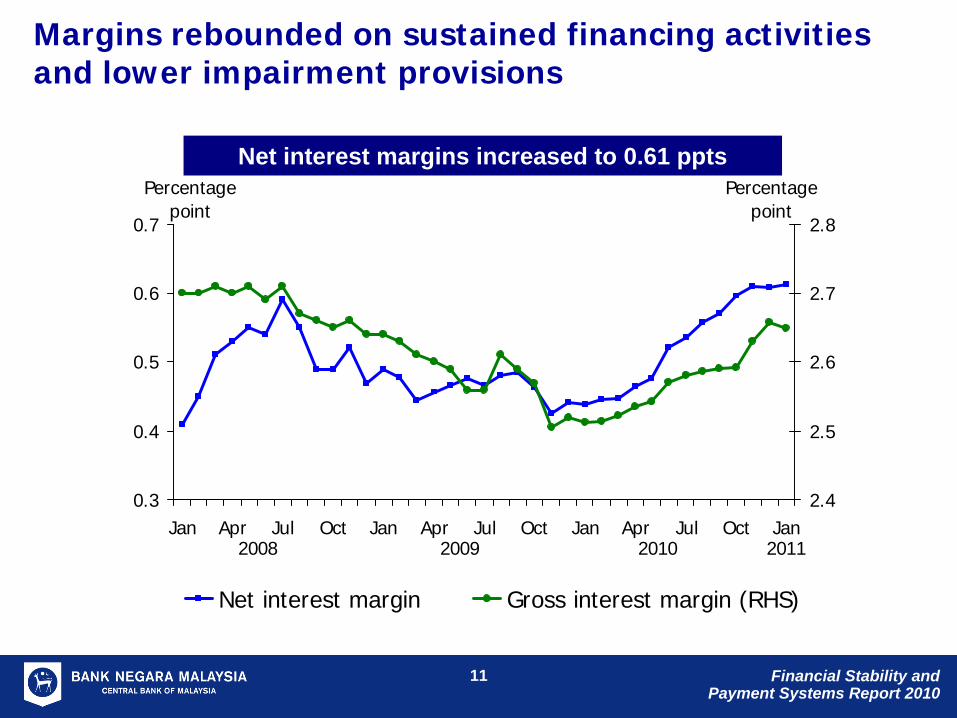
Margins rebounded on sustained financing activities and lower impairment provisions
0.3
0.4
0.5
0.6
0.7
Jan Apr Jul Oct Jan Apr Jul Oct Jan Apr Jul Oct Jan2.4
2.5
2.6
2.7
2.8
Net interest margin Gross interest margin (RHS)
Percentage point
Percentage point
2008 2009 2010 2011
Net interest margins increased to 0.61 ppts
Financial Stability and Payment Systems Report 2010
12
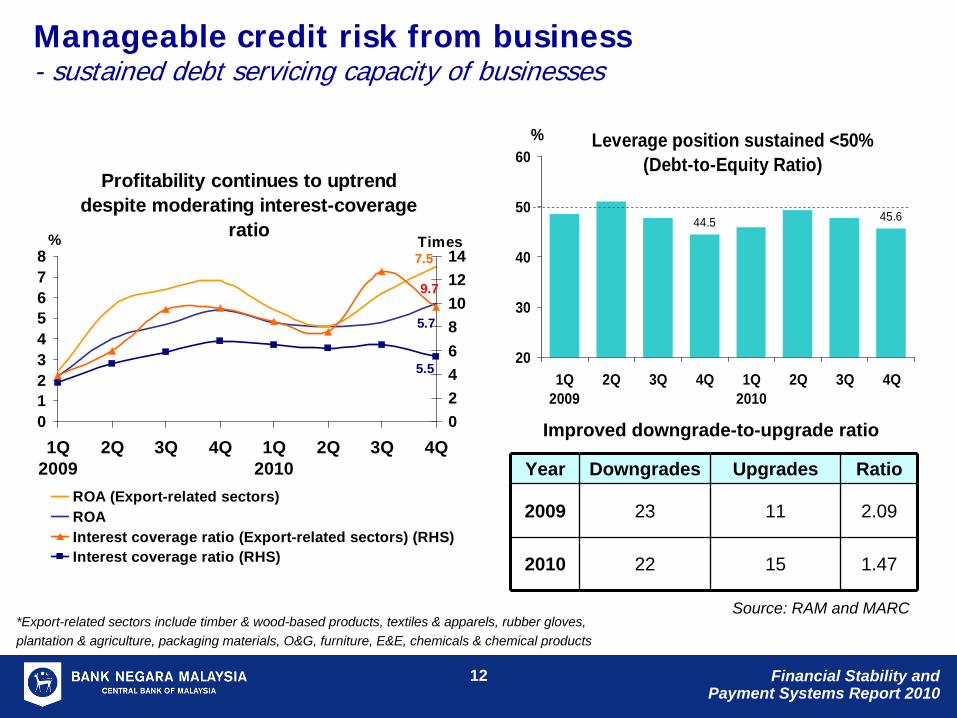
Manageable credit risk from business - sustained debt servicing capacity of businesses
Profitability continues to uptrend despite moderating interest-coverage
ratio
5.7
7.5
5.5
9.7
012345678
1Q2009
2Q 3Q 4Q 1Q2010
2Q 3Q 4Q
%
02468101214
Times
ROA (Export-related sectors)ROAInterest coverage ratio (Export-related sectors) (RHS)Interest coverage ratio (RHS)
Year Downgrades Upgrades Ratio
2009 23 11 2.09
2010 22 15 1.47
Leverage position sustained <50%(Debt-to-Equity Ratio)
44.5 45.6
20
30
40
50
60
1Q2009
2Q 3Q 4Q 1Q2010
2Q 3Q 4Q
%
Source: RAM and MARC
Improved downgrade-to-upgrade ratio
*Export-related sectors include timber & wood-based products, textiles & apparels, rubber gloves, plantation & agriculture, packaging materials, O&G, furniture, E&E, chemicals & chemical products

Financial Stability and Payment Systems Report 2010
13
Rising household indebtedness supported by strong financial buffers…
Household Debt-to-GDP Ratio (%)75.976
50
60
70
80
2006 2007 2008 2009 2010
Household debt-to-GDP ratio unchanged at 75.9%
Household financial assets are 2.4 times of household debts
Household Financial Assets, Deposits and Debts
0
200
400
600
800
1,000
1,200
1,400
1,600
2006 2007 2008 2009 20100
50
100
150
200
250
300
Financial Assets (LHS) Debts (LHS)
Fin. Asset-to-Debt Ratio Deposit-to-Debt Ratio
RM billion %

Financial Stability and Payment Systems Report 2010
14
Composition of HH Financial Assets(RM1,386 bil)
Savings with EPF
30%
Unit Trust funds16%
Equity Holdings
17%
Endowment policies
6%
Deposits with FIs
31%
…and high level of liquid assets, while bulk of borrowings are for purchase of assets
Secured financing constitute 64.9% of household debt
Composition of HH Financial Debts(RM581 bil)
Others10%
Purchase of
Securities5%
Auto financing
20%
Personal use15%
Credit Card5%
Housing loan45%
Liquid assets accounted for 64.6% of financial assets

Financial Stability and Payment Systems Report 2010
15
Personal financing grew 17.5% driven by salary deduction scheme
Composition of household debts
15%8%
0%
10%
20%
30%
40%
50%
60%
70%
80%
90%
100%
Dec-03
Dec-04
Dec-05
Dec-06
Dec-07
Dec-08
Dec-09
Dec-10
Others Securities Credit cards
Personal use Transport Vehicles Housing Loans
• Personal financing (PF) accounted for 14.6% of household debts
– Personal financing by banks grew at lower rate of 13%
– Account for less than 5% of banks’ loans
– NPL ratio of 2.5%
• Driven by development financial institutions, cooperatives and building societies
– Approx. 80% under salary deduction schemes
Financial Stability and Payment Systems Report 2010
16
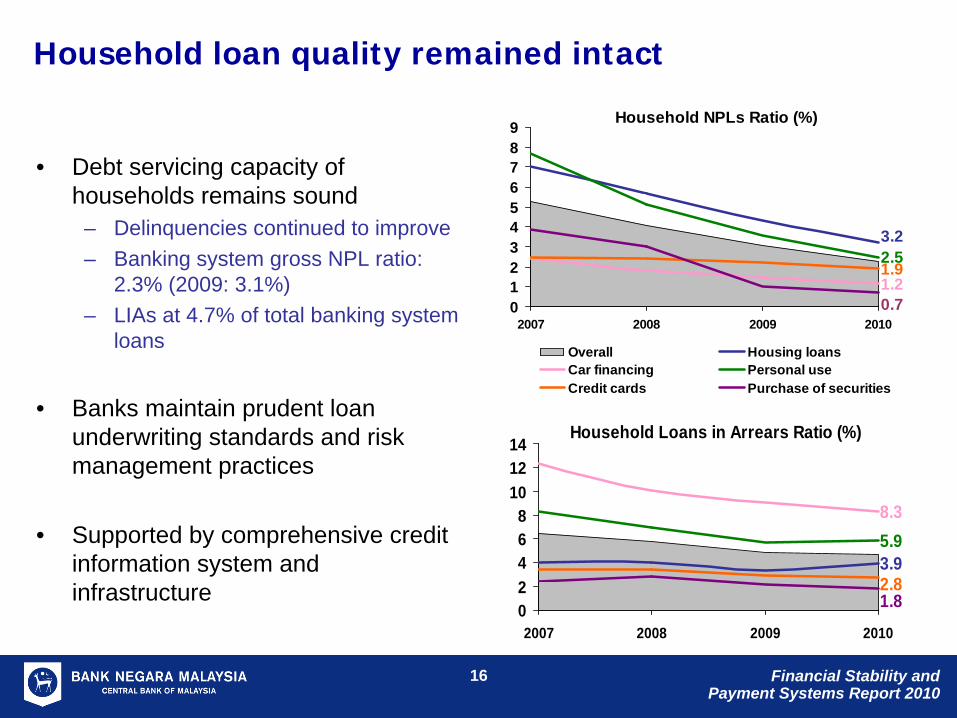
Household NPLs Ratio (%)
3.2
1.22.51.9
0.70123456789
2007 2008 2009 2010
Overall Housing loansCar financing Personal useCredit cards Purchase of securities
Household loan quality remained intact
• Debt servicing capacity of households remains sound
– Delinquencies continued to improve– Banking system gross NPL ratio:
2.3% (2009: 3.1%)– LIAs at 4.7% of total banking system
loans
• Banks maintain prudent loan underwriting standards and risk management practices
• Supported by comprehensive credit information system and infrastructure
Household Loans in Arrears Ratio (%)
3.9
8.35.9
2.81.80
2468
101214
2007 2008 2009 2010
Financial Stability and Payment Systems Report 2010
17
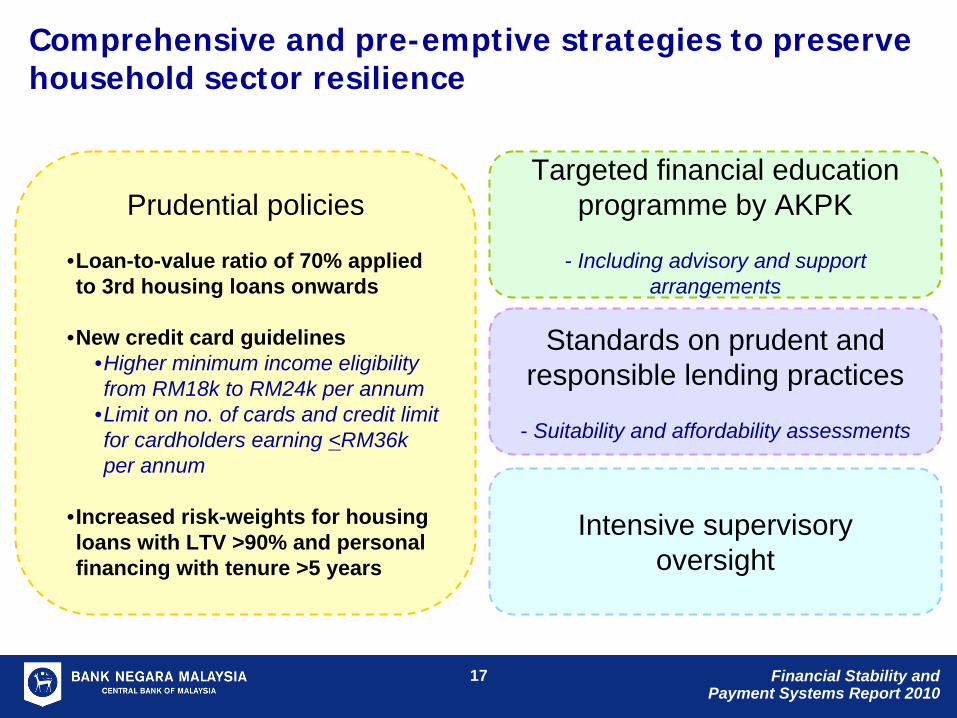
Comprehensive and pre-emptive strategies to preserve household sector resilience
Prudential policies
•Loan-to-value ratio of 70% applied to 3rd housing loans onwards
•New credit card guidelines •Higher minimum income eligibility from RM18k to RM24k per annum
•Limit on no. of cards and credit limit for cardholders earning <RM36k per annum
•Increased risk-weights for housing loans with LTV >90% and personal financing with tenure >5 years
Intensive supervisory oversight
Standards on prudent and responsible lending practices
- Suitability and affordability assessments
Targeted financial education programme by AKPK
- Including advisory and support arrangements
Financial Stability and Payment Systems Report 2010
18
Ensuring prudent and responsible conduct for retail financing as part of measures to preserve household sector resilience
• Inculcate responsible lending practices by financial institutions in dealing with retail customers
• Requirements NOT intended nor expected to hamper credit availability
• Key requirements include– Suitability and affordability assessment– Verification of customers' income– Product disclosure sheet to facilitate informed decision making– Compensation of sales and marketing personnel to take into account fair dealing
conduct
• Complete submissions should not result in processing delays
Financial Stability and Payment Systems Report 2010
19
Key contents of product disclosure sheet
• Borrowing rate, variable / fixed rate, tenure, repayment structure
• Repayment obligation– Installment amount, total repayment (entire duration), changes to installment
amount for 100-200bps increase in borrowing rate
• Applicable charges – Stamp duty, disbursement fee, processing fee
• Implications of non-repayment – Late payment penalty, review of borrowing rate, legal implications
• Risk associated with the product
• Assistance and redress mechanism

Financial Stability and Payment Systems Report 2010
20
Financial markets exhibited enhanced capacity to intermediate larger and more volatile portfolio flows
Volatility of asset prices remained low
90-day volatility (%)
0
5
10
15
20
25
30
35
40
Jan-08
Apr-08
Jul-08
Oct-08
Jan-09
Apr-09
Jul-09
Oct-09
Jan-10
Apr-10
Jul-10
Oct-10
KLCI MGS (5-year yield) [RHS]
Lehman collapse
European sovereign debt crisis
Returns-to-turnover ratio was lower, denoting higher
resilience
Ratio
0.000
0.004
0.008
0.012
0.016
0.020
Jan-08
Apr-08
Jul-08
Oct-08
Jan-09
Apr-09
Jul-09
Oct-09
Jan-10
Apr-10
Jul-10
Oct-10
0
0.1
0.2
0.3
0.4
FBM KLCI MGS [RHS]
Ratio
Avg 2010: 0.04
Avg 2010: 0.006
Source: Bloomberg
Financial Stability and Payment Systems Report 2010
21
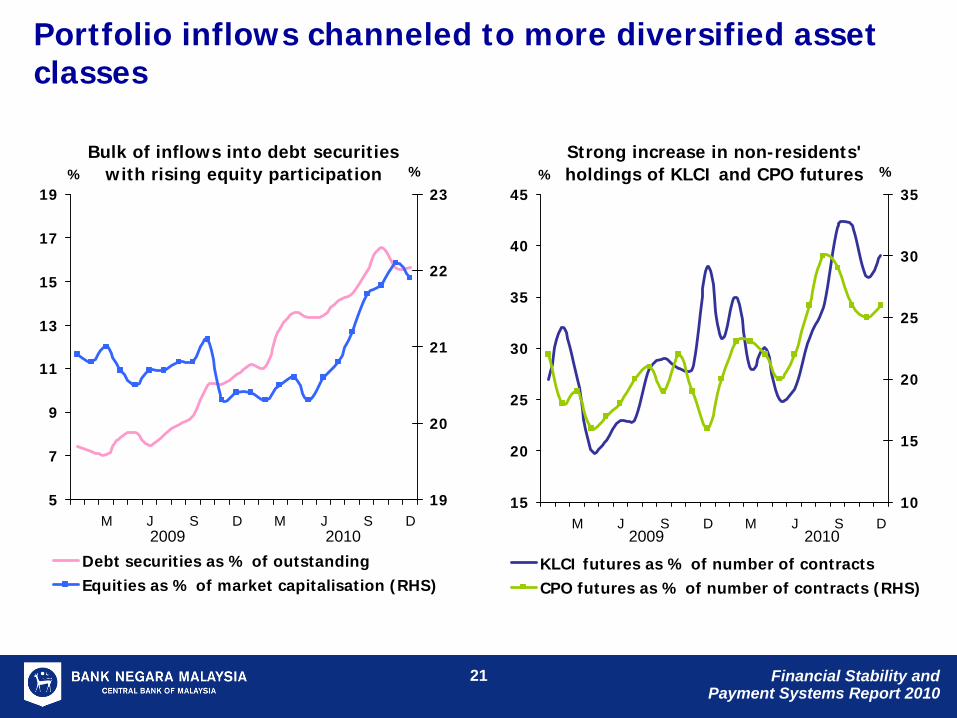
Portfolio inflows channeled to more diversified asset classes
Bulk of inflows into debt securities with rising equity participation
5
7
9
11
13
15
17
19
M J S D M J S D
%
19
20
21
22
23%
Debt securities as % of outstandingEquities as % of market capitalisation (RHS)
Strong increase in non-residents' holdings of KLCI and CPO futures
15
20
25
30
35
40
45
M J S D M J S D
%
10
15
20
25
30
35%
KLCI futures as % of number of contractsCPO futures as % of number of contracts (RHS)
2009 2010 2009 2010
Financial Stability and Payment Systems Report 2010
22
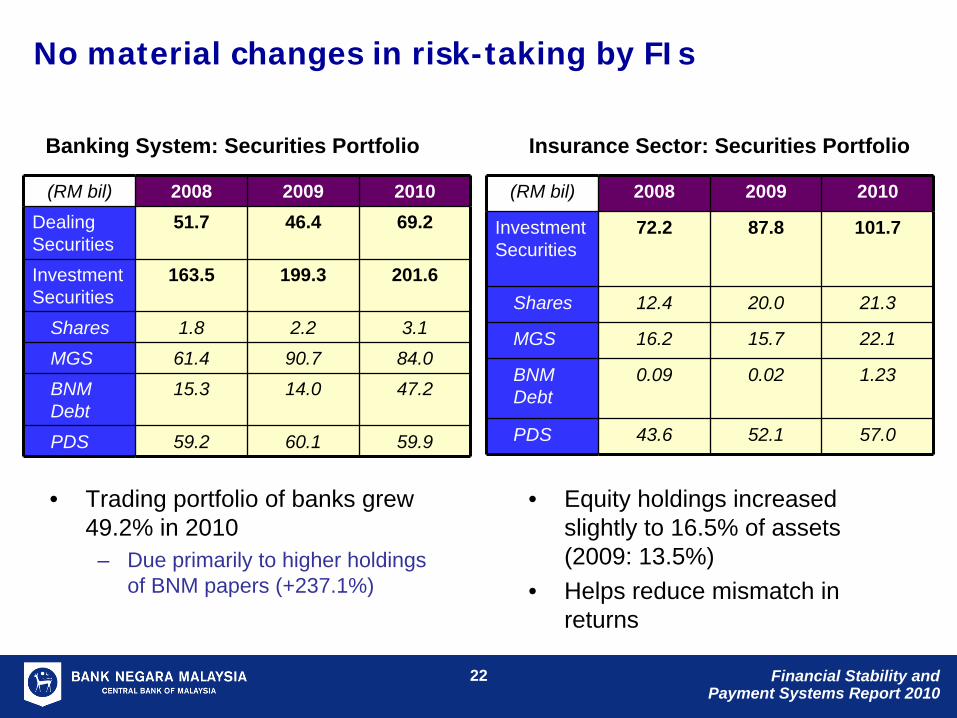
No material changes in risk-taking by FIs
(RM bil) 2008 2009 2010Dealing Securities
51.7 46.4 69.2
Investment Securities
163.5 199.3 201.6
Shares 1.8 2.2 3.1MGS 61.4 90.7 84.0BNM Debt
15.3 14.0 47.2
PDS 59.2 60.1 59.9
(RM bil) 2008 2009 2010
Investment Securities
72.2 87.8 101.7
Shares 12.4 20.0 21.3
MGS 16.2 15.7 22.1
BNM Debt
0.09 0.02 1.23
PDS 43.6 52.1 57.0
• Trading portfolio of banks grew 49.2% in 2010
– Due primarily to higher holdings of BNM papers (+237.1%)
Banking System: Securities Portfolio Insurance Sector: Securities Portfolio
• Equity holdings increased slightly to 16.5% of assets (2009: 13.5%)
• Helps reduce mismatch in returns

Financial Stability and Payment Systems Report 2010
23
Rise in market risk exposures of FIs is manageable
Banking system: Market Risk Exposure
(as % of Capital Base)
0
2
4
6
8
Sep Dec Mar Jun Sep Dec Mar Jun Sep Dec
Equity holdingsForeign currency net open positionDuration weighted net position (interest rate risk)
2008 2009 2010
%
• FCY exposures edged up to 3.8% of capital base, more active hedging by customers
– Stable FCY deposits from non-residents
Insurance sector:
Components of Market Risk

Financial Stability and Payment Systems Report 2010
24
Limited impact from developments in Europe and MENA*
• Banks’ exposures at 18.3% of external exposures or 5% of capital base
– No adverse spillovers from interbank funding strains in Europe
– Regional operations of domestic banks’ unaffected due to strong fundamentals
• Counterparty risks to European reinsurers well- contained
– High net retention ratio of 71.4%– Reinsurance exposures to Europe only 8.5% of
total capital available for general insurance
• Under scenario of widespread sovereign default by GIIPS^, potential credit losses will remain below 0.05% and 0.0006% of banks and insurance sectors’ capital buffers respectively
Banking System: External Exposures
(RM bil, % of cap base)
GIIPS (0.1, 0.1)
US (0.2, 0.2)
Others (2.0, 1.3)
Asia (25.7, 17.1)Middle
East (2.2, 1.4)
Europe (5.3, 3.5)
Labuan (5.4, 3.6)
Distribution of Premium Income
0% 20% 40% 60% 80% 100%
Direct Insurers Domestic Reinsurers Offshore Reinsurers Foreign Reinsurers* MENA – Middle East and North Africa
^ GIIPS – Greece, Ireland, Italy, Portugal and Spain

Financial Stability and Payment Systems Report 2010
25
Domestic banking groups have presence in 19 countries worldwide with a higher
share of overseas assets and income
MBB, RHB, Public, HL
MBB
MBB, CIMB, RHB, HL, AM
MBB, CIMB, AM
CIMB, RHB
Public
CIMB
MBB, CIMB, Public
MBB, CIMB, Public, HL, AM
MBB, CIMB, Public, HL
Expanded overseas presence of domestic banking groups in East Asia
Malaysian financial institutions have continued to strengthen their regional presence
Intensified domestic competition
Rising needs of internationalisation of local firms
Greater trade & investment linkages
Growth opportunities in new markets
Key Drivers for Expansion Abroad
2002 2010Assets RM3.3
bilRM258
bil
Revenue -4.3% 16.7%*
* 2009
Enhanced capacity to expand overseas
Financial Stability and Payment Systems Report 2010
26
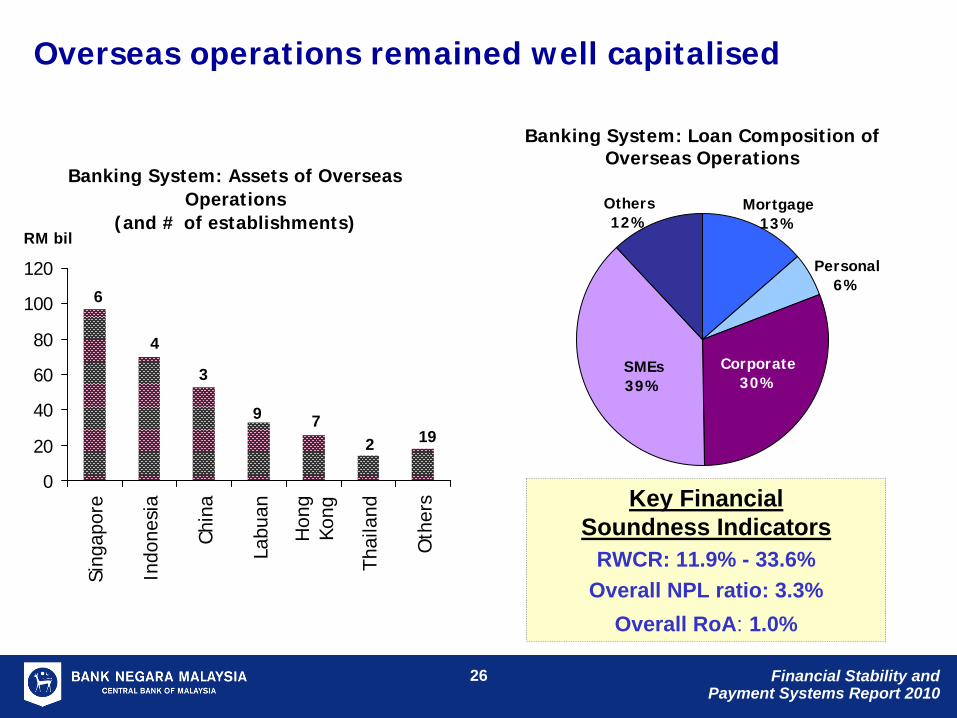
Overseas operations remained well capitalised
Banking System: Assets of Overseas Operations
(and # of establishments)
0
20
40
60
80
100
120
Sing
apor
e
Indo
nesi
a
Chin
a
Labu
an
Hon
gKo
ng
Thai
land
Oth
ers
RM bil
6
4
3
9 72 19
SMEs39%
Personal6%
Others12%
Mortgage13%
Corporate30%
Banking System: Loan Composition of Overseas Operations
Key Financial Soundness Indicators
RWCR: 11.9% - 33.6%Overall NPL ratio: 3.3%
Overall RoA: 1.0%
Financial Stability and Payment Systems Report 2010
27
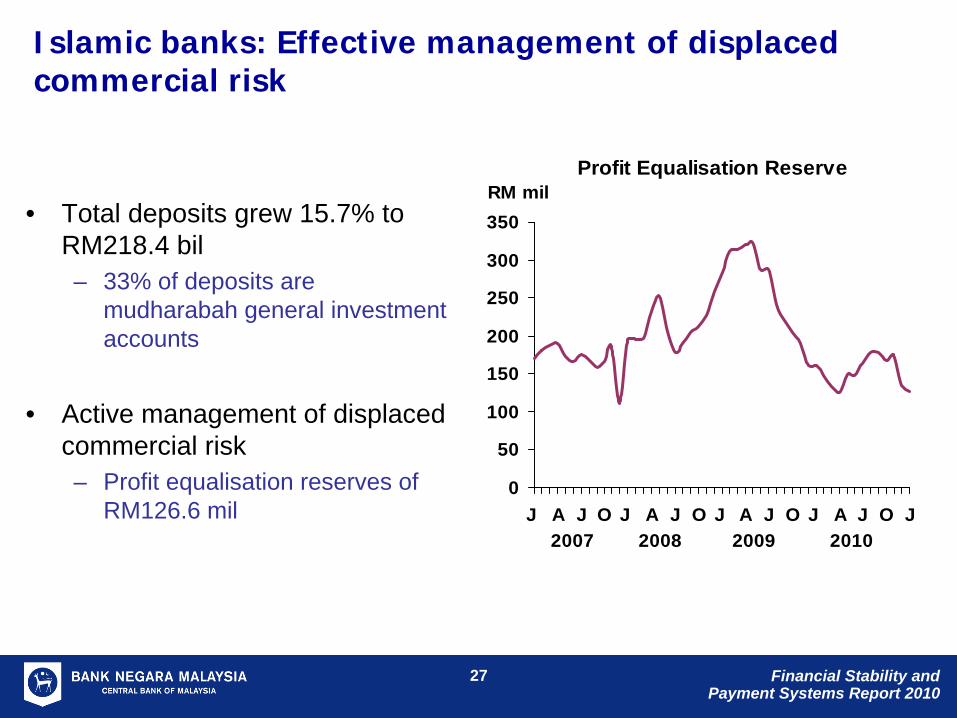
Islamic banks: Effective management of displaced commercial risk
• Total deposits grew 15.7% to RM218.4 bil– 33% of deposits are
mudharabah general investment accounts
• Active management of displaced commercial risk – Profit equalisation reserves of
RM126.6 mil
Profit Equalisation Reserve
0
50
100
150
200
250
300
350
J A J O J A J O J A J O J A J O J
RM mil
2007 2008 2009 2010
Financial Stability and Payment Systems Report 2010
28
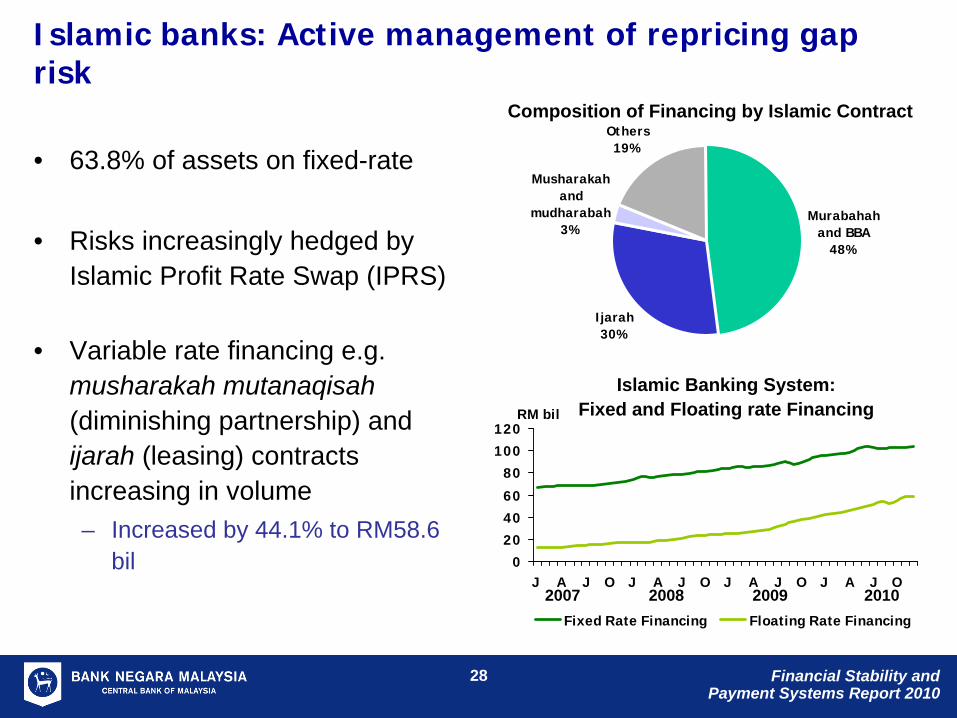
Islamic banks: Active management of repricing gap risk
• 63.8% of assets on fixed-rate
• Risks increasingly hedged by Islamic Profit Rate Swap (IPRS)
• Variable rate financing e.g. musharakah mutanaqisah (diminishing partnership) and ijarah (leasing) contracts increasing in volume– Increased by 44.1% to RM58.6
bil 0
20
40
60
80
100
120
J A J O J A J O J A J O J A J O
RM bil
Fixed Rate Financing Floating Rate Financing
Islamic Banking System: Fixed and Floating rate Financing
2007 2008 2009 2010
Murabahah and BBA
48%
Ijarah30%
Musharakah and
mudharabah3%
Others19%
Composition of Financing by Islamic Contract

Financial Stability and Payment Systems Report 2010
29
Strengthened governance and decision making framework for financial stability
Financial Stability Executive
Committee• High level committee
established under s.37 of CBA 2009 to review and decide on the Bank’s recommendations to manage risks to financial stability
• Entities outside regulatory perimeter of the Bank
• Resolution of systemically important financial institutions
• Involves public funds
Financial Stability Policy Committee (within the Bank)
• Maintaining price stability while giving due regard to the developments in the economy
• Formulation of monetary policy and policies for the conduct of monetary policy operations
• Risk assessment• Macroprudential responses• Microprudential responses • Supervisory interventions
Recommendations with systemic implications
Monetary Policy Committee
(within the Bank)
Joint meeting for effective deliberation and consideration of macroprudential measures to
safeguard financial and macroeconomic stability
Resolution of individual FI by PIDM

Financial Stability and Payment Systems Report 2010
30
Foundations for financial stability were further strengthened
Enhanced robustness of risk
management, stress testing and
capital management
More effective governance in
financial institutions
Strengthened cross- border supervisory
cooperation
Strengthened prudential standards for Islamic
finance
Enhanced protection for depositors and policyholders
Adoption of more advanced capital approaches under
Basel II
Financial Stability and Payment Systems Report 2010
31
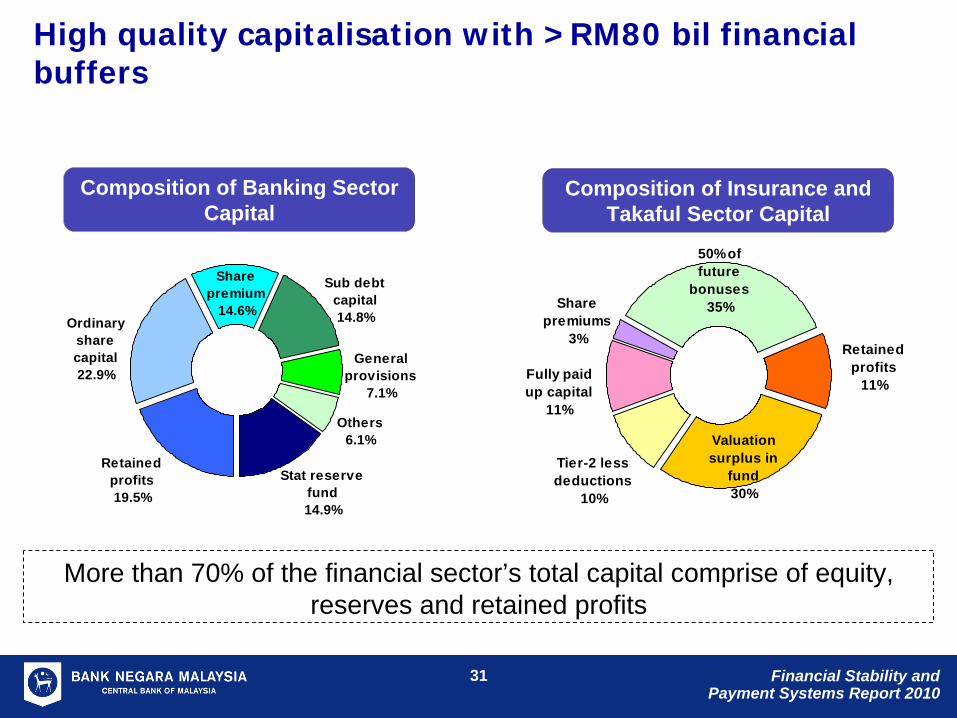
Share premium
14.6%Ordinary
share capital22.9%
Retained profits19.5%
Others6.1%
Stat reserve fund14.9%
General provisions
7.1%
Sub debt capital14.8%
Composition of Insurance and Takaful Sector Capital
High quality capitalisation with >RM80 bil financial buffers
Composition of Banking Sector Capital
Valuation surplus in
fund30%
Retained profits
11%
Tier-2 less deductions
10%
50% of future
bonuses35%
Fully paid up capital
11%
Share premiums
3%
More than 70% of the financial sector’s total capital comprise of equity, reserves and retained profits
Financial Stability and Payment Systems Report 2010
32
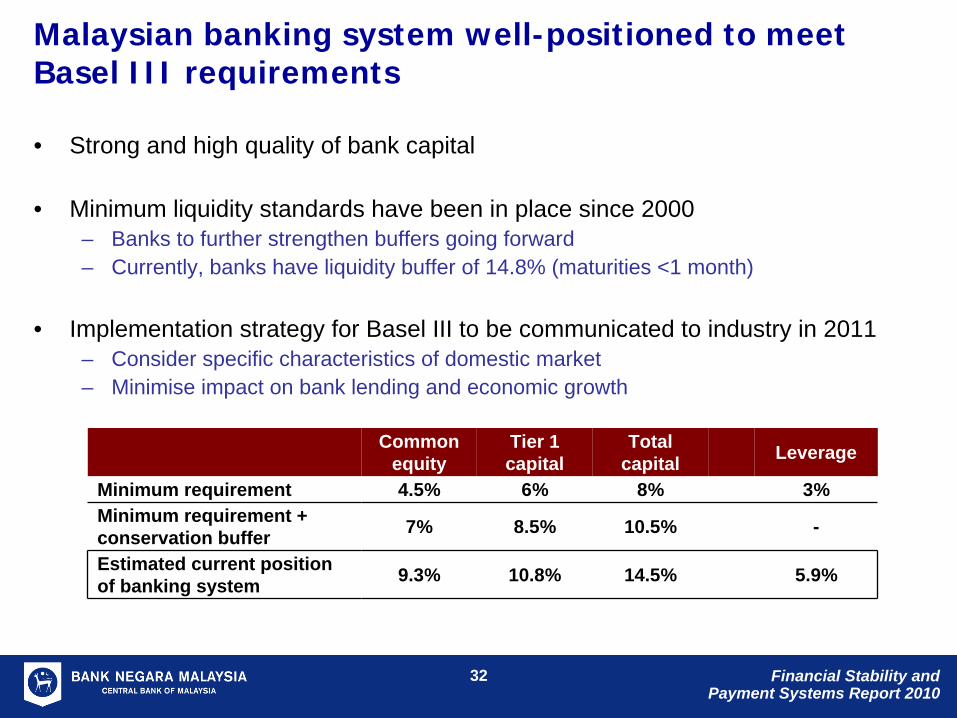
Malaysian banking system well-positioned to meet Basel III requirements
• Strong and high quality of bank capital
• Minimum liquidity standards have been in place since 2000– Banks to further strengthen buffers going forward– Currently, banks have liquidity buffer of 14.8% (maturities <1 month)
• Implementation strategy for Basel III to be communicated to industry in 2011– Consider specific characteristics of domestic market– Minimise impact on bank lending and economic growth
Common equity
Tier 1 capital
Total capital Leverage
Minimum requirement 4.5% 6% 8% 3%Minimum requirement + conservation buffer 7% 8.5% 10.5% -
Estimated current position of banking system 9.3% 10.8% 14.5% 5.9%
Financial Stability and Payment Systems Report 2010
33
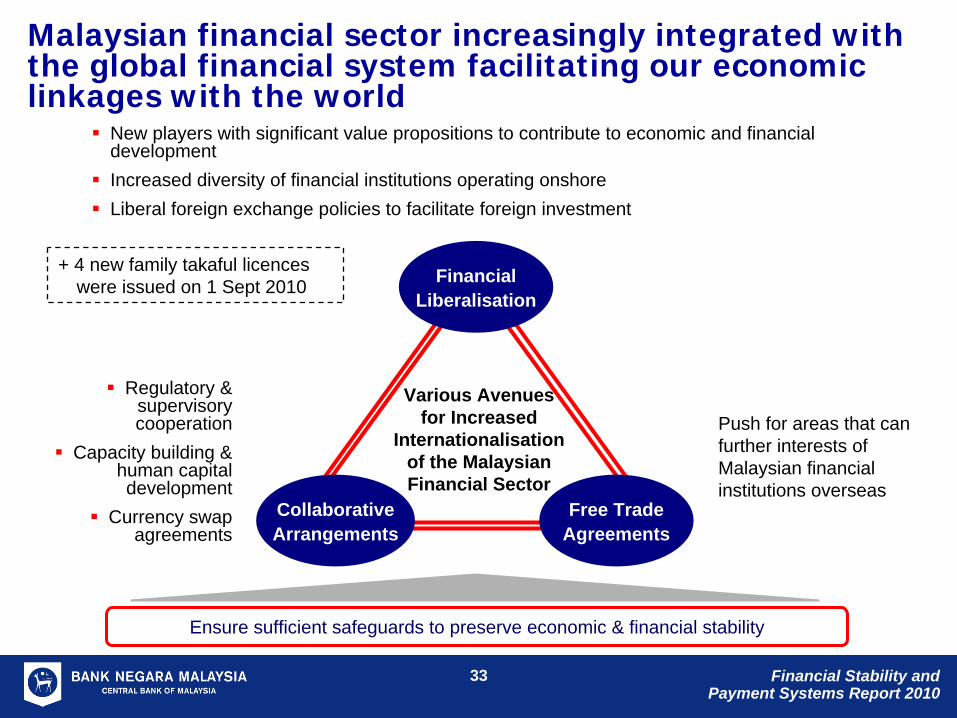
Malaysian financial sector increasingly integrated with the global financial system facilitating our economic linkages with the world
Financial Liberalisation
Collaborative Arrangements
Free Trade Agreements
Various Avenues for Increased
Internationalisation of the Malaysian Financial Sector
Push for areas that can further interests of Malaysian financial institutions overseas
Regulatory & supervisory cooperation
Capacity building & human capital development
Currency swap agreements
New players with significant value propositions to contribute to economic and financial developmentIncreased diversity of financial institutions operating onshoreLiberal foreign exchange policies to facilitate foreign investment
Ensure sufficient safeguards to preserve economic & financial stability
+ 4 new family takaful licences were issued on 1 Sept 2010
Financial Stability and Payment Systems Report 2010
3434
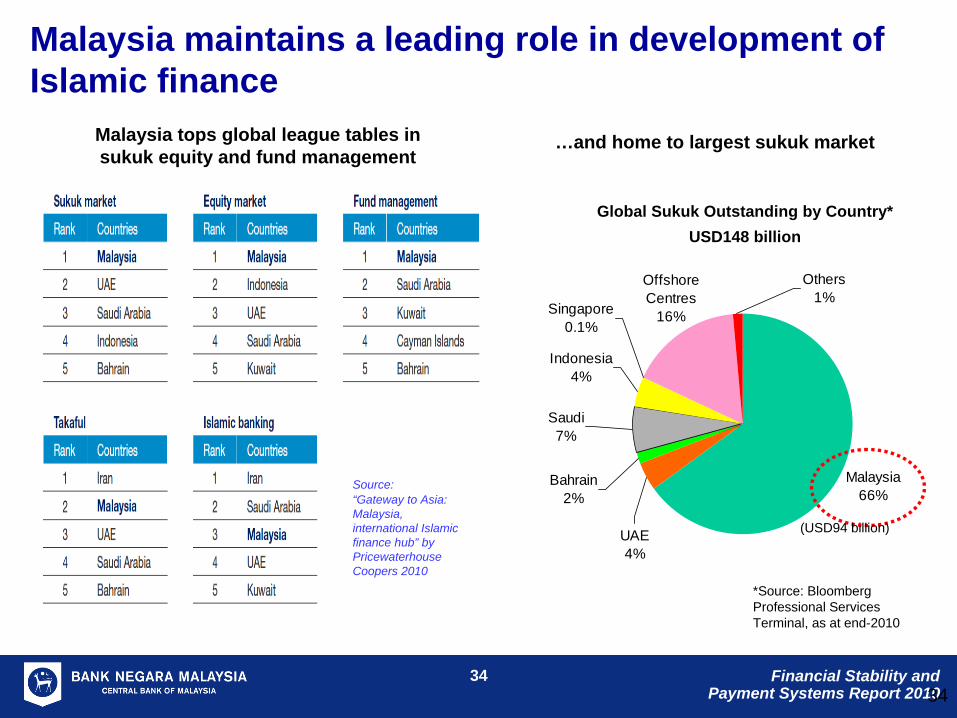
Malaysia maintains a leading role in development of Islamic finance
Malaysia tops global league tables in sukuk equity and fund management
Source: “Gateway to Asia: Malaysia, international Islamic finance hub” by Pricewaterhouse Coopers 2010
…and home to largest sukuk market
Global Sukuk Outstanding by Country*USD148 billion
*Source: Bloomberg Professional Services Terminal, as at end-2010
Malaysia66%
Indonesia4%
Offshore Centres
16%
Others1%
Saudi7%
Bahrain2%
UAE4%
Singapore0.1%
(USD94 billion)

Financial Stability and Payment Systems Report 2010
35
Outlook for domestic financial stability in 2011 remains positive
• Risks to financial stability largely externally driven
• Pre-emptive measures and strong financial buffers ensure that financial system is well-placed with capacity and flexibility to respond to emerging risks
• Macrosurveillance and supervisory activities in 2011 will focus on:– Ensuring prudent and responsible risk-taking and market conduct by FIs– Ensuring resilience and robustness of major payment and settlement systems– Active engagement in global regulatory and accounting reforms– Further strengthening of regulatory laws and prudential guidelines– Promoting closer domestic, regional and global cooperation and coordination
Financial Stability and Payment Systems Report 2010
36
Moving forward…
The new financial sector blueprint will build on the strong foundations of the Malaysian financial system to:
– remain resilient in withstanding any potential disruptions in the financial system and broader economy;
– to best serve the needs of a high value-added and high income economy;
while further promoting financial inclusion and regional financial integration.