Embed Size (px)
Citation preview

Financial Results H1/201425 July 2014

1
Highlights H1/2014
• Record sales and order intake
• High customer call orders led to logistical and operational pressure on the existing
technical capacity at both at our suppliers and in the Powder Metallurgy division
• Strong improvement in working capital
• New product launches proceeded consistently stable and on schedule
• Brazil: customer deliveries of oil pumps started
• China: first business contract with Truck & Off Highway customer signed
• North America: further prototype order from Detroit 3 car company received
• New mechanical line in the Brake Disc division running at full speed
• Framework agreement signed with Shandong Longji to draw up a joint venture contract

2
Sales and EBITDA fully within target range
Clearly outperforming European car market
€m H1/2014 H1/2013 Change in %
Group sales 212.1 176.4 +20.2%
Incoming orders 221.4 195.1 +13.5%
Adj. EBITDA 19.0 17.1 +11.5%
Depreciation (excl. PPA) 8.4 6.4 +32.4%
Adj. EBIT 10.6 10.7 -0.9%
Net income for the period 7.2 6.6 +9.0%
EPS (in €) 1.23 1.13 +9.0%
Working Capital Ratio (%) 10.1 15.6
Capex 18.0 17.2 + 4.5%
Free cash flow -8.7 -16.9
Net Debt -17.4 -20.1
ROCE (%) 17.2 16.4
No. of employees (average) 1.119 1.045 +7.0%

3
GroupSales by quarter (€m)
+23.9%
Q4
96.7
16.9%
107.391.8
Q1
104.8
84.6 92.6
Q3Q2
20142013
H1/2013
176.4
20.2%
H1/2014
212.1
Sales (€m)
New product launches and high level of customer call orders main growth drivers
10.211.046.9%
7.6
Q2Q1
8.8
6.0
Q4Q3
11.1
-7.8%
20142013
Adj. EBITDA (€m) Adj. EBITDA by quarter (€m)
9.0%
19.0
H1/2013
9.7%
17.10.9
11.5%
H1/2014
EBITDAAdjustments

4
Group
14.7
1.9
14.7
2.2
14.7 17.5
2.3
2.2
14.7 17.5
2.3
Sales by customer (€m)
SHW well positioned with German OEMs
10.6AUDI 15.1
4.6
6.1
6.3
Other
6.9
Hilite 3.4
17.4
36.2
ThyssenKrupp
58.8
5.5
PSA
38.0
5.9
Ford
Volvo Cars
10.4
36.0
Porsche
7.1
10.7
BMW
3.5
18.3
Daimler
12.3
28.0
VW 47.1
H1/2013H1/2014

5
Group
14.714.7
EAT by quarter (€m)
+73.3%
Q4
1.9
Q3
4.9
Q2
4.04.7
-16.4%
Q1
3.2
1.9 20142013
EAT (€m)Q1
6.6
4.5
2.5
6.9
5.4
Q2 Q3
-18.4%
+78.9%
Q4
2.9 20132014
EBT (€m) EBT by quarter (€m)
5.2%
8.8%
H1/2014
9.9
4.7%
H1/2013
9.1
9.0%
H1/2014
7.2
3.4%
H1/2013
6.6
3.7%

6
Pumps & Engine ComponentsSales by quarter (€m)
+27.2%
Q4
72.4
Q3
69.9
Q2
68.6
Q1
80.6
63.3
82.6
+20.4%
20142013
Sales (€m)
+55.4%
Q4
6.2
Q3
9.5
Q2
8.8
Q1
7.5
4.8
8.1
-8.1%
20142013
Adj. EBITDA (€m) Adj. EBITDA by quarter (€m)
+14.3%
H1/2014
15.6
9.5%
H1/2013
13.6
10.3%
H1/2014H1/2013
131.9
23.7%
163.1

7
Powder Metallurgy
Strong growth with highly innovative products (CAGR 2013 – 2017: 8.1 percent to approx. € 60m)
Average age of installed capacities: 15 years
Updated 3 year investment programme in the lower double digit million range approved by Supervisory Board
Capacity expansion in the areas of pressing, sintering, calibration and finishing Optimisation / Automation of production processes and procedures Rationalisation Building / Infrastructure
Current performance dilutes EBITDA margin on Group level by up to 100 bps

8
Brake DiscsSales by quarter (€m)
+14.0%
Q4
24.3
Q3
22.7
Q2
23.2
Q1
24.221.2
24.7
6.5%
Sales (€m)
-3.1%
+17.0%
Q4
1.9
Q3
2.0
Q2
2.6
Q1
1.71.5
2.5
Adj. EBITDA (€m) Adj. EBITDA by quarter (€m)
20142013
20132014
H1/2014H1/2013
+4.3%
9.2% 8.7%
4.34.1
48.9
H1/2013 H1/2014
10.1%
44.5

9
Working Capital
Net Working Capital / Sales (LTM)
First positive results from logistics optimization projects
Medium-term target: 11%
Q2/2014
10.1%
Q4/2013 Q1/2014
11.8%
9.1%
Q3/2013
16.1%
Q2/2013
15.6%
Q1/2013
16.8%
Q4/2012
11.2%
Q3/2012
15.7%
Q2/2012
15.6%
Q1/2012
15.2%

10
Cash flow
5.
Strong improvement of operating cash flow due to positive development in working capital
(€m) Q2/2014 Q2/2013 H1/2014 H1/2013
Cash flow from operating activities 12.1 11.2 12.1 0.3
Cash flow from investing activities -8.7 -9.0 -20.7 -17.2
Free cash flow 3.3 2.2 -8.7 -16.9
Other (esp. dividends) -5.9 -23.4 -5.8 -22.9
Change in net cash -2.5 -21.2 -14.5 -39.8

11
Net debt
Net debt (€m)19.6
Q1/2013 Q2/2013
-2.9
-20.1
1.1
-26.6
-19.0
Q1/2014Q2/2012 Q4/2013Q3/2013
-14.8
Q3/2012 Q4/2012Q4/2011
-8.6
Q2/2014
-17.4-14.9
Q1/2012
-17.6

12
Capex – Depreciation
14.714.7
Capex* by quarter (€m)12.1%
8.8
-2.4%
Q4
6.3
Q3
9.3
Q2
9.0
Q1
9.28.2
20142013
Capex* (€m)
Capex remains on a high level
32.3%31.6%
4.0
Q1 Q4Q3
3.7
Q2
3.44.0
3.0
4.5
Depreciation (€m) Depreciation by quarter (€m)
20132014
* Additions to tangible and intangible assets
+4.5%
H1/2014
18.0
8.5%
H1/2013
17.2
9.8%
6.4
8.5
4.0%
H1/2014
+32.0%
H1/2013
3.6%
13
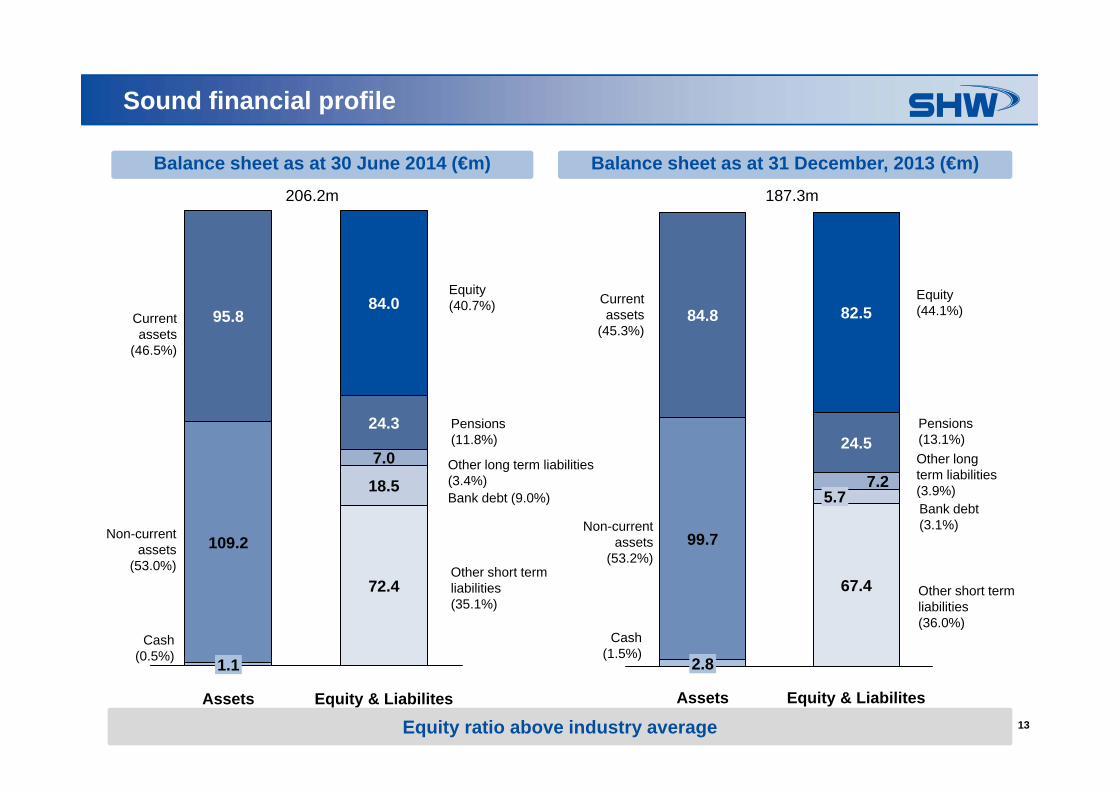
Sound financial profile
Balance sheet as at 30 June 2014 (€m) Balance sheet as at 31 December, 2013 (€m)
Other short termliabilities(35.1%)
Pensions(11.8%)
Currentassets
(46.5%)
Non-currentassets
(53.0%)
Equity(40.7%)
37.9
206.2m
1.1
109.2
84.0
Assets
24.3
95.8
Equity & Liabilites
72.4
7.0
18.5
Equity ratio above industry average
Cash(0.5%)
Other short termliabilities(36.0%)
Pensions(13.1%)
Currentassets
(45.3%)
Non-currentassets
(53.2%)
Equity(44.1%)
37.9
187.3m
5.7
Equity & Liabilites
67.4
7.2
24.5
82.5
Assets
2.8
99.7
84.8
Other long term liabilities(3.9%)
Cash(1.5%)
Other long term liabilities(3.4%)Bank debt (9.0%)
Bank debt(3.1%)

14
Update CEO Agenda: Status North America
• Management team on board (General Manager, Sales Manager, Operations Manager, Engineering Manager, Quality Manager)
• Development centre and administration building occupied
• First global project prototype order received
• Intensive customer talks ongoing; RFQ process started
• Installation of performance test stand in August
• Decision regarding manufacturing site for large-scale production in the course of H2/2014
Light vehicle production (< 6 t) – North America (m units)
Source: PwC Autofacts – July 2014
SHW seamlessly ties up with activities in US market
2.8%
2018
18.6
2017
18.2
2016
17.5
2015
17.3
2014
16.9
2013
16.2
15
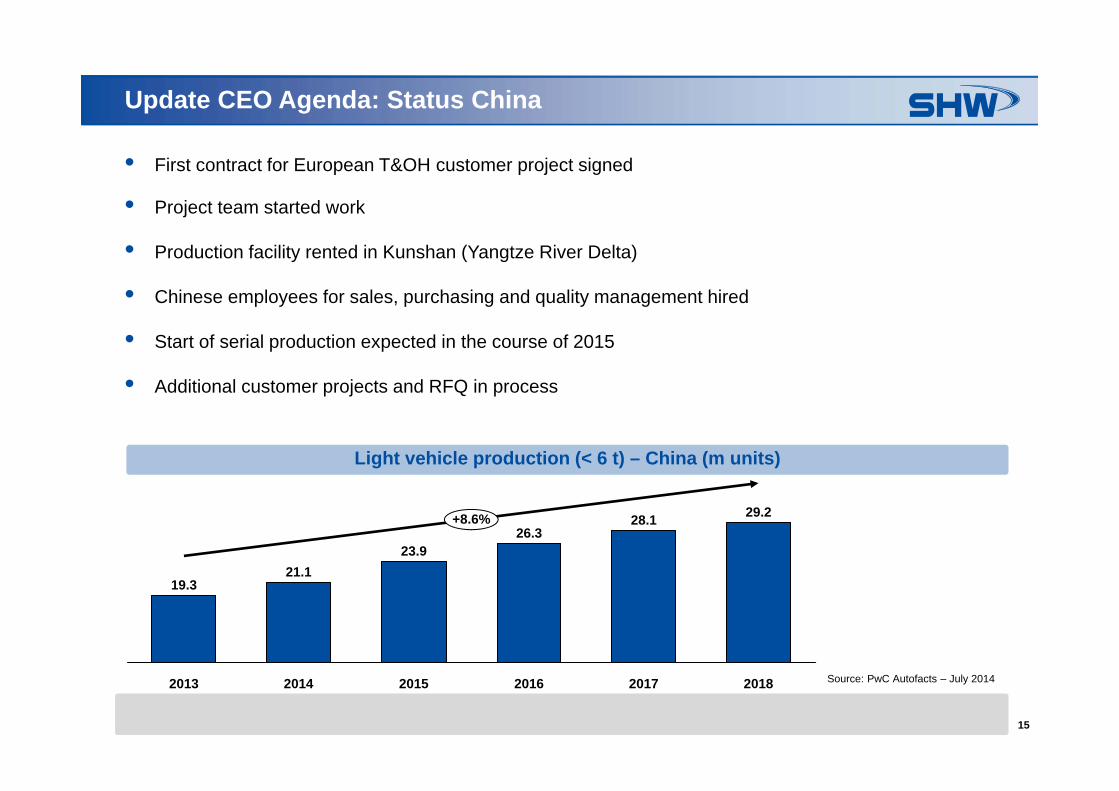
• First contract for European T&OH customer project signed
• Project team started work
• Production facility rented in Kunshan (Yangtze River Delta)
• Chinese employees for sales, purchasing and quality management hired
• Start of serial production expected in the course of 2015
• Additional customer projects and RFQ in process
Update CEO Agenda: Status China
Light vehicle production (< 6 t) – China (m units)
Source: PwC Autofacts – July 2014
19.3
+8.6%
2018
29.2
2017
28.1
2016
26.3
2015
23.9
2014
21.1
2013

16
Update CEO Agenda: Status Brazil
Customer deliveries started on 14 July
Export volumes will be increased from 2016 onwards by customer
Customer RFQ’s activities ongoing for new orders
6.4%
2018
6.3
2017
6.0
2016
5.5
2015
4.9
2014
4.4
2013
4.6
Light vehicle production (< 6 t) – South America (m units)
Source: PwC Autofacts – July 2014

17
Acquisition and cooperation strategy
Pumps & Engine Components
• Completion of product portfolio• Acceleration of internationalisation supporting best-cost strategy (production and
sourcing)• Expansion of vertical integration to safeguard tier 1 position (e.g. electric motors)
Brake Discs• Internationalisation with an asset-light model (no investments in foundry
capacities) via cooperations• Focus on value-adding activities (e.g. machining)
Considerations / Drivers

18
3.4%
2018
18.9
2017
18.5
2016
18.0
2015
17.3
2014
16.8
2013
16.0
4.6%
2018
513,540
2017
484,151
2016
449,706
2015
409,743
2014
369,111
2013
411,075
Source: PwC Autofacts – July 2014 Source: LMC Automotive – Q2/2014
Market environment in Europe further brightening
Light vehicle production (< 6 t) – Europe (m units) Truck production (GVW > 6t) – Western Europe (units)
units 2013 2014 2015 2016 2017 2018 CAGR
Mercedes-Benz 97.024 87.494 95.215 102.936 109.437 114.567 3,4%
MAN Group 63.521 58.510 64.553 70.101 74.478 78.145 4,2%
Volvo 55.821 47.530 50.914 55.676 60.112 64.165 2,8%
Scania 55.320 48.707 51.527 55.475 59.214 62.661 2,5%
PACCAR 54.064 47.039 55.844 61.670 66.981 71.449 5,7%
IVECO Group 46.635 42.645 48.442 55.436 60.952 65.642 7,1%
Renault 32.165 31.176 35.845 39.984 43.721 46.950 7,9%
m units 2013 2014 2015 2016 2017 2018 CAGR
VW Group 4,49 4,83 4,86 5,09 5,17 5,13 2,7%
PSA Group 1,93 2,01 2,00 2,02 2,08 2,13 2,0%
Renault-Nissan 1,82 1,86 1,93 2,18 2,19 2,15 3,3%
Daimler Group 1,45 1,55 1,67 1,69 1,64 1,69 3,0%
BMW Group 1,43 1,43 1,53 1,60 1,69 1,84 5,1%
Ford Group 1,07 1,18 1,18 1,09 1,13 1,16 1,6%
GM Group 0,90 0,86 0,92 1,09 1,19 1,22 6,4%

19
Sales and earnings forecast for FY 2014 raised
• Focal points:
Acquisition of new orders
Business expansion in Brazil, China and North America
Optimisation of the production processes and procedures (shop floor management)
Optimisation of the product development process
Optimisation of the entire supply chain
• Numerous new product launches
• Capex: € 31m – € 35m (previously: € 25m – € 29m)
• Group sales: € 390m – € 415m (previously: € 380m – € 400m)
P&EC sales: € 297m – € 320m (previously: € 287m – € 305m)
BD sales: € 93m – € 95m (unchanged)
• Adj. EBITDA: € 39m – € 41.5m (previously: € 38m – € 40m)
• Working Capital Ratio: sustainable 11 percent

20
Contact Investor Relations
Michael SchicklingHead of Investor Relations & Corporate Communications
SHW AGWilhelmstrasse 6773433 Aalen-Wasseralfingen Telephone: +49 (0) 7361 502-462E-Mail: [email protected]

21
DisclaimerThis document, which has been issued by SHW AG (the “Company” or “SHW”), does not constitute an offer to sell, or the solicitation of an offer to subscribe for orbuy, any shares in the Company, nor shall it or any part of it nor the fact of its distribution form the basis of, or be relied on in connection with, any contract orinvestment decision in relation thereto.
The contents of this presentation are may not be reproduced, redistributed or passed on, directly or indirectly, to any other person or published, in whole or in part,for any purpose. Neither the Company nor any other party is under any duty to update or inform you of any changes to such information. In particular, it should benoted that financial information relating to the Company contained in this document has not been audited and in some cases is based on management informationand estimates.
This material is given in conjunction with an oral presentation and should not be taken out of context.
Certain market data and financial and other figures (including percentages) in this document were rounded in accordance with commercial principles. Figuresrounded may not in all cases add up to the stated totals or the statements made in the underlying sources. For the calculation of percentages used in the text, theactual figures, rather than the commercially rounded figures, were used. Accordingly, in some cases, the percentages provided in the text may deviate frompercentages based on rounded figures.
Certain statements in this presentation are forward-looking statements. By their nature, forward-looking statements involve a number of risks, uncertainties andassumptions that could cause actual results or events to differ materially from those expressed or implied by the forward‐looking statements. These risks,uncertainties and assumptions could adversely affect the outcome and financial consequences of the plans and events described herein. The Company does notundertake any obligation to update or revise any forward-looking statements, whether as a result of new information, future events or otherwise, except asotherwise required by applicable laws and regulations. You should not place undue reliance on forward-looking statements, which speak as only of the date of thispresentation. Statements contained in this presentation regarding past trends or events should not be taken as a representation that such trends or events willcontinue in the future.


![Characterizing Test Methods and Emissions Reduction ...184-H1. 155-H1. 170-H1. 198-H1. 218-H1. 1. 10. 100. 1000. Axis Title Diameter [nm] A_0581_492_H1. A_0581_466_H1. A_0581_482_H1](https://img.dokumen.tips/doc/110x75/5f74a0f484fbe405e9323ea1/characterizing-test-methods-and-emissions-reduction-184-h1-155-h1-170-h1.jpg)